PERMISSION TO USE In presenting this thesis/dissertation in partial fulfillment of the requirements for a Postgraduate degree
from the University of Saskatchewan, I agree that the Libraries of this University may make it freely
available for inspection. I further agree that permission for copying of this thesis/dissertation in any
manner, in whole or in part, for scholarly purposes may be granted by the professor or professors who
supervised my thesis/dissertation work or, in their absence, by the Head of the Department or the Dean
of the College in which my thesis work was done. It is understood that any copying or publication or use
of this thesis/dissertation or parts thereof for financial gain shall not be allowed without my written
permission. It is also understood that due recognition shall be given to me and to the University of
Saskatchewan in any scholarly use which may be made of any material in my thesis/dissertation.
DISCLAIMER
Reference in this thesis/dissertation to any specific commercial products, process, or service by trade
name, trademark, manufacturer, or otherwise, does not constitute or imply its endorsement,
recommendation, or favoring by the University of Saskatchewan. The views and opinions of the author
expressed herein do not state or reflect those of the University of Saskatchewan, and shall not be used
for advertising or product endorsement purposes.
Requests for permission to copy or to make other uses of materials in this thesis/dissertation in whole or
part should be addressed to:
Head of the Department of Community Health and Epidemiology University of Saskatchewan Saskatoon, Saskatchewan S7N 5E5 Canada OR Dean College of Graduate Studies and Research University of Saskatchewan 107 Administration Place Saskatoon, Saskatchewan S7N 5A2
Canada
ii
ABSTRACT
Background: Low back pain (LBP) and low back related disorders are highly prevalent and
associated with a considerable burden of pain, disability and work loss. People with a variety of
low back-related complaints comprise a large proportion of referrals made to orthopedic
surgeons and many of these patients are not considered to be surgical candidates or have not
maximized their non-surgical options for managing their low back-related complaints.
Objectives: We sought to evaluate the impact of a triage assessment program delivered by
physiotherapists using a variety of approaches. Thus, informed by a biopsychosocial model, the
objectives of this dissertation were:
1) To determine the short term impact of a physiotherapy triage assessment for people with
low back-related disorders on participant self-reported pain, function and quality of life
and patient and referring practitioner satisfaction.
2) To determine which demographic, clinical, psychosocial and environmental factors are
predictive of improved self-reported pain, function, quality of life and participant and
referring practitioner satisfaction.
3) To determine the diagnostic and treatment recommendation concordance between
physiotherapists and orthopaedic surgeons, using a newly developed clinical
classification tool, for people presenting to a spinal triage assessment service with low-
back complaints.
Methods: Two approaches were used to achieve the aforementioned objectives: a prospective
observational study (n=115) to address the first two objectives and a sub-group reliability study
(n=45) to address the third objective.
Results: There was a mean overall significant improvement in the SF-36 Physical Component
Summary at the 4-6 week post-test time point and relatively high satisfaction reported by
participants and referring care providers. Qualitative analysis of comments revealed a variety of
positive, negative and other contextual factors that may impact outcomes. A variety of different
sociodemographic, psychological, clinical and other variables were associated with success or
iii
improvement in each respective outcome. There may be a potential mechanism of reassurance
that occurs during the spinal triage assessment process as those with higher psychological
distress were more likely to improve on certain outcomes. There was high diagnostic
concordance between physiotherapists and an orthopaedic surgeon; however, there were more
differences in management recommendations between the surgeon and a solo physiotherapist
versus physiotherapists working in a collaborative team.
Conclusions: A spinal triage assessment program delivered by physiotherapists has the potential
to positively impact a variety of patient-related short outcomes including satisfaction. Further
study is needed to examine longer-term outcomes and which biopsychosocial factors may impact
these outcomes.
iv
ACKNOWLEDGEMENTS
Many thanks to my supervisors, Dr. Bonnie Janzen and Dr. Punam Pahwa. You have both
provided me with excellent encouragement, support and feedback for not only my PhD, but for
my life outside of this work as well.
My thanks as well to the remainder of my committee: Dr. Nazeem Muhajarine (chair), Dr. Liz
Harrison, Richard Bourassa, Dr. Gill White and Dr. Alice Aiken (external examiner). You have
all contributed to this work in meaningful ways and I very much appreciate the collaborative
collegial approach that each member brought to this process.
This work would not have been possible without the tremendous support of Richard Bourassa
and Anne-Marie Graham from Bourassa and Associates Rehabilitation Centre. Thank you to
both of you for having faith in my abilities to carry out this project and your willingness to be
active participants in the research process.
Thank you to the following staff from Bourassa’s and Associates Rehabilitation Centre who
contributed in many different ways to developing and/ or running this research project: Cindy
Robb, Stacey Lovo Grona, Amber Rollack, Jana Hambleton, Ryan Dueck, and Tom Duggleby.
Thank you as well to the Wall Street orthopaedic surgeons and staff, especially Dr. Jack Reilly
who was and continues to be an active participant in the research process.
Thank you to Dr. Roger Pitbaldo from Laurentian University for supplying me with a postal code
conversion file.
Finally, thank you to my husband, Dr. Jon Bath, for his ongoing tech support (and his never
ending patience with my relative technology-related ineptitude).
v
Operational funding for this project was provided by Brourassa and Associates Rehabilitation
Centre.
Funding for my PhD was provided by the following:
- Canadian Insitutes of Health Research (CIHR) Fellowship in Knowledge Translation
- Public Health and the Agricultural Rural Ecosystem (PHARE) CIHR Strategic Graduate
Training program
- Western Regional Training Centre (WRTC) in Health Services Resarch CIHR Strategic
Graduate Training program
vi
DEDICATION
This disseration is dedicated to my husband, Jon, and my children, William and Adelaide.
You all serve as constant reminders to me that life is meant to be cherished and enjoyed.
vii
TABLE OF CONTENTS (BRIEF)
PERMISSION TO USE & DISCLAIMER ………………………………………. i
ABSTRACT ………………………………………………………………............. ii
ACKNOWLEDGEMENTS ………………………………………………............. iv
CHAPTER THREE: DIAGNOSTIC AND MANAGEMENTCONCORDANCE BETWEEN PHYSIOTHERAPISTS AND ANORTHOPAEDIC SURGEON FOR LOW BACK COMPLAINTS ………………………….……………………… 56
CHAPTER FOUR: A PHYSIOTHERAPY TRIAGE ASSESSMENT SERVICE FOR PEOPLE WITH LOW BACK-RELATED COMPLAINTS: EVALUATION OF SHORT TERM OUTCOMES ……………………………………………….. 82 CHAPTER FIVE: PATIENTS AND REFERRING HEALTH CARE PROVIDER SATISFACTION WITH A PHYSIOTHERAPY SPINA TRIAGE ASSESSMENT SERVICE …………………………………….……………………………………. 108 CHAPTER SIX: A PHYSIOTHERAPY ASSESSMENT FOR PEOPLE WITH LOW BACK-RELATED COMPLAINTS: SHORT TERM BIOPSYCHOSOCIAL PREDICTORS OF SUCCESS ………………………….. 143 CHAPTER SEVEN: CONCLUSION ……………………………………………. 176 APPENDICES …………………………………………………………………….. 185
viii
TABLE OF CONTENTS (DETAILED)
PERMISSION TO USE & DISCLAIMER ………………………………………. i
ABSTRACT ………………………………………………………………............. ii
ACKNOWLEDGEMENTS ………………………………………………............. iv
DEDICATION …………………………………………………………….. ……... vi
TABLE OF CONTENTS ………………………………………………….. ……... viii
LIST OF TABLES ………………………………………………………………… xvi
LIST OF FIGURES ……………………………………………………………….. xix
PREFACE …………………………………………………………………………. xxii
CHAPTER ONE: INTRODUCTION …………………………………………… 1
1.1 Accessibility and Orthopaedic Wait Times ………………………….. …….. 2
1.2 Orthopaedic Triage ………………………………………………………….. 3
1.3 Background: Spinal Triage Service …………………………………………. 4
1.4 Overview of the Biopsychosocial Model …………………………………… 6
1.5 Research Objectives ………………………………………………………… 7
1.6 General Overview of Study Methodology …………………………………. 7
1.7 Rational and Relevance of Study …………………………………………… 9
1.8 References ………………………………………………………………….. 10
CHAPTER TWO: LITERATURE REVIEW ……………………………………... 15
2.1 Epidemiology of Low Back-related Disorders ………………………………... 16
2.1.1 Incidence of Low Back Pain ………………………………………… 16
ix
2.1.2 Prevalence of Low Back Pain ……………………………….. …… 17
2.1.3 Frequency of Other Low Back-related Disorders …………………… 17
2.1.4 The Biopsychosocial Model ………………………………………… 18
2.1.5 Low Back Pain Associated Factors …………………………. ……... 19
2.1.5.1 Age and Sex ……………………………………………….. 20
2.1.5.2 Socioeconomic Status and Education …………………… 20
2.1.5.3 Other Risk Factors and Co-morbidities ………………… 20
2.1.5.4 Psychosocial Factors ……………………………………. 21
2.2 Treatment of Low Back-related Disorders …………………………………. 22
2.2.1 Treatment Options for Low Back Pain …………………………… 22
2.2.2 Treatment Options for Other Select Low Back-related Disorders … 22
2.3 Health Care Utilization …………………………………………………….. 24
2.3.1 Economic Burden of Low Back Pain ……………………………. 24
2.3.2 Primary Health Care Utilization for Low Back Pain ……………. 24
2.3.3 Wait Times for Orthopaedic Surgery and Consultation ………….. 25
2.3.4 Primary Health Care vs. Primary Care ……………………………. 26
2.3.5 Physiotherapy in Primary Health Care …………………………… 27
2.3.6 Physiotherapy in Primary Care …………………………………… 27
2.3.7 Triage Assessment by Physiotherapists for Orthopaedic Conditions.. 28
2.4 Classification of Low Back-related Disorders ……………………………… 30
2.5 Outcome Assessment and Psychosocial Screening for Low Back Disorders … 31
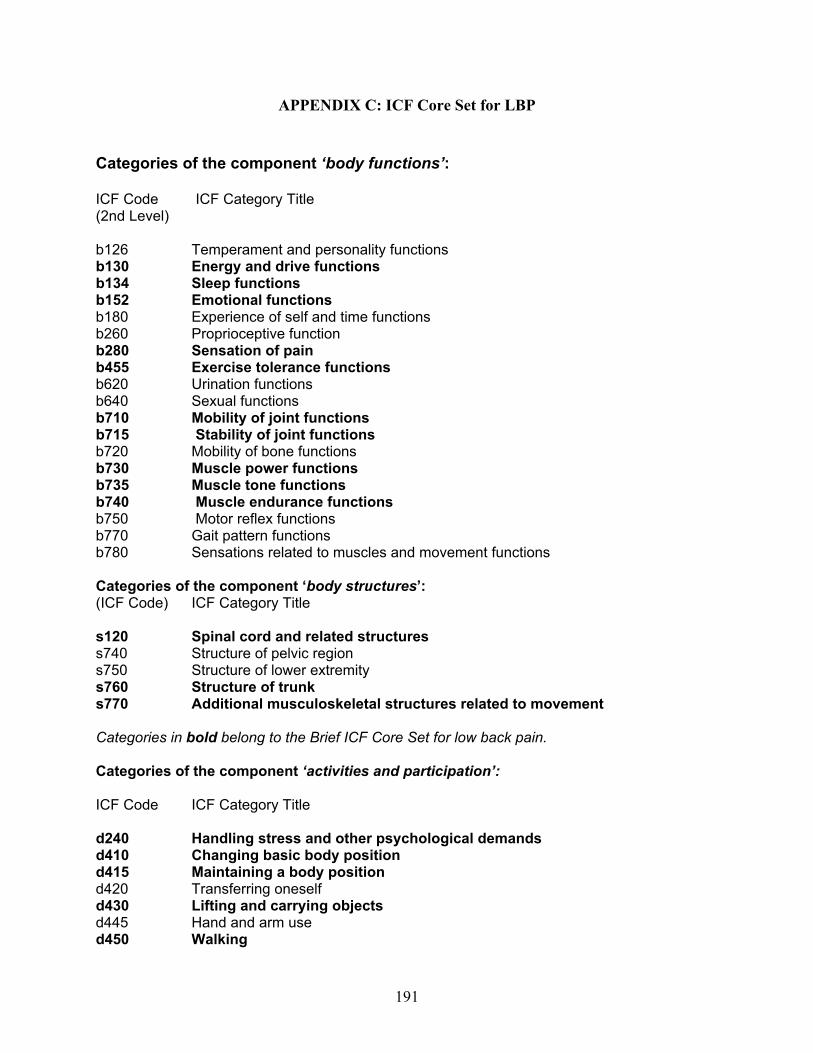
2.5.1 International Classification of Functioning, Disability and Health … 31
2.5.2 Outcome Measurement of Low Back-related Disorders …………… 33
2.5.3 Evaluation of Psychosocial Factors ………………………………… 36
2.5.3.1 Depression and Increased Bodily Awareness …………….. 37
2.5.3.2 Illness Behaviours …………………………………………. 38
2.5.3.3 Fear Avoidance Beliefs ……………………………………. 38
2.6 References …………………………………………………………………….. 40
CHAPTER THREE: DIAGNOSTIC AND MANAGEMENT CONCORDANCE BETWEEN PHYSIOTHERAPISTS AND AN ORTHOPAEDIC SURGEON FOR LOW BACK COMPLAINTS ………............................................................ 56
3.1 Introduction …………………………………………………………………… 59
3.2 Background ………………………………………………………………….. 61
3.2.1 Description of the Spine Triage Service ……………………………. 61
3.3 Participants …………………………………………………………………… 62
3.4 Methods and Measures ……………………………………………………… 63
3.4.1 Clinical Classification Tool Development ……………………….. 63
3.4.2 Clinician Examiners ……………………………………………….. 64
3.4.3 Assessment Reports ……………………………………………….. 64
3.4.4 Diagnostic and Management Classification ………………………. 65
5.3.4.7 Provider Comments: Other ………………………………. 132
5.3.4.7.1 Limited Access to Care …………………………. 132
5.4 Discussion …………………………………………………………….. 133
5.5 Conclusion ……………………………………………………………. 137
5.6 References ……………………………………………………………. 138
CHAPTER SIX: A PHYSIOTHERAPY ASSESSMENT FOR PEOPLE WITH LOW BACK-RELATED COMPLAINTS: SHORT TERM BIOPSYCHOSOCIAL PREDICTORS OF SUCCESS ………………………… 143 6.1 Introduction …………………………………………………………………… 145
6.2 Methods and Measures ………………………………………………………. 146
6.2.1 Study Design ………………………………………………………. 146
6.2.2 Participants ………………………………………………………… 147
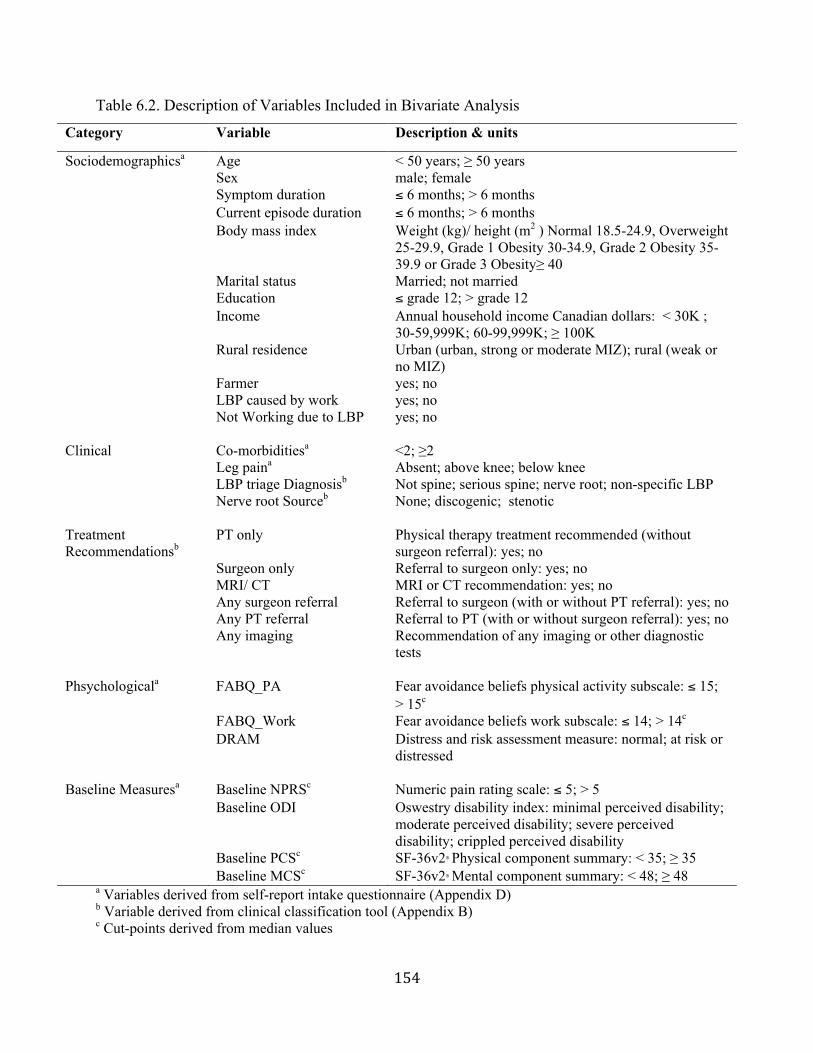
6.2.3 Measures …………………………………………………………… 148
6.2.3.1 Sociodemographics and General Health …………………………. 148
xiv
6.2.3.2 Employment Related Variables ………………………………….. 148
6.2.3.3 Clinical Features …………………………………………………. 149
6.2.3.4 Fear Avoidance Beliefs …………………………………………… 149
6.2.3.5 Depression and Somatization ……………………………………. 149
The evaluation of pain severity (i.e. how much does a person hurt) is, on the surface,
relatively straightforward, however pain evaluation can cover many dimensions. The bodily pain
subscale of the SF-36 is a generic scale that asks about overall pain; it’s comprised of two-item
scale measures for pain intensity and interference with activities. (155) It is also important to
consider pain severity over an interval of time and not just at a fixed point in time when
evaluating chronic and recurrent conditions or symptoms, such as LBP. (155)
The Graded Chronic Pain Scale (GCPS) 6(Appendix D) is a valid and reliable seven- item
self-reported instrument that measures pain and pain-related disability in the previous 6 months.
(167-171) It has demonstrated good psychometric properties (ie. reliability and validity) in
general population samples and in clinical samples of patients with a variety of musculoskeletal
conditions, including LBP, (167-171) The questionnaire provides five ordered grades of pain
severity: grade 0 represents no pain, grade I represents pain of low intensity and low disability,
grade II is pain of high intensity and low disability, grade III is pain associated with high levels
of disability and moderate limitations in activities, and Grade IV refers to pain with high levels
of disability and severe limitations.
The Numeric Pain Rating Scale (Appendix D) is a simple three-item tool that can be
used to indicate the intensity of current pain at its best and worst level over the preceding 24 hour
period. (172) The 3 ratings can be averaged to arrive at an overall pain score. The scale has been
shown to have adequate reliability and validity in patients with LBP when the 3 scores are
averaged. (173)
6 Note the GCPS was measured in intake, but was not repeated at 4 week post test (only 6 & 12 months), because it asks about symptoms in past 6 month period.
36
2.5.2.4 Work Disability Measures
The SF-36 role limitation questions ask about limitations in any role activity, including
work but also other roles. Therefore, the SF-36 role limitation scales do not reflect work
limitations only but are an aggregate across various roles. (155) Bombardier (155) states that
health-related work disability should include, at a minimum, a measure of work status and work-
time loss. She suggests that an initial categorization include the following: employed at usual
job, on light duty or some restricted work assignment, paid leave/sick leave, unpaid leave,
unemployed because of health problems, unemployed because of other reason, student, keeping
house/ homemaker, retired, on disability. Measuring work-time loss and, if applicable, time to
return to work is also recommended.
2.5.2.5 Satisfaction Measures
Patient satisfaction is an important outcome of care and there are many approaches to the
measurement of patient satisfaction. (155,174,175). Furthermore, satisfaction is a
multidimensional concept. For example, people or users of a service can be satisfied with one
aspect of care, but not with another. (175,176) Common dimensions incorporated in standardized
satisfaction measures used in health care settings include: interpersonal manner, technical
quality, accessibility and convenience, finances, efficacy and outcomes, continuity, physical
environment and availability. (174,175) Although there are several standardized
multidimensional quantitative patient satisfaction surveys described in the literature, (175,177-
181) Hudak (175) suggests that, at a minimum, a global satisfaction with treatment outcome and
an open-ended question be included to fully assess patient satisfaction.
2.5.3 Evaluation of Psychosocial Factors
Psychosocial factors, such as depression, somatic symptoms, pain behaviors and fear
avoidance behaviors, are important in the development of disability related to low back pain.
Thus, it is important to consider the impact of these factors on the outcomes of any intervention
for low back pain.
37
2.5.3.1 Depression and Increased Bodily Awareness
Depression is commonly associated with chronic back pain. (168,182) The term
depression can reflect a wide spectrum of presentations ranging from depressed mood to
depressive illness. Although it is important to recognize those patients who are psychiatrically ill
and refer them for appropriate evaluation and treatment,(183) the majority of people who have
back pain are thought to present with depressed mood simply as a component of their chronic
pain. (184) Increased bodily or somatic awareness are often also reported by people who
experience chronic pain; both are thought to be related to a heightened emotional state that
results in paying more attention to bodily sensations and physiological events that may be
interpreted as pain or other physical discomfort. (184,185)
There are several psychological questionnaires that can be used as a simple screen for
distress and depression. (184,186) The Distress and Risk Assessment Method (DRAM) of
assessing psychological distress (185) combines a depression questionnaire, the Modified Zung
Depression Inventory, and a questionnaire pertaining to somatic symptoms, the Modified
Somatic Perception Questionnaire (MSPQ) (Appendix D). The DRAM is a simple method of
classifying patients into those showing no psychological distress, those at risk and those who are
clearly distressed either due to primarily somatic or depressive symptoms.(184) Main and
colleagues suggest that people who are “distressed” according to the DRAM (see Table 2.1) may
need more than just physical treatment and should be referred on for further psychological
assessment.(185) The DRAM has been shown to predict outcomes in primary care patients with
back pain (187) and to predict the responses to a pain management program.(184)
Table 2.1: The Distress and Risk Assessment Method (DRAM) of assessing psychological distress:(185) Classification Zung and MSPQ scores Normal Modified Zung <17 At risk Modified Zung 17-33 and MSPQ <13 Distressed, somatic Modified Zung 17-33 and MSPQ>12 Distressed, depressive Modified Zung >33
38
2.5.3.2 Illness Behaviours
The consideration of illness behaviour is an important aspect of the biopsychosocial
approach to low back pain. Illness behavior is what people say and do that expresses and
communicates that they are ill. (188) Clinical observation of illness behavior may include a pain
drawing or observation of behavioral signs and symptoms.
A pain drawing (Appendix D), completed by a patient, can give an indication of both
physical and emotional characteristics of the pain.(188) A pain drawing can give a clinician an
indication of whether or not the patient’s perception of symptom type, location and pattern fits
with the information that is gathered in the remainder of the assessment (i.e. history and physical
examination). The pain drawing should not be used in isolation to provide evidence of
psychological distress; however, it can be used as an initial clue that the person requires more in
depth evaluation (i.e. further psychological assessment or investigation to rule out serious
pathology).(188)
Waddell (189,190) identified a group of behavioral signs and symptoms that do not
appear to fit with a clear pathoanatomical diagnosis of mechanical low back pain. Assessment of
these “non-organic” symptoms and signs can add to a more complete evaluation of a person’s
problem and assist with more effective management. Waddell, however, indicates that the use of
these signs is not appropriate in the following situations: 1) patients with possible serious spinal
pathology or widespread neurological problems, 2) patients over 60 years of age, and 3) patients
from ethnic minorities. (188) For these reasons, the behavioural signs are likely not appropriate
to use in the context of evaluating the WSSAS, however a pain drawing can be used to indicate
locations of pain and patterns of pain referral.
2.5.3.3 Fear Avoidance Beliefs
“Fear of pain may be more disabling than pain itself”. (191) How people think and feel
about back pain is a central component of what they do about it and how it affects them.(191)
Fear is a powerful negative drive that is closely related to pain. We learn from experience to fear
situations or stimuli that have caused us stress or pain, and then we try to avoid them. If we
avoid these situations and do not experience pain, this may reinforce our fear about the cause of
39
the pain and, thus, reward our efforts to avoid it. (191) The fear-avoidance model (191,192)
attempts to explain how some people recover from back pain while others go on to develop
chronic pain and disability.
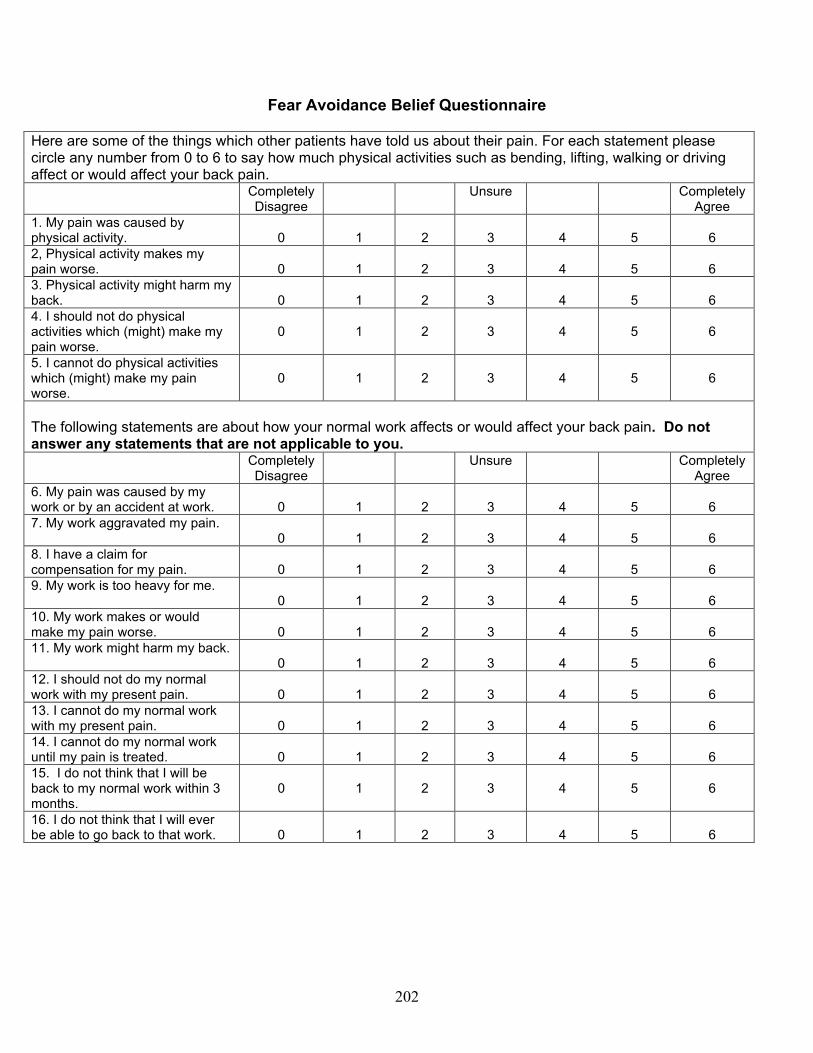
The emergence of the biopsychosocial model of LBP led Waddell et al (193) to develop
the Fear Avoidance Beliefs Questionnaire (FABQ) (Appendix D). The FABQ can be used to
assess participants’ beliefs with regard to the effect of physical activity and work on their LBP. It
consists of 16 items and patients rate their agreement with each statement on a 7- point Likert
scale (0 = completely disagree, 6 = completely agree). The original factor analysis revealed two
subscales: the work subscale (FABQ_W) and the physical activity subscale (FABQ_PA). The
psychometric properties of the subscales are better established than the total FABQ so use of the
subscales may be preferable. (194) The FABQ has been shown to explain unique amounts of
variance in work loss and disability, after controlling for other relevant factors. (193) A higher
score indicates more strongly held fear avoidance beliefs.
The aforementioned measurement tools, encompassing back specific function, general
well-being/ generic health status, pain, work disability, and satisfaction with care, and the
psychological screening tools presented represent a comprehensive approach to the evaluation of
outcomes and predictive factors of success or failure with any intervention for people with LBP.
These measures and tools, when combined with factors such as demographics (i.e. age, gender,
socioeconomic status) and perceived access to health care correspond to the ICF’s domains of
body, individual and societal perspectives that occur within an environmental context.
40
2.6 References
(1) Rubin DI. Epidemiology and risk factors for spine pain. Neurol Clin 2007 05;25(2):353-371.
(2) Deyo RA . Low back pain. NEJM 2001;344(5):363-370.
(3) Lawrence RC, Felson DT, Helmick CG, Arnold LM, Choi H, Deyp RA, et al. Estimates of
the prevalence of arthritis and other rheumatic conditions in the United States. Part II. Arthritis
Rheum 2008;58(1):26-35.
(4) Cassidy JD, Côté P, Carroll LJ, Kristman V. Incidence and course of low back pain episodes
in the general population. Spine 2005;30(24):2817-2823.
(5) Waxman R, Tennant A, Helliwell P. A prospective follow-up study of low back pain in the
community. Spine 2000 Aug 15;25(16):2085-2090.
(6) Papageorgiou AC, Croft PR, Thomas E, Ferry S, Jayson MI, Silman AJ. Influence of
previous pain experience on the episode incidence of low back pain: results from the South
Manchester Back Pain Study. Pain 1996;66(2-3):181-185.
(7) Kopec JA, Sayre EC, Esdaile JM. Predictors of back pain in a general population cohort.
Spine 2004;29(1):70-77.
(8) Andersson GB . Epidemiology of low back pain. Acta orthopaedica Scandinavica.
Supplementum 1998;281:28-31.
(9) Hestbaek L, Lenoeuf-Yde C, Manniche C. Low back pain: what is the long-term course? A
review of studies of general patient populations. Eur Spine J 2003;12(2):149-165.
(10) Cherkin DC, Deyo RA, Loeser JD, Bush T, Waddell G. An international comparison of
back surgery rates. Spine 1994;19(11):1201-1206.
(11) Deyo RA, Tsui-Wu YJ. Descriptive epidemiology of low-back pain and its related medical
care in the United States. Spine 1987;12(3):264-268.
(12) Taylor VM, Deyo RA, Cherkin DC, Kreuter W. Low back pain hospitalization. Recent
United States trends and regional variations. Spine 1994;19(11):1207-1212.
(13) Boden SD, Davis DO, Dina TS, Patronas NJ, Wiesel SW. Abnormal magnetic-resonance
scans of the lumbar spine in asymptomatic subjects. A prospective investigation. J Bone Joint
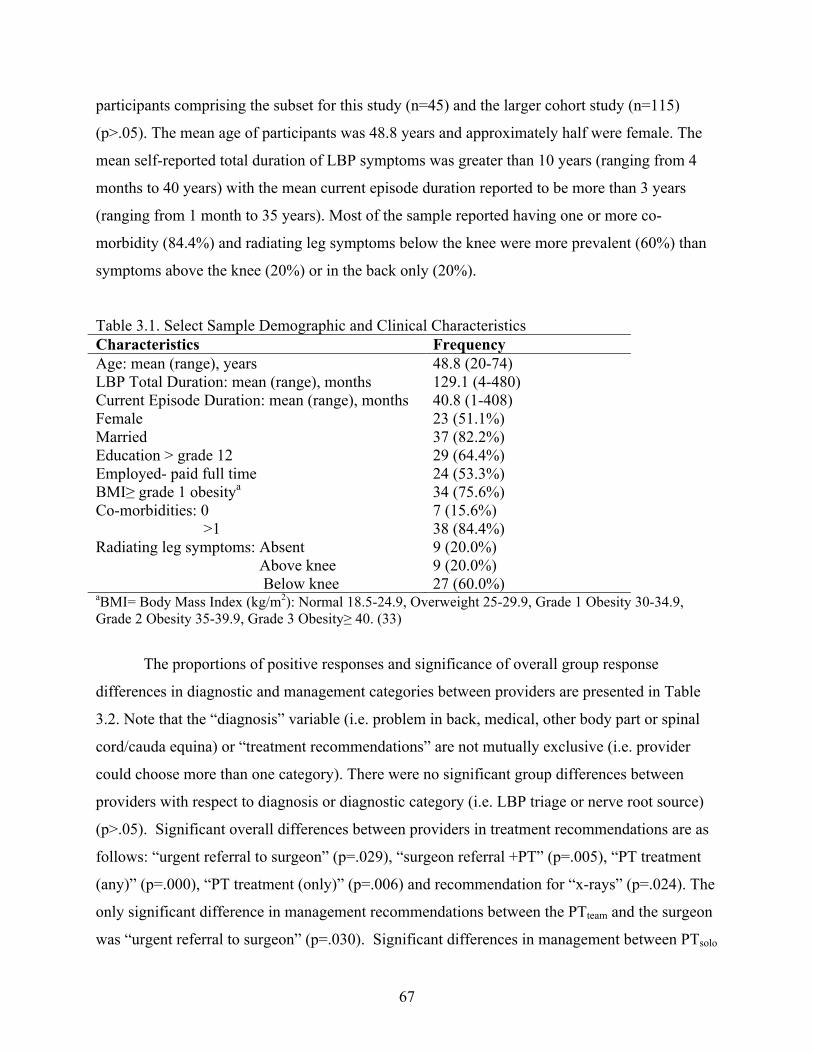
acategories are not mutually exclusive. bType of other specialists: vascular, neurologist, pain management physician, urogynecologist, rheumatologist c Includes Xray, CT, MRI or Other tests (i.e. blood work, bone scan)dFunctional testing, chiropractic
70
The inter-examiner reliability of diagnostic and management recommendations between
provider groups is presented in tables 3.3-3.5. Only variables with k >.40 and with prevalence
>10% and 90% are shown. The diagnostic categories, including LBP triage and nerve root
source show “moderate” to “good” agreement between all provider groups (range .42-.68).
Agreement for “imaging (any)” was “good” between all provider groups (.40-.48). Good
agreement for advanced imaging (i.e. CT or MRI) (.48-.57) and PT treatment (any) (.40-.43) was
only present between PTteam vs Surgeon and PTteam vs PTsolo, not between PTsolo vs Surgeon.
Table 3.3. Inter-examiner Reliability: PTteam vs Surgeon Variablea Overall
agreement Kappa coefficient
SE for Kappa 95% CI
LBP triageb 73.3% .54 - .16-.75 Nerve Root sourceb 68.9% .68 - .41-.82 Imaging (CT or MRI) 80.0% .55 .124 .31-.79 Imaging (any) 77.8% .48 .140 .21-.75 PT Rx (any) 68.9% .40 .126 .15-.65 aOnly variables with K>.40 and with prevalence >10% and <90% are shown. bWeighted kappa (quadratic weights) Table 3.4. Inter-examiner Reliability: PTsolo vs Surgeon Variablea Overall
agreement Kappa coefficient
SE for Kappa 95% CI
LBP triageb 73.3% .430 - -.038-.687 Nerve Root source b 71.1% .60 - .276-.782 Imaging (any) 73.3% .40 .144 .12-.68 aOnly variables with K>.40 and with prevalence >10% and <90% are shown. bWeighted kappa (quadratic weights) Table 3.5. Inter-examiner Reliability: PTteam vs PTsolo Variablea Overall
agreement Kappa coefficient
SE for Kappa 95% CI
LBP triageb 71.1% .56 - .21-.76 Nerve Root sourceb 71.1% .64 - .34-.80 PT Treatment (any) 73.3% .43 .134 .30-.69 Imaging (CT or MRI) 84.4% .57 .146 .30-.84 Imaging (any) 77.8% .483 .140 .21-.75 aOnly variables with K>.40 and with prevalence >10% and <90% are shown. bWeighted kappa (quadratic weights)
71
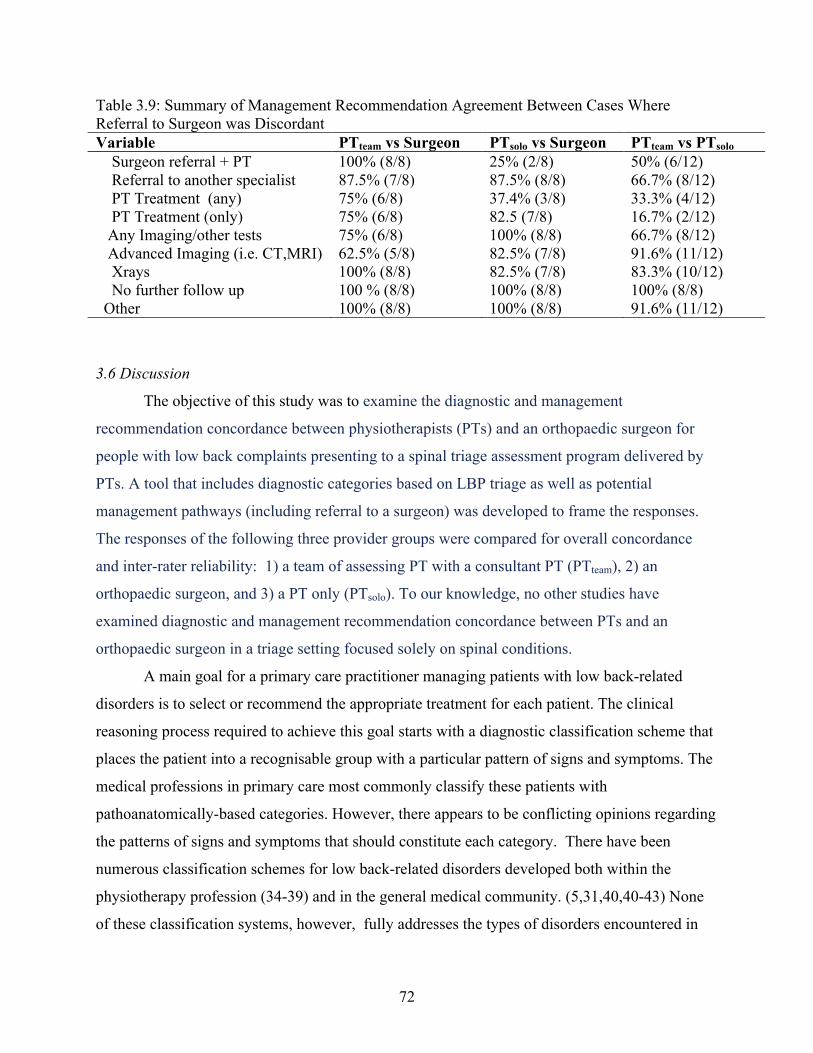
The levels of agreement between providers with respect to “referral to surgeon (any)” are
presented in Tables 3.6-3.8. The overall agreement was 82.2% for both PTteam vs Surgeon and
PTsolo vs Surgeon and 73.3% for PTteamvs PTsolo . Further analysis of discordant cases for surgical
referral is provided in Table 3.9 where a summary of percent agreement of the remaining
management recommendations can be found. Relatively high levels of agreement (i.e. ≥ 75%)
between PTteam and the surgeon are present for all variables with the exception of “advanced
imaging”(62.5%). Comparison of PTsolo to the surgeon shows high agreement (i.e. ≥ 82.5%)
between all variables with the exception of “surgeon referral + PT” (25%) and “PT treatment
(any)” (37.4%). Among discordant cases, fewer variables show high agreement between PTteam
and PTsolo with the least agreement for PT treatment (16.7-33.3%).
Table 3.6: Recommendation of Referral to Surgeon (any): PTteam vs Surgeon PTteam Yes No Total Surgeon Yes 2 1 3 No 7 35 42 Total 9 36 45 Percent Agreement 82.2% (37/45) Note- Kappa not calculated due to prevalence<10% Table 3.7: Recommendation of Referral to Surgeon (any): PTsolo vs Surgeon PTsolo Yes No Total Surgeon Yes 3 0 3 No 8 34 42 Total 11 34 45 Percent Agreement 82.2% (37/45) Note- Kappa not calculated due to prevalence<10% Table 3.8: Recommendation of Referral to Surgeon (any): PTteam vs PTsolo PTteam Yes No Total PTsolo Yes 4 7 11 No 5 29 34 Total 9 36 45 Percent Agreement 73.3%% (33/45) Note- Kappa not calculated due to prevalence<10%
72
Table 3.9: Summary of Management Recommendation Agreement Between Cases Where Referral to Surgeon was Discordant Variable PTteam vs Surgeon PTsolo vs Surgeon PTteam vs PTsolo Surgeon referral + PT 100% (8/8) 25% (2/8) 50% (6/12) Referral to another specialist 87.5% (7/8) 87.5% (8/8) 66.7% (8/12) PT Treatment (any) 75% (6/8) 37.4% (3/8) 33.3% (4/12) PT Treatment (only) 75% (6/8) 82.5 (7/8) 16.7% (2/12) Any Imaging/other tests 75% (6/8) 100% (8/8) 66.7% (8/12) Advanced Imaging (i.e. CT,MRI) 62.5% (5/8) 82.5% (7/8) 91.6% (11/12) Xrays 100% (8/8) 82.5% (7/8) 83.3% (10/12) No further follow up 100 % (8/8) 100% (8/8) 100% (8/8) Other 100% (8/8) 100% (8/8) 91.6% (11/12)
3.6 Discussion
The objective of this study was to examine the diagnostic and management
recommendation concordance between physiotherapists (PTs) and an orthopaedic surgeon for
people with low back complaints presenting to a spinal triage assessment program delivered by
PTs. A tool that includes diagnostic categories based on LBP triage as well as potential
management pathways (including referral to a surgeon) was developed to frame the responses.
The responses of the following three provider groups were compared for overall concordance
and inter-rater reliability: 1) a team of assessing PT with a consultant PT (PTteam), 2) an
orthopaedic surgeon, and 3) a PT only (PTsolo). To our knowledge, no other studies have
examined diagnostic and management recommendation concordance between PTs and an
orthopaedic surgeon in a triage setting focused solely on spinal conditions.
A main goal for a primary care practitioner managing patients with low back-related
disorders is to select or recommend the appropriate treatment for each patient. The clinical
reasoning process required to achieve this goal starts with a diagnostic classification scheme that
places the patient into a recognisable group with a particular pattern of signs and symptoms. The
medical professions in primary care most commonly classify these patients with
pathoanatomically-based categories. However, there appears to be conflicting opinions regarding
the patterns of signs and symptoms that should constitute each category. There have been
numerous classification schemes for low back-related disorders developed both within the
physiotherapy profession (34-39) and in the general medical community. (5,31,40,40-43) None
of these classification systems, however, fully addresses the types of disorders encountered in
73
the WSSAS nor would they likely be clinically relevant or meaningful for all of physiotherapists,
primary care providers and orthopedic surgeons. Many of the tools developed within the
physiotherapy profession, for example, are for classification of “non-specific” or mechanical low
back pain only and, thus, would not be relevant to a surgeon whose clinical focus is different
than a physiotherapist. Therefore a new classification scheme that is relevant for this
interprofessional clinical context was needed.
One of the reasons patients and surgeons may not be comfortable with models of
collaborative care is that they have the perception that patients may receive inferior, inaccurate
or inappropriate treatment from another health care professional. (44,45) Thus, evaluating the
“appropriateness” of referral to the surgeon is a key consideration in a spinal triage assessment
program such as the WSSAS. Although appropriateness of referral can have many meanings,
(46) in this study a proxy measure for appropriateness was deemed to be agreement with the
surgeon with respect to “referral to surgeon”. It has been suggested that PTs need to adapt to the
working methods of the orthopaedic surgeons involved, making our methodology a pragmatic
approach to measuring appropriateness. (7,19) While there was a high level of agreement
(82.2%) between PTs and the surgeon as to whether referral to the surgeon was necessary, the
PTs were more likely to recommend review with the surgeon than the surgeon himself. This
suggests that the PTs may be taking a more cautious approach to their recommendations and
seeking a surgeon’s opinion in cases where there are signs of potential serious spinal pathology
or where surgical intervention may be indicated. Also, it is likely that the surgeon is more
interested in reviewing patients who are more likely to be surgical candidates and may be more
inclined to refer to other specialists and/or investigations in cases which are deemed to be “non-
surgical”.
The assessment model used in the WSSAS is a team of an assessing PT and a consultant
PT with input from the client. This model is an example of a collaborative reasoning approach
where there is the development of a consensual approach toward the interpretation of
examination findings. (47,48) Analysis of the cases where there was disagreement over whether
referral to the surgeon was required showed that the PTteam had high levels of agreement (62.5%-
100%) with the surgeon for other management options whereas the PTsolo was more likely to
recommend a referral to PT + surgeon. These may be cases where the PTsolo felt that either a
second opinion from the PT consultant was recommended or further conservative PT treatment
74
in addition to a review with the surgeon was sought to help clarify an appropriate course of
management. The PT consultant had several years of practice working collaboratively with the
orthopaedic surgeon group, thus the higher concordance in management recommendations
between the PTteam and the surgeon is not surprising. Another reason for the discrepancies in
management recommendations may simply be years of experience with the PTteam having a total
of over 40 years of experience (ie. assessing PT 14 years, consultant PT 30+ years) and the PTsolo
having only 5 years. If possible, further studies investigating the utility of this model should aim
to have more uniform clinical years of experience represented in each group (ie PTteam and
PTsolo).
Although LBP is most often related to benign underlying pathoanatomical causes that are
not amenable to surgery, back pain can be a common presenting symptom of potentially serious
spinal or medical problems. (5,21)The clinical characteristics of the sample in this study (n=45),
which were found not to be significantly different from the larger cohort study sample (n=115),
suggests that the people accessing the spinal triage service had a higher proportion of below knee
symptoms (suggesting neurogenic pathology), potentially serious pathology and longstanding,
chronic symptoms. Thus, the people using the service likely represent more complex spinal
problems than may be typically seen in a primary care setting. (49,50) For example, Hall and
colleagues(50) examined the effectiveness of a LBP clinical classification system based
primarily on symptom location and presentation. The authors suggest that such a system can be
used to help clarify surgical referrals. This system, however, was evaluated for use in outpatient
physiotherapy settings only and people with potential serious pathology were excluded from the
study. Furthermore, the majority of participants (86%) had “back dominant” symptoms without
leg referral. Patients are referred to this service by their primary care providers because either
they have failed to respond favourably to treatment or based on a suspicion of the possibility of
more serious pathology.
Along with this increased complexity in cases is a greater level of professional
responsibility and risk. Weatherley and Hourigan (20) found that 74% of physiotherapists
working in spinal triage roles (n=39) in the UK reported having stress related to their role. These
authors further suggest that the role of a consultant (in this case a surgeon) is essential to counter
potential feelings of isolation on the part of the PTs, particularly when the degree of
responsibility taken by the PT’s in such positions exceeds that which they would normally be
75
expected to carry.The collaborative reasoning model used by the WSSAS with the involvement
of a consulting PT in each assessment, may help to ameliorate the high levels of stress and
potential feelings of isolation as well as help to ensure greater diagnostic and management
appropriateness.
McCarthy and colleagues (51) investigated the intertester reliability of individual tests
and questions recommended by international LBP guidelines for the triage process and found
that PTs generally demonstrated “fair” agreement on 86% (n=43) of the test items investigated in
301 participants. However, they go on to recommend that: “reliance on single tests with only fair
levels of agreement may be unwise”. Our study did not examine the reliability of individual tests
and questions, but rather investigated the diagnostic and management classification based on the
findings of the assessing PT only. We would suggest that further studies in this area should
incorporate not only the reliability of individual test items, but also concordance of diagnostic
and management recommendations between different professions (e.g. PT’s and surgeons) in
light of the findings of individual test items.
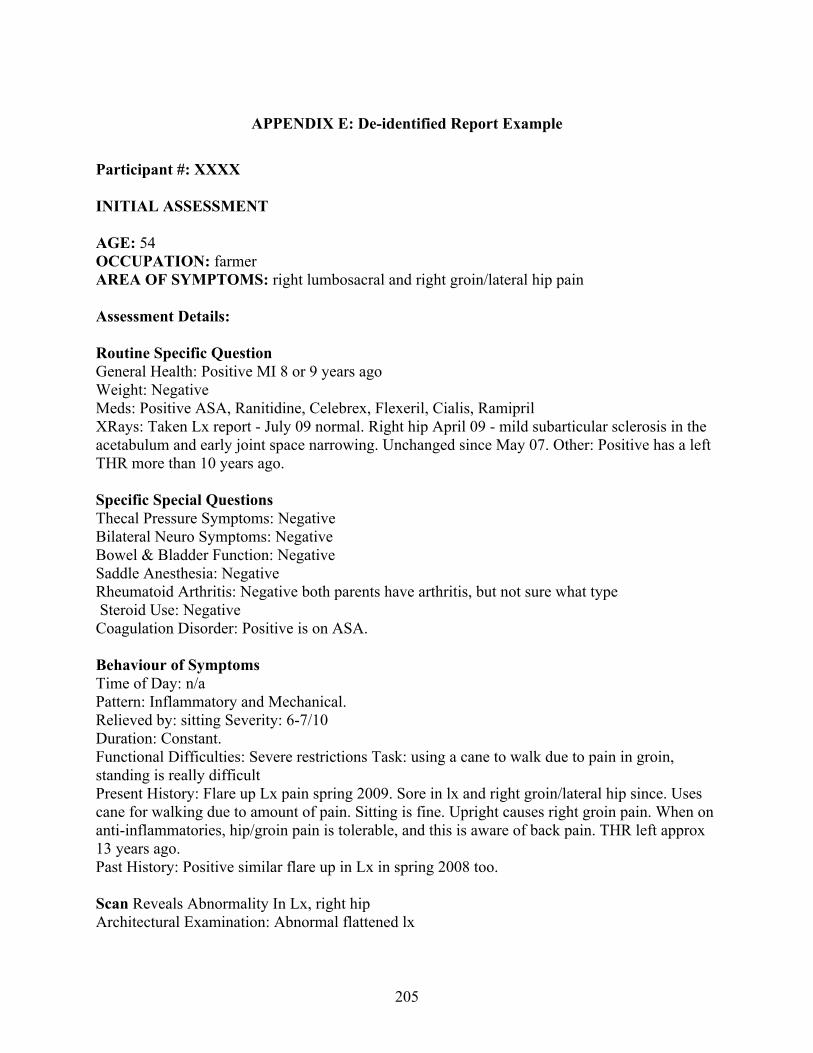
The results of this study should be viewed in light of its many limitations.
A main limitation is that the diagnostic and management classification done by the PTsolo and the
surgeon were based on de-identified assessment reports completed by the PTteam and not done on
the basis of in-person review of the participants. This may account for the relatively high level of
concordance for diagnostic classification among the provider groups. Future studies should be
undertaken in which the provider groups assess each participant “in-person” rather than basing
their classification on a de-identified report.
A second limitation is the use of a “pilot” non-validated diagnostic and management
recommendation tool. Although the diagnostic portion of the tool was based on work and
recommendations from other groups, (21,26,27) the management categories were derived from a
previous sample of users of the WSSAS (29) and, therefore, may not be applicable to other
settings with different case-mixes of patients as well as different management protocols. Further
work should seek to further develop and validate this tool in different clinical settings.
A further limitation of this study is the relatively small sample size. A post-hoc
determination of sample size based on Sim et al’s work (30) would suggest that a sample ranging
from 65 to 273 participants is needed depending on the level of kappa expected (i.e. .40 to .70), a
10% prevalence of “referral to surgeon” and 80 % power.
76
A final limitation is that reliability or concordance does not imply accuracy or validity.
Reliability has traditionally been emphasized as a precursor to validity and the numerous studies
examining test reliability without any assessment of validity attest to this approach. Reliability
assessments conducted separately from an examination of validity may result in the promotion of
highly reliable but diagnostically meaningless tests. (52) Thus, reliability should be considered a
complement to validity. As there is no “gold standard” for the diagnosis of LBP, validation of
the classification tool could include prospectively linking categorization of diagnosis and
management recommendations to the “actual” management that was undertaken as well as to
how diagnostic and management categorizations are related to patient relevant outcomes. This
type of analysis will be included in our ongoing prospective evaluation of the spinal triage
service.
3.7 Conclusion
Although there is general consensus on the importance of initial triage of spinal
conditions, there is little empirical evidence to support its use. (25) This study used a newly
developed pilot classification tool based on the LBP triage categories in addition to potential
management recommendations.
The results of this study show that there is high concordance in diagnostic categorization
of low back-related complaints between PTs with advanced orthopaedic training and an
orthopaedic surgeon regardless of whether the PT’s were collaborating as a team (i.e. assessing
PT + consultant PT) or on their own (i.e. PTsolo). Furthermore, there was high agreement (82.2%)
between PTs and a surgeon as to whether referral to a surgeon was required, with the PTs being
more likely to recommend review with the surgeon than the surgeon himself. There were,
however, more significant differences between groups for management recommendations with
the PTsolo being more likely than the PTteam or the surgeon recommend referral to the surgeon, PT
treatment or x-rays. These differences in management recommendations may reflect differences
in the model of collaborative reasoning of the PTteam in comparison to a PT assessing people with
complex spinal problems on their own.
77
3.8 References
(1) Hadlow AT. Back Pain: a problem of referral. J Bone Joint Surg Br 2003;85-
B(Supp_III):208.
(2) MacKay C, Canizares M, Davis A, Badley E. Health care utilization for musculoskeletal
disorders. Arthritis Care Res. 2010;62(2):161-169.
(3) Canizares M, MacKay M, Davis A, Mahomed N, Badley E. Orthopaedic Surgery in Ontario
in the era of the wait time strategy Arthritis Community Research & Evaluation Unit. 2007;
Report No.: 07-02.
(4) Mayman D, Yen D. Maximizing use of a surgical clinic for referrals of patients having back
problems. Can J Surg 1999;42:117-119.
(5) Waddell G. Diagnostic triage. The Back Pain Revolution. Second ed. Toronto: Churchill
Livingstone; 2004. p. 9-26.
(6) Waddell G. Epilogue. The Back Pain Revolution. Second ed. Toronto: Churchill Livingstone;
2004. p. 457-459.
(7) Daker-White G, Carr AJ, Harvey I, Woolhead G, Bannister G, Nelson I, et al. A randomised
controlled trial. Shifting boundaries of doctors and physiotherapists in orthopaedic outpatient
departments. J Epidemiol Community Health 1999;53(10):643-650.
(8) Hattam P. The effectiveness of orthopaedic triage by extended scope physiotherapists. Clin
Govern Int J 2004;9(4):244-252.
(9) Aiken AB, Harrison MM, Atkinson M, Hope J. Easing the burden for joint replacement wait
times: the role of the expanded practice physiotherapist. Healthcare Quarterly 2008;11(2):62-66.
(10) Sarro A, Rampersaud YR, Lewis S. Nurse practitioner-led surgical spine consultation clinic.
J Adv Nurs 2010;66(12):2671-2676.
(11) Aiken AB, McColl M. Interprofessional Healthcare: A common taxonomy to assist with
understanding. J Allied Health 2009;38:92-96.
(12) Connolly JF, DeHaven KE, Mooney V. Primary care management of musculoskeletal
disorders: managed care is redefining the physician's role. J Musculoskeltal Med 1998;15(8):28-
38.
(13) Roberts C, Adebajo AO, Long S. Improving the quality of care of musculoskeletal
conditions in primary care. Rheumatology 2002;41(5):503-508.
78
(14) Childs JD, Whitman JM, Sizer PS, Pugia ML, Flynn TW, Delitto A. A description of
physical therapists' knowledge in managing musculoskeletal conditions. BMC Musculoskelet
Disord 2005;6:32.
(15) Moore JH, Goss DL, Baxter RE, DeBerardino TM, Mansfield LT, Fellows DW, et al.
Clinical diagnostic accuracy and magnetic resonance imaging of patients referred by physical
(16) Aiken AB, McColl M. Diagnostic and treatment concordance between a physiotherapist and
an orthopedic surgeon- A pilot study. J Interprofessional Care 2008;22(3):253-261.
(17) MacKay C, Davis AM, Mahomed N, Badley EM. Expanding roles in orthopaedic care: a
comparison of physiotherapists and orthopaedic surgeon recommendations for triage. J Eval Clin
Pract 2009;15:178-183.
(18) Oldmeadow LB, Bedi HS, Burch HT, Smith JS, Leahy ES, Goldwasser M. Experienced
physiotherapists as gatekeepers to hospital orthopaedic outpatient care. Med J Aust
2007;186(12):625-628.
(19) Hourigan PG, Weatherley CR. Initial assessment and follow-up by a physiotherapist of
patients with back pain referred to a spinal clinic. J R Soc Med 1994 Apr;87(4):213-214.
(20) Weatherley CR, Hourigan PG. Triage of back pain by physiotherapists in orthopaedic
clinics. J R Soc Med 1998 Jul;91(7):377-379.
(21) Greenhalgh S, Selfe J. Red Flags: A Guide to Identifying Serious Pathology of the Spine.
Toronto: Churchill Livingstone; 2006.
(22) Deyo RA, Haselkorn J, Hoffman R, Kent DL. Designing studies of diagnostic tests for low
back pain or radiculopathy. Spine 1994;19(18):2057S-2065S.
(23) Waddell G, Somerville D, Henderson I, Newton M. Objective clinical evaluation of
physical impairment in chronic low back pain. Spine 1992;17(6):617-628.
(24) Koes BW, van Tulder MW, Ostelo R, Kim Burton A, Waddell G. Clinical guidelines for the
management of low back pain in primary care: an international comparison. Spine
2001;26(22):2513-2514.
(25) Waddell G, van Tulder M. Clinical guidelines. The Back Pain Revolution. Second ed.
Toronto: Churchill Livingstone; 2004. p. 283-322.
79
(26) Clinical Standards Advisory Group. Report of a Clinical Standards Advisory Group on back
pain. 1994.
(27) Bigos S. Acute low back pain in adults: Clinical practice guideline. 1994. Report No.: 95-
0643.
(28) Meadows JTS. Orthopedic Differential Diagnosis in Physical Therapy: A Case Study
Approach. New York, US: McGraw-Hill; 1999.
(29) Bath B, Bourassa R, Dueck R. Advanced practice physiotherapy triage assessment of spinal
conditions: a collaborative partnership with orthopaedic surgeons. Physio9 Abstracts: A
Supplement to Phys Can; 2009.p.22-3.
(30) Sim J, Wright CC. The kappa statistic in reliability studies: use, interpretation and sample
size requirements. Phys Ther 2005;85(3):257-268.
(31) Bertilson BC, Bring J, Sjöblom A, Sundell K, Strender LE. Inter-examiner reliability in the
assessment of low back pain using the Kirkaldy-Willis classification
. Eur Spine J 2006;15(11):1695-1703.
(32) Strender LE, Sjoblom S, Sundell K, Ludwig R, Taube A. Interexaminer reliability in
physical examination of patients with low back pain. Spine 1997;22:814-820.
(33) American College of Sports Medicine. ACSM’s Guidelines for Exercise Testing and
Prescription. 5th Edition ed. Baltimore, USA: Williams & Wilkins; 1995.
(34) Petersen T, Olsen S, Laslett M, Thorsen H, Manniche C, Ekdahl C, et al. Inter-tester
reliability of a new diagnostic classification system for patients with non-specific low back pain.
Aust J Physiother 2004;50(2):85-94.
(35) Dankaerts W, O'Sullivan PB, Straker LM, Burnett AF, Skouen JS. The inter-examiner
reliability of a classification method for non-specific chronic low back pain patients with motor
control impairment. Man Ther 2006;11(1):28-39.
(36) Flynn T, Fritz J, Whitman J, Wainner R, Magel J, Rendeiro D, et al. A clinical prediction
rule for classifying patients with low back pain who demonstrate short-term improvement with
spinal manipulation. Spine 2002 Dec 15;27(24):2835-2843.
(37) Fritz JM, Brennan GP, Clifford SN, Hunter SJ, Thackeray A. An examination of the
reliability of a classification algorithm for subgrouping patients with low back pain. Spine
2006;31(1):77-82.
80
(38) Petersen T, Laslett M, Thorsen H, Manniche C, Ekdahl C, Jacobsen S. Diagnostic
classification of non-specific low back pain. A new system integrating patho-anatomic and
clinical categories. Phys Ther Res Prac 2003;19(4):213-237.
(39) Rucker K, Cole A, Weinstein S. Low Back Pain: A Symptom-based Approach to Diagnosis
and Treatment. Boston: Butterworth-Heinemann; c2001.
(40) Wilson L, Hall H, McIntosh G, Melles T. Intertester reliability of a low back pain
classification system. Spine 1999;24(3):248-254.
(41) Hancock MJ, Maher CG, Latimer J, Spindler MF, McAuley JH, Laslett M, et al. Systematic
review of tests to identify the disc, SIJ or facet joint as the source of low back pain. Eur Spine J
2007 Oct;16(10):1539-1550.
(42) Newton W, Curtis P, Witt P, Hobler K. Prevalence of subtypes of low back pain in a defined
population. J Fam Pract 1997 Oct;45(4):331-335.
(43) Van Dillen LR, Sahrmann SA, Norton BJ, Caldwell CA, Fleming DA, McDonnell MK, et
al. Reliability of physical examination items used for classification of patients with low back
pain. Phys Ther 1998;78(9):979-988.
(44) Carr J, Armstrong S, Hancock B, Bethea J. GP's perceptions of the nurse practitioner role in
primary care. Br J Community Nurs 2002;7:408-413.
(45) Hooker RS, Cipher DJ, Sekscenski E. Patient satisfaction with physician assistant, nurse
practitioner, and physician care:A national survey of Medicare beneficiaries. J Clin Outcomes
Manage 2005;12:88-92.
(46) Sanmartin C, Murphy K, Choptain N, Conner-Spady B, McLaren L, Bohm E, et al.
Appropriateness of healthcare interventions: Concepts and scoping of the published literature. Int
J Technol Assess Health Care 2008;24(3):342-349.
(47) Edwards I, Jones MA, Carr J, Braunack-Meyer A, Jensen G. Clinical reasoning strategies in
physical therapy. Phys Ther 2004;84(4):312-330.
(48) Edwards I, Jones M, Higgs J, Trede F, Jensen G. What is collaborative reasoning? Adv
Physiother 2004;6:70-83.
(49) Dunn KM, Jordan KP, Croft PR.Contribution of prognostic factors for poor outcome in
primary care low back pain patients. Eur J Pain 2011;15:313-319.
(50) Hall H, McIntosh G, Boyle C. Effectiveness of a low back classification system. Spine J
2009;9:648-657.
81
(51) McCarthy CJ, Gittins M, Roberts C, Oldham JA. The reliability of the clinical tests and
questions recommended in international guidelines for low back pain. Spine 2007;32:921-926.
(52) Fritz JM, Wainner RS. Examining diagnostic tests: an evidence-based perspective. Phys
Ther 2001;81(9):1546-1564.
82
Chapter Four
A Physiotherapy Triage Assessment Service for People with Low
Back-Related Complaints:
Evaluation of Short Term Outcomes
83
Title: A Physiotherapy Triage Assessment Service for People with Low Back-Related
Complaints: Evaluation of Short Term Outcomes (Paper 2)
Abstract
Objectives: To determine the short term impacts of a physiotherapy triage assessment for people
with low back-related disorders on self-reported pain, function and general well-being/ quality of
life.
Methods: Participants with low back–related complaints were recruited from people referred to
a spinal triage assessment program delivered by physiotherapists. Before undergoing the triage
assessment, participants completed a battery of questionnaires covering a range of
sociodemographic, clinical, and psychosocial features. Self-reported outcome measures of pain
(Numeric Pain Rating Scale (NPRS)), function (Oswestry Disability Index), and quality of life
(Medical Outcomes Survey 36-item short-form survey version 2 (SF36 v2) were completed at
approximately 4 weeks after the assessment. Baseline measures and variables were analyzed
with descriptive analysis (i.e. proportions, means, medians). Overall group differences between
pretest and posttest outcome measures were analyzed with paired samples T-tests or Wilcoxon
matched pair signed rank tests where appropriate. A Bonferonni correction was applied to alpha
to protect against making a type 1 error.
Results: A total of 108/115 (93.9%) participants completed the posttest survey. The Physical
Component Summary of the SF36 v2 was the only measure that demonstrated significant
improvement (p<.001). Without the adjustment to alpha there was significant improvement
(p=.007) of the bodily pain scale of the SF-36v2 (SF_36_BP) and NPRS scores (p=.020).
Conclusions: A spinal triage assessment program delivered by physiotherapists can be viewed as
a complex intervention that may have the potential to impact a wide range of patient-related
outcomes. Further study is needed to examine longer-term outcomes and explore potential
mechanisms of improvements using a biopsychosocial framework.
84
4.1 Introduction
Low back pain (LBP) and low back-related disorders are significant population health
problems (1-3) which consume a large amount of health care resources. (4-6) People with a
variety of low back-related complaints comprise a large proportion of referrals made to
orthopaedic surgeons. (7,8) Many of these patients are not considered to be surgical candidates
(9,10) and may simply require reassurance that they do not have serious spine
pathology.(11,12)This patient subgroup can contribute significantly to wait times for consulting
with a surgeon and ultimately lead to greater wait times for other required orthopaedic surgical
procedures such as hip and knee joint replacements. Reducing the number of non-surgical
consultations in a surgeon’s caseload may help reduce wait times for surgical consultation for
patients who may benefit from spinal surgery and potentially redirect nonsurgical candidates for
more appropriate treatment earlier. Primary health care providers that have expertise in
assessment and evaluation of musculoskeletal disorders working collaboratively with
orthopaedic surgeons is an alternative approach to this problem.
Models of care provision that involve non-surgical specialists or other healthcare
professionals collaborating with surgeons to provide care to people with musculoskeletal
problems are being increasingly reported in the literature. (13-16) Physiotherapists with
advanced orthopaedic training, often practicing with a maximized or extended scope, have been
shown to be equally as effective as orthopaedic surgeons for the diagnosis and non-surgical
management of many musculoskeletal conditions. (13,17-21) Physiotherapists performing this
role have also contributed to reduced wait times and improved referral practices (13,22) with
data from the UK indicating that pre-screening of patients by such therapists can more than
double the proportion of patients who truly need surgery on assessment by the surgeon.(23)
This type of role can be referred to as triage, (24) whereby patients are first screened by a
physiotherapist to determine if referral to a surgeon, recommendation of further conservative
management and/or diagnostic investigations are appropriate. However, the evaluative research
examining these types of programs is sparse. The few programs studied focus on general
musculoskeletal practices (13,25,26) or hip and knee joint arthritis screening and management
only. (15,27,28) Few triage services that are delivered by physiotherapists focused solely on
spinal conditions are described or evaluated in the literature. (22,29) Furthermore, a systematic
85
review examining the evidence of extended roles for a variety of allied health professionals
concluded that one of the notable omissions in much of the research was a focus on health
outcomes in patients. (30) Despite research that has demonstrated the effectiveness of
physiotherapists with advanced orthopaedic training in similar roles, (13,22,27) little is known
about the impact that a spine triage program delivered by physiotherapists may have on
multidimensional outcomes.
A triage assessment program delivered by physiotherapists can be viewed as a complex
intervention (31) that may have the potential to impact a wide range of patient-centred outcomes.
(32) This type of program is an example of a change in service delivery and organization that
goes beyond a simple intervention as it includes several components that may impact outcomes.
As such, a phased approach to evaluation of complex interventions is recommended. (31)
The purpose of the present study was to determine the short-term (i.e. 4 week) impacts of
a physiotherapy triage assessment for people with low back-related disorders on self-reported
pain, perceived functional status as well as physical and psychological general well-being/
quality of life. The rationale for the posttest 1 time frame was to allow enough time for the
assessment report and recommendations to be sent to the primary care provider and short enough
that any treatment recommendations would likely not yet have been carried out, thus giving an
indication of whether changes in outcomes could be attributable to the assessment process itself.
4.2 Background
4.2.1 Description of the Spine Triage Service
The Wall Street Spinal Assessment Service (WSSAS) is a collaborative effort between a
group of three orthopaedic surgeons and PTs from a private rehabilitation clinic. The program
was initiated to address an excessive number of referrals to the orthopaedic surgeons of patients
with low back-related conditions, the majority of whom did not require surgery. Prior to
initiation of the program, the surgeons expressed frustration regarding how long people waited to
see them (often over a year) and the high proportion of non-surgical referrals in their caseloads.
The surgeon group had an existing extensive working relationship with physiotherapists from the
rehabilitation clinic and, thus approached the clinic to request help with their wait list back-log
and screening of subsequent new referrals pertaining to spine (mainly low back-related)
86
conditions. At present, any people referred to the orthopaedic surgeons for spine problems are
automatically re-routed to the PTs for screening. (Figure 4.1 shows the WSSAS referral and
clinical pathways.)
Figure 4.1: WSSAS Referral, Assessment and Clinical Pathways
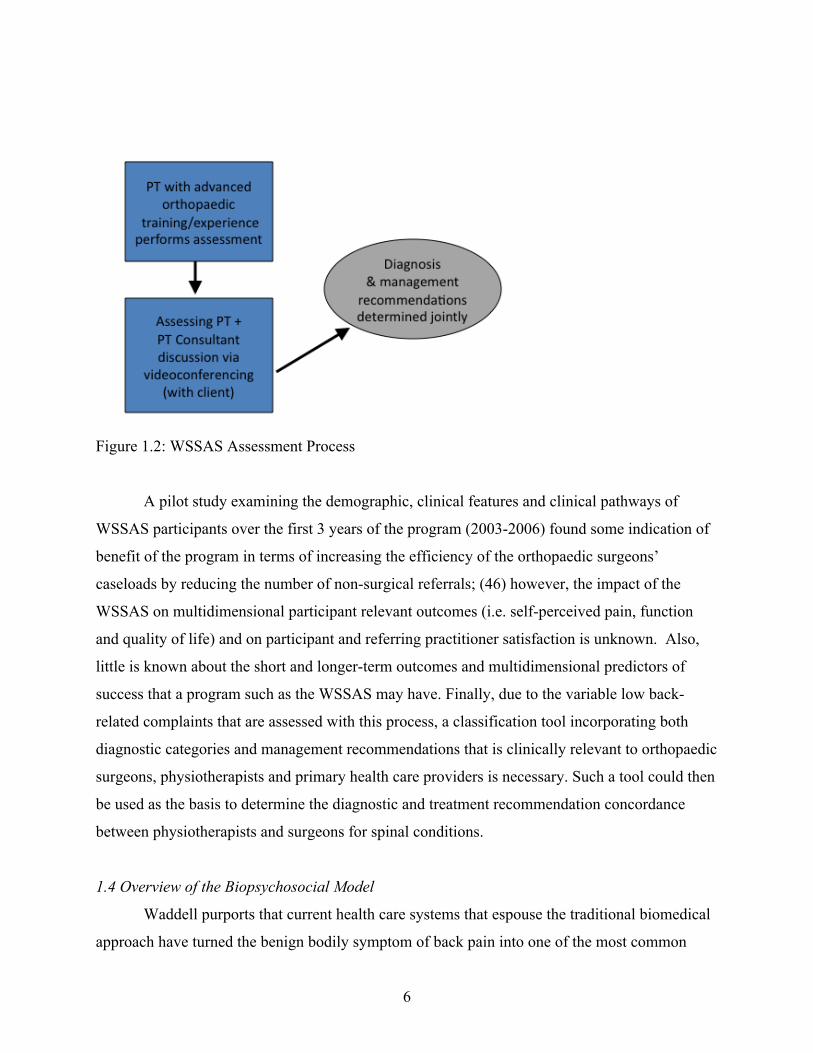
The assessing physiotherapist discusses the findings of each assessment with the
physiotherapy consultant via videoconferencing with the client present (Figure 4.2). The clinical
diagnosis and recommendations are determined jointly between the assessing physiotherapist and
consultant physiotherapist through a collaborative reasoning1 approach (33) with input from the
client. A detailed report outlining the assessment findings, diagnosis, management
recommendations and any recommended further diagnostic tests is then sent to the referring
health care providers and other primary care providers involved. All physiotherapists involved in
the WSSAS have completed advanced orthopaedic training in the Canadian Orthopaedic
1 Collaborative reasoning is the nurturing of a consensual approach towards the interpretation of examination findings.
87
Syllabus with experience ranging from (5 to 30 years). The consultant PT had an extensive prior
working relationship with the orthopaedic surgeon group.
Figure 4.2: WSSAS Assessment Process
4.3 Methods and Measures
4.3.1 Study Design
This study used a quasi-experimental, one group pretest-posttest design. (34) This design
represented the best option to evaluate this program given that there was no accessible and
equivalent control group that could be used as a comparison. The “pretest” measures were
derived from a paper-based survey that was completed before the participants underwent the
triage assessment and also from a clinical classification tool completed by the assessing
physiotherapist (details in “Measures” section below). The posttest evaluation of outcomes was
done at approximately 4 weeks following the assessment through either mail or a password
protected online survey (as per the choice of the participant). Reminders for completion of the
participant follow up surveys was done by phone or email prompts (up to three reminders
approximately one week apart) on the basis of the tailored design method proposed by Dillman
and colleagues. (35)
88
4.3.2 Participants
The participants of the study were recruited over an 8 month period from patients referred
to the triage program either directly from their primary care provider or via one of the
participating orthopaedic surgeons. The inclusion criteria were: patients referred to the triage
program with primarily low back related complaints, age ≥ 18 years and ≤ 80 years and
provision of informed consent. The exclusion criteria included: patients receiving third party
payer funding (i.e. Worker’s Compensation Board (WCB), or other) for their back related
complaints, patients with primarily neck (cervical spine) or mid back (thoracic spine) complaints
and people with language, reading or comprehension barriers that would limit adequate
completion of the study paperwork. Patients were also excluded due to other reasons such as
scheduling conflicts or other medical issues.
Patients were initially screened for inclusion and exclusion criteria as well as for their
potential willingness to participate in the study on the phone by a receptionist after their spinal
triage assessment was booked. Potentially eligible patients were sent a letter by the receptionist
from the researchers outlining the study and were asked to arrive an hour early for their
assessment to meet with one of the researchers. Potential participants were provided with a $10
gift card from either Tim Horton’s or Subway upon arrival at their booked appointment. The gift
card was given to all potential participants regardless of whether they met the inclusion criteria
or chose to participate. Further screening for eligibility was done by the primary investigator
prior to participants completing an informed consent process. Select demographic and clinical
characteristics of non-participants were collected by a PT not directly involved with the research
and provided in a de-identified manner to the researchers.
4.3.3 Measures
Before undergoing the triage assessment, participants completed a battery of
questionnaires covering a range of variables including: socio-demographics, clinical features,
fear avoidance beliefs, depression and somatization. A detailed description of these intake
variables can be found elsewhere (Chapter 6). A clinical classification tool that categorized
“diagnosis” and management recommendations for each participant was completed by the
assessing PT (a detailed description of the tool can be found in Appendix B). A description of the
89
outcome measures (completed at intake/ pretest and the 4 week/ posttest time point) can be found
below.
4.3.3.1 Self Perceived Pain
The 11-point Numeric Pain Rating Scale (NPRS) ranges from 0 (‘‘no pain’’) to 10
(‘‘worst pain imaginable’’) and was used to indicate the intensity of current pain and at its best
and worst level over the last 24 hours. (36)These 3 ratings were averaged to arrive at an overall
pain score. The scale has been shown to have adequate reliability, validity, and responsiveness in
patients with LBP when the 3 scores are averaged to produce one score. (37)
4.3.3.2 Self Perceived Function
Self-perceived function was assessed with the modified Oswestry Disability Index (ODI),
which is a condition-specific self-report questionnaire.(38,39)Items on the ODI focus on how
much low back pain is limiting activities of daily living, like sitting, standing, walking, and
lifting. The ODI used in this study was modified from the original by substituting a section
regarding employment/ home-making ability for the section related to sex lifeas the sex life
question is commonly left unanswered by respondents. The modified version of the ODI has
been found to have high levels of reliability (ICC = 0.90) and responsiveness in patients with low
back pain. (39,40) The ODI is proposed to be most useful in specialty care settings or in
situations in which the disability level is likely to remain relatively high throughout a trial. (41)
Higher scores on the ODQ represent higher levels of perceived disability. Fairbank et al .(38,39)
suggest that the continuous scores can be categorized 5 categories of perceived disability (i.e.
“minimal”, “moderate”, “severe”, “crippled” and “bed bound”/ “exaggerating”). As there were
no participants with ODI scores in the highest disability category in this study, the last category
was eliminated in our analysis.
4.3.3.3 Quality of Life/ General Health Status
The Medical Outcomes Survey 36-item short-form survey version 2 (SF-36v2)2 (42) was
used to assess general health status. The measure is comprised of eight interrelated health
dimensions (physical functioning, role-limitations resulting from physical health problems,
2 Non-commercial license agreement with Quality Metric Incorporated for use of SF-36v2. License Number: CT113220 / OP001547
90
bodily pain, general health, vitality (energy/fatigue), social functioning, role- limitations
resulting from emotional problems, and mental health (psychological distress /psychological
well-being)). (42,43) Two component summaries (i.e. physical and mental) can be derived from
the eight subscales. (42)The SF-36 has been shown to be a valid and reliable measure for both
clinical and general populations. (44-46) and is a recommended measure for people with back
pain. (47) The SF-36v2 has been shown to have improved reliability over the previous SF-36
version as well as improved floor and ceiling effects in certain domains. (42,48) Scoring of the
SF-36v2 was done by transformation of raw scores into norm-based scores for each of the
subscales and weighting of each subscale to produce physical and mental component summaries
(ie PCS and MCS). (42) Higher scores represent greater health status or quality of life.
4.3.4 Analysis
Descriptive analysis of all baseline measures and variables included frequencies and valid
percent for categorical variables and mean, standard error, median and interquartile ranges for
continuous variables. The Shapiro-Wilk Test was used to numerically assess the normality of the
distribution of each continuous variable. Variables that adhered to a normal distribution were
evaluated with parametric tests (e.g. T-tests) variables that were significantly different (i.e. p>.05
) from a normal distribution were evaluated with non-parametric test equivalents (e.g. Mann-
Whitney U). All tests of significance were 2-tailed and alpha was set at p=.05 (unless otherwise
stated).
Differences in select demographic and clinical variables between participants and non-
participants (i.e. those that were eligible to participate but chose not to) as well as between
responders and non-responders at the posttest time point were evaluated with Chi Square or
Fisher’s exact test for categorical variables and independent samples T-test or Mann-Whitney U
test for continuous variables.
Overall group (mean or median) differences between the baseline and posttest outcome
measures were evaluated with paired samples T-tests (for variables that were normally
distributed at each time point) or Wilcoxon matched pair signed ranks tests (for variables that
were non-normally distributed at each time point). A Bonferonni correction (i.e. .05/number of
comparisons) was applied to alpha to protect against making a type 1 (i.e. false positive) error
due to multiple comparisons. Comparisons were made between the prettest and posttest scores of
91
the NPRS, the ODI, and the eight subscales of the SF-36v2 (i.e. physical function, role physical,
bodily pain, general health, vitality, social function, role emotional, mental health) as well as the
physical and mental component summary (PCS, MCS) scores of the SF-36v2. Thus the new
alpha level was set at .05/12=.004. All statistical analysis was done using PASW (Predictive
Analytics SoftWare) Statistics Mac version 18.0.This study was approved on July 30th, 2009 by
the Behavioural Ethics Board of the University of Saskatchewan. (Appendix A)
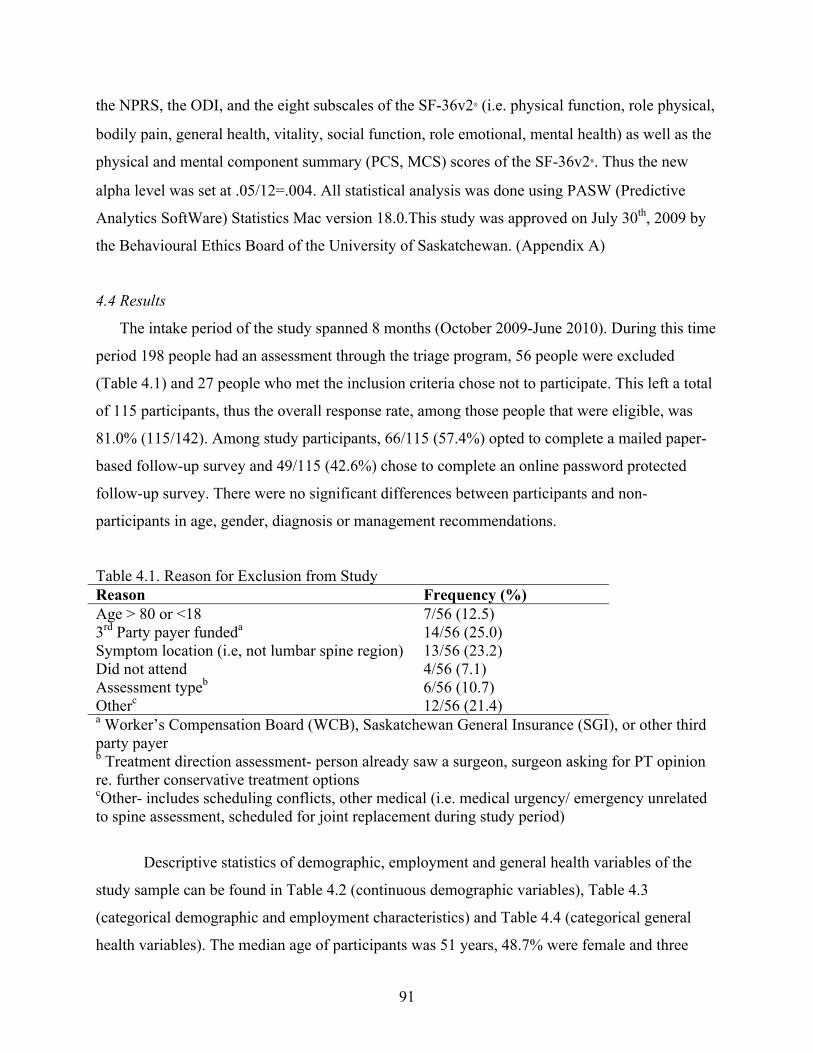
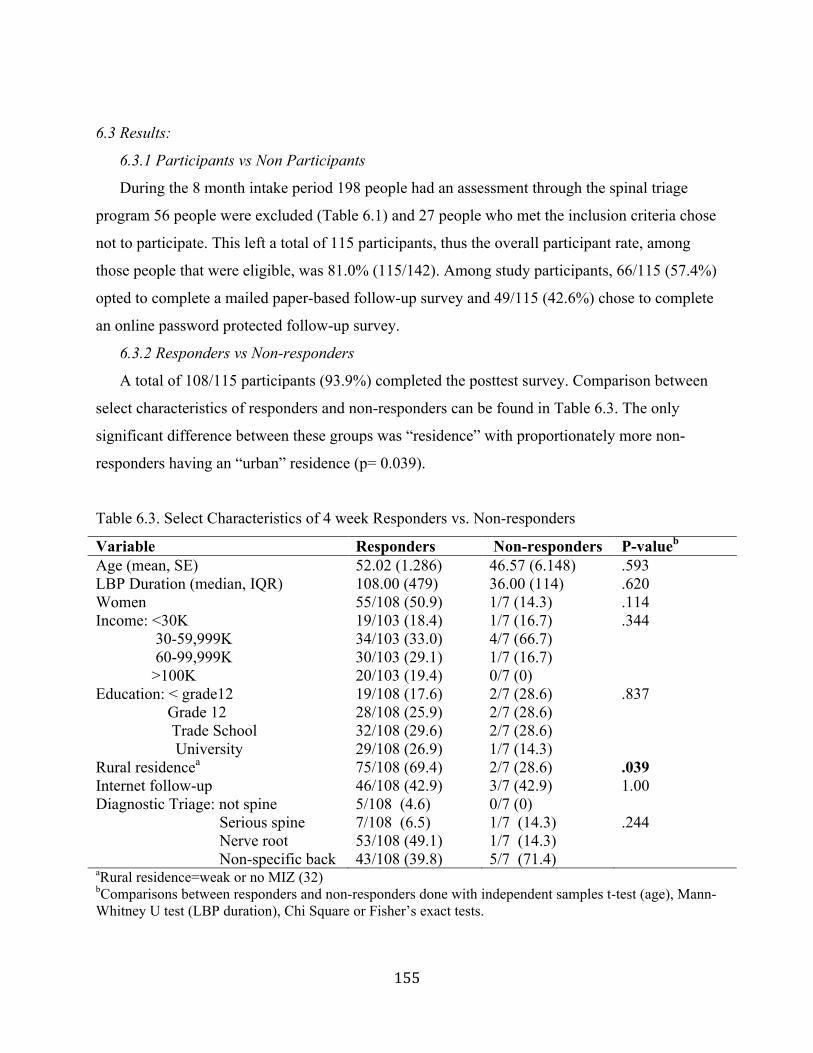
4.4 Results
The intake period of the study spanned 8 months (October 2009-June 2010). During this time
period 198 people had an assessment through the triage program, 56 people were excluded
(Table 4.1) and 27 people who met the inclusion criteria chose not to participate. This left a total
of 115 participants, thus the overall response rate, among those people that were eligible, was
81.0% (115/142). Among study participants, 66/115 (57.4%) opted to complete a mailed paper-
based follow-up survey and 49/115 (42.6%) chose to complete an online password protected
follow-up survey. There were no significant differences between participants and non-
participants in age, gender, diagnosis or management recommendations.
Table 4.1. Reason for Exclusion from Study Reason Frequency (%) Age > 80 or <18 7/56 (12.5) 3rd Party payer fundeda 14/56 (25.0) Symptom location (i.e, not lumbar spine region) 13/56 (23.2) Did not attend 4/56 (7.1) Assessment typeb 6/56 (10.7) Otherc 12/56 (21.4) a Worker’s Compensation Board (WCB), Saskatchewan General Insurance (SGI), or other third party payer b Treatment direction assessment- person already saw a surgeon, surgeon asking for PT opinion re. further conservative treatment options cOther- includes scheduling conflicts, other medical (i.e. medical urgency/ emergency unrelated to spine assessment, scheduled for joint replacement during study period)
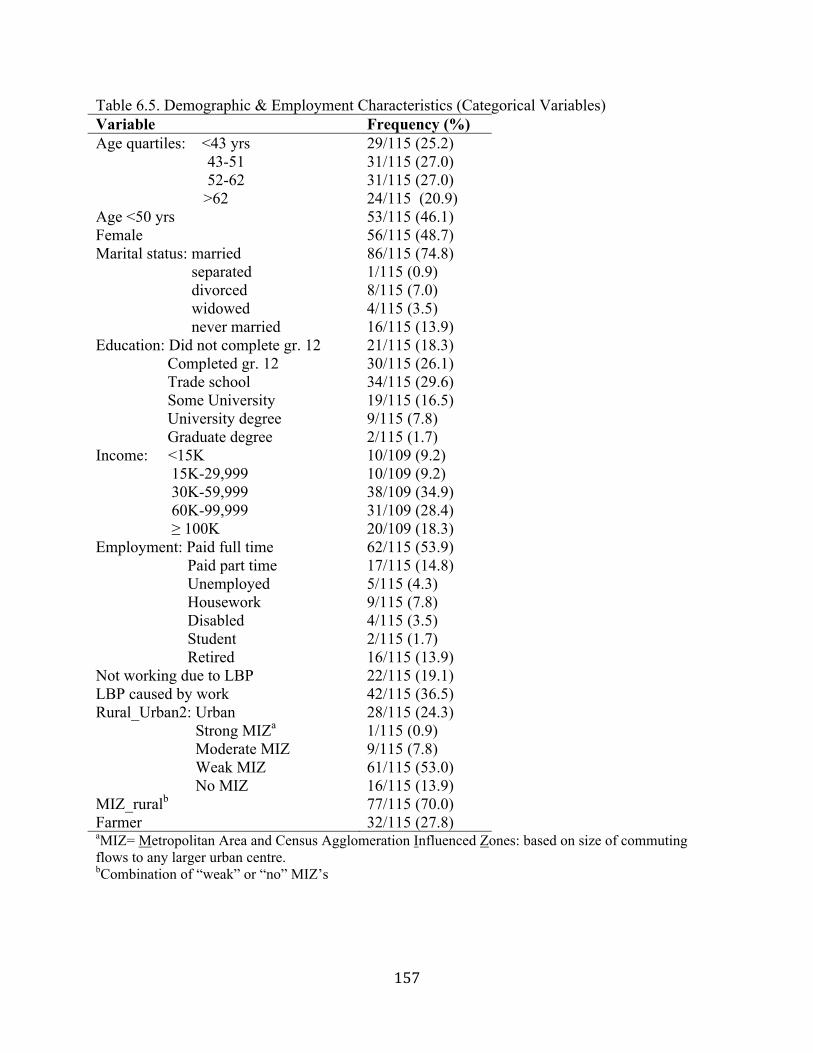
Descriptive statistics of demographic, employment and general health variables of the
study sample can be found in Table 4.2 (continuous demographic variables), Table 4.3
(categorical demographic and employment characteristics) and Table 4.4 (categorical general
health variables). The median age of participants was 51 years, 48.7% were female and three
92
quarters of participants were married (74.8%). The majority of participants (55.6%) had an
educational attainment of more than grade 12, an annual household income of greater than 30K
(Canadian dollars) (81.6%), had full or part time employment (68.7%) and had a “rural”
residence (70%). Also, a sizeable proportion of the participants were farmers (27.8%). The
majority (73.9%) of the sample had body mass index scores of greater than a “normal” range,
(49), 61.2% used to smoke or were current smokers and 58.2% had two or more other chronic
health conditions with “other bone or joint problems” being the most prevalent condition
reported (62.6%). Approximately half (50.8%) of participants were in the “at risk” category
using the Distress and Risk Assessment Method (DRAM)(50) indicating psychological risk of
depression and/or somatization with 17.4% scoring as being “distressed” due to either somatic or
depressive symptoms. Most participants (79.2%) had “moderate” to “ severe” perceived
disability according to the categorized ODI scores.
Table 4.2. Demographics of Study Sample (Continuous Variables) Variable Min Max Mean S.E. Median IQR Age (yrs) 20 79 51.69 1.263 51.00 43.0-62.0 LBP Total Duration (months) 1 480 138.94 12.061 108.00 28.5-240 Current Episode Duration (months) 1 408 39.54 6.796 10.00 4.0-36.0 Body Mass Index (kg/m2) 18.75 58.39 28.84 .626 27.32 24.4-31.6
93
Table 4.3. Demographic & Employment Characteristics (Categorical Variables) Variable Frequency (%) Age quartiles: <43 yrs 29/115 (25.2) 43-51 31/115 (27.0) 52-62 31/115 (27.0) >62 24/115 (20.9) Age <50 yrs 53/115 (46.1) Female 56/115 (48.7) Marital status: married 86/115 (74.8) separated 1/115 (0.9) divorced 8/115 (7.0) widowed 4/115 (3.5) never married 16/115 (13.9) Education: Did not complete gr. 12 21/115 (18.3) Completed gr. 12 30/115 (26.1) Trade school 34/115 (29.6) Some University 19/115 (16.5) University degree 9/115 (7.8) Graduate degree 2/115 (1.7) Income: <15K 10/109 (9.2) 15K-29,999 10/109 (9.2) 30K-59,999 38/109 (34.9) 60K-99,999 31/109 (28.4) ≥ 100K 20/109 (18.3) Employment: Paid full time 62/115 (53.9) Paid part time 17/115 (14.8) Unemployed 5/115 (4.3) Housework 9/115 (7.8) Disabled 4/115 (3.5) Student 2/115 (1.7) Retired 16/115 (13.9) Not working due to LBP 22/115 (19.1) LBP caused by work 42/115 (36.5) Rural_Urban2: Urban 28/115 (24.3) Strong MIZa 1/115 (0.9) Moderate MIZ 9/115 (7.8) Weak MIZ 61/115 (53.0) No MIZ 16/115 (13.9) MIZ_ruralb 77/115 (70.0) Farmer 32/115 (27.8) aMIZ= Metropolitan Area and Census Agglomeration Influenced Zones (based on size of commuting flows to any larger urban centre) bcombination of “weak” or “no” MIZ’s
94
Table 4.4 General Health & Other Variables Variable Frequency (%) Smoking status: Never smoked 44/115 (38.3) Used to smoke 45/115 (39.1) Current smoker 26/115 (22.6) BMIa: Normal 30/115 (26.1) Overweight 44/115 (38.3) Grade 1 Obesity 26/115 (22.6) Grade 2 Obesity 8/115 (7.0) Grade 3 Obesity 7/115 (6.1) Other Health: Other bone or joint problems 72/115 (62.6) Headaches 42/115 (36.5) Stomach or digestive problems 29/115 (25.2) Lung or breathing problems 16/115 (13.9) Hypertension 14/115 (12.2) Heart problems 12/115 (10.4) Diabetes 9/115 (7.8) Other 18/115 (15.7) Number of Other Health Problems: 0 12/115 (10.4) 1 36/115 (31.3) 2 42/115 (36.5) 3 or more 25/115 (21.7) DRAM: Normal 37/115 (32.2) At risk 58/115 (50.4) Distressed, somatic 8/115 (7.0) Distressed, depressive 12/115 (10.4) ODI: Minimal (0-20) 16/115 (13.9) Moderate (21-40) 60/115 (52.2) Severe (41-60) 31/115 (27.0) Extreme Disability b(61-80) 8/115 (7.0) aBMI= Body Mass Index (kg/m2): Normal 18.5-24.9, Overweight 25-29.9, Grade 1 Obesity 30-34.9, Grade 2 Obesity 35-39.9, Grade 3 Obesity≥ 40. (49) b There were no participants in the 80-100 category.
Clinical descriptors of the study sample can be found in Table 4.5. Most participants
reported having relatively long total duration of symptoms (74.8% > 24 months) and current
episode duration. The majority of participants had attempted a variety of non-invasive or
conservative treatment modalities in the past including medication, massage therapy, chiropractic
and physiotherapy with relatively few (3.5%) reporting having past surgical intervention for their
back problems. The majority of participants also reported having below knee symptoms (59.1%)
indicating potential nerve root involvement. A summary of the categorization of clinical
features with a clinical classification tool (Appendix B) completed by the assessing PT can also
be found in Table 4.5.
95
Table 4.5. Clinical Descriptors of Study Sample Variable Frequency (%) LBP Duration_cat: 0-6 months 15/114 (13.2) 7-12 months 5/114 (4.4) 13-24 months 8/114 (7.0) >24 months 86/114 (74.8) LBP Current Episode_cat: 0-6 months 46/115 (40.0) 7-12 months 19/115 (16.5) 13-24 months 18/115 (15.7) >24 months 32/115 (27.8) Past Treatment for LBP: Medication 75/115 (65.2) Massage Therapy 72/115 (62.6) Chiropractic 69/115 (60.0) Physiotherapy 63/115 (54.8) Exercise Therapy 39/115 (33.9) Acupuncture 30/115 (26.1) Surgery 4/115 (3.5) Radiating leg symptoms: Absent 16/115 (13.9) Above knee 31/115 (27.0) Below knee 68/115 (59.1) Diagnosisa: Problem in back 108/115 (93.9) Medical 11/115 (9.6) Mechanical/degenerative other body part 5/115 (4.3) Spinal cord/ cauda equina 5/115 (4.3) LBP Triage: Nerve root problem 54/115 (47.0) Non-specific/mechanical spine 48/115 (41.7) Serious spine pathology 8/115 (7.0) Not spine related 5/115 (4.3) Nerve Root Source: None 52/115 (45.2) Stenotic 35/115 (30.4) Discogenic 28/115 (24.3) Treatment Recommendations: Referral to Surgeon (any) 23/115 (20.0) Urgent referral to surgeon 16/115 (13.9) Surgeon referral + PT treatment 6/115 (5.2) Emergency referral to surgeon 1/115 (.9) Referral to another specialistb 11/115 (9.6) PT Treatment (any) 73/115 (63.5) PT Treatment (only) 67/115 (58.3) Imaging and diagnostic testsa: Any Imaging or other diagnostic testsc 38/115 (33.0) Advanced Imaging (i.e. CT, MRI) 31/115 (27.0) Xrays 8/115 (7.0) No further follow up 2/115 (1.7) Otherd 7/115 (6.1)
aCategories are not mutually exclusive. bType of specialist: vascular, neurologist, pain management physician, urogynecologist, rheumatologist c Includes Xray, CT, MRI, blood work, bone scan dIncludes functional testing, chiropractic treatment.
96
The majority of participants were classified as having a “problem in back” (93.9%);
however, there were relatively high proportion of participants classified as having “medical”
(9.6%) and “spinal cord/ cauda equina” (4.3%) presentations. Similarly, categorization according
to the LBP triage categories demonstrated relatively high proportions of “nerve root problems”
(47.0%) and “serious spine pathology” (7.0%). Further PT treatment was recommended in the
majority of cases (63.5%) and “referral to the surgeon” was made in 20% of cases.
A total of 108/115 participants (93.9%) completed the posttest survey. Comparison
between select characteristics of responders and non-responders can be found in Table 4.6. The
only significant difference between these groups was “residence” with proportionately more non-
responders having an “urban” residence (p=.039).
Table 4.6. Select Characteristics of 4 week Responders vs. Non-responders Variable Responders Non-responders Significanceb Age (mean, SE) 52.02 (1.286) 46.57 (6.148) .593 LBP Duration (median, IQR) 108.00 (479) 36.00 (114) .620 Women 55/108 (50.9) 1/7 (14.3) .114 Income: <30K 19/103 (18.4) 1/7 (16.7) .344 30-59,999K 34/103 (33.0) 4/7 (66.7) 60-99,999K 30/103 (29.1) 1/7 (16.7) >100K 20/103 (19.4) 0/7 (0) Education: < grade12 19/108 (17.6) 2/7 (28.6) .837 Grade 12 28/108 (25.9) 2/7 (28.6) Trade School 32/108 (29.6) 2/7 (28.6) University 29/108 (26.9) 1/7 (14.3) Rural residencea 75/108 (69.4) 2/7 (28.6) .039 Internet follow-up 46/108 (42.9) 3/7 (42.9) 1.00 Diagnostic Triage: not spine 5/108 (4.6) 0/7 (0) Serious spine 7/108 (6.5) 1/7 (14.3) .244 Nerve root 53/108 (49.1) 1/7 (14.3) Non-specific back 43/108 (39.8) 5/7 (71.4) aRural residence=weak or no MIZ bComparisons between responders and non-responders done with independent samples t-test (age), Mann-Whitney U test (LBP duration), Chi Square or Fisher’s exact tests.
An overall group mean or median comparison between prettest and posttest outcome
measures is presented in Table 4.7. With the alpha level adjusted by a Bonferonni correction (i.e.
.05/12= .004), the only measure that demonstrated overall significant improvement was the PCS
of the SF-36v2 (p<.001). However, without the adjustment to alpha, there was also significant
97
improvement (p= 0.007) of the bodily pain scale of the SF-36v2 (SF_36_BP) and NPRS scores
(p= 0.020).
Table 4.7. Comparison of Mean Pretest and Posttest Outcome Measures Variable Pretesta Posttest
Significanceb
NPRS 4.94 (.175) 4.61 (.188) .020 ODI 35.15 (1.435) 33.07 (1.503) .075 SF_36_PF 35.99 (27.57, 42.30) 35.99 (31.78, 44.41) .056 SF_36_RP 37.26 (27.47, 44.61) 37.26 (27.47, 44.61) .163 SF_36_BP 33.37 (29.15, 37.18) 37.18 (29.15, 41.83) .008 SF_36_GH 45.78 (42.45, 48.17) 45.78 (38.63, 52.93) .522 SF_36_VT 42.72 (36.48, 52.09) 42.72 (33.36, 48.97) .262 SF_36_SF 40.49 (35.03,45.94) 40.49 (29.58, 51.40) .639 SF_36_RE 44.22 (32.56, 55.88) 44.22 (32.56, 51.99) .333 SF_36_MH 47.19 (38.74, 52.82) 47.19 (38.74, 52.82) .202 SF_36_PCS 35.09 (.842) 37.33 (.821) .000 SF_36_MCS 47.79 (40.53, 55.87) 48.26 (37.40, 55.60) .059 a mean (SE) reported for normally distributed variables, median (IQR) reported for non-normally distributed variables b A Bonferonni correction (i.e. .05/ number of comparisons) was applied to alpha to protect against a type 1 error due to multiple comparisons. Thus the new alpha level is: .05/ 12= .004.
4.5 Discussion
The objective of the study was to examine short-term (i.e. approximately 4 weeks)
changes in outcomes of self-reported pain, back specific function and general health (i.e.
physical and mental) in people who underwent a triage assessment service delivered by
physiotherapists with advanced orthopaedic training and experience. There were significant
group mean improvements in the Physical Component Scale of the SF-36v2 (p<.001) and
borderline improvements in the bodily pain scale of the SF-36v2 and Numeric Pain Rating Scale
scores (p=.020) at the posttest time point.
Outcome assessment of back pain is complex and should be multidimensional. (41)
International groups of back pain researchers (41,47) recommend that the following domains be
considered in a standard battery of outcome measures: back specific function, general well-
being/ generic health status, pain, satisfaction with care and work disability (if appropriate). The
types and domains of outcome measures used in this study align with the recommendations of
these expert groups with the exception of satisfaction and work disability. Participant and
98
referring health care provider satisfaction were ascertained at the 4-week posttest time point
through both quantitative and qualitative means, however the results are beyond the scope of this
paper and can be found elsewhere (Chapter 5). Work disability status as an outcome measure
was not included in this study for a variety of reasons. People receiving Workers Compensation
benefits in Saskatchewan can access a separate multidisciplinary team assessment process that
includes triage to surgeons if required. As such, the vast majority of users of the spinal triage
service are not receiving third party payer benefits, thus those people that were receiving such
benefits were excluded from this study. Furthermore, people with chronic back pain receiving
third party payer income replacement benefits may respond differently to interventions than
those that are not receiving benefits. (51,52)
The results of this study suggest that many of the participants may not be representative
of a typical person that presents with back-related complaints in a primary care setting. An
estimated 95 % of back pain cases presenting in primary care are thought to be attributable to
mechanical or non-specific back pain, less than 5% are though to be related to true nerve root
pain (arising from a disc prolapse, spinal stenosis or surgical scarring) and only an estimated 1%
of these patients are thought to have serious spinal pathology such as tumors, infections,
inflammatory conditions or other conditions requiring urgent specialist investigation and
treatment. (11,53) These proportions are in stark contrast to the diagnostic triage categorization
of the participants in this study (i.e. From Table 4.5: 42% mechanical spine, 47% nerve root and
7% serious spine pathology). Furthermore, the study participants primarily had chronic
longstanding symptoms (75% had > 24 month total symptom duration), complex clinical
presentations (i.e. high proportion of below knee symptom referral, high proportion of other
chronic conditions), high perceived disability, psychological risk factors (according to the
DRAM). Thus, the people using the service likely represent more complex spinal problems than
may be typically seen in a primary care setting. (54, 55)The study participants also reported low
overall general well being compared to both healthy normative populations and disease-specific
norms of people with back pain / sciatica. (42) For example, mean or median scores on the SF-36
v2 PCS and MCS from a population-based study in the United States of people with back pain/
sciatica were 45.70 (PCS mean) and 50.40 (MCS median) (42)which are much higher (i.e. better)
than the baseline participant scores of 35.09 (PCS mean) and 47.79 (MCS median) in this study.
99
By providing a detailed report and management plan that is sent to the referring care
provider, the spinal triage program provides a service to the patients and to the primary care
providers that refer them. The triage service is a model of care that operates at the interface
between primary and secondary care; therefore, the characteristics of patients referred to this
service and the patterns of referral sources potentially reflect unmet needs at the primary care
level. LBP is known to be a common reason for seeking care at the primary care level. A recent
study by Jordan et al. found that a quarter of all consultations in a UK physician-based primary
care setting were for musculoskeletal problems with the back (20%, low back 14%) being the
most common reason. (56) In Canada people with chronic back pain report significantly greater
use of family physician, physiotherapy and chiropractic services than those without back pain
(6,57) and those with co-morbidities such as arthritis or depression are most likely to consult
with family physicians and/or physiotherapists .(57) Further study is needed to more fully
understand the impact that a spinal triage program may have on meeting the needs and perhaps
easing the burden of primary care providers. Also, the impact of reduced access to local health
care services on participant outcomes is an important area for further research given the high
proportion of people referred from rural regions.
By assessing outcomes relatively soon after the triage assessment was performed (i.e. at 4
weeks), we hoped to gain insight into whether the assessment process itself impacted participant
outcomes. Despite the chronic and complex baseline characteristics of the sample, there was a
mean overall significant improvement in the SF-36 PCS (and borderline significant
improvements in the bodily pain subscale of the SF-36 and the NPRS). Participants likely did not
have time to fully embark on any treatment or management recommendations during the 4 weeks
after the assessment, thus any improvements in outcomes could be related to the assessment
itself as being a type of intervention. A spinal triage assessment program delivered by
physiotherapists can be viewed as a complex intervention that may have the potential to impact a
wide range of patient-related outcomes. (32) Complex interventions may contain a number of
different elements that act independently or interdependently, thus it is difficult to identify
precise mechanisms that contribute to outcomes. (31)
One potential mechanism of action is the education and reassurance that likely occurs as
part of the triage assessment process. Upwards of 50 % of back pain patients presenting to
primary care suspect that they have serious pathology. (11,58) People who experience pain,
100
particularly when the precise cause cannot be determined, often feel hopeless and helpless.
Additionally, the inability to obtain timely or effective relief for their pain may result further in
depression and anxiety. (59) This, in turn, can lead to increased perceived pain and disability.
(60) Feelings of uncertainty and insecurity regarding fear of the unknown (i.e. having a diagnosis
of “non-specific low back pain”, or having no clear diagnosis at all) also have the potential to
hamper any attempts at treatment and potential recovery.(53) Both the assessing and consulting
PT in the triage assessment play an important role in reassuring the patient about their symptoms
and how they may related to potential underlying conditions. Also, given that the main output of
the assessment is a detailed report that outlines a plan of action for subsequent management,
investigations and follow-up, this likely provides or enhances a greater sense of certainty and
control of users of the service. The role of reassurance in interactions between health care
providers and patients with chronic pain is a complex process that requires further study. (61)
Further research may help to elucidate the role of reassurance and education in the spinal triage
assessment process and other potential mechanisms for why improvements in outcomes
occurred.
The findings of this study should be interpreted in light of its many limitations. The main
limitations are related to design, response rate and analysis issues. The primary limitation is the
lack of a control or comparison group. The absence of a control group can result in many
potential forms of bias (ranging from history, maturation, testing or selection)(62) thus the
findings should be interpreted with caution. For example, even though there was overall mean
significant improvement in some outcome measures, attribution of improvements due to the
triage assessment itself cannot be made with any certainty. A further limitation relates to bias
that may be introduced due to loss to follow up of participants and non-response of referring care
providers. Despite having a relatively high response rate of participants on follow-up (93.9%),
the non-responders may have differed significantly than responders in ways that were not
measured. Finally, the application of a Bonferroni correction to the alpha level in order to protect
against the chance of making a type 1 error (i.e. false positive) may have resulted in levels of
statistical significance that were too rigid and, thus, greater likelihood of making a type 2 or false
negative error. In other words, rejecting potentially valid variables that do not reach the adjusted
level of significance.
101
This aims of this study were primarily exploratory and further research is needed to more
fully understand the longer term impacts that a spinal triage service delivered by physiotherapists
can have as well as the potential mechanism(s) by which improvements occurred. Further study
examining outcomes at 6 and 12 months following the assessment is ongoing. We will be able to
then ascertain whether short-term improvements following the assessment were sustainable or
not and which factors may impact sustainability. Examination of potential predictors of success
(or deterioration) of patient outcomes using a biopsychosocial model may also help to shed light
why some people improve and some do not as well as help to identify potential gaps in the care
pathway. Mixed method research, which combines quantitative and qualitative is recommended
in order to gain a broader understanding of complex interventions like the spinal triage service.
(31) As such, further research using quantitative and qualitative methods would contribute to
generating a program effect theory (63,64) or program logic model (65) to explore / explain why
there is improvement at the short-term time point. The validity of such a theory could then be
subsequently tested in further research. This work, which has focused on patient-related
outcomes only, does not include an examination of cost and economic implications of the triage
program. Thus, further work that examines the cost implications and that compares the
effectiveness and efficiency of different models of care and service delivery is also needed.
4.6 Conclusion
A spinal triage assessment program delivered by physiotherapists can be viewed as a
complex intervention that may have the potential to impact a wide range of patient-related
outcomes. This study demonstrated that there were significant group mean short term
improvements in the Physical Component Scale of the SF-36v2 (p<.001) and borderline
improvements in the bodily pain scale of the SF-36v2 and Numeric Pain Rating Scale scores
(p=.020) of participants undergoing a spinal triage assessment performed by physiotherapists.
Further study is needed to examine longer -term outcomes and explore potential mechanisms of
improvements using a biopsychosocial framework.
102
4.7 References
(1) Andersson GB. Epidemiological features of chronic low-back pain. Lancet 1999 Aug
14;354(9178):581-585.
(2) Hestbaek L, Lenoeuf-Yde C, Manniche C. Low back pain: what is the long-term course? A
review of studies of general patient populations. Eur Spine J 2003;12(2):149-165.
(3) Lawrence RC, Felson DT, Helmick CG, Arnold LM, Choi H, Deyp RA, et al. Estimates of
the prevalence of arthritis and other rheumatic conditions in the United States. Part II. Arthritis
Rheum 2008;58(1):26-35.
(4) Katz JN. Lumbar disc disorders and low-back pain: socioeconomic factors and consequences.
J Bone Joint Surg Am 2006 Apr;88(Suppl 2):21-24.
(5) Gandjour A, Telzerow A, Lauterbach KW, INTERCARE International I. European
comparison of costs and quality in the treatment of acute back pain. Spine 2005 Apr
15;30(8):969-975.
(6) Lim KL, Jacobs P, Klarenbach S. A population-based analysis of healthcare utilization of
persons with back disorders: results from the Canadian Community Health Survey 2000-2001.
Spine 2006;31(2):212-218.
(7) Hadlow AT. Back Pain: a problem of referral. J Bone Joint Surg Br 2003;85-B
(Supp_III):208.
(8) MacKay C, Canizares M, Davis A, Badley E. Health care utilization for musculoskeletal
disorders. Arthritis Care Res 2010;62(2):161-169.
(9) Canizares M, MacKay M, Davis A, Mahomed N, Badley E. Orthopaedic Surgery in Ontario
in the era of the wait time strategy. Arthritis Community Research & Evaluation Unit.
Report No.: 07-2. 2007;07-2.
(10) Mayman D, Yen D. Maximizing use of a surgical clinic for referrals of patients having back
problems. Can J Surg 1999;42:117-119.
(11) Waddell G. Diagnostic triage. The Back Pain Revolution. Second ed. Toronto: Churchill
Livingstone; 2004. p. 9-26.
(12) Waddell G. Epilogue. The Back Pain Revolution. Second ed. Toronto: Churchill
Livingstone; 2004. p. 457-459.
103
(13) Daker-White G, Carr AJ, Harvey I, Woolhead G, Bannister G, Nelson I, et al. A randomised
controlled trial. Shifting boundaries of doctors and physiotherapists in orthopaedic outpatient
departments. J Epidemiol Community Health 1999;53(10):643-650.
(14) Hattam P. The effectiveness of orthopaedic triage by extended scope physiotherapists. Clin
Govern Int J 2004;9(4):244-252.
(15) Aiken AB, Harrison MM, Atkinson M, Hope J. Easing the burden for joint replacement wait
times: the role of the expanded practice physiotherapist. Healthcare Quarterly 2008;11(2):62-66.
(16) Sarro A, Rampersaud YR, Lewis S. Nurse practitioner-led surgical spine consultation clinic.
J Adv Nurs 2010;66(12):2671-2676.
(17) Childs JD, Whitman JM, Sizer PS, Pugia ML, Flynn TW, Delitto A. A description of
physical therapists' knowledge in managing musculoskeletal conditions. BMC Musculoskelet
Disord 2005;6:32.
(18) Moore JH, Goss DL, Baxter RE, DeBerardino TM, Mansfield LT, Fellows DW, et al.
Clinical diagnostic accuracy and magnetic resonance imaging of patients referred by physical
These other issues may be important contextual factors that have the potential to impact patient
relevant outcomes.
Keywords: interprofessional practice, quality assurance, back pain, orthopaedics
111
5.1 Introduction
Accessibility to health care services and satisfaction are key components of quality of care.
Wait time has been identified by Canadians as an important measure of access and is cited as the
most prominent barrier among those who experience difficulties obtaining care. (1,2)
“Satisfaction” can refer to a health care recipient’s reaction to aspects of the service delivered
which, in turn, result in overall perceptions of quality of service. (3)
Long wait times for elective orthopaedic surgery have been and continue to be problematic
in Canada. (4) People waiting for health care can experience adverse effects such as reduced
function, lower health related quality of life and psychological distress, (1,5-7) and living with
uncertainty of diagnosis, prognosis and further management may create or perpetuate patient
concerns. (8) People with spine related complaints comprise a large proportion of referrals made
to orthopaedic surgeons. (9,10) Many of these patients are not considered to be surgical
candidates (11,12) and may simply require reassurance that they do not have serious spine
pathology. (13,14) This patient subgroup can contribute significantly to wait times for consulting
with a surgeon which ultimately lead to greater wait times for other required orthopaedic surgical
procedures such as hip and knee joint replacements. Reducing the number of non-surgical
consultations in a surgeon’s caseload may help reduce surgical consultation wait times for
patients who may benefit from spinal surgery and potentially redirect nonsurgical candidates to
more appropriate treatment earlier. There is, therefore, a need for innovative approaches to the
management and reduction of orthopaedic wait times.
Physiotherapists (PTs) are primary health care providers who have expertise in the
assessment and evaluation of musculoskeletal disorders. Interprofessional models of care that
include PTs as key providers are an alternative approach to traditional physician-centered referral
and care pathways. There is a growing body of evidence to support new and expanded roles that
maximize the unique skill sets of PTs. PTs with advanced orthopaedic training, often practicing
with a maximized or extended scope, have been shown to be equally as effective as orthopaedic
surgeons for the diagnosis and non-surgical management of many musculoskeletal conditions.
(15-20) PTs performing this role have also contributed to reduced wait times and improved
referral practices, (19,21) with data from the United Kingdom indicating that pre-screening of
patients by such therapists can more than double the proportion of patients who need surgery on
112
assessment by the surgeon. (22) This type of role can be referred to as triage (23) whereby
patients are first screened by a PT to determine if referral to a surgeon, recommendation of
further conservative management and/or diagnostic investigations are appropriate.
Much of the research evaluating such programs has focused on general orthopaedic practices
(19,24-26) or hip and knee arthritis management only. (27-29) Few PT-delivered triage services
focused solely on spinal conditions are described or evaluated in the literature. (21,30,31)
A spinal triage program delivered by PTs represents a shift in roles that may affect patient
and referring care provider expectations, given that both groups may be accustomed to
interacting with orthopaedic surgeons for management of complex and/or chronic back problems
that have been recalcitrant to conservative care. Therefore, evaluating the satisfaction of both
patients and referring care providers with the spinal triage service is an important outcome as the
perceptions of both groups are crucial to the acceptance and adoption of this new and emerging
role for PTs. Furthermore, unmet expectations in a health care encounter can be a source of
reduced satisfaction. (32) Certain patients, for example, may have expectations of seeing a
surgeon rather than a physiotherapist. The objective of the present study was to evaluate patient
and referring care provider satisfaction associated with a spine triage service delivered by PTs in
collaboration with orthopaedic surgeons.
5.2 Methods
5.2.1 Background: Description of the Spine Triage Service
The Spinal Triage Assessment Service (STAS) is a spinal assessment service located in a
mid-size Canadian city and is a collaborative effort between a group of three orthopaedic
surgeons and PTs from a private rehabilitation clinic. The program was initiated to address an
excessive number of referrals to the orthopaedic surgeons of patients with low back-related
conditions, the majority of whom did not require surgery. Prior to initiation of the program, the
surgeons expressed frustration regarding how long people waited to see them (often over a year)
and the high proportion of non-surgical referrals in their caseloads. The surgeon group had an
existing extensive working relationship with PTs from the rehabilitation clinic and approached
the clinic to request help with their wait list back-log and screening of subsequent new referrals
pertaining to spine (mainly low back-related) conditions. All PTs involved in the STAS have
completed advanced orthopaedic training in the Canadian Orthopaedic Syllabus with experience
113
ranging from 5 to 30 years. At present, any people referred to the orthopaedic surgeons for spine
problems are automatically re-routed to the PTs for screening. (Figure 1 shows the STAS referral
and clinical pathways.)
Figure 5.1 STAS Referral, Assessment and Clinical Pathways
The assessing PT discusses the findings of each assessment with the PT consultant via
videoconferencing with the patient present (Figure 2). The clinical diagnosis and
recommendations are determined jointly between the assessing PT and consultant PT through a
collaborative reasoning approach (33) with input from the patient. A detailed report outlining the
assessment findings, diagnosis, management recommendations and any recommended further
diagnostic tests is then sent to the referring health care providers and any other relevant care
providers involved. The consultant PT had an extensive prior working relationship with the
orthopaedic surgeon group.
114
Figure 5.2 STAS Assessment Process
5.2.2 Participants
The participants of the study involved two groups: the patients referred to the service and
the referring care providers. The patient participants of the study were recruited from a
convenience sample of people referred to the triage program either directly from their primary
care provider or via one of the triage program’s orthopaedic surgeons. The inclusion criteria
included: patients referred to the triage program with primarily low back related complaints, age
≥ 18 years and ≤ 80 years and provision of informed consent. The exclusion criteria included:
patients receiving third party payer funding (ie Worker’s Compensation Board, or other) for their
back related complaints, patients with primarily neck (cervical spine) or mid back (thoracic
spine) complaints and people with language, reading, or comprehension barriers that would limit
adequate completion of the study paperwork.
5.2.3 Study Design
The satisfaction survey reported here was conducted as part of a prospective evaluation
study that evaluated a number of multidimensional patient outcomes (ie pain, function, quality of
life) and biopsychosocial predictors of success with each outcome. The main study used a quasi-
115
experimental one group pretest-posttest design.(34) This design represented the best option to
evaluate this program given that there was no accessible and equivalent control group that could
be used as a comparison. The “pretest” measures were derived from a paper-based survey that
was completed before the participants underwent the triage assessment and also from a clinical
classification tool completed by the assessing PT. The “posttest” evaluation of outcomes,
including patient satisfaction surveys, was done at approximately 4 weeks following the
assessment through either mail or a password protected online survey (as per the choice of the
patient participant). Provider satisfaction surveys were faxed to referring health care providers
with the completed assessment report. Reminders for completion of the patient participant
follow-up surveys were done by phone or email prompts (up to three reminders approximately 1
week apart) on the basis of the tailored design method proposed by Dillman and colleagues. (35)
There were no reminders sent to referring care providers. This study was approved on ethical
grounds by the Behavioural Ethics Board of the University of Saskatchewan.
5.2.4 Measures
Patient satisfaction with the triage program was ascertained through two questions
developed specifically for this purpose. The first question was: “ How would you rate your
satisfaction with the overall service you received from the health care providers at the <Spinal
Triage Assessment Service>?” The second question was: “How would you rate your satisfaction
with the recommendations that were made by the < Spinal Triage Assessment Service > health
care providers to your doctor?” Possible responses were on a 5-point likert scale (i.e. “very
satisfied”, “somewhat satisfied”, “neither satisfied nor dissatisfied”, “somewhat dissatisfied” or
“very dissatisfied”). Space was also provided for patient participants to list any comments
regarding satisfaction.
Provider satisfaction with the report and recommendations were measured with one
question: “How would you rate your satisfaction with the recommendations that were made by
the < Spinal Triage Assessment Service > regarding your patient?” The providers chose from the
same five response levels listed above and also had a space for general comments related to the
triage program. The main cohort study also evaluated outcomes of pain, (36,37) perceived
function (38,39) and quality of life (40) through surveys done at baseline (ie, before the triage
assessment) as well as at 4-week, 6-month and 12-month follow-up intervals. A variety of
116
demographic, clinical and psychosocial factors (eg. Distress and Risk Assessment Method) (41)
were also collected at baseline; however, only a selection of the baseline variables and outcome
measures are presented in this manuscript in order to provide a more complete description of the
sample.
5.2.5 Analysis
Differences in select demographic and clinical variables between patient participants and
nonparticipant patients (i.e. those that were eligible to participate but chose not to) as well as
between patient participant responders and nonresponders at the posttest time point were
evaluated with chi square or Fisher’s exact test for categorical variables, and independent
samples t-test or Mann-Whitney U test (if there was a non-normal distribution) for continuous
variables. Frequencies and valid percents for the satisfaction survey question responses were
calculated. All quantitative analysis was done with PASW (Predictive Analytics SoftWare)
Statistics Mac version 18.0.
An inductive thematic analysis approach was applied to qualitatively describe the
comments provided from the patient and health care provider satisfaction surveys. A process of
open and axial coding (42,43)using NVivo 9 software was applied. During open coding, a
constant comparative approach was used to group the codes into categories and identify themes.
Axial coding was then done to look at the interrelationship of categories. (42) A coding scheme
was developed jointly and verified independently by two researchers by identifying, classifying
and labeling the primary patterns in the data. One of the researchers is a clinician academic with
past experience in the spinal triage service and the second researcher is a non-clinician academic.
Differences in coding between the researchers were resolved though discussion.
5.3 Results
5.3.1 Participants versus Non-participants
The intake period of the study spanned 8 months (October 2009-June 2010). During this time
period 198 people had an assessment through the triage program, 56 people were excluded
(Table 1) and 27 people who met the inclusion criteria chose not to participate. This left a total of
115 patient participants and an overall response rate, among those people that were eligible, of
117
81.0% (115/142). Among study patient participants, 66/115 (57.4%) opted to complete a mailed
paper-based follow-up survey and 49/115 (42.6%) chose to complete an online password-
protected follow-up survey. There were no significant differences (p>.05) between patient
participants and non-participants in age, gender, diagnosis or management recommendations.
Table 5.1. Reason for Exclusion from Study
Reason Frequency (%) Age > 80 or <18 7/56 (12.5) Third party payer fundeda 14/56 (25.0) Symptom location (ie. not lumbar spine region) 13/56 (23.2) Did not attend 4/56 (7.1) Assessment typeb 6/56 (10.7) Otherc 12/56 (21.4) Notes: aWorker’s Compensation Board or other third-party insurance company btreatment direction assessment- person had already seen a surgeon, surgeon asking for PT opinion re. further conservative treatment options cother- includes scheduling conflicts, other medical (ie. medical urgency/ emergency unrelated to spine assessment, scheduled for joint replacement during study period)
Of the 115 people what had agreed to participate in the study, 108/115 (93.9%) actually
completed the post-test survey. The only significant difference between the responders and non-
responders was “residence” with proportionately more non-responders having an “urban”
residence (p = 0.039). There were no significant differences between these groups with respect to
age, sex, symptom duration, income, education, diagnosis and mode of follow-up (ie. paper-
based or internet-based).
The provider satisfaction survey was sent to the referring care provider attached to the
assessment report. The response rate was only 18.3% (21/115) despite attempts to increase
response rate via highlighting a request for completion of the survey at the beginning of the
assessment report. There were no significant differences (p > 0.05) between patient age, gender,
diagnostic category, treatment recommendations (ie. PT or surgeon referral) between primary
practitioner responders and non-responders (determined by independent samples t-tests, chi
square tests or Fisher exact tests where appropriate). However, care providers of patient
participants living in rural regions were significantly more likely to have responded (2/21 urban
and 19/21 rural; p = 0.011).
118
5.3.2 Description of Study Sample
Descriptive statistics of demographic, employment and general health variables of the
study sample can be found in Table 5.2 (continuous demographic variables), Table 5.3
(categorical demographic and employment characteristics) and Table 5.4 (categorical general
health variables).
Table 5.2 Demographics of Study Sample (Continuous Variables) Variable Min Max Mean SD Median IQR Age (years) 20 79 51.69 13.543 51.00 43.0-62.0 Symptom total duration (months)
1 480 138.94 128.778 108.00 28.5-240
Current episode duration (months)
1 408 39.54 72.880 10.00 4.0-36.0
Body mass index (kilogram/metre2)
18.75 58.39 28.84 6.718 27.32 24.4-31.6
Abbreviations: Min, minimum; Max, maximum; SD, standard deviation; IQR, interquartile range
119
Table 5.3 Demographic & Employment Characteristics (Categorical Variables) Variable Frequency (%) Age quartiles: <43 yrs 29/115 (25.2) 43-51 31/115 (27.0) 52-62 31/115 (27.0) >62 24/115 (20.9) Age <50 yrs 53/115 (46.1) Female 56/115 (48.7) Marital status: married 86/115 (74.8) separated 1/115 (0.9) divorced 8/115 (7.0) widowed 4/115 (3.5) never married 16/115 (13.9) Education: Did not complete grade 12 21/115 (18.3) Completed grade 12 30/115 (26.1) Trade school 34/115 (29.6) Some University 19/115 (16.5) University degree 9/115 (7.8) Graduate degree 2/115 (1.7) Income: <15 K 10/109 (9.2) 15 K-29,999 10/109 (9.2) 30 K-59,999 38/109 (34.9) 60 K-99,999 31/109 (28.4) ≥ 100 K 20/109 (18.3) Employment: Paid full time 62/115 (53.9) Paid part time 17/115 (14.8) Unemployed 5/115 (4.3) Housework 9/115 (7.8) Disabled 4/115 (3.5) Student 2/115 (1.7) Retired 16/115 (13.9) Not working due to back pain 22/115 (19.1) Back pain caused by work 42/115 (36.5) Rurala 77/115 (70.0) Farmer 32/115 (27.8) Notes: a Rural residence defined as weak or no Metropolitan Influenced Zones (44)
120
Table 5.4 General Health and Other Variables Variable Frequency (%) Smoking status: Never smoked 44/115 (38.3) Used to smoke 45/115 (39.1) Current smoker 26/115 (22.6) BMIa: Normal 30/115 (26.1) Overweight 44/115 (38.3) Grade 1 Obesity 26/115 (22.6) Grade 2 Obesity 8/115 (7.0) Grade 3 Obesity 7/115 (6.1) Other Health: Other bone or joint problems 72/115 (62.6) Headaches 42/115 (36.5) Stomach or digestive problems 29/115 (25.2) Lung or breathing problems 16/115 (13.9) Hypertension 14/115 (12.2) Heart problems 12/115 (10.4) Diabetes 9/115 (7.8) Other 18/115 (15.7) Number of Other Health Problems: 0 12/115 (10.4) 1 36/115 (31.3) 2 42/115 (36.5) 3 or more 25/115 (21.7) DRAM: Normal 37/115 (32.2) At risk 58/115 (50.4) Distressed, somatic 8/115 (7.0) Distressed, depressive 12/115 (10.4) ODQ: Minimal (0-20) 16/115 (13.9) Moderate (21-40) 60/115 (52.2) Severe (41-60) 31/115 (27.0) Extreme disability (61-80) 8/115 (7.0) Notes: aBMI: Normal 18.5-24.9, Overweight 25-29.9, Grade 1 Obesity 30-34.9, Grade 2 Obesity 35-39.9, Grade 3 Obesity≥ 40. (45); b There were no participants in the 80-100 category. Abbreviations: BMI, Body Mass Index; DRAM, Distress and Risk Assessment Method; ODQ, Oswestry Disability Questionnaire.
The median age of patient participants was 51 years, 48.7% were female and the majority
of participants were married (74.8%). Most patient participants (55.6%) had an educational
attainment of more than grade 12, and annual household income of greater than 30K (Canadian
dollars) (81.6%), were employed (68.7%) and had a “rural” residence (70%). A sizeable
proportion of the patient participants were farmers (27.8%). The majority (73.9%) of the sample
had body mass index scores of greater than a “normal” range, (45) 61.2% used to smoke or were
current smokers, and 58.2% had two or more other chronic health conditions, with “other bone or
121
joint problems” being the most prevalent condition reported (62.6%). Approximately half
(50.8%) of patient participants were in the “at risk” Distress and Risk Assessment Method (41)
category, indicating psychological risk of depression and/or somatization with 17.4% scoring as
being “distressed” due to either somatic or depressive symptoms. Most patient participants
(79.2%) had “moderate” to “ severe” perceived functional disability according to the Oswestry
(48) Hudak PL, Wright JG. The characteristics of patient satisfaction measures. Spine
2000;25(24):3167-3177.
(49) Ware JE, Snyder MK, Wright WR, Davies AR. Defining and measuring patient satisfaction
with medical care. Eval Program Plann 1983;6:247-263.
(50) Ferris, L.E. and the Health Services Research Group. A guide to direct measures of patient
satisfaction in clinical practice. Can Med Assoc J 1992;146:1727-1731.
(51) Pascoe GC. Patient satisfaction in primary health care: a literature review and analysis. Eval
Prog Plan 1983;6:185-210.
(52) Hill J, Bird HA, Hopkins R, Lawton C, Wright V. Survey of satisfaction with care in a
rheumatology out-patient clinic. Ann Rheum Dis 1992;51:195-197.
(53) Baker R. Development of a questionnaire to assess patients' satisfaction with consultations
in general practice. Br J Gen Pract 1990;40:487-490.
(54) McClellan CM, Greenwood R, Benger JR. Effect of an extended scope physiotherapy
service of patient satisfaction and the outcome of soft tissue injuries in an adult emergency
department. Emerg Med J 2006;23:384-387.
142
(55) Slade SC, Keating JL. Measurement of patient experience and satisfaction of exercise
programs for low back pain: a structured literature review. Pain Medicine 2010;11:1489-1499.
(56) Campbell M, Fitzpatrick R, Haines A, Kinmonth A, Sandercock P, Spiegelhalter D, et al.
Framework for design and evaluation of complex interventions to improve health. BMJ
2000;321:694-696.
(57) von Korff M, Moore JC. Stepped care for back pain: activating approaches for primary care.
Ann Int Med 2001;134:911-917.
(58) Rubin DI. Epidemiology and risk factors for spine pain. Neurol Clin 2007 05;25(2):353-
371.
(59) Waddell G. The biopsychosocial model. The Back Pain Revolution. Second ed. Toronto:
Churchill Livingstone; 2004. p. 265-282.
(60) Greenhalgh S, Selfe J. Red Flags: A Guide to Identifying Serious Pathology of the Spine.
Toronto: Churchill Livingstone; 2006.
(61) Verbeek J, Sengers M, Riemens L, Haafkens J. Patient expectations of treatment for back
pain. A systematic review of qualitative and quantitative studies. Spine 2004;29(20):2309-2318.
(62) Linton SJ, McCracken LM, Vlaeyen JW. Reassurance: Help of hinder in the treatment of
pain. Pain 2008;134:5-8.
(63) Goubert L, Crombez G, Danneels L. The reluctance to generalize corrective experiences in
chronic low back pain patients: a questionnaire study of dysfunctional cognitions. Behav Res
Ther 2005;43:1055-1067.
(64) Jordan KP, Kadam KD, Haywards R, Porcheret M, Young C, Croft P. Annual consultation
prevalence of regional musculoskeletal problems in primary care: an observational study. BMC
Musculoskelet Disord 2010;11(144):1471.
(65) Lim KL, Jacobs P, Klarenbach S. A population-based analysis of healthcare utilization of
persons with back disorders: results from the Canadian Community Health Survey 2000-2001.
Spine 2006;31(2):212-218.
143
Chapter Six
A Physiotherapy Assessment Service for People with Low Back-
related Complaints:
Short Term Biopsychosocial Predictors of Success
144
Title: A Physiotherapy Triage Assessment Service for People with Low Back-Related
Complaints: Short Term Biopsychosocial Predictors of Success (Paper 4)
Abstract
Objectives: To determine which biopsychosocial factors (i.e. demographic, clinical,
psychosocial and other) were predictive of short term improved self-reported pain, function,
general health status and participant satisfaction in people undergoing a spinal triage assessment
delivered by physiotherapists.
Methods: Participants with low back–related complaints were recruited from people referred to
a spinal triage assessment program delivered by physiotherapists. Before undergoing the triage
assessment, participants completed a battery of questionnaires covering a range of
sociodemographic, clinical, and psychological features. Self-reported outcome measures of pain,
function, quality of life and satisfaction (participant and referring health care provider) were
completed at approximately 4 weeks after the assessment. Baseline measures and variables were
analyzed with descriptive analysis. Determination of “success” was based on proposed minimal
important change (MIC) scores of select outcome measures. Multivariate logistic regression was
used to explore potential predictors of success for each outcome of interest (i.e. self-reported
pain, function, physical and mental quality of life and satisfaction).
Results: Despite the complex and chronic presentation of many of the participants, certain
people did report improvements in outcomes at the 4-week post assessment time point with the
highest proportion of participants demonstrating improvement (according to the MIC scores) in
the SF 36 Physical Component Summary Score (48.6%) but the lowest proportion of participants
having improvements in the Numeric Pain Rating Scale (11.5%). A variety of different
sociodemographic, psychological, clinical and other variables were associated with success or
improvement in each respective outcome.
Conclusions: The results suggest that there may be a potential mechanism of reassurance that
occurs during the spinal triage assessment process as those with higher psychological distress (as
measured by the Fear Avoidance Beliefs Questionnaire and the Distress and Risk Assessment
Measure) were more likely to improve on certain outcomes. The use of an evaluation framework
guided by a biopsychosocial model may help determine potential mechanisms of action for a
complex intervention like the triage program.
145
6.1 Introduction
Musculoskeletal conditions such as low back pain, osteoarthritis and other regional pain
syndromes are highly prevalent and associated with a considerable burden of pain, disability and
work loss. (1) An estimated one in four adults will consult primary care for a musculoskeletal
problem during a one year period with low back pain being the most common reason for
consultation. (2) Although most people with back pain can be effectively managed in primary
care, people with low back pain continue to comprise a significant proportion of referrals made
to secondary care specialist providers such as orthopaedic surgeons. (3,4) As many of these
patients are not considered to be surgical candidates,(5,6) it calls into question the
appropriateness as well as the efficiency of this traditional referral pathway.
New models of care provision that function at the interface between primary and
secondary care and involve non-surgical specialists or other healthcare professionals, such as
physiotherapists, providing care to people with musculoskeletal problems are being increasingly
reported in the literature. (7-10) Physiotherapists with advanced orthopaedic training, often
practicing with a maximized or extended scope, have been shown to be equally as effective as
orthopaedic surgeons for the diagnosis and non-surgical management of many musculoskeletal
conditions. (7,11-15) Physiotherapists performing this role have also contributed to reduced wait
times and improved referral practices (7,16) with data from the UK indicating that pre-screening
of patients by physiotherapists can more than double the proportion of patients who need surgery
on assessment by the surgeon. (17) However, evaluation research examining these types of
programs is sparse. The few programs studied focus on general musculoskeletal practices
(7,18,19) or hip and knee joint arthritis management only. (9,20,21) Few triage services
delivered by physiotherapists focused solely on spinal conditions are described or evaluated in
the literature. (16,22)
A triage assessment program delivered by physiotherapists can be viewed as a complex
intervention that may have the potential to impact a wide range of patient-centred outcomes. (23)
Complex interventions may contain a number of different elements that act independently or
interdependently, thus it is difficult to identify precise mechanisms that contribute to outcomes.
(24) A recent systematic review examining the evidence of extended roles for a variety of health
professionals, including physiotherapists, concluded that one of the notable omissions in much of
the research was a focus on health outcomes in patients. (25) We have recently shown that
146
participants of a spinal triage program delivered by physiotherapists demonstrated overall
significant short term improvements in self-reported pain and general physical health as well as
high satisfaction with the service; however the reasons or mechanisms for these improvements
remain unclear. (see Chapter 4) Examination of potential predictors of short-term success or
improvement in outcomes using a biopsychosocial model may help to shed light why some
people improve and some do not as well as help to begin to understand potential mechanisms of
action.
A biomedical approach assumes a direct link between pain, disease and physical
pathology, whereas a biopsychosocial model acknowledges that the pain experience and
disability arising from it are determined by the interaction between biological, psychological and
social factors. (26-28) A biopsychosocial framework considers not only the body-focused
biological components of health, but also the individual and societal contexts of the individual’s
experience of health. (29) The biopsychosocial model is proposed as a means to more completely
understand, evaluate and manage disability attributed to low back pain; (26,27) however, much
of the outcomes research involving people with spine problems do not incorporate this
multidimensional approach.
The purpose of the present study was to determine which demographic, clinical,
psychosocial and other factors were predictive of improved self-reported pain, function, general
health status and participant satisfaction. We used a biopsychosocial approach through the types
of outcomes measured and through the type and breadth of potential predictive variables
examined.
6.2 Methods and Measures
6.2.1 Study Design
This study used a quasi-experimental one group pretest-posttest design. (30) This design
represented the best option to evaluate this program given that there was no accessible and
equivalent control group that could be used as a comparison. The “pretest” measures were
derived from a paper-based survey that was completed before the participants underwent the
triage assessment and also from a clinical classification tool completed by the assessing
physiotherapist. (The “posttest” evaluation of outcomes was done at approximately 4 weeks
147
following the assessment through either mail or a password protected online survey (as per the
choice of the participant). Reminders for completion of the participant follow up surveys were
done by phone or email prompts (up to three reminders approximately one week apart) on the
basis of the tailored design method proposed by Dillman and colleagues. (31)
6.2.2 Participants
The participants of the study were recruited from a convenience sample of people
referred to the spinal triage program either directly from their primary care provider or via one of
the participating orthopaedic surgeons. The inclusion criteria included: patients referred to the
spinal triage program with primarily low back related complaints, age ≥ 18 years and ≤ 80 years
and provision of informed consent. The exclusion criteria included: patients receiving third party
payer funding (i.e. Worker’s Compensation Board (WCB), or other) for their back related
complaints, patients with primarily neck (cervical spine) or mid back (thoracic spine) complaints
and people with language, reading or comprehension barriers that would limit adequate
completion of the study paperwork. Patients were also excluded due to other reasons such as
scheduling conflicts or other medical issues. (Table 6.1)
Table 6.1. Reason for Exclusion from Study Reason Frequency (%) Age > 80 or <18 7/56 (12.5) 3rd Party payer fundeda 14/56 (25.0) Symptom location (i.e, not lumbar spine region) 13/56 (23.2) Did not attend 4/56 (7.1) Assessment typeb 6/56 (10.7) Otherc 12/56 (21.4) a Worker’s Compensation Board (WCB), Saskatchewan General Insurance (SGI), or other third party payer b Treatment direction assessment- person already saw a surgeon, surgeon asking for PT opinion re. further conservative treatment options c Other- includes scheduling conflicts, other medical (i.e. medical urgency/ emergency unrelated to spine assessment, scheduled for joint replacement during study period)
Select demographic and clinical characteristics of non-participants were collected by a
physiotherapist not directly involved with the research and provided in a de-identified manner to
the researchers.
148
6.2.3 Measures
Before undergoing the triage assessment, participants completed a battery of
questionnaires covering a range of variables including: socio-demographics, clinical features,
fear avoidance beliefs, depression and somatization. Outcomes of interest were self perceived
pain, function, general health status and satisfaction. (see Appendix D & F) A detailed
description of these measures can be found below.
6.2.3.1 Sociodemographics and General Health
The following socio-demographic variables were collected at intake: age, sex, marital
status, highest level of educational attainment and annual household income. Also collected were
the residential postal codes of participants. “Urban” residence was classified as living in a town
or city with ≥ 10,000 residents as determined on the basis of having a number other than zero in
the second position of the postal code. (32) All other postal codes were designated as “rural” and
categorized along a continuum of relative rurality on the basis of Statistics Canada’s
classification of Metropolitan Influence Zones (MIZs). MIZ’s are determined by the percentage
of the community population that commutes to a city or urban centre for employment. (32)
MIZ’s were categorized into strong MIZ (>30% residents commute to work in an urban core
(population ≥ 10,000)), moderate MIZ (5-30% of residents commute to an urban core), weak
MIZ (0-5% of residents commute to work in an urban core) and no MIZ (40 or fewer residents
commute to work in an urban core). (32) General health measures, developed specifically for this
study, that were collected included self-reported presence of other health conditions, height and
weight (to calculate body mass index (BMI)) and smoking status (i.e. current, past or never
smoked).
6.2.3.2 Employment Related Variables
Employment status (paid full time, paid part time, unemployed, housework, disabled,
student, retired) and employment type were self-reported. The intake questionnaire also included
two questions with dichotomous (i.e. yes/ no) response options pertaining to work and LBP: “ If
you are not working, is this because of your low back problem?” and “ Do you feel (that) your
back problem is caused by your work?”.
149
6.2.3.3 Clinical Features
Total duration of symptoms and the duration of current episode related to participants’
presenting symptoms was ascertained from the intake questionnaire. The presence and location
of lower extremity symptoms (i.e. pain, numbness, tingling or other) was determined from a
body diagram completed by participants. Symptom location was coded into “back only”, “above
knee leg referral” or “below knee referral” on the basis of the body diagram.
A clinical classification tool, derived from the diagnostic triage categories developed by
international groups of experts (33-35) that also incorporates management recommendations,
was developed in consultation with the physiotherapists and surgeon(s) involved in the spinal
triage program (see Appendix B). Further detail regarding development of the clinical
classification tool can be found elsewhere. (Chapter 3)
6.2.3.4 Fear Avoidance Beliefs
The emergence of the biopsychosocial model of low back pain (LBP) led Waddell et al
(36) to develop the Fear Avoidance Beliefs Questionnaire (FABQ). The FABQ can be used to
assess participants’ beliefs with regard to the effect of physical activity and work on their LBP. It
consists of 16 items and patients rate their agreement with each statement on a 7- point Likert
scale (0 = completely disagree, 6 = completely agree). The original factor analysis demonstrated
two subscales: the work subscale (FABQ_W) and the physical activity subscale (FABQ_PA).
The psychometric properties of the subscales are better established than the total FABQ so use of
the subscales may be preferable. (37) The FABQ has been shown to explain unique amounts of
variance in work loss and disability, after controlling for other relevant factors. (36) A higher
score indicates more strongly held fear avoidance beliefs.
6.2.3.5 Depression and Somatization
Symptoms of depression and increased bodily/somatic awareness are often reported by
people who experience chronic pain. (38-41) The Distress and Risk Assessment Method
(DRAM) (41) was used in this study to assess psychological distress related to depression and
somatization. The DRAM combines scores from a depression questionnaire (Modified Zung
Depression Inventory) and a questionnaire pertaining to somatic symptoms (Modified Somatic
Perception Questionnaire). The DRAM is a simple method of classifying patients into those
150
showing no psychological distress, those at risk and those who are clearly distressed either due to
primarily somatic or depressive symptoms. (40) Main and colleagues suggest that people who
are “distressed” either due to primarily depressive or somatic symptoms according to the DRAM
may need more than just physical treatment and should be referred on for further psychological
assessment. (41) The DRAM has been shown to predict outcomes in primary care patients with
back pain (42) and to predict the responses to a pain management program. (40)
6.2.3.6 Self Perceived Pain
The 11-point Numeric Pain Rating Scale (NPRS) ranges from 0 (‘‘no pain’’) to 10
(‘‘worst pain imaginable’’) and was used to indicate the intensity of current pain, pain at its best
and pain at its worst level over the last 24 hours. (43) These 3 ratings were averaged to arrive at
an overall pain score. The scale has been shown to have adequate reliability, validity, and
responsiveness in patients with LBP when the 3 scores are averaged. (44)
6.2.3.7 Self Perceived Function
Self-perceived function was assessed with the modified Oswestry Disability Index (ODI),
which is a condition-specific self-report questionnaire. (45,46) Items on the ODI focus on how
much low back pain is limiting activities of daily living, like sitting, standing, walking, and
lifting. The ODI was modified from the original by substituting a section regarding employment/
home-making ability for the section related to sex life.(46,47)This modified version of the ODI
has been found to have high levels of reliability (ICC = 0.90) and responsiveness in patients with
low back pain. (46,47) The ODI is proposed to be most useful in specialty care settings or in
situations in which the disability level is likely to remain relatively high throughout a trial. (48)
Higher scores on the ODI represent higher levels of perceived disability. Fairbank et al. (45,46)
suggest that the continuous scores can be categorized into 5 categories of perceived disability
(i.e. “minimal”, “moderate”, “severe”, “crippled” and “bed bound”/ “exaggerating”). As there
were no participants with ODI scores in the highest disability category in this study, the last
category was eliminated in our analysis.
151
6.2.3.8 Quality of Life/ General Health Status
The Medical Outcomes Survey 36-item short-form survey version 2 (SF-36v2) 1(49) was
used to assess general health status. The measure is comprised of eight interrelated health
dimensions (physical functioning, role-limitations resulting from physical health problems,
bodily pain, general health, vitality (energy/fatigue), social functioning, role-limitations resulting
from emotional problems, and mental health (psychological distress /psychological well-being)).
(49,50) Two component summaries (i.e. physical and mental) can be derived from the eight
subscales. (49) The SF-36 has been shown to be a valid and reliable measure for both clinical
and general populations. (51-53) The SF-36v2 has been shown to have improved reliability over
the previous SF-36 version as well as improved floor and ceiling effects in certain domains.
(49,54) Scoring of the SF-36v2 was done by transformation of raw scores into norm-based
scores for each of the subscales and weighting of each subscale to produce the PCS and MCS.
(49) Higher scores represent greater health status or quality of life.
6.2.3.9 Satisfaction
Participant satisfaction with the triage program was ascertained through two questions
developed specifically for this purpose (Appendix F). The first question pertained to participants’
level of satisfaction with the service received and the second question related to their satisfaction
with the recommendations that were made. Possible responses were on a 5-point likert scale (i.e.
“very satisfied”, “somewhat satisfied”, “neither satisfied nor dissatisfied”, “somewhat
dissatisfied” or “very dissatisfied”).
6.2.4 Outcome Measures
The NPRS, ODQ and SF-36v2 were repeated at the posttest time point as the main
outcomes of interest (Appendix D). The physical and mental component summary scores (i.e.
PCS and MCS) were derived from the SF-36v2. The participant satisfaction survey was also
administered at that time (Appendix F). These measures cover domains of pain, back specific
function, general well-being/ quality of life and satisfaction and align with the recommendations
of various expert groups. (48,55,56)
1 Non-commercial license agreement with Quality Metric Incorporated for use of SF-36v2. License Number: CT113220 / OP001547
152
6.2.5 Analysis
Descriptive analysis of all baseline measures and variables included frequencies and
percent for categorical variables and mean, standard error, median and interquartile ranges for
continuous variables.
The determination of “success” or improvement in select outcome measures (i.e. NPRS,
ODI, PCS, MCS) was based on proposed minimal important change (MIC) or difference scores
The MIC score is defined as: “the smallest difference in score in the outcome of interest that
informed patients or informed proxies perceive as important, either beneficial or harmful, and
which would lead the patient or clinician to consider a change in the management”.(57)A
consensus group of international experts in the field produced guidelines for the clinical
interpretation of commonly used measures for pain and back-specific function. (57) The
proposed MIC values for the measures used in this study were: 2- NPRS, 10-ODI, 2-PCS, 3-
MCS (note- units are specific to each of the measure indicated). (49,57) The individual change
scores between prettest and posttest time points were re-coded into those that improved a
minimum of the MIC value and those that did not improve as per the MIC value for each
outcome. “Improvers” for “satisfaction” were coded as follows: “somewhat satisfied” and/or
“very satisfied” on both items of satisfaction questionnaire (i.e. satisfaction with service and
satisfaction with recommendations). The proportions (i.e. percentages) in each group for each
outcome were subsequently calculated.
Multivariate logistic regression was used to explore potential “predictors of success” for
each outcome of interest (i.e. NPRS, ODI, PCS, MCS, satisfaction). The MIC cut-points
(described above) were used to dichotomize each outcome/ dependent variable into people that
improved or those that did not improve. The model building process began with a bivariate
analysis exploring the association of a range of sociodemographic, clinical and other variables
using either Chi Square or Fisher’s exact test where appropriate. For most variables, data over
the full range of each measure was collected, however for the purposes of the regression analyses
most variables were transformed or recoded. Table 6.2 shows the variables used in the bivariate
analysis. Continuous variables were initially dichotomized or transformed into categorical
variables based on either median values or clinically relevant cut-points in order to allow clearer
interpretation of resulting odd ratios and to avoid restrictive assumptions of straight line linearity
between variables. (58) Also any variables that had zero cell counts in the initial bivariate
153
analysis, were re-coded by collapsing categories of the independent variable. Any variables that
had a p value of < 0.25 from the bivariate analysis was considered as a candidate for the
multivariate models.
Independence of variables (both among independent variables and between dependent
and independent variables) is an assumption of logistic regression. (58) Correlation within
independent variables and among baseline/ pretest and posttest variables of the same measure
was evaluated with Spearman’s correlation coefficient. For any independent variables that were
correlated r > 0.5, only the most significant variable (as per the bivariate analysis) was used in
the multivariate model. (59) Any baseline variables that were correlated r > 0.3 (60) with the
dependent outcome variable of the same measure (e.g. baseline ODI and ODI_MIC) were also
excluded from the models.
The remaining dependent variables were evaluated with logistic regression using a
backward stepwise selection procedure with p values of 0.10 to exit the model and 0.05 to enter
it. Stepwise selection procedures are recommended over other model building strategies when
there is an exploratory purpose to the analysis and when the relationships among dependent
outcome variables and covariates are not well established or understood. (58,61) Furthermore, a
backwards selection procedure is recommended over a forward procedure due to higher risks of
making Type II errors with forward selection procedures. (61) R2 was used to determine the
proportion of variance in the outcome variable explained by the knowledge of the explanatory
variables but not as a measure of the appropriateness of the final model. (58) Goodness-of-fit of
the final model was assessed by the Hosmer-Lemeshow statistical test. (58) The resulting models
were tested for multicollinerarity by examining variance inflation factors. (61) The final models
are presented as adjusted odds ratios with 95% confidence intervals. Statistical analysis was done
using PASW (Predictive Analytics SoftWare) Statistics Mac version 18.0. This study was
approved on July 30th, 2009 by the Biobehavioural Ethics Board of the University of
Saskatchewan.
154
Table 6.2. Description of Variables Included in Bivariate Analysis
Category Variable Description & units
Sociodemographicsa Age < 50 years; ≥ 50 years Sex male; female Symptom duration ≤ 6 months; > 6 months Current episode duration ≤ 6 months; > 6 months Body mass index Weight (kg)/ height (m2 ) Normal 18.5-24.9, Overweight
PT only Physical therapy treatment recommended (without surgeon referral): yes; no
Surgeon only Referral to surgeon only: yes; no MRI/ CT MRI or CT recommendation: yes; no Any surgeon referral Referral to surgeon (with or without PT referral): yes; no Any PT referral Referral to PT (with or without surgeon referral): yes; no Any imaging Recommendation of any imaging or other diagnostic
a Variables derived from self-report intake questionnaire (Appendix D) b Variable derived from clinical classification tool (Appendix B) c Cut-points derived from median values
155
6.3 Results:
6.3.1 Participants vs Non Participants
During the 8 month intake period 198 people had an assessment through the spinal triage
program 56 people were excluded (Table 6.1) and 27 people who met the inclusion criteria chose
not to participate. This left a total of 115 participants, thus the overall participant rate, among
those people that were eligible, was 81.0% (115/142). Among study participants, 66/115 (57.4%)
opted to complete a mailed paper-based follow-up survey and 49/115 (42.6%) chose to complete
an online password protected follow-up survey.
6.3.2 Responders vs Non-responders
A total of 108/115 participants (93.9%) completed the posttest survey. Comparison between
select characteristics of responders and non-responders can be found in Table 6.3. The only
significant difference between these groups was “residence” with proportionately more non-
responders having an “urban” residence (p= 0.039).
Table 6.3. Select Characteristics of 4 week Responders vs. Non-responders
Variable Responders Non-responders P-valueb Age (mean, SE) 52.02 (1.286) 46.57 (6.148) .593 LBP Duration (median, IQR) 108.00 (479) 36.00 (114) .620 Women 55/108 (50.9) 1/7 (14.3) .114 Income: <30K 19/103 (18.4) 1/7 (16.7) .344 30-59,999K 34/103 (33.0) 4/7 (66.7) 60-99,999K 30/103 (29.1) 1/7 (16.7) >100K 20/103 (19.4) 0/7 (0) Education: < grade12 19/108 (17.6) 2/7 (28.6) .837 Grade 12 28/108 (25.9) 2/7 (28.6) Trade School 32/108 (29.6) 2/7 (28.6) University 29/108 (26.9) 1/7 (14.3) Rural residencea 75/108 (69.4) 2/7 (28.6) .039 Internet follow-up 46/108 (42.9) 3/7 (42.9) 1.00 Diagnostic Triage: not spine 5/108 (4.6) 0/7 (0) Serious spine 7/108 (6.5) 1/7 (14.3) .244 Nerve root 53/108 (49.1) 1/7 (14.3) Non-specific back 43/108 (39.8) 5/7 (71.4) aRural residence=weak or no MIZ (32) bComparisons between responders and non-responders done with independent samples t-test (age), Mann-Whitney U test (LBP duration), Chi Square or Fisher’s exact tests.
156
6.3.3 Participant Characteristics
Descriptive statistics of demographic, employment and general health variables of the
study sample can be found in Table 6.4 (continuous demographic variables), Table 6.5
(categorical demographic and employment characteristics) and Table 6.6 (categorical general
health variables). The median age of participants was 51 years, 48.7% were female and the
majority were married (74.8%). Most participants (55.6%) had an educational attainment of
more than grade 12, an annual household income of greater than 30K (81.6%), had full or part
time employment (68.7%) and had a “rural” residence (70%). Also, a large proportion of the
participants were farmers (27.8%). The majority of the sample had BMIs greater than a “normal”
range (73.9%), used to smoke or were current smokers (61.2%) and had two or more other
chronic health conditions (58.2%) with “other bone or joint problems” being the most prevalent
condition reported (62.6%). Approximately half (50.8%) of participants were in the “at risk”
DRAM category with 17.4% scoring as being distressed to either somatic or depressive
symptoms. Most participants (79.2%) had “moderate” to “ severe” perceived disability according
to the categorized ODI scores.
Table 6.4. Demographics of Study Sample (Continuous Variables) Variable Min Max Mean S.E. Median IQR Age (years) 20 79 51.69 1.263 51.00 43.0-62.0 LBP Total Duration (months) 1 480 138.94 12.061 108.00 28.5-240 Current Episode Duration (months) 1 408 39.54 6.796 10.00 4.0-36.0 Body Mass Index (kg/m2) 18.75 58.39 28.84 .626 27.32 24.4-31.6
157
Table 6.5. Demographic & Employment Characteristics (Categorical Variables) Variable Frequency (%) Age quartiles: <43 yrs 29/115 (25.2) 43-51 31/115 (27.0) 52-62 31/115 (27.0) >62 24/115 (20.9) Age <50 yrs 53/115 (46.1) Female 56/115 (48.7) Marital status: married 86/115 (74.8) separated 1/115 (0.9) divorced 8/115 (7.0) widowed 4/115 (3.5) never married 16/115 (13.9) Education: Did not complete gr. 12 21/115 (18.3) Completed gr. 12 30/115 (26.1) Trade school 34/115 (29.6) Some University 19/115 (16.5) University degree 9/115 (7.8) Graduate degree 2/115 (1.7) Income: <15K 10/109 (9.2) 15K-29,999 10/109 (9.2) 30K-59,999 38/109 (34.9) 60K-99,999 31/109 (28.4) ≥ 100K 20/109 (18.3) Employment: Paid full time 62/115 (53.9) Paid part time 17/115 (14.8) Unemployed 5/115 (4.3) Housework 9/115 (7.8) Disabled 4/115 (3.5) Student 2/115 (1.7) Retired 16/115 (13.9) Not working due to LBP 22/115 (19.1) LBP caused by work 42/115 (36.5) Rural_Urban2: Urban 28/115 (24.3) Strong MIZa 1/115 (0.9) Moderate MIZ 9/115 (7.8) Weak MIZ 61/115 (53.0) No MIZ 16/115 (13.9) MIZ_ruralb 77/115 (70.0) Farmer 32/115 (27.8) aMIZ= Metropolitan Area and Census Agglomeration Influenced Zones: based on size of commuting flows to any larger urban centre. bCombination of “weak” or “no” MIZ’s
158
Table 6.6. General Health & Other Variables Variable Frequency (%) Smoking status: Never smoked 44/115 (38.3) Used to smoke 45/115 (39.1) Current smoker 26/115 (22.6) BMIa: Normal 30/115 (26.1) Overweight 44/115 (38.3) Grade 1 Obesity 26/115 (22.6) Grade 2 Obesity 8/115 (7.0) Grade 3 Obesity 7/115 (6.1) Other Health: Other bone or joint problems 72/115 (62.6) Headaches 42/115 (36.5) Stomach or digestive problems 29/115 (25.2) Lung or breathing problems 16/115 (13.9) Hypertension 14/115 (12.2) Heart problems 12/115 (10.4) Diabetes 9/115 (7.8) Other 18/115 (15.7) Number of Other Health Problems: 0 12/115 (10.4) 1 36/115 (31.3) 2 42/115 (36.5) 3 or more 25/115 (21.7) DRAM: Normal 37/115 (32.2) At risk 58/115 (50.4) Distressed, somatic 8/115 (7.0) Distressed, depressive 12/115 (10.4) ODI: Minimal (0-20) 16/115 (13.9) Moderate (21-40) 60/115 (52.2) Severe (41-60) 31/115 (27.0) Extreme Disability b(61-80) 8/115 (7.0) aBMI= Body Mass Index (kg/m2): Normal 18.5-24.9, Overweight 25-29.9, Grade 1 Obesity 30-34.9, Grade 2 Obesity 35-39.9, Grade 3 Obesity≥ 40. (62) b There were no participants in the 80-100 category.
159
Clinical descriptors of the study sample can be found in Table 6.7. The participants
reported having relatively long total duration of symptoms (74.8% > 24 months) and current
episode duration. The majority of participants had attempted a variety of non-invasive treatment
modalities in the past including medication, massage therapy, chiropractic and physiotherapy
with relatively few (3.5%) reporting having past surgical intervention for their back problems.
The majority of participants also reported having below knee symptoms (59.1%) indicating
potential nerve root involvement. A summary of the categorization of clinical features with the
clinical classification tool completed by the assessing PT can also be found in Table 6.7. The
majority of participants were classified as having a “problem in back” (93.9%); however, there
were relatively high classification of “medical” (9.6%) and “spinal cord/ cauda equina” (4.3%)
presentations. Similarly categorization according to the LBP triage categories demonstrated
relatively high proportions of “nerve root problems” (47.0%) and “serious spine pathology”
(7.0%). Further PT treatment was recommended in the majority of cases (63.5%) and “referral to
the surgeon” was made in 20% of cases.
160
Table 6.7. Clinical Descriptors of Study Sample
Variable Frequency (%) LBP Duration_cat: 0-6 months 15/114 (13.2) 7-12 months 5/114 (4.4) 13-24 months 8/114 (7.0) >24 months 86/114 (74.8) LBP Current Episode_cat: 0-6 months 46/115 (40.0) 7-12 months 19/115 (16.5) 13-24 months 18/115 (15.7) >24 months 32/115 (27.8) Past Treatment for LBP: Medication 75/115 (65.2) Massage Therapy 72/115 (62.6) Chiropractic 69/115 (60.0) Physiotherapy 63/115 (54.8) Exercise Therapy 39/115 (33.9) Acupuncture 30/115 (26.1) Surgery 4/115 (3.5) Radiating leg symptoms: Absent 16/115 (13.9) Above knee 31/115 (27.0) Below knee 68/115 (59.1) Diagnosisa: Problem in back 108/115 (93.9) Medical 11/115 (9.6) Mechanical/degenerative other body part 5/115 (4.3) Spinal cord/ cauda equina 5/115 (4.3) LBP Triage: Nerve root problem 54/115 (47.0) Non-specific/mechanical spine 48/115 (41.7) Serious spine pathology 8/115 (7.0) Not spine related 5/115 (4.3) Nerve Root Source: None 52/115 (45.2) Stenotic 35/115 (30.4) Discogenic 28/115 (24.3) Treatment Recommendations: Referral to Surgeon (any) 23/115 (20.0) Urgent referral to surgeon 16/115 (13.9) Surgeon referral + PT treatment 6/115 (5.2) Emergency referral to surgeon 1/115 (.9) Referral to another specialistb 11/115 (9.6) PT Treatment (any) 73/115 (63.5) PT Treatment (only) 67/115 (58.3) Imaging and diagnostic tests*: Any Imaging or other diagnostic testsc 38/115 (33.0) Advanced Imaging (i.e. CT, MRI) 31/115 (27.0) Xrays 8/115 (7.0) No further follow up 2/115 (1.7) Otherd 7/115 (6.1) aCategories are not mutually exclusive. bType of specialist: vascular, neurologist, pain management physician, urogynecologist, rheumatologist c Includes Xray, CT, MRI, blood work, bone scan d Includes functional testing, chiropractic treatment.
161
6.3.4 “Improvers” vs “non-improvers”
The proportion of participants that improved versus those that did not improve according
to MIC values is presented in Table 8 and Figure 8. The PCS of the SF-36v2 is the measure that
had the largest proportion of participants that improved (48.6%) and the lowest proportion of
participants reached an MIC threshold of improvement on the NPRS (11.5%).
Table 6.8. Proportion of Participants that Improved versus Those That Did Not Improve Variable/ Outcome Improveda(%) Did not improvea (%) NPRS_MIC 12/104 (11.5) 92/104 (88.5) ODI_MIC 25/108 (23.1) 83/108 (76.9) SF-36 PCS_MIC 52/107 (48.6) 55/107 (51.4) SF-36 MCS_MIC 33/107 (30.8) 74/107 (69.2) abased on MIC cutpoints
Figure 6.1. Proportion of participants that improved versus those that did not improve
162
6.3.5 Biopsychosocial characteristics of “improvers” for each outcome
A summary of the bivariate analysis can be found in Appendix G (only those variables
with p< 0.25 shown). Table 6.9 summarizes the results of the logistic regression analyses using
the backwards selection procedure. Both crude (i.e. bivariate) and adjusted (i.e. multivariate)
odds ratios are presented. All models had a mean variance inflation factors close to 1 and no
independent variable had a variance inflation factor above 2, indicating that the independence
assumption was met.
The following variables were associated with an improvement in NPRS at the posttest
time point: urban residence (vs. rural), having nerve root pathology or serious spine or not spine
related pathology (vs. non-specific LBP), and having a “minimal” or “crippled” ODI score at
baseline. Covariates associated with improvement in the ODI were: being male, having a LBP
duration (total and current episode) of less than 6 months, having never smoked, having a
baseline PCS <35, having a baseline FAB_PA>15 and being referred to “another specialist” as
part of the management recommendations. Variables associated with improved PCS were:
having never smoked (vs. used to smoke), being a current smoker (vs. never smoked) and having
a baseline FABQ_Work >14. The following variables were associated with improved MCS
scores: being married, having < 2 co-morbidities, having an NPRS baseline score of less than 5
and an MCS baseline score of < 48. Finally, the variables associated with participant satisfaction
were: age < 50 years, not married, having an educational attainment of < grade 12, being referred
for an MRI or CT scan, having a “minimal” ODI score at baseline and being in the “at risk or
distressed” category of the DRAM (vs. normal).
163
Table 6.9: Crude and Adjusted Estimates for Improvement in Perceived Pain, Function, General
Health and Satisfaction
Variables Crude OR
Adjusted OR
95%CI P-Value
A. Covariates of improved NPRS Urban 2.41 3.58 (.851,15.056) .082 LBP triage: Non-specific LBP (ref) - - .112 Nerve root 3.72 6.51 (.977, 43.333) .058 Serious spine or not spine related 4.44 11.13 (.918, 134.895) .053 ODI: Minimal (ref) - - .045 Moderate 0.31 0.14 (.021, .956) .045 Severe 0.26 0.14 (.016, 1.252) .079 Crippled 2.20 1.35 (.158, 11.445) .786 B. Covariates of improved ODI Male 2.77 9.93 (2.202, 44.794) .003 LBP current episode <6 months 2.79 3.65 (.831, 16.042) .086 LBP duration < 6months 3.60 7.25 (.669, 78.605) .103 Smoking: Never smoke (ref) - - .002 Used to smoke .311 .058 (.010, .330) .001 Smoker .393 .038 (.005, .298) .002 Baseline PCS <35 3.75 5.95 (1.454, 24.348) .013 Baseline FABQ_PA >15 2.83 6.20 (1.397, 27.530) .016 Another specialist referral 4.94 125.26 (8.037,
1952.163) .001
C. Covariates of improved PCS of SF36 Smoking: Never smoked (ref) - - .027 Used to smoke 0.50 0.46 (.188, 1.142) .094 Smoker 2.18 2.06 (.693, 6.145) .193 Baseline FABQ_work > 14 2.21 2.21 (1.010, 5.100) .047 D. Covariates of improved MCS of SF36 Married 2.37 2.93 (.883, 9.736) .079 Co-morbidities <2 2.09 2.40 (.918, 6.276) .074 NPRS baseline <5 3.50 4.60 (1.677, 12.591) .003 MCS baseline <48 3.37 5.56 (1.998, 15.458) .001 E. Covariates of participant satisfaction Age <50 4.51 8.81 (2.22, 34.975) .002 Not married 2.98 4.17 (.779, 22.261) .095 Education: grade12 or less 2.39 4.45 (1.234, 16.013) .022 MRI/CT 3.73 4.11 (.858, 19.705) .077 Baseline ODI (cat): minimal .032 moderate 0.17 0.08 (.008, .795) .031 severe 0.35 0.15 (.012, 1.856) .139 crippled 0.07 0.02 (.001, .282) .015 DRAM: at risk or distressed 2.27 6.65 (1.788, 24.755) .005 Notes: Summary of goodness of fit statistics for each model can be found in Appendix G; Statistically significant adjusted odds ratios are in bold.
164
6.4 Discussion
In this study we used a biopsychosocial framework and approach through the types of
outcomes measured and through the type and breadth of potential predictive variables examined.
The aim of this study was to determine which factors were predictive of short term improved
self-reported pain, function, quality of life (physical and mental) and satisfaction of participants
with low back-related complaints who underwent a spinal triage assessment delivered by
physiotherapists. We have shown that a variety of different sociodemographic, psychological,
clinical and other factors were associated with success or improvement in a battery of outcomes.
Our hope was that an evaluative framework informed by a biopsychosocial model would lead to
a more complete and multidimensional understanding of outcomes related to this type of service.
The baseline characteristics of this study’s sample demonstrate that the people referred to
the spinal triage service may not be representative of a typical person that presents with low back
complaints in a primary care setting. The majority of the participants had longstanding symptoms
(75% had > 24 month total symptom duration), complex clinical presentations (i.e. high
proportion of below knee symptom referral, high proportion of other chronic conditions), high
perceived disability, psychological risk factors (according to the DRAM) and low overall general
well being compared to both healthy normative populations and disease-specific norms of people
with back pain / sciatica. (49)
Despite the complex and chronic presentation of many of the participants, certain people
did report improvements in outcomes at the 4-week post assessment time point with the highest
proportion of participants demonstrating improvement (according to the MIC scores) in the SF
36 PCS (48.6%) and the lowest proportion of participants having improvements in the NPRS
(11.5%) (Figure 6.1). Even though a variety of different covariates were identified through
multivariate modeling for each outcome of interest (Table 6.9), we will limit our discussion to a
few key items as grouped by sociodemographic, clinical and psychological variables.
6.4.1 Sociodemographic Variables
Men were more likely than women to have improved ODI scores at the post-test time
point. This finding appears to be consistent with other research which has shown that women are
more likely than men to utilize more healthcare for back pain, take more sick days from work,
165
have a poor outcome after a single episode of low back pain, and develop persistent, chronic pain
lasting more than 3 months. (63,64)
Marital status may be an indicator of social support and possibly household income. We
are unaware of any other studies that have examined the impact of marital status on back pain
outcomes, but our results would suggest that being married could be associated with either
positive or negative outcomes depending on the type of outcome examined. For example, being
married (versus not married) was associated with a positive outcome on the SF36 MCS, but a
negative likelihood of satisfaction.
With respect to place of residence, urban dwellers were more likely than rural
participants to report improvement in the NPRS. Given the large proportion of participants from
“rural” regions referred to this service and emerging research that demonstrates that rural
residents, especially farmers, are at higher risk of low back pain and associated disability than
their urban counterparts, (65-69) this is an important area that requires further study.
6.4.2 Clinical Variables
The type of diagnostic categorization and duration of symptoms appear to have an impact
on self-reported pain and function, but not on other types of outcomes. For example, having a
diagnostic categorization of “nerve root”, “serious spine” or “not spine” related pathology
(according to the LBP triage categories) was associated with greater likelihood of improved
NPRS scores compared to those participants that were classified as having “non-specific LBP”;
however, the reasons for this association are unclear. Having symptom duration (both total and
current episode) of less than 6 months was associated with greater likelihood of improved ODI
scores; an unsurprising finding given that this group represents people that have had low back
symptoms for less time than would be considered “chronic” and/or have chronic episodic LBP
that would likely have a tendency to resolve periodically over time.
Management recommendations (e.g. referral to specialist), on the other hand, may impact
(72) Verbeek J, Sengrs MJ, Riemens L, Haafkens J. Patients expectations for back pain: a
systematic review of qualitative and quantitative studies. Spine 2004;29:2309-2318.
(73) Carman KL, Maurer M, Yegian JM, Dardess P, McGee J, Evers M, et al. Evidence that
consumers are skeptical about evidence-based health care. Health Affairs 2010;29(7):1-7.
(74) Rhodes LA, McPhillips-Tangum CA, Markham C, Klenk R. The power of the visible:the
meaning of diagnostic tests in chronic low back pain. Soc Sci Med 1999;48:1189-1203.
(75) Vlaeyen JW, Linton SJ. Fear-avoidance and its consequences in chronic musculoskeletal
pain: a state of the art. Pain 2000;85(3):317-332.
(76) Waddell G. The problem. The Back Pain Revolution. Second ed. Toronto: Churchill
Livingstone; 2004. p. 1-7.
175
(77) Linton SJ, McCracken LM, Vlaeyen JW. Reassurance: Help of hinder in the treatment of
pain. Pain 2008;134:5-8.
176
Chapter Seven
Conclusion
177
Conclusion
7.1 Broad aim and specific objectives
The broad aim of this dissertation was to evaluate a spine triage assessment service
delivered by physiotherapists in collaboration with orthopaedic surgeons. The Wall Street Spinal
Assessment Service (WSSAS) represents a relatively unique and new service delivery model
whereby people with back-related symptoms, referred from their primary care providers, are
screened by physiotherapists to determine appropriate management including conservative
intervention, referral to a surgeon, and/or diagnostic investigations.
Given the complexity of back pain and the dearth of research evaluating similar models
of care delivery, the specific objectives of this work were formulated to integrate a wide range
factors ranging from clinical issues and considerations to health services and policy implications.
Many of these diverse factors are reviewed in Chapters One and Two with the biopsychosocial
model (section 2.1.4) presented as a means to frame both the selection of outcome measures and
for the types of predictor variables that were examined.
Layered upon this already complex picture were pragmatic and contextual factors. This
project represents an integrated approach to research and knowledge translation that was
developed as a partnership between the researcher(s), a private rehabilitation clinic and a group
of orthopaedic surgeons. Thus, the needs and expectations of the stakeholders involved in the
project needed to be considered when planning the objectives, methods and design of the
research. Furthermore, the WSSAS is a “real world” program that is situated within a complex
clinical and health care environment, thus how external/ environmental factors may influence
outcomes as well as pragmatic issues needed to be considered when designing the evaluation.
The specific objectives of this project were:
1) To determine the impact of a physiotherapy triage assessment (i.e. the WSSAS) for
people with low back-related disorders on participant self-reported pain, function and
quality of life and patient and referring practitioner satisfaction.
178
2) To determine which demographic, clinical, psychosocial and environmental factors are
predictive of improved self-reported pain, function, quality of life and participant and
referring practitioner satisfaction.
3) To determine the diagnostic and treatment recommendation concordance between
physiotherapists and orthopaedic surgeons, using a newly developed clinical
classification tool, for people presenting to the WSSAS with low-back complaints.
Two approaches were used to achieve the aforementioned objectives: a prospective
observational study to address the first two objectives and a sub-group reliability study to address
the third objective. Chapters Three to Six address the specific research objectives and were
written such that each can be read independently as stand-alone manuscripts (with the exception
of the appendices which can be found at the end of the dissertation). The first manuscript
(Chapter 3) examines the diagnostic and management concordance between physiotherapists and
an orthopaedic surgeon using a newly developed classification tool (research objective #3). The
second manuscript (Chapter 4) uses quantitative methods to address the first research objective
by examining the short-term impacts for all outcomes with the exception of satisfaction. The
third manuscript (Chapter 5) examines satisfaction with the triage program from the perspective
of participants and referring care providers using quantitative and qualitative analytical methods
(research objective #1). The final manuscript, Chapter 6, uses quantitative methods to examine to
predictors of short-term success for all outcomes (research objective #2).
7.2 Principal Findings
7.2.1 Diagnostic and Management Concordance (Chapter 3)
Chapter Three presents an examination of the diagnostic and treatment recommendation
concordance between physiotherapists (PTs) and an orthopaedic surgeon for people presenting to
the WSSAS with low back-related complaints. A pilot tool that includes diagnostic categories
based on LBP triage as well as potential management pathways (including referral to a surgeon)
was developed to frame the responses. The responses of the following three provider groups
were compared for overall concordance and inter-rater reliability: 1) a team of assessing PT with
a consultant PT (PTteam), 2) an orthopaedic surgeon, and 3) a PT only (PTsolo).
179
The results of this study showed that there was high concordance in diagnostic
categorization of low back-related complaints between PTs with advanced orthopaedic training
and an orthopaedic surgeon regardless of whether the PT’s were collaborating as a team (i.e.
assessing PT + consultant PT) or on their own (i.e. PTsolo). Furthermore, there was high
agreement (82.2%) between PTs and a surgeon as to whether referral to a surgeon was required,
with the PTs being more likely to recommend review with the surgeon than the surgeon himself.
There were, however, more significant differences between groups for management
recommendations with the PTsolo being more likely than the PTteam or the surgeon to recommend
referral to the surgeon, PT treatment or x-rays. These differences in management
recommendations may reflect differences in the model of collaborative reasoning of the PTteam in
comparison to a PT assessing people with complex spinal problems on their own.
7.2.2 Short-term Outcomes evaluation (Chapter 4)
An evaluation of short-term outcomes associated with the physiotherapy triage
assessment is presented in Chapter Four. A one-group pre-test post-test design was used with
baseline questionnaires and measures applied prior to participants undergoing the assessment and
follow-up measures repeated at approximately 4 weeks following the assessment. The outcome
measures covered dimensions of pain (Numeric Pain Rating Scale (NPRS)), function (Modified
Oswestry Disability Questionnaire) and quality of life (Medical Outcomes Survey 36-item short-
form survey version 2 (SF36 v2).
By assessing outcomes relatively soon after the triage assessment was performed (i.e. at 4
weeks), we hoped to gain insight into whether the assessment process itself impacted participant
outcomes. Despite the chronic and complex baseline characteristics of the sample, there was a
mean overall significant improvement in the SF-36 Physical Component Summary (PCS) (and
borderline significant improvements in the bodily pain subscale of the SF-36 and the NPRS).
Participants likely did not have time to fully embark on any treatment or management
recommendations during the 4 weeks after the assessment, thus any improvements in outcomes
could be related to the assessment itself as being a type of intervention. One potential mechanism
of action is the education and reassurance that likely occurs as part of the triage assessment
process.
180
7.2.3 Satisfaction With the Triage Program (Chapter 5)
A spinal triage program delivered by physiotherapists represents a shift in traditional
practice boundaries that may affect patient and referring care provider expectations. Thus,
evaluating the satisfaction of both participants and referring care providers is an important
outcome as the perceptions of both groups are crucial to the acceptance and adoption of this new
and emerging role for physiotherapists. Chapter 5 presents the satisfaction of both patients and
referring care providers using a mixed methods (ie quantitative and qualitative) approach.
The quantitative results of the participant/ patient satisfaction survey demonstrated very
high levels of satisfaction with the service and slightly less satisfaction with the
recommendations that were made. Satisfaction of referring care providers with the
recommendations and report was also high, but given the low response rate, these results should
be interpreted with caution. Qualitative analysis of participant and provider comments revealed a
diverse range of themes. Positive themes identified by the patients and providers related to the
service include aspects of receiving a diagnosis, reassurance, customer service, efficiency of care
and guidelines for direction of a care pathway. Negative themes related to the service included
perceived lack of detail, timing of follow-up, issues related access to services due to cost or lack
of local availability. Other themes identified that were not directly related to the service
included: persisting or chronic symptoms, presence of co-morbidities and limited access to
recommended health care. These “other” issues may be important contextual factors that have
the potential to impact other patient relevant outcomes such as pain, function and quality of life.
7.2.4 Predictors of Short-term Success (Chapter 6)
A triage assessment program delivered by physiotherapists can be viewed as a complex
intervention that may have the potential to impact a wide range of patient-centred outcomes. (1)
Complex interventions may contain a number of different elements that act independently or
interdependently, thus it is difficult to identify precise mechanisms that contribute to outcomes.
(2) An examination of potential predictors of short-term success or improvement in a variety of
outcomes (ie pain, function, quality of life, satisfaction) using a biopsychosocial model (as found
in Chapter 6) may help to shed light as to why some people improve and some do not improve.
Additionally this information may assist in a better understanding of potential mechanisms of
action.
181
Despite the complex and chronic presentation of many of the participants, certain people
did report improvements in outcomes at the 4-week post assessment time point with the highest
proportion of participants demonstrating improvement in the SF 36 PCS (48.6%) but the lowest
proportion of participants having improvements in the NPRS (11.5%). A variety of different
sociodemographic, psychological, clinical and other variables were associated with success or
improvement in each respective outcome. However, the results suggest that there may be a
potential mechanism of reassurance that occurs during the spinal triage assessment process as
those with higher psychological distress (as measured by the Fear Avoidance Beliefs
Questionnaire and the Distress and Risk Assessment Measure) were more likely to improve on
certain outcomes (ie perceived function and SF-36 v2 PCS).
7.3 Overall Strengths and Limitations
The main strength of the work described in this dissertation relates to the comprehensive
inclusion of variables of interest beyond clinical factors and basic demographics and the
incorporation of multiple multidimensional outcome measures recommended by experts in the
field of back pain research. (3,4) Another strength is the inclusion of both quantitative and
qualitative data analysis and interpretation which provides a more holistic picture of the potential
impacts of the spinal triage program.
The absence of a control or comparison group is the main limitation of this work.
Without a control group, we are unable to infer program effectiveness of patient and provider
outcomes, financial costs or wait times compared to usual care pathways. Also, the spinal triage
assessment program arose from a longstanding collaborative relationship between the surgeons
and the physiotherapy clinic, and, thus, may not be applicable to other settings, patients and/ or
health care providers.
7.4 Implications and Future Directions
Even though the spinal triage service described and evaluated in this work is relatively
specialized and unique, the findings of this dissertation will have implications for further
research, practice and policy.
This aims of this dissertation were primarily exploratory and further research is needed to
more fully understand the longer term impacts that a spinal triage service delivered by PT’s can
182
have as well as the potential mechanisms by which improvements occurred. Further study
examining outcomes and predictors of success at 6 and 12 months following the assessment is
ongoing. We will then be able to ascertain whether short-term improvements following the
assessment were sustainable or not and which factors may impact sustainability. Determining
whether or not participants undertook and/ or had access to the health care recommendations
made in the assessment will likely be an important consideration in evaluating longer-term
outcomes. The main role of the spinal triage program is to provide management
recommendations to referring primary care providers. Thus, given that the triage program may
re-direct the type of care that people receive and not deliver that care per se, determining
potential “modifiable” predictors of deterioration (such as access to care) may help to alert health
care providers and policy makers to gaps in optimal care pathways that may ultimately impact
patient outcomes.
Although there has been little published research in the area of spinal triage by
physiotherapists, in response to health care system demands these types of programs are starting
to emerge. For example, the Saskatchewan Spinal Pathway (5) is a province-wide publically
funded initiative that includes specially trained physiotherapists providing a triage similar to that
described in this work. As this is a newly implemented program, access to a control or
comparison group in a comprehensive staged evaluation is much more viable. A similar
evaluation model to what was used in this dissertation, with the addition of a control group,
would provide much more robust evidence of the effectiveness of the role of physiotherapists in
spinal triage.
Furthermore, the model of evaluation described in this dissertation could be used as a
guide to investigate the impact of physiotherapists (or other health care professionals) in non-
traditional triage roles outside of management of spinal problems. The area of urogynecology,
for example, is one such area where physiotherapists with specialized training in the area of
pelvic floor disorders would likely have a valuable contribution in a surgical triage role. The
following progressive steps could be used to comprehensively evaluate such a role: 1) evaluating
or demonstrating adequate concordance between the assessing PTs and surgeons in triage
categorization and management recommendations, 2) evaluating a variety of patient relevant
outcomes including satisfaction, 3) ascertaining the acceptance of this new role through
evaluation of referring care provider satisfaction, and 4) examining which factors are associated
183
with improved or deteriorating outcomes in order to highlight both modifiable and contextual/
environmental factors that may impact outcomes.
Finally, in an era of health care reform, particularly in the area of primary care services,
exploring and evaluating new and emerging roles for physiotherapy, such as in spinal triage, can
be used to “sell” physiotherapy as an essential primary care services to policy makers. (6)
Although there has been much discussion in Canada about the need for interprofessional teams in
primary care service delivery models, (7) the involvement of physiotherapists in such teams
(and health professions outside of medicine and nursing for that matter) is exceedingly rare. (8)
Thus, the results of this dissertation can serve to highlight one aspect of how the physiotherapists
are key health care providers in the provision of holistic integrated primary care.
184
7.5 References
(1) Kersten P, McPherson K, Lattimer V, George S, Breton A, Ellis B. Physiotherapy extended
scope of practice- who is doing what and why? Physiother 2007;93:235-242.
(2) Campbell M, Fitzpatrick R, Haines A, Kinmonth A, Sandercock P, Spiegelhalter D, et al.
Framework for design and evaluation of complex interventions to improve health. BMJ
2000;321:694-696.
(3) Deyo RA, Battie M, Beurskens AJ, Bombardier C, Croft P, Koes B, et al. Outcome measures
for low back pain research. A proposal for standardized use. Spine 1998;23(18):2003-2013.
(4) Bombardier C. Outcome assessments in the evaluation of treatment of spinal disorders:
summary and general recommendations. Spine 2000;25(24):3100-3103.
(5) Fourney DR, Dettori JR, Hall H, Hartl R, McGrist MJ, Daubs MD. A systematic review of
clinical pathways for lower back pain and introduction of the Saskatchewan Spine Pathway.
Spine 2011;36(21S):S164-S171.
(6) Aiken A. Clinician's commentary on Cott et al. Physiother Can 2011;63(3):276-277.
(7) Romanow RJ. Building on values: The future of health care in Canada. Commission on the
Future of Health Care in Canada. 2002.
(8) Cott CA, Mandoda S, Landry MD. Models of integrating physical therapists into family
health teams in Ontario, Canada: challenges and opportunities. Physiother Can 2011;63(3):265-
275.
185
APPENDICES
Table of Appendices
A Ethics Certificate ………………………………………………………………… 186 B Diagnostic Classification Tool & Explanatory Notes …………………………… 187 C ICF Core Set for LBP ……………………………………………………………. 191 D Study Intake Paperwork (* with SF36 removed) ………………………………… 194 E De-identified Report Example …………………………………………………….. 205 F Satisfaction Surveys ……………………………………………………………… 207 G Summary of Bivariate Analyses and Goodness of Fit Statistics for Multivariate Models ……………………………………………………………….. 210 H Post-Hoc Power and Sample Size Estimates ……………………………………… 215 I Intellectual Property Agreement ………………………………………………….. 217
DIAGNOSTIC CLASSIFICATION QUESTIONNAIRE -Completed by assessing PT for each participant and also by second PT and surgeon for each participant in the diagnostic/ management reliability sample. - Each provider had a unique login and ID number to access a password-protected website with the online questionnaire. -Responses linked to each unique participant number Diagnostic Classification and Management: Diagnosis: Based on the clinical findings (i.e. history, symptom behavior /location, physical exam findings and imaging findings (if available)), please answer the following questions: 1. What is this client’s presenting symptoms likely due to? a) A problem in the back? Yes No b) Is it likely a medical problem (e.g. GU, systemic)? Yes No
c) Is it likely a mechanical/ degenerative problem from elsewhere (e.g. hip, knee)? Yes No - List: _________________________________________ 2. Is there likely a spinal cord or cauda equina lesion? Yes No Back pain diagnostic triage: 3. Indicate which category best fits the clinical presentation:
a) Possible serious spinal pathology Yes No b) Nerve root problem Yes No c) Non-specific back pain Yes No
188
4. Indicate what the likely source of the nerve root problem is: a) none Yes No b) discogenic Yes No c) stenosis Yes No Management Recommendations 6. Indicate what your recommended treatment plan is (check all that apply)
a) No further follow-up Yes No b) Urgent surgical consult Yes No c) Emergency surgical consult Yes No d) Referral to another specialist Yes No List: _________________ e) PT/rehabilitation (with or without PT consultant review)
Yes No
f) PT treatment and surgical referral Yes No g) Advanced Imaging (i.e. CT or MRI) Yes No h) Other: __________________________
189
Diagnostic Triage Explanatory Notes: 1. What is the back pain likely due to? a) A problem in the back - clinical presentation (i.e. history, symptom behavior and location, physical examination findings fit with a problem arising mainly from the lumbar spine region) b) A problem elsewhere - clinical presentation (i.e. history, symptom behavior and location, physical examination findings do not fit with a problem arising mainly from the lumbar spine region)
i)Is it likely a medical problem (e.g. GU, systemic)? - clinical presentation does not fit with a lumbar spine region problem and there are associated sings or symptoms that may indicate a medical and/or systemic problem
ii) Is it likely a mechanical/ degenerative problem from elsewhere (e.g. hip)?
- clinical evidence of degenerative peripheral joint disease (i.e. radiological evidence, capsular pattern of restriction, symptom presentation etc.) causing referral to low back region
2. Is there likely a spinal cord or cauda equina lesion? - presence of signs and symptoms of indicative of either spinal cord or cauda equina lesions (ie. gait disturbance, saddle anesthesia, hypereflexia, clonus, Babinski sign, Hoffman sign, difficulty with micturition, loss of anal sphincter tone or fecal incontinence) Diagnostic triage categories:
- Serious spinal pathology: - may present with back pain or nerve root pain - clinical presentation, diagnosis and management concern the underlying pathology - presence of “red flags” (usually a combination of factors may be present) -red flags: - age <20 or >55 years - significant trauma -thoracic pain -non-mechanical pain - past medical history of: carcinoma, systemic steroids, drug abuse, HIV - systemically unwell - significant weight loss - lumbar flexion severely limited - widespread neurological deficits -structural deformity
190
- erythrocyte sedimentation rate (ESR) >25 - xray- shows vertebral collapse of bone destruction - Nerve root pain: - unilateral leg pain is worse than back pain - pain generally radiates to foot or toes - numbness or paresthesia in the same distribution - nerve irritation signs - reduced straight leg raising which reproduces leg pain - motor, sensory, or reflex changes - limited to one nerve root - Non-specific/ mechanical low back pain: - clinical presentation usually age 20-55 years - pain is present in lubosacral region, buttocks and thighs - pain is mechanical in nature - varies with physical acticivty -varies with time - patient is “well” 4. Indicate what the likely source of the nerve root problem is: a) discogenic - age usually 20-55 - typical pattern of symptoms is increased symptoms with flexion activities (ie. sitting, bending) and relieved with extension (walking, standing) - radiological evidence on CT or MRI (if available) that fits with the remainder of the clinical picture - signs of nerve root irritation (e.g.. positive straight leg raise, slump or prone knee bend) and/or altered nerve conduction (i.e. fatigable weakness of key muscles, reduced or absent deep tendon reflexes, reduced or absence sensation in a dermatomal pattern) b) stenosis - age of onset usually > 50 years - typical symptom pattern is leg symptoms worse with extension activities (i.e. walking or standing) and relieved by flexion (i.e. sitting or bending) - radiological evidence of foraminal or central canal narrowing that fits with the remainder of the clinical picture
191
APPENDIX C: ICF Core Set for LBP
Categories of the component ‘body functions’: ICF Code ICF Category Title (2nd Level) b126 Temperament and personality functions b130 Energy and drive functions b134 Sleep functions b152 Emotional functions b180 Experience of self and time functions b260 Proprioceptive function b280 Sensation of pain b455 Exercise tolerance functions b620 Urination functions b640 Sexual functions b710 Mobility of joint functions b715 Stability of joint functions b720 Mobility of bone functions b730 Muscle power functions b735 Muscle tone functions b740 Muscle endurance functions b750 Motor reflex functions b770 Gait pattern functions b780 Sensations related to muscles and movement functions Categories of the component ‘body structures’: (ICF Code) ICF Category Title s120 Spinal cord and related structures s740 Structure of pelvic region s750 Structure of lower extremity s760 Structure of trunk s770 Additional musculoskeletal structures related to movement Categories in bold belong to the Brief ICF Core Set for low back pain. Categories of the component ‘activities and participation’: ICF Code ICF Category Title d240 Handling stress and other psychological demands d410 Changing basic body position d415 Maintaining a body position d420 Transferring oneself d430 Lifting and carrying objects d445 Hand and arm use d450 Walking
192
d455 Moving around d460 Moving around in different locations d465 Moving around using equipment d470 Using transportation d475 Driving d510 Washing oneself d530 Toileting d540 Dressing d570 Looking after one’s health d620 Acquisition of goods and services d630 Preparing meals d640 Doing housework d650 Caring for household objects d660 Assisting others d710 Basic interpersonal interactions d760 Family relationships d770 Intimate relationships d845 Acquiring, keeping and terminating a job d850 Remunerative employment d859 Work and employment, other specified and unspecified d910 Community life d920 Recreation and leisure Categories in bold belong to the Brief ICF Core Set for low back pain. Categories of the component ‘environmental factors’: ICF Code ICF Category Title (2nd Level) e110 Products or substances for personal consumption e120 Products and technology for personal indoor and outdoor mobility and transportation e135 Products and technology for employment e150 Design, construction and building products and technology of buildings for public use e155 Design, construction and building products and technology of buildings for private use e225 Climate e255 Vibration e310 Immediate family e325 Acquaintances, peers, colleagues, neighbours and community members e330 People in positions of authority e355 Health professionals e360 Other professionals e410 Individual attitudes of immediate family members e425 Individual attitudes of acquaintances, peers, colleagues, neighbours and community members e450 Individual attitudes of health professionals e455 Individual attitudes of other professionals
193
e460 Societal attitudes e465 Social norms, practices and ideologies e540 Transportation services, systems and policies e550 Legal services, systems and policies e570 Social security services, systems and policies e575 General social support services, systems and policies e580 Health services, systems and policies e585 Education and training services, systems and policies e590 Labour and employment services, systems and policies Categories in bold belong to the Brief ICF Core Set for low back pain.
194
APPENDIX D: Study Intake Paperwork1
PARTICIPANT GENERAL PAPERWORK Thank you for agreeing to participate in this study. Please answer the following questions to the best of your knowledge. To ensure confidentiality, please do not put your name on any of the following pages. If you have any questions about the questionnaires, please ask to speak to the study co-ordinator. About You:
1. Age: _______ 2. Gender:
Male Female
3. Current Marital Status:
Married Separated
Divorced Widowed Never Married
4. Education:
Did not complete Grade 12 High School Trade School Some University University Degree
Graduate Degree
5. Family Income: <$15,000 $15,000-29,999
$30,000-59,999 $60,000-99,999 Equal to or greater than $100,000
6. Height: _______
7. Weight: _______
1 Note that SF_36 questionnaire not included due to copyright legislation
195
8. Postal Code: ______________________ About Your Job: 9. Please check your main form of work
paid work-full time paid work-part time
unemployed housework disabled student retired
10. If employed, what is your occupation: _____________________ 10.a Are you are farmer? Yes No 11. If you are not working, is this because of your low back problem?
Yes No 11.a Do you feel your back problem is caused by your work?
Yes No About your health: 12. Please check any of the following medical conditions that you may have or have had:
Headaches Lung or breathing problems Heart problems Stomach or digestive problems Other bone and joint problems Please list where you have bone or joint problems: _____________ _____________________________________________________ Other health issues:_____________________________________
13. Please indicate your smoking status: Never smoked Used to smoke, not a smoker now Smoker
196
About your low back problem:
14. How long have you had problems with your low back (please indicate in days, months or years)? ___________________________________________________________
15. When did your current low back episode begin (please indicate in days, months
or years)? ___________________________________________________________
16. What types of treatment have you had for your low back problem?
Medication Surgery Physiotherapy Chiropractic Massage Therapy Acupuncture Exercise Therapy Other (please list): _____________________________________ _______________________________________________________
17. Please indicate what types of treatment options/ care providers are available to
you and if there are any barriers to you accessing the following treatments and/or care providers:
Not accessible due to: Available
and accessible
Cost
Wait time
Location/ travel time
Family Physician Physiotherapy Chiropractic Massage Therapy Acupuncture Other: ___________________
197
Pain Drawing Instructions: Please indicate on the diagram below where you are experiencing symptoms. Use the following symbols to indicate the type of problems you are experiencing: // . . . pain
O . . . pins and needles X . . . ache = . . . numbness
198
Numeric Pain Rating Scale
For the following questions, please consider the amount of pain you have experienced in the past 24 hours only. Current Pain: On a scale of 0-10, with 0=no pain and 10=pain as bad as it could be, how much pain do you feel right now? Please pick only one number. 0 1 2 3 4 5 6 7 8 9 10 Worst Pain: On the same scale of 0-10, how much pain did you feel when it was at it’s worst? Please pick only one number. 0 1 2 3 4 5 6 7 8 9 10 Least Pain. On the same scale of 0-10, how much pain did you feel when it was at it’s best or least? Please pick only one number. 0 1 2 3 4 5 6 7 8 9 10
Global Chronic Pain Scale Pain Intensity Items 1. How would you rate your back pain on a 0-10 scale at the present time, that is right now where 0 is ‘no pain’ and 10 is pain ‘as bad as could be’?
Pain as bad as No pain could be 0 1 2 3 4 5 6 7 8 9 10 2. In the past 6 months, how intense was your worst pain on a 0-10 scale where 0 is ’no pain’ and 10 is ‘pain as bad as could be’? Pain as bad as No pain could be 0 1 2 3 4 5 6 7 8 9 10 3. In the past 6 months, on the average, how intense was your pain rated on a 0-10 scale where0 is ’no pain’ and 10 is ‘pain as bad as could be’? (That is, your usual pain at times you were experiencing pain.)
Pain as bad as No pain could be 0 1 2 3 4 5 6 7 8 9 10
199
Disability Items 4. About how many days in the last 6 months have you been kept from your usual activities (work, school or housework) because of back pain? _______________________________________________________ 5. In the past 6 months, how much has back pain interfered with your daily activities rated on a 0-10 scale where 0 is ‘no interference’ and 10 is ‘unable to carry on any activities’?
Unable to carry No interference on any activities 0 1 2 3 4 5 6 7 8 9 10 6. In the past 6 months, how much has back pain changed your ability to take part in recreational, social and family activities where 0 is ‘no change’ and 10 is ‘extreme change’? No change Extreme change 0 1 2 3 4 5 6 7 8 9 10 7. In the past 6 months, how much has back pain changed your ability to work (including housework) where 0 is ‘no change’ and 10 is ‘extreme change’?
No change Extreme change 0 1 2 3 4 5 6 7 8 9 10 Modified Oswestry Disability Questionnaire This questionnaire has been designed to give us information as to how your back or leg pain is affecting your ability to manage in everyday life. Please answer by checking one box in each section for the statement which best applies to you. We realize you may consider that two or more statements in any one section apply but please just shade out the spot that indicates the statement which most clearly describes your problem. 1: Pain Intensity I have no pain at the moment The pain is very mild at the moment The pain is moderate at the moment The pain is fairly severe at the moment The pain is very severe at the moment The pain is the worst imaginable at the moment
200
2: Personal Care (eg. washing, dressing) I can look after myself normally without causing extra pain I can look after myself normally but it causes extra pain It is painful to look after myself and I am slow and careful I need some help but can manage most of my personal care I need help every day in most aspects of self-care I do not get dressed, wash with difficulty and stay in bed 3: Lifting I can lift heavy weights without extra pain I can lift heavy weights but it gives me extra pain Pain prevents me lifting heavy weights off the floor but I can manage if they are
conveniently placed eg. on a table Pain prevents me lifting heavy weights but I can manage light to medium weights
if they are conveniently positioned I can only lift very light weights I cannot lift or carry anything 4: Walking Pain does not prevent me walking any distance Pain prevents me from walking more than 2 kilometres Pain prevents me from walking more than 1 kilometre Pain prevents me from walking more than 500 metres I can only walk using a stick or crutches I am in bed most of the time 5: Sitting I can sit in any chair as long as I like I can only sit in my favourite chair as long as I like Pain prevents me sitting more than one hour Pain prevents me from sitting more than 30 minutes Pain prevents me from sitting more than 10 minutes Pain prevents me from sitting at all 6: Standing I can stand as long as I want without extra pain I can stand as long as I want but it gives me extra pain Pain prevents me from standing for more than 1 hour Pain prevents me from standing for more than 30 minutes Pain prevents me from standing for more than 10 minutes Pain prevents me from standing at all
201
7: Sleeping My sleep is never disturbed by pain My sleep is occasionally disturbed by pain Because of pain I have less than 6 hours sleep Because of pain I have less than 4 hours sleep Because of pain I have less than 2 hours sleep Pain prevents me from sleeping at all 8: Social Life My social life is normal and gives me no extra pain My social life is normal but increases the degree of pain Pain has no significant effect on my social life apart from limiting my more energetic interests (e.g. sport) Pain has restricted my social life and I do not go out as often Pain has restricted my social life to my home I have no social life because of pain 9: Traveling I can travel anywhere without pain I can travel anywhere but it gives me extra pain Pain is bad but I manage journeys over two hours Pain restricts me to journeys of less than one hour Pain restricts me to short necessary journeys under 30 minutes Pain prevents me from traveling except to receive treatment 10: Employment/ Homemaking My normal homemaking/job activities do not cause pain My normal homemaking/job activities increase my pain, but I can still perform all
that is required of me I can perform most of my homemaking/job duties, but pain prevents me from
performing more physically stressful activities (eg, lifting, vacuuming). Pain prevents me from doing anything but light duties Pain prevents me from doing even light duties. Pain prevents me from performing any job or homemaking chores.
202
Fear Avoidance Belief Questionnaire
Here are some of the things which other patients have told us about their pain. For each statement please circle any number from 0 to 6 to say how much physical activities such as bending, lifting, walking or driving affect or would affect your back pain. Completely
Disagree Unsure Completely
Agree 1. My pain was caused by physical activity.
0
1
2
3
4
5
6
2, Physical activity makes my pain worse.
0
1
2
3
4
5
6
3. Physical activity might harm my back.
0
1
2
3
4
5
6
4. I should not do physical activities which (might) make my pain worse.
0
1
2
3
4
5
6
5. I cannot do physical activities which (might) make my pain worse.
0
1
2
3
4
5
6
The following statements are about how your normal work affects or would affect your back pain. Do not answer any statements that are not applicable to you. Completely
Disagree Unsure Completely
Agree 6. My pain was caused by my work or by an accident at work.
0
1
2
3
4
5
6
7. My work aggravated my pain.
0
1
2
3
4
5
6
8. I have a claim for compensation for my pain.
0
1
2
3
4
5
6
9. My work is too heavy for me.
0
1
2
3
4
5
6
10. My work makes or would make my pain worse.
0
1
2
3
4
5
6
11. My work might harm my back.
0
1
2
3
4
5
6
12. I should not do my normal work with my present pain.
0
1
2
3
4
5
6
13. I cannot do my normal work with my present pain.
0
1
2
3
4
5
6
14. I cannot do my normal work until my pain is treated.
0
1
2
3
4
5
6
15. I do not think that I will be back to my normal work within 3 months.
0
1
2
3
4
5
6
16. I do not think that I will ever be able to go back to that work.
0
1
2
3
4
5
6
203
Modified Zung Depression Index Please indicate for each of these questions, which answer best describes how you have been feeling lately.
Rarely or none of the time (less than 1 day per week)
Some or little of the time (1-2 days per week)
A moderate amount of the time (3-4 days per week)
Most of the time (5-7 days per week)
1. I feel downhearted and sad 2. Morning is when I feel best 3. I have crying spells or feel like it 4. I have trouble getting to sleep at night 5. I feel that nobody cares 6. I eat as much as I used to 7. I still enjoy sex 8. I notice I am losing weight 9. I have trouble with constipation 10. My heart beats faster than usual 11. I get tired for no reason 12. My mind is as clear as it used to be 13. I tend to wake up too early 14. I find it easy to do the things I used to 15. I am restless and can’t keep still 16. I feel hopeful about the future 17. I am more irritable than usual 18. I find it easy to make a decision 19. I feel quite guilty 20. I feel that I am useful and needed 21. My life is pretty full 22. I feel that others would be better off if I were dead.
23. I am still able to enjoy the things I used to
204
Modified Somatic Perceptions Questionnaire Please describe how you have felt during the PAST WEEK by marking a check mark (√) in the appropriate box. Please answer all questions. Do not think too long before answering. Not at
all A little, slightly
A great deal, quite a bit
Extremely, could not have been worse
Heart rate increase Feeling hot all over Sweating all over Sweating in a particular part of the body Pulse in neck Pounding in head Dizziness Blurring of vision Feeling faint Everything appears unreal Nausea Butterflies in stomach Pain or ache in stomach Stomach churning Desire to pass water Mouth becoming dry Difficulty swallowing Muscles in neck aching Legs feeling weak Muscles twitching or jumping Tense feeling across forehead Tense feeling in jaw muscles
205
APPENDIX E: De-identified Report Example
Participant #: XXXX INITIAL ASSESSMENT AGE: 54 OCCUPATION: farmer AREA OF SYMPTOMS: right lumbosacral and right groin/lateral hip pain Assessment Details: Routine Specific Question General Health: Positive MI 8 or 9 years ago Weight: Negative Meds: Positive ASA, Ranitidine, Celebrex, Flexeril, Cialis, Ramipril XRays: Taken Lx report - July 09 normal. Right hip April 09 - mild subarticular sclerosis in the acetabulum and early joint space narrowing. Unchanged since May 07. Other: Positive has a left THR more than 10 years ago. Specific Special Questions Thecal Pressure Symptoms: Negative Bilateral Neuro Symptoms: Negative Bowel & Bladder Function: Negative Saddle Anesthesia: Negative Rheumatoid Arthritis: Negative both parents have arthritis, but not sure what type Steroid Use: Negative Coagulation Disorder: Positive is on ASA. Behaviour of Symptoms Time of Day: n/a Pattern: Inflammatory and Mechanical. Relieved by: sitting Severity: 6-7/10 Duration: Constant. Functional Difficulties: Severe restrictions Task: using a cane to walk due to pain in groin, standing is really difficult Present History: Flare up Lx pain spring 2009. Sore in lx and right groin/lateral hip since. Uses cane for walking due to amount of pain. Sitting is fine. Upright causes right groin pain. When on anti-inflammatories, hip/groin pain is tolerable, and this is aware of back pain. THR left approx 13 years ago. Past History: Positive similar flare up in Lx in spring 2008 too. Scan Reveals Abnormality In Lx, right hip Architectural Examination: Abnormal flattened lx
206
Neurological Examination Key Muscles: Normal L2-S1 normal bilateral Sensations: Normal light touch LE’s Reflexes: Normal AJ, KJ, L4,5 DTR and babinski bilateral Neural Dynamic Tests: Normal 80 degrees bilateral SLR Range of Motion FLEX: Normal EXT: Abnormal 75% LSF: Normal RSF: Abnormal 75% LR: Abnormal 60% RR: Abnormal 60% Segmental Motion Tests: Abnormal right L2-S1 hypomobile into flexion, more so and L4- S1. Left L5-S1 hypomobile into extension. Hypomobile Left L5-S1 into flexion. Directional Stress Tests: Traction: Not Appropriate to Assess Compression: Not Appropriate to Assess Posterior: Not Appropriate to Assess Anterior: Not Appropriate to Assess Torsional: Not Appropriate to Assess Lateral: Not Appropriate to Assess Muscle Testing: Not Appropriate to Assess SIJ Examination: Abnormal mild hypomobility left caudal ilium glide noted. Peripheral Vascular Examination: Normal Other Tests When Applicable Right hip: flexion 100, very painful right groin. Flexion/add and flexion/abd markedly limited and painful, extension limited to neutral and painful, both quadrants markedly limited and painful. Internal rotation mildly-moderately limited and painful.
207
APPENDIX F: Satisfaction Surveys
Participant Satisfaction
Please answer the following questions regarding your satisfaction with the Wall Street Spinal Assessment Service. Any additional comments you have would also be greatly appreciated.
1. How would you rate your satisfaction with the overall service you received from the health care providers at the Wall Street Spinal Assessment Service?
Very Satisfied Somewhat satisfied Neither satisfied nor dissatisfied Somewhat dissatisfied Very dissatisfied
2. How would you rate your satisfaction with the recommendations that were made
by the Wall Street Spinal Assessment Service health care providers to your doctor?
Very Satisfied Somewhat satisfied Neither satisfied nor dissatisfied Somewhat dissatisfied Very dissatisfied
3. Please add any additional comments regarding your satisfaction here: __________________________________________________________________________________________________________________________________________________________________________________________________________________________________________________________________________________________________________________________________________________________________________________________________________________________________________________________________________________________________________________________________________________________________________________________________________________________________________________________________________________________________________________________________________________________________________________________________________________________________________________________________________________________________________________________________________________________________
208
MEMO: Wall Street Spinal Assessment Service Research / Satisfaction Questionnaire Your patient has consented to participate in a study evaluating the outcomes associated with the Wall Street Assessment Service. This is a research project that is being done by Bourassa and Associates Rehabilitation Centre and Wall Street Orthopaedic Surgeons in partnership with the following researchers: Dr. Punam Pahwa Dr. Bonnie Janzen Brenna Bath (Co-Supervisor, Associate Professor) Dept. of Community Health and Epidemiology University of Saskatchewan Email: [email protected]
(Co-Supervisor, Assistant Professor) Dept. of Community Health and Epidemiology University of Saskatchewan Email: [email protected]
(PhD Candidate) Dept. of Community Health and Epidemiology University of Saskatchewan Email: [email protected]
This research project has been approved on ethical grounds by the University of Saskatchewan Behavioural Sciences Research Ethics Board on July 30th, 2009. We value your opinions and feedback, thus one of the outcomes we are evaluating is referring practitioner satisfaction. We would appreciate if you would complete the short satisfaction questionnaire attached and fax it back to our office at: (306) 975-0109; or fax toll free: 866-340-0109 . Please note that there is no name on the questionnaires (yours or your patients) in order to maintain confidentiality of responses. Thank you for your time and interest. Sincerely, Richard Bourassa
Subject #: _______________________
209
Primary Care Provider Satisfaction
Please answer the following questions regarding your satisfaction with the Wall Street Spinal Assessment Service. Any additional comments you have would also be greatly appreciated.
1. How would you rate your satisfaction with the recommendations that were made by the Wall Street Spinal Assessment Service regarding your patient?
Very Satisfied Somewhat satisfied Neither satisfied nor dissatisfied Somewhat dissatisfied Very dissatisfied
2. Please add any additional comments regarding your satisfaction with our service here:___________________________________________________ __________________________________________________________________________________________________________________________________________________________________________________________________________________________________________________________________________________________________________________________________________________________________________________________________________________________________________________________________________________________________________________________________________________________________________________________________________________________________________________________________________________________________________
210
APPENDIX G: Summary of Bivariate Analyses and Goodness of Fit Statistics for Multivariate Models
Table G-1. Summary of Bivariate Analysis for NPRS_MIC Variable NPRS
Improvement N (%)
NPRS no improvement N (%)
P valuea
Education: grade 12 or less 3/12 (25.0) 43/92 (46.7) .219 Rural 6/12 (50.0) 65/92 (70.7) .148 LBP duration 6 months or less 3/12 (25.0) 11/91 (12.1) .208 Baseline ODI: Minimal (0-20) 3/12 (25.0) 11/92 (12.0) .044 Moderate (21-40) 4/12 (33.3) 48/92 (52.2) Severe (41-60) 2/12 (16.7) 28/92 (30.4) Crippled (61-100) 3/12 (25.0) 5/92 (5.4) NPRS>5 (median) 8/12 (66.7) 43/92 (46.7) .231 FAB_PA>15 (median) 8/12 (66.7) 39/92 (42.4) .133 aOnly variables that had p<.25 shown. Note: No independent variables correlated >.5 level; Baseline NPRS (median value) not correlated to dependent NPRS outcome (r=.127, p=.198)
211
Table G-2. Summary of Bivariate Analysis for ODI_MIC Variable ODI Improvement N
(%) ODI no improvement N (%)
P valuea
Female 8/25 (32.0) 47/83 (85.5) .031
Married 22/25 (88.0) 59/83 (71.1) .087
Rural 21/25 (84.0) 54/83 (65.1) .086
Smoking: Never smoked 15/25 (60.0) 28/83 (33.7) .060
Used to smoke 6/25 (24.0) 36/83 (43.4)
Smoker 4/25 (16.0) 19/83 (22.9)
LBP duration: 6 months or less 7/25 (28.0) 8/82 (9.8) .021
LBP current episode: 6 months or
less
15/25 (60.0) 29/83 (34.9) .025
Not working due to LBP 7/25 (28.0) 13/83 (15.7) .164
Surgeon referral Only 1/25 (4.0) 14/83 (16.9) .184
Referal to another specialist 5/25 (20.0) 4/83 (4.8) .030
PCS <35 (median) 19/25 (76.0) 38/83 ( 45.8) .008 aOnly variables that had p<.25 shown. Note: Baseline ODI(cat) correlated with PCS (median), r=.555 (p<.001); Baseline ODI(cat) correlated with ODI_MIC, r=.420, (<.001), thus baseline ODI(cat) not included in the multivariate model
212
Table G-3. Summary of Bivariate Analysis for PCS_MIC Variable PCS Improvement
N (%) PCS no improvement N (%)
P valuea
LBP current episode: 6 months or
less
25/52 (48.1) 19/55 (34.5) .155
Smoking: Never smoked 22/52 (42.3) 21/55 (38.2) .022
Baseline PCS <35 (median) 32/52 (61.5) 25/55 (45.5) .096 a Only variables that had p<.25 shown. Note: Baseline PCS correlated with baseline ODI, r=.555 (p<.001); Baseline PCS (median value) not correlated to PCS_MIC (r=-.239, p=.013)
213
Table G-4. Summary of Bivariate Analysis for MCS_MIC Variable MCS Improvement
N (%) MCS no improvement N (%)
P valuea
Age<50 18/33 (54.5) 31/74 (41.9) .225
Female 20/33 (60.6) 34/74 (45.9) .161
Married 28/33 (84.8) 52/74 (70.3) .109
Co-morbidities 2 or more 15/32 (45.5) 47/74 (63.5)) .081
LBP caused by work 8/33 (24.2) 30/74 (40.5) .104
Any imaging 16/33 (48.5) 22/74 (29.7) .061
Baseline NPRS >5 9/33 (27.3) 42/74 (56.8) .005
FAB_work>14 12/33 (36.4) 37/74 (50.0) .191
DRAM: at risk or distressed 25/33 (75.8) 46/74 (62.2) .169
Baseline MCS <48 (median) 23/33 (69.7) 30/74 (40.5) .005 aOnly variables that had p<.25 shown. Note: Baseline MCS correlated with DRAM, r=.521 (p<.001); Baseline MCS (median) not correlated to MCS_MIC (r=-.269, p<.001)
214
Table G-5. Summary of Bivariate Analysis for Participant Satisfaction Variable Satisfieda N (%) Not Satisfied
N (%) P valueb
Age<50 44/83 (53.0) 5/25 (20.0) .004
Female 47/83 (56.6) 8/25 (32.0) .031
Married 59/83 (71.1) 22/25 (88.0) .115
Education: grade 12 or less 40/83 (48.2) 7/25 (28.0) .074
DRAM: at risk or distressed 59/83 (71.1) 13/25 (52.0) .076
PCS_dichot >35 43/83 (51.8) 8/25 (32.0) .082 aSomewhat or very satisfied on both items of satisfaction survey. bOnly variables that had p<.25 shown. Note: MRI/ CT Imaging correlated with any imaging, r=.865 (p<.001); Baseline PCS correlated with baseline ODI, r=.555 (p<.001) Table G-6. Summary of goodness of fit statistics for multivariate models
APPENDIX H: Post-Hoc Power and Sample Size Estimates
Table H-1 Post hoc power analysis for pre-specified p0=0.50 and α=0.05 based on observed sample Variable Observed
proportion improved based on MIC (p1)
Observed Sample Size
Assuming 50% improvement (p0)
Post-hoc power
NPRS_MIC 0.115 104 .05 .10 .20 0.50
57% 6% 73% 100%
ODI_MIC 0.231 108 .05 .10 .20 0.50
100% 96% 10% 100%
SF-36 PCS_MIC
0.486 107 .05 .10 .20 0.50
100% 100% 100% 5%
SF-36 MCS_MIC
0.308 107 .05 .10 .20 0.50
100% 100% 70% 88%
216
Table H-2: Sample size required for type-I error = 0.05, power = 0.80, and for selected pre-specified values of p0 Variable p1 p0 Difference=d Required Sample Size
NPRS_MIC 0.115 0.05 0.10 0.20 0.50
0.07 0.02 0.09 0.39
114 3256 153 11
ODI_MIC 0.231 0.05 0.10 0.20 0.50
0.18 0.13 0.03 0.27
19 52 1348 25
SF-36 PCS_MIC 0.486 0.05 0.10 0.20 0.50
0.44 0.39 0.29 0.01
4 7 18 9998
SF-36 MCS_MIC 0.308 0.05 0.10 0.20 0.50
0.26 0.21 0.11 0.19
10 22 118 51
Above tables based on the following formula:2
n =z! p0 (1! p0 ) ! z" p1(1! p1)
p1!p0
"
#$$
%
&''
2
p1 is the proportion improved in the study population assumed not to be different from the pre-specified value of p0, proportion improved in general population. For type-I error = 0.05 and power = 0.80, for pre-specified value of p0, a sample of size” n” required is given in Table I-2.
2 Colton T. Statistics in Medicine. 1974. Little, Brown and Company, Boston.
This Intellectual Property Agreement (this “Agreement”) is made the 10th day of June, 2009 among: BOURASSA AND ASSOCIATES REHABILITATION CENTRE, 109 - 294 Venture Crescent, Saskatoon, SK, S7K 6M1, Telephone: (306) 665-1962, Facsimile: (306) 975-0109 (the “Company”); and
UNIVERSITY OF SASKATCHEWAN, Research Services, 110 Gymnasium Place, Box 5000 RPO University, Saskatoon, SK S7N 4J8, Telephone: (306) 966-2974, Facsimile: (306) 966-8597 (the “University”); and
BRENNA BATH, 511 Albert Avenue Saskatoon, SK S7N 1G4, Telephone: (306) 343-9984 (the “Student”);
each referred to hereinafter as a “Party” and collectively as the “Parties.” WHEREAS: A. The Student is a student of the University’s College of Graduate Studies and Research who is, or is
proposed to be, engaged in a program of research and study supervised by Dr. Bonnie Janzen and Dr. Punam Pahwa of the University’s College of Medicine, Department of Community Health & Epidemiology, with a view to satisfying the University’s requirements for an award to the Student of a postgraduate degree.
C. The Company wishes to support her performance of the said program of research and study (the “Program”) and, by this Agreement, the Parties wish to establish the terms of such support.
NOW THEREFORE, in consideration of the premises and mutual obligations hereinafter described, the sufficiency of which is hereby acknowledged, the Parties hereto covenant and agree as follows. 1. The premises and mutual obligations hereinafter described shall become effective if and when:
(a) the Parties agree on the nature of the Program research in accordance with Section 2 hereof.
2. The nature of the Program research will be negotiated among the Parties and, once agreed, no Party shall undertake to change the nature of the Program research without the consent of the other Parties, which consent shall not be unreasonably withheld or delayed.
3. The Parties acknowledge that, as further described herein below, both the University and the Company will support the Program by: (a) permitting Student use of certain background intellectual properties and certain confidential or
proprietary information of each of them; (b) permitting Student access to research facilities, equipment and other resources of each of them;
and (c) providing on-going Student supervision.
218
4. The Company will make available to the University and the Student the services of its designate, Anne Marie Graham, to assist Dr. Bonnie Janzen and Dr. Punam Pahwa to supervise the Student’s performance of the Program.
5. The Company is not contributing funds to pay for a student scholarship. If the Sponsor agrees to provide to the University funds to pay for a student scholarship, this Agreement will be amended identify the amount of funds and payment terms as a part of Appendix “A”.; such amount being inclusive of applicable University indirect costs (the “Funds”). The University will receive and administer said funds in accordance with the terms of this Agreement and University policy.
6. The Company will make available to the Student its research facilities, equipment and other resources so as to permit the Student to spend at least twenty per cent (20%) of her time performing Program research using such facilities, equipment and other resources; such access to be provided through completion of the student’s Program research, which may extend beyond the term of this Agreement.
7. For the purposes of this Agreement “Confidential Information” means information, including, without limitation, trade secrets, formulas, designs, prototypes, compilations of information, data, materials, methods, processes, reports and software programs that: (a) is known by or proprietary to the University or the Company (each a “Discloser”); (b) is disclosed or otherwise made available to the Student by a Discloser during the term of the
Program; (c) derives economic value, actual or potential, by being generally not known to, or not readily
ascertainable by proper means by, other persons who can obtain economic value from its disclosure or use;
(d) is the subject of efforts by the Discloser that are reasonable under the circumstances to maintain its confidential nature; and
(e) is identified by the Discloser to the Student as being confidential to the Discloser.
8. The Student acknowledges that her access to and use of University and Company facilities, equipment and other resources will likely result in receipt of and/or access to Confidential Information. The Student shall not disclose Confidential Information to any person or entity except authorized employees or agents of the Discloser without the prior written consent of the Discloser.
9. Notwithstanding the foregoing, this Agreement imposes no obligations on the Student to maintain the secrecy and/or confidentiality of Confidential Information that: (a) was known to the Student prior to any disclosure from or through the Discloser; (b) is or becomes publicly known through no wrongful act on the part of the Student; (c) is rightfully received by the Student from a party other than the Discloser without restriction and
without breach of this Agreement; or (d) is independently developed by the Student, without reference to any disclosure from or through
the Discloser.
10. The Student shall disclose to the University which shall, in turn, disclose to the Company, each and every invention, discovery and improvement, whether or not patentable, that is conceived, reduced to practice or otherwise created by the Student, solely or jointly with others, during the term of the Program (each an “Invention”). Furthermore, the Student will provide to the University and the Company regular reports on the progress of her Program research and will keep on Company premises a copy of any data and record books acquired or written by her respecting Program research performed using the Company’s facilities, equipment or other resources.
11. The University shall ensure that the Student is afforded rights in and to intellectual properties created through her performance of Program research, solely or jointly with others, equivalent to the rights in
219
and to intellectual properties created by other students of the University engaged in programs of post-graduate research and study. Specifically, in accordance with University policies of general effect, the Student shall assign the entirety of her rights, title and interest in and to all Inventions so created to the University in return for a right to participate equitably with other creators of the same (if any) in the net revenues of the University attributable to commercialization of such Inventions.
12. Any Invention created by the Student jointly with an employee or agent of the Company shall be owned by the University and the Company jointly, and the interests of the University and the Company therein shall be in proportion to contributions of their respective employees, agents and students to such creation. Subject to Section 13, the University and the Company agree to negotiate in good faith and otherwise collaborate with a view to commercializing any jointly held Invention for the benefit of each of them, recognizing the contributions and other interests of each of each of them.
13. The Parties acknowledge and agree that: (a) the granting of the Student's post-graduate degree will not be delayed by a desire of the
University or the Company to keep research results confidential; and (b) publication by the Student of reports and papers describing Program research and results thereof,
including the Student’s research thesis, will not be unreasonably delayed by a desire of the University or the Company to keep research results confidential and, in any event, will not be delayed in any manner inconsistent with relevant University policies of general effect.
14. The Company shall be entitled to receive from the University a royalty-fee, non-exclusive license in and to any Invention created through the performance of Program research by the Student, solely or jointly with others, exercisable for internal research purposes only.
15. No Party shall assign any of its rights or obligations under this Agreement without the prior written consent of the other Parties. This Agreement shall bind and enure to the benefit of each Party and its respective successors and permitted assigns. This Agreement constitutes the entire understanding among the Parties and supersedes all previous understandings, agreements, and representations, written and oral, concerning the subject matter hereof. No cancellation, amendment, or other change to this Agreement, or waiver of any right or remedy herein provided, shall be effective for any purpose unless set forth in a writing duly executed by or on behalf of each Party to be bound thereby. No waiver of or failure to assert any right or remedy respecting any event, act or omission on one or any number of occasions, shall be deemed a waiver of such right or remedy in respect of a event, act or omission on any other occasion. This Agreement shall be governed by and interpreted under the laws of the Province of Saskatchewan without giving effect to the choice of laws principles thereof.
16. The University warrants and represents that this Agreement is consistent with its policies and procedures governing research, intellectual property and graduate studies.
AGREED TO AND ACCEPTED BY: UNIVERSITY OF SASKATCHEWAN Per: _____________________________________ ____________________ for Chair, Board of Governors Date
Per: _____________________________________ ____________________ for Secretary, Board of Governors Date
Acknowledged by: _____________________________________ Dr. Bonnie Janzen, Academic Co-Supervisor Department of Community Health & Epidemiology, College of Medicine
220
________________________________________ Dr. Punam Pahwa, Academic Co-Supervisor Department of Community Health & Epidemiology, College of Medicine _____________________________________ Dean, College of Graduate Studies & Research
BOURASSA AND ASSOCIATES REHABILITATION CENTRE Per: _____________________________________ ____________________ Anne Marie Graham, Partner: Date
STUDENT _____________________________________ ____________________ Brenna Bath Date _____________________________________ Name (print): Witness to signature of Student