BIOREACTOR MODELLING & CONTROL 2013 ENGINEERING THESIS By Luke Richards A report submitted to the School of Engineering and Information Technology, Murdoch University in partial fulfilment of the requirements for the degree of Bachelor of Engineering.
Transcript
BIOREACTOR MODELLING & CONTROL
2013 ENGINEERING THESIS
By Luke Richards
A report submitted to the School of
Engineering and Information Technology,
Murdoch University in partial fulfilment of
the requirements for the degree of
Bachelor of Engineering.
i
Abstract Bioreactors provide controlled environments for biological processes, and find many uses in
industrial and research settings. Such bioprocesses often involve the cultivation of living cells which
necessitates strict control of a range of biologically important parameters (e.g. temperature, pH,
aeration) to ensure optimal growth and product yield. Bioreactors are therefore equipped with
instrumentation to monitor and control a range of variables that allows precise regulation of the
dynamic environment within the reactor vessel.
This project involved the use of the Murdoch University bioreactor to parameterise a growth model
of baker’s yeast (Saccharomyces cerevisiae). The initial component of the project involved the setup,
calibration and testing of the bioreactor and related instrumentation in a new, dedicated bioreactor
laboratory. This exercise revealed several shortcomings of the bioreactor equipment which required
the development of alternative methodology. The most significant of these was that the oxygen
measurement channel of the exit gas analyser functioned incorrectly, and this apparatus could
therefore not be used for online growth estimation.
An alternative method for measuring oxygen uptake was developed that involved the use of the
reactor dissolved oxygen probe. This was demonstrated to have reasonable functionality during
bioreactor runs but suffered limitations, and the repair or replacement of the gas analyser is a
principal recommendation of this thesis.
Model parameterisation using the bioreactor was attempted using both continuous and fed-batch
culture methods. For the former, contamination of the feed reservoir resulted in abandonment of
the experiment and the method was not repeated due to cost and time constraints. The fed-batch
experiments were also unsuccessful, and the factors responsible were determined to be related to
growth medium composition and the secondary metabolic pathways inherent to the yeast.
Despite incompletion of the second objective, the project highlighted several key issues related to
bioreactor monitoring and control, yeast metabolism and experimental design. The Murdoch
bioreactor was demonstrated to be suitable for the three primary modes of bioreactor operation,
namely batch, fed-batch and continuous culture, although modifications to methodology are
required for successful modelling applications of these. Numerous recommendations for the
improvement of bioreactor operation have been made, and several potential future projects have
been identified.
ii
Acknowledgements Many elements of this project would not have been possible if not for the valuable advice and/or
technical assistance provided by Linh Vu, Graeme Cole, John Boulton, Iafeta “Jeff” Laava, Ken
Seymour, Will Stirling and Chris Wallis. Your help was much appreciated, thank you.
Regards,
Luke
iii
Table of Contents Abstract ........................................................................................................................................ i
Acknowledgements...................................................................................................................... ii
Table of Contents ........................................................................................................................ iii
Abbreviations ............................................................................................................................. vi
List of Figures .............................................................................................................................. vi
List of Tables ............................................................................................................................... vi
Engineering, Australia). Bioreactor instrumentation was
interfaced with a computer via A/D hardware and a data
acquisition module (6B series, National Instruments, USA),
and controlled using LabVIEW software (Version 8.5,
National Instruments, USA). A pre-existing LabVIEW
program was available for bioreactor control, and a range of
modifications were made to facilitate experimental work.
These are documented in Section 3.12.2.
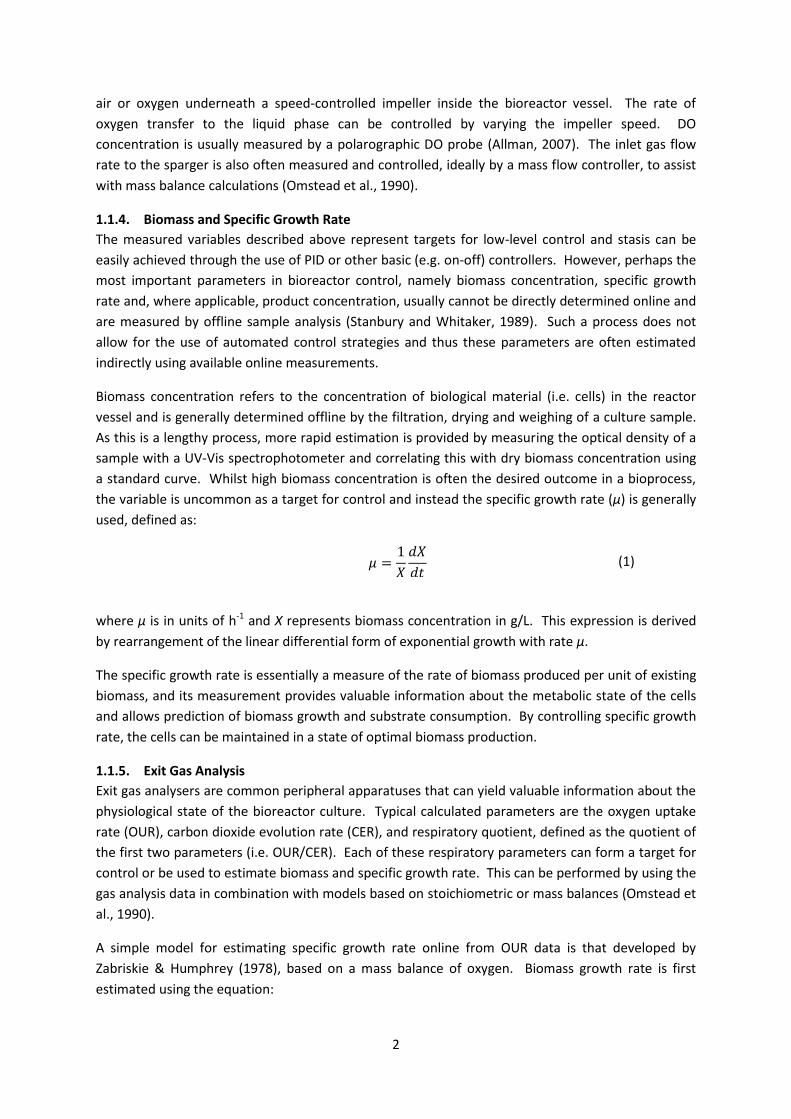
The bioreactor consisted of a glass-walled vessel mounted in
a stainless steel enclosure (see Figure 3.1). The vessel had a
5L capacity, and contents were sterilisable in situ (for
procedure, see Section 3.6). Several apparatuses were
mounted in the interior: an impeller, equipped with three
Rushton turbines; two 1200W heating coils mounted in
stainless steel towers; two coils for flow of cooling water; a
resistance temperature detection (RTD) probe for
temperature measurement; steam-sterilisable probes for DO
and pH measurement (models InPro6000 and 405-DPAS
respectively, Mettler Toledo, USA); and a gas sparger for aeration. The vessel top plate contained
threaded ports for fittings to facilitate sampling, inoculation, and additions of feed, titrant and
antifoam.
The impeller speed was controlled by a variable speed drive
controller (VLT5000, Danfoss, Germany). Heating coils were
powered by a thyristor. Inlet gas flow was controlled by an
electronic mass flow controller (5850E, Brooks, USA) attached
to the gas sparger, and a three-way valve allowed selection of
compressed air or pure oxygen. Digital-display transmitters
for pH and DO measurement (2100 and 4100 respectively,
Mettler Toledo, USA) were mounted on the bioreactor back
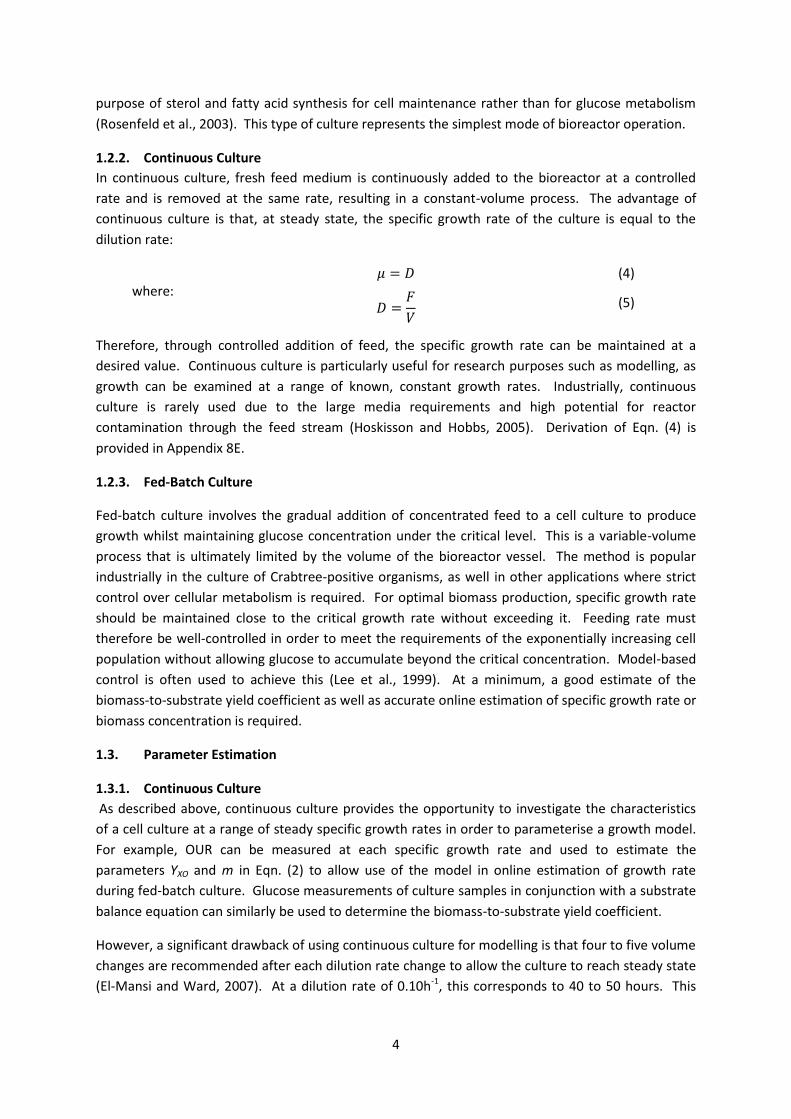
panel. The A/D converters and communication hardware,
thyristor and variable speed drive controller were mounted
behind the bioreactor front panel, as shown in Figure 3.2.
Three peristaltic pumps (313U, Watson Marlow, USA) were
also interfaced with the computer via the bioreactor
communication hardware. Two mass balances (Explorer,
OHAUS, USA) and a gas analyser (NGA2000, Rosemount,
USA) were interfaced directly with the computer through
separate communication ports.
Figure 3.1. Murdoch bioreactor. Back panel has displays for pH and DO transmitters. Impeller drive, port fittings and condenser are attached in top plate. Front panel is mounted with mains, impeller and heater switches. Glass doors are on each side to enclose the vessel.
Figure 3.2. Bioreactor electronics. 6B module and A/D hardware on left, variable speed drive controller at top right, thyristor at bottom right.
8
3.2. Gas Analysis and Oxygen Uptake Measurement
Exit gas from the bioreactor was passed through a water-
cooled condenser and a moisture-scrubbing column (Drierite,
USA) before entering the gas analyser (see Figure 3.3). The gas
analyser was equipped with channels for paramagnetic oxygen
and infrared carbon dioxide analysis. However, as the oxygen
measurement channel was found to be faulty, an alternative
method for monitoring culture oxygen uptake was devised that
involved periodic interruption of the inlet gas flow and
subsequent quantitation of OUR by measuring the slope of DO
decline. This is further discussed in Section 4.1.4.
Implementation of this method required modifications to the
LabVIEW control program, discussed in Section 3.12.2.
3.3. pH Measurement
A steam-sterilisable, gel-filled pH electrode was available for
bioreactor pH monitoring. However, during instrument
calibration, the pH probe was noted to be faulty (see Section
4.1.3). A new probe was ordered, but the delivery time of
several weeks required an interim solution to monitor pH
levels.
A “pH recycle” was constructed to allow the temporary use of a small pH probe (PBFA, Ionode,
Australia) connected to the bioreactor pH transmitter. This was comprised of a 60ml sterile sample
jar with its lid fitted with a 12mm cable gland and two stainless steel tubes. The pH probe was
mounted through the cable gland. A peristaltic pump was used to draw culture media from the
bioreactor into the jar, and push it through the outlet tube back into the bioreactor (see Figure 3.4).
This allowed continuous online measurement of the reactor pH level. The volume of culture inside
the jar was approximately 30ml with a pump speed of around 10ml/min, producing a short
residence time of approximately 3 minutes. As the pH recycle occupied two bioreactor ports, no
free port was available for the syringe inlet. This issue was overcome by the addition of a three-way
connection on the pH recycle outflow line. This apparatus was used for the batch and continuous
runs. Following these, the newly ordered pH probe arrived and was used for subsequent fed-batch
runs. The probes were calibrated before each run using standard buffer solutions.
Figure 3.3. Gas analysis: A. Condenser. B. Moisture-scrubbing column. C. Gas analyser.
Figure 2.4. pH recycle. System diagram shown on left. Photo of container with pH probe on right.
9
3.4. Sampling
Regular, aseptic sampling of the bioreactor contents was required
for offline analysis. For this purpose, a sterile sampler was
constructed and is depicted in Figure 3.5. The sampler consisted of
a sterile 10ml sample tube with two short lengths of stainless steel
tube mounted in the lid. One of these was connected to the
bioreactor vessel via a short length of silicone hose, and the other
to a three-way Luer-Lok® stopcock attached to a 30ml syringe and
sterile 0.45µm filter. A clamp was placed along the bioreactor line
to seal off the sampler when not in use. When a sample was
desired, the stopcock was switched to close off the filter side, the
clamp was unscrewed and the syringe was pulled back, creating a
negative pressure and drawing culture into the sample tube. The
stopcock was then switched to close off the sample tube side, and
the air in the syringe was ejected through the filter. The hose clamp was then tightened to seal off
the sampler from the bioreactor. The full sample tube was then unscrewed from the lid and a new,
sterile tube was quickly screwed into place to await the next sample. This procedure is illustrated in
Figure 3.6.
3.5. Microorganism Strain, Storage and Inoculation
The strain of S. cerevisiae used in the bioreactor experiments was WY1272 – American Ale II™
(Wyeast Laboratories Inc, USA), a commercially available brewers’ yeast. The yeast was obtained in
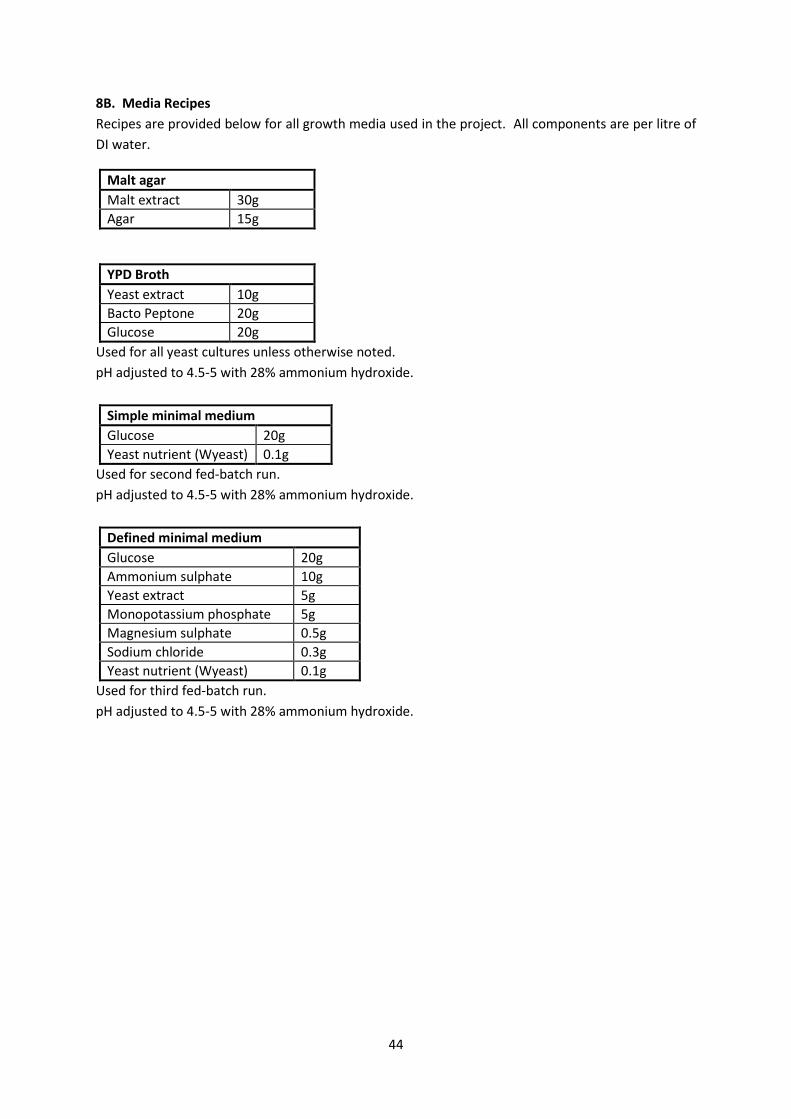
liquid culture form, streaked onto several malt agar plates (Appendix 8B) and stored at
approximately 4°C. To prepare inocula for the bioreactor runs, a small amount of biomass was
scraped from a storage plate and used to inoculate 10ml of culture media in a 10ml sterile sample
tube. This was incubated for approximately 24 hours at 30°C in the laboratory incubator (5160,
Stuart Scientific, UK). This culture was then added to 290ml of media in a sterile flask and placed on
a magnetic stir-plate (IEC, Australia) inside the incubator. This was allowed to grow for
approximately 24 hours before being
used to inoculate 1.7L of sterile
culture media inside the bioreactor,
bringing total working culture volume
to 2L.
3.6. Asepsis
Aseptic precautions were taken to
avoid contamination of the
bioreactor. Media and flasks for
starter cultures were autoclaved at
121°C for 20 minutes. The glucose
component of the media was
autoclaved separately from the other
components in order to prevent
degradation (Wang & Hsiao, 1995),
which would have limited the amount
Figure 3.5. Sterile sampling device.
Figure 3.6. Sampling procedure. The syringe was used to draw culture into the sampling tube, which was then removed and replaced with a new sterile tube.
10
of free glucose available to the yeast and subsequently caused modelling errors. Inoculations and
other procedures vulnerable to contamination (e.g. opening bottles of sterile solution) were
performed either under flame from a Bunsen burner or in a laminar flow cabinet. Prior to bioreactor
runs, all fittings and lines were autoclaved. Culture media without glucose was placed into the
bioreactor and raised to boiling point, displacing headspace air with steam. The vessel was then
sealed and the temperature was allowed to rise to approximately 121°C. This temperature was held
for 20 minutes, then heating was switched off and temperature was allowed to drop below 100°C.
The exit gas condenser and MFC fittings were then attached and inlet air flow was switched on. This
allowed the sterile bioreactor fittings to be added against positive pressure, decreasing the
possibility of airborne contaminants entering the vessel. When the reactor contents had cooled to
ambient temperature, sterile glucose solution and the starter culture were added via the inoculation
port using a sterile syringe.
3.7. Bioreactor Growth Conditions
During the runs, the bioreactor vessel was held at 30°C by a PID controller. pH was initially adjusted
to 4.5-5 with 5M H2SO4 and maintained in this range by manual addition of 28% NH4OH, which also
acted as an additional nitrogen source for the culture. Prior to inoculation, the media was saturated
with air and the DO transmitter was set to 100%. DO was maintained above 20% of air saturation by
adjusting stirring speed when compressed air was the inlet gas, or mass flow rate when oxygen was
used (see Section 4.3). Foaming was controlled by dropwise addition of silicon-based antifoam
solution as required.
3.8. Batch Culture
Two simple batch culture runs were performed to gain familiarity with the bioreactor hardware and
control software, and to aid in design and testing of the OUR measurement strategy. For each run,
the bioreactor was inoculated as per Section 3.5 into YPD culture media (Appendix 8B) and operated
under the conditions described in Section 3.7. Just prior to commencement of the first run, the UV-
vis spectrophotometer borrowed from another laboratory was found to be reporting erroneous
values and thus OD was not measured for this run. OUR during the first run was monitored by
periodic manual interruption of the inlet gas flow and subsequent analysis of DO levels using
Microsoft Excel. This provided preliminary results to aid in design of the automated OUR
measurement strategy described in Sections 2.2. Automated OUR measurement was employed
during all runs thereafter.
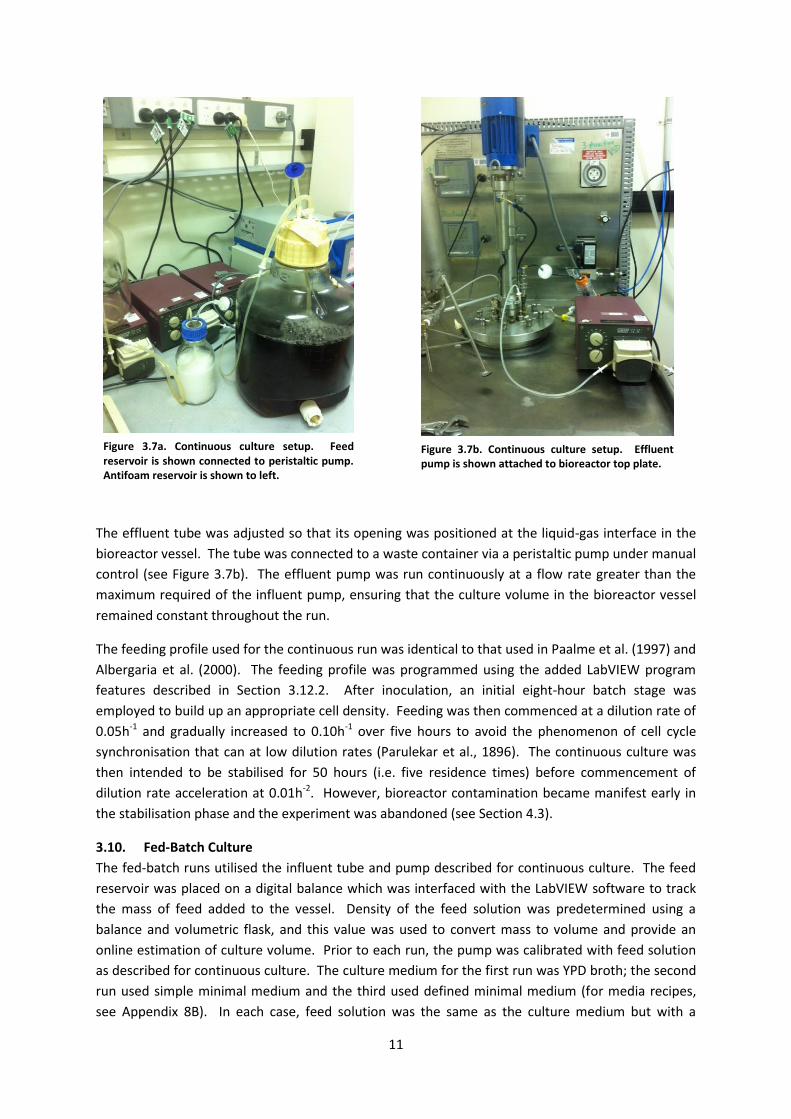
3.9. Continuous Culture
For the continuous culture experiment, influent and effluent lines were added to the bioreactor.
The influent line was connected via a peristaltic pump to a 10L feed reservoir containing sterile
YPD medium (see Figure 3.7a). Prior to the run, a calibration curve for the pump was generated by
measuring the flow rate of YPD medium at a range of pump power outputs (Appendix 8D). This
allowed a desired volumetric flow rate to be entered in LabVIEW and the corresponding power level
to be outputted to the pump (see Section 3.12.2).
11
The effluent tube was adjusted so that its opening was positioned at the liquid-gas interface in the
bioreactor vessel. The tube was connected to a waste container via a peristaltic pump under manual
control (see Figure 3.7b). The effluent pump was run continuously at a flow rate greater than the
maximum required of the influent pump, ensuring that the culture volume in the bioreactor vessel
remained constant throughout the run.
The feeding profile used for the continuous run was identical to that used in Paalme et al. (1997) and
Albergaria et al. (2000). The feeding profile was programmed using the added LabVIEW program
features described in Section 3.12.2. After inoculation, an initial eight-hour batch stage was
employed to build up an appropriate cell density. Feeding was then commenced at a dilution rate of
0.05h-1 and gradually increased to 0.10h-1 over five hours to avoid the phenomenon of cell cycle
synchronisation that can at low dilution rates (Parulekar et al., 1896). The continuous culture was
then intended to be stabilised for 50 hours (i.e. five residence times) before commencement of
dilution rate acceleration at 0.01h-2. However, bioreactor contamination became manifest early in
the stabilisation phase and the experiment was abandoned (see Section 4.3).
3.10. Fed-Batch Culture
The fed-batch runs utilised the influent tube and pump described for continuous culture. The feed
reservoir was placed on a digital balance which was interfaced with the LabVIEW software to track
the mass of feed added to the vessel. Density of the feed solution was predetermined using a
balance and volumetric flask, and this value was used to convert mass to volume and provide an
online estimation of culture volume. Prior to each run, the pump was calibrated with feed solution
as described for continuous culture. The culture medium for the first run was YPD broth; the second
run used simple minimal medium and the third used defined minimal medium (for media recipes,
see Appendix 8B). In each case, feed solution was the same as the culture medium but with a
Figure 3.7a. Continuous culture setup. Feed reservoir is shown connected to peristaltic pump. Antifoam reservoir is shown to left.
Figure 3.7b. Continuous culture setup. Effluent pump is shown attached to bioreactor top plate.
12
glucose concentration of 25g/L. For each experiment, a 300ml starter culture was prepared as per
Section 3.5 and used to inoculate 1.7L of medium in the bioreactor. Following inoculation, the
culture was grown in batch mode until exhaustion of glucose. Feeding was then commenced at a
dynamic rate as described in Section 1.3.2. The LabVIEW features added to facilitate fed-batch
culture are described in Section 3.12.2.
3.11. Offline Analytical Methods
3.11.1. Biomass Concentration
To determine dry cell weight concentrations, 5-10ml samples were passed through pre-weighed
0.45µm filters (Advantec, USA) using a Büchner flask and funnel with vacuum filtration. The filters
were washed twice with DI water and dried for eight hours at 80°C in an oven. The filters were then
weighed to determine dry cell mass and scaled to reflect biomass concentration in g/L. All
measurements were used to populate a standard curve of optical density versus biomass (see
Appendix 8D) for rapid offline estimation of culture biomass concentration.
3.11.2. Optical Density
Optical density (OD) of samples was measured at 600nm using a UV-vis spectrophotometer (UVmini
1240, Shimadzu, Japan). To improve accuracy, samples were diluted with DI water to give OD
readings of <1.
3.11.3. Glucose Concentration
Sample glucose levels were initially intended to be measured using high-performance liquid
chromatography (HPLC). However, due to the lack of a suitable detector on campus, and the high
costs of having analysis performed externally or purchasing an enzymatic measurement kit, a
portable blood glucose analyser (Accu-Chek® Active, Roche, Switzerland) was used to measure
sample glucose. To test the accuracy of the analyser, solutions of YPD broth containing known
glucose concentrations were analysed. Although measurements were within 0.1g/L of expected
values, the lower limit of measurement for the analyser (0.1g/L) represents the critical glucose level
for aerobic growth in baker’s yeast. Therefore, in fed-batch culture, the analyser was only suitable
for indicating excess of glucose. The analyser was, however, appropriate for use with simple batch
culture or for measuring glucose in feed solutions.
3.11.4. Ethanol Concentration
As with glucose, ethanol concentration was intended to be measured with HPLC and thus required
an alternative analysis method to be sought. Caputi et al. (1968) provide a colorimetric method
involving the oxidation of ethanol by acidified dichromate and subsequent spectrophotometric
measurement of the associated colour change. This method was tested using solutions of YPD broth
containing known ethanol concentrations. Unfortunately, the method was not sensitive for the low
ethanol concentrations (<100mM) anticipated in bioreactor samples. However, as the presence of
ethanol in bioreactor samples is a qualitative indicator of anaerobic fermentation, quantitative
ethanol measurement was not strictly required and it was deemed sufficient to infer anaerobic
fermentation from a sharp rise in outgas carbon dioxide fraction on the gas analyser (Postma et al.,
1999).
3.12. LabVIEW Program
The LabVIEW program used for all bioreactor runs is provided in Appendix 8A (mastervet2.vi).
13
3.12.1. Pre-existing Features
The bioreactor instrumentation was monitored and controlled through a pre-existing LabVIEW
program. The program contained subroutines to communicate with the bioreactor via the
6B hardware, and with the gas analyser and balances directly. On program start-up, the A/D
hardware and balances were initialised using subroutines. The main program code consisted of
several loops running in parallel. The heart of the program was the data acquisition loop, a
sequence of four steps running every 100ms that would: (i) read raw values of reactor temperature,
pH, dissolved oxygen and inlet mass flow from the serial communication port and pass the values
through linear calibration subroutines; (ii) calculate PID controller outputs for the base pump and
heating coils based on pH and temperature values and user-defined tuning coefficients; (iii) scale
analogue output values (impeller speed, heater power, mass flow setpoint, and pump outputs) to
appropriate milliamp values (4-20mA) and transmit to A/D hardware; and (iv) send digital output
values for impeller and heater circuit on/off control. Mass balance readings were handled in a
separate loop as each reading required 300ms. The mass balance readings were achieved through a
subroutine that sent a print command to the balance, waited for a response and then converted the
returned string to a mass value. The gas analyser was read by a similar subroutine to that described
for the balances, with the returned string interpreted to provide percentage values of carbon dioxide
and oxygen in the exit gas.
The LabVIEW program contained a range of features that utilised the core I/O loops described
above. These included logging functions, a biomass estimator, two DO controllers, and four
different nutrient flow controllers designed as part of a previous project. These features were not
utilised in the current project and are therefore not described further.
The program front panel provided a user interface for bioreactor control. All features mentioned
above were accessible from the front panel of the original program, shown in Figure 3.8. The only
pre-existing front-panel feature used in this project was the temperature PID controller, and a
modified version of the dissolved oxygen controller. All other controls used during bioreactor runs
Figure 3.8. LabVIEW program front panel view. PID control loops, exit gas composition, and variable plot are shown.
14
were added during the course of the project, and are described below.
3.12.2. Added Features
A range of features were added to the bioreactor program over the course of the project to facilitate
experimental work.
3.12.2.1. General Features
Features were added to the LabVIEW program to increase general usability. These were:
Data logging. The original program contained a data logging loop, however this was customised to
the original author’s own work and logged a range of derived variables not applicable to this project.
A new data logging loop was written that recorded appropriate data for the project. The front-panel
components included a dialog box for file selection, an on/off switch, and time interval control. The
same logging subroutine used in the original program was used to write to the selected file.
Optical density logging. This allowed the user to log and plot the measured OD of a sample by
entering the value into a front-panel control. As determining OD generally required dilution, a
feature was included that allowed the user to input the dilution factor used for measurement. This
would then be used to scale the measured value to reflect the true sample OD. An indicator was
also added to display the estimated biomass concentration of the sample, calculated from the linear
regression equation derived from the standard curve in Appendix 8D.
Separate plots for variables of interest. The original program displayed a front-panel plot of online
measurements, however some variables such as pH (range 0-14) and DO (0-100%) have significantly
different ranges and plotting them together creates difficulty in monitoring small changes. Separate
plots for variables of interest (DO, temperature, pH, outgas CO2 concentration, OUR and OD) were
created to overcome this issue. A control was included for selection of plotting interval.
Timer. A feature was added to display the time since the program was started.
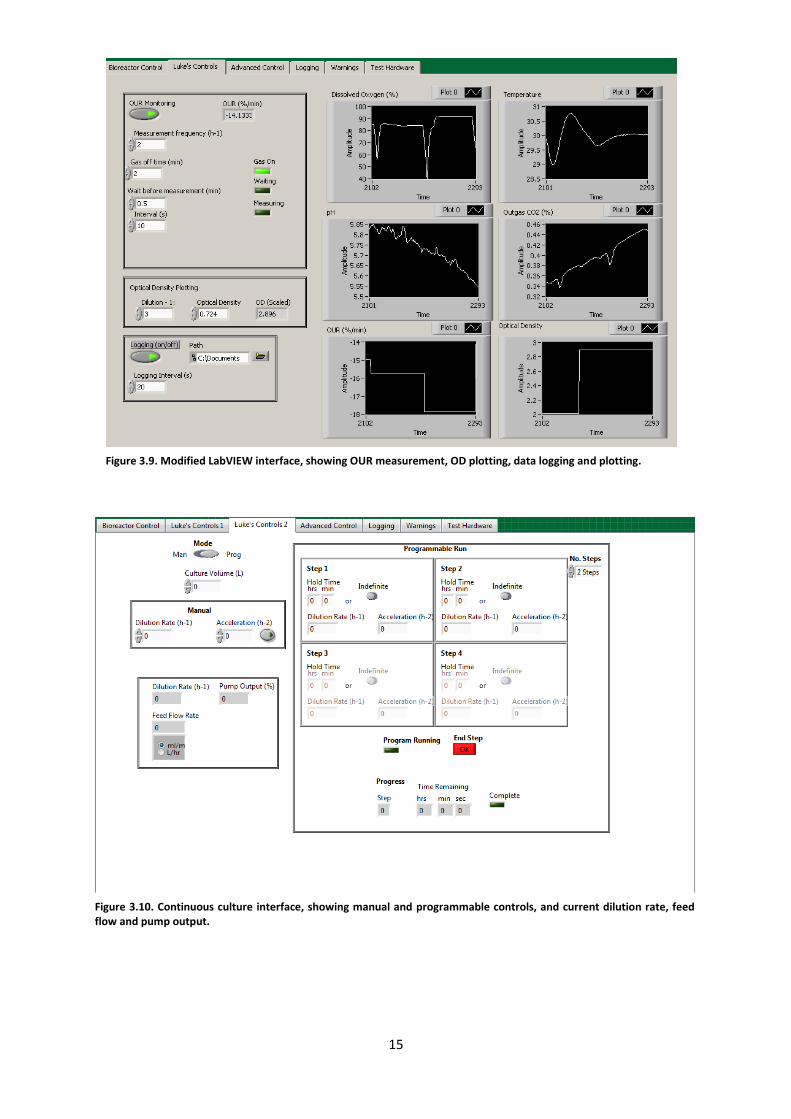
These features are shown in Figure 3.9.
3.12.2.2. Oxygen Uptake Measurement
As discussed in Section 3.2, a feature was added to the LabVIEW program to monitor oxygen uptake
online. The operating principle of this feature was as follows. At a frequency determined by the
user (in measurements per hour), the inlet air flow through the MFC was set to zero. The program
then waited a specified amount of time to allow for the actual flow rate to drop to zero and to
account for any delay related to the DO probe. The DO level was then read at a user-specified
interval, subtracted from the previous reading to determine the difference between the two
measurements, and added to a cumulative total. When the gas-out time had reached the limit
entered by the user, the MFC flow rate was set to its original value. The cumulative difference value
was then divided by the number of measurements made to determine the average difference
between successive DO readings. This value was then converted into percentage change per minute
(%/min), which was plotted and logged. If the bioreactor DO level dropped below a critical value
during gas-out time, the measurement loop was stopped so that aeration could recommence. All
timing parameters (measurement frequency, gas-out time, wait time, interval between readings) as
well as the critical DO limit could be specified by the user via the front panel, and a series of Boolean
indicators signified the current stage of the cycle.
15
Figure 3.9. Modified LabVIEW interface, showing OUR measurement, OD plotting, data logging and plotting.
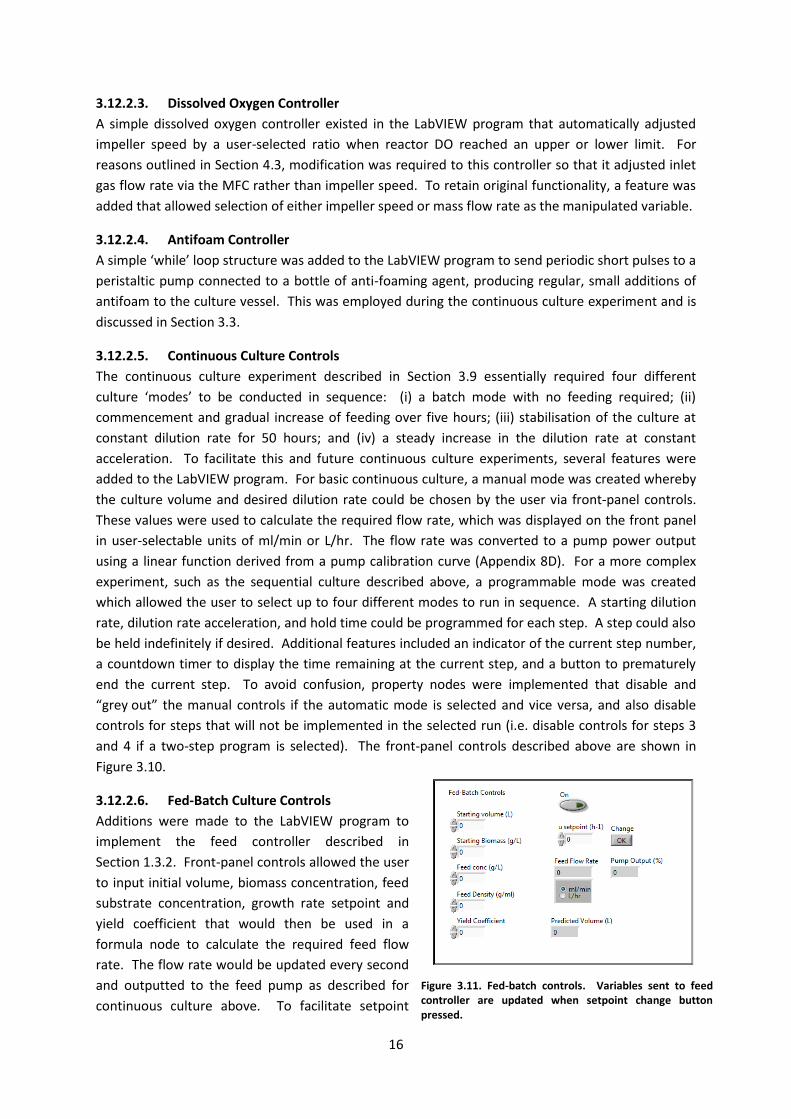
Figure 3.10. Continuous culture interface, showing manual and programmable controls, and current dilution rate, feed flow and pump output.
16
3.12.2.3. Dissolved Oxygen Controller
A simple dissolved oxygen controller existed in the LabVIEW program that automatically adjusted
impeller speed by a user-selected ratio when reactor DO reached an upper or lower limit. For
reasons outlined in Section 4.3, modification was required to this controller so that it adjusted inlet
gas flow rate via the MFC rather than impeller speed. To retain original functionality, a feature was
added that allowed selection of either impeller speed or mass flow rate as the manipulated variable.
3.12.2.4. Antifoam Controller
A simple ‘while’ loop structure was added to the LabVIEW program to send periodic short pulses to a
peristaltic pump connected to a bottle of anti-foaming agent, producing regular, small additions of
antifoam to the culture vessel. This was employed during the continuous culture experiment and is
discussed in Section 3.3.
3.12.2.5. Continuous Culture Controls
The continuous culture experiment described in Section 3.9 essentially required four different
culture ‘modes’ to be conducted in sequence: (i) a batch mode with no feeding required; (ii)
commencement and gradual increase of feeding over five hours; (iii) stabilisation of the culture at
constant dilution rate for 50 hours; and (iv) a steady increase in the dilution rate at constant
acceleration. To facilitate this and future continuous culture experiments, several features were
added to the LabVIEW program. For basic continuous culture, a manual mode was created whereby
the culture volume and desired dilution rate could be chosen by the user via front-panel controls.
These values were used to calculate the required flow rate, which was displayed on the front panel
in user-selectable units of ml/min or L/hr. The flow rate was converted to a pump power output
using a linear function derived from a pump calibration curve (Appendix 8D). For a more complex
experiment, such as the sequential culture described above, a programmable mode was created
which allowed the user to select up to four different modes to run in sequence. A starting dilution
rate, dilution rate acceleration, and hold time could be programmed for each step. A step could also
be held indefinitely if desired. Additional features included an indicator of the current step number,
a countdown timer to display the time remaining at the current step, and a button to prematurely
end the current step. To avoid confusion, property nodes were implemented that disable and
“grey out” the manual controls if the automatic mode is selected and vice versa, and also disable
controls for steps that will not be implemented in the selected run (i.e. disable controls for steps 3
and 4 if a two-step program is selected). The front-panel controls described above are shown in
Figure 3.10.
3.12.2.6. Fed-Batch Culture Controls
Additions were made to the LabVIEW program to
implement the feed controller described in
Section 1.3.2. Front-panel controls allowed the user
to input initial volume, biomass concentration, feed
substrate concentration, growth rate setpoint and
yield coefficient that would then be used in a
formula node to calculate the required feed flow
rate. The flow rate would be updated every second
and outputted to the feed pump as described for
continuous culture above. To facilitate setpoint
Figure 3.11. Fed-batch controls. Variables sent to feed controller are updated when setpoint change button pressed.
17
changes, a push button was added that would send newly inputted values of volume, biomass and
growth rate setpoint to the feed controller. A feature was added that integrated the feed rate to
provide a cumulative estimate of culture volume. These features are shown in Figure 3.11.
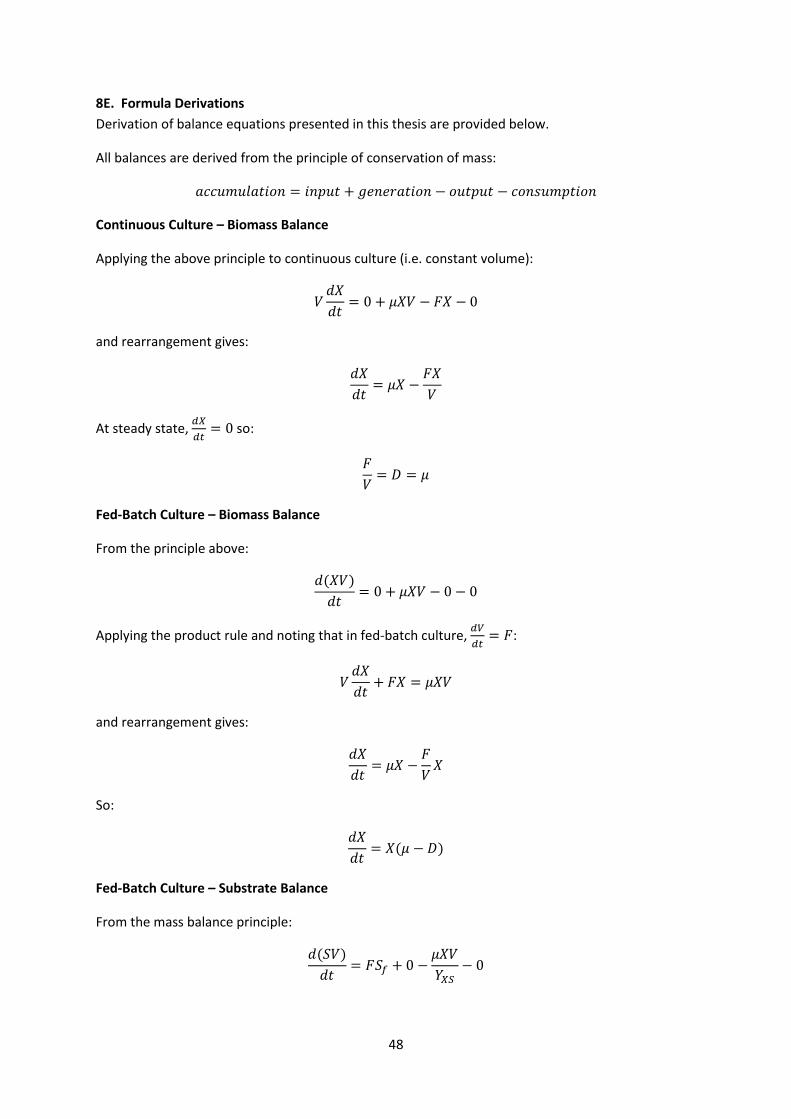
3.13. Modelling
To examine the viability of the fed-batch parameter estimation strategy described in Section 1.3.2,
modelling was conducted in SIMULINK. The model file is provided in Appendix 8A. The system of
equations used for modelling was developed from mass balances for fed-batch culture. The model
used to simulate specific growth rate is the Monod equation and is used frequently in microbial
growth modelling (van Dijken et al., 1993). The modelling equations are listed below, and derivation
of these is provided in Appendix 8E.
Specific Growth Rate:
Biomass Balance:
( )
Substrate Balance:
( )
Oxygen Uptake: (
)
Feed Rate:
( )
The parameters and variables of the above system are described in Table 2.1.
Symbol Name Units Type
µ Specific growth rate h-1 Output variable
µmax Max. specific growth rate h-1 Growth parameter
S Substrate concentration g/L Output variable
KS Saturation coefficient g/L Growth Parameter
X Biomass concentration g/L Output variable
D Dilution rate h-1 Input variable
Sf Feed substrate concentration g/L Input variable
µS Specific growth rate setpoint h-1 Input variable
t Time hr Input variable Table 2.1. Variables and parameters used for modelling.
To simulate the stepped growth rate setpoint changes described in Section 1.3.2, the variables of the
feed rate equation were periodically updated using step functions. The simulation was programmed
18
to stop once the maximum capacity of the vessel was reached. To simulate volume changes caused
by sampling, a ramp function combined with a zero-order hold was used to make periodic volume
subtractions.
19
4. Results
4.1. Setup, Calibration and Testing
4.1.1. Laboratory Setup
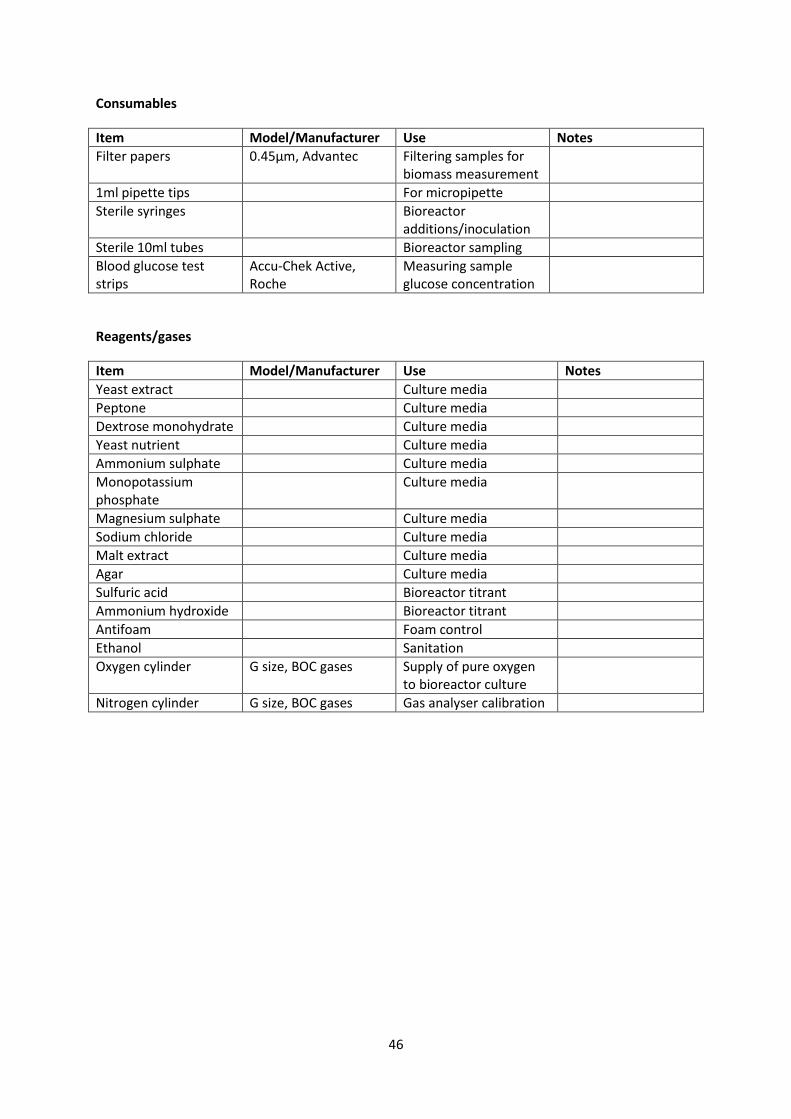
The project required the establishment of a new, dedicated bioreactor laboratory. The initial
portion of the project therefore involved the acquisition of necessary laboratory equipment and
reagents for the planned experiments. Many of these were obtained from storage; the remaining
items were acquired from elsewhere within the Engineering Department, or purchased. For
reference purposes, a list of the new laboratory inventory is provided in Appendix 8C, along with
each item’s purpose and any important observations.
4.1.2. Bioreactor Setup
The bioreactor and related instrumentation were set up in the laboratory. All port fittings were
located in storage and fitted to the bioreactor. Feed and titrant lines were connected to their
respective fittings and threaded through peristaltic pumps. The pumps were linked to the bioreactor
I/O hardware through serial connections. Cooling lines were connected to the water ports on the
bioreactor vessel exterior. The inlet port was connected with silicone hose to the upper faucet on
the laboratory sink, which also supplied the exit gas condenser cooling channel via a Y-fitting. The
exit line drained into the sink.
A compressed air line and regulator, as well as three lines for cylinder gases, were fitted to the
laboratory by the School technician. Compressed air and oxygen lines were connected to a three-
way valve on the bioreactor back panel and the respective pressure regulators were adjusted to
supply approximately 10psi. The valve was linked to the mass flow controller. An inline air filter was
added between the MFC outlet and the bioreactor gas sparger. The exit gas condenser was attached
to the bioreactor exit gas port; its water inlet was attached to the faucet as described above, and its
outlet drained into the sink. The condenser gas outlet was linked via an inline filter to a moisture-
scrubbing column which was attached to the gas analyser. Air-flow resistance provided by the gas
analyser internal valve was noted to cause pressure build-up inside the bioreactor vessel. This was
remedied by the addition of a simple pressure-relief fitting consisting of a tube and hose clamp
between the condenser and moisture-scrubbing column, however this should be replaced by an
adjustable pressure-relief valve and inline gauge to prevent exit gas mixing with ambient air and
Figure 4.1. Vessel pressure relief. Current configuration shown on left, recommended configuration on right.
20
allow regulation of line pressure to the gas analyser (see Figure 4.1).
A sterile sampling device for removing bioreactor samples was described in the bioreactor
documentation but could not be located in storage. A new sampler was constructed, and this has
been detailed in Section 3.4.
The bioreactor, gas analyser and balances were connected to the laboratory computer via serial
connections. A pre-existing I/O testing program (masterIO.vi, Appendix 8A) was used to test each
instrument for functionality. Initially, the program failed to interface with the equipment. The
problem was identified as being caused by mismatches between the computer COM port
designations and those expected by the program. This required reassigning of the COM port
numbers to match those called by the software; this was performed by the School IT technician.
Another immediate issue was that the front-panel display for exit gas composition displayed
significantly different values to those shown on the gas analyser display. On investigation, this issue
was traced to the subroutine responsible for interpreting the hexadecimal strings read from the gas
analyser I/O module. The offset values for the two string subsets containing the gas composition
values were incorrect and required alteration. The main bioreactor LabVIEW program also required
this modification. This error was due to a structural change in the character string produced by the
gas analyser since the LabVIEW program was written, possibly due to a factory reset or change of a
parameter in the gas analyser module by a previous user. It was also noted that the output to the
MFC, whilst labelled as being in litres per hour, was actually in percentage of maximum. This
resulted in a large disparity between the volume of gas being injected into the bioreactor and the
desired mass flow entered into the user interface. This issue was exclusive to the I/O testing
program, and was resolved by adding the MFC input and output scaling parameters from the main
bioreactor LabVIEW program into the testing program. Finally, one mass balance did not appear to
communicate with the computer software. This fault was investigated and found to be with the
balance itself rather than its serial cable or COM port. This balance was given to the School
technician for repair.
Following these modifications, outputs to the bioreactor impeller, heater, MFC and pumps, and
inputs from the DO transmitter, pH transmitter, temperature probe, gas analyser and remaining
mass balance, functioned satisfactorily.
4.1.3. Measurement Probes
During instrument testing, both the pH and DO probes exhibited drifting readings. The DO probe
drift was resolved by refilling the probe head with electrolyte solution. The failure of the pH probe
was likely due to its age and/or the improper storage conditions in which it was found. Attempts
were made to reactivate it according to the manufacturer’s guidelines, but these were unsuccessful.
A new pH probe was ordered, and an alternative method of pH measurement was employed during
the time to delivery, as described in Section 3.3.
4.1.4. Gas Analyser
The gas analyser was tested for functionality using various gas cylinders in the laboratory. The
carbon dioxide channel was zeroed using pure nitrogen gas; however, it was unable to be fully
calibrated due to the lack of a suitable span gas with a carbon dioxide composition of 16% or less.
Nonetheless, the channel appeared to function satisfactorily, giving a CO2 reading of 400-500ppm
when measuring compressed air (CO2 concentration approx. 400ppm), although the reading was
21
noted to drift somewhat during bioreactor experiments. As the use of the carbon dioxide channel in
this project was simply to monitor bioreactor runs for the signature spike in carbon dioxide
production associated with a switch to fermentative metabolism, small measurement errors and
output drift were considered acceptable.
Zero and span calibration of the oxygen channel was attempted using nitrogen gas, synthetic air and
pure oxygen gas. Unfortunately, the channel showed no response to changing oxygen input despite
repeated attempts. The gas analyser parameters and settings were explored and corresponding
documentation was read thoroughly in an effort to resolve the problem, but no solution could be
found. Removal of the instrument casing revealed the paramagnetic oxygen sensor chamber to
appear darkened and scaled, suggesting the sensor may be worn from long-term use.
Measurement of exit gas oxygen was intended for use in online estimation of oxygen uptake rate for
modelling and control purposes. An alternate method of OUR estimation was therefore devised that
utilised dissolved oxygen measurement in the liquid phase. This method, known as the ‘gas-out’
method (Bandyopadhyay et al., 1967), involved the periodic interruption of the inlet gas flow and
subsequent measurement of dissolved oxygen decline during the outage using the DO probe.
Quantifying OUR through DO monitoring is considered more accurate than indirect measurement
through exit gas analysis (Heinzle et al., 1990). However, measurements are taken much less
frequently and care must be taken to ensure DO does not drop below critical level during the gas
outage and become growth-limiting.
4.2. Batch Culture
Two simple batch culture runs were performed in order to gain familiarity with the bioreactor, test
the control software and develop the OUR monitoring strategy.
4.2.1. First Batch Run
A simple batch run was commenced to gain familiarity with the bioreactor and test the control
software. Media was added to the bioreactor and sterilised and inoculated as described in
Section 2.5. Prior to inoculation, the temperature control loop was enabled. This functioned
satisfactorily, bringing the bioreactor to the 30°C setpoint rapidly and holding it for the duration of
the run. The oxygen uptake rate was monitored manually by periodically interrupting air flow to the
bioreactor and analysing the resultant data points offline using Excel.
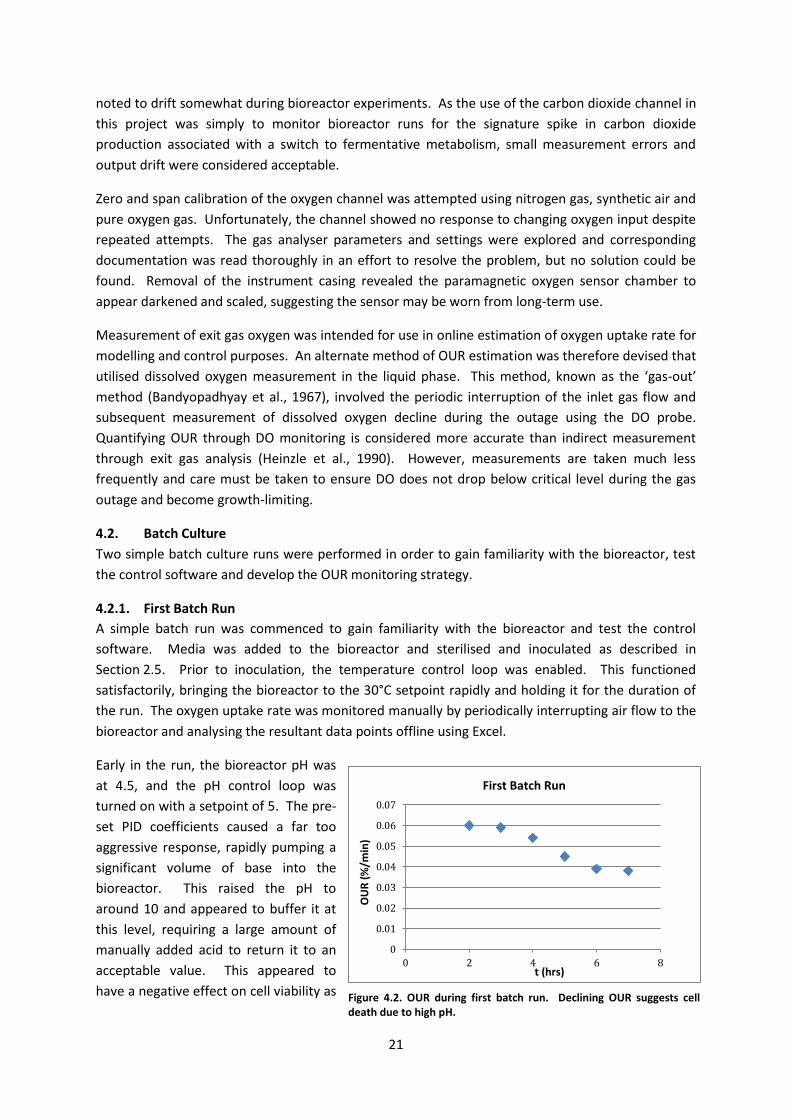
Early in the run, the bioreactor pH was
at 4.5, and the pH control loop was
turned on with a setpoint of 5. The pre-
set PID coefficients caused a far too
aggressive response, rapidly pumping a
significant volume of base into the
bioreactor. This raised the pH to
around 10 and appeared to buffer it at
this level, requiring a large amount of
manually added acid to return it to an
acceptable value. This appeared to
have a negative effect on cell viability as
0
0.01
0.02
0.03
0.04
0.05
0.06
0.07
0 2 4 6 8
OU
R (
%/m
in)
t (hrs)
First Batch Run
Figure 4.2. OUR during first batch run. Declining OUR suggests cell death due to high pH.
22
the OUR gradually decreased after this incident, depicted in Figure 4.2, suggesting declining live cell
numbers. The experiment was ceased seven hours after inoculation. Despite the problem caused
by the pH control loop, the run provided experience with the bioreactor instrumentation and
software features, and an opportunity to investigate dissolved oxygen dynamics to aid in designing
the OUR monitoring controls described in Section 4.1.4.
Following this experiment, preliminary investigation into the pH controller was undertaken with no
culture present. This revealed the base pump to be unresponsive to power outputs of under
approximately 8%. Addition of a simple offset to the PID controller output was complicated by the
observation that this feature demonstrated some hysteresis about this value. Automated control of
bioreactor pH was identified as an area requiring significant investigation and was not pursued in
this project. For all subsequent bioreactor runs, pH was controlled by manual additions of titrant
only. A discussion of pH control is provided in Section 5.3.
4.2.2. Second Batch Run
A second batch run was undertaken due to the complications encountered in the first experiment,
and to test the OUR monitoring function added to the LabVIEW program. The experiment ran for
15 hours. pH required only minor adjustment during the run by manual base addition. A of biomass
concentration and OUR over the course of the fermentation is shown in Figure 4.2. A plot of exit gas
carbon dioxide is shown in Figure 4.3.
An important feature of the OUR plot is the effect of agitation rate. At the two points marked on the
plot, impeller speed was manually increased by 10% to increase the rate of oxygen transfer to the
liquid phase. This was due to the observation that dissolved oxygen was nearing critical
concentration during gas outages. At these time points, discontinuities in the exponential OUR
curve can be observed, with an apparent negative shift exhibited at each point. This is likely
explained by gaseous oxygen in the vessel headspace being dissolved into the liquid phase at these
higher agitation speeds (Suresh et al., 2009), causing a decrease in the observed uptake by the cells.
To circumvent this issue, a feature was added to the LabVIEW OUR measurement loop that
0
1
2
3
4
5
6
0
5
10
15
20
25
30
0 2 4 6 8 10 12 14 16
Bio
mas
s (g
/L)
OU
R (
%/m
in)
t (hrs)
Second Batch Run
OUR
Biomass
Figure 4.3. OUR and biomass concentrations during second batch run. Dashed lines indicate step changes in agitation
rate.
23
decreased agitation rate to 10% during measurements.
There are two features of note on the exit gas carbon dioxide plot. Firstly, there are two obvious
and consecutive points of sharp decline in carbon dioxide concentration followed by an apparent
recovery of the original curve. The first of these points occurred shortly after the second increase in
agitation rate described above. During bioreactor setup, the stainless steel tube for the sterile
sampler was noted to be loose in its threaded fitting. This was temporarily sealed with silicone.
However, the increased agitation during the run caused the sampler tube to be rocked back and
forth, which eventually partially detached the sealant and caused pressure to be lost from the
vessel. The drop in vessel pressure caused a concurrent drop in line pressure to the gas analyser. As
described in Section 4.1.2 above, the gas analyser line contained a pressure-relief fitting which was
not one-way, and thus ambient air was likely drawn into the line during the pressure drop. The
second point of decrease on the plot marked further loosening of the sealant. Following this, the
problem was identified and the fitting was re-sealed.
The other notable feature on the plot is the regular oscillations in carbon dioxide concentration
occurring every 15 minutes. These points coincide with automated OUR measurements during
which inlet gas flow to the bioreactor is interrupted, indicating that this feature is also a result of
falling pressure in the bioreactor vessel.
Allowing for these graphical anomalies, the plots demonstrate the expected patterns for microbial
batch culture: a period of increasing respiration but no growth (lag phase); followed by a period of
exponential increase in biomass and respiration (log phase); followed by stability of the cell
population and decline in gas metabolism as growth conditions become limiting (stationary phase).
The timing parameters for OUR measurement required adjustment during the run. The low levels of
oxygen uptake at the beginning of the run required relatively long gas-out times and reading
intervals to ensure that the slow decline of dissolved oxygen was appropriately captured. Towards
the end of the run, when biomass concentration was high, DO would fall rapidly during gas-out and
approach critical concentration within approximately 15 seconds. This required the use of a brief
gas outage to ensure conditions did not become growth-limiting. The ramifications of this
0
0.1
0.2
0.3
0.4
0.5
0.6
0.7
0 2 4 6 8 10 12 14 16
Exit
Gas
CO
2 (
%)
t (hrs)
Second Batch Run (CO2)
Figure 4.4. Exit gas carbon dioxide composition during second batch run.
24
requirement, as well as the other issues noted with OUR measurement, are reviewed in the
Section 5.2.
4.3. Continuous Culture
The continuous culture experiment was set up as described in Section 3.9, and inoculated as per the
procedure in Section 3.5. The bioreactor was initially run in batch mode. Feed flow was commenced
after eight hours, increased automatically from 0.05h-1 to 0.10h-1 over five hours, and maintained at
this rate thereafter, as per the protocol described in Section 3.9.
OUR and dilution rate for the duration of the experiment are shown in Figure 4.4. The culture
initially demonstrated very low respiratory activity, which did not begin to rise substantially until
feeding commenced eight hours post inoculation. The OUR then increased rapidly and exponentially
over the next 12 hours before stabilising at around 53%/min. This was an exceptionally high rate of
oxygen uptake compared to those seen in the initial batch runs (max. 17.5%/min). During this rise,
the culture demonstrated significant foaming, which required frequent additions of antifoam. The
large oxygen demand of the culture required changing the inlet gas from compressed air to pure
oxygen. The effluent from the bioreactor became pungent in odour. These features suggested
bacterial contamination of the bioreactor, and the experiment was abandoned. A sample of the
effluent was spread onto an agar plate and incubated overnight, then compared to a plate
containing a pure culture of S. cerevisiae. The significant differences in colony morphology,
demonstrated in Figure 4.6, confirm contamination and indicate that the bioreactor contained only
bacteria at the end of the experiment.
Generally speaking, bacteria can metabolise glucose significantly faster than yeast (Tortora et al.,
2004). A relatively small amount of bacterial contaminant in a continuous yeast culture can
therefore quickly propagate and begin to actively compete for substrate. The decreased amount of
substrate available to the yeast can then become growth limiting and, if growth is insufficient to
match the dilution rate of the culture, microbial washout occurs and the yeast population in the
0
0.05
0.1
0.15
0.2
0.25
0.3
0
10
20
30
40
50
60
0 5 10 15 20 25
Dilu
tio
n r
ate
(h
-1)
OU
R (
%/m
in)
t (hrs)
Continuous Culture Run
OUR
D
Figure 4.5. OUR and dilution rate during continuous culture run. OUR rises markedly after initiation of feeding.
25
Figure 4.6. Comparison of purity plates for continuous culture. Sample from start of run is on left, and end of run is on right. The right-hand plate displays colony morphology typical of bacteria.
vessel rapidly decreases to zero (Veldkamp et al., 1972). In this experiment, the low metabolic
activity initially present in the yeast culture would have contributed to the rapid decimation of the
yeast population in the bioreactor.
As contamination only became apparent upon commencement of feeding, the likely source of the
contaminant was the feed reservoir. This was in spite of significant aseptic precaution being taken in
preparing the feed media. The non-glucose components of the feed were sterilised in the reservoir,
with glucose solutions autoclaved separately. The glucose was then mixed into the feed reservoir
under laminar flow, and the reservoir remained sealed at all other times. Prior to pouring glucose
solution into the reservoir, the bottle openings were wiped with 70% ethanol. The reservoir lid and
both ends of the feed line were covered by foil caps prior to autoclaving. These were only removed
briefly to connect the reservoir to the bioreactor, and were sprayed with ethanol during this
procedure. The origin of the contaminant therefore remains unclear.
The very low respiratory activity and apparent extended lag phase seen throughout the eight-hour
batch stage of the experiment indicates either poor viability and/or low metabolic activity of the
300ml starter culture used to inoculate the bioreactor. The starter culture was prepared in the same
manner as for the other experiments (see Section 3.5) and visually achieved a similar turbidity.
However, due to a mechanical fault with the autoclave used to sterilise the influent media, the
experiment was delayed for two days and the starter was refrigerated until required. The starter
was brought to room temperature before inoculation. Inoculation is best performed during or soon
after completion of the log phase in the starter. Allowing the starter to ferment to completion,
followed by cold storage, promotes dormancy in the starter culture which can then result in an
extended lag phase upon inoculation (White & Zainasheff, 2010). In this experiment, the batch
phase could have been extended before commencement of feeding to allow for adequate cell
growth. However, initiation of continuous feeding was pre-programmed via the LabVIEW features
discussed in Section 3.12.2, and the bioreactor was unattended in the hours surrounding this. The
total running time of the full continuous culture program was set at 83 hours and thus periods of
non-attendance were unavoidable, but limited to no greater than six hours during the portion of the
program completed here. Bioreactor supervision is reviewed in Section 5.8.
26
Whilst not achieving the desired outcome, the continuous culture experiment did yield some useful
observations. The pattern of oxygen uptake after commencement of feeding, albeit pertaining to an
undesired organism, demonstrates the behaviour expected during initiation of a continuous culture:
the OUR rises exponentially and then stabilises at the constant dilution rate, indicating growth to a
steady-state cell population. This demonstrates that continuous culture experiments are achievable
with the Murdoch bioreactor equipment, providing contamination is prevented. Asepsis is further
discussed in Section 5.5.
Another important issue highlighted by the experiment was foam control. Foaming decreases the
effective volume of the liquid phase and can cause clogging of inlet and exit gas filters and other
ports. As mentioned, significant media foaming occurred during growth of the bacterial
contaminant. Frequent but less aggressive foaming also occurred during yeast cultures in this
project, and this would likely become problematic at high cell concentrations. Periodic addition of
antifoam solution suppressed foaming, and a simple timed loop was added to the LabVIEW program
to pump small volumes of antifoam through a vacant port at regular intervals (see Section 2.12.2).
However, foaming was unpredictable and, moreover, antifoam additions temporarily decreased
oxygen transfer to the liquid phase and caused DO drops that interfered with OUR measurement
and operation of the DO controller. Potential solutions are discussed in Section 5.4.
Finally, the experiment led to modification of the simple DO controller present in the LabVIEW
program. Originally, the controller manipulated the impeller speed to maintain the DO level within a
desired range. As the oxygen demand of the culture increased, the associated high impeller speeds
amplified foam formation. Switching the inlet gas from air to pure oxygen allowed the use of lower
speeds and thus decreased foaming. However, it was noted that the rate of oxygen transfer using
pure oxygen was very sensitive to impeller speed, and even the smallest effective increment (2%)
would result in significant change in steady-state DO, often exceeding the limits of the target range.
More gentle adjustment of oxygen transfer was achieved by controlling the setpoint of the mass
flow controller, and this was incorporated into the LabVIEW program as described in Section 2.12.2.
Due to the costs and impractical sterilisation regimes associated with the large media volumes of
continuous culture, as well as lengthy experimental time, it was decided not to repeat the
experiment. Instead, it was chosen to proceed to modelling using fed-batch culture.
4.4. Fed-Batch Simulation
Prior to running fed-batch experiments, extensive modelling was conducted using SIMULINK
software. The primary purposes of the simulations were to: (i) examine the strategic validity of
using fed-batch culture for parameter estimation; (ii) determine the effects of modelling errors;
namely, parameter error in the feed flow function; and (iii) gain estimates of the feed concentration
and flow rate range required for the experiments. The modelling process was outlined in
Section 2.13.
Completing the model required selection of growth parameter; these were chosen through
literature review. The chosen values, along with the literature values used to guide selection, are
provided in Table 4.1. Only single literature values were located for YXO and m, as these are
uncommon parameters used for the growth rate estimation method developed by Zabriskie &
Humphrey (1978) and employed in this project. As the oxygen uptake component of the model is
27
observational and does not interact with the biomass and substrate balances, these parameters are
essentially arbitrary and their values only affects the realness of the OUR output.
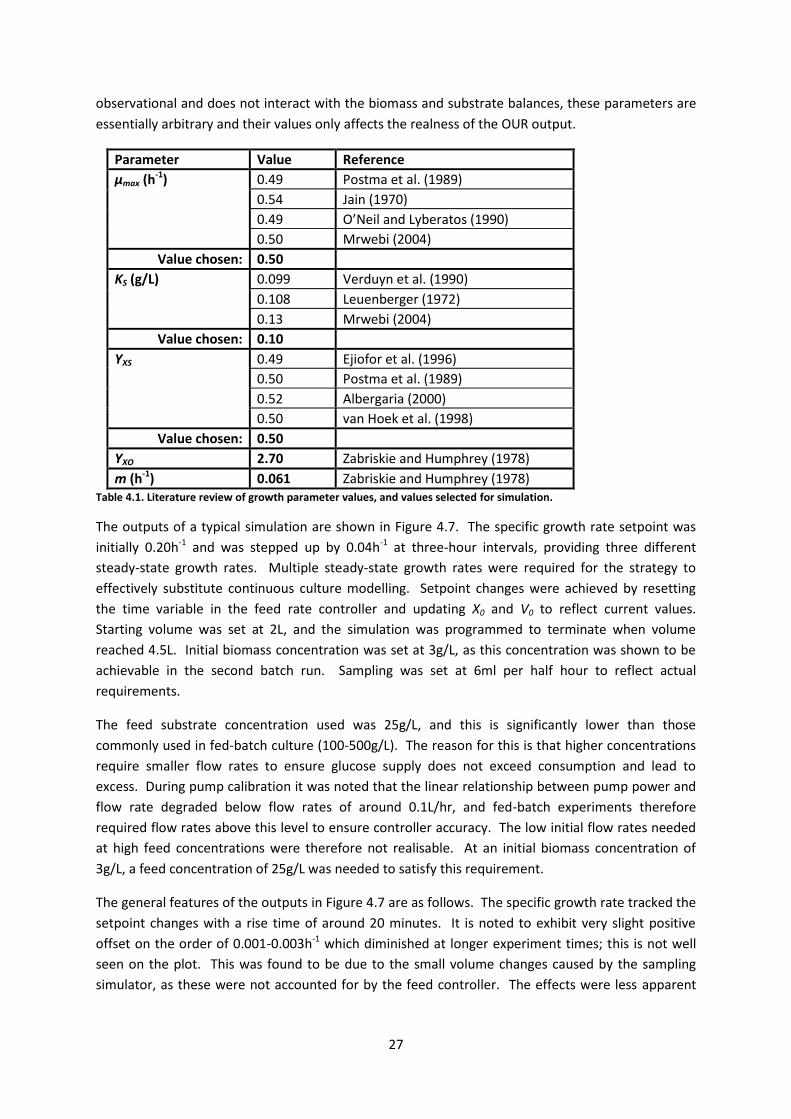
Parameter Value Reference
µmax (h-1) 0.49 Postma et al. (1989)
0.54 Jain (1970)
0.49 O’Neil and Lyberatos (1990)
0.50 Mrwebi (2004)
Value chosen: 0.50
KS (g/L) 0.099 Verduyn et al. (1990)
0.108 Leuenberger (1972)
0.13 Mrwebi (2004)
Value chosen: 0.10
YXS 0.49 Ejiofor et al. (1996)
0.50 Postma et al. (1989)
0.52 Albergaria (2000)
0.50 van Hoek et al. (1998)
Value chosen: 0.50
YXO 2.70 Zabriskie and Humphrey (1978)
m (h-1) 0.061 Zabriskie and Humphrey (1978) Table 4.1. Literature review of growth parameter values, and values selected for simulation.
The outputs of a typical simulation are shown in Figure 4.7. The specific growth rate setpoint was
initially 0.20h-1 and was stepped up by 0.04h-1 at three-hour intervals, providing three different
steady-state growth rates. Multiple steady-state growth rates were required for the strategy to
effectively substitute continuous culture modelling. Setpoint changes were achieved by resetting
the time variable in the feed rate controller and updating X0 and V0 to reflect current values.
Starting volume was set at 2L, and the simulation was programmed to terminate when volume
reached 4.5L. Initial biomass concentration was set at 3g/L, as this concentration was shown to be
achievable in the second batch run. Sampling was set at 6ml per half hour to reflect actual
requirements.
The feed substrate concentration used was 25g/L, and this is significantly lower than those
commonly used in fed-batch culture (100-500g/L). The reason for this is that higher concentrations
require smaller flow rates to ensure glucose supply does not exceed consumption and lead to
excess. During pump calibration it was noted that the linear relationship between pump power and
flow rate degraded below flow rates of around 0.1L/hr, and fed-batch experiments therefore
required flow rates above this level to ensure controller accuracy. The low initial flow rates needed
at high feed concentrations were therefore not realisable. At an initial biomass concentration of
3g/L, a feed concentration of 25g/L was needed to satisfy this requirement.
The general features of the outputs in Figure 4.7 are as follows. The specific growth rate tracked the
setpoint changes with a rise time of around 20 minutes. It is noted to exhibit very slight positive
offset on the order of 0.001-0.003h-1 which diminished at longer experiment times; this is not well
seen on the plot. This was found to be due to the small volume changes caused by the sampling
simulator, as these were not accounted for by the feed controller. The effects were less apparent
28
0
1
2
3
4
5
6
7
8
9
0
0.2
0.4
0.6
0.8
1
1.2
1.4
0 2 4 6 8
X
S,u
, F, O
UR
t (hrs)
Fed-Batch Simulation
S (g/L)
u (h^-1)
F (L/h)
OUR (g/L/h)
X (g/L)
over time as the overall volume increased and the small sample sizes became less significant.
Regardless, the effect on growth rate is considered negligible.
Biomass concentration increased exponentially between setpoint changes, exhibiting a rate increase
at each change. Notably, the maximum biomass concentration reached (8.4g/L) is far lower than
those often reported for fed-batch culture. This was due to the constraints imposed by the feed
substrate concentration, discussed above, and the maximum culture volume limit. Oxygen uptake
rate showed stepped increases at each setpoint change, due to increasing metabolism at higher
growth rates, and demonstrated exponential increase between changes due to increasing biomass.
Feed flow rate exhibits exponential increase as per controller design, with discontinuities
representing setpoint changes.
Reactor substrate concentration demonstrated stepped increases at each setpoint change and
remained constant between changes. This seems somewhat paradoxical, as increasing biomass and
growth rate would be expected to result in less residual substrate, but can be understood by
examining the feed controller and growth rate functions. The feed controller provides sufficient
substrate to sustain the cells at a chosen growth rate. However, as the growth rate is governed by a
first order rate equation, the cells do not consume substrate at the rate provided by the controller
until steady state is reached. The residual substrate after a setpoint change therefore represents
accumulation during the rise time. This is an important concept as it demonstrates that the inherent
growth kinetics of the organism affect more than just the transient response of the growth rate. In
the simulation shown, for example, bioreactor glucose concentration was noted to exceed 0.1g/L on
the third setpoint change, which may be sufficient to induce anaerobic metabolism. This feature is
considered in more detail in Section 5.6.
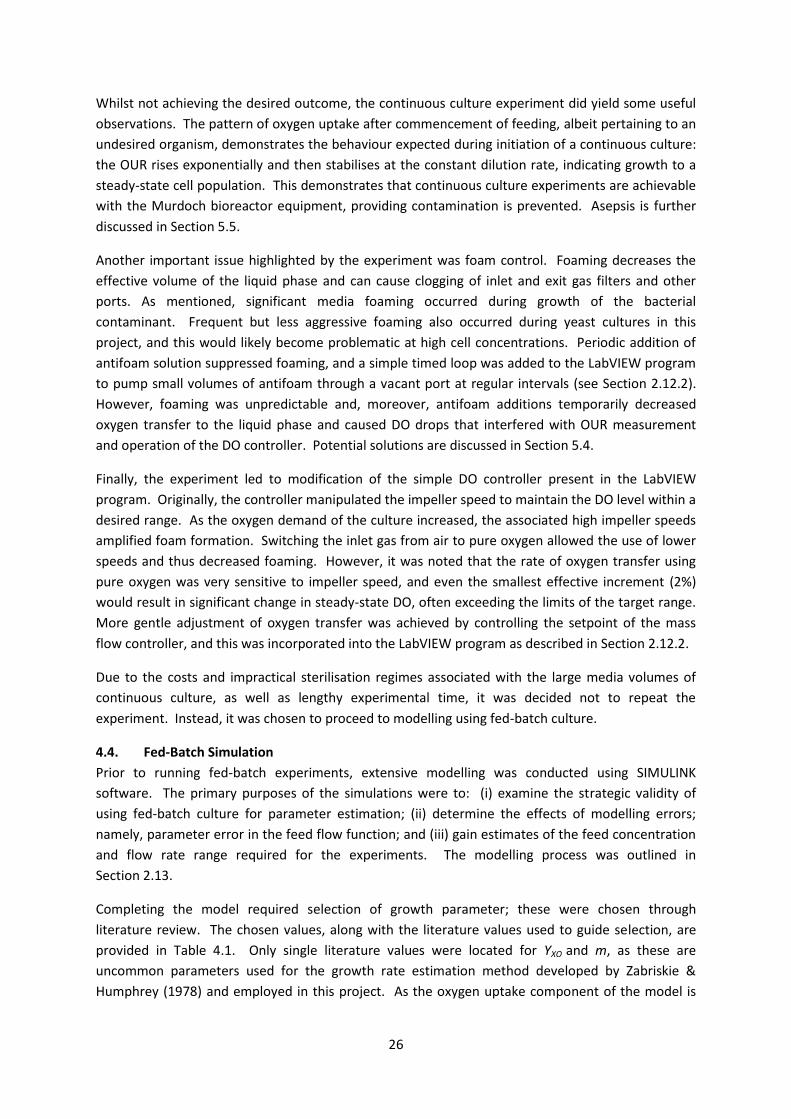
Only one parameter in the feed controller equation, namely YXS, required estimation from the
literature, whereas the remaining elements of the function are either predetermined (Sf, V0) or easily
measured (X0). It was therefore necessary to investigate the effect of error between the chosen
Figure 4.7. Outputs of typical fed-batch simulation.
29
value of YXS and the inherent property of the yeast strain. Figure 4.8 shows the simulated specific
growth rate when a value of 0.50 is used for YXS in the controller and the value in the substrate
balance equation differs by ±0.03. Greater error than this would be unlikely as the majority of
estimates in the literature are within this range. The plot demonstrates that parameter error results
in slight over- or undershoot of the growth rate setpoint. This would not be particularly problematic
in an experiment as the growth rate retains enough stability to be regarded as steady-state for
collection of data.
Simulation of fed-batch culture demonstrated viability of the parameter estimation strategy. In
particular, the strategy seemed fairly robust in respect to modelling error in the controller equation.
Additionally, the exercise raised practical considerations regarding selection of feed concentration
and the initial biomass required, and highlighted an important concept regarding growth rate
kinetics. Although only relatively low cell densities were shown to be achievable, this would not
limit the use of the strategy for parameter estimation. The results of the simulations were deemed
adequate to justify experimental fed-batch culture.
4.5. Fed-Batch Culture
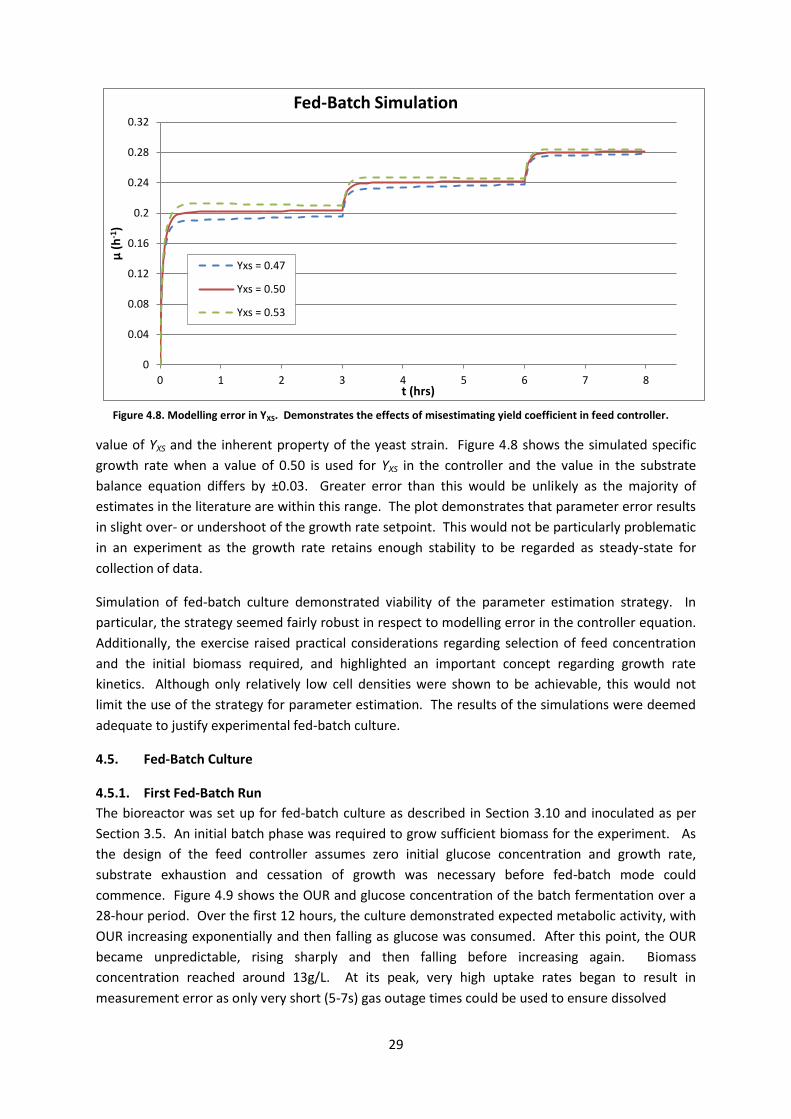
4.5.1. First Fed-Batch Run
The bioreactor was set up for fed-batch culture as described in Section 3.10 and inoculated as per
Section 3.5. An initial batch phase was required to grow sufficient biomass for the experiment. As
the design of the feed controller assumes zero initial glucose concentration and growth rate,
substrate exhaustion and cessation of growth was necessary before fed-batch mode could
commence. Figure 4.9 shows the OUR and glucose concentration of the batch fermentation over a
28-hour period. Over the first 12 hours, the culture demonstrated expected metabolic activity, with
OUR increasing exponentially and then falling as glucose was consumed. After this point, the OUR
became unpredictable, rising sharply and then falling before increasing again. Biomass
concentration reached around 13g/L. At its peak, very high uptake rates began to result in
measurement error as only very short (5-7s) gas outage times could be used to ensure dissolved
0
0.04
0.08
0.12
0.16
0.2
0.24
0.28
0.32
0 1 2 3 4 5 6 7 8
µ (
h-1
)
t (hrs)
Fed-Batch Simulation
Yxs = 0.47
Yxs = 0.50
Yxs = 0.53
Figure 4.8. Modelling error in YXS. Demonstrates the effects of misestimating yield coefficient in feed controller.
30
Figure 4.9. Glucose and OUR measurements during initial batch phase of first fed-batch run.
oxygen levels did not fall to zero. These high rates also necessitated switching the inlet gas to pure
oxygen. Due to the very long experimental time, unpredictable growth and problematic OUR
measurement, the experiment was abandoned without commencing fed-batch mode.
The above behaviour can be explained by considering the metabolic characteristics of yeast and the
composition of the growth medium. Whilst glucose is the primary preferred energy source for
yeasts, cells possess the genetic capabilities to metabolise a varied range of substrates, including
alcohols, organic acids and protein, if glucose or other simple sugars are unavailable (Feldmann,
2010). The growth medium used for this experiment was YPD broth, a complex medium composed
of yeast extract, peptone and glucose. The two former ingredients are undefined nutrient
supplements composed of peptides, vitamins and various nitrogen sources that promote optimal cell
growth.
The unexpected respiratory activity displayed after exhaustion of glucose in the culture can
therefore be viewed as catabolism of secondary carbon sources in the medium, such as ethanol
produced from glucose metabolism as well as the protein and amino acid constituents of the YPD
mixture. The extreme oxygen uptake rates seen towards the end of the run were likely due to a
combination of both the high biomass concentration and the greater metabolic demand of utilising
these complex carbon sources. To avoid such prolonged and unpredictable growth, alternative
culture media was considered.
Experiments that rely on predictable yeast metabolism often involve the use of defined minimal
media which contain only glucose and the necessary salts and vitamins required for growth
(Bergman, 2001). Such media recipes can contain over 20 individual constituents (e.g. Verduyn et
al., 1992) and are therefore costly to prepare. However, as predictable growth was required to
proceed with fed-batch culture, effort was made to prepare a simple minimal medium for this
purpose.
0
2
4
6
8
10
12
14
16
18
20
0
20
40
60
80
100
120
140
0 5 10 15 20 25 30
Glu
cose
(g/
L)
OU
R (
%/m
in)
t (hrs)
First Fed-Batch Run
OUR
Glucose
31
4.5.2. Second Fed-Batch Run
The growth medium used for the second fed-batch attempt was comprised only of: glucose; a
commercially available yeast nutrient supplement (Wyeast Laboratories Inc, USA) to provide
vitamins, minerals and trace elements; and sufficient ammonium hydroxide to adjust the pH to 5.0
and act as a nitrogen source. This media recipe is provided in Appendix 8B. This medium was also
used to generate the starter culture which was used to inoculate the bioreactor. Following
inoculation, the culture demonstrated very little growth, with the OUR increasing only slightly over
eight hours, and biomass remaining under 1g/L (data not shown). The experiment was ceased at
this point due to insufficient growth. The likely cause for the growth limitation was insufficient
nitrogen or absence of some other necessary nutrient.
4.5.3. Third Fed-Batch Run
For the final fed-batch run, a growth medium was constructed using glucose and all common media
salts that could be located within the department. These included sufficient nitrogen, phosphate
and sulphur sources. The medium was supplemented with the nutrient blend mentioned above to
provide vitamins and trace elements. The full recipe is provided in Appendix 8B. The medium was
used to generate the starter culture and inoculate the bioreactor. OUR, glucose concentration and
biomass are plotted in Figure 3.10. The culture appears to demonstrate reasonable growth,
although not achieving the 3g/L biomass concentration seen in batch culture with YPD medium.
Again, the OUR exhibits a sharp rise after consumption of glucose, although this appeared to plateau
rather than increase dramatically as in the first fed-batch attempt. In the absence of complex media
constituents, this likely represents ethanol catabolism. After 18 hours, when glucose levels fell
below detectable limits, biomass concentration appeared stable and exit gas carbon dioxide has
fallen. Fed-batch mode was commenced at this point by switching on the feed controller.
Figure 3.11 shows the OUR, glucose and carbon dioxide levels after commencement of feeding.
Glucose concentration quickly rose above the critical level of 0.1g/L and coincided with a rapid
increase in exit gas carbon dioxide, indicating anaerobic fermentation. Feeding was stopped at this
point and the glucose concentration fell over the next hour. Feeding was again commenced but with
0
0.2
0.4
0.6
0.8
1
1.2
1.4
1.6
1.8
2
0
2
4
6
8
10
12
14
16
0 5 10 15
Bio
mas
s
OU
R, g
luco
se
t (hrs)
Third Fed-Batch Run
OUR (%/min)
Glucose (g/L)
Biomass (g/L)
Figure 4.10. OUR, glucose and biomass during initial batch phase of third fed-batch run. OUR demonstrates a second peak after exhaustion of glucose.
32
similar results (not shown). These results indicate that glucose consumption was far less rapid than
expected, and accumulation of substrate quickly resulted in anaerobic respiration via the Crabtree
effect. The experiment was terminated due to this behaviour.
The likely explanation for these results is that, as suggested by the pre-feeding data, the cells were
actively consuming ethanol at commencement of feeding. Utilisation of a secondary carbon source
requires a metabolic shift that involves suppression of the enzymes involved in glucose acquisition
and a dedication to the pathway required for catabolism of the new carbon source (El-Mansi and
Ward, 2007). Therefore, upon feeding, there was a delayed response to the reintroduction of
glucose to the medium and it was allowed to quickly accumulate. The culture then fermented the
glucose anaerobically as it existed in a concentration beyond the Crabtree threshold. Subsequent
re-commencement of feeding had the same effect as the culture was still dedicated to ethanol
consumption. This issue could perhaps have been circumvented by running batch fermentation
longer to ensure complete exhaustion of all substrates. However, as demonstrated by the first fed-
batch attempt, this phase can continue for a significantly long time and conducting experiments of
this length becomes unpractical. Possible solutions to this issue are discussed in the Section 5.7.
0
2
4
6
8
10
12
14
16
18
-0.05
0
0.05
0.1
0.15
0.2
0.25
0.3
0.35
0.4
0 0.5 1 1.5 2 2.5
OU
R
Glu
cose
, CO
2
t (hrs)
Third Fed-Batch Run
CO2 (%)
Glucose (g/L)
OUR (%/min)
Figure 4.11. OUR, glucose and CO2 following initiation of feeding at t=0. CO2 rises rapidly and glucose exceeds critical value. Biomass remained stable during this period and is not shown.
33
5. Conclusions and Recommendations
5.1. General
Although parameter estimation was ultimately unsuccessful, the first objective of the project was
achieved and the experiments fostered the exploration and understanding of a range of important
principles related to bioreactor operation and microbial culture. The project has resulted in the
establishment of a dedicated bioreactor laboratory and identified several key areas for investigation
that could potentially form the basis of new research projects. The bioreactor and its related
equipment have been shown to be suitable for the three main modes of bioreactor operation,
namely, batch, continuous and fed-batch, and the LabVIEW control program has been further
developed to accommodate these.
The factors responsible for failure of the parameter estimation experiments have been identified,
and are considered rectifiable for future runs. However, the lengthy preparation and running times
associated with bioreactor experiments limited the number of runs that could be conducted in the
project timespan. Additionally, setbacks such as the faulty gas analyser and pH probe, as well as the
compressed air line not being fitted until several weeks into the project, caused delay in
commencement of culture experiments.
Given that bioreactor experiments work with living organisms governed by complex biochemical
processes, it is reasonable to assume that successful experiments require many trials in order to gain
familiarity with the growth characteristics of the organism, which are most often specific to the
microbe strain and culture conditions used. As such, the experiments of this project have yielded
valuable information regarding the growth patterns, culture times, nutritive requirements and
metabolic activity of baker’s yeast in the Murdoch bioreactor that will aid the design of future
experiments.
The experiments of this project raised several key issues that warrant discussion, and this is provided
below. Suggested alterations to the bioreactor hardware and software, as well as experimental
design, are provided where appropriate. In some cases, potential improvements represent a
significant body of work that could form the foundation of a future project, and these are identified
in Section 5.
5.2. Oxygen Uptake Measurement
The malfunctioning gas analyser presented perhaps the most significant challenge of the project.
Within the limitations of the Murdoch bioreactor instrumentation, quantification of cellular
respiration represents the only viable online method of estimating growth rate and predicting
biomass. Accurate measurement of oxygen uptake is therefore integral to bioreactor control.
To overcome this issue, an alternative method of OUR measurement was devised that relied on
measurements from the dissolved oxygen probe. This technique was shown to produce expected
results during batch culture experiments. However, the method suffered several drawbacks.
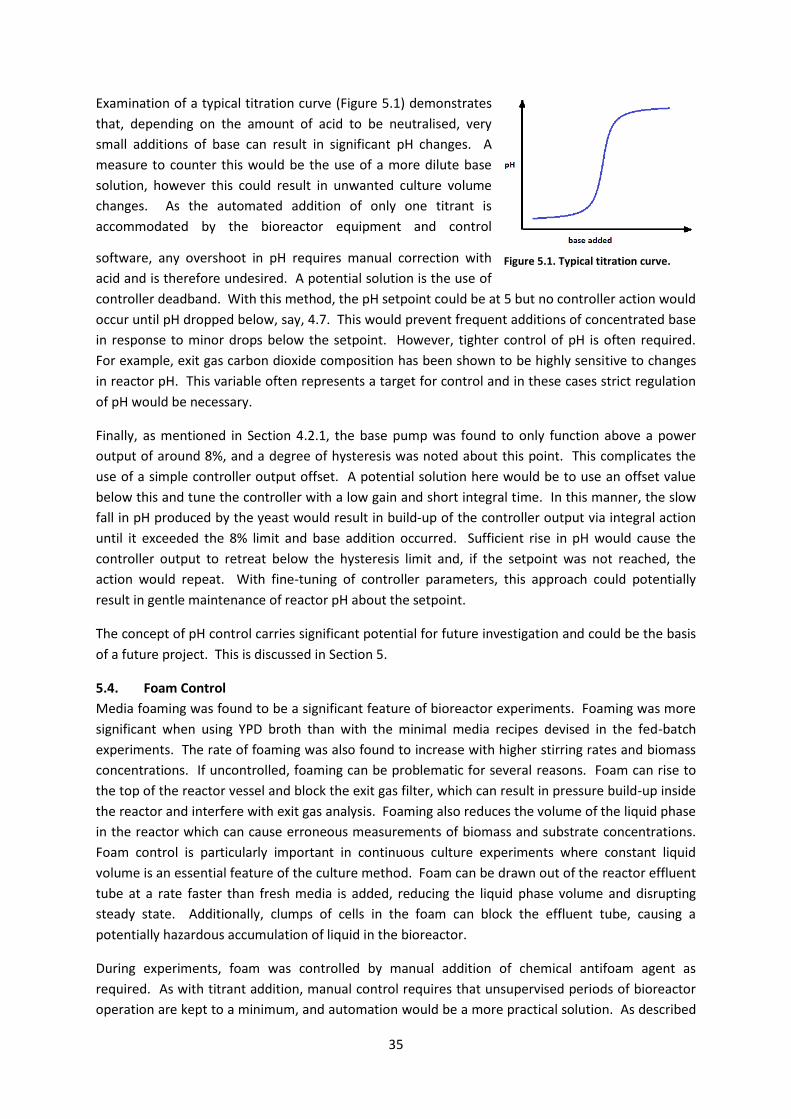
The nature of the method requires that measurements be taken some time apart to allow the
dissolved oxygen level to regain stability prior to the next measurement. Depending on the rate of
uptake and the concomitant timing parameters used, this could be up to 10 minutes. Compared to
the almost continuous quantification of uptake provided by the gas analyser, this property of the
34
gas-out method is significantly inferior. Although the dynamics of yeast growth are sufficiently slow
to be captured by this frequency, fewer measurements increase the significance of measurement
error and this is of particular importance when measurements are used to calculate a cumulative
estimation of biomass, such as that provided by Eqn. (3), as these errors accumulate over time.
Another important limitation of the method is that the timing parameters require adjustment over
time in accordance with the rate of uptake exhibited by the culture. At low uptake rates, a relatively
long gas-out time and reading interval is required to adequately capture the low gradient of DO
decline. Conversely, at high uptake rates, gas-out time must be brief in order to prevent DO levels
becoming critically low and negatively affecting growth. This necessitates a high level of user
attendance during bioreactor runs. This issue could, potentially, be improved by incorporation of a
controller that automatically scales gas-out time and reading interval based on the previous OUR
measurement. Such a feature would progressively shorten gas-out times as culture respiration
increases and lengthen them as it declines.
Finally, as noted in Section 4.2.2, gas outages result in vessel pressure drops that interfere with gas
analyser carbon dioxide readings. This is in part due to the current method of reactor pressure
regulation and a potential solution was mentioned in Section 4.1.2.
Due to the importance of accurate and frequent online measurement of oxygen uptake in bioreactor
control and the disadvantages of the gas-out method discussed here, repair or replacement of the
laboratory gas analyser is the primary recommendation arising from this project.
An interesting and potentially very useful alternative to using oxygen uptake measurement to
estimate biomass growth is the use of an online optical density meter. Such devices attach to the
exterior wall of bioreactor vessels and monitor culture optical density online, negating frequent
sampling and subsequent offline measurement. These apparatuses have the obvious advantage of
estimating cell growth via direct application of spectrophotometry rather indirect estimation using a
previously correlated relationship between respiratory activity and offline optical density
measurement. Should purchase of such a device be feasible, the installation, calibration and
performance evaluation could form the basis of a potential project. This prospect is discussed in
Section 5.3.
5.3. pH Control
As noted in the Results, the pH control loop was activated during the first batch run and found to be
tuned too aggressively, causing excessive base addition and likely demise of the culture. Due to this
potential to irreversibly affect culture viability, use of the controller was avoided in subsequent
experiments and pH was maintained by manual titrant additions. This limited the length of time the
bioreactor could be left unsupervised, and automated control is therefore desired. Acidification of
culture media by the yeast was found to be a fairly slow process, taking around four to five hours to
achieve a pH drop of 0.5, although this was more rapid in the defined medium of the final fed-batch
experiment, likely due to the absence of buffering by amino acids. This process is, however,
dependent on the biomass concentration and growth rate and would be more significant in high-
cell-density cultures. A primary safeguard against pH changes would the addition of a suitable buffer
to growth media, though constant acid production by the yeast would eventually neutralise this.
35
Examination of a typical titration curve (Figure 5.1) demonstrates
that, depending on the amount of acid to be neutralised, very
small additions of base can result in significant pH changes. A
measure to counter this would be the use of a more dilute base
solution, however this could result in unwanted culture volume
changes. As the automated addition of only one titrant is
accommodated by the bioreactor equipment and control
software, any overshoot in pH requires manual correction with
acid and is therefore undesired. A potential solution is the use of
controller deadband. With this method, the pH setpoint could be at 5 but no controller action would
occur until pH dropped below, say, 4.7. This would prevent frequent additions of concentrated base
in response to minor drops below the setpoint. However, tighter control of pH is often required.
For example, exit gas carbon dioxide composition has been shown to be highly sensitive to changes
in reactor pH. This variable often represents a target for control and in these cases strict regulation
of pH would be necessary.
Finally, as mentioned in Section 4.2.1, the base pump was found to only function above a power
output of around 8%, and a degree of hysteresis was noted about this point. This complicates the
use of a simple controller output offset. A potential solution here would be to use an offset value
below this and tune the controller with a low gain and short integral time. In this manner, the slow
fall in pH produced by the yeast would result in build-up of the controller output via integral action
until it exceeded the 8% limit and base addition occurred. Sufficient rise in pH would cause the
controller output to retreat below the hysteresis limit and, if the setpoint was not reached, the
action would repeat. With fine-tuning of controller parameters, this approach could potentially
result in gentle maintenance of reactor pH about the setpoint.
The concept of pH control carries significant potential for future investigation and could be the basis
of a future project. This is discussed in Section 5.
5.4. Foam Control
Media foaming was found to be a significant feature of bioreactor experiments. Foaming was more
significant when using YPD broth than with the minimal media recipes devised in the fed-batch
experiments. The rate of foaming was also found to increase with higher stirring rates and biomass
concentrations. If uncontrolled, foaming can be problematic for several reasons. Foam can rise to
the top of the reactor vessel and block the exit gas filter, which can result in pressure build-up inside
the reactor and interfere with exit gas analysis. Foaming also reduces the volume of the liquid phase
in the reactor which can cause erroneous measurements of biomass and substrate concentrations.
Foam control is particularly important in continuous culture experiments where constant liquid
volume is an essential feature of the culture method. Foam can be drawn out of the reactor effluent
tube at a rate faster than fresh media is added, reducing the liquid phase volume and disrupting
steady state. Additionally, clumps of cells in the foam can block the effluent tube, causing a
potentially hazardous accumulation of liquid in the bioreactor.
During experiments, foam was controlled by manual addition of chemical antifoam agent as
required. As with titrant addition, manual control requires that unsupervised periods of bioreactor
operation are kept to a minimum, and automation would be a more practical solution. As described
Figure 5.1. Typical titration curve.
36
in Section 4.3, a simple timed loop was added to the LabVIEW control program that operated a
pump connected to an antifoam reservoir. However, foaming appeared to be relatively
unpredictable and excess antifoam addition caused temporary impairment of oxygen transfer to the
liquid phase, interfering with dissolved oxygen control and oxygen uptake measurement. Further
work is therefore required to determine the optimum frequency and pulse length of automated
antifoam addition. Alternatively, a foaming probe could be purchased and used to facilitate
automated foam control. These probes often have dual function as a level sensor and would thus be
a useful addition to the bioreactor hardware.
5.5. Asepsis
Whilst due care was taken to ensure sterility, contamination of the continuous culture experiment
highlights aseptic technique as an important issue in bioreactor use. The risk of contamination is
greater in continuous culture than batch culture for two reasons. Firstly, batch culture is less
conducive to contaminants as it involves relatively high numbers of yeast cells growing at a fast rate,
and a small amount of introduced contaminant is likely to be outcompeted by the yeast and killed by
increasing ethanol production. In a continuous culture, the continuous turnover of culture media
limits the yeast to a fixed population size and a low specific growth rate, and ethanol is removed as
effluent. This environment therefore provides significant opportunity for a fast-metabolising
contaminant to out-compete the yeast and become dominant in the culture. The second reason is
that continuous culture requires production, sterilisation and mixing of a large volume of fresh
media which is stored at ambient temperature during the long course of the experiment. Any
contaminant introduced after sterilisation has the opportunity to grow unrestricted in the feed
reservoir before being added to the bioreactor, and can thus be introduced at a relatively high cell
concentration. This factor also poses a risk in fed-batch culture, which similarly requires a sterile
feed reservoir and lacks the protective quality of ethanol production.
In research environments, antibiotics are often used during microbial culture to prevent
contamination. In these cases, the strain of microbe being studied would possess an introduced
antibiotic resistance gene so that only the desired microbe could grow in the medium. For the yeast
used in this project, a bactericidal agent could be added to the media to prevent bacterial growth,
however contamination would still be possible by wild yeast strains. Future projects could
potentially explore the use of transformed, antibiotic-resistant yeast strains available through
research institutions.
5.6. Fed-Batch Simulation
The fed-batch simulations raised two important issues that warrant discussion. Firstly, they
demonstrated that the slowest feed pump speed achievable was incompatible with high feed
glucose concentrations. The simulations also suggested that the transient response of the specific
growth rate to setpoint changes could potentially result in substrate accumulation above the critical
level for aerobic growth.
The pump speed constraint represents a significant obstacle in the use of fed-batch culture to
achieve high biomass concentrations. The necessitated use of lower feed concentrations means that
maximum culture volume is reached earlier, limiting the run length and maximum biomass growth.
Theoretically, the flow rate at the lowest pump speed could be decreased by the use of tubing with a
smaller internal diameter, as the liquid volume moved each pump cycle would be less. However, the
37
tubing currently used has an ID of 0.5mm and it is uncertain whether smaller diameter tubing is
readily available.
Apart from acquisition of a more suitable pump, the only other viable solution would be to use a
greater initial biomass for fed-batch runs. This would allow for higher feed concentrations due to
more rapid substrate uptake. At present, the laboratory facilities only allow for culture of one
starter culture flask at a time. An incubated or water-bath orbital shaker would allow several starter
cultures to be grown concurrently and then pooled for inoculation. This would also negate the use
of long batch cultures prior to fed-batch experiments, which proved problematic in this project.
The other important concept demonstrated by the simulations was that setpoint changes in the
open-loop feed controller caused simulated substrate build-up during the growth rate rise time,
which accumulated over several changes. This is due to the controller immediately outputting a
feed rate commensurate with the new setpoint but the actual growth rate requiring some time to
reach this. This issue could potentially be circumvented by the use of ramped setpoint changes.
This would involve the relatively simple addition of a ’for’ loop to the LabVIEW program that, upon a
setpoint change, incrementally increases the setpoint value sent to the controller over a specified
amount of time until it reaches the newly desired value. In this manner, specific growth rate would
remain close to the setpoint over the course of the change and little excess substrate will
accumulate.
5.7. Fed-Batch Culture
The problems encountered with the fed-batch experiments stemmed from the use of initial batch
phases to build up biomass concentration prior to initiation of feeding. In the first experiment,
secondary carbon sources in the complex medium promoted prolonged growth, resulting in long
running time and problematic OUR measurement. The final fed-batch experiment, which used a
more limited growth medium, lacked the more unpredictable growth pattern displayed by the first
run but did display some secondary growth which resulted in a sluggish response to glucose feeding.
In the case of the final run, complete exhaustion of carbon sources could have been achieved by
allowing the experiment to run longer. However, as the prolonged supervision and frequent
sampling requirements of the bioreactor during long runs can result in user fatigue and therefore
pose a safety risk, such lengthy pre-feeding stages are undesirable. Additionally, at long running
times, the usually negligible rate of cell death becomes more significant. As optical density
measures the total biomass concentration rather than the proportion of viable cells, resultant
overestimation of viable biomass can cause excess feeding by the feed controller. The best solution
would be to use a large inoculum size, as described in the previous section. A large starter culture
could be added to glucose-free minimal media in the bioreactor. This would then require only a
short fermentation period to consume ethanol and any other metabolic by-products before feeding
could commence. The laboratory requirements for this process were previously described.
The fed-batch experiments demonstrated the importance of media composition in achieving desired
yeast growth. The complex YPD medium proved useful for achieving rapid growth and high cell
numbers and is therefore suited toward applications where these traits are desired, such as
equipment and control testing. The defined minimal medium used in the final batch run, although
more costly to prepare, provides strict control over the carbon sources and nutrients available to the
yeast and is therefore appropriate for metabolic studies and those where predictable growth is
38
desired. It is important to note that the minimal medium lacked several different nutrients that are
commonly present in such recipes due to the unavailability of these compounds. These would likely
be conducive to greater cell health and should be obtained for future experiments if possible.
5.8. Supervision
An important issue raised by the project was the requirement for frequent supervision of the
bioreactor during long runs. The batch runs presented here typically ran for at least 17 hours with
further time scheduled for fed-batch phases. Even the use of a faster-growing organism such as
bacteria would generally require at least 10-12 hours to complete a typical growth cycle, and
measures to reduce the required amount of user attendance are therefore desirable. The key
factors currently necessitating frequent supervision are: (i) adjustment of the oxygen uptake
measurement parameters; (ii) manual pH adjustments; (iii) foam control; and (iv) sampling.
Potential remedies to the first three factors have been discussed elsewhere in this section. The
importance of sampling could be reduced by the development of an accurate method of online
biomass estimation, such as those possible with a fully functional gas analyser or an online optical
density monitor. Supervision requirement would be further reduced by the introduction of remote
monitoring and control, and this prospect is further discussed in Section 5.
39
6. Future Work As a result of this project, four key areas for potential future work have been identified.
6.1. Computer and Software Update
Perhaps the most urgent topic for attention concerns the bioreactor control computer. At present,
the bioreactor is controlled by an old computer which is significantly inferior to the majority of those
in the University. The limited memory capacity of the computer caused frequent freezing of the
computer during bioreactor runs and due care was required to minimise these events. Additionally,
the LabVIEW platform used to run the control program (v8.5) is much older than the most recent
version (2012) licensed by the University. Opening the existing program with the newest version of
LabVIEW results in several incompatibility issues, apparently due to obsolete subVIs from the old
version. Finally, the operating system of the computer (Windows 2000) will soon be no longer
supported by the School network.
Establishment of a new bioreactor control computer is therefore recommended. A new computer is
available in the laboratory for this purpose. The two principal tasks of such a project would be to:
(i) establish hardware connections between the new computer and bioreactor and ensure correct
functionality; and (ii) debug the control program to achieve full compatibility with the most current
LabVIEW platform.
6.2. pH Control
This project identified automated pH control of the Murdoch bioreactor to be a topic that warrants
future work. The current problems and some possible solutions were discussed in Section 5.3.
Additionally, a more precise method of pH control would involve the addition of an acid pump to
allow bidirectional adjustment of pH. Control strategies more complex than the simple PID loop
existing in the current LabVIEW program could potentially be investigated, such as the
gain-scheduled adaptive approach developed by Gnoth et al. (2010).
6.3. Optical Density Monitoring
As suggested in Section 5.2, a valuable addition the bioreactor instrumentation would be an external
optical density monitor to negate regular sampling of the bioreactor and allow continuous online
estimation of reactor biomass concentration. Implementation of such a device would require
several steps: (i) interfacing of the sensor with the control computer and development of a
communication protocol in LabVIEW; (ii) calibration of the sensor and correlation with offline dry
biomass weights; and (iii) the application of filtering or other techniques to allow accurate online
estimation of biomass. The device could then be used to estimate specific growth rate, which could
form a process variable for future control strategies.
6.4. Remote Monitoring and Control
A potential solution to negate the need for constant laboratory attendance during long runs would
be the implementation of remote logging and control capabilities. LabVIEW software provides the
means to establish a web server through which information is communicated to a user-developed
internet website. Use of this feature would allow important parameters to be monitored remotely
through a custom web interface, and system outputs to be adjusted online as required. Further
work could explore the use of the mobile phone communication software developed by National
40
Instruments, such as Data Dashboard for LabVIEW, to develop a mobile application for monitoring
and control.
41
7. References Albergaria, Helena, Luis C Duarte, MT Amaral-Collaço, and Francisco M Gírio. "Study of Saccharomyces Uvarum Ccmi 885 Physiology under Fed-Batch, Chemostat and Accelerostat Cultivation Techniques." Food Technology and Biotechnology 38, no. 1 (2000). Allman, A.R. "Fermentors: Design, Operation and Applications." In Fermentation Microbiology & Biotechnology, edited by E.M.T. El-Mansi, 407-50. Boca Raton, FL: CRC Press, 2007. Bandyopadhyay, B, AE Humphrey, and H Taguchi. "Dynamic Measurement of the Volumetric Oxygen Transfer Coefficient in Fermentation Systems." Biotechnology and Bioengineering 9, no. 4 (1967): 533-44. Bergman, Lawrence W. "Growth and Maintenance of Yeast." In Two-Hybrid Systems, 9-14: Springer, 2001. Caputi, Arthur, Masao Ueda, and Thomas Brown. "Spectrophotometric Determination of Ethanol in Wine." American Journal of Enology and Viticulture 19, no. 3 (1968): 160-65. Dickinson, J.R. "Metabolism and Biosynthesis." In Saccharomyces, edited by M Tuitte. Biotechnology Handbooks, 59-89: New York, USA: Plenum Press, 1991. Ejiofor, Anthony O, Yusuf Chisti, and Murray Moo-Young. "Culture of Saccharomyces Cerevisiae on Hydrolyzed Waste Cassava Starch for Production of Baking-Quality Yeast." Enzyme and microbial technology 18, no. 7 (1996): 519-25. El-Mansi, E.M.T., and F.B. Ward. "Microbiology of Industrial Fermentation." In Fermentation Microbiology & Biotechnology, edited by E.M.T. El-Mansi, 11-37. Boca Raton, FL: CRC Press, 2007. Feldmann, H. Yeast: Molecular and Cell Biology. Germany: John Wiley & Sons, 2010. Gnoth, S, A Kuprijanov, R Simutis, and A Lübbert. "Simple Adaptive Ph Control in Bioreactors Using Gain-Scheduling Methods." Applied microbiology and biotechnology 85, no. 4 (2010): 955-64. Heinzle, E., A. Oeggerli, and B. Dettwiler. "On-Line Fermentation Gas Analysis: Error Analysis and Application of Mass Spectrometry." Analytica Chimica Acta 238, no. 0 (1990): 101-15. Hoskisson, Paul A, and Glyn Hobbs. "Continuous Culture–Making a Comeback?". Microbiology 151, no. 10 (2005): 3153-59. Jain, Viney Kumar. "Relationship between Energy Metabolism and Growth." Archiv für Mikrobiologie 72, no. 3 (1970): 252-59. Komives, Claire, and Robert S Parker. "Bioreactor State Estimation and Control." Current Opinion in Bbiotechnology 14, no. 5 (2003): 468-74. Lee, Jeongseok, Sang Yup Lee, Sunwon Park, and Anton PJ Middelberg. "Control of Fed-Batch Fermentations." Biotechnology advances 17, no. 1 (1999): 29-48. Leuenberger, Hans Georg W. "Cultivation of Saccharomyces Cerevisiae in Continuous Culture." Archiv für Mikrobiologie 83, no. 4 (1972): 347-58. Moulin, G, Hélène Boze, and P Galzy. "Inhibition of Alcoholic Fermentation." Biotechnology and Genetic Engineering Reviews 2, no. 1 (1984): 365-82. Mrwebi, Mandisi. "Testing Monod: Growth Rate as a Function of Glucose Concentration in Saccharomyces Cerevisiae." Stellenbosch: University of Stellenbosch, 2004. Nielsen, J. "Fermentation Kinetics." In Fermentation Microbiology & Biotechnology, edited by E.M.T. El-Mansi, 47-95. Boca Raton, FL: CRC Press, 2007. Omstead, Daniel R, Janice A Phillips, and Arthur E Humphrey. "Indirect Parameter Estimation." In Computer Control of Fermentation Processes, edited by Daniel R Omstead, 107-28: CRC Press Inc.: Boca Raton, FL, 1990. O'Neil, DG, and G Lyberatos. "Dynamic Model Development for a Continuous Culture of Saccharomyces Cerevisiae." Biotechnology and bioengineering 36, no. 5 (1990): 437-45.
42
Paalme, T, R Elken, R Vilu, and M Korhola. "Growth Efficiency of Saccharomyces cerevisiae on Glucose/Ethanol Media with a Smooth Change in the Dilution Rate (a-Stat)." Enzyme and Microbial Technology 20, no. 3 (1997): 174-81. Paalme, Toomas, Anne Kahru, Raul Elken, Kalju Vanatalu, Kalle Tiisma, and Vilu Raivo. "The Computer-Controlled Continuous Culture of Escherichia coli with Smooth Change of Dilution Rate (a-Stat)." Journal of Microbiological Methods 24, no. 2 (1995): 145-53. Parulekar, Satish J., Gary B. Semones, Michael J. Rolf, Jefferson C. Lievense, and Henry C. Lim. "Induction and elimination of oscillations in continuous cultures of Saccharomyces cerevisiae." Biotechnology and bioengineering 28, no. 5 (1986): 700-710. Popovid, M, H Niebelschütz, and M Reuss. "Oxygen Solubilities in Fermentation Fluids." European Journal of Applied Microbiology and Biotechnology 8, no. 1-2 (1979): 1-15. Postma, E., C. Verduyn, W. Scheffers, and J.P. van Dijken. "Enzymic Analysis of the Crabtree Effect in Glucose-Limited Chemostat Cultures of Saccharomyces Cerevisiae." Applied and Environmental Microbiology 55, no. 2 (1989): 468-77. Pronk, Jack T, H Yde Steensma, and JOHANNES P Van Dijken. "Pyruvate Metabolism in Saccharomyces cerevisiae." Yeast 12, no. 16 (1996): 1607-33. Rosenfeld, Eric, Bertrand Beauvoit, Bruno Blondin, and Jean-Michel Salmon. "Oxygen Consumption by Anaerobic Saccharomyces Cerevisiae under Enological Conditions: Effect on Fermentation Kinetics." Applied and Environmental Microbiology 69, no. 1 (2003): 113-21. Sigler, K, A Knotková, and A Kotyk. "Factors Governing Substrate-Induced Generation and Extrusion of Protons in the Yeast Saccharomyces Cerevisiae." Biochimica et Biophysica Acta (BBA)-Biomembranes 643, no. 3 (1981): 572-82. Stanbury, Peter F. Whitaker Allan. Principles of Fermentation Technology. Oxford: Pergamon Press, 1989. Suresh, S, VC Srivastava, and IM Mishra. "Techniques for Oxygen Transfer Measurement in Bioreactors: A Review." Journal of Chemical Technology and Biotechnology 84, no. 8 (2009): 1091-103. Tortora, Gerard J, Berdell R Funke, and L Christine. "Microbiology: An Introduction." San Francisco: Benjamin-Pearson, 2004. van Dijken, Johannes P, Ruud A Weusthuis, and Jack T Pronk. "Kinetics of Growth and Sugar Consumption in Yeasts." Antonie Van Leeuwenhoek 63, no. 3-4 (1993): 343-52. Van Hoek, Pim, Johannes P Van Dijken, and Jack T Pronk. "Effect of Specific Growth Rate on Fermentative Capacity of Baker’s Yeast." Applied and Environmental Microbiology 64, no. 11 (1998): 4226-33. Veldkamp, H, and Holger W Jannasch. "Mixed Culture Studies with the Chemostat." Journal of Applied Chemistry and Biotechnology 22, no. 1 (1972): 105-23. Verduyn, Cornelis, Erik Postma, W Alexander Scheffers, and Johannes P Van Dijken. "Effect of Benzoic Acid on Metabolic Fluxes in Yeasts: A Continuous‐Culture Study on the Regulation of Respiration and Alcoholic Fermentation." Yeast 8, no. 7 (1992): 501-17. Verduyn, Cornelis, Erik Postma, W Alexander Scheffers, and Johannes P Van Dijken.. "Physiology of Saccharomyces cerevisiae in Anaerobic Glucose-Limited Chemostat Culturesx." Journal of General Microbiology 136, no. 3 (1990): 395-403. Wang, Xiao‐Jia, and Ke‐Cheng Hsiao. "Sugar Degradation During Autoclaving: Effects of Duration and Solution Volume on Breakdown of Glucose." Physiologia Plantarum 94, no. 3 (1995): 415-18. White, Chris, and Jamil Zainasheff. Yeast : The Practical Guide to Beer Fermentation. Brewers Publications, 2010. Zabriskie, Dane W, and Arthur E Humphrey. "Real‐Time Estimation of Aerobic Batch Fermentation Biomass Concentration by Component Balancing." AIChE Journal 24, no. 1 (1978): 138-46.
43
8. Appendices
8A. LabVIEW and SIMULINK files
The main LabVIEW control program (mastervet2.vi, top level of mastervet2.llb library file), I/O
testing program (TestIO.vi) and SIMULINK model file (FedBatchModel.mdl) are provided as software
appendices. Opening the LabVIEW programs will likely involve several error messages due to
incompatibility issues with the version in which the files were written; simply click ‘Ok’ to each error
followed by ‘Ignore’ when errors are summarised.
In the main LabVIEW program, front-panel controls added as part of this project can be found under
the “General”, “Continuous”, and “Fed-Batch” tabs of the user interface. In the Block Diagram view,
features added as part of this project appear in the lower half of the diagram and are annotated as
appropriate, with references to relevant sections of this report.
In the SIMULINK model, a list of variable values used for the simulation in Section 4.2 is provided,
and these should be declared through the main MATLAB command window.
44
8B. Media Recipes
Recipes are provided below for all growth media used in the project. All components are per litre of
DI water.
Malt agar
Malt extract 30g
Agar 15g
YPD Broth
Yeast extract 10g
Bacto Peptone 20g
Glucose 20g
Used for all yeast cultures unless otherwise noted.
pH adjusted to 4.5-5 with 28% ammonium hydroxide.
Simple minimal medium
Glucose 20g
Yeast nutrient (Wyeast) 0.1g
Used for second fed-batch run.
pH adjusted to 4.5-5 with 28% ammonium hydroxide.
Defined minimal medium
Glucose 20g
Ammonium sulphate 10g
Yeast extract 5g
Monopotassium phosphate 5g
Magnesium sulphate 0.5g
Sodium chloride 0.3g
Yeast nutrient (Wyeast) 0.1g
Used for third fed-batch run.
pH adjusted to 4.5-5 with 28% ammonium hydroxide.
45
8C. Laboratory Inventory
An inventory of laboratory equipment and consumables is provided to act as a reference for future
work.
Equipment
Item Model/Manufacturer Use Notes
Steam steriliser HC2, Siltex Sterilising bioreactor fittings and media
Incubator 5160, Stuart Scientific Growing flask cultures for inoculation
Water bath Custom built Heating media components to aid dissolution
Laminar flow cabinet Emailair Sterile workspace Does not operate.
Centrifuge C-28, Boeco Obtaining cell-free supernatant for glucose/ethanol testing
UV/vis spectrophotometer
UVmini 1240, Shimadzu
Measuring sample optical density
4 x peristaltic pumps, two interfaced
313U, Watson Marlow
Automated addition of feed/titrant
One does not operate.
Gas analyser and power supply
NGA2000, Rosemount
Gas analysis Oxygen channel erroneus.
Moisture scrubbing column
Drierite Moisture removal for gas analysis
Personal blood glucose meter
Accu-chek Active, Roche
Measuring sample glucose concentration
Refrigerator Coldspace, GEC Storage of agar plates, media and samples
Small pH probe PBFA, Ionode For use with pH recycler
2 x 0-2000g mass balances, interfaced
Explorer, OHAUS Online monitoring of feed/titrant weights, weighing of >10g quantities of reagents
Serial connection of one balance is faulty, sent for repairs.
Precise mass balance SA210, Scientech Weighing of filtered biomass samples and <10g quantities of reagents
Various laboratory glassware – flasks, beakers, pipettes, etc.
Filter papers 0.45µm, Advantec Filtering samples for biomass measurement
1ml pipette tips For micropipette
Sterile syringes Bioreactor additions/inoculation
Sterile 10ml tubes Bioreactor sampling
Blood glucose test strips
Accu-Chek Active, Roche
Measuring sample glucose concentration
Reagents/gases
Item Model/Manufacturer Use Notes
Yeast extract Culture media
Peptone Culture media
Dextrose monohydrate Culture media
Yeast nutrient Culture media
Ammonium sulphate Culture media
Monopotassium phosphate
Culture media
Magnesium sulphate Culture media
Sodium chloride Culture media
Malt extract Culture media
Agar Culture media
Sulfuric acid Bioreactor titrant
Ammonium hydroxide Bioreactor titrant
Antifoam Foam control
Ethanol Sanitation
Oxygen cylinder G size, BOC gases Supply of pure oxygen to bioreactor culture
Nitrogen cylinder G size, BOC gases Gas analyser calibration
47
8D. Standard Curves
Correlated calibration data used for standard curves of OD versus biomass and pump speed versus
flow rate are provided below.
Biomass vs OD plot. Optical density measurements were correlated with filtered and dried biomass samples.
Pump power output versus flow rate. Flow rates were measured with a graduated cylinder and timer. Relationship became nonlinear below 20% pump power (not shown).
y = 0.3958x - 0.1591 R² = 0.9916
0
2
4
6
8
10
12
14
16
0 5 10 15 20 25 30 35 40
Dry
bio
mas
s co
nce
ntr
atio
n (
g/L)
Optical density
Biomass vs OD
y = 113.28x + 8.4864 R² = 0.999
0
10
20
30
40
50
60
70
80
90
100
0 0.1 0.2 0.3 0.4 0.5 0.6 0.7 0.8
Pu
mp
po
we
r o
utp
ut
(%)
Flow rate (L/hr)
Pump output vs Flow rate
48
8E. Formula Derivations
Derivation of balance equations presented in this thesis are provided below.
All balances are derived from the principle of conservation of mass:
Continuous Culture – Biomass Balance
Applying the above principle to continuous culture (i.e. constant volume):
and rearrangement gives:
At steady state,
so:
Fed-Batch Culture – Biomass Balance
From the principle above:
( )
Applying the product rule and noting that in fed-batch culture,
:
and rearrangement gives:
So:
( )
Fed-Batch Culture – Substrate Balance
From the mass balance principle:
( )
49
Using the product rule:
and rearranging gives:
( )
Fed-Batch Culture – Oxygen Uptake Rate
The equation used to model OUR in the simulation is obtained from rearrangement of the equation
presented in Section 1.1.5. This equation is taken from the paper by Zabriskie & Humphrey (1978)
and a detailed derivation is provided therein.
Fed-Batch Culture – Feed Controller
The equation for the feed flow controller presented in Section 1.3.2 and used fed-batch simulation
and experiments represents the rate of feeding required to sustain biomass growing at the setpoint
rate µS.
The solution to the linear differential form of biomass growth, ( )
is:
( )
The substrate uptake rate for this population is given by:
Supplying substrate at this rate from a feed solution of concentration Sf requires:
and substituting in the above exponential equation and rearranging gives: