Page 1
BIOREMEDIATION OF PETROLEUM HYDROCARBON CONTAMINATED SOIL USING INDIGENOUS CULCULTURES
BY
@ Zhongyun Ma, B. Eng.
A Thesis Submitted to the School of Graduate Studies
in Partial Fulf?laient of the Requirements for the Degree of
Master of Engineering
Faculty of Engineering & Applied Science
Mernorial University of Neopfomdland
April, 1998
St. John's, Newfomdland, Canada
Page 2
National Library 1*1 of Canada Bibliothèque nationale du Canada
Acquisitions and Acquisitions et Bibliographie Services services bibliographiques
395 Wellington Street 395. rue Wellington Ottawa ON KIAON4 OttawaON KlAONc) Canada Canada
The author has granted a non- exclusive Licence dowing the National Library of Canada to reproduce, loan, distribute or sell copies of this thesis in microform, paper or electronic formats.
The author retains ownership of the copyright in this thesis. Neither the thesis nor substantial extracts fkom it may be printed or otherwise reproduced without the author's permission.
L'auteur a accordé une licence non exclusive permettant à la Bibliothèque nationale du Canada de reproduire, prêter, distribuer ou vendre des copies de cette thèse sous la forme de microfiche/nlm, de reproduction sur papier ou sur format électronique.
L'auteur conserve la propriété du droit d'auteur qui protège cette thèse. Ni la thèse ni des extiaits substantiels de celle-ci ne doivent ê e imprimés ou autrement reproduits sans son autorisation.
Page 3
This research consisted of studyiog the biodegradation potential of Total Petroleum
HydrocacbOm (WH) in a diesel contaminated soil using indigenous cultures. From a site
investigation conducted on a pohted site in Argentia (Newfou11dland, Canada), typical soi1
profiles and contaminants were determineci fot helping in setting up an Environmental Test
Faciüty. The potential br bioremediation of soils in that area was studied in the laboratory.
Four kinds of cultures were hkted h m the petroleum hydrocarbon (diesel) contamiriateci
soil, enriched in the laboratory and injecteci into the soi1 as a seed to inaease the population
of cuitues. The contaminated soils were incubated in closed reacton at temperatures
rangkg h m 25 to 5 O C and pH values fiom 6 to 8. The addition of minerai salts as nutrients
was a h included. Surfactants were used as additional chernid to enhance the rate of
bio remediation
The degradation of TPH was evaluated by concentration monitoring (Gas
Chromatography) and bacteria counting. Temperature effcts study showed that
bio treat ability markediy decreased with decreasing t emperature. The optimal rate of
bioactivity was obtained in a neutral or slight acid condition, and suffactant Triton X-100
showed an enhancement of degradation of petroleum hydrocarbon, whiie the suffactant
Twen 60 did w t improve degradation. Nutrient requirement was a h clearly identifie&
Under optimal condition, the TPH removal efficiency reached 50% of the initial value. It was
also observeci that bacteria seediag is possible and echances the remediation rate.
Page 4
Swfiictants were used to wash diesel out of the contaminateci soils in column tests,
Distilleci water, 0.5% ( w h ) aqueous solution of surfactant Tween 60 and 0.5% (w/iv)
aqueous solution of surfactant Triton X-100 were used as leaching solutions. Corresponding
TPH removais were obtained as 5.3%, 21.7%, and 67.8% respectively, demomtrathg
potential etnciency of combinmg physical and biologicai remediation methods.
Page 5
1 greatly acknowledge the hancial support provided by the School of Graduate
Studies, the Facuity of Engineering & Applied Science at Memorial University of
Newfounnland and Dr. Pierre Morin's NSERC grant which made this work possible.
1 would iike to express my most sincere thadas to my supervisor Dr. Pierre Morin, br
his guidance, encouragement, and active support through the course of this work. 1 have
been bmioate that he advised me in the geoenvironmental area which will be valuable
knowledge in my career.
My special thanLs to Dr. Robert J. Helieur fkom the Department of Chemistry and
Dr-Tbakor R Patel fiom the Department of Biobgy at Memorial University of Newfoundland
for their closed attention, expert, and invaluable support in chernical analysis and biological
experiments.
1 would like to thank Dr. Keith M. Kosar and Mr. David J. Waiter fkom C-CORE; Ms.
Abgail Steel and Mr. Calvin. Ward fkom Engineering & Applied Science; Mr Edward Hudson
and Mr. JeBey Harris h m the Department of Chemistry, and Mt. Edward Acheampong
fkom the Department of Biology at Memorial University of Newfoundland for sharing their
technical expertise.
The love, understanding and support &en to me by my husband, Ruifeng, and my
son, Ling, are appreciated.
iii
Page 6
TABLE OF CONTENTS
AB STRACT
ACKNO WLEDGEMENT
TABLE OF CONTENTS
LIST OF FIGURES
LIST OF TABLES
LIST OF SYMBOLS
1 INTFtODUCTION
1 . 1 Petroleum Hydrocarbons in the Environment
1.2 Remediation of Petroleum Hydrocarbons
1.3 Objectives of This Study
2 LITERATURE REVIEW
2.1 Foundamentai Pnnciples of Bioremediation
2.1.1 Microorganisms in soi1
2.1.2 Role of microorganisms in biorernediation
2.1.3 Intrinsic and engineered bioremediation
2.2 Petroleum Hydrocarbon Bioremediation
2.2.1 Definition of Petroleum Hydrocarbon
2.2.2 General treatment methods for PH
2.2.3 In-situ and on site bioremediation
2.2.4 Laboratory treatability studies
2.3 Factors AfFecting Bioremediation
2.3.1 Microbiai factors
2.3 -2 Hydrocarbon variety and concentration
2.3.3 Soi1 structure
2.3 -4 Nutrients
Page 7
2.3.5 Oxygen
2.3 -6 Temperature
2.3.7 Soi1 Moisture
2.3.8 pH value
2.4 General Information on Degradation Pathway of PH
2.4.1 Degradation pathway of aiiphatic hydrocarbons
2.4.1.1 Oxidation of hydrocarbons
2.4.1.2 P-oxidation reaction
2-4.1.3 The TCA cycle
2.4.2 Degradation pathway of aromatic hydrocarbons
2.5 Surfactant Definition and Properties
2.5.1 CIassification of surfactants
2.5.2 Effects of surf'actant on PB biodegradation
3 THE ARGENTIA SITE AND TKE ENVIRONMENTAL
TESTING F A C m
3.1 Site Presentation
3 -2 Site Investigation
3.2.1 Soil sample collection
3.2.2 Extraction of hydrocarbons
3.2.3 Separation of hydrocarbons
3.2.4 Analysis o f contaminants
3.3.5 The Environmental testing facility
3 -4 Typical Protocol For Remediation of Contaminants
3.4.1 Operation of the treatment cell
3 -4.2 Water sampling and measurement
4 LABORATORY EXPERIMENTS: MATERIALS AND METHODS
4.1 Materiais
4.1.1 Soil
Page 8
4.1 -2 Petroleum hydrocarbon
4.1.3 Nutrients
4.1.4 Surfactants
4.2 Bacterid Cultures
4.2.1 Isolation of colonies from contaminated soil
4.2.2 Identification of colonies by Gram Stain technique
4.2.3 Enrichment of bacterial cultures
4.2.4 Microbial enurneration
4.2.5 Po tential for bio remediation
4.3 Analysis of Total Petroleum Hydrocarbons
4.3.1 Extraction of petroleum hydrocarbons
4.3 -2 Analysis methods
4.3.2.1 Instrument parameters
4.3 -2.2 Calibration standards
4.3.2.3 Calculation o f TPH concentration in soil
4.4 Bioremediation Tests on Soil Contaminated with PH
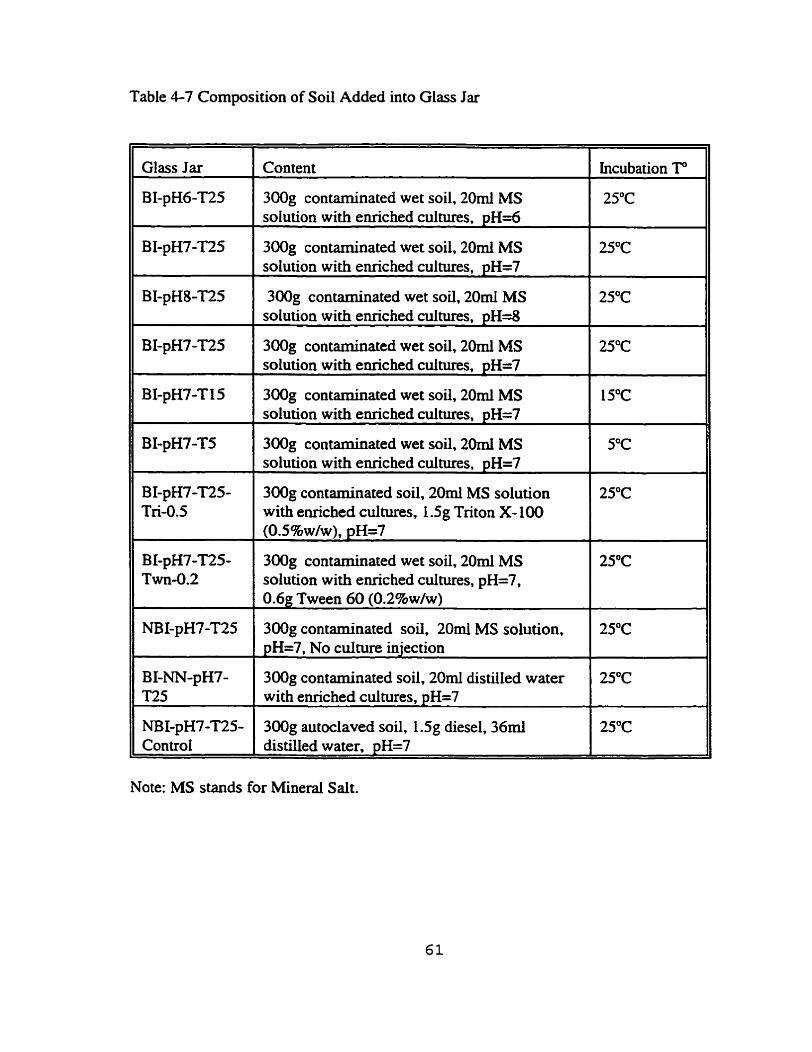
4.4.1 Set up the close system reactors and test procedures
4.4.2 Bactena seeding
4.4.3 Preparation of the control jar
4.5 Surfactant Treatment of Soil Contaminated with PH
4.5.1 Soil preparation
4.5.2 Preparation of surfactant solution
4.5.3 Experimental column set up
4.5.4 Extraction and analysis of contaminant
4.5.5 Determination of hydraulic conductivity
5 RESULTS AND DISCUSSION 66
5.1 Biodegradation of Contarninated Soil in Closed System Reactors 66
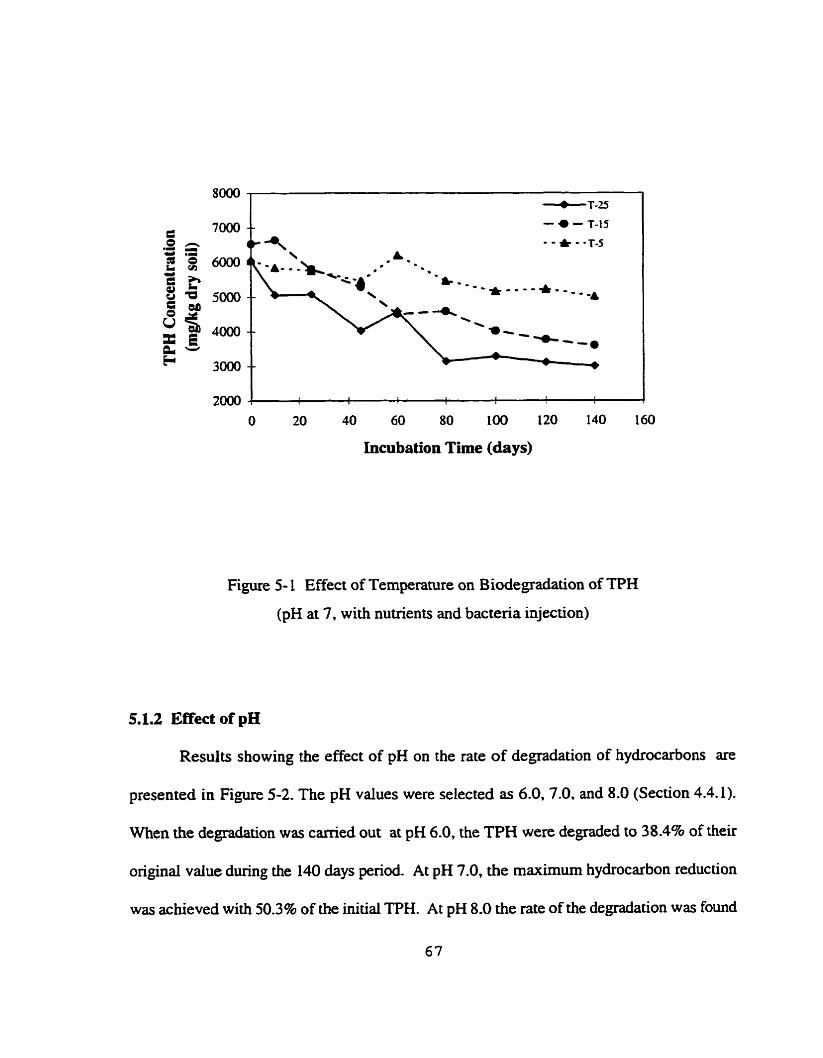
5.1.1 Effect of temperature 66
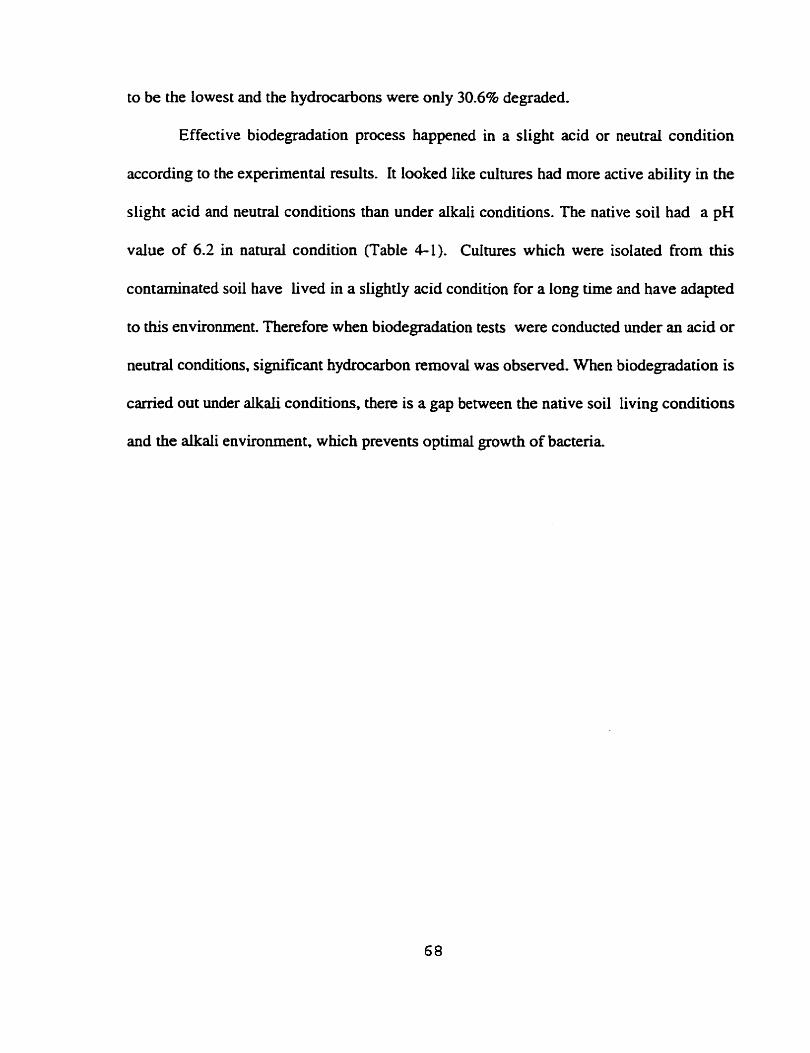
5.1 -2 Effect of pH 67
Page 9
5.1.3 Effect of surfactants
5.1.4 Effect of addi tional bacteria injection
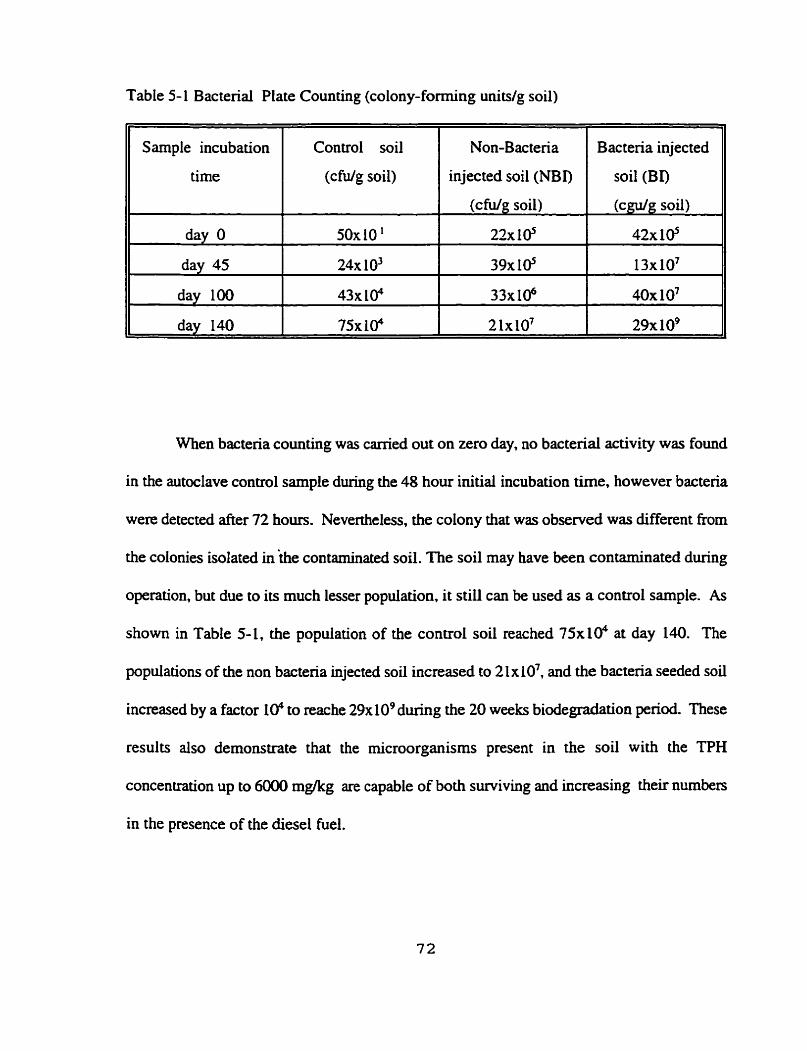
5.1.4.1 Bacteria counting
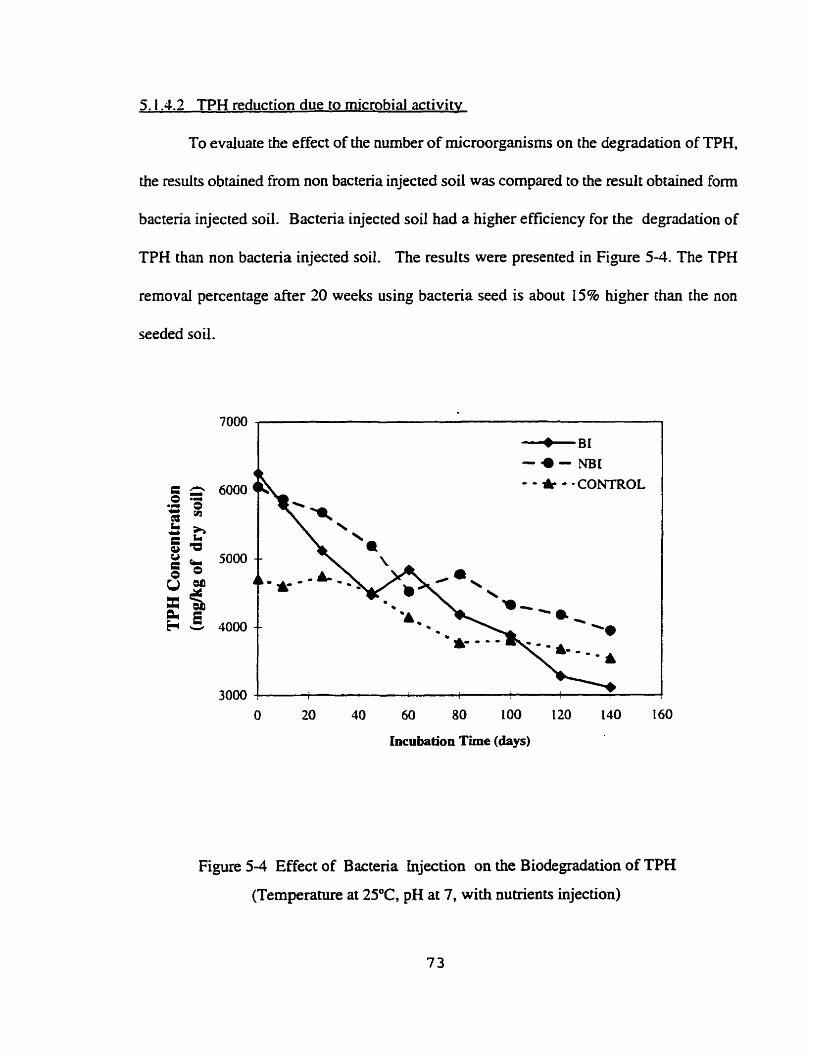
5.1.4.2 TPH reduction due to microbiai activity
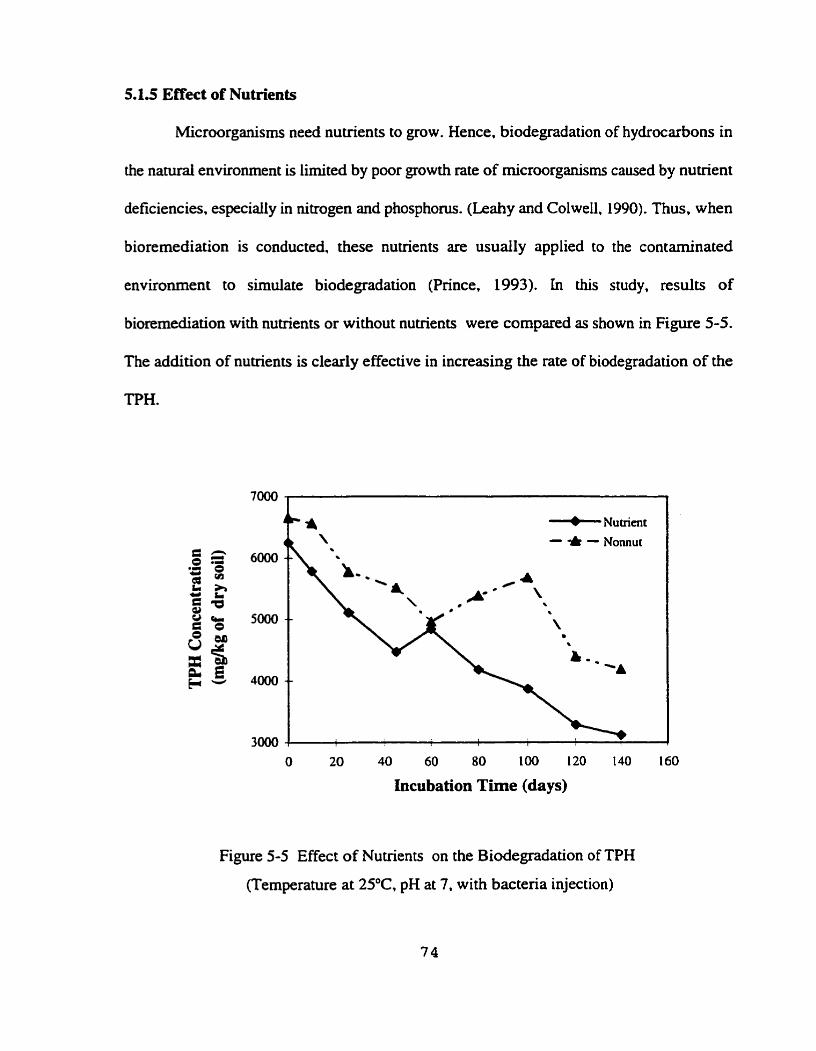
5.1.5 Effect of Nutrients
5. L .6 Summary of the laboratory degradation expenments
5.2 Effect of Surfactants on Removd of TPH in Coiurnn Tests
5.2.1 Surfactant as an agent for removal of diesel fuel
5.2.1. I Soiubilization
5.2-1.2 Mobilizauon
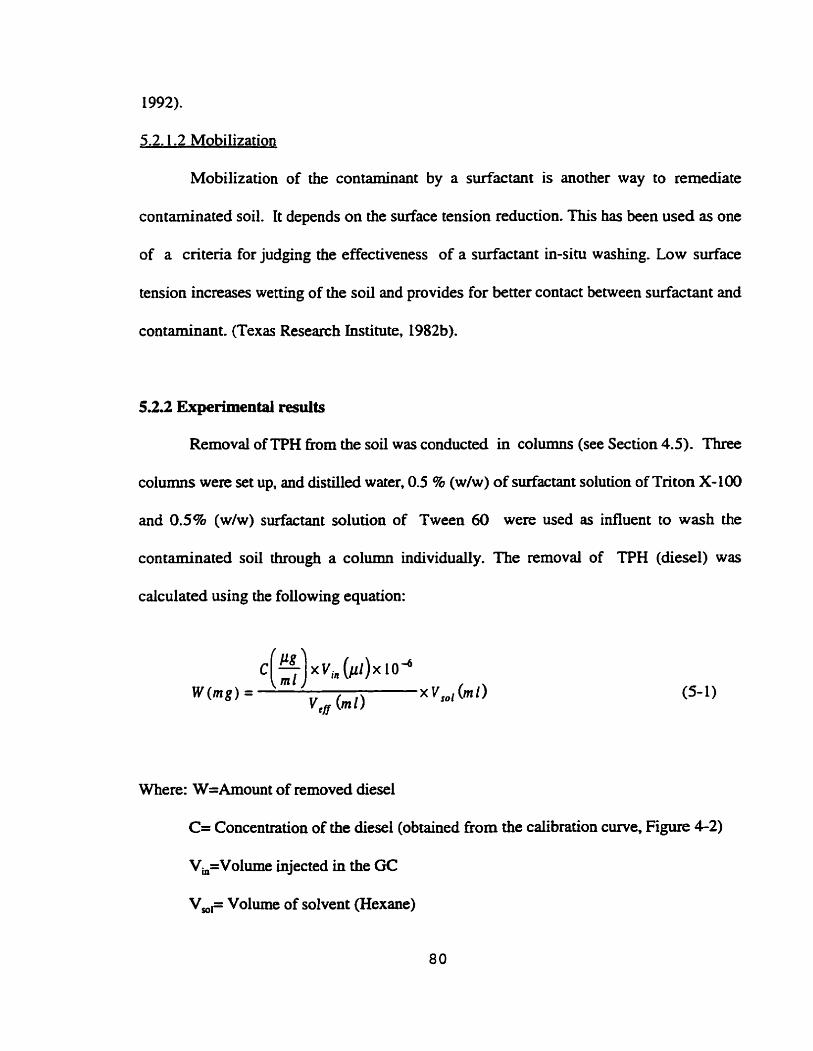
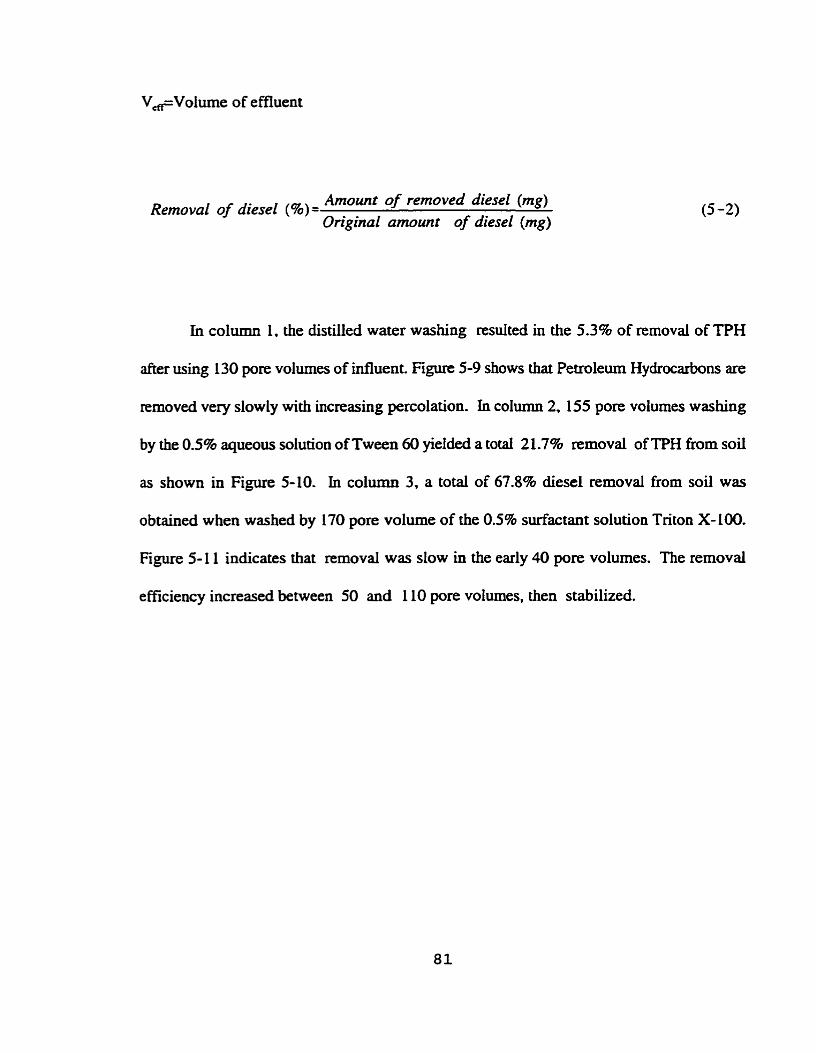
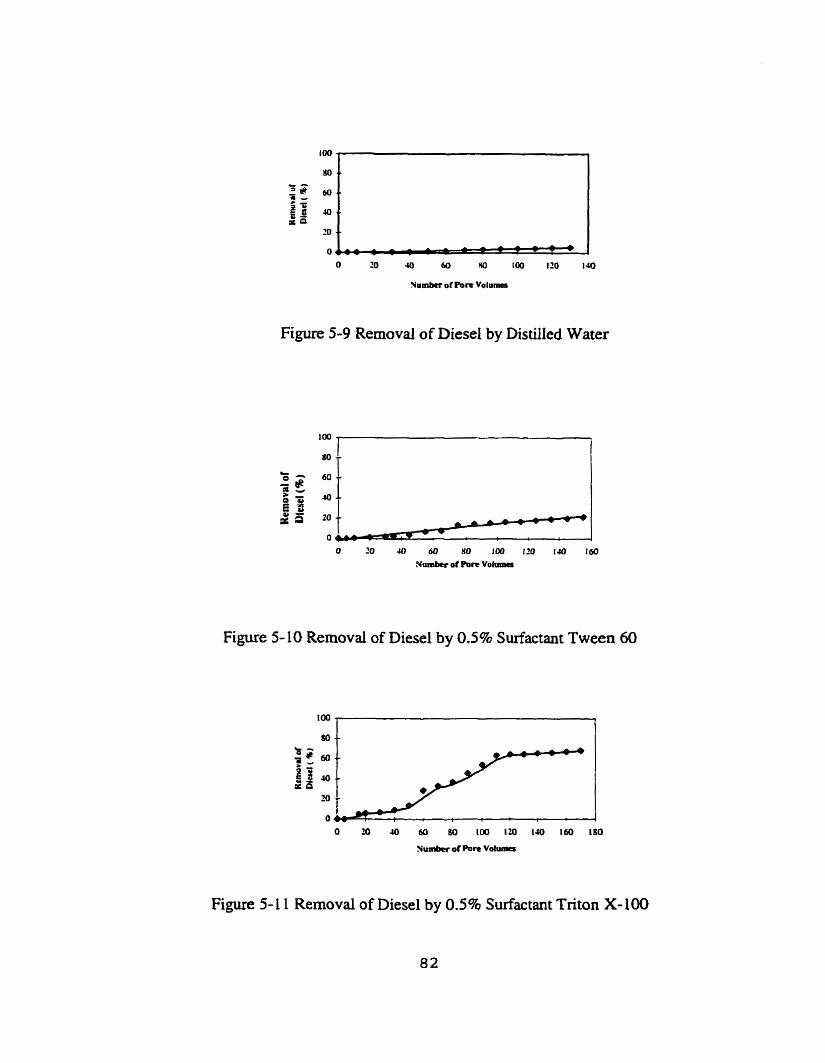
5.2.2 Experimental results
52.3 Discussion of results
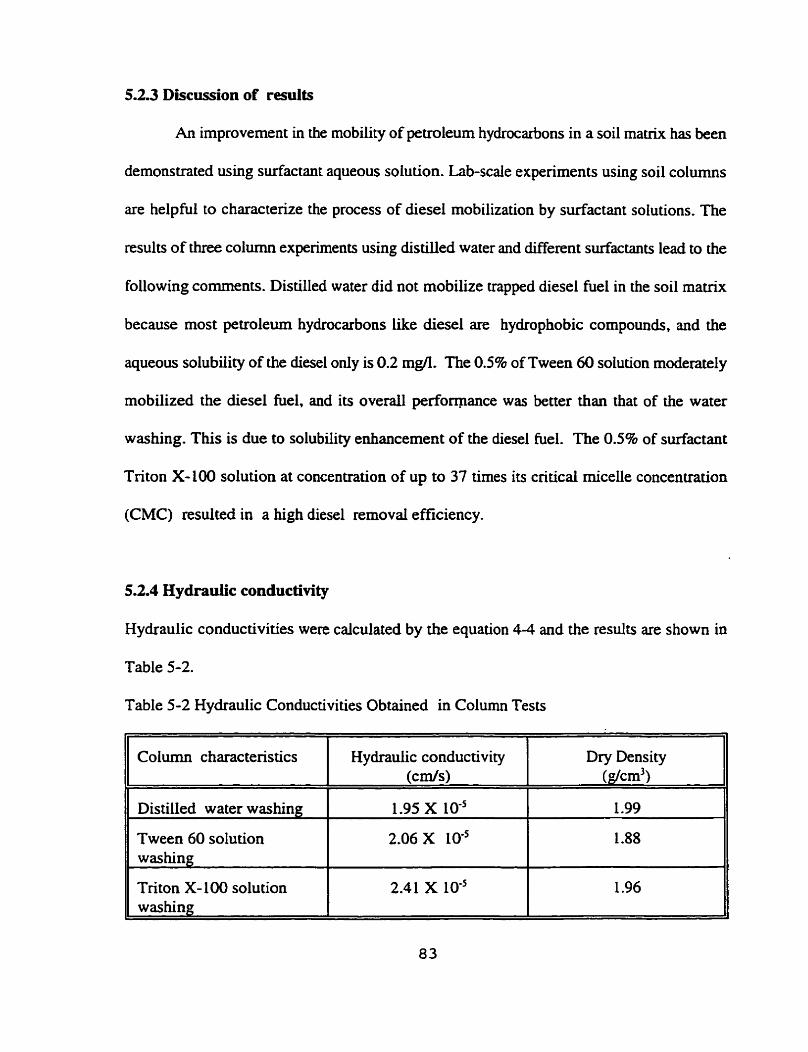
5.2.4 Hydrauiic conductivity
6 CONCLUSIONS
6.1 S urnmary and Conclusions
6.2 Recommendations
REFERENCES
vii
Page 10
LIST OF FIGURES
Figure 2- 1
Figure 2-2
Figure 2-3
Figure 2-4
Figure 2-5
Figure 3-1
Figure 3-2
Figure 3-3
Figure 3-4
Figure 3-5
Figure 4- 1
Figure 4-2
Figure 5- 1
Figure 5-2
Figure 5-3
Figure 5-4
Figure 5-5
Figure 5-6
Figure 5-7
Figure 5-8
Figure 5-9
Figure 5-10
Fimre 5- i 1
Degradation of aliphatic hydrocarbon
Degradation of a fatty acid by P-oxidation
The uicaroxylic acid (TCA) cycle
Degradation of typical aromatic hydrocarbon
Surfactant rnicellization
Location of Argentia site
Grain size distribution of Argentia contaminated soil
Schematic of extraction, partition and analysis of hydrocarbons
Schematic of the Environmental Testing Facility
Concentration and distribution of contaminants
Grain size distribution (soil for bioremediation experiments)
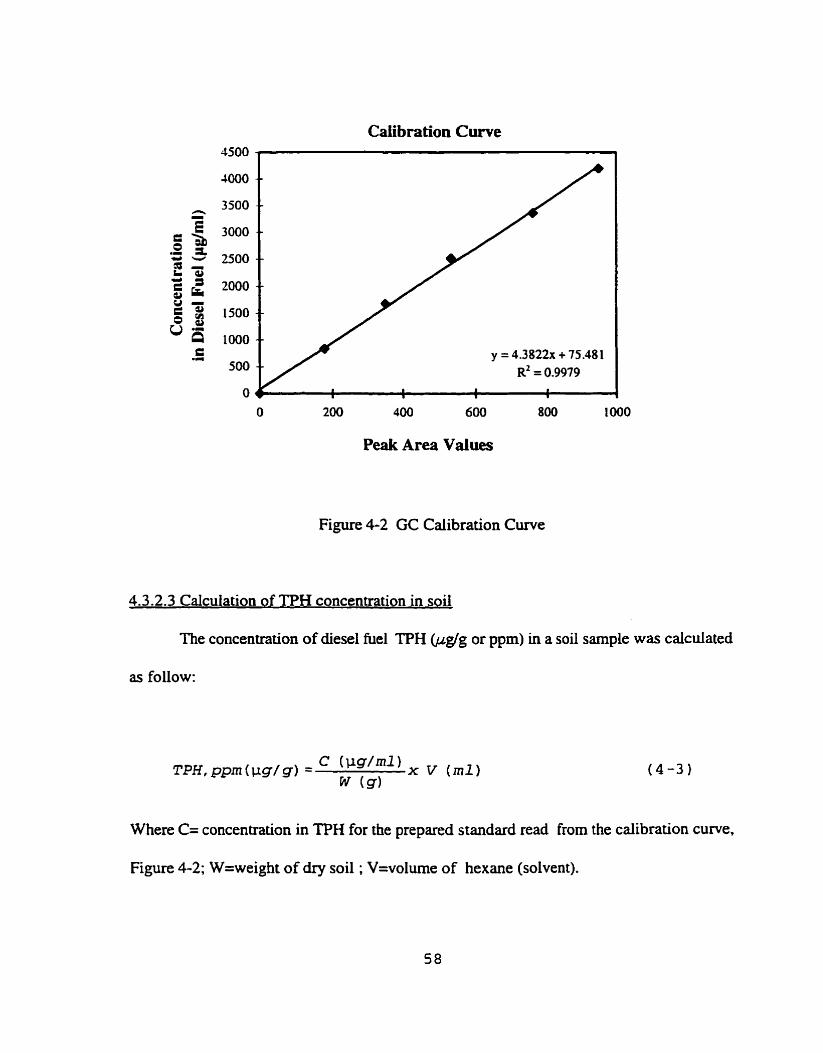
Gas c hromatography calibration curve
Effect of temperature on biodegradation of TPH
Effect of pH on biodegradation of TPH
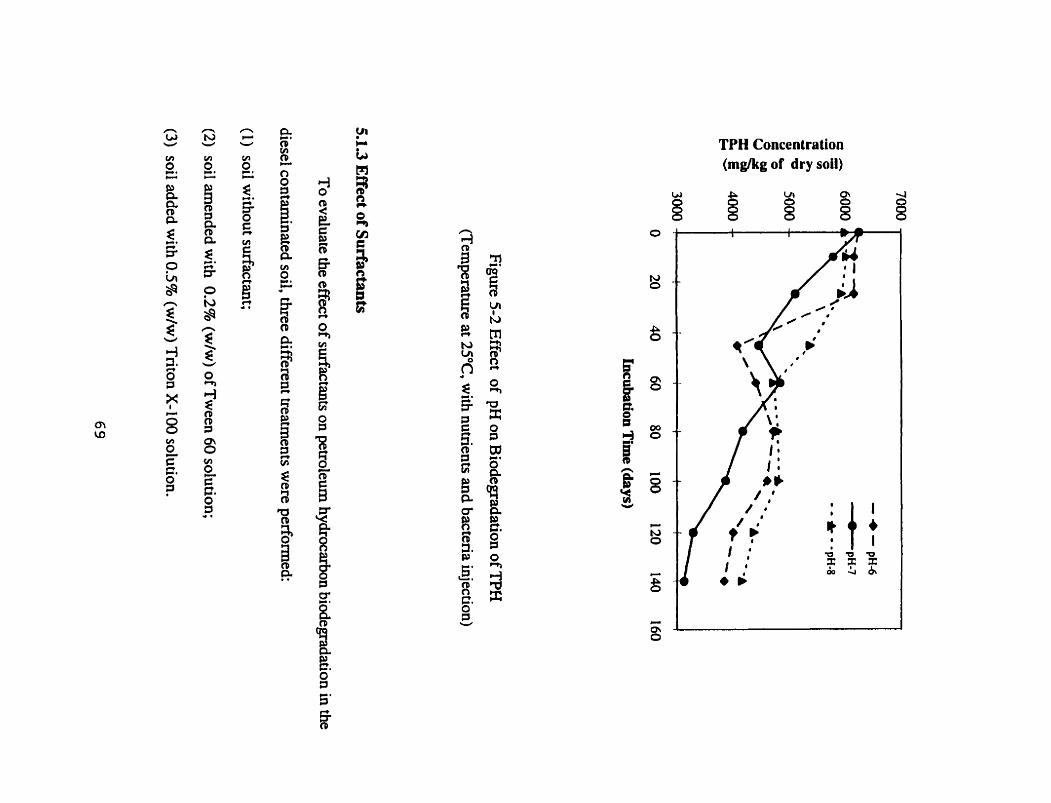
Effect of surfactants on the biodegradation of TPH
Effect of bacteria injection on the biodegradation of TPH
Effect of nutrients on the biodegradation of TPH
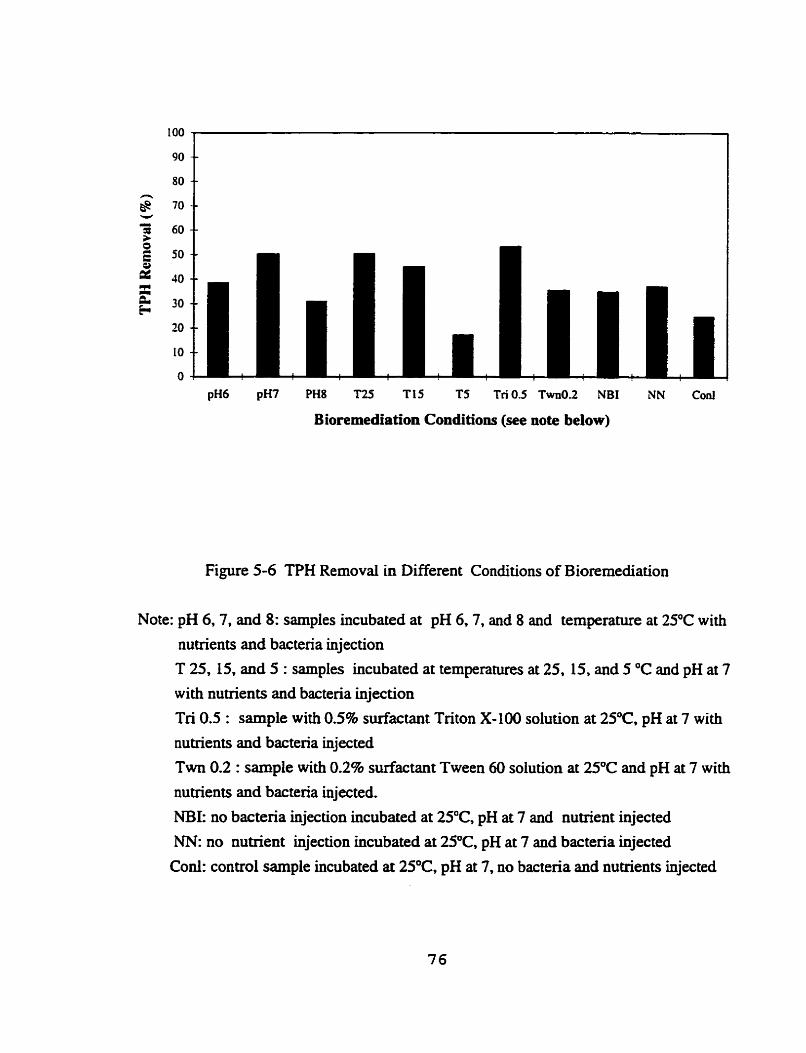
TPH removal in different conditions of bioremediation
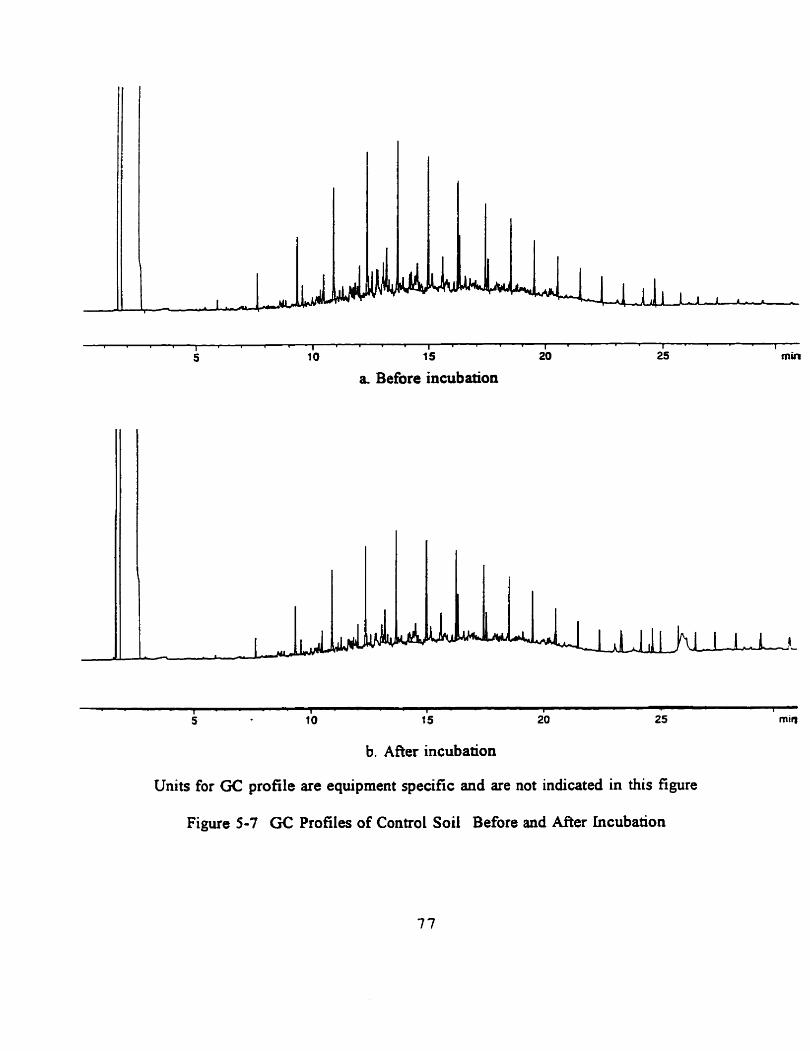
GC profiles of control soil before and after incubation
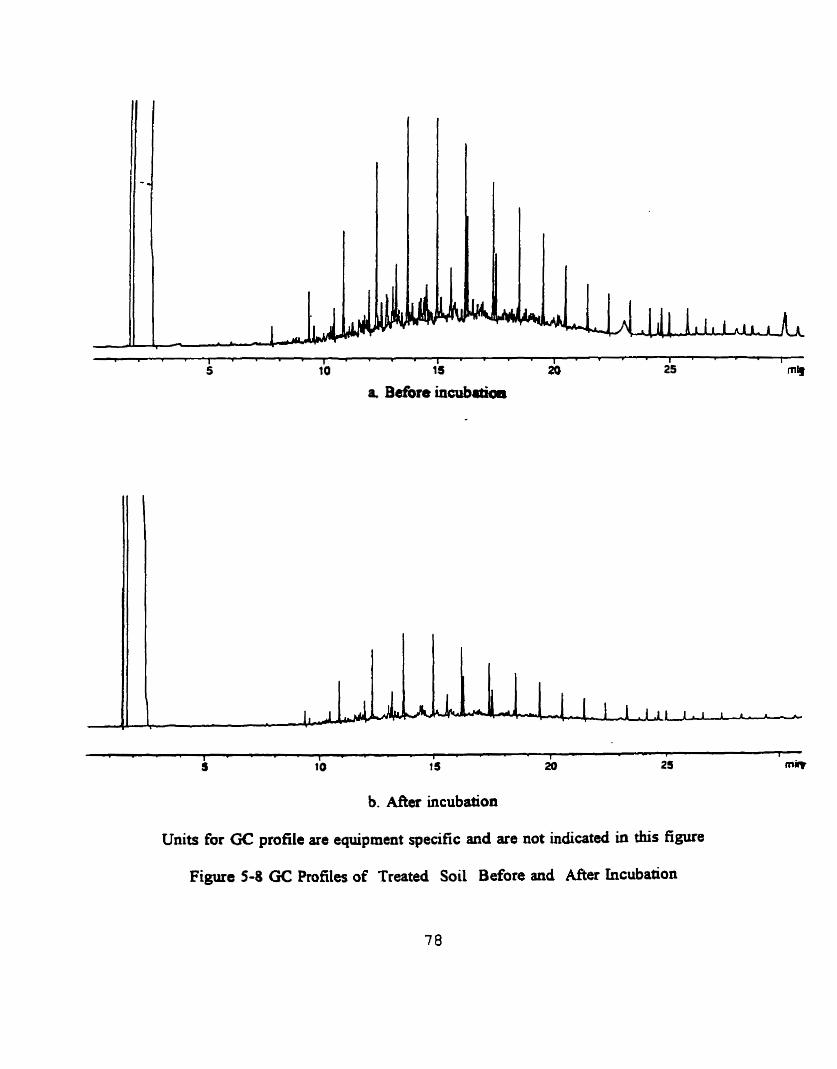
GC profde of treated soil before and after incubation
Removai of diesel by distilled water
Removal of diesel by 0.5% surfactant Tween 60
Removal of diesel bv 0.5% surfactant Triton X-100
Page 11
LIST OF TABLES
Table 2- 1
Table 2-3
Table 2-3
Table 3- 1
Table 3-2
Table 3-3
Table 3-4
Table 3-5
Table 3-6
Table 4- 1
Table 4-2
Table 4-3
Table 4-4
Table 4-5
Table 4-6
Table 4-7
Table 4-8
Table 5- 1
Table 5-2
Common hydrocarbon degrading bacteria found in soils 15
Essentid elements for biological growth 17
Four types of surfactants 27
Soi1 description and in place properties 3 4
Summary of typical Argentia soil properties at depth of 40 cm 35
Extraction of contaminants from samples at different depths 36
Hydrocarbon anaiysis of a typical Argentia contaminated soi1 39
Density and moisture content of contarninated soi1 42
Example of parameters measured during ail operations 46
Properties of soils used in Argentia test facility 48
Typicai chernical and physical propenies of diesel hiel 49
Composition of mineral salts aqueous solution used for nutrients 50
Surfactants used in experiments 5 1
Colony characteristics 53
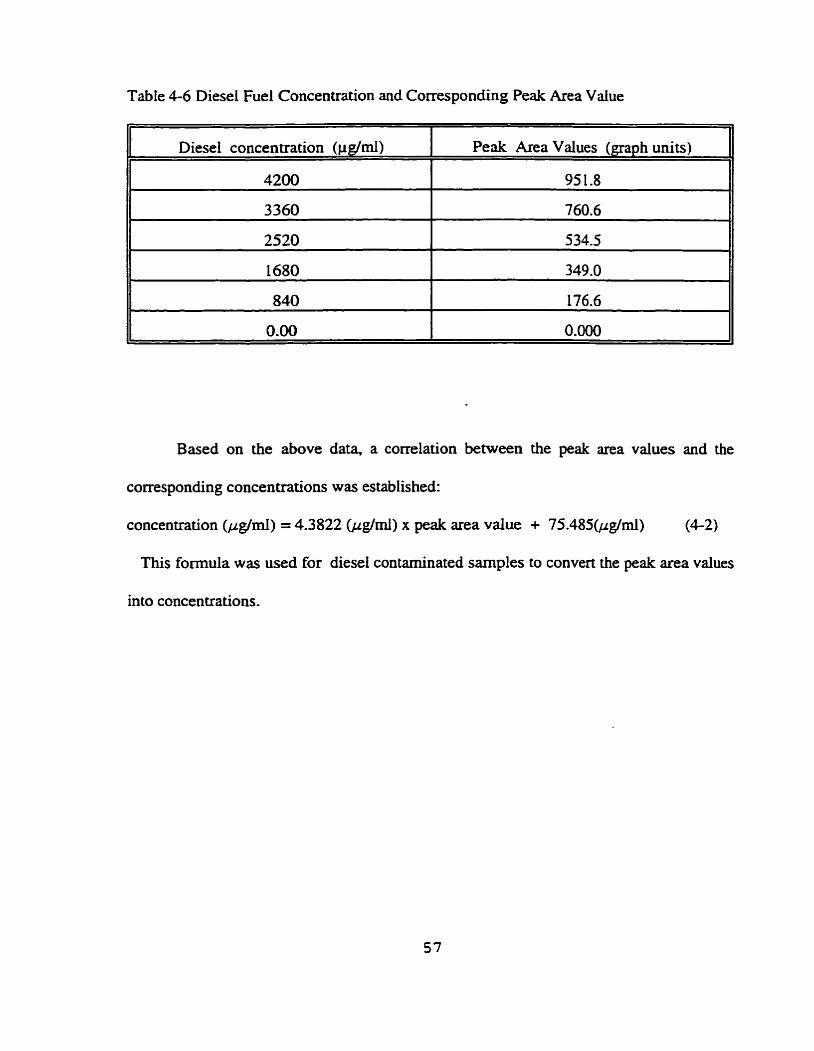
Diesel fuel concentration and corresponding peak area value 57
Composition of soi1 added into g las jar 61
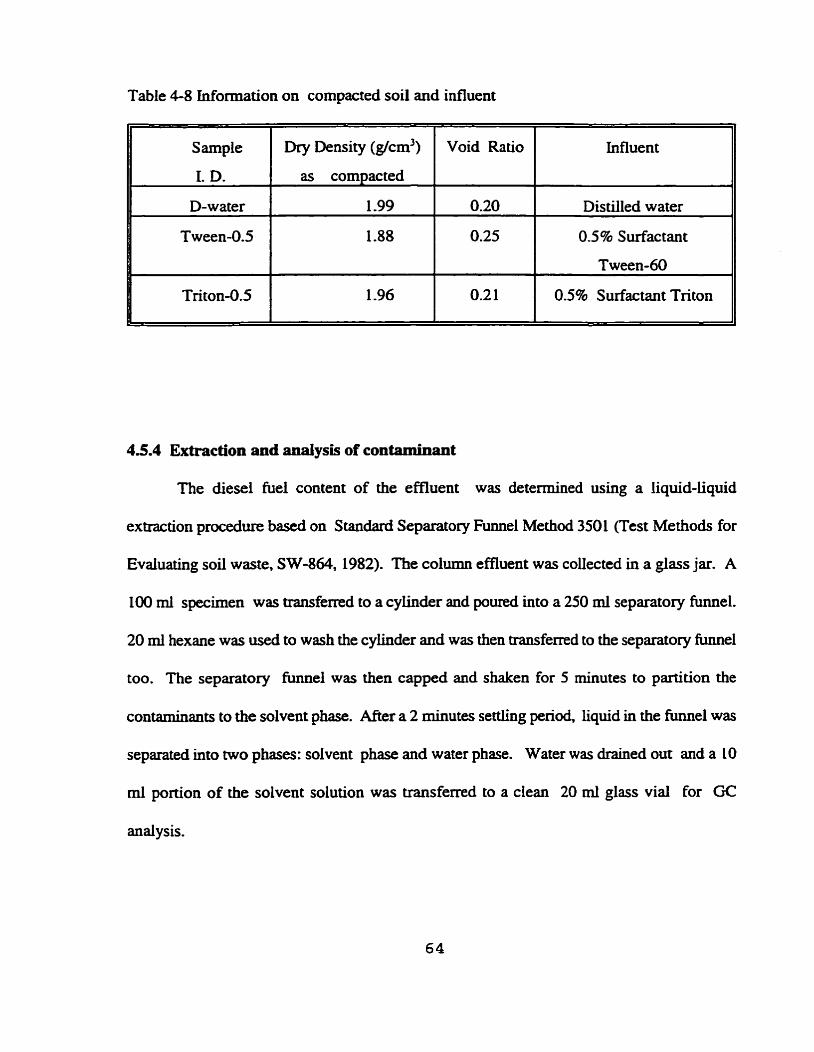
Information on cornpacted soi1 and influent 64
Bacterial plate counting (colony-forming unitdg of soil) 72
Hydraulic conductivities obtained in column tests 83
Page 12
LIST OF SYMBOLS
BTEX
cfu
CMC
COD
con1
OC
GC/FID
GCMS
hi
PH
L
LOI
k
MS
NAPL
NB1
Cross-sectional area of a cornpacted soi1 specimen
Bacteria Injection
Biochemical Oxygen Demand
Benzene, Toluene, Ethylbenzene, Xylene
Concentration in TPH for the prepared standard read from the calibration
colony form unit
Critical Micelle Concentration
Chernical Oxygen Demand
control sample
degree Celcius
Gas Chromatography/Flame Ionization Detector
Gas Chromatography/Mass Spectrometer
average water head difference between inflow and outfolw during AG
Petroleum Hydrocarbon
Length of the sample
Loss On ignition
hy dradic conductivity
Mineral Salt
None Aqueous Phase Liquid
Non Bacteria Injection
Page 13
NN
PAH
T
T'PH
Tri
TSA
Twn
4
UST
v
Vi
W
No Nutrients
Polycyclic Aromatic Hydrocarbon
part per million
Temperature
Total Petroleum Hy drocarbon
Triton X- 100 (surfactant)
Trypticase Soya Agar
Tween 60 (surfactant)
individual time interval
Underground Storage Tank
Volume of solvent
The effluent volume collected during the time interval nt,
Weight of dry soi1
Page 14
Chapter 1
Introduction
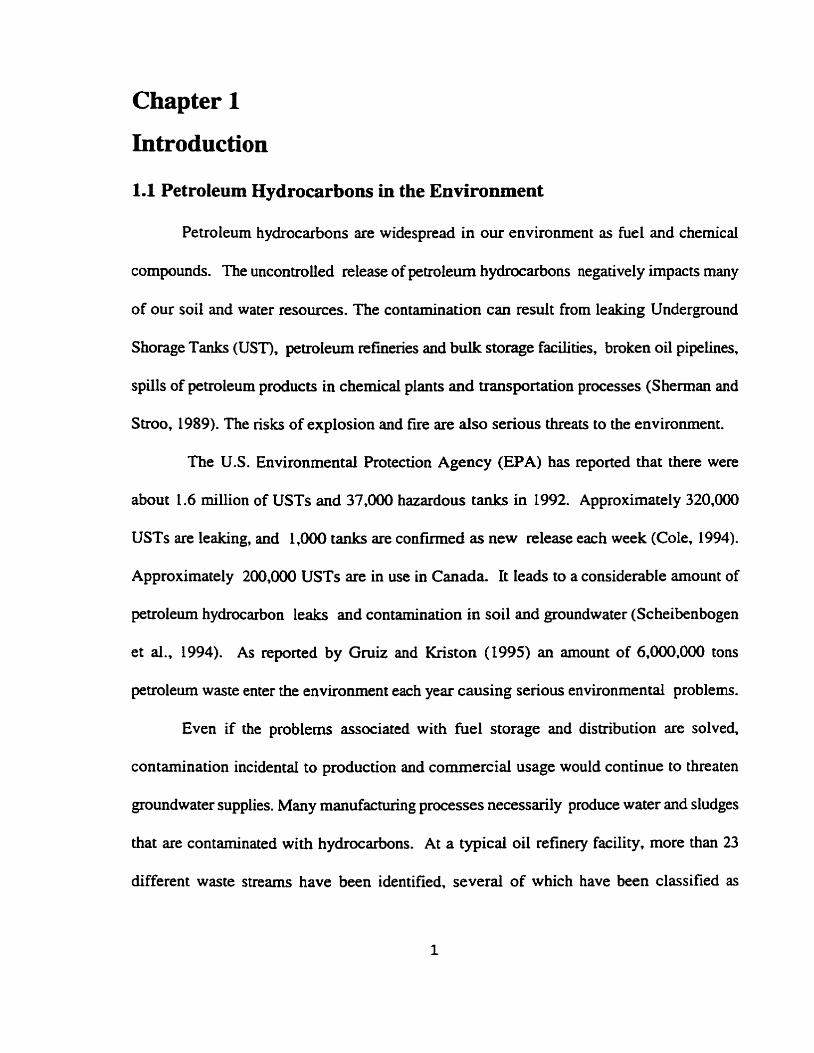
1.1 Petroleum Hydrocarbons in the Environment
Petroleum hydrocarbons are widespread in our environment as fuel and chernical
compounds. The uncontrolled release of petroleum hydrocarbons negatively impacts many
of our soi1 and water resources. The contamination can result from leaking Underground
Shorage Tanks (UST), petroleum refmeries and buk storage facilities, broken oil pipelines,
spiils of petroleum products in chernical plants and transportation processes (S heman and
Stroo, 1989). The risks of explosion and £ire are also serious threats to the environment.
The US. Environmental Protection Agency (EPA) has reported that there were
about 1.6 million of USTs and 37,000 hazardous tanks in 1992. Approximately 320.000
USTs are leaking, and 1,000 tanks are confmed as new release each week (Cole, 1994).
Approximately 200,000 USTs are in use in Canada. It leads to a considerable amount of
petroleum hydrocarbon leaks and contamination in soi1 and groundwater (Scheibenbogen
et al., 1994). As reported by Gruiz and Knston (1995) an arnount of 6,000,000 tons
petroleum waste enter the environment each year causing serious environmental problems.
Even if the problerns associated with fuel storage and distribution are solved,
contamination incidental to production and commercial usage would continue to threaten
groundwater supplies. Many manufactu~g processes necessarily produce water and sludges
that are contaminated with hydrocarbons. At a typical oil refinery facility, more than 23
different waste streams have been identified, several of which have been classified as
Page 15
hazardous waste (Sims, 1990).
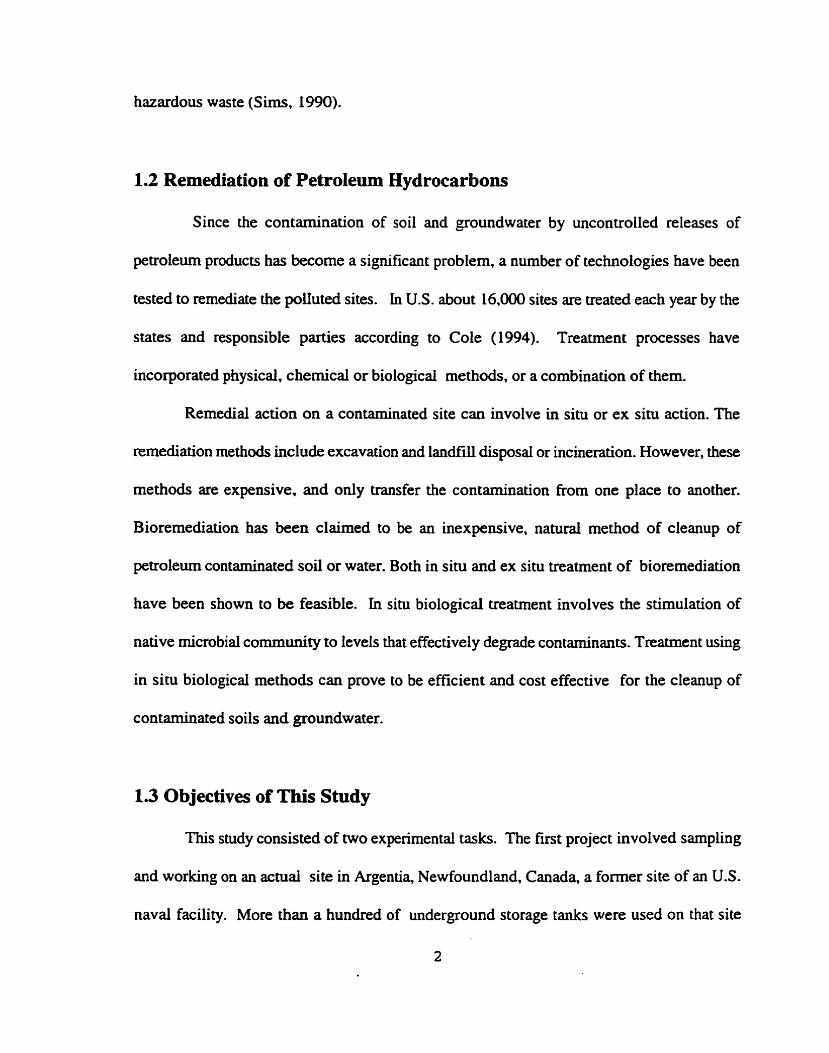
1.2 Remediation of Petroleurn Hydrocarbons
Since the contamination of soil and groundwater by uncontroiled releases of
petroleum products has become a sigmficant problem. a number of technologies have been
tested to remediate the poliuted sites. in US. about 16,000 sites are treated each year by the
states and responsible parties according to Cole ( 1994). Treatment processes have
incorporated physical, chemical or biological methods, or a combination of them.
Remedial action on a contaminated site can involve UI situ or ex situ action. The
remediation methods include excavation and landfill disposal or incineration. However, these
methods are expensive. and only transfer the contamination h m one place to another.
Bioremediation has been claimed to be an inexpensive, natural method of cleanup of
petroleum contaminated soil or water. Both in situ and ex situ treatment of bioremediation
have been s h o w to be feasible. In situ biological treatment involves the stimulation of
native microbial community to levels that effectively degrade contaminanis. Treatment using
in situ biological methods can prove to be efficient and cost effective for the cleanup of
contaminated soils and groundwater.
1.3 Objectives of This Study
This snidy consisted of two experirnental tasks. The fint project involved sarnpling
and working on an actud site in Argentia, Newfoundland, Canada, a former site of an U.S.
naval facility. More than a hundred of underground storage tanks were used on that site
Page 16
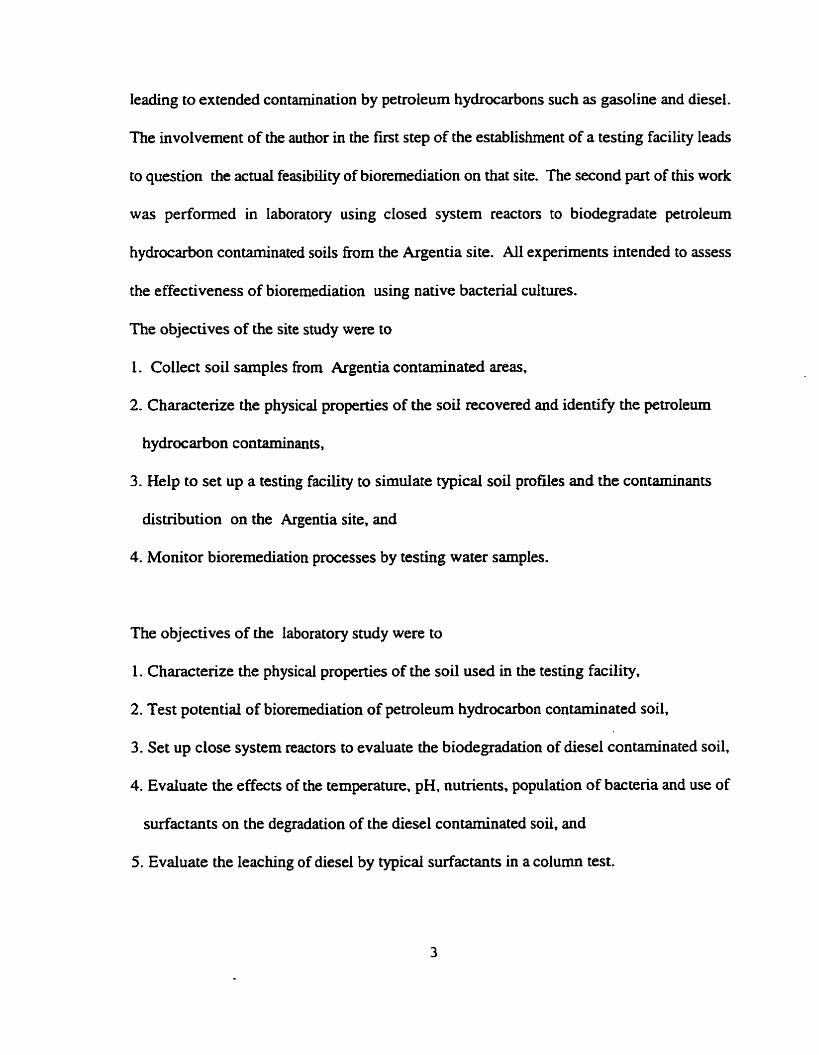
Ieading to extended contamination by petroleum hydrocarbons such as gasoline and diesel.
The involvement of the author in the fmt step of the establishment of a testing facility Ieads
to question the amal feasibility of bioremediation on that site. The second part of this work
was performed in Iaboratory using closed system reactoa to biodegradate petroleurn
hydrocarbon contaminated soils from the Argentia site. Al1 experiments intended to assess
the effectiveness of bioremediation using native bacterial cultures.
The objectives of the site study were to
1. Collec t soil samples from Argentia contaminated areas,
2. Characterize the physical properties of the soil recovered and identiQ the petroleum
hydrocarbon contaminants,
3. Help to set up a testing facility to simulate typical soil profdes and the contaminants
distribution on the Argentia site, and
4. Monitor bioremediation processes by testing water sarnples.
The objectives of the laboratory study were to
1. Characterize the physical properties of the soil used in the testing facility,
2. Test potential of bioremediation of petroleum hydrocarbon contaminated soil,
3. Set up close system reactors to evaluate the biodegradation of diesel contaminated soil,
4. Evaluate the effects of the temperature, pH, nutrients, population of bacteria and use of
surfactants on the degradation of the diesel contaminated soil, and
5. Evaiuate the leaching of diesel by typicai surfactants in a column test.
Page 17
The content of this thesis has been organized in six chaptea that are presented a s
foUows:
Chapter 1 is the present introduction: the petroleurn hydrocarbons in the environment and
possible remediation methods. In this section, the pathes through which petroleum
hydrocarbons enter the environment are introduced, and some data given indicating how
much arnount of petroleum hydrocarbons cm be accidentaliy released into the
environment. Inaddition, severai rernediation methods are presented.
Chapter 2 is a review of fundamental principles of bioremediation, which includes a
description of the rnicroorganisms in soil, their roles in bioremediation and the definition
of intrinsic and engineered bioremediation. Groups of petroleurn hydrocarbon ware defmed
and general biorernedediation rnethods are presented. The factors afTecting on
bioremediation are discussed. Geneml information of the pathway of hydrocarbon
degradation and a description of surfactant properties are also introduced.
Chapter 3 summarizes available information on the Argentia site and the site
investigation results, showing the soil profde and the concentration of petroleum
hydrocarbons. The Environmental Testing Facility is described to show the simulation
process that has been under taken.
Chapter 4 presents the laboratory experiments, which were conducted using dosed
system reacton and columns. Materials used in experiments, including soil, petroleum
Page 18
hydrocarbon, nutrients. and surfactants are presented. Experimental methoàs are dso
introduced.
Chapter 5 contains the results obtained from closed reactoa and column tests and
discusses the factors affecting bioremediation and removat of TPH by surfactants.
Finally in Chapter 6, sorne conclusions and recommendations are presented .
Page 19
Chapter 2
Literature Review
The literature review prepared for this study consists of two pans. Section 2.1 to 2.4
are devoted to bioremediation, its applications. limitations, and general information on the
biodegradation pathway. Section 2.5 deais with surfactants. This re flects the expenmental
work undertaken accordhg to the initial objectives of combining both techniques.
2.1 Fundamental Principles of Bioremediation
2.1.1 Micrwrganisms in Soü
" The most important principle of bioremediation is that rnicroorganisms can be used
to destroy hazardous contaminants or transform them to tess h m 1 f o m " (US National
Research Council, 1993).
Since ZoBeli (1946) reported that nearly 100 species of bacteria, representing 30
microbial genera, had hydrocarbon oxidizing properties , many species and genera have k e n
found to have this ability (Texas Research uistitute, L982a) and to be widely distributed in
soils. In the present study, we will concentrate on microorganisrns that are present in the
soil. thus excluding artificiai impon of extraneous species.
Microorganisms in the soil include bacteria fungi , algae and protozoa The bactena
are most abundant in the soil and can be heterotrophic or autotrophic in their metabolism.
Heterotrophic bacteria use one or more organic compounds as a source of carbon for sumival
and growth, while autotrophic use inorganic material as a source of nutrients and CO2 as the
6
Page 20
sole source of carbon for growth and obtain their energy from light (Pelczar et al, 1986).
Heterotrophic bactena are the most important organisms in the transformation of organic
compounds. and the purpose of engineered bioremediation is to enhance their activity (RB
and Associates, 1984).
Bactena are classifieci into two groups, Gram-passive and Gram-negative, depending
on their ce11 w d structure and composition. Gram-passive bacteria have a thick
peptidoglycan cell wali and when stained by Gram stalliing technique introduced by Christian
Gram in 1884 to distinguish between Gram-negative and Gram-passive bacteria by using
senes of staining reagents, they appear dark blue or violet. The Gram-negative bactena have
a more complex celi w d than those of Gram-passive bacteria with the presence of an outer
membrane surrounding a thin layer of peptidoglycan. Mer Gram Stain, they appear as pink
coloured (Killham, 1994).
Microorganisms can release enzymes in soil. Enzymes have the ability to catalyze
the oxidation of a variety of different hydrocarbons indicated by their broad substrate
specificities (Gibson and Yeh, 1973). The enzyme activity of soil is the sum of the activity
of al1 accumulated enzymes. The native enzyme activity is the result of many processes
which lead to partial incorporation of locally produced enzymes into the soil environment.
In other words. these enzymes are immobilized at the surface of the soil particles (McLaren.
1975).
2.1.2 Role of Microorganisms in Bioremediation
Page 21
Bioremediation is a process which uses microorganisms and their biodegradative
capacity to remove contaminants from the soil. In particular, native soil rnicroorganisms play
a key role in soil bioremediation. They perform as biogeochernical agents to transform
complex organic compounds intc simple inorganic compounds or into their constituent
elements. This process is termed rnineralization. The micrmrganisms (bacteria) are adsorbed
to soil particles by the mechanism of ionic exchange. In general soil particles have a
negative charge , and soil and bactena can hold together by a ionic bond involving
polyvalent cations (Killharn ,1994).
Microorganisms c m destroy contaminan@ based on microbial metabolism which
is the life process of the microbial cell by which the nutritional and functional activities of
an organism are maintained (Pelczar et al. 1986). They c m take the contarninants for the3
own growth and build up new cells. Generally, soil microorganisms carry out two ta&: they
take a source of carbon, which is a new ce11 constituent. from an organic contaminant, and
they use electrons provided by contaminants to obtain energy.
2.13 Intrinsic and Engineered Bioremediation
Two classes of bioremediation technologies have k e n developed. One is tenned
intrinsic, which uses naturally occurring microorganisms to degrade contaminants and do
not need engineered interventions at the site. Intrinsic remediation relies on the activity of
indigenous microorganisms. The second group of technologies involves engineered
intervention. usually to enhance the rate of bioremediation by introducing engineered
modified processes such as adding microorganisms and supplying nutrients. The principle
Page 22
of engineered remediation is to change environmental conditions for accelerating
microorganisms activity. Therefore, the degradation of the contaminants in engineered
processes c m be conducted according to tighter schedule thus reducing risks and costs.
An intrinsic bioremediation case study was documented on Vancouver bland. B.C.
in 1973. Approximately 180 tons of fuel oil was spilled. Cretney et al. ( 1978) reported that
biodegradation accounted for almost complete removal of n--es during the fmt year afier
the spiii. Pristane and phytane were biodegraded more slowly, but were ahost compietely
gone afier 4 yean. The non n-alkane components of the C, to C, range of appeared to be
the most resistant to degradation of al1 the components resolvedy by gas chromatography.
An engineered bioremediation was conducted in a New Jersey wheat field which had
been contaminated with approximately 1.9 million litres of kerosene over 1.5 hectares. A
remediation program consisting of liming, fertilizing and frequent tiiling was initiated, and
the decrease of hydrocarbon contaminants was monitored for a 2-year period . Duiing that
period. the hydrocarbon content of the surface soi1 decreased to an insignificant level and the
field r e m e d to a near-nomal productive state (Dibble and Banha , 1979).
2.2 Petroleum Hydrocarbon Bioremediation
2.2.1 Definition of Petroleum Hydrocarbons
Petroleum hydrocarbons are a mixture of hydrocarbons obtained from reservoin of
crude petroleum. The petroleum hydrocarbons include aliphatic hydrocarbons and aromatic
hydrocarbons. The most cornmon petroleum hydrocarbons contaminating environment are
the ggasiine, diesel and fuel oils.
Page 23
Petroleum hydrocarbons are between C, and C, (Parr et ai, 1994 ). Gasoline is a
light fraction in the range from C, to Go (Parr et al. 1994) with a boiling temperature
ranging frorn 23OC to 2WC (PEDCO Environmental Inc., 1978). Diesel fuel is in the
middle distillate group (C, to & ) with boiling temperature between 202' and 320 C
(Holmes and Thomsom, 1982). Most diesel hydrocarbons are between the C,, and C,,,
Fuel oil and lubricants are heavier cuts in petroleum products and simiiar in composition and
characteristics to middle distillates. These types of fuels are relatively viscous and insoluble
in water and are relatively immobile in the subsurface (Petrov, 1987). Petroleum products
have basically similar chemicai and physical properties. For the purpose of rernediation of
contaminants. the most important physical propeaies are volatility, solubility in water,
specific gravity, and kinematic viscosity (Cole, 1994).
2-2-2 General treatment methods for petroleum hydroairbons
Several remediation methods have been developed for cleaning up petroleum
hydrocarbon contaminated soil. A traditional method is to excavate the polluted soil and
landfill it under controlled condition. This method is not reaiiy remediation and is not
acceptable for large areas or volumes since landfïliing has become cost prohibitive. Another
method for remediation is soil venting. It removes volatile hydrocarbons from the vadose
(unsaturated) zone. It usuaiiy treats raw gasoline contamination. As an alternative method,
bioremediation can be used to clean contaminants either in-situ or ex-situ (Cole, 1994).
During the biotreament process, the hydrocarbons are degraded by naturally occurring
(indigenous) soi1 microorganisms to carbon dioxide. water, and biomass (Huesemann, 1994).
Page 24
This process of breaking complex molecule down to simple molecule by microorganisms is
called biodegradation. Bioremediation treatment technologies include:
(1) bioaugmentation defined as a treatment technology in which bacteria are added to
contaminated medium. This technique is used in bioreacton and ex-situ systems;
(2) biostimulation, which is a treatment process that simulates the indigenous microbial
populations in soil or ground water. The treatment can be done in-situ or ex-situ:
(3) bioreactor treatment. which is a process conducted in containers or reactors and
frequently used to treat liquids or slurries contamination;
(4) bioventing treatment, which is a method to draw oxygen through the soil to stimulate
microbial growth and activity;
(5) landfanning, which is used to treat solid-phase contamination. It c m be done in situ or
in a treatment ceii (Baker and Herson, 1994 a).
Among other advantages the bioremediation processes c m be done at the
contaminated site with minimal transport and handluig, which reduce the costs and
environmental potentiai hazards.
Bioremediation is limited only by the lack of understanding of the rnicrobial ecology
and physiology of poiiuted sites and interactions between the microbial community and the
physical and geochemical environment in which contaminants are degraded (Major, 199 1).
2.2.3 In-situ and on site bioremediation
Bioremediation as a treatment technique c m be used in-situ or on site. h-situ
bioremediation means that contaminants are treated without excavation or removal from
Page 25
the site. Advantages of in-situ remediation are a relatively low cost. little change in the soi1
structure and resuiu that may meet regulatory clean up guidelines (Gruiz and Kriston, 1995)
In-situ remediation therefore is a possible method when it is too expensive to excavate and
transport the contaminated soil from the site (Wardell, 1995).
In-situ bioremediation requires that the soil matrix has the ability to supply oxygen.
nutrients and contaminant-degrading organisrns. The process is conducted through injection
weils at the head or within the plume of contaminated groundwater in order to enhance the
biodegradation rate at which the indigenous organisms grow and metabolize the
contarninants (Canter and Knox, 1985).
On site remediation methods imply the excavation of the contaminated soils and the
construction of a iined biotreatment ceil on site. On site treatment allows a better control of
remediation parameters such as temperature, moisture content, nutrient concentration, and
oxygen availability. But the excavation of the contaminated soil increases the cost of the
operation.
2.2 A Laboratory Treatability studies
Laboratory studies are necessary for assessing the biodegradation potential of a site
prior to initiating the process at hiil-scale. Laboratory treatability studies are conducted in
various ways. Generally, three kinds of tests are used: ( 1) pan studies which simulate solid-
phase bioactivity; (2) flask snidies that perform liquid-phase and slurry-phase biological
process; (3) column studies which represent in situ bioremediation (Nelson et al, 1994).
Page 26
Laboratory tests can be used to select optimal conditions for bioremediation. Several
conditions are usuaily tested including unmodified microorganisms, nutrient amended
microorganisrns. and biologically inhibited conditions. These tests can rneasure the rate of
change on the microbial populations. They provide data on the rate and extent of conversion
of contaminants.
A Iaboratory scale biotreatment of diesel contaminated soi1 was conducted in a
bioreactor by Britto and his coworkers (1994). Soii was contarninated by 1SOOmg of diesel
per kg of wet soil. A continuous type reactor was operated and nutrients. moism. and
oxygen were monitored at al l the . The reactor was operated for 70 days in a steady
condition, and diesel fuel was measured in tenns of TPH. Over the treatrnent process
period, 80% of TPH was removed,
2.3 Factors Affecting Bioremediation
Bioremediation generally occurs when the microorganisrns use the pollutant as a
carbon source. Hence. degradation is accompanied by rnicroorganism growth. An efficient
degradation is dependant on the presence of other required nutrients, including nitrogen.
phosphorus. and so on. Suitable environmentai conditions, with respect to pH. temperature,
moistwe content. and redox potential are also required.
2.3.1 Microbial factors
Many microorganisrns are able to degrade petroleum hydrocarbons. They are present
in contaminated soi1 and water, most of them are aerobic organisrns and cm make use of
Page 27
organic contaminants for their growth. Since individual organisms can metabolize only a
lirnited range of hydrocarbon substrate. it is necessary to assemble several bacteria with a
broad catabolic potenual which has the ability to dissirnilate or break down complex organic
molecules and release energy, in order to degrade the compiex mixture of hydrocarbons that
may affect a contaminated site. Keuning and Jager ( 1994) used pure and mixed
Pseudomonas cultures to degrade chlorobenzene, toluene, xylene, and ethanol. The resulis
showed that a rnixed culture made of three strains demonstrated more stable growth
behaviour and degraded contaminants to much lower concentrations than pure cultures.
Natural soil microorganisms may not have the metabolic capability to readily degrade
certain compounds, and seeding of microorganisms into the soi1 has been perfomed to
enhance the process of bioremediation (bioaugmentation). Generally, natural soil
microorganisms have been previously isolated and enriched as a "seed". They are added
during in situ treatment thus increasing the biomass and reducing the time necessary for
remediation (Hinchee et al.. 1994).
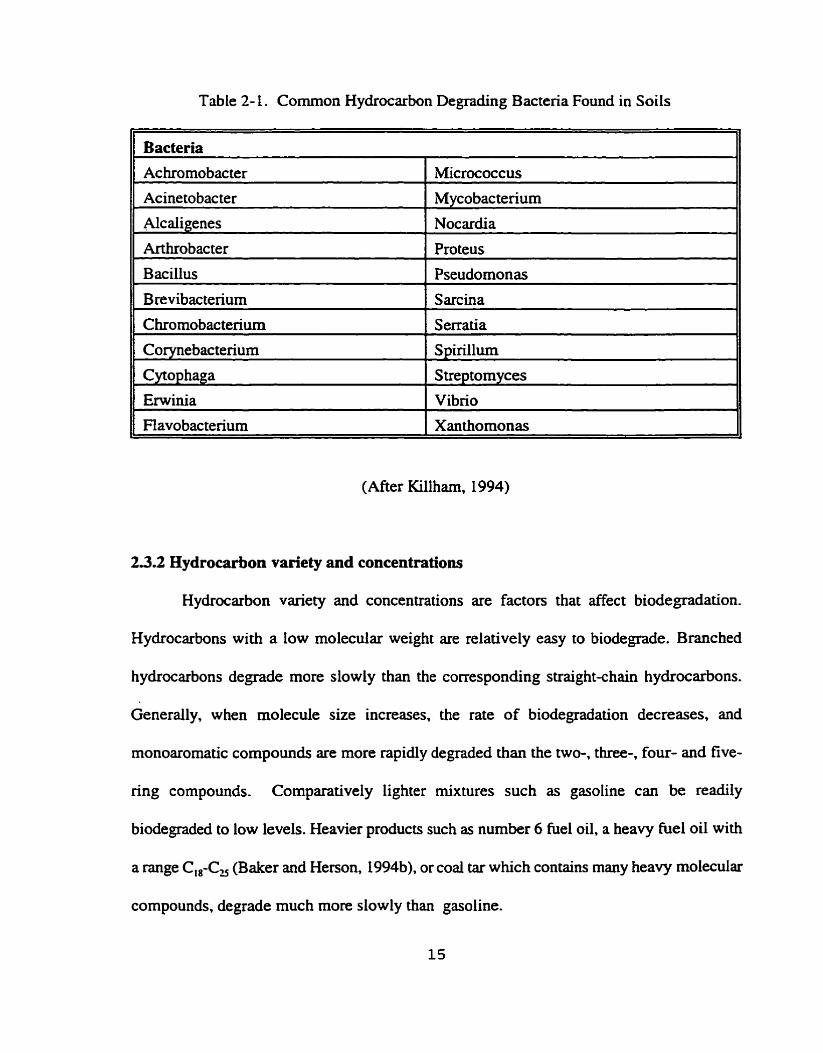
As indicated before many hydrocarbon-degrading bactena can be found in soils and
some of the cornmon ones are listed in Table 2- 1.
Page 28
Table 2- 1. Cornmon Hydrocarbon Degrading Bactena Found in Soils
II FLavobacterium 1 Xanthomonas
I
/ Achromobacter
Acinetobacter
Alcaligenes
Arthrobacter
Bacillus
Brevibacterium
Chromobac terium
l Corynebacterium
I Cytophaga
' Erwinia
(Afier Killharn, 1994)
Micrococcus
Mycobacterium
Nocardia
Pro teus
Pseudomonas
S arc ina
Serratia
S pirillum
Streptomyces
Vibno
2.3.2 Hydroearbon variety and concentrations
Hydrocarbon variety and concentrations are factors that affect biodegradation.
Hydrocarbons with a low molecular weight are relatively easy to biodegrade. Branched
hydrocarbons degrade more slowly than the corresponding straight-chain hydrocarbons.
Generally, when molecule size increases, the rate of biodegradation decreases, and
monoaromatic compounds are more rapidly degraded than the two-, three-, four- and five-
ring compounds. Comparatively lighter mixtures such as gasoline can be readily
biodegraded to low levels. Heavier products such as nurnber 6 fuel oil, a heavy fuel oïl with
a range C,,-C, (Baker and Herson, 1994b), or coal tar which contains many heavy molecular
compounds, degrade much morr slowly than gasoline.
Page 29
The concentration of hydrocarbon c m affect the bioactivity and be toxic to the
microorganisms (US. Environmental Protection Agency, 1985). High concentration of
h y h a r b o n s can be inhibitory to microorganisms, thus slowing down the remediation rate.
At highly elevated concentration, contaminant can becorne toxic for microorganisms.
(Alexander, 1985).
2 3 3 Soil structure
Soil structure controls the transmission of water, oxygen, and nutrients to the area
of bioactivity. Generally, fme particles such as clay and silt transmit these substances slowly.
Permeable soils, such as sands and gravels, are more favourable to nutrient transport and
relatively rapid clean up cm be achieved. Charactenstics of the soils, such as composition,
particle size distribution, percent moisture content. percent organic and cation exchange
capacity (Skladany and Baker, 1994), may also be important for the remediation of
contarninants.
2.3.4 Nutrients
Most microorganisms existing in the subsurface are part of an ecosystem that has low
organic carbon content. The heterophic microorganisms found in soils possess the ability
to degrade petroleum products (Odu, 1978, Pinholt, 1979), but they require nutrients to grow.
Nitrogen and phosphorous are the most comrnon nutrients for bacteria Jamison et al. (1975)
reported that addition of nitrogen and phosphorus enhanced in situ gasoline degradation.
Other nutrients required for bacteria metabolism are potassium, magnesium, calcium.
Page 30
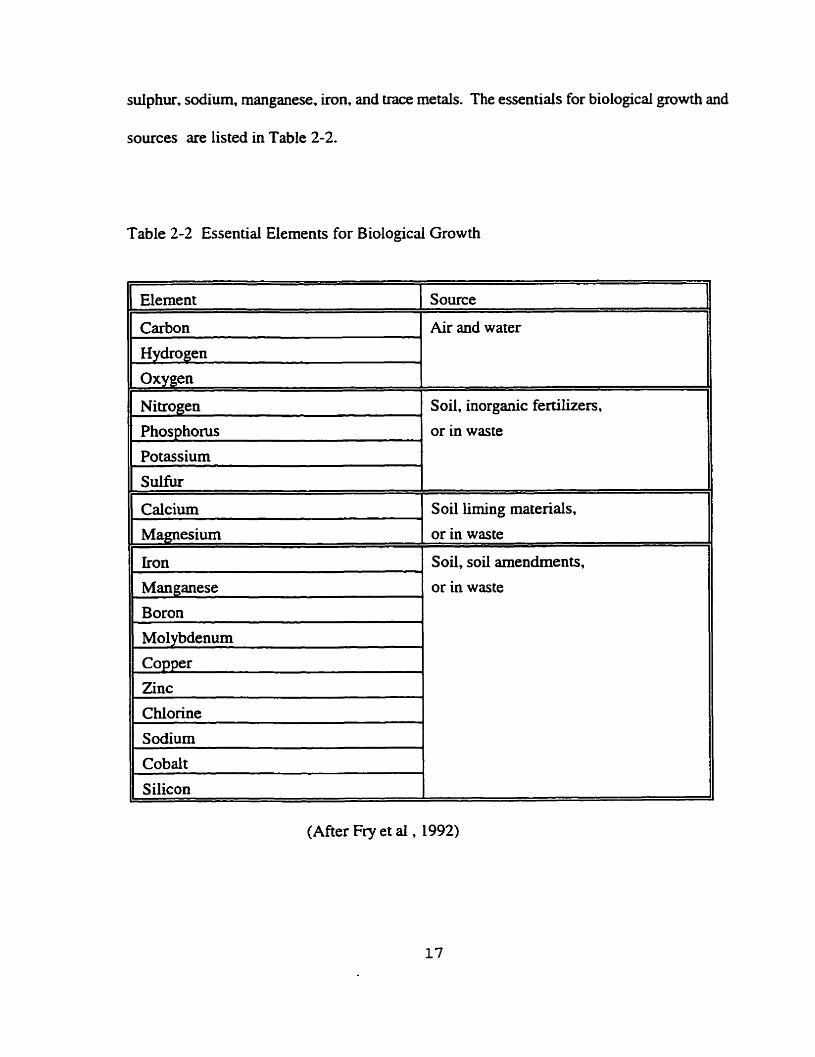
sulphur, sodium, rnanganese, iron, and trace metals. The essentials for biological growth and
sources are listed in Table 2-2.
Table 2-2 Essentiai Elements for Biological Growth
Element
Carbon
Oxygen
Source
Air and water
1 II Nitrogen Soil, inorganic fertilizers.
Hydrogen l
1 Phosphorus 1 or in waste
II potassium I Sulfur
Calcium Maenesium
11 Manganese 1 or in waste
Soi1 lirning materials,
or in waste
1 Soil, soi1 amendments,
II Zinc
1
II Sodium 1
Molybdenum I
1 Silicon I
(After Fry et al , 1992)
Page 31
WestIake et al. ( 1978) exarnined the in situ degradation of oii in a soil of the bored
region of the Northwest Territories of Canada- Where fertilizer containing nitrogen and
phosphoms was applied to the soil. there was a rapid increase in bacterial numbea. This was
followed by a npid disappearance of n-alkane and isoprenoids and a continuous loss of
weight of saturated compounds in the recovered oil. This study indicated that addition of
nitrogen and phosphorus containing fertilizers can be used as nutrients to stimulate microbid
degradation of petroleum hydrocarbons.
2.3.5 Oxygen
in hydrocarbon aerobic bioremediation, oxygen availability is a cri tical factor
(Floodgate. 1973). Bactena activity proceeds more rapidly if suficient oxygen is provided.
During aerobic biodegradation, molecular oxygen is reduced to water while petroleum
hydrocarbon is oxidized to create energy, cell mass, and carbon dioxide.
The supply of oxygen to the scene of microbid activity is controlied by soil saturation
and conduction. Dineen et al (1990) reported that the requirement of oxygen to degrade
hydrocarbon is 3.1 g of oxygen for 1.0 g of hydrocarbon. The largest arnount of oxygen
required is approximately 200,000 ppm in a weli aerated soil and 8 ppm in a saturated soil.
Brown and his coworkers (1984) developed several projects where oxygen supply was
identified as a critical point if the processes are to be generally applicable. This
demonstration led to use hydrogen peroxide as an oxygen carrier (Brown et al., 1984).
Increasing oxygen availability by treating the soil with dilute hydrogen peroxide. H,O, at
a concentration up to 1OOO mgA (Texas Research hstinite. 1982a) has ken successfully uied.
Page 32
Dlathman et al. ( 199 1) evaluated the utilization of hydrogen peroxide for enhanced
biological treatment of petroleum hydrocarbon contaminated soil in laboratory. IP-5. diesel
hel. and lubricating oil were used as mode1 petroleum hydrocarbons. The concentration of
the H202 was approximately 500 ma. Biotreatment was monitored by bacteria population
density and concentration of petroleum hydrocarbons. Results showed enhanced removal
of the petroleum hydrocarbon after comparing control sample and test sample.
Soil venting is a method that provides oxygen to the contarninated area by
introducing air into the vadose zone in order to increase the activity of native bacteria and
allow them to degrade the contaminants. Dineen et ai (1990) reported on three bioventing
projects in southem California They treated the vadose zone with ammonia and air resulting
in a one to two orders of magnitude increase in the microbial counts and in the arnount of
degraded hydrocarbons.
2.3.6 Temperature
Soil temperature is another factor which can affect microbiological activity and the
rate of the contaminant decomposition (Sims and Bass, 1984). Generaliy, a high temperature
induces a high rate of biological degradation processes in the soil (JRB and Associates
Inc.,1982). Very low rates of hydrocarbon utilization were found by Gunkel ( 1967) at low
temperature because low temperature leads to a slow rate of microbial growth. The rate of
degradation c m double for every 10°C rise in temperature (Thibault and Elliot, 1979).
=Bell( 1969) found that hydrocarbon degradation was over an order of magnitude faster at
25°C than at 5°C. Most soil microorganisrns have an optimal growth for temperature in the
Page 33
range of 20 to 35'~ (Parr et a1.,1983). The majority of organisms that degrade petroleum
products are active in this range. Enrichments of thermophilic rnicroorganisms have an
optimal temperature for degradative activity compnsed between 50" and 60°C .
2.3.7 Soi1 rnoisture
Microorganisms require water for microbial growth and for diffusion of nutrients and
by-products during the degradation process (JRB and Associates Inc., 1984). if the soil is
too dry, many rnicroorganisrns will die. If water content of the soi1 is too hi&. oxygen
transfer to microorganisms will be resisted by the flooded soil and the rate of the
hydrocarbn degradation will be reduced. The optimum soil water content for bioremediation
is dependent on the soii type. Generally, the optimum activity occurs when the soil moisnire
is 50-8096 of the field capacity, also temed the water holding capacity which is defined as
"the amount of the water remaining within the soil after gravitational water has drained
away" (Baker, 1994) or the percentage of water in a soii when it was saturated (IRB and
Associates, Inc.,1984). When rnoisture content is lower than 10% of the holding capacity,
the bioactivity becomes marginal (Testa and Winegardner, 199 1).
23.8 pH value
Biological activity in the soil can be affected by the pH. Some rnicroorganisrns can
survive in a wide range of pH, but others are sensitive to smail variations. The bactena grow
better in pH values between 6.5 and 8.5 (Dibble and BarthaJ979). Bioremediation is
Page 34
therefore favoured by near neutral pH values (6-8). Soi1 pH can be adjusted if necessary to
enhance microbial activity.
2.4 General Information on Degradation Pathway
of Petroleum Hydrocarbons
Petroleum hydrocarbon is a cornplex mixture of hydrocarbons. Several studies have
k e n performed to determine the rnetabolic pathways for degradation of these compounds.
In this section, generai information on the degradation pathways is reviewed.
2.4.1 Degradation pathway of aliphatic hydrocarbons
2.41.1 Oxidation of bvdrocarbons
The n-alkanes are generaily considered to be the most readily degraded compounds
in a petroleum mixture. Biodegradation of n-alkanes with molecule weight up to Cu has
been demonstrated (Haines, 1974). Three steps are involved in degradation of aliphatic
hydrocarbons (Gaudy, Jr and Gaudy, 1980). The initial step is an oxidation reaction that
involves molecular oxygen, and oxidation is catalyzed by an enzyme. The terminai methyl
group is fmt oxidized to a primary alcohol. The alcohol then undergoes successive oxidation
to form an aldehyde which is then converted to a fatty acid. The conversion of the alcohol
Page 35
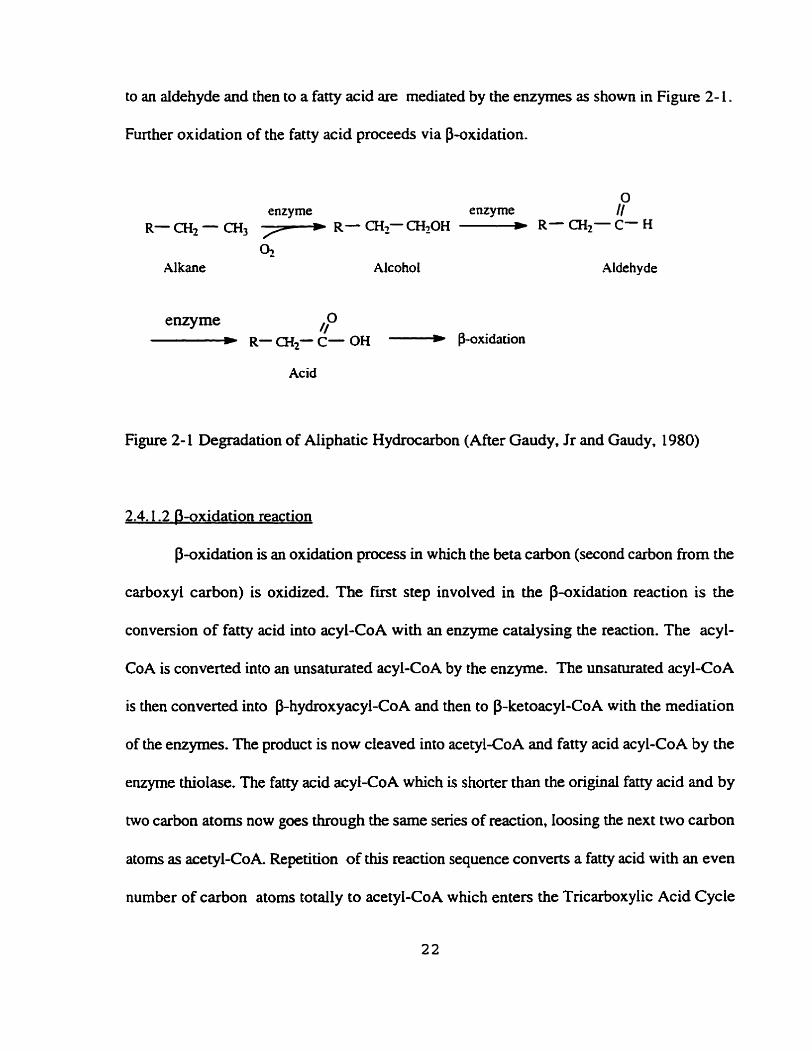
to an aldehyde and then to a fatty acid are mediated by the enzymes as shown in Figure 2- 1.
Further oxidation of the fatty acid proceeds via P-oxidation.
Acid
Figure 2- 1 Degradation of Aiiphatic Hydrocarbon (After Gaudy, Ir and Gaudy. 1980)
2.4.1.2 B-oxidation reaction
P-oxidation is an oxidation process in which the beta carbon (second carbon from the
carboxyl carbon) is oxidized. The f i t step involved in the P-oxidation reaction is the
conversion of fatty acid into acyl-CoA with an enzyme cataiysing the reaction. The acyl-
CoA is converted into an unsaturated acyl-CoA by the enzyme. The unsaturated acyl-CoA
is then converted into P-hydroxyacyl-CoA and then to P-ketoacyl-CoA with the mediation
of the enzymes. The product is now cleaved into acetyl-CoA and fatty acid acyl-CoA by the
enzyme thiolase. The fatty acid acyl-CoA which is shorter than the original fatty acid and by
two carbon atoms now goes through the same series of reaction, loosing the next two carbon
atoms a s acetyl-CoA. Repetition of this reaction sequence converts a fatty acid with an even
number of carbon atoms totally to acetyl-CoA which enters the Tricarboxylic Acid Cycle
Page 36
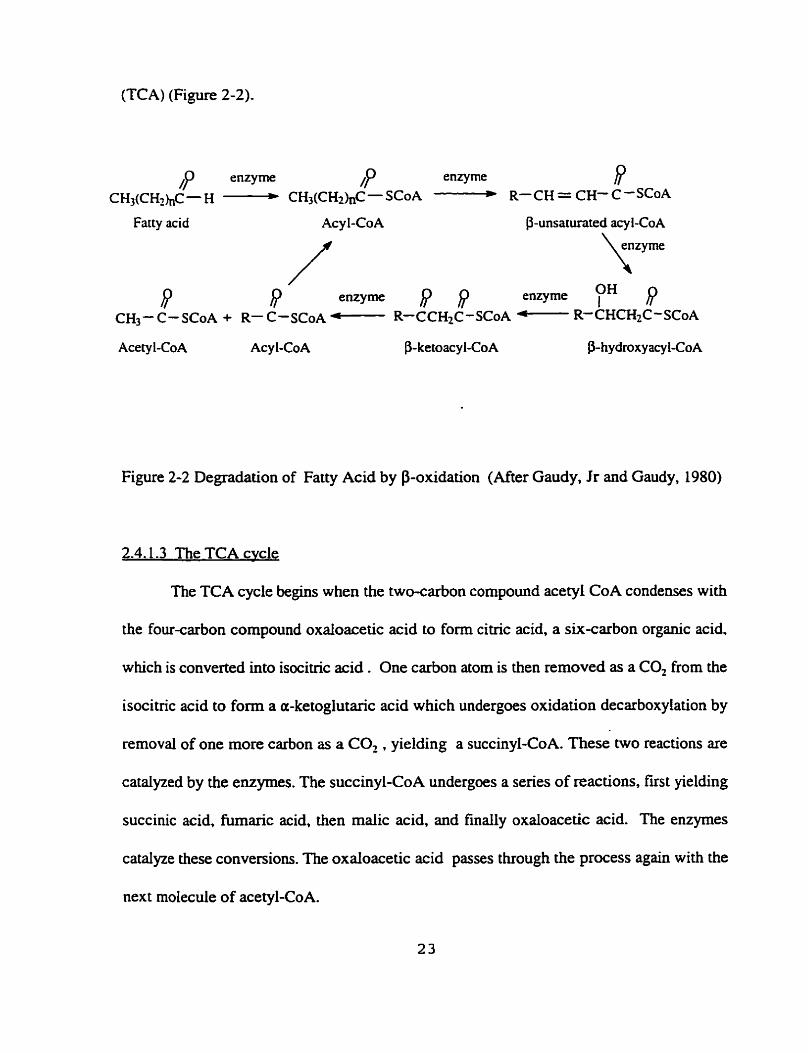
( K A ) (Figure 2-2).
enzyme /P enzyme P CH3(CF&C - H - CH3(CH2)& - SCOA - R- CH = CH- C -SCOA
Fatty acid Ac y 1-CoA P-unsaturated acyl-CoA
f enzyme
R R enzyme p p enzyme I
\ OH P
c&- C-SC~A + R- C-SC~A R-CCH2C-SCoA R-CHCH2C-SCoA
Acety 1-CoA Acyl-CoA B-ketoacyl-CoA P- h ydroxy acy 1-CoA
Figure 2-2 Degradation of Fatty Acid by P-oxidation (Mer Gaudy, Ir and Gaudy, 1980)
2.4.1 -3 The TCA cvcle
The TCA cycle begins when the two-carbon compound acetyl CoA condenses with
the four-carbon compound oxaloacetic acid to fom citric acid, a sixcarbon organic acid,
which is converted into isocitric acid . One carbon atom is then removed as a CO2 from the
isocitric acid to form a a-ketoglutaic acid which undergoes oxidation decarboxylation by
removal of one more carbon as a C O , yielding a succinyl-CoA. These two reactions are
catalyzed by the enzymes. The succinyl-CoA undergoes a series of reactions, fust yielding
succinic acid, fumaric acid. then rnalic acid, and finally oxaloacetic acid. The enzymes
catalyze these convenions. The oxdoacetic acid passes through the process again with the
next molecule of acetyl-CoA.
Page 37
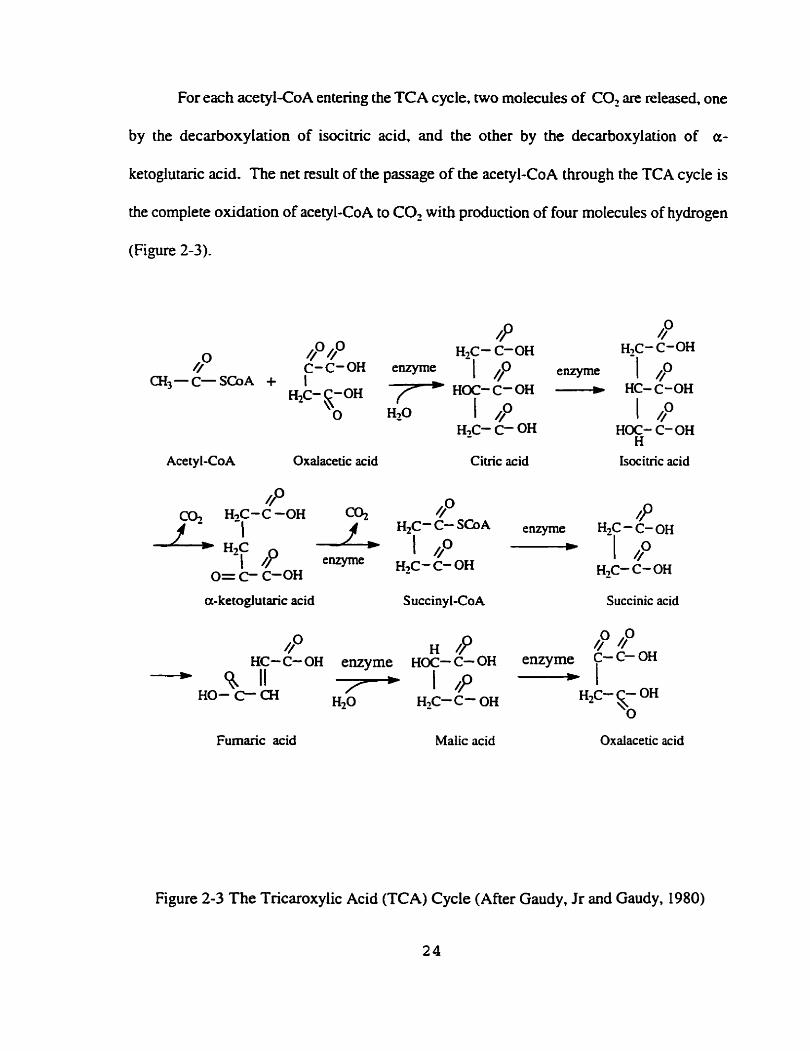
For each acetylCoA entering the K A cycle, two molecules of COz are released, one
by the decarboxylation of isocitric acid, and the other by the decarboxylation of a-
ketoglutaric acid. The net resdt of the passage of the acetyl-CoA through the TCA cycle is
the complete oxidation of acetyl-CoA to CO? with production of four molecules of hydrogen
(Figure 2-3).
/P /P /Pd= HîC- C-OH HIC- C-OH /P C-C-OH enzyme 1 /P
CK3-C-SCoA f 1 enzyme 1 /p $-OH /* HOC-C-OH - HC- C-OH
O H20 1 8 1 /p Hg- C- OH HOC- C- OH
H Acetyl-CoA Oxalacetic acid Citric acid Isocitric acid
a-ketoglutaric acid Succiny 1-CoA Succinic acid
Fumaric acid Malic acid Oxalacetic acid
Figure 2-3 The Tncaroxylic Acid (TCA) Cycle (Afier Gaudy, Jr and Gaudy, 1980)
24
Page 38
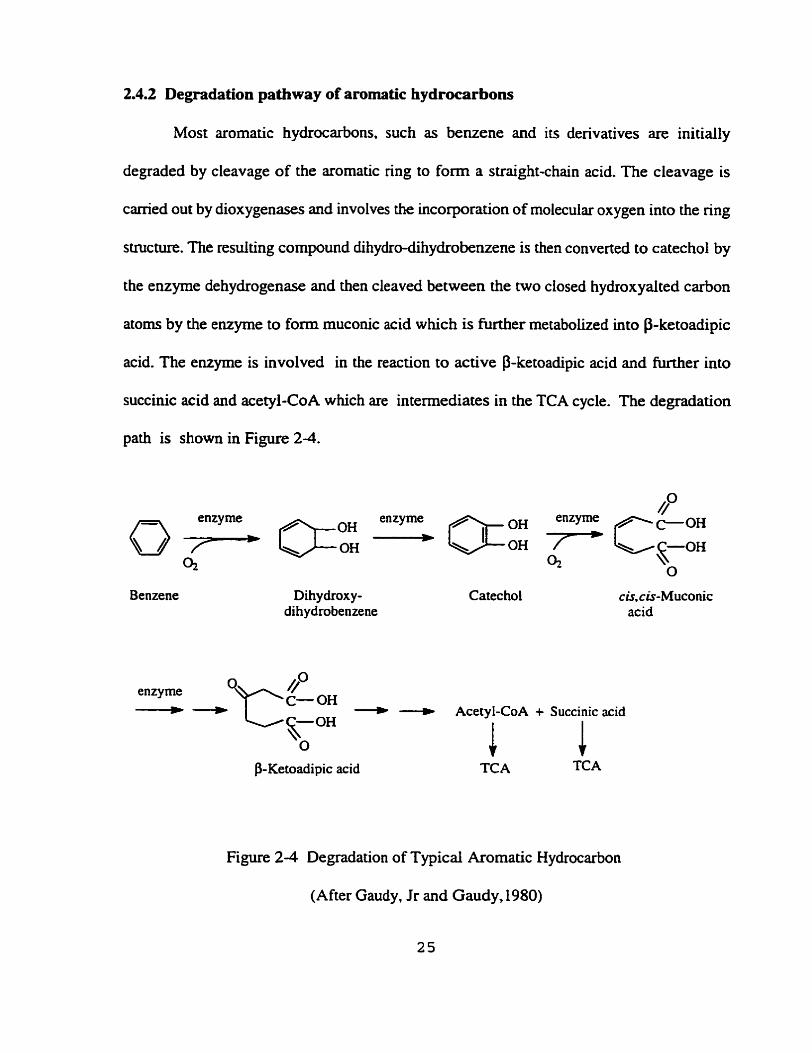
2.4.2 Degradation pathway of aromatic hydrocarbons
Most aromatic hydrocarbons, such as benzene and its derivatives are initially
degraded by cleavage of the aromatic ring to fonn a straight-chain acid. The cleavage is
carried out by dioxygenases and involves the incorporauon of molecular oxygen into the ring
structure. The resulting compound dihydro-dihydrobenzene is then converted to catechol by
the enzyme dehydrogenase and then cleaved between the two closed hydroxyaited carbon
atoms by the enzyme to form muconic acid which is further metabolized into P-ketoadipic
acid. The enzyme is involved in the reaction to active P-ketoadipic acid and further into
succinic acid and acetyl-CoA which are intermediates in the TCA cycle. The degradation
path is shown in Figure 2-4.
enzyme enzyme
Benzene Dihydroxy- dihydrobenzene
enzyme -4
c-OH - - C-OH
%O
B-Ketoadipic acid
Catec ho1 cis. cis-Muconic acid
AcetyI-CoA + Succinic acid
TCA TCA
Figure 2 4 Degradation of Typical Aromatic Hydrocarbon
(After Gaudy. Jr and Gaudy, 1980)
Page 39
Some Polycyclic Aromatic Hydrocarbons (PAH) can be degraded by bacteria such
as Pseudomonas species. The degradation pathway of naphthalene (bicyclic arornatic
hydrocarbon), anthracene and phenanthrene (tricyclic arornatic hydrocarbonand) were
reported by Schiegel (1993). Unlike benzene, they are initially degraded into salicylate
instead of catechol. The salicyalte is then converted to f o m catechol by the enzyme. Like
the degradation of catechol, the carboxy-muconic acid is converted into P-ketoadipic acid
which is further metabolized in a manner similar to the P-ketoadipic acid produced from
catechol degradation .
2.5 Surfactant Definition and Properties
2.5.1 Classification of surfactants
Surfactants. surface active agents, are amphiphilic molecules which consist of two distinct
stmchual p m . One is polar, and another is nonpolar. The polar part of the molecule has
an affinity for water and other polar substances, while the nonpolar part is hydrophobie
(Edwards et al., 1991).
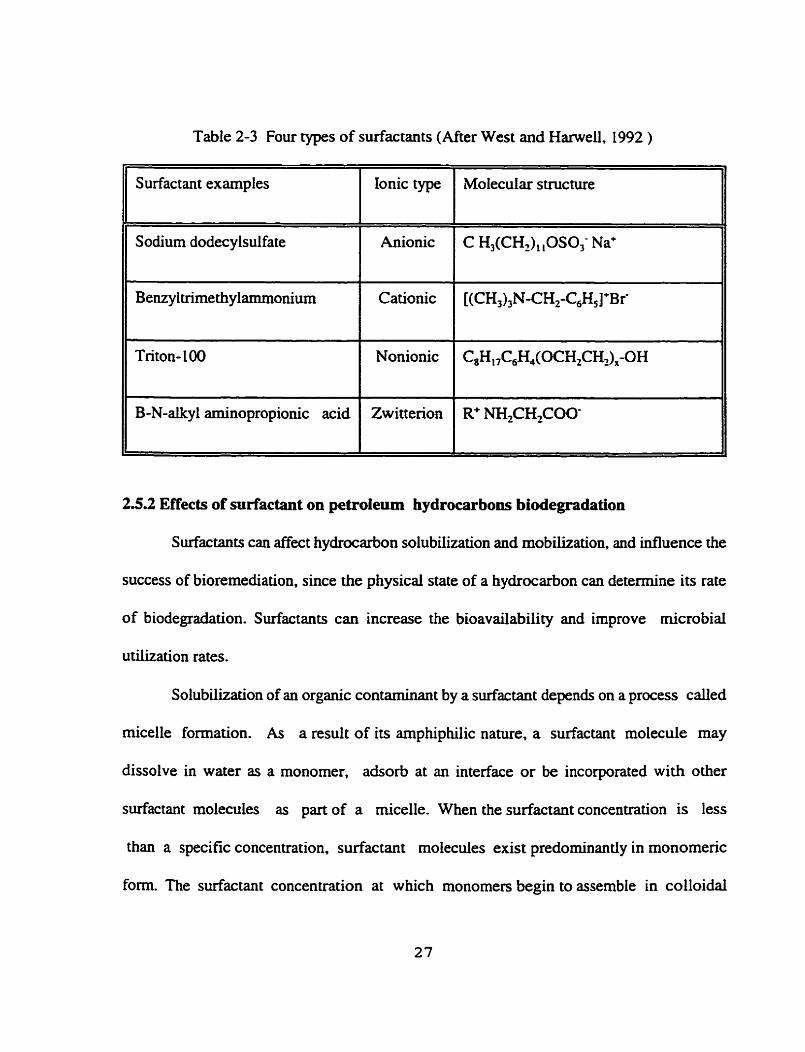
Surfactants are classified based on the charge of the hydrophillic group. Functiooal groups
in the hydrophillic end can impart a charge to this part of the molecule. An anionic
surfactant carries a negative charge at its hydrophillic end while a cationic surfactant cames
a positive charge. When negative and positive charges are present the surfactant is defined
as zwitterionic, or if no polarization occurs, it is temed nonionic surfactant (West and
Hawell. 1992). Four exarnples of these types of surfactants are listed in Table 2-3.
Page 40
Table 2-3 Four types of surfactants (After West and Harwelî, 1992 )
2.5.2 Effects of surfactant on petroietun hydrocarbons biodegradation
Surfactant examples
Sodium dodecylsulfate
Benzy ltrimethylammonium
Triton- 100
B-N-alkyl aminopropionic acid
Surfactants can affect hydrocarbon solubilization and mobilization. and influence the
success of bioremediation, since the physical state of a hydrocarbon cm determine its rate
of biodegradation. Surfactants can increase the bioavailability and improve microbial
utilization rates.
Solubilization of an organic contaminant by a surfactant depends on a process c d e d
micelle formation. As a result of its amphiphilic nature, a surfactant molecule may
dissolve in water as a rnonomer. adsorb at an interface or be incorporated with other
surfactant molecules as part of a micelle. When the surfactant concentration is less
than a specific concentration, surfactant molecules exist predorninantly in monomerk
form. The surfactant concentration at which monomen begin to assemble in colloidal
Ionic type
Anionic
Cationic
Nonionic
Zwittenon
Molecular structure
C H,(CHt), ,OSO, Na*
[(CH,),N-CH,-C,H, ]+Br-
C8H,,C&I4(OCH,CH2),-OH
R+ NH,CH,COO-
Page 41
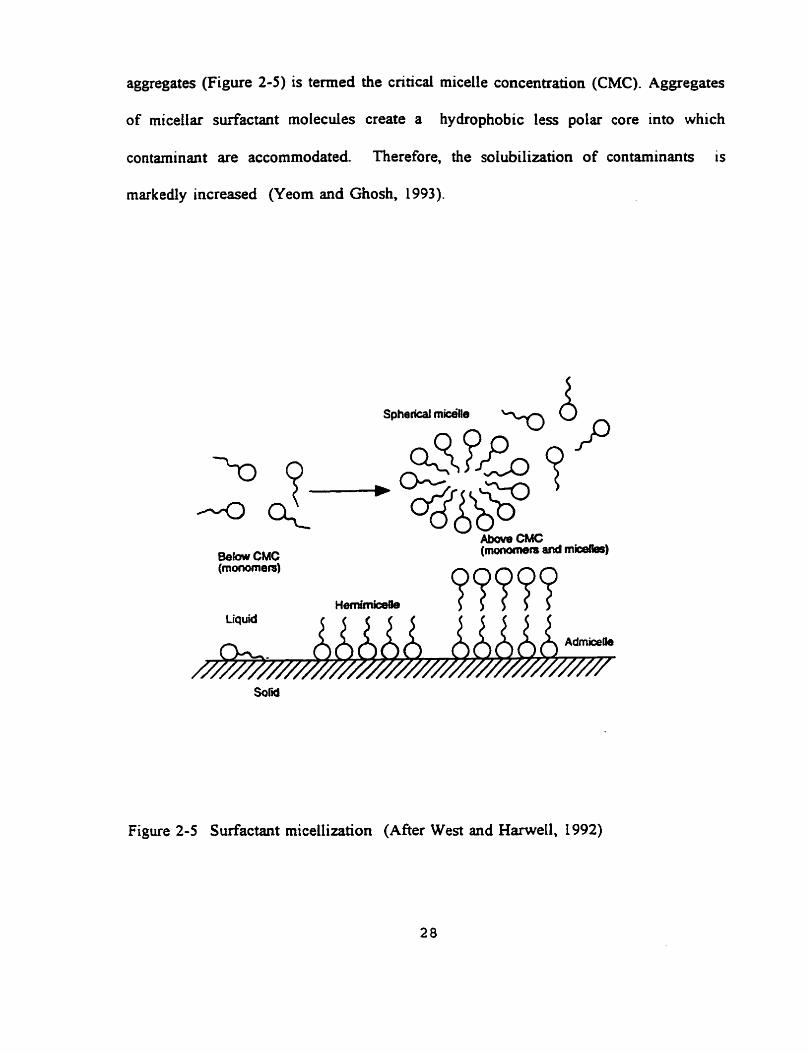
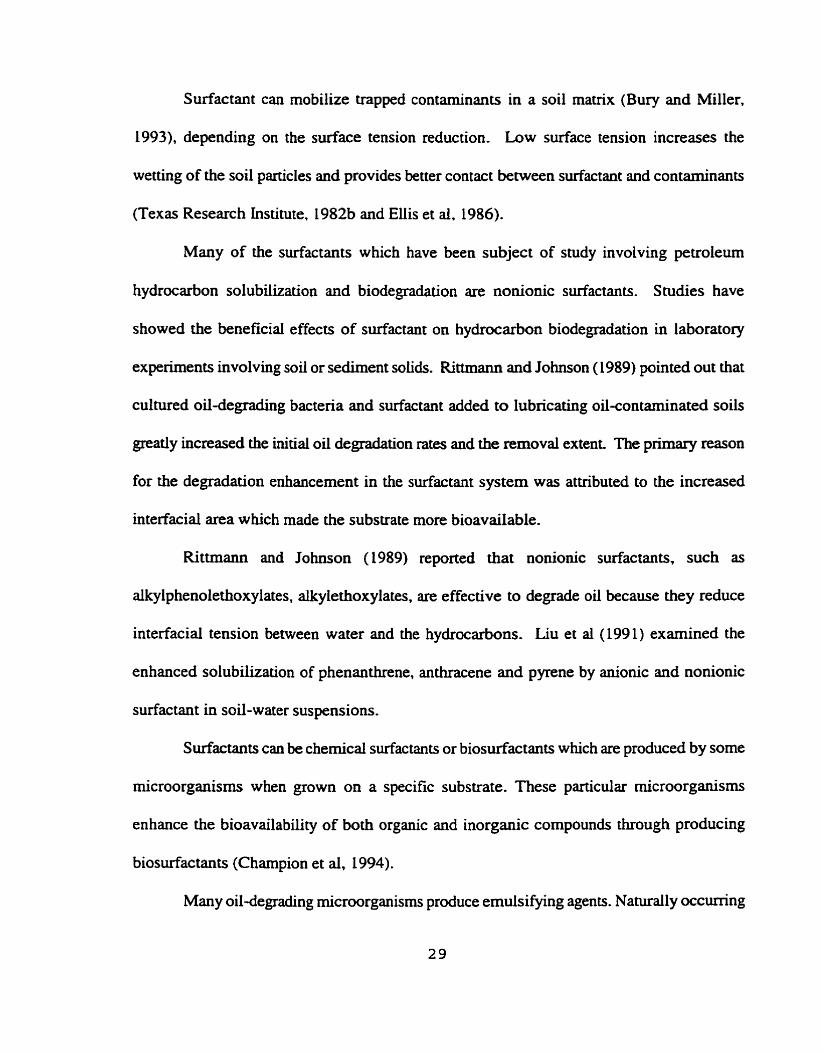
aggregates (Figure 2-5) is termed the critical micelle concentration (CMC). Aggregates
of micellar surfactant molecules create a hydrophobie less polar core into which
contaminant are accommodated. Therefore, the solubiIization of contaminants is
markedly increased (Yeom and Ghosh, 1 993).
Figure 2-5 Surfactant micellization (After West and Harwell, 1992)
Page 42
Surfactant can rnobilize trapped contaminants in a soil matrix (Bury and Miller,
1993), depending on the surface tension reduction. Low surface tension increases the
wetting of the soil particles and provides better contact between surfactant and contaminants
(Texas Research Institute, 1982b and Eliis et al. 1986).
Many of the surfactants which have been subject of study involving petroleum
hydrocarbon solubilization and biodegradation are nonionic surfactants. Studies have
showed the beneficial effects of surfactant on hydrocarbon biodegradation in laboratory
experiments involving soii or sediment soiids. Rittmann and Johnson ( 1989) pointed out that
cultured oii-degrading bacteria and surfactant added to Iubncating oilcontaminated soils
greatly increased the initial oil degradation rates and the rernoval extent. The primary reason
for the degradation enhancement in the surfactant system was attributed to the increased
interfacial area which made the substrate more bioavailable.
Rittmann and Johnson (1989) reported that nonionic surfactants, such as
alkylphenolethoxylates, alkylethoxylates, are effective to degrade oil because they reduce
interfacial tension between water and the hydrocarbons. Liu et al (1991) examined the
enhanced solubilization of phenanthrene, anthracene and pyrene by anionic and nonionic
surfactant in soil-water suspensions.
Surfactants can be chernicd surfactants or biosurfactants which are produced by some
rnicroorganisms when grown on a specific substrate. These particular rnicroorganisms
enhance the bioavailability of both organic and inorganic compounds through producing
biosurfactants (Champion et al, 1994).
Many oil-degrading microorganisms produce emulsifjhg agents. Naturally occurring
Page 43
biosurfactants such as Sophorose Lipids and Rhamnolipid. seem to be effective in the
degradation of hydrocarbons (Van Dake et al., 1993). Oberbremer et al ( 1990) examined
the effect of the addition of a biosurfactant, the suphorose lipid. on hydrocarbon degradation
in a soil. They found that the hydrocarbons degndation rate could be doubled by addition
of this biosurfactant. Ishihara et ai (1995) used a microbial consortium SM8 to degrade 50
to 60% of the saturated hydrocarbow and 30 to 40% of the aromatic hydrocarbons of crude
soil in 30 days in batch culture. Lindoerfer et al. (1992) dernonstrated that biologically
produced surfactants will enhance rates of petroleum hydrocarbon biodegradation
significantly. They showed that treating cmde oil-contaminated soil with a mixture of a
glycolipid biosurfactant and a chernical surfactant could produce a threefold increase in the
overall rate of hydrocarbon biodegradation.
However, surfactant may affect soil biology. Laboratory evidence of inhibitory
effects of surfactant under àifferent conditions on Poly Aromauc Hydrocarbon (PAH)-
degradhg microorganisms was reported by Laha and Luthy ( 199 1). They found that nonioic
surfactant alcohol ethoxylates at concentration of CMC inhibited the mineralkation of the
phenantherene, and did not enhance the rate of mineralization of the phenanthrene at a sub-
CMC concentration in soil-water systems. Soil microorganism activity and vitality have been
negatively influenced by some types and concentrations of surfactant (Litz et al., 1987).
Page 44
Chapter 3
The Argentia Site and the Environmental Testing
Facility
3.1 Site Presentation
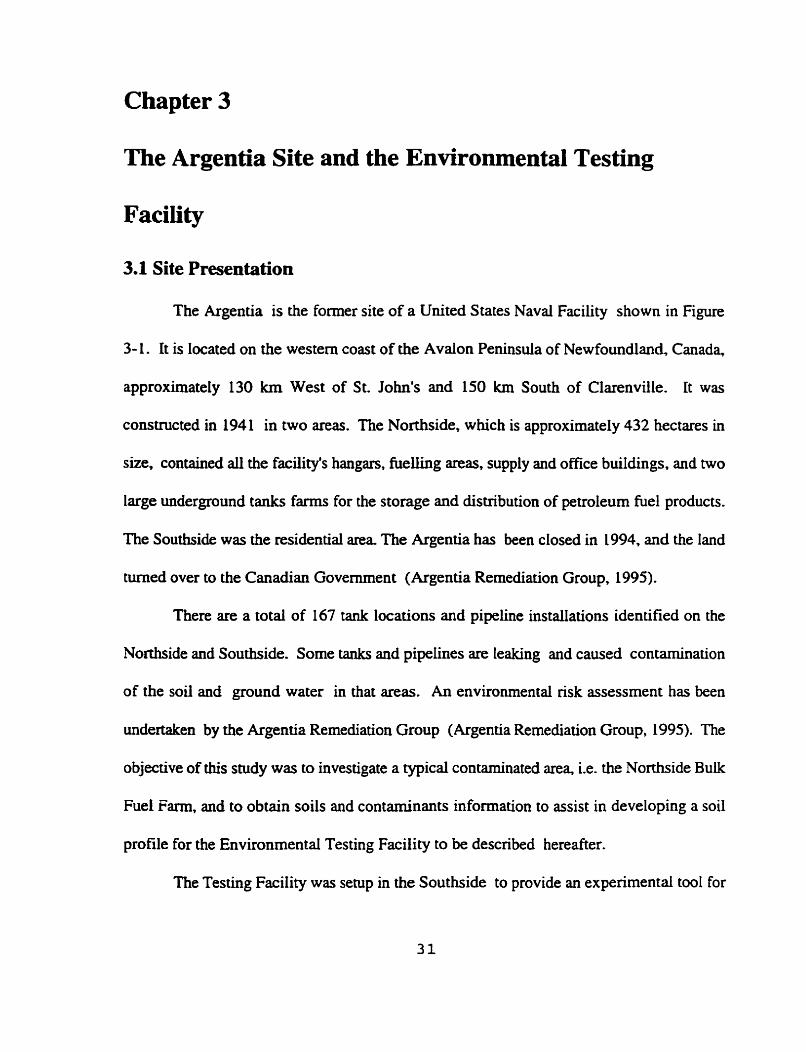
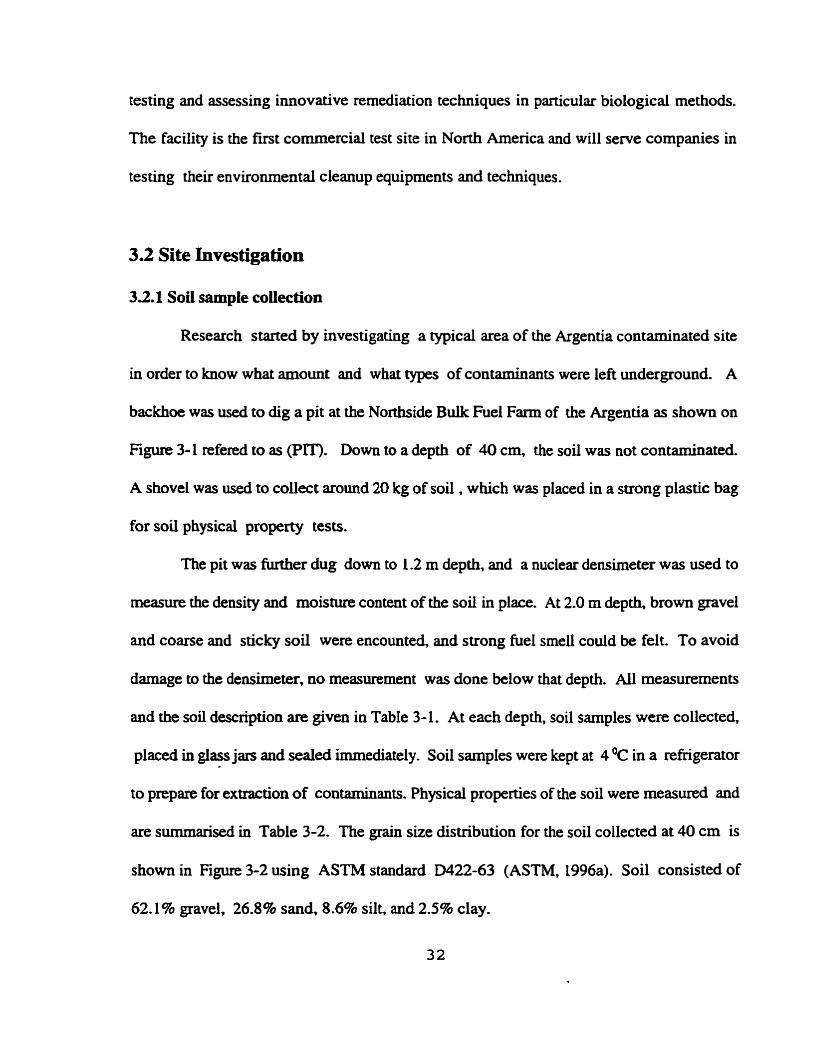
The Argentia is the former site of a United States Naval Facility shown in Figure
3- 1. It is Iocated on the western Coast of the Avalon Peninsula of Newfoundland, Canada,
approxirnately 130 km West of St. John's and 150 km South of Clarenville. It was
constructed in 1941 in two areas. The Northside, which is approximately 432 hectares in
size. contained aU the facility's hangars, fuelling areas, supply and ofice buildings. and two
large underground tanks farms for the storage and distribution of petroleum fuel products.
The Southside was the residential area The Argentia has been closed in 1994, and the land
turned over to the Canadian Govemment (Argentia Remediation Group. 1995).
There are a total of 167 tank locations and pipeline installations identified on the
Northside and Southside. Some tanks and pipelines are leaking and caused contamination
of the soii and ground water in that areas. An environmental rïsk assessrnent has k e n
undertaken by the Argentia Remediation Group (Argentia Remediation Group, 1995). The
objective of this study was to investigate a typical contaminated area, i.e. the Northside Bulk
Fuel F m , and to obtain soils and contaminanis information to assist in developing a soi1
profile for the Environmentai Testing Facility to be described hereafter.
The Testing Facility was setup in the Southside to provide an experirnental tool for
Page 45
testing and assessing innovative remediation techniques in particular biological methods.
The facility is the fust commercial test site in North Arnenca and will serve companies in
testing their environmental cleanup equipments and techniques.
3.2 Site Investigation
3.2.1 Soii sample collection
Research started by investigating a typical area of the Argentia contaminated site
in order to know what amount and what types of contaminants were left underground. A
backhae was used to dig a pit at the Northside Bulk Fuel Farm of the Argentia as shown on
Figure 3-1 refered to as (PIT). Down to a depth of 40 cm. the soil was not contamiaated.
A shovel was used to coiiect around 20 kg of soil , which was placed in a strong plastic bag
for soil physical property tests.
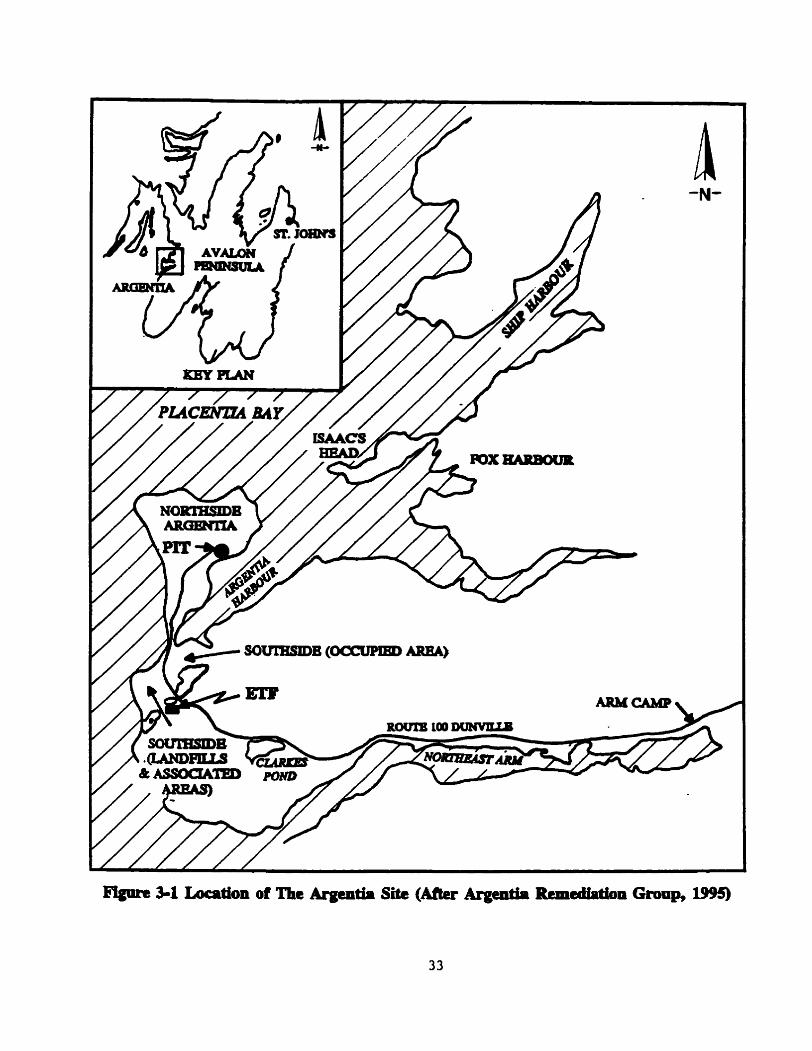
The pit was m e r dug dom to 1.2 rn depth, and a nuclear densimeter was used to
measure the density and moisture content of the soil in place. At 2.0 m depth, brown grave1
and coane and sticky soil were encounted, and strong fuel smell could be felt. To avoid
damage to the densimeter. no measurement was done below that depth. AU measurements
and the soi1 description are given in Table 3-1. At each depth, soil samples were collected,
placed in giass jars and sealeci irnmediately. Soil samples were kept at 4 OC in a refrigerator
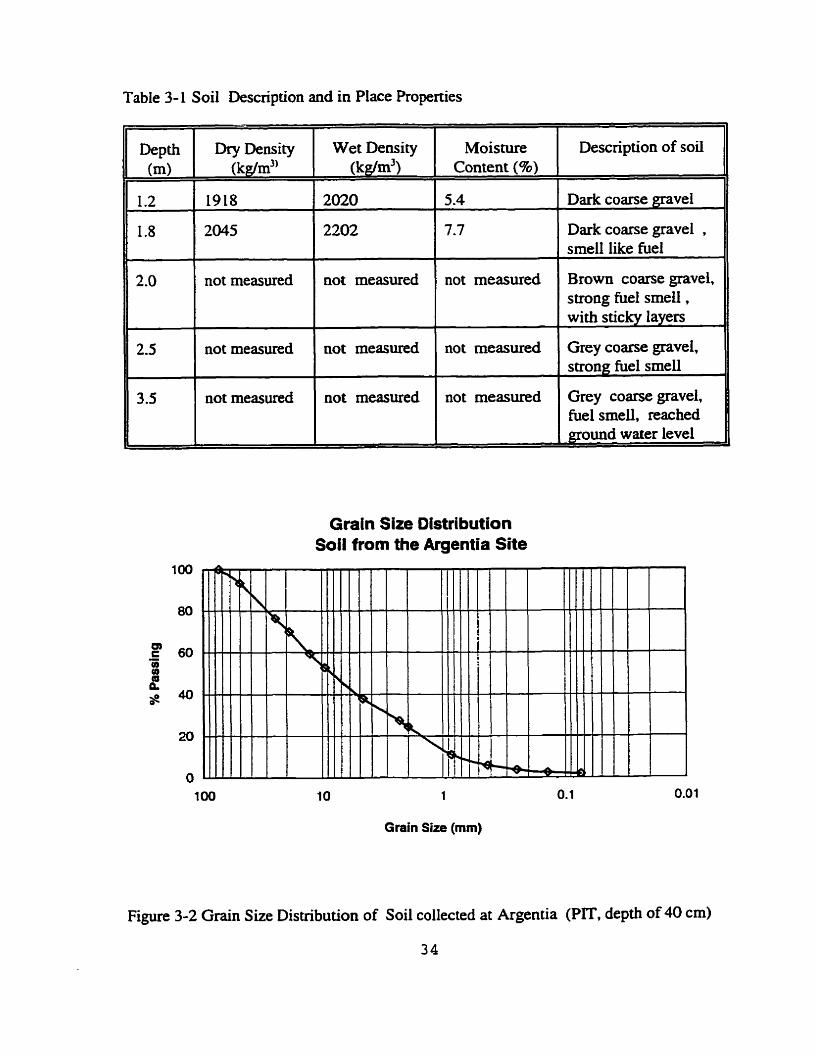
to pxpare for extraction of contaminants. Physical properties of the soil were measured and
are summarised in Table 3-2. The grain size distribution for the soil collected at 40 cm is
shown in Figure 3-2 using ASTM standard D422-63 (ASTM, 1996a). Soil consisted of
62.1% gravel, 26.8% sand, 8.6% silt. and 2.5% clay.
Page 47
Table 3- 1 Soi1 Description and in Place Properties
Depth Dry Density Wet Density
I not measured not measured I l not measured not measured I
not measured not measured 1 J Grain Size Distribution
Soil from the Argentia Site
Moisture Content (%)
5.4
7.7
not measured
not measured
not measured
10 1 o. 1
Grain Size (mm)
Description of soi1
Dark coarse p v e l
Dark coarse gravel . smell like fbel
Brown coarse gravel, strong fuel smell, with sticky layers
Grey coarse gravel. strong hiel smell
Grey coarse gravel. fbel srneil, reached ground water level
Figure 3-2 Grain Size Distribution of Soil collected at Argentia (Pr, depth of 40 cm)
34
Page 48
Table 3-2 Summary of typical Argentia Soil Properties at Depth of 40 cm
Liquid Limit (CANIBNQ 2501-092) of II Fines
- - .
Soi1 Properties Values
1 ,hsticitv Index of Fines I 7
1
Shnnkage Limit (ASTM D424-59) of 1 Fines
plastic ~ i m i t (ASTM 11424-591 of Fines 1
1,
32.2 Extraction of hydrmbons
Following soi1 sarnpling, contaminam were extracted using Soxhlet extraction
method 3540 (Test Methods for Evaluating soil waste, SW-864, 1982). Particles larger than
sieve # 8 US (2.36 mm) were removed 20-30 g of the remaining soil was blended with an
equal weight of anhydrous sodium sulfate in a glass beaker for 20 minutes. The mixture was
placed in a cellular extraction thimble. 300 ml of the extraction agent (methylene chloride)
was prepared in a flask with two boiling Stones.
Soii sample was exmted for 24 hours at three cycles per hour. Following the
extraction, the extract was concentrated in volume to around 1 ml in a rotary evaporator at
a temperature of 30°C. The concentrated extract was pipetted in a 2 mi via1 and blown down
to a constant weight using nitrogen. The viai was then sealed and stored in a refrigerator.
35
Optimum Water Content (95 dry wt.)
Maximum Dry Density ( g/cm3)
pH ( 1 : 1 Soi1 -Water)
Specific Gravity (ASTM D854-59)
11.1
2.15
6.5
2.69
Page 49
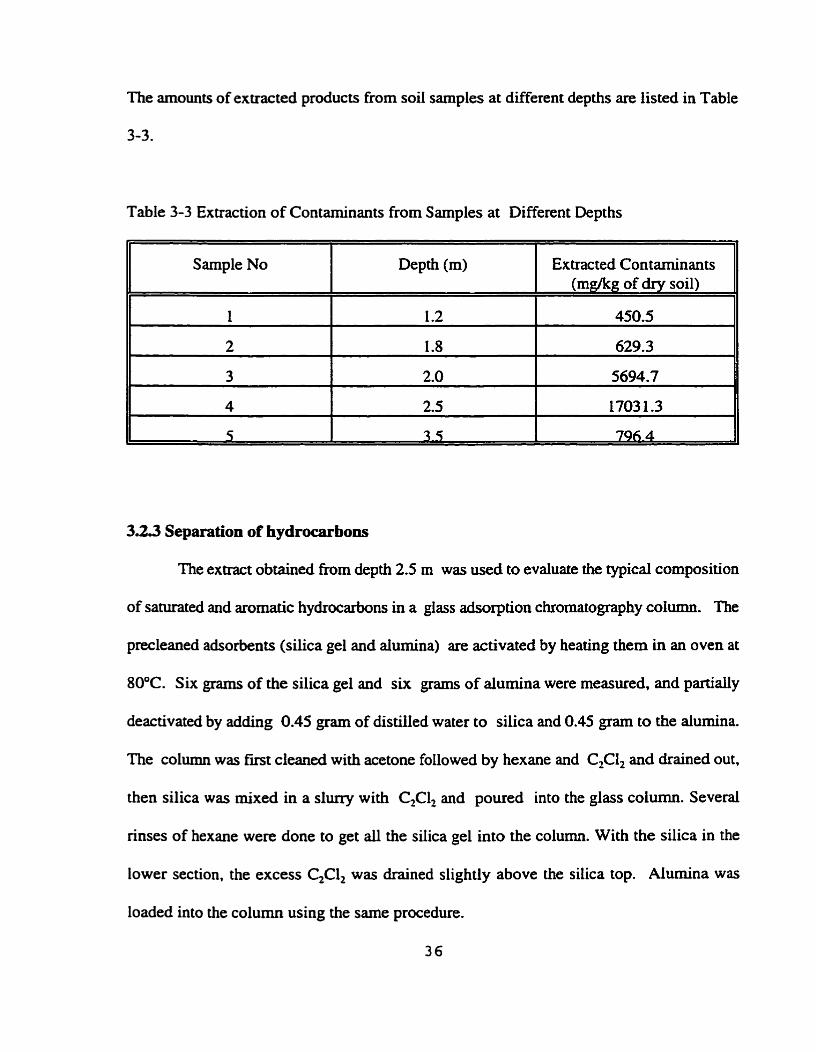
The arnounts of extracted products from soil samples at different depths are listed in Table
Table 3-3 Extraction of Contaminants from Samples at Different Depths
3.2.3 Separation of hydrocarbons
The extract obtained from depth 2.5 m was used to evaluate the typical composition
of saturateci and aromatic hydrocarbons in a glass adsorption chromatography columu. The
precleaned adsorbenu (silica gel and alumina) are activated by heating them in an oven at
80°C. Six gram of the silica gel and six grams of alumina were measured, and paaially
deactivated by adding 0.45 gram of distilled water to silica and 0.45 gram to the dumina.
The column was first cleaned with acetone followed by hexane and C,Cl, and drained out.
then silica was mixed in a slurry with GCl, and poured into the glass coiumn. Several
rinses of hexane were done to get aIi the silica gel into the column. With the silica in the
lower section, the excess C2CI, was drained slightly above the silica top. Alumina was
loaded into the column using the same procedure.
36
Sample No
1
Deph (m)
1.2
Extracted Contaminants (mgkg of dry soil)
450.5
Page 50
After the column was packed the extract was taken out £iom the renigerator and 50
mg of it was pipped into a 1 ml via1 filied with hexane that was in him placed in a 5 ml
beaker. The beaker was then placed in a ultrasonic bath for 3 minutes. The content of the
Id vial was injected in the column by a syringe. which was rinsed with hexane. 30 ml
of hexane was added to the column content, and effluent was collected by a flask labelled
"saturated hydrocarbon". 30 mi of 812 of hexane/dichloromethane was then added to the
column, and the effluent was collected in another flask labeiied "aromatic hydrocarbon".
The solvent in the flask was evaporated using the rotary evaporator, and the content
in the flask was pipetted into a lm1 preweighed uial, then dried using N, to a constant
weight which was recorded. Using this procedure. the extract under study showed a
composition of 90.896 of saturated hydrocarbon and 9.2% of aromatic hydrocarbon. The
vial was sealed and stored in the refngerator for Gas Chrornatography (GC) analysis.
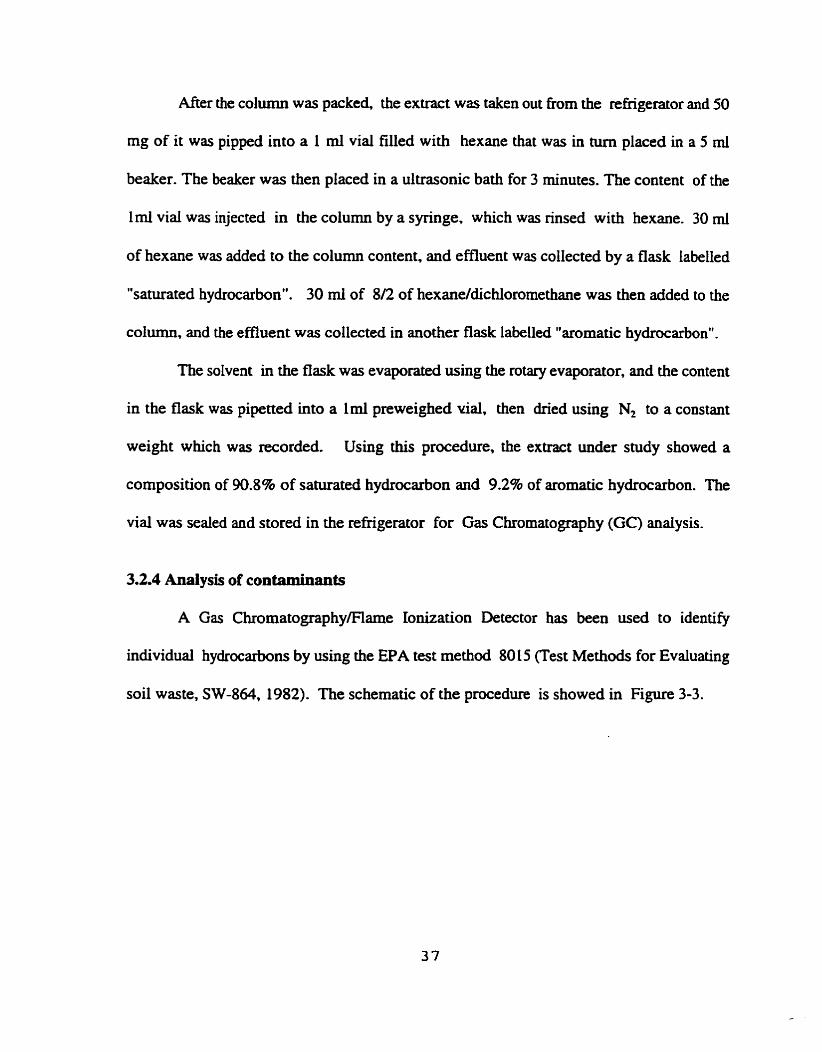
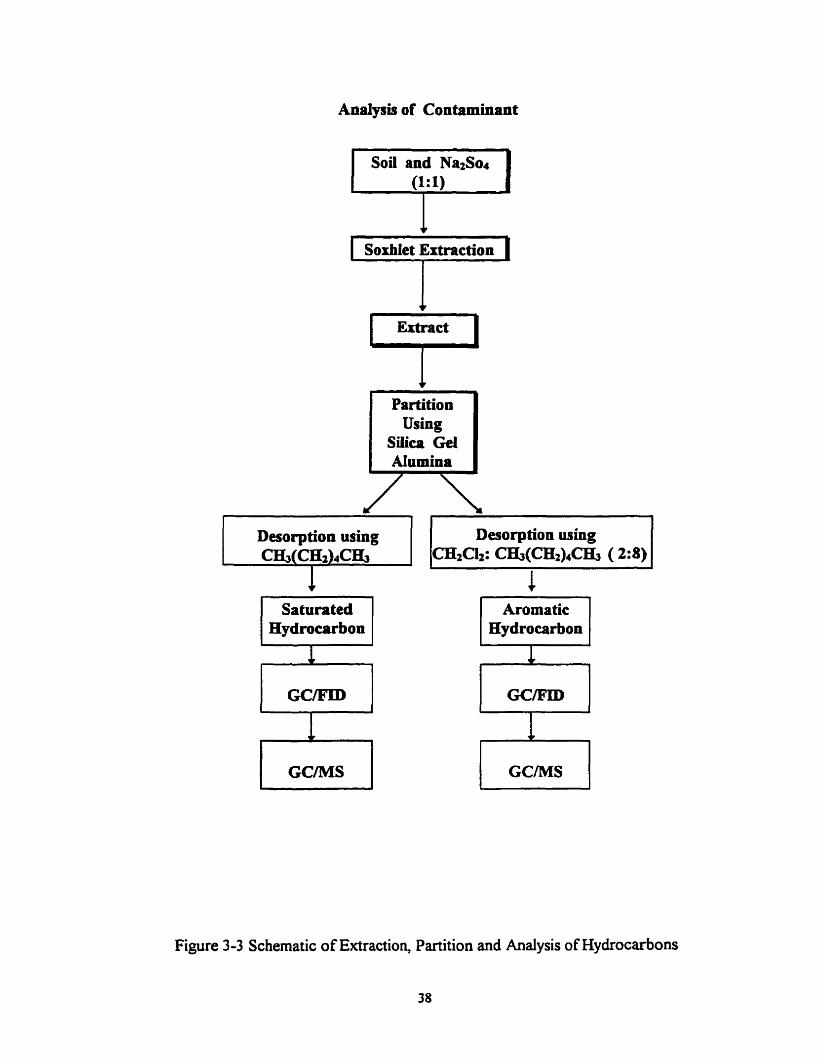
3.2.4 Analysis of contaminants
A Gas Chromatography/Flame Ionization Detector has k e n used to identify
individual hydrocarbns by using the EPA test method 80 15 (Test Methods for Evaluating
soi1 waste, SW-864, 1982). The schematic of the procedure is showed in Figure 3-3.
Page 51
Aoaiysis of Contaminant
A
Partition Using
Silica Gel Alurnina
Desorption uaing
Saturated Hydrocarbon
( Desorption u h g 1
Aromatic Hydrocarbon
Figure 3-3 Schematic of Extraction, Partition and Analysis of Hydrocarbons
38
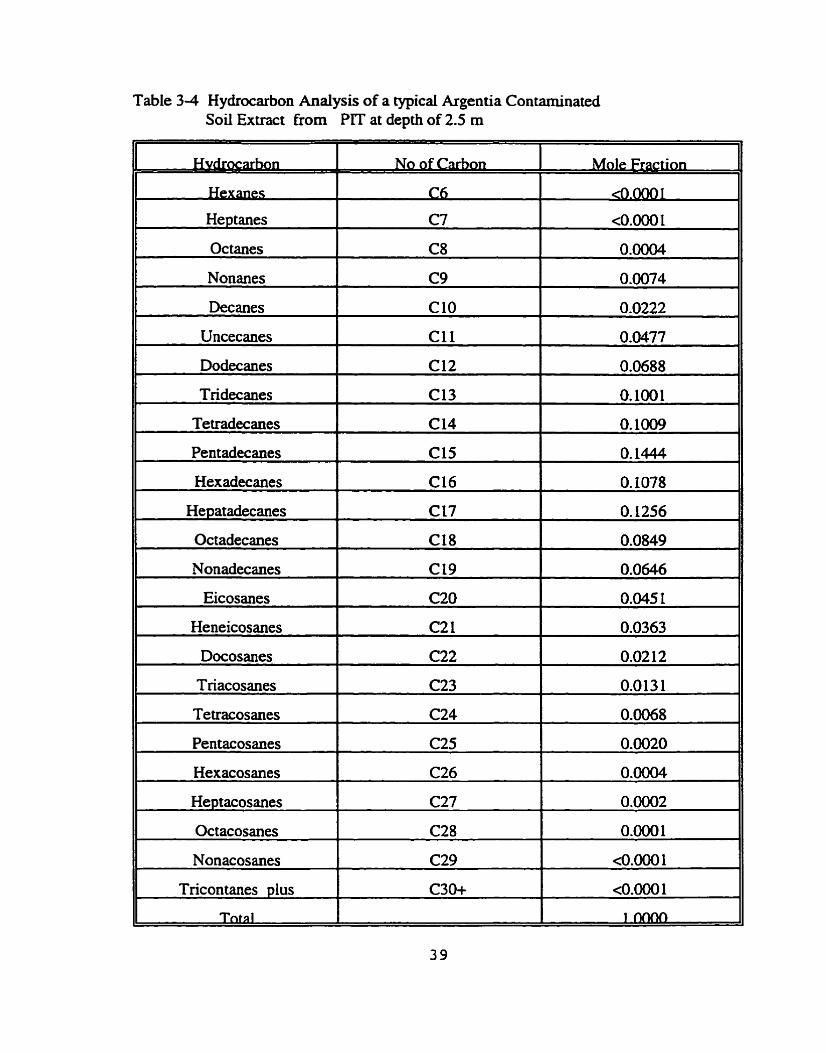
Page 52
Table 3-4 Hydrocarbon Analysis of a typical Argentia Contarninated Soi1 Extract nom Pïï at depth of 2.5 m
Hep tanes
Octanes
Nonanes
II Dodecanes 1 Cl2 1 0.0688 Il Uncecanes
No of C m
C6
C7
1
<0.0001
Cl 1
I
0.0477
Pentadecanes
Hexadecanes
Hepatadecanes
Octadecanes
Nonadecanes
Eicosanes
Heneicosanes
Docosanes
Triacosanes
Te tracosanes
Pentacosanes
Hexacosanes
Heptacosanes
Oc tacosanes
Nonacosanes
C8
C9
Tridecanes
1
0.0004
0.0074
Cl5
Cl6
Cl7
Cl8
Cl9
C20
C2 1
C22
C23
C24
C25
C26
C27
C28
C29 1
Cl3
O. 1444
O. 1078
O. 1256
0.0849
0.0646
0.045 1
0.0363
0.02 12
0.013 1
0.0068
0.0020
0.0004
0.0002
0.000 1
~û.000 1
Tricontanes plus 1 C30+
O. 1001
<O.OOO 1
Page 53
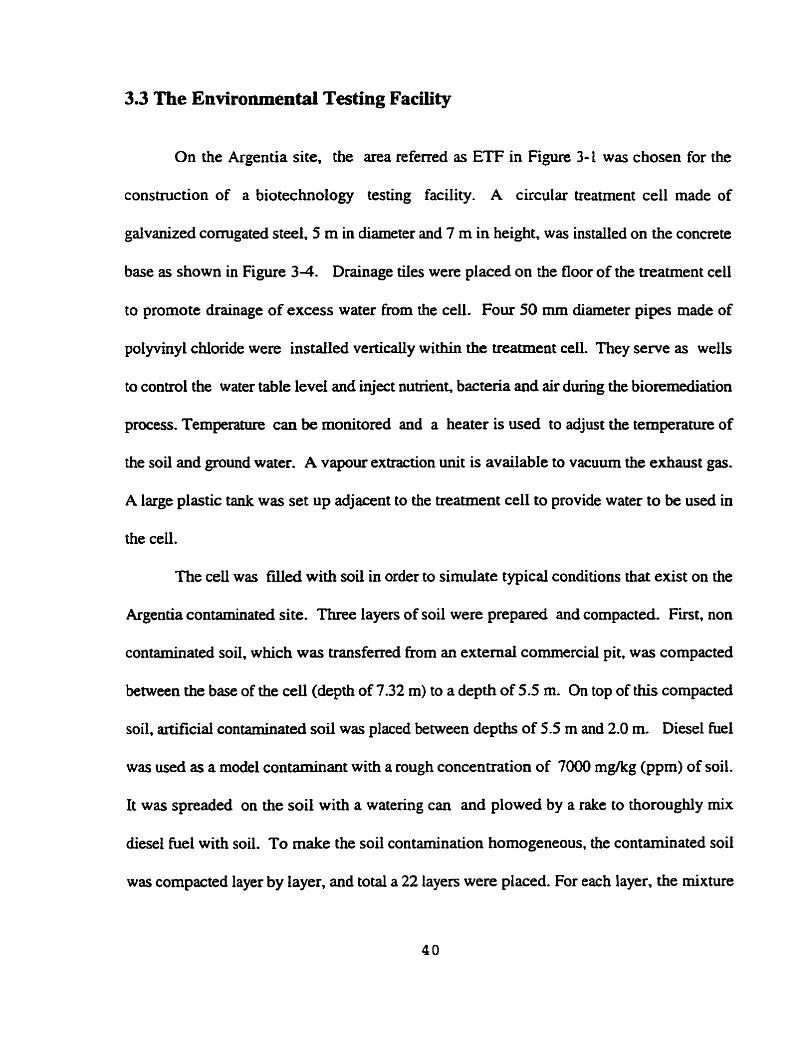
3.3 The Environmental Testing Faciiity
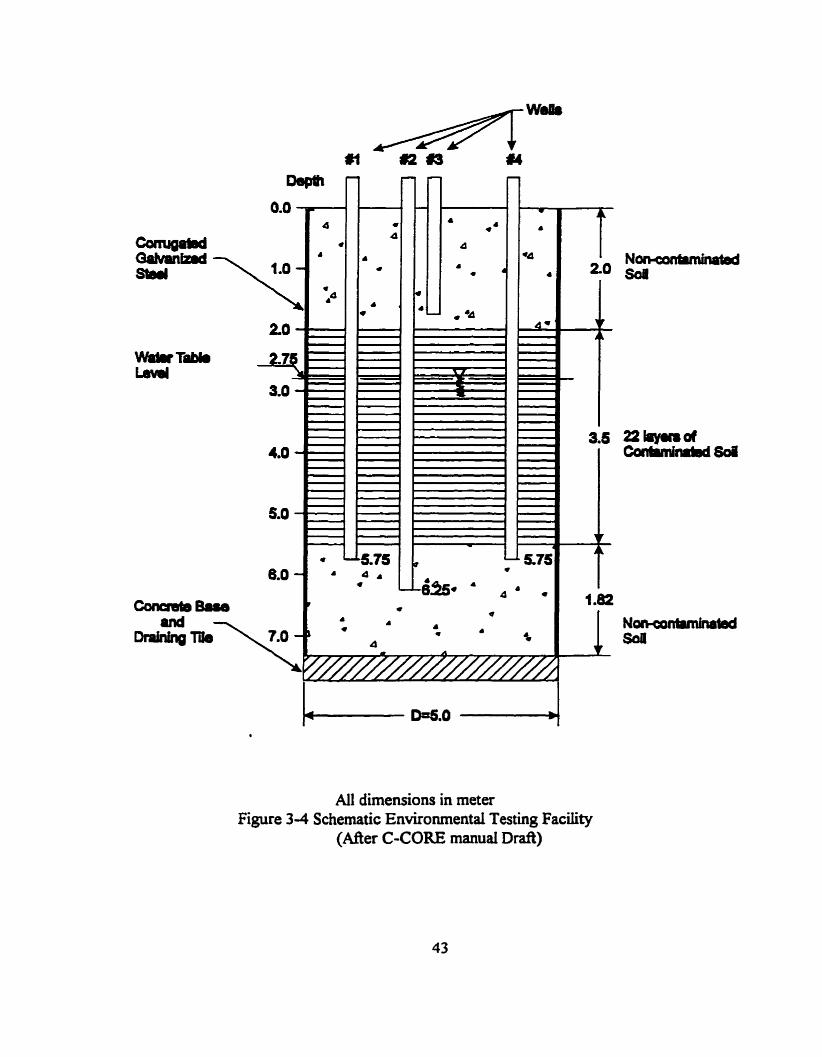
On the Argentia site, the area referred as ETF in Figure 3-1 was chosen for the
construction of a biotechnology testing facility. A circular treatment ce11 made of
gaivanized comgated steel, 5 m in diameter and 7 rn in height, was installed on the concrete
base as shown in Figure 3-4. Drainage tiles were placed on the floor of the treatrnent ce11
to promote drainage of excess water from the cell. Four 50 mm diameter pipes made of
polyvinyl chloride were installed venically within the treatment cell. They serve as wells
to control the water table Ievel and inject nutrient, bacteria and air during the bioremediation
process. Temperature can be monitored and a heater is used to adjust the temperature of
the soii and ground water. A vapour extraction unit is available to vacuum the exhaust gas.
A large plastic tank was set up adjacent to the treatment ce11 to provide water to be used in
the cell.
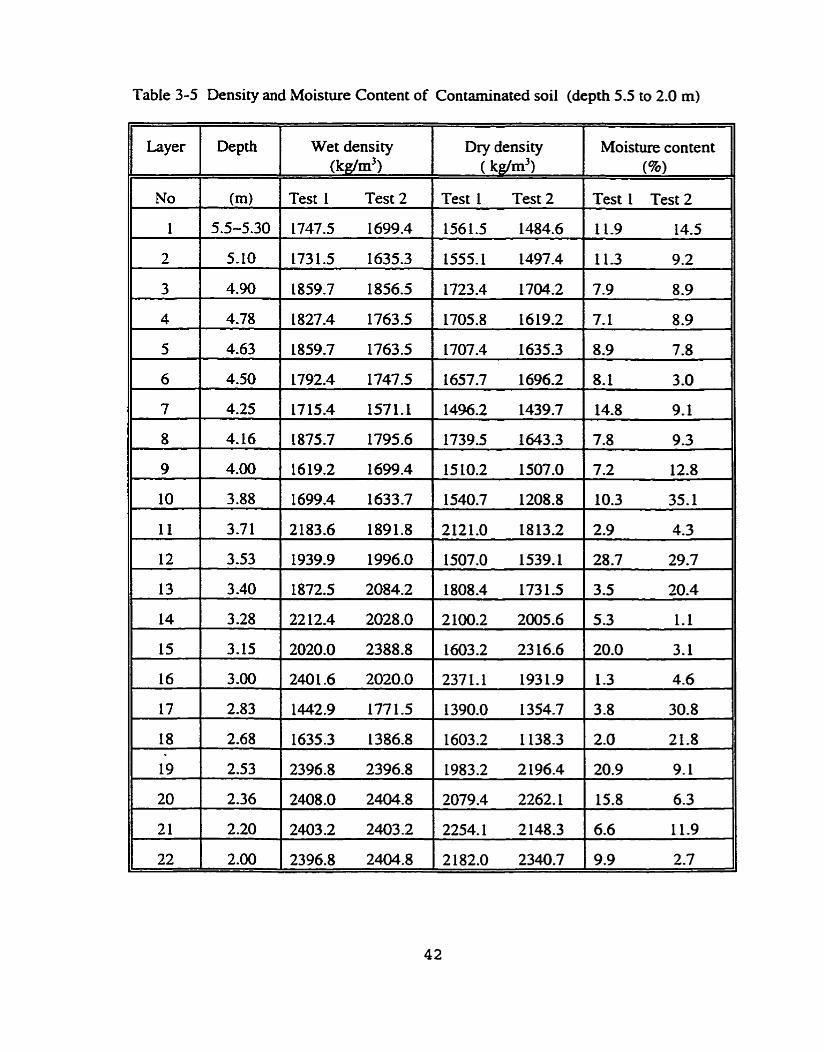
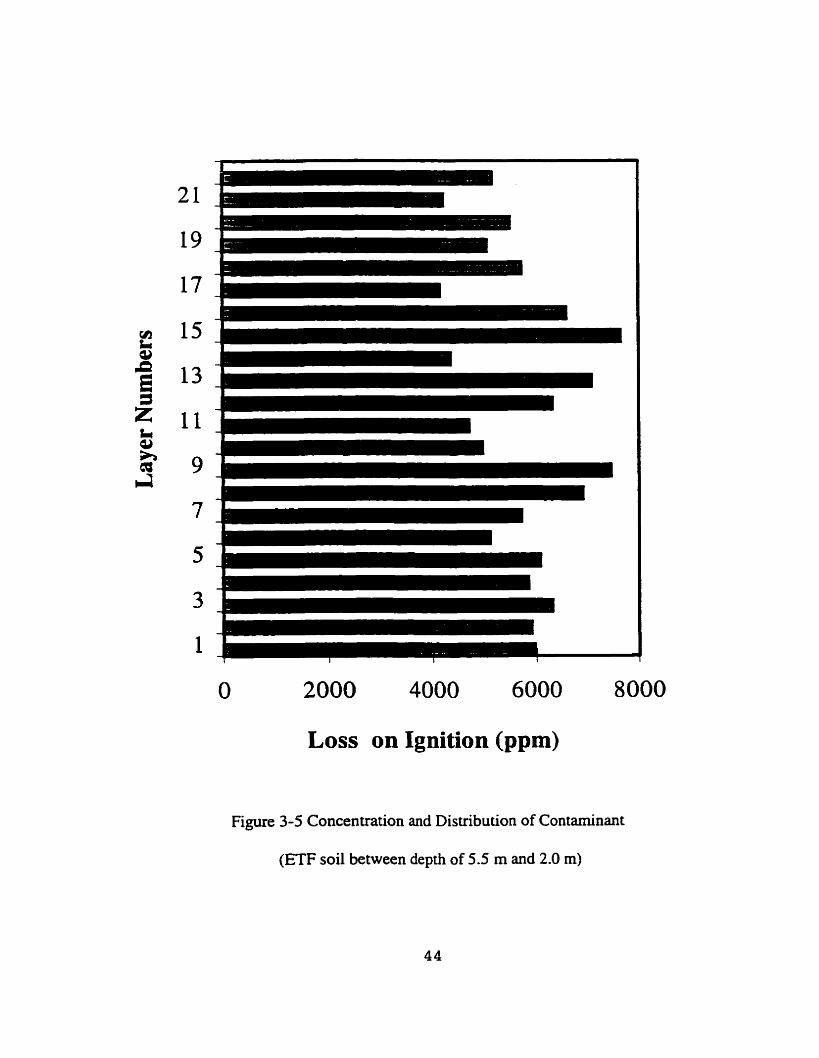
The ceil was fded with soii in order to simulate typical conditions that exist on the
Argentia contaminated site. Three layers of soil were prepared and compacted. F i t , non
contaminated soil, which was transferred fiom an external commercial pit, was compacted
between the base of the ceii (depth of 7.32 m) to a depth of 5.5 m. On top of this compacted
soil, &cial contaminated soil was placed between depths of 5.5 m and 2.0 m. Diesel hie1
was used as a mode1 contaminant with a rough concentration of 7000 mg/kg (ppm) of soil.
It was spreaded on the soi1 with a watenng can and plowed by a rake to thoroughly mix
diesel fuel with soil. To make the soil contamination homogeneous, the contaminated soil
was compacted layer by layer, and total a 22 layen were placed. For each layer, the mixture
Page 54
of diesel and soil was compacted using waiking-behind gasoline powered tamper. The
density and moisture content were measured with a nuclear densimeter and the results are
s h o w in Table 3-5. The concentrations and distribution of contaminant in the contamiriated
layers were determined ( Loss on Ignition test) and the results are presented in Figure 3-5.
Findy, non contaminated soil was placed between the depth of 2.0 m and the ground level.
The ceIl was then covered. Ground water table was set at the depth of 2.75 m.
Page 55
Table 3-5 Density and Moisture Content of Contaminated soi1 (depth 5.5 to 2.0 m)
Wet density Dry density Moisture content W m 3 ) ( kp/m3) (W
Test 1 Test 2 Test 1 Test 2 Test 1 Test 2
Page 56
All dimensions in meter Figure 3-4 Schematic Environmental Testing Faciiiv
(Mer C-CORE manuai Dr&)
Page 57
O 2000 4000 6000 8000
Loss on Ignition (ppm)
Figure 3-5 Concentration and Distribution of Contaminant
(ETF soi1 between depth of 5.5 m and 2.0 m)
Page 58
3.4 Typicai Protocol for in Situ Remediation of Diesel Contaminated Soi1
3.4.1 Operation of the treatment ceil
The matment cell started operation in December. 1996. A Company specialized in
bioremediation went on the site and conducted a trial test. Nutrients and bacteria were
injected into the treatment cell through one of the weli placed in the centre of the celi. Hence
nutrients and bacteria reached the simulated ground water in the ceil. Air was also circulated
to supply oxygen which is a very important factor to accelerate the rate of biodegradation.
The temperature was monitored . Because of propnetary concems and limitation, details of
the exact procedures cannot be made available in the present study.
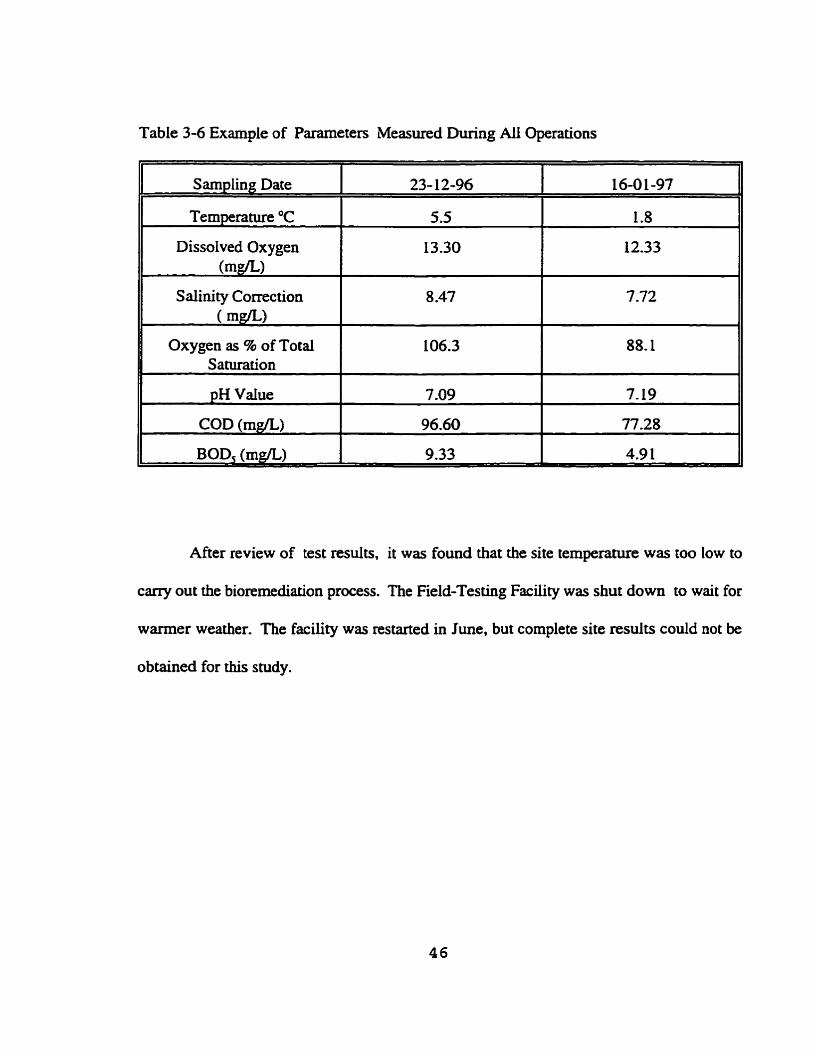
3.4.2 Water sampliag and measurement
Water from the treatment cell was coliected in one of the peripheral well in order
to know the growth of bacteria during biodegradation process. Water samples were tested
for several parameters such as dissolved oxygen, temperature, pH, salinity correction and
oxygen a s % of total saturation. This was doue immediately on the test site using a portable
Dissolved Oxygen Meter (Ati Orion, 1996). Chernical Oxygen Demand (COD) and
Biochernical Oxygen Demand (BOD5) were measured in the laboratory within 24 hours.
Both COD and BOD values give an indication of the organic content in the contaminated
water. The difinitions and testing procedures are given in Eaton, et al (1995). Typical
results are shown in Table 3-6,
Page 59
Table 3-6 Example of Parameten Measured During AU Operations
Sarnding Date 1 23- 12-96 1 16-0 1-97
Temperature O C
Salinity Correction 1 8 -47 1 7.72
Dissolved Oxygen (mg/L>
Oxygen as 96 of Total Saturation
5.5
DH Value 1 7.09 1 7.19
1.8
13.30 12.33
After review of test resuits, it was found that the site temperature was too low to
carry out the bioremediation process. The Field-Testing Facility was shut down to wait for
warmer weather. The facility was restarted in lune, but complete site results could not be
obtained for this study.
COD (mg/L)
BOD, (rnfl)
96.60
9.33
77.28
4.9 1
Page 60
Chapter 4
Laboratory Experiments: Materials and Methods
4.1 Materials
4.1.1 Soii
The soils used in the biorernediation experiments were collected from the Argentia
Testing Facility tank where they had been contaminated by diesel fuel with a concentration
of about 7 0 ppm. They had a strong fuel smell and treatment operations were therefore
carried out under a hime hood. Soils were fmt sieved through a sieve #4 US (4.75 mm) to
remove grave1 sue, debris and chunks. Then the soils were thoroughly rnixed in a plastic bag
to make them more homogeneous and they were placed in refngerated storage at 4OC. For
the experiments , selected amounts of soi1 were taken and put into a glass jar.
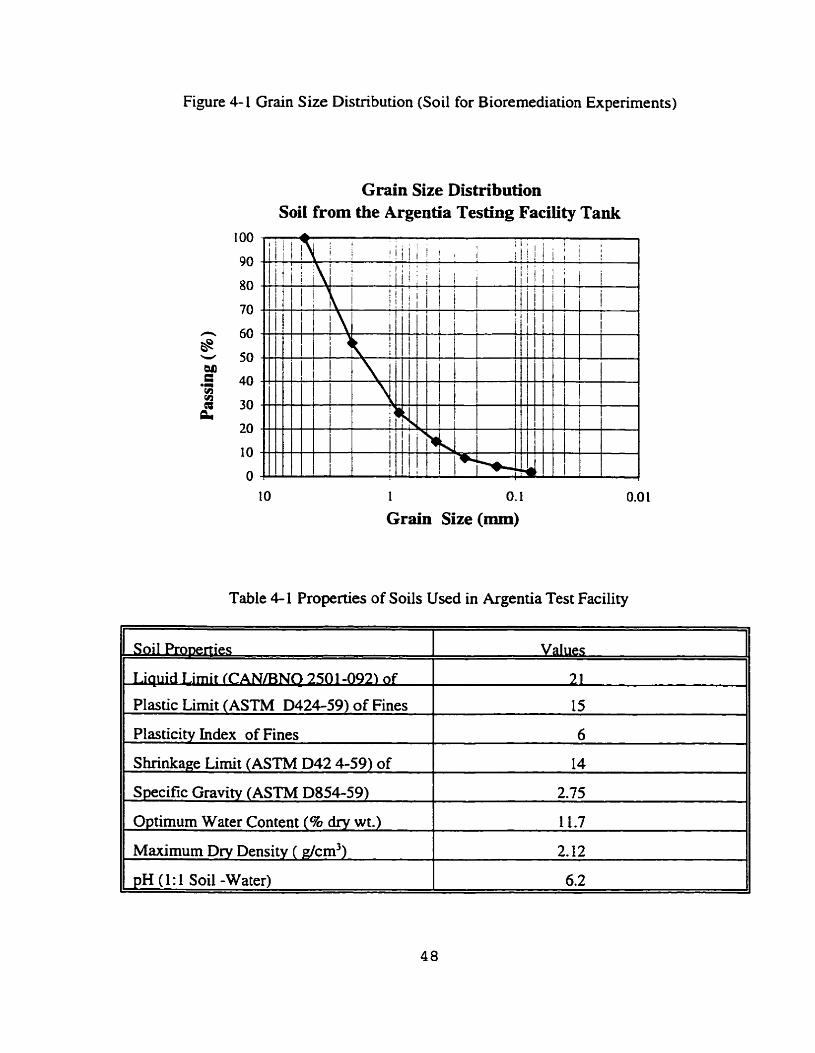
The soils were characterized according to grain size distribution. pH value, and
physical properties. The grain size distribution is s h o w in Figure 4-1 and the sieving
procedure foilowed the ASTM D422-63 (ASTM. 1996a). The truncated material is a well
graded sand with little fines (1.9% < # 2 0 ) US sieve. The soi1 properties are summarized
in Tabie 4- 1.
Page 61
Figure 4- L Grain Size Distribution (Soil for Bioremediation Experiments)
Grain Size Distribution Soil from the Argentia Testing Facility Tank
1 O. 1
Grain Size (mm)
Table 4- 1 Properties of Soils Used in Argentia Test Facility
- -
Soi1 P r o m e s alues
Plastic Limit (ASTM D424-59) of Fines
Plasticity Index of Fines
Shrinkage Limit (ASTM D42 4-59) of
Specific Gravity (ASTM D854-59)
Optimum Water Content (% dry wt.)
Maximum Dry Density ( g/cm3)
pH (1: 1 Soi1 -Water)
15
6
14
2.75
11.7
2.12
6.2
Page 62
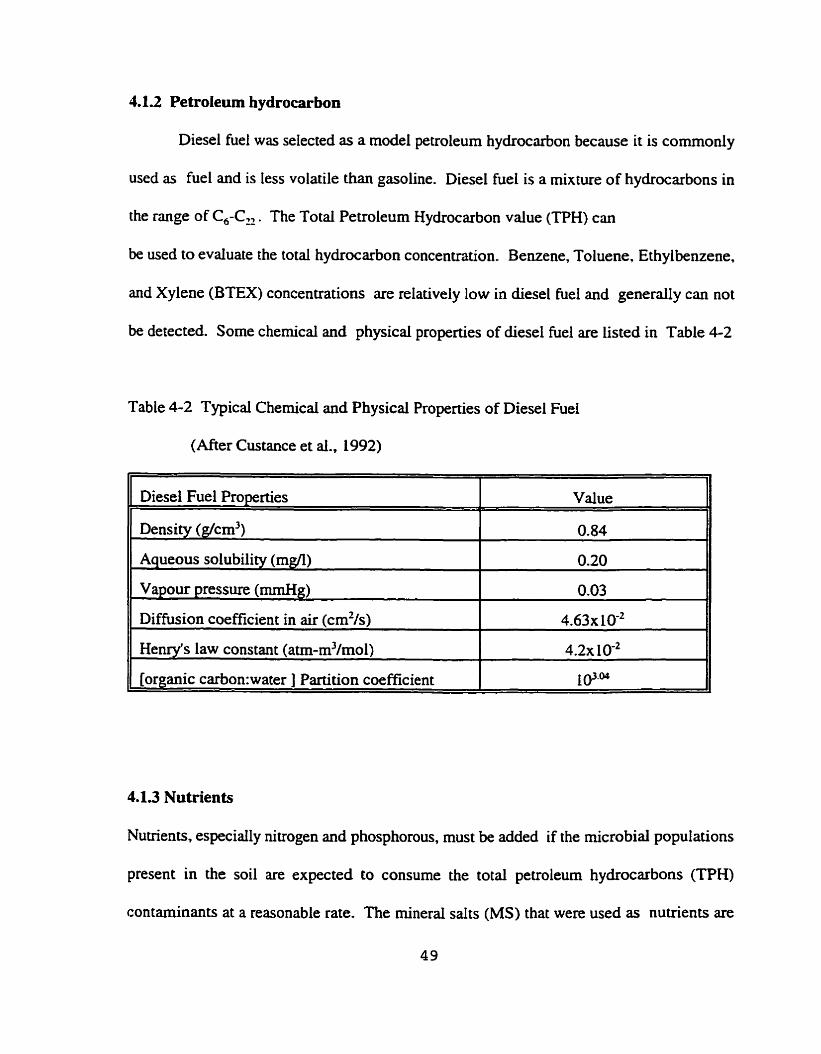
4.12 Petroleum hydrocarbon
Diesel fuel was selected as a mode1 petroleum hydrocarbon because it is commonly
used as fuel and is less volatile than gasoline. Diesel hie1 is a mixture of hydrocarbons in
the range of C,-Cï . The Total Petroleum Hydrocarbon value (WH) can
be used to evaiuate the total hydrocarbon concentration. Benzene, Toluene. Ethylbenzene.
and Xylene (BTEX) concentrations are relatively low in diesel hiel and generaily can not
be detected. Some chernical and physical properties of diesel fuel are Listed in Table 4-2
Table 4-2 Typical Chernical and Physical Properties of Diesel Fuel
(After Custance et al., 1992)
Diesel Fuel Properties
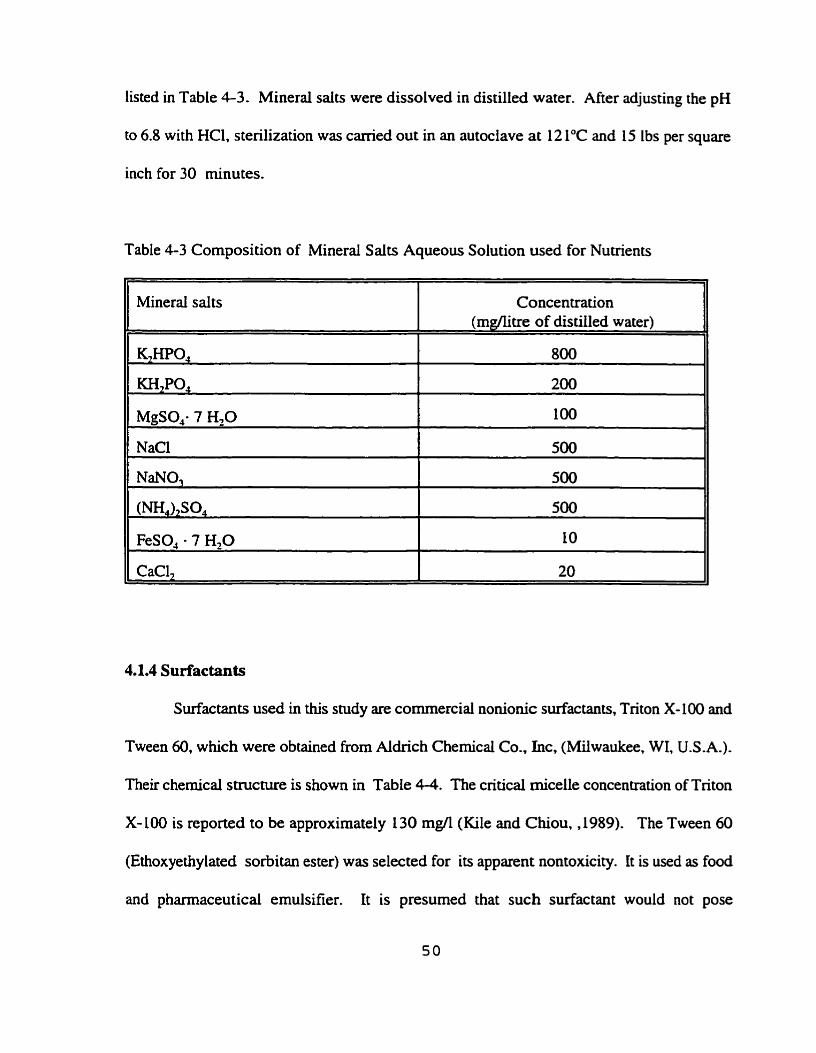
4.1.3 Nutrients
Nutrients, especially nitrogen and phosphorous, must be added if the microbid populations
present in the soi1 are expected to consume the total petroleum hydrocarbons (TPH)
contaminants at a reasonable rate. The minerai saits (MS) that were used as nuhents are
49
Value
Density @/cm3)
Aqueous solubility (mgll)
Vapour pressure (mm&)
Diffusion coefficient in air (cm%)
Henry's law constant (atm-m3/mol)
[organic carbon:water ] Partition coefficient
-- -- --
0.84
0.20
0.03
4.63~ IO-'
4 . 2 ~ 10-~
1 @.O4
Page 63
listed in Table 4-3. Mineral salts were dissolved in distilled water. After adjusting the pH
to 6.8 with HCI, sterilization was carried out in an autoclave at 12 1°C and 15 lbs per square
inch for 30 minutes.
Table 4-3 Composition of Mineral Salts Aqueous Solution used for Nutrients
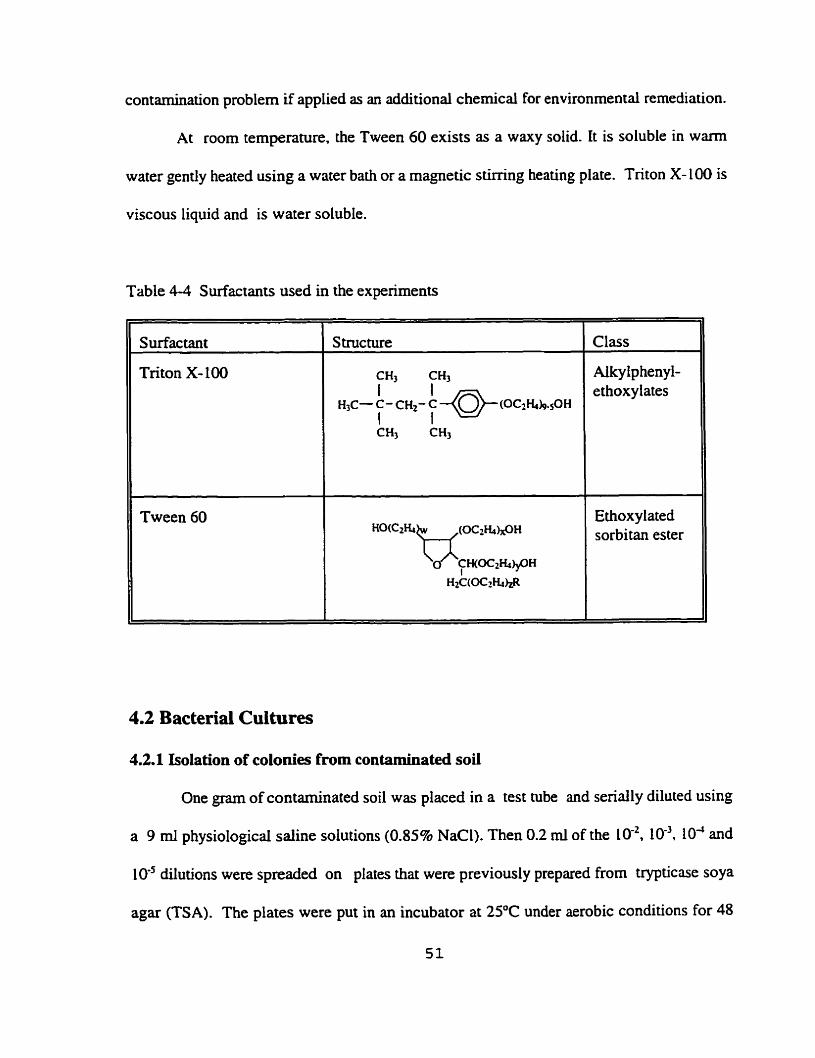
4.1.4 Surfactants
Surfactants used in this snidy are commercial nonionic surfactants, Triton X-LM) and
Tween 60, which were obtained from Aldrich Chernical Co., Lnc, (Milwaukee, WI, U.S.A.).
Their chernical structure is shown in Table 4-4. The criticai micelle concentration of Triton
Mineral salts
K,HPO,
KH,PO,
MgS0,- 7 H 2 0
X- LOO is reported to be approxirnately 130 mgIl (Kile and Chiou. ,1989). The Tween 60
(Ethoxyethylated sorbitan ester) was selected for its apparent nontoxicity. It is used as food
and phamiaceutical emulsifier. It is presumed that such surfactant would not pose
Concentration (rngfitre of distilled water)
800
200
100
NaCl 500
Page 64
contamination problem if applied as an additional chernical for environmental remediation.
At room temperature, the Tween 60 exists as a waxy solid. It is soluble in warm
water gently heated using a water bath or a magnetic stimng heating plate. Triton X- 100 is
viscous liquid and is water soluble.
Table 4-4 Surfactants used in the experiments
Structure Class
Aikylp henyl- ethoxylates
Ethoxylated sorbitan ester
4.2 Bacterial Cultures
4.2.1 Isolation of colonies €rom contaminated soil
One gram of contaminated soil was placed in a test tube and serially diluted using
a 9 ml physiological saline solutions (0.85% NaCl). Then 0.2 ml of the 10-*, IO-'. 104 and
10'' dilutions were spreaded on plates that were previously prepared from trypticase soya
agar (T'SA). The plates were put in an incubator at 25°C under aerobic conditions for 48
51
Page 65
houn. Specific colonies were isolated and subcultured ont0 TSA plates and incubated for
another 48 hours. Plates were then put in a refngerator at CC for further study and
identification. Four types of colonies were obtained from contarninated soil. Test tubes and
spatulas were sterilized and al1 manipulations were carried out in a biological containment
cabinet to rninimize the possibiiity of introducing contaminants.
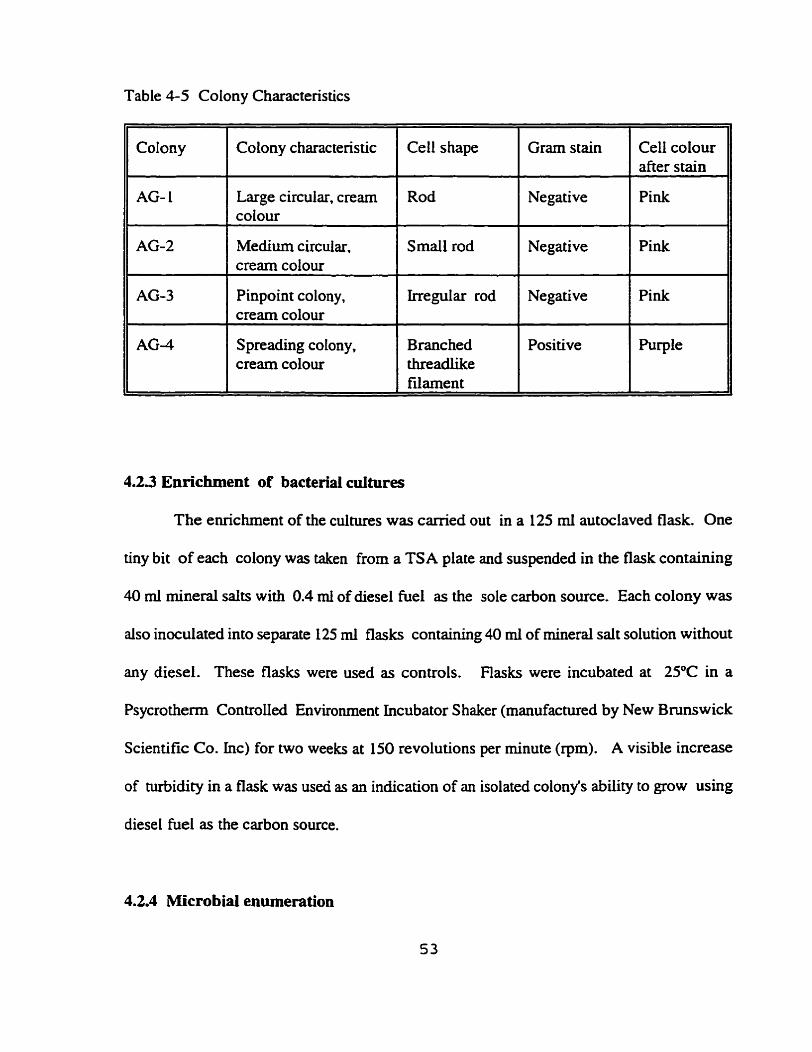
43.2 Idenüfication of colonies by Gram Stain technique
Bacterial celis are diffcuit to observe because they are nearly transparent. However,
most bacteria can be stained by dyes to increase the contrast between the cells and the
background. The Gram Stain technique consists of five steps.
(1) one srnear of each colony was prepared on a glas slide;
(2) smear was stained with crystal violet solution for one minute. then washed off with
Gram's iodine;
(3) Gram's iodine solution was left on the smear for one minute, then washed with water and
drained;
(4) smear was decolorized with aicohol(95%) until fiee colour (approxirnately 30 seconds),
and slide was washed with water and drained;
(5) smear was flooded with sananllie for 30 seconds, then washed and bloated dry by placing
the slide between two clean pages of paper. The shapes of the cells were then observed
through a microscope. The characteristics of colonies were detected and are listed in Table
4- 5.
Page 66
Table 4-5 Coiony Characteristics
Colony
AG- 1
Colony charactenstic
Large circular, cream colour
Medium circular, cream colour
Pinpoint colony, crearn colour
S preading colony, crearn colour
Cefl shape
Rod
--
Small rod
Irregular rod
Branc hed threadlike filament
Negative
Gram stain
Negative
Cell colour afier stain
1 Pink
Negative
Positive
4.2.3 Enrichment of bacterial cultures
The enrichment of the cultures was carried out in a 125 ml autoclaved flask. One
tiny bit of each colony was taken from a TSA plate and suspended in the flask containing
40 ml mineral sdts with 0.4 ml of diesel fuel as the sole carbon source. Each colony was
also inoculated into separate 125 ml flasks containing 40 mi of mineral salt solution without
any diesel. These flasks were used as controls. Flasks were incubated at 25°C in a
Psycrotherm Controlled Environment Incubator Shaker (manufactured by New Brunswick
Scientific Co. Inc) for two weeks at 150 revolutions per minute (rpm). A visible increase
of turbidity in a flask was used as an indication of an isolated colony's ability to grow ushg
diesel fuel as the carbon source.
4.2.4 Microbiai enurneration
Page 67
The enurneration of microbial populations was performed by the plate counting
technique. One of the comrnon methods is the spread plate method which is a simple and
rapid way to count viable microbiai cells in soil (Carter, 1993, and Moskovits et al., 1995).
This procedure can be conducted by preparing a seriai dilution (e-g.. 1 : 10 - 1 : 10'0 of a soil
sample, spreading an aliquot of dilution on the surface of TSA plate, and incubating the TSA
plate under appropriate conditions. The detailed procedure used in this study is as follows.
First, 99 ml of physiological saline solution and lg of contaminated soil were placed in a 250
mi sterilized flask to make a 1 : 100 dilution. Then 1 ml of suspension was transferred to a 15
ml steriiized test tube with 9 mi physiological saline inside to make a dilution 1: 1@. The
same procedure was repeated until the requkd dilution was reached. The prepared dilutions
were spreaded on TSA plates and incubated under aerobic conditions at 2S°C for 48 hours.
An average nurnber of colonies. corresponding to dilutions giving between 30 and 300 per
plate, was computed by the following equation. It is expressed as number of colony fonn
unit (cfu).
Average number of colonies X dilution factor No of c f u / g of soil=
I n i t i a l weight of soil ( 4 - 1 )
4.2.5 Potential for Bioremediation
The potential for bioremediation cm be assessed in two ways. The principle
developed in this study is to test weather or not an isolated colony can grow when diesel fuel
is used as the sole carbon source. If bacteria can grow under this condition, it means that
Page 68
the colonies can use the diesel fuel for their metabolism and biodegradation is likely to
happen.
in a fmt experiment. the growth potential of each colony was determined in a flask
by providing nuuients and diesel fuel. No additional carbon source was added to the flask
which was placed in an incubator shaker using the procedures mentioned as above.
A second test was conducted by using a plate which was only made of minerd
salts and agar. Each colony was spreaded on the surface of the plate. Diesel vapours were
used to provide the only carbon source in the expenment. A bandage was cut into smail
piece and sterilized by autoclaving. Diesel fuel was pipped on the surface of a piece of
bandage and put in the lid of the plate. Piate was placed upside down, so chat the bacteria
could obtain carbon fiom the diesel fuel vapour. Plates were put in an incubator at 25°C
until visible growth was observed.
4 3 Anaiysis of Total Petroleum Hydrocarbons
4.3.1 Extraction of petroleum hydrocarbons
Diesel contaminated soi1 was extracted by soxhlet extraction using Soxtec HT2.
Tecator Co.. Sewden. The extraction principles are the same as mentioned in Chapter 3
section 3.2.2, but the operation rnethod is sightly different. Five grams of soils were placed
into a thimble. The same amount of anhydrous sodium sulfate was used as a drying agent.
LOO ml of methylene dichloride and two boiling stones were placed into the extraction cup.
The temperature was adjusted so as to give a condensing drop rate of 3-5 drops per second
according to the method suggested by Tecator Co. (Tecator Co. manual, 1996). Following
Page 69
one hou extraction, the soi1 was rinsed for another half hour, and the extract w u purged
by air until less lm1 of residual methylene dichloride was left. The extract was transferred
to a 2 ml via1 for subsequent GC analysis.
4.3.2 Anaiytical Methods
4.3.2.1 instrumental parameten
A Gas Chromatography/'Flame Ionization Detector (Hewleit-Packard, mode1 6890) was used
to detect and quanti@ the total petroleum hydrocarbons in soi1 and aqueous effluent by EPA
method 8015 (Test Methods for Evaiuating soi1 waste, SW-864, 1982). The capiilary
colurnn (30m x 320pm x 0.25pm) was packed with 5% Phenyl Methyl Siloxane. The oven
temperature was set at 60°C for 2 minutes, programrned at 1û'CJmin to 3WC and then
held for 5 minutes.
4-3.2.2 Calibration standards
Prior to beginning the anaiysis of the sampIe extracts, quantitative conversion of GC
area counts data to concentration of petroleum hydrocarbons (&rd or ppm) was performed
by preparing a senes of standard solutions. These standards are prepared by weighing the
required amount of diesel hiel and diluting by volume of the hexane. A calibration curve
for analysis of diesel fuel was prepared according to the results shown in Table 4-6 and
plotted in F i p 4-2
Page 70
Table 4-6 Diesel Fuel Concentration and Corresponding Peak Area Value
Based on the above data, a correlation between the peak area values and the
corresponding concentrations was established:
concentration (&ni) = 4.3822 (&ml) x peak area value + 75.485(&nl) (4-2)
This formula was used for diesel contaminated samples to convert the peak area values
into concentrations-
Diesel concentration (pg/ml)
4200
Peak Area Values (graph units)
95 1.8
Page 71
O 200 400 600 800 1000
Peak Area Values
Figure 4-2 GC Caiibration Cuve
4.3.2.3 Calculation of TPH concentration in soil
The concentration of diesel fuel TPH kg/g or ppm) in a soil sample was calcuiated
as follow:
Where C= concentration in TPH for the prepared standard read from the calibration curve,
Figure 4-2; W=weight of dry soil ; V=volume of hexane (solvent).
Page 72
4.4 Bioremediation Tests on Soi1 Contaminated with Petroleum Hydrocarbons
In this section, the preparation of soil and chernicals in a close system reactor is
presented and bactena injection procedures are discussed.
.R
4.4.1 Set up of the close system reactors and test procedures
Closed system reactoa were built in 500 ml total volume glas jars with septa caps.
The contaminated suil was weighed and transferred to the sterilized glas jars. Nutrient
solutions. colony solution and surfactants were then rnixed and introduced in the jars
according to a welI defined testing program.
Bioremediation tests were designed to investigate the effects of temperature of
incubation. pH value, nutrients, surfactants, and amount of microorganisms on the rate of
diesel fuel degradation. Temperatures of incubation were set at 5. 15 and 25OC. and pH
values were changed within a range from 6 to 8. The pH of the contaminated soi1 as
provided was from 6.8 to 7.0. Hydrochloric acid was used to adjust the pH value to 6, and
sodium hydroxide was used to increase the pH to 8.
The influence of nutrients was assessed by using distiiied water instead of the nutrient
solution. The 20 ml mixed colony solution was centrifuged to get a pellet, resuspended in
20 ml distilled water and poured into the glass jar.
The importance of the amount of microorganisms was studied by comparing
biodegradation using bactena injection and biodegradation without bacteria injection.
Enriched colony solution was seeded into the glas jar to increase the population of bactena
5 9
Page 73
in order to enhance the rate of bioremediation.
The composition of each glass jar is given in Table 4-7. Glass jars were put in
incubators at different temperatures Soi1 was mixed every week in order to supply oxygen
to microorganisms. Samples were taken at scheduled times to analyze the concentration of
TPH and to count bactena
4.4.2 Bacteria seeding
As indicated above for some tests, e ~ c h e d colony was injected into the
conespondhg glass jar to increase the population of the bacteria Each isolated colony was
grown in a flask for two weeks as mentioned in section 4.2.3. The cells were collected by
centrifuging at 12,000 rpm for 10 minutes. The peliets were resuspended in a flask with
fresh nutrient solution and diesel fuel for another week, and the centrifugation procedure
was repeated. The peliets of four kinds of enriched colonies were resuspended together in
a 1000 mi flask with a fresh nutrient solution and diesel fuel for three days to form a solution
of mixed colonies. This mked colony solution was later used as a seed in g las jars so
designated .
Page 74
Table 4-7 Composition of Soi1 Added into Glass Jar
Glass Jar
BI-pH6-T25
Content
3 0 g contarninated wet soil, 20ml MS solution with enriched culhires. pH=6
3ûûg contaminated wet soil, 201x11 MS solution with e ~ c h e d cultures. D H = ~
300g contaminated wet soil, 20ml MS solution with e ~ c h e d cultures. D H = ~
300g contaminated wet soil, 20ml MS solution with e ~ c h e d cultures. pH=7
3 0 g contaminated wet soil. 20ml MS solution with e ~ c h e d cultures. pH=7
300g contaminated wet soil, 201x11 MS solution with e ~ c h e d cultures. D H = ~
NBI-pH7-T25- Control
3ûûg contaminated soil, 20mi MS solution with enriched cultures, 1.5g Triton X- 100 (OS%w/w), pH=7
300g contaminated wet soil. 20ml MS solution with e ~ c h e d culhues, pH=7, 0.6~ Tween 60 (0.2%w/w)
300g contaminated soil, 20mi MS solution, pH=7, No culture injection
300g contaminated soil. 20ml distilled water with e ~ c h e d cultures, pH=7
3ûûg autoclaved soil, 1.5g diesel, 36ml distilled water. D H = ~
Incubation T"
Note: MS stands for Mineral Salt.
Page 75
4-43 Reparation of the control jar
Autoclaved soi1 was used to prepare a control reactor. Soi1 was put into a capped
glas jar. The glass jar was left in the autoclave for haif an hour at 12 1°C and 15 pounds
of pressure per square inch (1056 @cm2). M e r that, the glas jar was left in the laboratory
overnight. The same autoclave procedure was repeated the next day. Sterilized soil was
rnixed with diesel fuel to make a contaminated soil with a concentration of 5000 mg of
diesel per kg of soil.
4 J Surfactant Treatment of Soil Contaminated with Petroleum Hydrocarbons
Surfactants were utilued to remediate petroleurn hydrocarbon poiiuted soils. These
experiments were conducted in fixed wail permeameters and consisted of washing the
contaminated soil containeci in the column. The contaminant removai was analyzed in time.
Procedures are presented hereafter.
4.5.1 Soil preparation
Soil was air dried at rwm temperature and screened on a Sieve #8 U.S . (2.36 mm).
Diesel fuel was spread on the soil to prepare a contaminated soil with a concentration of
7000 mg diesel per kg of soil pnor to column experiment. The mixing was carried out long
enough to ensure that the contaminant distribution was homogeneous.
Page 76
45.2. Reparation of the surfactant solution
Surfactant solutions of Triton X-100 and Tween 60 were used in these tests. They
were prepared by dissolving the surfactants using distilled water in a magnetic stimng
heating plate. The concentrations are reported as percent weight of surfactant in water.
Surfactant solutions were used as an influent through the column to wash diesel hiel out of
contaminated soil .
45.3 Experiraentai column set-up
As mentioned above, column tests were conducted in a pennemeter consishg of
a acrylic cylinder clamped between aaylic end plates. One porous disk with a Nter paper
was inserted at each end of the specimen, and two O-rings were used to seal the cyhder
with the end plates. Polyethylene tubings were used for inflow and oudlow. The cylinder
was 5.08 cm (2.0 in.) in diameter and 10.16 cm (4.0 in.) in length.
The contaminated soil was compacted to a dry density of 1.88 to 1.99 g/cm3 as shown
in Table 4-8. Distilled water. 0.5% (w/w) Tween 60 solutions and 0.5% (w/w) Triton X-100
solutions were used as influents. Soils were initidy sanirated with water ovemight before
staaing the washing test. The effluents were collected at different time intervals
corresponding to increasing amount of percoiating pore volumes.
Page 77
Table 4-8 Information on compacted soil and influent
S ample 1 Dry Denrity (g/cm3) 1 Voici Ratio 1 Influent
Triton-û.5 1 1.96 1 0.21 1 0.546 Surfactant Triton
1. D.
D-water
Tween-0.5
4.5.4 Extraction and analysis of contaminant
The diesel fuel content of the effluent was determined using a liquid-liquid
extraction procedure based on Standard Separatory Fumel Method 3501 (Test Methods for
Evaluating soi1 waste, SW-864, 1982). The column effluent was collected in a glass jar. A
1 0 ml specimen was transferred to a cyiinder and poured into a 250 ml separatory -el.
20 ml hexane was used to wash the cylinder and was then transferred to the separatory funnel
too. The separatory funnel was then capped and shaken for 5 minutes to partition the
contaminants to the solvent phase. After a 2 minutes settling p e n d liquid in the funne1 was
separated into two phases: solvent phase and water phase. Water was draineci out and a 10
ml portion of the solvent solution was transferred to a clean 20 ml glas via1 for GC
analysis.
as compacted
1-99
1.88
0.20
0.25
Distilled water
0.5% Surfactant
Tween-60
Page 78
4 5 5 Determination of hydrauiic conductivity
Anaiysis of water £iow in sanirated soil are usuaiiy denved from Darcy's Iaw which
is based on the expimental observation of a linear relationship between the rate of flow and
the hydraulic gradient. After the soil has been compacted and saturated with water, the head
of water or surfactant solution was adjusted to give the desired hydraulic gradient. The
percoiation rates of water or aqueous surfactant solutions were determined during the testhg
period. The effluent was coilected in a glass jar . Both effluent volumes and periods were
recordeci. The hydrauiic conductivity in term of k (cm/s) was calculated by the foilowing
equation:
where Vi (cm3) = the effluent volume collected during the time interval Ati;
L = Iength of the sample (cm);
A = cross-sectional axa of the specimen (cm2);
A4 = individual tirne interval (s);
4 (cm) = average water head difference between inflow and outflow d h g
Ati .
Page 79
Chapter 5
Results and Discussion
5.1 Biodegradation of Contaminated Soil in Closed System Reactors
5.1.1 Effect of temperature
The effect of temperature on the rate of biodegradation of petroieurn hydrocarbons
was evduated in glass jars incubated at 5. 15.25 O C for a period of 140 days (Section 4.4.1)
. The incubation ternperahues were selected based on the range of Newfoundland seasonal
ternperatures. Petroleurn hydrocarbon degradation in the reacton was monitored by
measuring the TPH concentration in the soil. The reduction of T'PH concentration in closed
system reacton venus t h e for each incubation temperature is plotted in Figure 5- 1. The
maximum rate of the degradation occurred at 25 O C . The concentration of T'PH decreased
fiom 6044 mgkg of dry soi1 to 3004 mgkg of dry soil. The hydrocarbons degraded to 50%
of the initial value. Medium degradation rate happened at 15OC. The lowest degradation rate
was obtained at SOC, and oniy 17% of the hydrocarbons was reduced after 20 weeks of
bioremediation treatment.
As the results show, temperature have a marked effect on the rate of the petroleurn
hydrocarbon degradation. At low temperatures, the biodegradation of TPH is limited or
reduced. It is suggested to carry out remediation of TPH in the range of 15 to 25°C.
Therefore, in situ remediation wili not be efficient in the Newfoundland winter season due
to cold weather.
Page 80
Incubation T h e (days)
Figure 5- 1 Effect of Temperature on Biodegradation of TPH
(pH at 7, with nutrïents and bacteria injection)
5.1.2 Effect of pH
Results showing the effect of pH on the rate of degradation of hydrocarbons are
presented in Figure 5-2. The pH values were selected as 6.0, 7.0, and 8.0 (Section 4.4.1).
When the degradation was carried out at pH 6.0, the TPH were degraded to 38.4% of their
original value during the 140 days pend. At pH 7.0, the maximum hydrocarbon reduction
was achieved with 50.38 of the initial TPH. At pH 8.0 the rate of the degradation was found
67
Page 81
to be the towest and the hydrocarbons were only 30.6% degraded.
Effective biodegradation process happened in a slight acid or neutrai condition
according to the experimentai results. It looked Iike cultures had more active ability in the
slight acid and neutral conditions than under aikali conditions. The native soil had a pH
value of 6.2 in natural condition (Table 4-1). CuItures which were isolated from this
contaminated soil have iived in a slightly acid condition for a long time and have adapted
to this environment. Therefore when biodegradation tests were conducted under an acid or
neutral conditions. signifcant hydrocarbon removal was observed. When biodegradation is
carried out under alkali conditions. there is a gap between the native soil living conditions
and the alkali environment, which prevents optimal growth of bactena
Page 82
TPH Concentration (mgkg of dry soil)
Page 83
O 20 40 60 80 100 120 1 40 160
incubation Tirne (days)
Figure 5-3 Effect of Surfactant on the Biodegradation of TPH
(Temperature at 25OC. pH at 7. with nutrients and bacteria injection)
The resdts are presented in Figure 5-3. The reactor containing Triton X- 100 indicated
a final reduction of TPH (After 20 weeks) of 53.4%, close to the non surfactant reduction.
However the rate of degradation was found to be higher in the initial 10 weeks. It may be
explained by the fact that surfactant is a kuid of carbon source. With time going, it can be
consumed by bacteria If surfactant was added in the reactor after a certain tirne such as afier
10 weeks. better degradation may be achieved.
In terms of percentage of the initial TPH. a 3% increase in efficiency was obtained
by the addition of 0.5% of surfactant X-100 compared to non surfactant process. It is
therefore found that surfactant X-10 may be useful in biotreatment of the petroleum
70
Page 84
contaminated soil.
Unlike the effect of surfactant Triton X-100, an addition of 0.2% (w/w) surfactant
Tween 60 did not enhance of the degradation rate of the TPH. It even appeared to have a
negative effect on the rate of the TPH biodegradation when compared to treatment without
surfactant addition. Only 35.5% of TPH removal was obtauied in the biodegradation process.
This result may imply that the surfactant Tween 60 inhibited the microbiai activity thus
decreasing the rate of biodegradation.
5.1.4 E f f ~ t of additional bacteria injection
5.1.4.1 Bactena counting
Microorganism activity was monitored by bacteria counting. The populations of
bacteria in the control autoclave soil, non bacteria injected soil, and bacteria injected soil
were counted at day zero of the biodegradation process, and subsequently counted at 45,
100. and 140 days to evaluate the changes in bactena population. The colony forrn unit per
gram of soil were enumerated from appropriate dilutions of the above mentioned three soil
samples after 48 additional hours of incubation at 25°C on TSA plates and calculated by the
equation 4- 1. The resuits are listed in Table 5- 1.
Page 85
Table 5- 1 Bacterial Plate Counting (colony-forming unitdg soil)
When bacteria counting was carried out on zero day, no bacterial activity was found
in the autoclave control sample during the 48 hour initial incubation time. however bacteria
were detected after 72 hours. Nevertheless, the colony that was observed was different from
the colonies isolated in *the contaminated soil. The soi1 may have been contaminated during
operation, but due to its much lesser population. it still can be used as a control sarnple. As
shown in Table 5-1, the population of the control soil reached 75x104 at day 140. The
populations of the non bacteria injected soil increased to 2 l x lo7. and the bactena seeded soil
increased by a factor 104 to reache 2% 109 during the 20 weeks biodegradation period. These
results also demonstrate that the rnicroorganisrns present in the soil with the TPH
concentration up to 6000 mgkg are capable of both surviving and increasing their ni?mben
in the presence of the diesel fuel.
Sample incubation
time
day O
day 45
day 100
dav 140
Control soi1
(cfidg soii)
50x 10 ' 24x 103
43x104
75x 104
Non-Bacteria
injected soi1 (Mi)
(cfu/g soil)
2Sx 10s
39x105
33x106
Bacteria injected
soi1 (BI)
(cgdg soil)
42x16
13x 107
40x 10'
21x10~ 29x 109
Page 86
S. 1-42 T'PH reduction due to microbial activitv
To evaluate the effect of the number of rnicroorganisms on the degradation of TPH,
the results obtained from non bacteria injected soil was compared to the result obtained form
bacteria injected soil. Bacteria injected soil had a higher efficiency for the degradation of
TPH than non bacteria injected soil. The results were presented in Figure 5-4. The TPH
removal percentage after 20 weeks using bacteria seed is about 15% higher than the non
seeded soil.
O 20 40 60 80 100 120 140 160
hcu bation Time (days)
Figure 5-4 Effect of Bacteria Injection on the Biodegradation of TPH
(Temperature at 25OC, pH at 7, with nutrïents injection)
Page 87
5.1.5 Effect of Nutrients
Microorganisms need nutrients to grow. Hence, biodegradation of hydrocarbons in
the naturai environment is limited by poor growth rate of rnicrwrganisms caused by nutrient
deficiencies, especiaily in nitrogen and phosphorus. (Leahy and Colweil, 1990). Thus, when
bioremediation is conducted. these nutrients are usually applied to the contaminated
environment to simulate biodegradation (Prince, 1993). In this study, results of
bioremediation with nutrients or without nutrients were compared as shown in Figure 5-5.
The addition of nutrients is clearly effective in increasing the rate of biodegradation of the
TPH.
O 20 40 60 80 100 120 140 160
Incubation Time (days)
Figure 5-5 Effect of Nutrients on the Biodegradation of TPH
(Temperature at 25OC, pH at 7. with bacteria injection)
Page 88
5.1.6 Summary of the Iaboratory bidegradation experiments
The growth potential of the bacteria in the diesel contaminated soil was determined
by providing nutrients, and observing the ability of the microorganisms to grow with time
using the fuel present in the soil. The samples were incubated under aerobic conditions with
various ternperatures, pH values and addition of surfactants. Later analysis of the soil
indicated that part of the T'PH was in fact consumed as carbon and energy sources for
microorganisms. A surnmary of TPH removais is given in Figure 5-6. The efficiency of the
biodegradation which was obtained at the temperature 2S°C and pH 7 is 25% higher than
the correspondhg control sample. The GC profiles before and after incubation are given in
Figure 5-7 and 5-8. An addition of 0.5% surfactant Triton X- 100 solution, mineral salts and
bacteria seeding assisted in degradating the petroleum hydrocarbon contaminated soils.
Page 89
pH6 pH7 PH8 T25 Tt5 TS Tri 0.5 TwnO2 NB1 NN Cod
Bioremediation Conditions (see note below)
Figure 5-6 TPH Removal in Different Conditions of Bioremediation
Note: pH 6,7, and 8: samples incubated at pH 6.7, and 8 and temperature at 2PC with
nutrients and bacteria injection
T 25, 15, and 5 : samples incubated at temperatures at 25, 15, and 5 O C and pH at 7
with nutrïents and bactena injection
Tri 0.5 : sample with 0.5% surfactant Triton X- 100 solution at 2S°C. pH at 7 with
nutrients and bactena injected
Twn 0.2 : sample with 0.2% surfactant Tween 60 solution at 25OC and pH at 7 with
nutrients and bacteria injected.
NBI: no bacteria injection incubated at 25°C. pH at 7 and nutrient injected
NN: no nutrient injection incubated at 25°C. pH at 7 and bactena injected
Cod: control sample incubated at 25*C, pH at 7, no bacteria and nutrients injected
Page 90
s Before incubation
1 - - - - 1 - I I I
5 10 15 20 25 miq
b. After incubation
Units for GC profile are equipment specific and are not indicated in this figure
Figure 5-7 GC Profiles of Control Soi1 Before and Mer incubation
Page 91
I - - . - l - - - - l - - ' - l - 1
s 10 1 S 20 25 m*,
b. After incubation
Units for GC profile are equipment specific and are not indicated in this figure
Figure 5-8 GC Profiles of Treated Soi1 Before and After Incubation
Page 92
5.2 Effect of Surfactants on Removal of TPH in Column Tests
5.2.1 Surfactant as an agent for removal of diesel fuel
5.2. i . I Solubilization
One general mechanism by which surfactants can enhance the removai of
contaminants is solubilization. Many of petroleum hydrocarbons, descnbed as hydrophobic
organic compounds, are relatively insoluble in water. Petroleum hydrocarbons rnay be
adsorbed onto the soil or present in the subsuface aquifer as a discrete organic phase mixture
of none aqueous phase liquid (NAPLs).
Surfactants can enhance the solubility of a hydrophobic compound in water due to
the hydrophobic pseudophase of a micelle. Micelles are formed at the critical micelle
concentration which is the aqueous surfactant concentration at which surfactant monomers
f o m coiloidal aggregates. Surfactant chernistry, temperature, ionic strength and the presence
and type of organic additives determine the CMC. At the CMC, abrupt changes in solution
properties such as surface tension occur (Canadia and Hawell, 1992).
Surfactants may partition between or adsorb to the interfaces of an oil-water-soils
system. When surfactant is added to the aqueous phase, the polar head group interacts
strongly with the water phase. The nonpolar hydrocarbon chah portion interacts very weakly
with water molecules but partitions into hydrophobic organic compounds or petroleum
hydrocarbons. The hydrophobic organic contaminants are thus desorbed fiom the soil and
solubilized, allowing the implementation of remediation. Surfactant addition enhances the
solubiiity of these contaminants in the aqueous phase. Such solubilized hydrocarbons
more available for conventional pump and treat strategies or bioremediation (Peter et
Page 93
1992).
5.2.1.2 Mobilization
Mobilization of the contaminant by a surfactant is another way to remediate
contaminated soil. It depends on the surface tension reduction. This has k e n used as one
of a critena for judging the effectiveness of a surfactant in-situ washing. Low surface
tension increases wetting of the soil and provides for better contact between surfactant and
contaminant. (Texas Research Institute, 1982b).
5.2.2 Experimental resuits
Removd of TPH trom the soii was conducted in columns (see Section 4.5). Three
columns were set up, and distilled water, 0.5 9% (wlw) of surfactant solution of Triton X-100
and 0.5% (wlw) surfactant solution of Tween 6û were used as influent to wash the
contaminated soil through a column individually. The removal of TPH (diesel) was
calculated using the foiiowing equation:
Where: W=Amount of removed diesel
C= Concentration of the diesel (obtained from the calibration curve, Figure 4-2)
V,=Volume injected in the GC
V,p Volume of solvent (Hexane)
Page 94
V&/olume of effluent
Amount of removed diesel (mg) Removal of diesel (%)= Original amount of diesel (mg)
In column 1, the distiiied water washing resulted in the 5.3% of removal of TPH
after using 130 pore volumes of influent. Figurc 5-9 shows that Petroleum Hydrocarbons are
removed very slowly with increasing percolation. In column 2, 155 pore volumes washing
by the 0.5% aqueous solution of Tween 60 yielded a total 2 1.7% removal of TPH from soi1
as shown in Figure 5-10. In column 3, a total of 67.841, diesel removal from soi1 was
obtained when washed by 170 pore volume of the 0.5% surfactant solution Triton X-100.
Figure 5- 1 1 indicates that removal was slow in the early 40 pore volumes. The removal
efficiency increased between 50 and 1 10 pore volumes, then stabilized.
Page 95
N o m k of Pore Valunœs
Figure 5-9 Removal of Diesel by Distilled Water
Figure 5- 10 Removal of Diesel by 0.5% Surfactant Tween 60
Figure 5-i 1 Removal of Diesel by 0.5% Surfactant Triton X- 100
Page 96
5.2.3 Discussion of results
An improvement in the mobility of petroleum hydrocarbons in a soil matrix has been
demonstrated using surfactant aqueous solution. Lab-scale experiments using soil columns
are helpful to characterize the process of diesel mobilization by surfactant solutions. The
results of three column experiments using distilled water and dinerent surfactants lead to the
following comments. Distilled water did not mobilize trapped diesel fuel in the soil matrix
because most petroleum hydrocarbons like diesel are hydrophobic compounds, and the
aqueous solubiiîty of the diesel only is 0.2 mg. The 0.56 of Tween 60 solution moderately
mobilized the diesel fuel. and its overall perfonpance was better than that of the water
washing. This is due to solubility enhancement of the diesel fuel. The 0.58 of surfactant
Triton X-100 solution at concentration of up to 37 times its critical micelle concentration
(CMC) resuited in a high diesel removal efficiency.
5.2.4 Hydraulic conductivity
Hydraulic conductivities were calculated by the equation 4-4 and the results are shown in
Table 5-2.
Table 5-2 Hydraulic Conductivities Obtained in Column Tests
Column characteristics
Triton X- 100 solution washing
Distilled water washing
Tween 60 solution washing
Hydraulic conduc tivity Dry Density (g/cm3)
1.95 X IO-'
2-06 X IO-'
1.99
1.88
Page 97
Chapter 6
Conclusions
6.1 Summary and Conclusioas
A study has k e n camied out in the Argentia site (Newfoundland) to identiQ typical
soil conditions involving contaminant treatrnent and simulating conditions in a controiled
testing facility. The potential for bioremediation using local soil and indigenous bacteria
for the degradation of petroieum hydrocarbons (diesel fuel) has been evaluated. The
incubation conditions used for this treatability study in closed system reactors included
temperature, pH value, surfactant and nutrient addition, and bactena seeding. Diesel fuel
leaching by surfactants has also been conducted in column tests. Based on the results
obtained from these experiments, the following conclusions can be drawn.
1. Degradation of total petroleum hydrocarbon using indigenous microorganisrns
is possible.
2. Petroleum removal effxiencies in tems of T'PH removal can reach 50% over a
penod of 140 days in a closed system reactor within the range of experimental
conditions inves tigated in this study .
3. TPH removal decreases with decreasing temperature in the closed system reacton.
A maximal degradation rate was achieved at temperature 2S°C.
4. Optimal rate of degradation of TPH is obtained at a neutral or slightly acid pH
condition.
Page 98
5. Addition of surfactant Triton X-LOO may be usehl to degradate the TPH. QLdEQt
Tween 60 does not enhance the biodegradaûon of the TFW.
6. Microbiological growth with diesel fuel as sole carbon source was clearly observed
by bactena counting results.
7. Nutrient requirements have been demonstrated by the results of enhancement of
TPH bioremoval.
8. Surfactants are useful in increasing the solubility of petroleum hydrocarbons in
pore water, thus increasing the potential for biorernediation.
6.2 Recomendations
1. The laboratory experimental work should be confmed by additional testing such
as duplication, f i e r range of parameter variation, etc.
2. Bactena growth in-situ should be studied to validate the laboratory findings.
3 The influence of the type of electron acceptor (oxygen , hydrogen peroxide, etc.)
should be evaluated,
Page 99
References
Albaiges, I. and Frei, R.W. (1986). Fate of Hydrocarbons In The Environment: An
Analytical Approach. Gordon and Breach Science Publishen. New York.
Alexander, M. (1985). Biodegradation of chernicals. Environ. Sci. Technol. 18: 106- 1 1 1.
Amencan Petroleum hstitute (1991). Sarnpling and analysis of gasoline range organics in
soils. American Petroleum hstitute Publication. No.45 16.
Argentia Remediation Group: Jacques Whitford Enviromnt Limited Newfoundland
Geosciences Limited, Porter Dillon Limited, Sheppard Green Engineering & Associates
Limited (1995). Environmental site assessrnent U.S. naval Facility, Argentia, NF. Report to
Public Works and Government Services Canada Atlantic Region. pp. 1-7.
ASTM. (1996a). Standard test method for particle size analysis of soiis (D422-63). In 1996
Annual book of ASTM stondardî. Sec. 8, Vol. 4, ASTM, Philadelphia, pp. 10-20.
ASTM. (1996b). Test method for laboratory compaction characteristics of soi1 using standard
effort (D689-91). In 1996 Annual book of ASTM standards. Sec. 8, Vol. 4, ASTM,
Philadelphia, pp.75-82.
Ati Orion. (1996). Dissolved Oxygen Meter Instrutional Manual. Mode1 No. 835. Gemiany.
Baker, K.H. and Herson, D.S. (1994a). introduction and overview of bioremediation.
Bioremediation. Ed by Baker, K.H. and Heaon, D.S. McGraw-Ha, Inc. New York. p. 1-7.
Baker. KH.and Henon, D.S. (1994b). Microbiology and Biodegradation. Bioremediation.
Ed by Baker, K.H. and Herson, D.S. McGraw-Hill, Inc. New York. pp.9-60.
Page 100
Baker, ICH. ( 1994). Biodegradation of surface and subsurface soils. Bioremediation. Ed by
Baker. K.H. and Herson, D.S. McGraw-Hill. Inc. New York. pp.203-259.
Berg, G.. Deech A.G., Lee, H., and Trevors, J.T. (1990). Identification and characterization
of a soil bacterium with extracelluar emulsifjhg activity. J. Environ. Sci Health A 25: 753-
764.
Bonneau. M. and Souchier, B. (1982). Constituents and Properties of SoiLF. Academic Press.
London.
Britto, R., Shenard, J.H., and Truax, D. (1994). Kinetics of pseudo-continuous flow
bioreactor treatment of diesel contaminated soils. Water, Air and Soi1 Pollution. 86: 125-
136.
Brock, T.D. ( 1979). Biology of Microorganism. Prentice-Hall International, Inc. London.
Brown,R.A.. Noms, RD., and Raymond, R.L. (1984). Oxygen transport in contaminated
aqui fea. Proceedings of Petroleum Hydrocarbons and Organic Chemicak in Groundwatec
Prevention, detection and restoratiom Nov. 5-7, Houston Worthuigton Ohio: National Well
Water Association.
Bury, S.J. and Miller, C.A. (1993). Effect of miceliar solubilization on biodegradation rates
of hydrocarbons. Environmental Science and Technology. 27: 104- 1 10.
Canter, L.W. and Knox, R.C. (1985). Ground Water Pollution Control. Lewis Publishers.
Chelsea, MI. U.S.
Cassidy D. P. and h ine R. L (1997). Biologicai treatment of a soil contaminated with diesel
fuel using periodically operated slurry and solid phase reactors. Water Science and
Page 101
Technology. 35: 185- 192.
Champion, J.T., Gilkey, J.C., Lamparske, H., Retterer, J-, and Miller, R.M. (1995). Electron
Microscopy of Rhamnolipid (Biosurfactant) Morphology: Effects of pH, Cadimim, and
Octadeane. Journal of Colloid and lnte@ace Science. 1 70: 569-574.
Cole, G.M. (1994). Assessrnent and Remediation of Petrolewn Contaminated Sites. Lewis
Publishers. London-
C-CORE. (1997). Progress report of bioremediation test at the environmentai test facility
Argentia . Newfoundland.
Cretney. W.I., Wong, C.S., Green, D.R., and Bawden. C.A. (1978). Long-term fate of a
haevy fuel oil in a spill-contaminated coastai bay. J.Fish. Res. Board Can. 35: 521-527.
Custance, S. and Ruth, M.P. ( 1992). Environmental fate of the chemical mixtures: cmde oil,
JP-5, mineral spirits, and diesel fuel. Journal of Soil Contamination. 1 (4): 379-386.
Dibble, I.T. and Bartha, R (1979). Leaching aspects of oii siudge biodegradation in soil.
Soil Science. 127: 365-370.
Dibble, J.T. and Bartha, R. (1979). Rehabilitation of oil-inundated agriculhual land: a case
history. Soil Science. 128: 5660.
Dineen. D., Slater, J.P., Jicks, P. and Holland, 1. (1990). In situ biological remediation of
petroleum hydrocarbons in uwaturated soils. Hydrucarbon Contaminuted SoiLr and Ground
Water : Analysis, Fate, Environmental and Public Health Effects, Remediation. Ed by
Kostecki, P.T. and Calabrese, E. J. Vol. 1. Lewis Publishers, Chelsea, Mich., pp. 177- 187.
Page 102
Ducreux, J., Ballerini, D. and Bocard C. (1994). The Role of Surfactant in Enhanced in
Situ Bioremediation . Hydrocarbon Bioremediation. pp.237-242
Eaton, A. D., Clesceri, L. S., and Greengerg, A E. (1995). Standard Methods for
Examination of Water and Wastewater. pp.5- 15.
Edwards, D.A., Luthy, R.G., and Liu, 2. (1991). Solubilization of polycyclic arornatic
hydmcarbons in micekir nonionic surfactant solutions. Environ. Sci Technol. 25( 1): 127-
133.
ElLis W.D., Rayne, J and McNabb, G.D. (1986). Project summary. Treatment of
contaminated soil with aqueous surfactants. EPA/600/5 2-86- 129.
Fiathman, P.E., Carson, J.H., and Whitehead, SJ. (1991). Laboratory evaluating of the
utilization of hydrogen peroxide for enhanced biological trcatment of petroleum hydrocarbon
contaminanîs in soil. In Situ Bioreclantation: Application and Investigarions for
Hydrocarbon and Contaminated Site Remediation. Ed. by Hinchee, R.E. and O1 fen bu ttel,
R.F. Butterworth-Heinemann. London. pp. 125- 142.
Roodgate, G.C. (1973). Theory conceming the biodegradation of soil in natural waters.
Microbial Degradation of Oil Pollutunts. Ed. by Ahearn, D.G. and Meyers, S .P. h b l . No.
ISU-SG-73-0 1. Baton Rouge: Louisiana State University, Center for Wetland Resources.
Fry, J.C., Gadd, G.M., Herbert, R.A., Jones, C.W and Watson-Craik, LA. (1 992). Microbial
Control of Pollution. Cambridge University PRss. New York.
Gaudy, A.F.Jr and Gaudy, E.T. (1980). Microbiology for Environmental Scientists and
Engineers. McGraw-Hill Book Company. New York
Page 103
Gibson. D.T. (1984). Microbial Degradation of Organic Cornpo&. Marcel Dekker. hc .
New York.
Gibson. D.T. and Yeh, W. K. (1973). Microbial degradation of aromatic hydrocarbons. The
Microbial Degradation of Oil Pollutants. Ed. by Ahearn, D.G. and Meyers, S .P. Louisiana
State University. Baton Rouge, LA. Publication No. LSU-SG-7341. pp. 33-38.
Gr&, K. and Kriston, E. (1995). In situ bioremediation of hydrocarbon in soil. Journal of
Soil Contamination . 4(2): 163- 173.
Gunkel, W. (1967). Experimentell-~kolo~ische Unteauchmgen Über die limitierenden
Faktoren des rnikrobiellen OLabbaues in Marinen Milieu. Helgol. Wiss- Meeresunters. 15:
2 10-224.
Haines. J.R. and Alexander, M. (1974). Microbial degradation of high-molecular weight
alkanes. Appl. Microbiol. 28: 1084- 1085.
Hausler, A.. Muller-Hurtig, R., and Wagner, F. (1990). Effect of the addition of microbiai
surfactants on hydrocarbon in a soil population in a stirred reactor. Applied Microbiol
Biotechnology. 32: 485-489.
Hinchee, R.E., Anderson, D.B., Mening, F.B., and Syles, G.D. (1994). Applied
Biotechnology for site remediation. Lewis publis hers. London.
Holmes, S.H. and Thompson, L.E. (1982). Nitrogen distributions in hydrotreated shale oil
products fiom commercial-scale refining. Review draft. Laramie, WY: Laramie Energy
Technology Center. p.4.
Hommel, R.K. (1990). Formation and physiological role of biosurfactants produced by
Page 104
hydrocarbon-uulizing microorganisms. Biodegradation. 1 : 107- 1 19.
Huesemam. M.H. ( 1994). Guidelines for land-treating petroleum hydrocarbon-contaminat&
soils. Journal of Soil Contamination. 3(3): 299-3 18.
Ishihara, M., Sugiura. K., Asemia, M.. Gobo. M.. Cysteic, E.. and Harambee, S. (1995). Oii
degradation in Microcosms and mysticisms- Microbial Processes for bioremediation. M.
by Hinchee, R.E., Vogel, CM., and Brochan, FJ. Lewis Publishers. London. pp. 10 1- 1 16.
Jamison. V.W., Raymond, R.L.,and Hudson. Ir. J.O. (1975). Biodegradation of highoctane
gasoiine in groundwater. Developments in Industrial Microbiology. 16: 305-32 1.
JRB and Associates. Inc. (1982). Final Report, EPA Report NO. EPA-6296-82-06.
Environmental Protection Agency . Cincinnati, OH.
JRB and Associates, Inc. (1984). Review of in-place treamtent techniques for contumimted
sugace soil. Vol. 2. Background Information for In Situ Treatment. Repared for Municipal
Environmental Research Lab. Cincinnati, OH.
Keuning, S. and Jager, D. (1994). Simultaneous degradation of Chlorobenzene. toluene,
xylene, and ethano1 by pure and mixed Pseudomonas cultures. Applied Biotechnology for
Site Remediation. Ed. Hinchee, R.E., Anderson, D.B.9 Metting, F.B. and Sayles, G.D.
Lewis Publishers. London.
Kile, D.E. and Chiou, C.T. (1989). Water solubility enhancements of DDT and
tnchlorobenzene by some surfactants below and above the critial micelle concentration.
Environ-Sci. Technol. 23: 832-838.
KiIlhm, K. (1994). Soil Ecology. Cambridge University Press. U.K.
91
Page 105
Kim , H.T. ( 1982). Principles of Soil Chemistry. Marcel Dekker Inc. New York.
Laha, S. and Luthy, R.G. ( 199 1). Inhibition of phenanthrene rnineralization by nonionic
surfactant in soil-water systems. Environ. Sci. Technoi. 25(11): 1920- 1930.
Leahy, J.G. and Colwell, R.R. (1990). Microbial degradation of hydrocarbons in the
environment. Microbiologicai Reviews. 54(3): 305-3 15.
Lee, M.L.. Yang, FJ.. and Bartle, KD. (1983). Open Tubuiar C o l m Gos Chromatogruphy.
John Wiley and Sons. New York.
Lindoerfer, W., Sewe, KU. , Oberbremmer, A., Muelier-Hurtig, K. and Wagner, F. (1992).
Microbial decontamination of soils contarninated with hydrocarbons, in paaicular mineral
oils by microbial oxidation. U.S. Patent 5128262.
Litz, N., Doering, H.W., Thiele, M., and Blume, KP. (1987). The behaviour of linear
aikylbenzene sulfonate in different soils: a cornparison between field and laboratory studies.
Ecotoxicol. Environ. Saf . 14: 103- 106.
Liu. Z., Laha, S. and Luthy, R.G. (1991). Surfactant solubilization of PAH compounds in
soil-water suspensions. Water Science und technology. 23: 475485.
Major, D. ( 199 1). Reviewing the options in bioremediation of ground water. Environmental
Science and Engineering. 25: 33-38.
Martin, R.C. ( 1993). Soil SampIing and Methods of Analysis. Lewis Publishers, London.
McLaren, A.D. (1975) Soil as a system of humus and clay with immobilized enzymes. Chem.
Page 106
Moskovits, G. and Hollohan, B.T. ( 1995). Introduction to Microbiology Luboratory Mmml
for Biology 3050. Memoriai University of Newfoundland.
Nelson, MJ.. Cornpeau, G.C., Maziarz, T., and Mahaffey, W.R. (1994). Laboratory
Treatabiiity Testing for Assessrnent of Field Applicability. Bioremediation : Field
Ekperience. Ed. Flathman, P.E., Jerger,.DE. and Exner, J.H. Lewis publishen. London.
pp.59-78.
Oberbremer, A., Muller-Hurtig, R. , and Wagner, F. (1990). Effect of the addition of
microbial surfactants on hydrocarbon degradadon in a soil pohation in a stirred reactor.
Appl. Microbiol. Biotechnol. 32: 485-489.
Odu. C.T. (1978). The Effect of Nutrient application and aeration on oil degradation.
Environ. Pollut. 1 5 : 235-240.
Parr, J.F., Sikoew, L.J., and Burge, W.D. (1983). Factors af5ecting the degradation and
inactivation of waste constituents in soils. uurd Treaîment of Huzardow Wastes. Ed Parr,
JE., Marsh, P., and Kla, J.M. Noyes Data Corporation. Park Ridge, NJ. U.S.A. pp.2049.
Parr, I.L., Claff, R.E., Kocurek, D.S ., and Lowry, J.C. (1994). Interlaboratory study of
analyticd methods for petroleum h ydrocarbons . Analysis of Soi1 - Con tmimted with
Perroleum Consiiîuents. Edited by O'Shay, T.A. and Hoddinott, K.B. ASTM Publication
Code Number 041) 122 10-38. ASTM Philadelphia, PA. U.S.A. pp.53-60.
Peavy, H. S, Rowe, D. R., and Tchnbanogious, G. (1985). Environmental Engineering.
McGraw-Hill Book Company. New York. pp.694-695.
Page 107
PEDCO Environmental , Inc. (1978). Assessrnent of gasoline toxicity. US EPA Contract No.
68-02-25 15. p.25.
Pelczar,. M.I. Jr, Chan, E.C.S., and Krieg, N.R. (1986). Microbiology. McGraw-Hill Book
Company. New York.
Peter, R.W., Montemagno, CD.. and Shem, L. (1992) Surfactant screening of Diesel-
contaminanted soil. Hazardous Wmte and Hatardous Materiais. 9(2): 1 13- 136.
Petrov. A.A. ( 1987). Petrolewn Hydrocarbonr. Springer-Verlag. New York.
Pickup, R.W. and Saunden, J.R (1996). Environmental Microbiology. Ellis Honvood.
bndon.
Pinholt, Y., Smiwe, S. and Kjoller, A. (1979). Microbid changes during oii decomposition
in soii. Holartic Ecol. 2: 195-200.
Prince, R (1993). Petroleum S p a bioremediation in marine environments. Microbiology.
19(4): 217-242
Reese, E.T., Maguire, A. (1969). Surfactants as stimulants of enzyme production by
micrwrganisms. Appl. Microbiol . 17: 242-245.
Ri-. BE. and Johnson, N.M. (1989). Rapid biologicd clean-up of soils contaminated
with lubricatiag oil. Wuter Science and Technology. 2 1 : 209-2 19.
Scheibenbugen, EL, Zytner, R.G., Lee, H., and Travors, J.T. (1994). Enhanced removal of
selected hydrocarbons from soil by Pseudomonas aeruginosa UG2 biosurfact ants and some
chernical surfactants. J. Chem. Tech. Biotechnol. 59: 53-59.
Page 108
Sherman, D-and Stroo, H. (1989). Biological treatment of PAHs in soi1 residues in
simulated land matment systems. Specialty Conference on Environmental Engineering,
ASCE. Jdy. 726-733.
Schlegel, H.G. ( 1 992). General Microbiology. Seventh Edition. Cambridge University Press.
Cambridge.
Sims, IL (1990). Approach to bioremediation of contarninated soil. Hazardous WW Md
Hazardous Materials. 7(2): 1 17- 148.
Sims, R. and Bass, J. (1984). Review of in-place matment techniques for contarninated
surface soils. Voi. 1. Technical Evaluation. EPA Report No. EPA-540n-84-003a
Skladany, GJ. and Baker, KK (1994). Laboratory biotreatability studies. Bioremediation
. Ed by Baker, KH. and Herson. D.S. McGraw-W. Inc. New York. pp. 97-173.
Tadros, T.F. (1984). Su$actmts. Academic Press, London.
Testa, S.M. and Winegardner, D.L. (1991). Restoration of Petrolewn-contamhuted
Aquifers. Lewis Publishea. London.
Texas Research Institute, Inc. (1982a). Enhancing the micmbial degradation of underground
gasoline by increasing available oxygen. Report to the Amerïcan Petroleum Imtitute.
Washington, D.C.
Texas Research Institute (1982b). Test results of surJactant enhanced gasoline recovery in
la rge-scale model aquifer. American Petroleum Ins titute, Washington, D.C.
Thibault, G.T. and Eiiiott, N. W. ( 1979). Accelerating the biologicai clean-up of hazardous
Page 109
matenais spills. Roceedings and Hazardous Material Spills: &vention Conuol- Cleanup
Recovery- Disposal. Dec.3-5. Sponsored by: Hazardous Materials Control Research Inst.
and Information Transfer. Inc. pp. 1 15- 120.
Tecator Co. (1996). Soxtec system HT, Instruction Manual. Rev. 2.0 Part no. 1 0 û 2296.
Tecaton AB, Sweden.
US. Environmental Protection Agency (1982a). Nonhalogenated volatile organics method
8015. In Test Methods for Evaluating Soi1 Waste. SW2M6, pp.290-297.
US. Environmental Protection Agency (1982b). Soxhlet extraction method 3540. In Test
Methods for Evaluating soil waste, SW-846, pp. 145- 1 50.
US. Environmental Protection Agency. (1985). Hunàbook of Remedial Acrion ut Wute
Disposal Sites (Revised). EPA Report No. EPA/625/6-85/006.
US National Research Council. (1993). In Situ Bioremediation: M e n does it work?.
National Academy Press. Washington, D.C.
Van Dake, M.I., Couture, P., Brauer, M., Lee, Ha, and Trevors, J.T. (1993). Pseudomonas
aeruginosa UG2 rhamnolipid biosurgactands: structural characterization and their use in
removing hydrophobie compounds h m soil. Cun Journal of microbiol. 39: 107 1- 1078. - .. I
Wardeîl. W. (1995). Potential for bioremediaiton of fuel-contaminated soi1 in Antarctica
J. of Soil Contami~rion. 4(2): 1 1 1- 12 1.
West, C.C. and Harweil, J.H. ( 1992). Surfactants and Subsurface Remediation. Environ. Sci.
Technol. 26(12): 2324-2330.
Page 110
Westlake, D.W.S., Jobsoo, AM., and Cook, F.D. (1978). In situ degradation of oil in a soii
of the boreal region of the Northwest Temtories. Can. J. Microbiol. 24: 254-260.
Yeom, LT. and Ghosh, MM. (1993). Surfactants in mobilizing soi1 bounded polycyclic
aromatic hydrocarbom. CSCE-ASCE National Conference on Environmental Engineering.
Montreal, Quebec, Canada, July 12-14.
ZoBeii, C.E. (1946). Action of micrwrganisms on hydrocarbons. Bacteriol. Rev. 10: 149.
ZoBeil. C.E. (1969). Microbid modification of crude oil in the sea pp. 317-326. In
Proceedings of Joints Conference on preveniion and Control of Oil Spills. knerican
Petroleum Institute. Washington, D.C.
Page 111
IMAGE NALUATION TEST TARGET (QA-3)
APPLIED - & IMAGE. Inc = 1653 East Main Street - -. - Rochester, NY 14609 USA C --= Phone: 71 W48&O3OO -- - Fax 716/288-5989
0 1993. Appiied Image. Inc. Aa Rlqhr) Rgsenred