Page 1
International Journal of Engineering Science Invention (IJESI)
ISSN (Online): 2319 – 6734, ISSN (Print): 2319 – 6726
www.ijesi.org ||Volume 7 Issue 3 Ver. 3 || March 2018 || PP62-73
www.ijesi.org 62 | Page
Bioremediation Process ofEffluent fromDetergent andFood
Industries inJos, Nigeria: Kinetics andThermodynamics
Akeem Adebayo Jimoh*1, Dr Adebayo GaniyuBabatunde
2, Dauda Baba
3,
Abdullateef Baba 4
1Chemistry Department, College ofPure andApplied Sciences, Kwara State University, Malete. Ilorin, Nigeria.
2Industrial Chemistry Department, Faculty of Physical Sciences, University of Ilorin, Ilorin, Nigeria.
3Chemical Engineering Department, Faculty ofEngineering, University of Maiduguri, Maiduguri, Nigeria.
4Chemistry Department, Faculty ofScience, University of Maiduguri, Maiduguri, Nigeria.
Corresponding Author:Akeem Adebayo Jimoh
Abstract :In This Present Study, The Reduction Trends in Total Solids (TS) of Effluents from Food and
Detergent Industries were used to determine the rate of Remediation using Immobilized Bacterial Substrates.
Two different Bacteria Pseudomonas Spp and Bacillus Spp were isolated from Food Effluent (FE) and
Detergent Effluents (DE) and were used for their remediation study. The results showed that the reduction in
Total Solids (TS) ranged between 11.55% and 84.26% for Food Effluent and 17.89% and 97.84% for Detergent
Effluent (DE) Respectively. The Reductions in TS were subjected to zero and first order kinetics. The rate
constant for TS reduction for zero order kinetics were ranged (FE 0.095-0.758 Mg/L/Day and DE 0.036-1.029
Mg/L/Day) and first order kinetics also ranged (FE 0.015-0.238 D-1
and DE 0.015-0.42 D-1
). The kinetic
models’ results showed that both the TS reduction for Pseudomonas Spp. and Bacillus Spp. used in this research
followed both the zero order and first order kinetics.
Key Words: Bacillus Spp., Immobilization, Kinetics, Pseudomonas Spp., Thermodynamics.
---------------------------------------------------------------------------------------------------------------------------------------
Date of Submission: 27-02-2018 Date of acceptance: 14-03-2018
----------------------------------------------------------------------------------------------------------------------------- ----------
I. Introduction Environmental bioremediation is an emerging technology which is receiving great attention because
conventional methods to clean up the environment are cost-intensive and eco-unfriendly. Bioremediation is
based on the idea that all organisms remove substances from the environment to carry outgrowth and
metabolism [1]. Bioremediation make use of micro-organisms and higher plants to treat hazardous organic and
metallic residues or by-products which enter into soils and sediments from various processes associated with
domestic, municipal, agricultural, industrial and military activities [2].
A major concern for petroleum hydrocarbon bioremediation is the presence of heavy compounds such
as polycyclic aromatic hydrocarbons (PAHs), asphaltenes and many branched compounds with 20 or more
carbon atoms. These heavy hydrocarbon constituents are not easily metabolized by microorganisms and are
considered potential health risks due to their possible carcinogenic and mutagenic actions [3].Information on
kinetics is extremely important because it describes the concentration of the chemical remaining at any time and
permit prediction of the levels likely to be present at some future time [4].
Waters with high total dissolved solids (TDS) are unpalatable and potentially unhealthy. Water
treatment plants use flocculants to aggregate suspended and dissolved solids into particles large enough to settle
out of the water column in settling tanks. TDS on the other hand is equally important in water quality studies,
though there was no serious health effect associated with TDS ingestion in water but some regulatory agencies
recommended a maximum TDS value of 500 mg/l in drinking water supplies [5]- [6]. TDS concentration of
2200 mg/l in effluents has been reported by jiunkins [7] while wesenberg [8] reported a value of 2700 mg/l.
High TDS is one of the major sources of sediment which reduce the light penetration into water and ultimately
decrease the photosynthesis. According to WHO [9], the palatability of water with TDS level of less than 600.00
mg/l is generally considered good; drinking water becomes significantly and increasingly unpalatably at TDS
levels greater than about 1000.00 mg/l. Therefore, a guideline value of 1000.00 mg/l was established for TDS
based on taste consideration [10].
Total Suspended Solids (TSS) include all the particles suspended in water which will not pass through
a filter. Suspended solids are present in natural water [10], sanitary wastewater, and many types of industrial
wastewaters. It is observed that a suspended solid absorb heat from sunlight, causing increase in water
temperature and subsequently decreases level of dissolved oxygen. Some aquatic species are sensitive to
Page 2
Bioremediation Process of Effluent from Detergent and Food Industries in Jos, Nigeria: Kinetics
www.ijesi.org 63 | Page
prolonged exposure to TSS and thus, monitoring of TSS is an important criterion for assessing the quality of
water [11].Total Solid (TS) comprises of total dissolved solids (TDS) and total suspended solids (TSS).
Investigation of bioremediation of diesel-contaminated using composting techniques was carried out.
The results of applied first-order kinetics models agreed to a great extent with the experimental results [12]. The
evaluation of microbial systems for bioremediation of petroleum refinery effluents in Nigeria was studied. The
study revealed the high potency of the strains and the possibility of using them in bioremediation of petroleum
refinery and petrochemical waste waters [13]. Heavy metal biosorption potential of aspergillusand rhizopussp.
isolated from wastewater treated soil was conducted. The findings revealed that fungi of metal polluted sites
showed higher metal tolerance and bio-adsorption capacity of chromium and cadmium [14]. The kinetics of
bioremediation of petroleum contaminated soil using a laboratory scale aerated reactor was studied. The results
showed that the first order kinetic constants for the different bioreactors vary between 0.041 and 0.0071 / day
[15]. Microbial degradation and its kinetics on crude oil polluted soil from Agbor area of the Niger Delta in
Nigeria was worked on. A remediation efficiency of 81.69% was obtained on the sixth week indicating the
efficiency and effectiveness of the process. The biodegradation process followed first order with a rate constant
of 0.035 /day [16]. This research work aimed at studying the kinetics and thermodynamics of bioremediation
process whereby the rate of biochemical reaction involving removal of TS from industrial effluent by
microorganisms was studied for future reference.
II. Materials and Methods 2.1. Sampling Area and Collection of Samples
The Effluents was collected from two different production plants in a sterile 4 litres plastic container
carried in an ice-chest and stored in a refrigerator before analysis. The sample was collected from the channel of
flow into the river [17].The concentration of TSS, TDS and TS were determined before and after the
bioremediation.
2.2. Determination of Total Solids (TS)
A clean dish of suitable size was dried at 103-105oC in an oven to a constant weight.100 ml of
thoroughly mixed effluent sample was accurately pipette into a dish, weighed and evaporated to dryness on a
steam bath. The residue was dried in an oven for about 1 hour at 103-105oC and re-weighed after cooling to
room temperature. The cooling was done until the weight of the dish plus residue was constant to within 0.05
mg. the weight of the dish was subtracted to obtain the weight of the total solids [18] - [19]. This procedure was
repeated for the biological treated sample of the effluent. The value of TS was calculated using the formula:
𝑇𝑆 𝑚𝑔
𝑙
=𝑚𝑖𝑙𝑙𝑖𝑔𝑟𝑎𝑚𝑜𝑓𝑇𝑜𝑡𝑎𝑙𝑠𝑜𝑙𝑖𝑑
𝑣𝑜𝑙𝑢𝑚𝑒𝑜𝑓𝑠𝑎𝑚𝑝𝑙𝑒× 1000------- (1)
2.3 Determination of Total Suspended Solids (TSS)
100 Mlof the sample of the effluent was withdrawn into a conical flask with a pipette. It was filtered
with filter paper which was pre-dried at 103-105oC and weighed. The weight of the filter paper was subtracted
from the weight of the filter paper containing the solids to obtain the weight of the suspended solids [18] - [19].
This procedure was repeated for the biological treated sample of the effluent. The value of TSS was calculated
using the formula:
𝑇𝑆𝑆 𝑚𝑔
𝑙
=𝑚𝑖𝑙𝑙𝑖𝑔𝑟𝑎𝑚𝑜𝑓𝑇𝑜𝑡𝑎𝑙𝑠𝑜𝑙𝑖𝑑
𝑣𝑜𝑙𝑢𝑚𝑒𝑜𝑓𝑠𝑎𝑚𝑝𝑙𝑒× 1000------ (2)
2.4 Determination of Total Dissolved Solids (TDS)
Dissolved Solids were obtained by difference between total solids and total suspended solids [18]- [19].
2.5. Isolation and Identification of Organisms
Dominant Organisms (Bacteria) were isolated using serial dilution [18]. The biochemical tests that
were used to identified the bacteria were sulphateindole motility (sim), oxidase, catalase, phenylalanine
deaminase (pd), indole, citrate, coagulase, methyl red (mr), nitrate reduction, voges-proskauer (vp), sugar and
urease tests [20] - [21]
2.6.Immobilization of Organisms
Agar solution and inoculi was prepared separately. 50 ml of nutrient broth each of the inoculi was
prepared in a mccartney bottles and incubated for 24 hours. A solution of agar-agar media was prepared by
dissolving 10 g of the media powder in distilled water and made up to 500 ml mark in an erlenmeyer flask and
was sterilized in an autoclave for 15 minutes and allowed to cool to 40-45oc [21]. The 4 ml of microorganism in
nutrient broth was mixed with 36 ml of the prepared agar-agar media in petri-dish plates and then allowed to
solidify. This was kept in the refrigerator for bioremediation and its kinetics studies.
Page 3
Bioremediation Process of Effluent from Detergent and Food Industries in Jos, Nigeria: Kinetics
www.ijesi.org 64 | Page
2.7. Bioremediation of the Effluents
The solidified agar block was cut into cubes using a sterile knife; 0.1 ml phosphate buffer (pH 7.0) was
added and kept in the refrigerator for 1 hour for curing. Phosphate buffer was decanted after 1 hour and the
cubes were washed with sterile distilled water 3-4 times before it was used [22].
Two litres of the effluent was supplemented with minimum basel medium in g/l: Na (0.8),
MgSO4.7H2O (0.001), KH2PO4 (2), NaNO3 (2), CaCl2.2H2O (0.5) and NaHPO4.12H2O (2) and sterilized in an
autoclave at 121oc for 15 minutes.
200 ml of the effluent was transferred into 250 ml conical flask. The content was covered with a
cotton-wool ramped with foil paper to avoid contamination. A particular weight in grams (5 g, 10 g) each of
immobilized microorganism cells was quickly transferred into the effluent in the conical flask in an inoculating
chamber and agitated for five [23]. The concentrations of TSS, TDS and TS were determined daily for five days
and the results used to monitor the kinetics of the bioremediation process.
2.8. Kinetic Study of the Bioremediation
In order to evaluate the kinetic studies of the bioremediation process, data was fitted into the zero-order
and first-order models. The linear forms of zero-order and first-order kinetic equations are given in equations 3
and 4 respectively: 𝐶𝑡 = −𝑘𝑡 + [𝐶𝑜]----------------------------------- (3)
Ln[𝐶𝑡] = −𝑘𝑡 + 𝑙𝑛[𝐶𝑜] ---------------------------- (4)
Where Ctrepresents the amount of parameters (TS) at time (daily) intervals t, Co is the initial amount of
parameters used at the beginning of the experiments and kt represents the kinetic constants.
2.9.Thermodynamic Study of the Bioremediation
On the basis of the rate constants obtained from the temperature-dependent data of the rate of
bioremediation, the thermodynamic parameters including ∆𝐺,∆𝐻𝑎𝑛𝑑∆𝑆 could be estimated from Gibb‟s free
energy equation: ∆G = ∆H − T∆S and gas equation: ∆𝐺 = −𝑅𝑇𝑙𝑛𝐾n by equating the two equations and solving
the linear equation derived from its solution gave:
Where −∆𝐻
𝑅= 𝑠𝑙𝑜𝑝𝑒,
∆𝑆
𝑅= 𝑖𝑛𝑡𝑒𝑟𝑐𝑒𝑝𝑡𝑎𝑛𝑑𝑅 = 𝑔𝑎𝑠𝑐𝑜𝑛𝑠𝑡𝑎𝑛𝑡
−∆𝐻 =R× Slope And ∆S= R× Intercept
2.10.Statistical Analysis
The differences in the measured and experimental values of each parameter were carried out using
SPSS software. The data were represented as mean ± standard deviation. All the data were analyzed statistically
applying student„t‟ test, for all the studied parameters.
III. Results and Discussion Table I: Physico-Chemical Properties of Samples before and after Bioremediation at 35
oc.
Parameters
Sample FE
Sample DE
Tolerance Limits (USEPA, 1993; NESREA,
2007 And NAFDAC, 2000).
Before
Treatment
After
Treatment
Before
Treatment
After
Treatment WHO NESREA NAFDAC
Odour Offensive Odourless Pungent Odourless Odourless Odourless Odourless
Colour Dirty Brown Clear Greenish Blue Light Blue Clear Clear Clear
pH 4.6 6.9 11.8 7.50 7.0-8.5 6-9 6.5-8.5
TSS(Mg/L) 0.052 0.608 0.694 0.081 500 500 500
TDS(Mg/L) 7.24 2.958 5.89 0.741 500 500 500
TS(Mg/L) 7.292 3.526 5.961 0.841 30 30 100.00
WHO: World Health Organisation, NESREA: National Environmental Standard and Regulatory Enforcement
Agency, NAFDAC: National Agency for Foods and Drugs Administration Commission
Page 4
Bioremediation Process of Effluent from Detergent and Food Industries in Jos, Nigeria: Kinetics
www.ijesi.org 65 | Page
Table II:Characterisationof Organisms in Effluent Samples.
FS1* DS1 FS2 DS2* FS3 DS3 FS4 DS4
Shape Irregular Rhizoid Circular Circular Circular Circular Rhizoid Irregular
Elevation Flat Raised Convex Convex Flat Flat Curve Flat
Edge Undulated Rhizoid Entire Entire Entire Entire Undulated Undulated
Optical
Characteristics Opaque Opaque Opaque Opaque Transparent Opaque Opaque Opaque
Pigmentation Yellow Light Yellow
Light Yellow White Yellow
Light Yellow
Light Yellow
Light Yellow
Colony Surface Rough Rough Smooth Smooth Smooth Smooth Rough Rough
Consistency 4/5 1/5 3/5 4/5 2/5 3/5 1/5 2/5
Table III: Biochemical Characteristics of Isolated Bacteria BIOCHEMICAL TEST DETERGENT SAMPLE FOOD SAMPLE
MR Test + +
PD Test - -
VP Test - -
Nacl Test + +
Lysine Test + +
IndoleTest - -
Nitrate Test - +
Urea Test - -
SIM Test ++ ++
Glucose Test Fermentive Oxidative
Maltose Test Fermentive Oxidative
Catalase Test + +
Lactose Test + +
Oxidative + -
Citrate + +
+, ++= Positive Result - = Negative Result
Table IV:Bioremediation of undiluted sample of FE and DE at 35, 45, 55 and 65oC with 5.0g Agar-Agar.
Temp.
(OC)
Time
(Day)
TSS (Mg/L)
FE DE
TDS (Mg/L)
FE DE
TS (Mg/L)
FE DE
3
5 1 0.088 0.144 5.678 4.600 5.766 4.744
2 0.231 0.339 5.116 4.165 5.347 4.504
3 0.453 0.621 4.737 2.705 5.183 3.326
4 0.578 0.689 4.222 1.326 4.800 2.016
5 0.608 0.694 2.958 0.787 3.526 0.841
4
5 1 0.067 0.081 6.812 5.20 6.879 5.281
2 0.092 0.99 6.793 5.031 6.865 5.128
3 0.124 0.128 6.621 4.966 6.745 5.094
4 0.166 0.281 6.493 4.711 6.659 4.992
5 0.181 0.313 6.266 4.584 6.450 4897
5
5 1 0.294 0.128 6.241 5.115 6.355 5.243
2 0.430 0.222 5.533 4.881 6.065 5.003
3 0.684 0.297 4.844 4.443 5.528 4.740
4 0.781 0.331 4.004 2.985 4.785 3.316
5 0.863 0.403 2.439 2.042 3.205 2.446
6
5 1 0.0675 0.143 1.913 1.90 1.976 2.041
2 0.167 0.520 1.190 1.011 1.357 1.877
3 0.464 0.857 0.690 0.690 1.211 1.477
4 0.833 1.056 0.350 0.478 1.183 1.334
5 0.988 1.325 0.190 0.290 1.148 1.014
Page 5
Bioremediation Process of Effluent from Detergent and Food Industries in Jos, Nigeria: Kinetics
www.ijesi.org 66 | Page
Table V: Bioremediation of 50% diluted sample ofFE andDE at 35, 45, 55 and 65oC with 5.0g Agar-Agar.
Temp.
(OC)
Time
(Day)
TSS (Mg/L)
FE DE
TDS (Mg/L)
FE DE
TS (Mg/L)
FE DE
35
1 0.052 0.081 3.792 2.537 3.844 2.418
2 0.113 0.174 3.252 2.010 3.365 2.184
3 0.186 0.236 2.555 1.570 2.741 1.806
4 0.277 0.311 2.039 0.753 2.316 1.064
5 0.304 0.376 1.609 0.083 1.913 0.459
4
5 1 0.031 0.049 3.890 3.455 3.921 3.504
2 0.052 0.071 3.571 3.345 3.623 3.416
3 0.096 0.095 3.336 2.853 3.017 2.522
4 0.112 0.124 2.905 2.408 3.017 2.522
5 0.135 0.156 2.656 1.960 2.791 2.116
5
5 1 0.149 0.097 2.998 2.414 3.147 2.511
2 0.219 0.142 2.723 2.008 2.942 2.150
3 0.361 0.196 2.195 1.785 2.556 1.981
4 0.421 0.214 1.777 1.155 2.198 1.369
5 0.453 0.256 1.352 0.670 1.805 0.926
6
5 1 0.028 0.068 1.232 1.316 1.260 1.384
2 0.084 0.301 0.907 0.705 0.991 1.006
3 0.302 0.439 0.404 0.402 0.706 0.841
4 0.441 0.512 0.141 0.183 0.552 0.695
5 0.462 0.618 0.051 0.028 0.512 0.646
Table VI:Bioremediationofundiluted sample of FE and DE at 35, 45, 55 and 65oCwith 10g Agar-Agar.
Temp. (OC)
Time (Day)
TSS (Mg/L) FE DE
TDS (Mg/L) FE DE
TS (Mg/L) FE DE
35
1 0.166 0.193 3.785 4.736 3.951 4.949
2 0.223 0.404 3.411 3.386 3.634 3.789
3 0.394 0.725 2.842 1.183 3.236 1.908
4 0.584 0.804 2.621 0.824 3.192 1.628
5 0.633 0.926 1.972 0.314 2.605 1.240
4
5 1 0.152 0.196 4.541 5.024 4.693 5.220
2 0.196 0.262 4.234 4.484 4.430 4.746
3 0.247 0.342 4.102 3.932 4.249 4.294
4 0.315 0.399 3.962 3.557 4.277 3.956
5 0.306 0.462 3.884 3.162 4.290 3.624
5
5 1 0.314 0.223 4.339 4.962 4.851 5.185
2 0.396 0.385 4.165 3.524 4.761 3.909
3 0.769 0.436 3.822 3.124 4.589 3.56
4 0.384 0.569 3.229 2.143 4.113 2.712
5 1.002 0.702 2.964 1.524 3.966 2.226
6
5 1 0.123 0.735 1.624 1.974 1.717 2.359
2 0.256 0.684 1.468 1.648 1.724 2.332
3 0.633 0.983 0.942 1.335 1.575 2.318
4 0.964 1.174 0.423 1.084 1.387 2.20
5 1.129 1.492 0.158 0.724 1.287 2.216
Figure 1:Graph of zero-order kinetics of TS against time at different temperature (undiluted sample FE with 5g
Immobilized Bacteria)
0
2
4
6
8
0 1 2 3 4 5 6
TS (
mg/
l)
Time (day)
TS (mg/l) FE (35)
TS (mg/l) FE (45)
TS (mg/l) FE (55)
TS (mg/l) FE (65)
Page 6
Bioremediation Process of Effluent from Detergent and Food Industries in Jos, Nigeria: Kinetics
www.ijesi.org 67 | Page
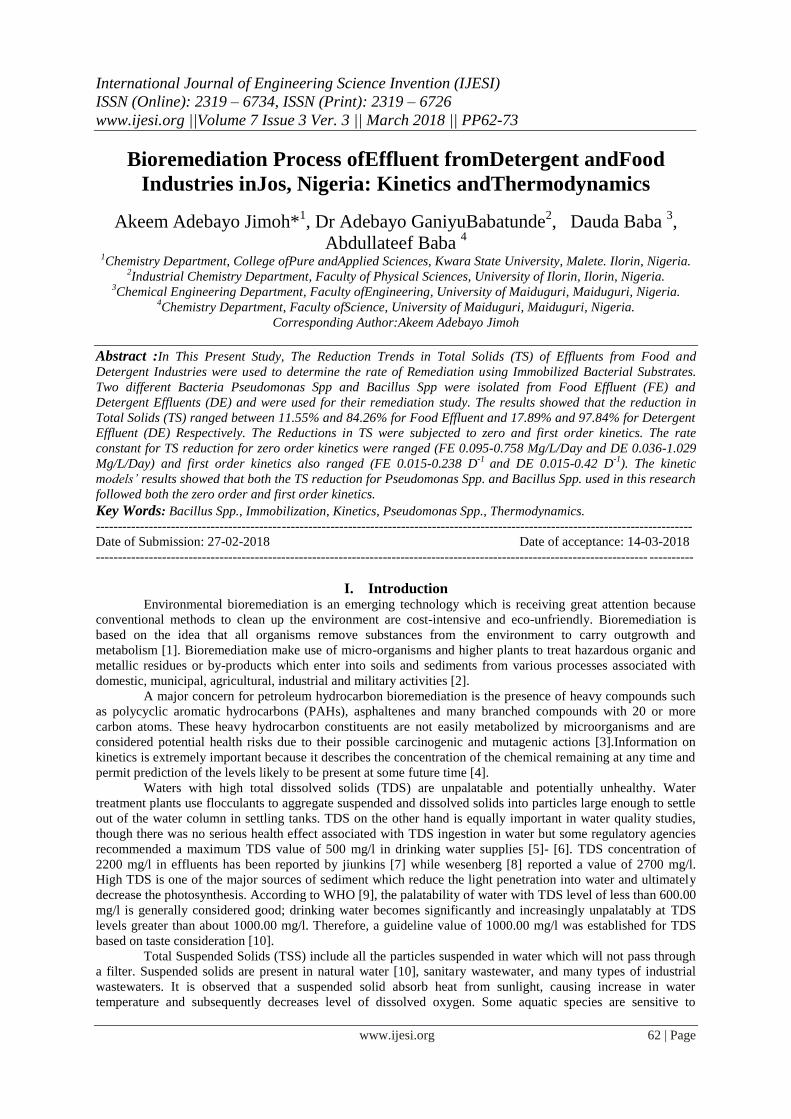
Figure 2:Graph of first-order kinetics of TS against time at different temperature (undiluted sample FE with 5g
Immobilized Bacteria)
Figure 3:Graph of zero-order kinetics of TS against time at different temperature (undiluted sample DE with 5g
Immobilized Bacteria)
Figure 4:Graph of first-order kinetics of TS against time at different temperature (undiluted sample DE with 5g
Immobilized Bacteria)
Figure 5:Graph of zero-order kinetics of TS against time at different temperature (diluted sample FE with 5g
Immobilized Bacteria)
0
0.5
1
1.5
2
2.5
0 1 2 3 4 5 6
lnC
Time (day)
lnTS (FE) 35
lnTS (FE) 45
lnTS (FE) 55
lnTS (FE) 65
0
1
2
3
4
5
6
0 1 2 3 4 5 6
TS (
mg/
l)
Time (day)
TS (mg/l) DE (35)
TS (mg/l) DE (45)
TS (mg/l) DE (55)
TS (mg/l) DE (65)
-1
0
1
2
0 1 2 3 4 5 6
lnC
Time (day)
lnTS (DE) 35lnTS (DE) 45lnTS (DE) 55lnTS (DE) 65
0
1
2
3
4
5
0 1 2 3 4 5 6
TS (
mg/
l)
Time (day)
TS (mg/l) FE (35)
TS (mg/l) FE (45)
TS (mg/l) FE (55)
TS (mg/l) FE (65)
-1
-0.5
0
0.5
1
1.5
0 1 2 3 4 5 6
lnC
Time (day)
lnTS (FE) 35lnTS (FE) 45lnTS (FE) 55lnTS (FE) 65
Page 7
Bioremediation Process of Effluent from Detergent and Food Industries in Jos, Nigeria: Kinetics
www.ijesi.org 68 | Page
Figure 6:Graph of first-order kinetics of TS against time at different temperature (diluted sample FE with 5g
Immobilized Bacteria)
Figure 7:Graph of zero-order kinetics of TS against time at different temperature (diluted sample DE with 5g
Immobilized Bacteria)
Figure 8:Graph of first-order kinetics of TS against time at different temperature (diluted sample DE with 5g
Immobilized Bacteria)
Figure 9:Graph of zero-order kinetics of TS against time at different temperature (undiluted sample FE with
10g Immobilized Bacteria)
0
1
2
3
4
0 1 2 3 4 5 6
TS (
mg/
l)
Time (day)
TS (mg/l) DE (35)TS (mg/l) DE (45)TS (mg/l) DE (55)TS (mg/l) DE (65)
-1
-0.5
0
0.5
1
1.5
0 1 2 3 4 5 6
lnC
Time (day)
lnTS (DE) 35lnTS (DE) 45lnTS (DE) 55lnTS (DE) 65
0
1
2
3
4
5
6
0 1 2 3 4 5 6
TS (
mg/
l)
Time (day)
TS (mg/l) FE (35)TS (mg/l) FE (45)TS (mg/l) FE (55)TS (mg/l) FE (65)
Page 8
Bioremediation Process of Effluent from Detergent and Food Industries in Jos, Nigeria: Kinetics
www.ijesi.org 69 | Page
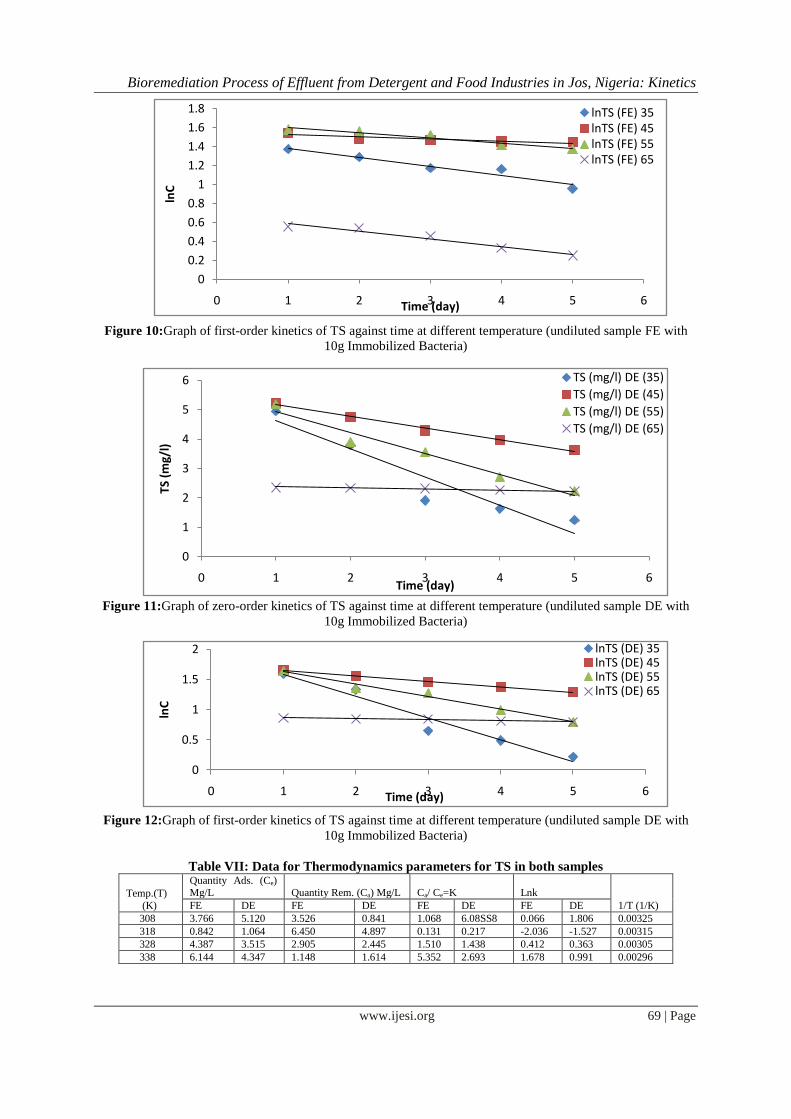
Figure 10:Graph of first-order kinetics of TS against time at different temperature (undiluted sample FE with
10g Immobilized Bacteria)
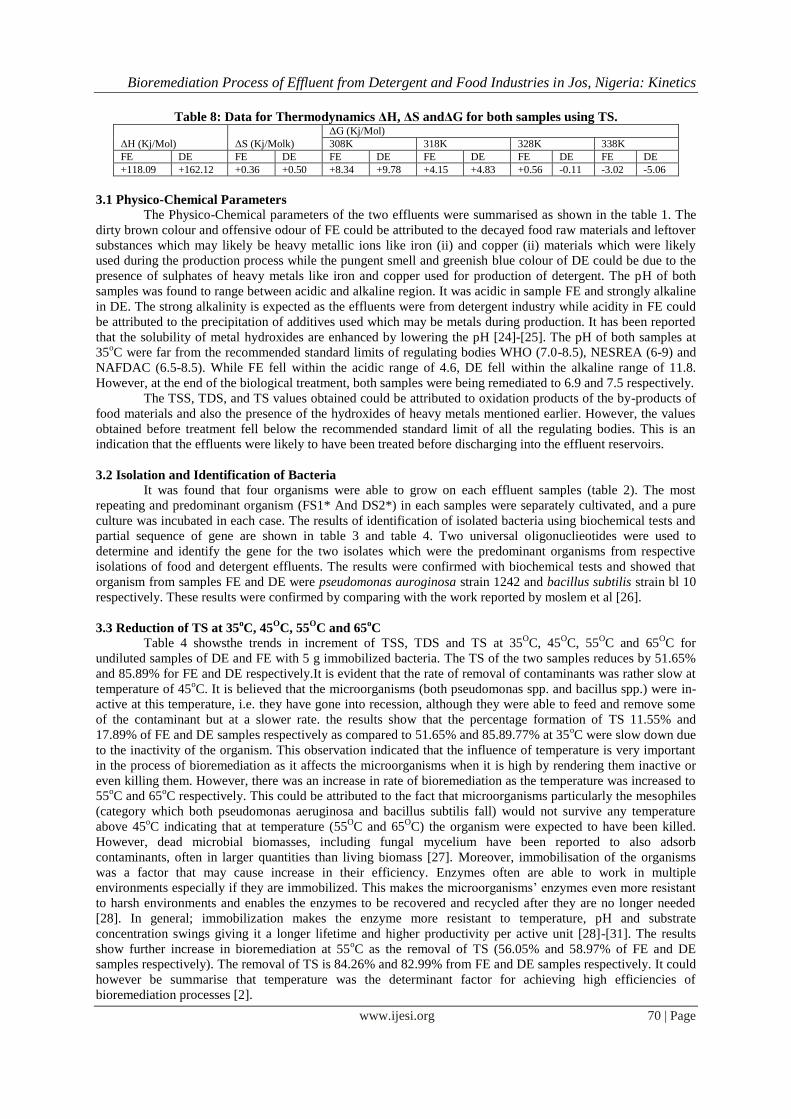
Figure 11:Graph of zero-order kinetics of TS against time at different temperature (undiluted sample DE with
10g Immobilized Bacteria)
Figure 12:Graph of first-order kinetics of TS against time at different temperature (undiluted sample DE with
10g Immobilized Bacteria)
Table VII: Data for Thermodynamics parameters for TS in both samples
Temp.(T)
(K)
Quantity Ads. (Ce) Mg/L Quantity Rem. (Ca) Mg/L Ca/ Ce=K Lnk
1/T (1/K) FE DE FE DE FE DE FE DE
308 3.766 5.120 3.526 0.841 1.068 6.08SS8 0.066 1.806 0.00325
318 0.842 1.064 6.450 4.897 0.131 0.217 -2.036 -1.527 0.00315
328 4.387 3.515 2.905 2.445 1.510 1.438 0.412 0.363 0.00305
338 6.144 4.347 1.148 1.614 5.352 2.693 1.678 0.991 0.00296
0
0.2
0.4
0.6
0.8
1
1.2
1.4
1.6
1.8
0 1 2 3 4 5 6
lnC
Time (day)
lnTS (FE) 35lnTS (FE) 45lnTS (FE) 55lnTS (FE) 65
0
1
2
3
4
5
6
0 1 2 3 4 5 6
TS (
mg/
l)
Time (day)
TS (mg/l) DE (35)
TS (mg/l) DE (45)
TS (mg/l) DE (55)
TS (mg/l) DE (65)
0
0.5
1
1.5
2
0 1 2 3 4 5 6
lnC
Time (day)
lnTS (DE) 35lnTS (DE) 45lnTS (DE) 55lnTS (DE) 65
Page 9
Bioremediation Process of Effluent from Detergent and Food Industries in Jos, Nigeria: Kinetics
www.ijesi.org 70 | Page
Table 8: Data for Thermodynamics ΔH, ΔS andΔG for both samples using TS.
ΔH (Kj/Mol) ΔS (Kj/Molk)
ΔG (Kj/Mol)
308K 318K 328K 338K
FE DE FE DE FE DE FE DE FE DE FE DE
+118.09 +162.12 +0.36 +0.50 +8.34 +9.78 +4.15 +4.83 +0.56 -0.11 -3.02 -5.06
3.1 Physico-Chemical Parameters
The Physico-Chemical parameters of the two effluents were summarised as shown in the table 1. The
dirty brown colour and offensive odour of FE could be attributed to the decayed food raw materials and leftover
substances which may likely be heavy metallic ions like iron (ii) and copper (ii) materials which were likely
used during the production process while the pungent smell and greenish blue colour of DE could be due to the
presence of sulphates of heavy metals like iron and copper used for production of detergent. The pH of both
samples was found to range between acidic and alkaline region. It was acidic in sample FE and strongly alkaline
in DE. The strong alkalinity is expected as the effluents were from detergent industry while acidity in FE could
be attributed to the precipitation of additives used which may be metals during production. It has been reported
that the solubility of metal hydroxides are enhanced by lowering the pH [24]-[25]. The pH of both samples at
35oC were far from the recommended standard limits of regulating bodies WHO (7.0-8.5), NESREA (6-9) and
NAFDAC (6.5-8.5). While FE fell within the acidic range of 4.6, DE fell within the alkaline range of 11.8.
However, at the end of the biological treatment, both samples were being remediated to 6.9 and 7.5 respectively.
The TSS, TDS, and TS values obtained could be attributed to oxidation products of the by-products of
food materials and also the presence of the hydroxides of heavy metals mentioned earlier. However, the values
obtained before treatment fell below the recommended standard limit of all the regulating bodies. This is an
indication that the effluents were likely to have been treated before discharging into the effluent reservoirs.
3.2 Isolation and Identification of Bacteria
It was found that four organisms were able to grow on each effluent samples (table 2). The most
repeating and predominant organism (FS1* And DS2*) in each samples were separately cultivated, and a pure
culture was incubated in each case. The results of identification of isolated bacteria using biochemical tests and
partial sequence of gene are shown in table 3 and table 4. Two universal oligonuclieotides were used to
determine and identify the gene for the two isolates which were the predominant organisms from respective
isolations of food and detergent effluents. The results were confirmed with biochemical tests and showed that
organism from samples FE and DE were pseudomonas auroginosa strain 1242 and bacillus subtilis strain bl 10
respectively. These results were confirmed by comparing with the work reported by moslem et al [26].
3.3 Reduction of TS at 35oC, 45
OC, 55
OC and 65
oC
Table 4 showsthe trends in increment of TSS, TDS and TS at 35OC, 45
OC, 55
OC and 65
OC for
undiluted samples of DE and FE with 5 g immobilized bacteria. The TS of the two samples reduces by 51.65%
and 85.89% for FE and DE respectively.It is evident that the rate of removal of contaminants was rather slow at
temperature of 45oC. It is believed that the microorganisms (both pseudomonas spp. and bacillus spp.) were in-
active at this temperature, i.e. they have gone into recession, although they were able to feed and remove some
of the contaminant but at a slower rate. the results show that the percentage formation of TS 11.55% and
17.89% of FE and DE samples respectively as compared to 51.65% and 85.89.77% at 35oC were slow down due
to the inactivity of the organism. This observation indicated that the influence of temperature is very important
in the process of bioremediation as it affects the microorganisms when it is high by rendering them inactive or
even killing them. However, there was an increase in rate of bioremediation as the temperature was increased to
55oC and 65
oC respectively. This could be attributed to the fact that microorganisms particularly the mesophiles
(category which both pseudomonas aeruginosa and bacillus subtilis fall) would not survive any temperature
above 45oC indicating that at temperature (55
OC and 65
OC) the organism were expected to have been killed.
However, dead microbial biomasses, including fungal mycelium have been reported to also adsorb
contaminants, often in larger quantities than living biomass [27]. Moreover, immobilisation of the organisms
was a factor that may cause increase in their efficiency. Enzymes often are able to work in multiple
environments especially if they are immobilized. This makes the microorganisms‟ enzymes even more resistant
to harsh environments and enables the enzymes to be recovered and recycled after they are no longer needed
[28]. In general; immobilization makes the enzyme more resistant to temperature, pH and substrate
concentration swings giving it a longer lifetime and higher productivity per active unit [28]-[31]. The results
show further increase in bioremediation at 55oC as the removal of TS (56.05% and 58.97% of FE and DE
samples respectively). The removal of TS is 84.26% and 82.99% from FE and DE samples respectively. It could
however be summarise that temperature was the determinant factor for achieving high efficiencies of
bioremediation processes [2].
Page 10
Bioremediation Process of Effluent from Detergent and Food Industries in Jos, Nigeria: Kinetics
www.ijesi.org 71 | Page
Table 5 shows the trends of results of bioremediation of 50% diluted samples of FE and DE with 5.0 g
of immobilized microorganism in agar-agar media. The results show that there is a similar trend for TS when
compared with the results for the undiluted sample. It was observed that the dilution of the effluents caused
reduction in the concentration of the contaminants. This reduction in the initial concentration of the
contaminants made the rate of bioremediation to be faster as compared with those of original effluents. Diluting
the samples indicated that the levels of contaminants were reduced due to interaction with water. there was
reduction in the values of TS.
Table 6 shows the trends of results of bioremediation of undiluted sample with 10 g immobilized
microorganism. The results show that there is a similar trend in TS when compared to those results in table 4.
The TS were decreasing at each interval. The value of TS of FE and DE samples reduced at a percentage of
64.28% and 79.20% respectively.
3.4 Kinetics Study
Figures 1 To 4 show the graphs of zero-order and first-order kinetics of undiluted samples of FE and
DE with 5 g immobilized bacteria. The TS reduction was studied at different temperatures and it was subjected
to kinetic modelling. For the zeroth-order, the results showed that the rate constants varied between 0.106-0.758
mg/l/day and 0.258-1.029 mg/l/day for sample FE and DE respectively. The correlation coefficient of the plots
showed that bioreaction at 45oC (0.906) and 55
oC (0.916) were above 0.9 for sample FE while all the plots for
sample DE have correlation coefficient greater than 0.9 with the highest at 45oC (0.981). also, the experimental
values at 45oC (7.038 mg/l) and 55
oC (7.461 mg/l) are more closer to the measured value 7.292 mg/l for sample
FE while the experimental value of 5.344 mg/l at 45oC was more closer to measured value of 5.961 mg/l for
sample DE. The difference between the measured and experimental values of zero order for both samples were
insignificant (p>0.05).
However, the first-order kinetic study showed that rate constants varied between 0.015-0.16 D-1
and
0.017-0.42 D-1
with the highest values in both samples FE and DE at 35oC. The correlation coefficients values at
35oC, 55
OC and 65
oC were all lower than 0.9 in both samples, while at 45
oC of samples FE and DE the value
was 0.908 and 0.963 respectively were above 0.9. The experimental value of sample FE at 45oC (7.043 Mg/L)
was only value closer to the measured value 7.292 Mg/L while sample DE also at 45oC (5.344) was closer to the
measured value 5.961 Mg/L. The difference between the measured and experimental values of first order for
both samples were insignificant (P>0.05).
The kinetic modelling of TS for sample FE using 5g Immobilised Bacteria showed that at 35OC, 45
OC
and 55oC zero order model was better fitted, having higher correlation coefficient as compared to its zero order.
At 65oC itwas first order that was better fitted. Meanwhile, sample DE was zero order at all temperature used.
Figures 5 To 8 show the graphs of zero-order and first-order kinetics of DILUTED SAMPLES of FE
and DE with 5 g Immobilized Bacteria. The effect of dilution on the rate of removal of TS was studied. The zero
order rate constants of TS reduction of diluted effluent samples varied between 0.193-0.491 Mg/L/Day and
0.178-0.503 Mg/L/Day for sample FE andDE Respectively. The highest value was at 35oC in both samples. The
correlation coefficients of both samples were greater than 0.90, the highest value for sample FE was 0.993 at
35oC, while that of sample DE was 0.955 at 45
oC.The intercept of the plots showed that experimental values of
sample FE at 35oC (4.309 Mg/L) was close to the measured value (4.363 Mg/L) and that of sample DE at 45
oC
(3.917 Mg/L) was also close to the measured value (3.907 Mg/L). The difference between the measured and
experimental values for zero order kinetics of both sample were insignificant (P>0.05). This show that the zero-
order modelling of TS reduction is better fitted at 35oC for sample FE and 45
oC for sample DE.
Meanwhile, the first-order kinetic shows that the rate constants of samples FE and DE varied between
0.086-0.238 D-1
and 0.131-0.331 D-1
respectively. The correlation coefficients of the plots have values greater
than 0.9 in both samples. The highest in each case were 0.996 at 35oC for sample FE and 0.955 at 45
oCfor
sample DE. The experimental values of sample FE at 45oC and 35
OC (4.315 And 4.674 Mg/L) were both close
to the measured value 4.363 Mg/L, while that of sample DE also at 35oC AND 45
OC (3.955 and 4.225 Mg/L)
compared well with the measured value of 3.903 Mg/L. The difference between the measured and experimental
values of first order kinetics for both sample were insignificant (P>0.05).
At 50% dilution of the samples, the TS kinetic modeling for sample FE showed that first order model
was better fitted at 35oC, 45
OC and 65
OC but at 55
oC zero order models was better fitted. However, those of
sample DE were better fitted at 35oC and65
oC with zero order models but at 45
oC and 55
OC the first order
model were better fitted.
Figures 9 To 12 show the graphs of zero-order and first-order kinetics of undiluted samples of FE and
DE with 10 g immobilized bacteria respectively. The rate constants of the zero-order kinetic were determined;
and were ranged between 0.095-0.313 Mg/L/Day and 0.036-0.957 Mg/L/Day for samples FE and DE
respectively. The highest value in each sample was at 35oC. The correlation coefficients varied between 0.676-
Page 11
Bioremediation Process of Effluent from Detergent and Food Industries in Jos, Nigeria: Kinetics
www.ijesi.org 72 | Page
0.957 and 0.903-0.992 for sample FE and DE respectively; the highest was at 35oc for sample FE and 45
oC for
sample DE. None of the experimental values of sample FE were close to the measured value but sample DE at
35oC (5.576), 45
oC (5.562) and 55
oC (5.652) were all close to the measured value of 5.961 Mg/L. The statistical
t-test analysis showed that the difference between the measured and experimental values of zero order kinetics
for sample FE were significant (P<0.05) while those of sample DE were insignificant (P>0.05).
However, the rate constants of the first-order kinetic study were ranged between 0.022-0.096 D-1
and
0.015-0.361 D-1
for samples FE and DE respectively; the highest rate constant in both samples was at 35oC. This
indicates that living organism perform better at room temperature. The correlation coefficients at 35oC 0.934
and 65oC 0.951 have higher values for sample FE while those of sample DE were higher than 0.95. The
experimental values of the plots for sample FE at all temperatures were not comparable with the measured
value. But those of sample DE at 45oC (5.692 Mg/L) and 55
oC (6.246) were close to the measured value 5.961
Mg/L. The statistical t-test analysis showed that showed that the difference between the measured and
experimental values of first order kinetics for sample FE were significant (P<0.05) DE were insignificant
(P>0.05).
Using 10 g of immobilised biomass, the kinetic modelling of TS removal indicated that at 35oC, 55
OC
and 65OC zero order models had higher correlation as compared to those of its corresponding values from the
first order models. At 45oC the first order model was better fitted. However, sample DE had better kinetic model
as first order at 35oC, 45
OC asnd 55
OC but zero order model was better fitted at 65
oc.
3.5 Thermodynamics Study
The effect of temperature on bioremediation process leads to the study of its thermodynamic as it is
essential to know the spontaneousity of the removal of various contaminants in both effluents. The Values of the
entropy change (∆S) and enthalpy (∆H) were positive and large for both samples which signify chemisorptions.
It could be observed that ΔH was all positive for all systems which confirmed favorability of the processes. It
has been observed that the heat evolved during physisorption generally lies in the range of 2.1-20.9 Kjmol-1
,
while the heat of chemisorption falls into a range of 80-200kjmol-1
[32].This indicated that the bioreaction is
endothermic but the feasibility of the removal of TS were very small at temperature region from 308 to 318K
because the Gibb‟s Free Energy (∆G) were positive in both samples. The positive values of ΔS are an indication
of an increased disorderliness and randomness at the bacteria–solution interface. ∆G decreases in magnitude
from +8.981 to -8.064KJ/Molfor temperature range from 308 to 338K. At a higher temperature of 328 and
338K, the bioreaction became feasible and spontaneous as the ∆G values changed to negative. The ΔG values
which were all positive decreased with increasing in temperature. Although, the process was not spontaneous, it
can be improved upon by increasing the temperature. This is in agreement with the result presented in the
similar work of Omar andAl- Itaw[33].
IV. Conclusion The following conclusions were made from the results and the discussion:
i. The result revealed that the values of TS in both effluent samples FE and DE were lower than the standard
tolerance limits.
ii. The characterisation and biochemical tests of the isolated organisms revealed that the most active organisms
were Pseudomonas Aeruginosain sample FE andBacillus Subtilisin sample DE.
iii. The bioremediation of Food and Detergent Effluents by Pseudomonas Aeruginosa and Bacillus
Subtilisrespectively showed a significant reduction of the TS level in the effluents making the effluents safe
for discharge into environment.
iv. Biological treatment of these effluents was carried out at different time intervals in order to study the rate of
bioremediation. Data obtained at each interval were subjected to zero and first order kinetic models. The
results revealed that both models were well fitted for bioremediation process but first-order kinetic model
provide a better approximation for the rate of removal of TS.
v. The results obtained from the rate experiment were used to study the thermodynamics of bioremediation
process. It was found that the process was faster as the temperature was increasing; revealing that
temperature is a very important factor of bioremediation. The removals of TS were endothermic i.e. positive
enthalpy change and thermodynamically stable since increase in temperature increases the spontaneity of
bioremediation process.
References
Page 12
Bioremediation Process of Effluent from Detergent and Food Industries in Jos, Nigeria: Kinetics
www.ijesi.org 73 | Page
[1]. E. J. Bouwerand A. J. B. Zehnder, Bioremediation of Organic Compounds-Putting Microbial Metabolism to work, Trends Biotech,11(8), 1993, 360-
367.
[2]. S. Ranenand C. Sharadinadra, Biotechnology Applications to Environmental Remediation in Resource Exploitation,Current Science, 97, 2009, 6-25.
[3]. H. Baheri, and P. Meysami, Feasibility of Fungi Bioaugmentation in Composting a Flare Pit Soil,Journal ofHazardous Materials, 89, 2002, 279–286.
[4]. M. S. Bruines, S. Kapil, and F. W. Ochne, Microbial Resistance to Metals in the Environment, Ecotoxicology Environmental Safety
EnvironmentalResearch.45, 2000, 198-207.
[5]. FEPA. “Guidelines and Standards for Environmental Pollution Control in Nigeria”. Federal Environmental Protection Agency Nigeria. 1991.
[6]. NAFDAC. (National Agency for Food and Drug Administration and Control) Commission Consumer Bulletin, 2001. 1, 9.
[7]. R. Jiunkins, Pretreatmentof Textile Waste Water,Proc. 37thIndustrial Waste Conference Purdue Uni. Lafayette, Ind. 1982, 37-139
[8]. D. Wesenberg, I, Kyriakides, and S. N. Agathos, White-Rot Fungi and Their Enzymes for the Treatment of Industrial Dye Effluents, Journal
ofBiotechnology Advance,22, 2003, 161-187.
[9]. WHO, Air Quality Guidelines (World Health Organization, Europe Regional Office, Copenhagen, 2006
[10]. WHO, Water Treatment and Pathogen Control; Process Efficiency in Achieving Safe Drinking Water(IWAPublication,UK, 2004, Pp. 1890)
[11]. J. C. Akan, V. O. Ogugbuaja, F. I. Abdulrahman, and J. T. Ayodele, Pollutant Levels in Effluent Samples from Tanneries and Textiles of Kano
industrial areas, Nigeria,Global Journal of Pure and Applied Sciences,15(3), 2009, 343-352
[12]. E. Hwang, W. Namkoog, and J. Park, Recycling of Remediated Soil for Effective Composting of Diesel- Contaminated Soil,Compost Science and
Utilization, 2001, 143-149.
[13]. T. V. Ojumu, O. O. Bello, J. A. Sonibare, and B. O. Solomon, Evaluation of Microbial Systems for Bioremediation of Petroleum Refinery Effluents in
Nigeria,African Journal of Biotechnology, 4(1), 2005, 31-35.
[14]. A. Iqbal, Z. Shaheen, and A.Farah, Heavy Metal BiosorptionPotential of Aspergillusand RhizopusSp. Isolated from Wastewater Treated Soil, J. Appl.
Sci. Environ Mgt,9 (1), 2005, 123–126.
[15]. E. A. Bassim, and D. S. Walid, Kinetics of Indigenous Isolated Bacteria used for Ex-Situ BioremediationOfPetroleum Contaminated Soil,Water Air
Soil Pollution, 192, 2008, 221-226
[16]. O. V. Akpoveta, F. Egharevba, and O. W. Medjor, A Pilot Study on the Biodegradation of Hydrocarbon and its Kinetics on Kerosene Simulated Soil,
International Journal of Environmental Science, 2(1),2011.
[17]. G. B. Adebayo, G. A. Otunola, and T. A. Ajao, Assessment and Biological Treatment of Effluent from Textile Industry,African Journal
ofBiotechnology,9(49), 2010, 8365- 8368.
[18]. APHA. Standard Methods for Examination of Waste and Wastewater(15th Edition. Brydpass Springfield, Washington DC, 1989) 164-176.
[19]. C. M. Ademoroti, A Standard Methods for Water and Effluent Analysis (1st Edition, 1996) 20-50.
[20]. Fawole, M. O.; Oso, B. A. Laboratory Manual of Municipal of Microbiology.Spectrum Books Limited, 1988.
[21]. A. T. Ajao, G. B. Adebayo and S. E. Yakubu, Bioremediation of Textile Industrial Effluent Using Mixed Culture of Pseudomonas Aeruginosaand
Bacillus SubtilisImmobilized on Agar-Agar in a Bioreactor J. Microbiol. Biotech. Res.1(3), 2011, 50-56
[22]. P. Ellaiah, K. Adinarayana, and B. Jyothi, AAPS PharmaSci Tech, 6(03), 2005, 391-397
[23]. R. Margesin, and F. Schinner, Bioremediation (Natural Attenuation and Biostimulation) of Diesel-Oil-Contaminated Soil in an Alpine Glacier Skiing
Area, Applied and Environmental Microbiology,67(7),2001, 3127-3133.
[24]. L. Charerntanyarak, Heavy Metals Removal by Chemical Coagulation and Precipitation,Water Science and Technology,39, 1999, 135-138.
[25]. J. A. Dyer, N. C. Scrivner, and S. K.Dentel, A Practical Guide for Determining the Solubility of Metal Hydroxides and Oxides in Water, Environ.
Prog.171, 1998. 1–8.
[26]. S. Moslem, R. Zohreh, I. Javid, M. Abbas, and R. Tahsin, Water Quality Assessment of the Zarivar Lake Using Physico-Chemical Parameters and
NSF- WQI Indicator, Kurdistan Province-Iran,International Journal of Advanced Biological and Biomedical Research, 1(3), 2013, 302-312.
[27]. W. Jianlong, Z. Xinmin, D. Decai, Z. J. Ding, Biosorptionof Lead (II) from Aqueous Solution by Fungal Biomass of AspergillusNiger. Biotechnol.87,
2001, 273-277.
[28]. L. Gianfreda, and M.A. Rao, Potentia1 of Extra Cellular Enzymes in Remediation: A Review, En:YmeMicrob. Technol, 35, 2004, 339-354.
[29]. P. D. Fuilbrook, "Kinetics."Industrial Enzymology: The Application of EnzymesinIndustry (2nd Ed. T. Godfrey andJ. Reichelt. Eds. Nature. New York,
1996).
[30]. A. J. Russell, J. A. Berberich, G. F. Drevon, R. R. Koepsel, Biomaterials for Mediation of Chemical and Biological Warfure Agents,Biomed Eng, 5,
2003, 1-27.
[31]. A. Kandelbauer, O. Maute, R.W. Kessler, A. Erlacher, and G. M. Gubitz, Study of Dye Decolourization in an Immobilized Lactase Enzyme-Reactor
Using Online Spectroscopy,Bioethanol Bioeng., 87(4), 2004, 552-563.
[32]. Y. Liu, And Y. J. Liu, BiosorptionIsotherms, Kinetics and Thermodynamics,Sep. Purif. Technol., 61(3), 2008, 229–242.
[33]. Omar, W.; Al-Itaw, H. Amer. J. Appl. Sci., 2007. 4(7), 502-507
Akeem Adebayo Jimoh"Bioremediation Process of Effluent from Detergent and Food
Industries in Jos, Nigeria: Kinetics and Thermodynamics"International Journal of
Engineering Science Invention (IJESI), vol. 07, no. 03, 2018, pp62-73