The author hereby grants to MIT permission to reproduce
and to distribute publicly paper and electronic copies of this thesis document in whole or in part.
Signature of Author: Department of Civil and Environmental Engineering
May 11, 2001
Certified by: Susan E. Murcott
Lecturer of Civil and Environmental Engineering Thesis Supervisor
Accepted by:
Oral Buyukozturk Chairman, Committee for Graduate Students
BioSand Household Water Filter in Nepal Abstract
2
BIOSAND HOUSEHOLD WATER FILTER PROJECT IN
NEPAL
by
Tse-Luen Lee
Submitted to the Department of Civil and Environmental Engineering on May 11, 2001 in partial fulfillment of the requirements for the degree of Master of Engineering in Civil and
Environmental Engineering
Abstract
This purpose of this study was to investigate the effectiveness and the performance of the BioSand filter in Nepal. To achieve this, the author undertook a field trip to Nepal in January, 2001. The trip was made possible with generous support provided by the Department of Civil and Environmental Engineering of MIT. The author spent 3 weeks in Nepal - 4 days in the vicinity of Tansen in the central Palpa region and 9 days in the Nawalparasi district in the Terai collecting water samples. Turbidity measurements were taken and presence/absence tests for total coliform, E.coli and H2S producing bacteria were carried out. At MIT, membrane filtration tests were also carried out. This study found that while filtered water from the BSFs in Nepal has low turbidity and flows at a sufficiently high rate, only 9 out of 12 properly functioning BSFs removed total coliform and 10 out of 12 properly functioning BSFs removed E. coli. Membrane filtration tests carried out in MIT indicate that the BSF technology is effective at removal of total coliform with an average removal of 99.5% of total coliform in the source water. Based on the effectiveness of the BSF in removing microbial contamination, the author recommends the BSF technology to be adopted on a large scale in Nepal, but only if it is coupled with a monitoring plan to ensure correct construction, operation and maintenance procedures are followed. A monitoring plan is necessary to reduce the fraction of BioSand filters that were not working properly. Supervised by: Susan E. Murcott Title: Lecturer of Civil and Environmental Engineering
3
ACKNOWLEDGMENTS
Thanks to all the people who have helped me through my graduate career, including the
following:
Thesis supervisor, Susan Murcott, who offered invaluable advice and guidance all the way
from the start of the project till the day this thesis was handed in, and who took time to
meticulously read through numerous drafts;
Faculty advisor, Dr. Eric Adams, who gave me the flexibility to choose the subjects that
stimulate my learning in this institute;
The Nepal group a.k.a. Naiad Engineering for making my stay in Nepal unforgettable: Nat,
Meghan, Tim, and Jessie;
Friends who kept me sane and made living in Cambridge enjoyable: Kirill, Fiona, Shan, Thor,
Thomas Moore, Takashi, Shao-Hwei, Anthony, Wesley, Woody, Romeo, Win, William,
Nadine, Tee and many more;
Friends we met in Nepal: Kaanchu, Tili and others at the luxurious Hotel White Lake in
Tansen;
Friends back home in Singapore whom I have temporarily ignored while working on this
thesis, for their kind understanding;
Xin-Yun, for her support during the stressful times;
Most importantly, to my parents and family, who have always been behind me.
4
This thesis is dedicated to the many kind people Nat and I met in Nepal, including
the young boy who sat in our jeep as we went around Tansen in search for the next
BioSand filter. I sincerely hope that this thesis will, in some way, contribute to the
betterment of their lives.
BioSand Household Water Filter Project in Nepal Table of Contents
5
TABLE OF CONTENTS
1 INTRODUCTION........................................................................................................11 1.1 Purpose of Study ............................................................................................... 12
1.2 A Brief History of Slow Sand Filters................................................................ 13
1.3 History of The BioSand Filter........................................................................... 17
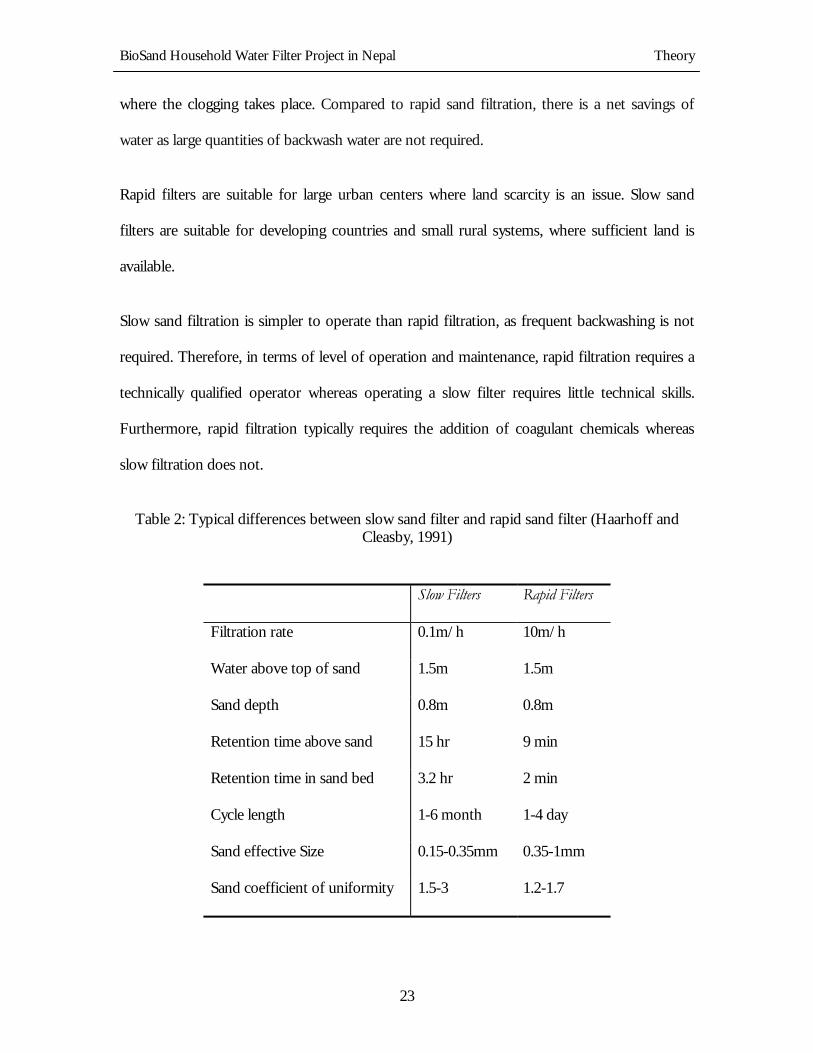
2 THEORY.......................................................................................................................22 2.1 Contrast Between Slow Sand Filter and Rapid Sand Filter .............................. 22
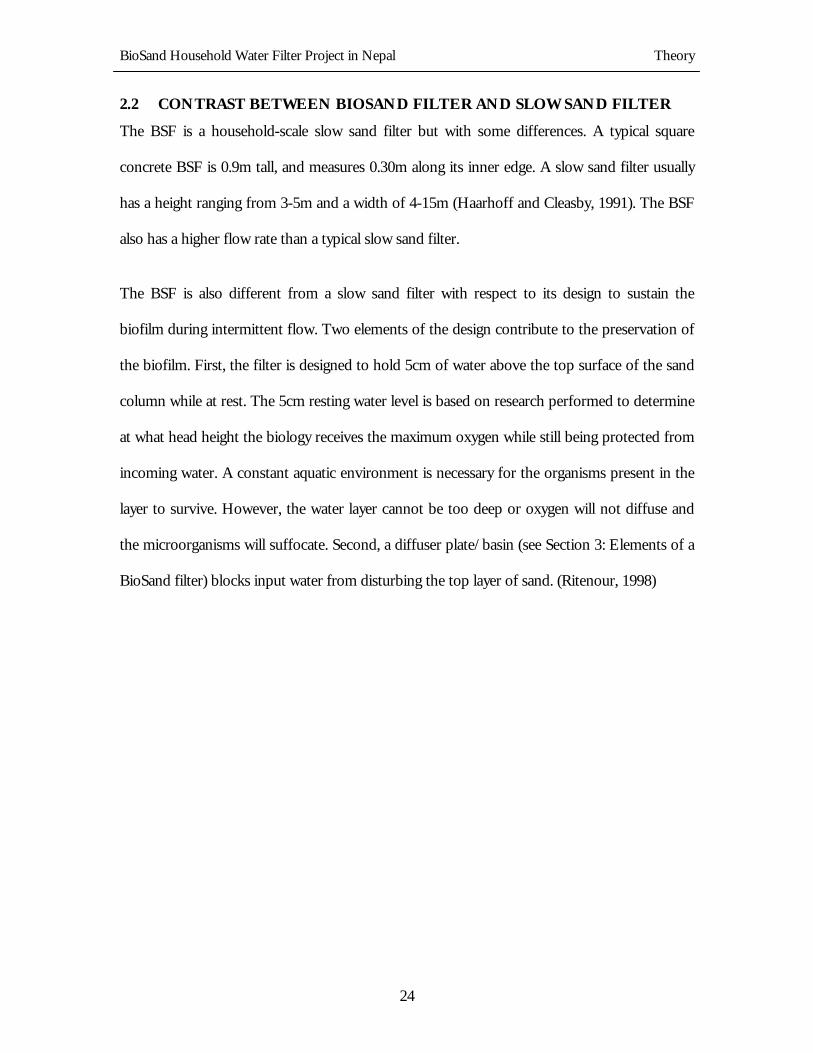
2.2 Contrast Between BioSand Filter and Slow Sand Filter................................... 24
2.3 The Schmutzdecke ............................................................................................ 25
3 ELEMENTS OF A BIOSAND FILTER...................................................................31 3.1 Concrete Body/Shell ......................................................................................... 32
6 EXPERIMENTS CARRIED OUT AT MIT ............................................................73 6.1 Membrane Filtration ......................................................................................... 73
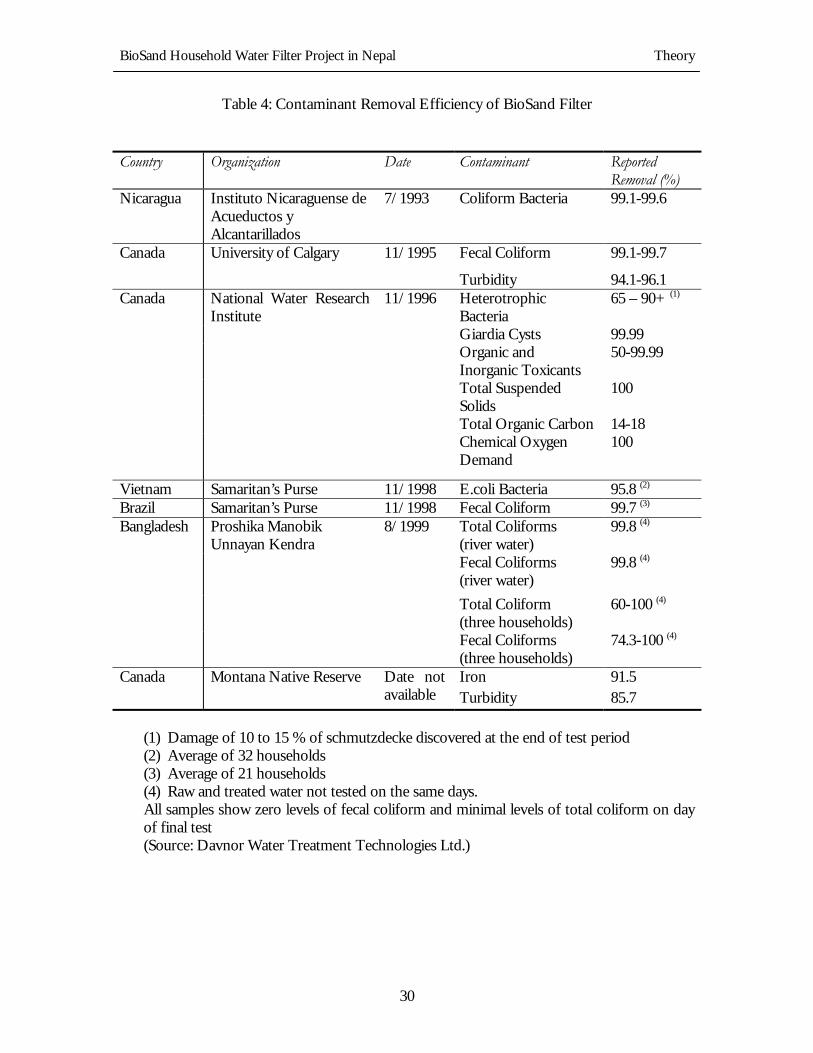
Brazil Samaritan’s Purse 11/1998 Fecal Coliform 99.7 (3)
Total Coliforms (river water)
99.8 (4)
Fecal Coliforms (river water)
99.8 (4)
Total Coliform (three households)
60-100 (4)
Bangladesh Proshika Manobik Unnayan Kendra
8/1999
Fecal Coliforms (three households)
74.3-100 (4)
Iron 91.5 Canada Montana Native Reserve Date not available Turbidity 85.7
(1) Damage of 10 to 15 % of schmutzdecke discovered at the end of test period (2) Average of 32 households (3) Average of 21 households (4) Raw and treated water not tested on the same days. All samples show zero levels of fecal coliform and minimal levels of total coliform on day of final test (Source: Davnor Water Treatment Technologies Ltd.)
BioSand Household Water Filter Project in Nepal Elements of a BioSand Filter
31
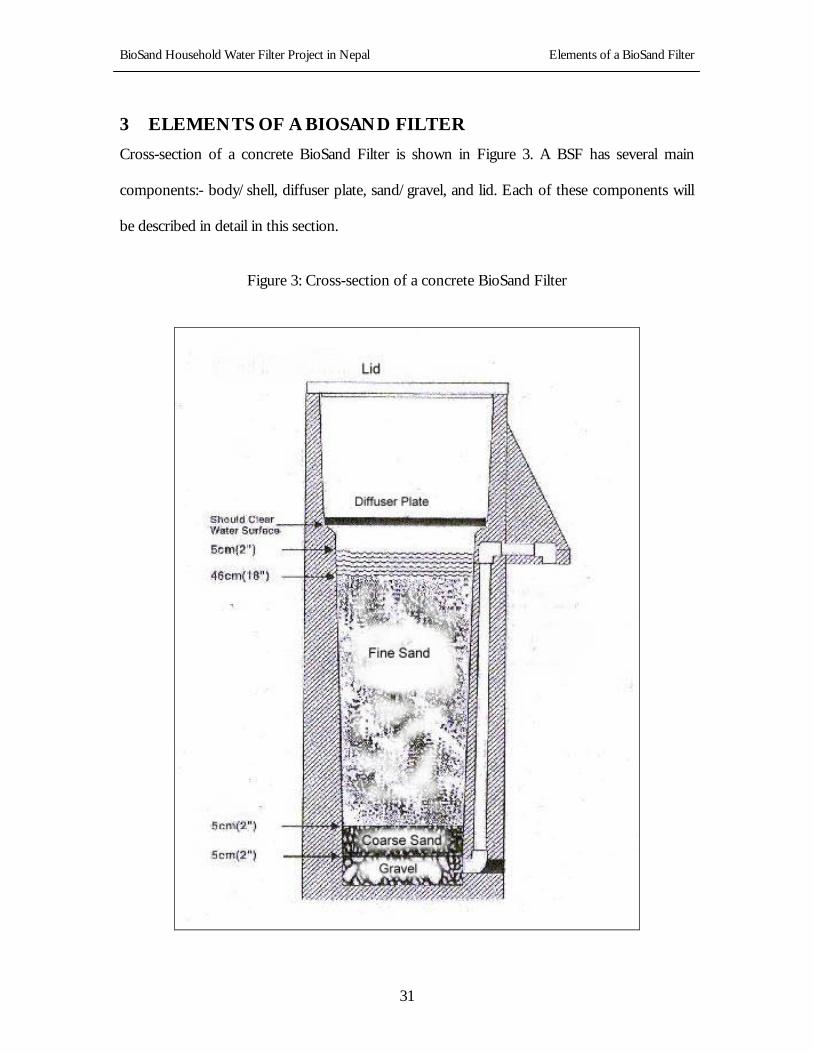
3 ELEMENTS OF A BIOSAND FILTER
Cross-section of a concrete BioSand Filter is shown in Figure 3. A BSF has several main
components:- body/shell, diffuser plate, sand/gravel, and lid. Each of these components will
be described in detail in this section.
Figure 3: Cross-section of a concrete BioSand Filter
BioSand Household Water Filter Project in Nepal Elements of a BioSand Filter
32
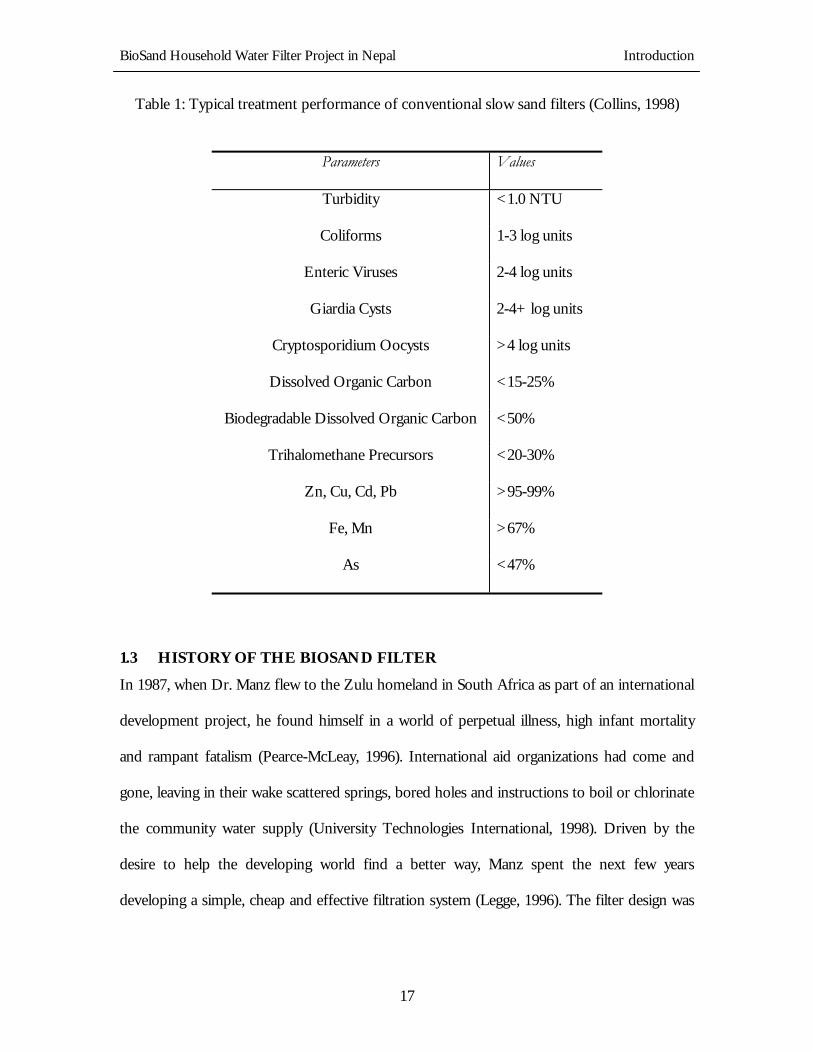
Table 5: BSF Design Parameters
Design Parameter Value Fine Sand Size <1mm
Coarse Sand Size 1mm – 6mm Underdrain Gravel Size 6mm – 15mm Surface Area of Sand 540m2
Initial Flow Rate 1L/min ± 30% BSF Size 30cm x 30 cm x 90cm
3.1 CONCRETE BODY/SHELL
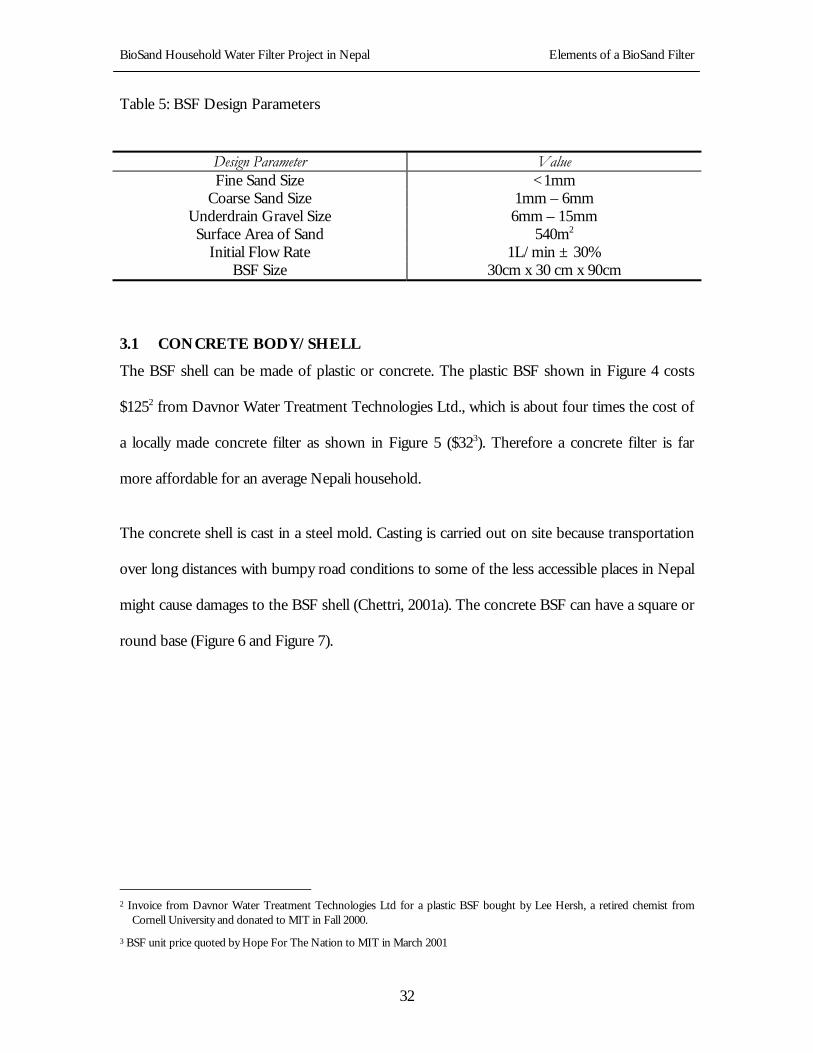
The BSF shell can be made of plastic or concrete. The plastic BSF shown in Figure 4 costs
$1252 from Davnor Water Treatment Technologies Ltd., which is about four times the cost of
a locally made concrete filter as shown in Figure 5 ($323). Therefore a concrete filter is far
more affordable for an average Nepali household.
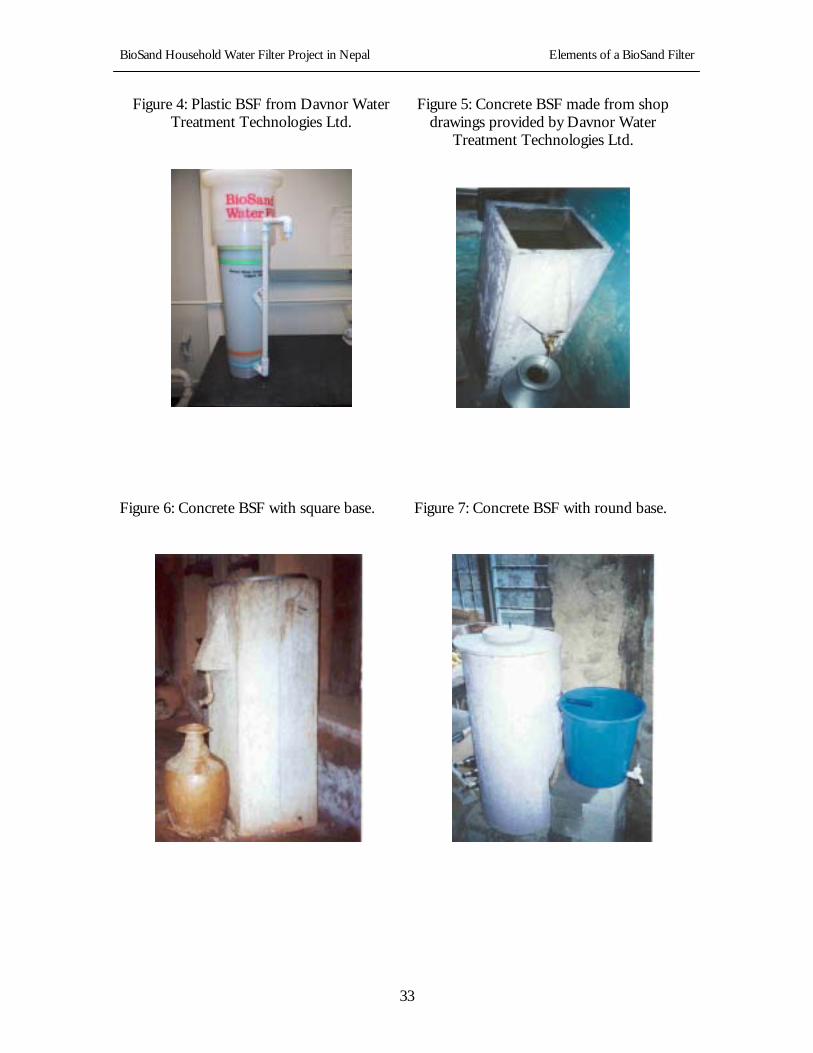
The concrete shell is cast in a steel mold. Casting is carried out on site because transportation
over long distances with bumpy road conditions to some of the less accessible places in Nepal
might cause damages to the BSF shell (Chettri, 2001a). The concrete BSF can have a square or
round base (Figure 6 and Figure 7).
2 Invoice from Davnor Water Treatment Technologies Ltd for a plastic BSF bought by Lee Hersh, a retired chemist from
Cornell University and donated to MIT in Fall 2000.
3 BSF unit price quoted by Hope For The Nation to MIT in March 2001
BioSand Household Water Filter Project in Nepal Elements of a BioSand Filter
33
Figure 4: Plastic BSF from Davnor Water Treatment Technologies Ltd.
Figure 5: Concrete BSF made from shop drawings provided by Davnor Water
Treatment Technologies Ltd.
Figure 6: Concrete BSF with square base.
Figure 7: Concrete BSF with round base.
BioSand Household Water Filter Project in Nepal Elements of a BioSand Filter
34
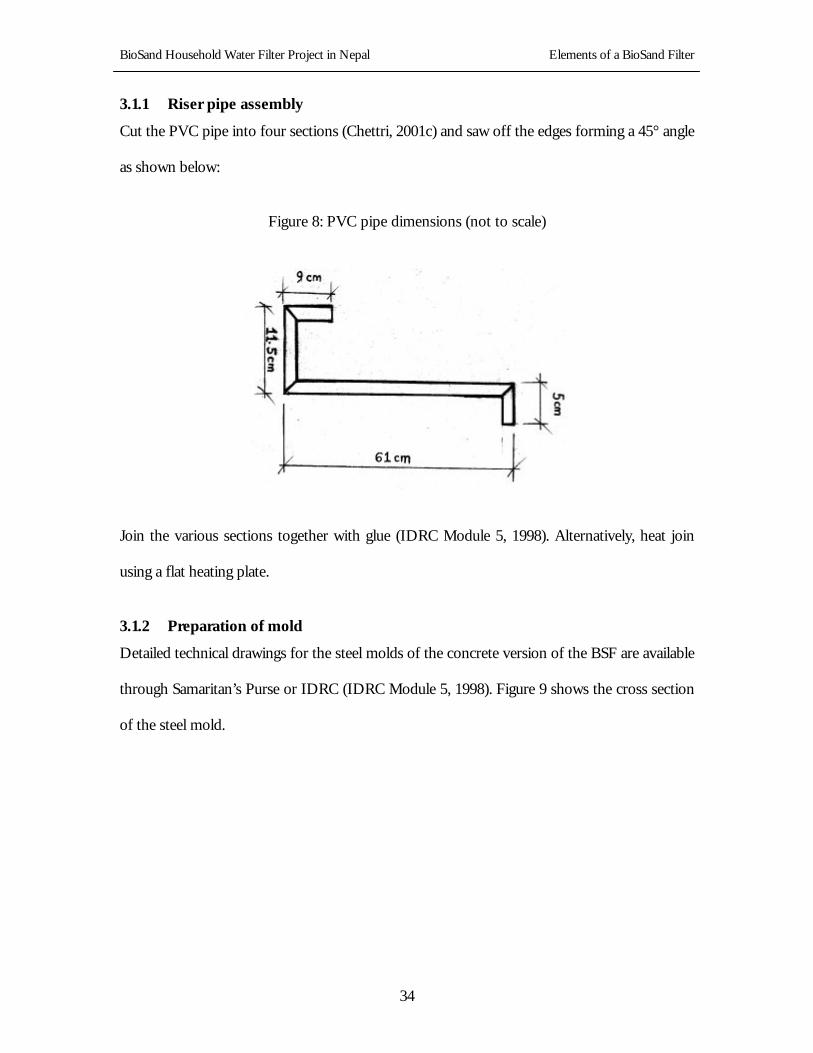
3.1.1 Riser pipe assembly
Cut the PVC pipe into four sections (Chettri, 2001c) and saw off the edges forming a 45° angle
as shown below:
Figure 8: PVC pipe dimensions (not to scale)
Join the various sections together with glue (IDRC Module 5, 1998). Alternatively, heat join
using a flat heating plate.
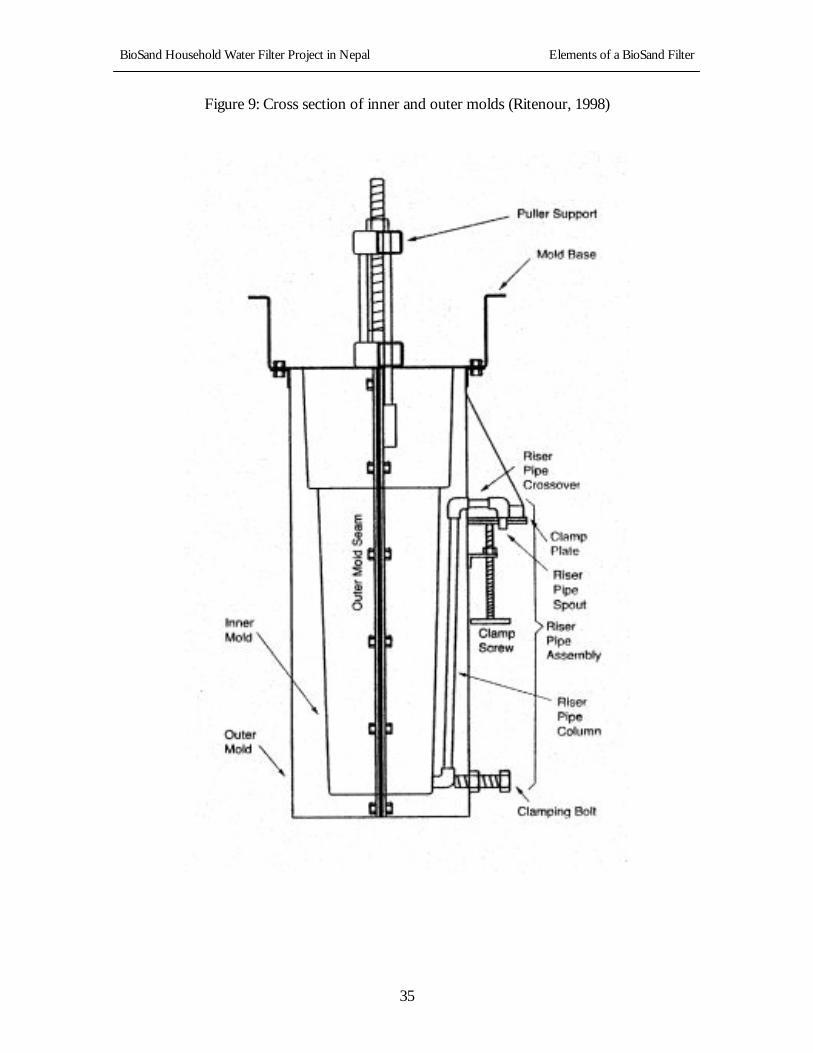
3.1.2 Preparation of mold
Detailed technical drawings for the steel molds of the concrete version of the BSF are available
through Samaritan’s Purse or IDRC (IDRC Module 5, 1998). Figure 9 shows the cross section
of the steel mold.
BioSand Household Water Filter Project in Nepal Elements of a BioSand Filter
35
Figure 9: Cross section of inner and outer molds (Ritenour, 1998)
BioSand Household Water Filter Project in Nepal Elements of a BioSand Filter
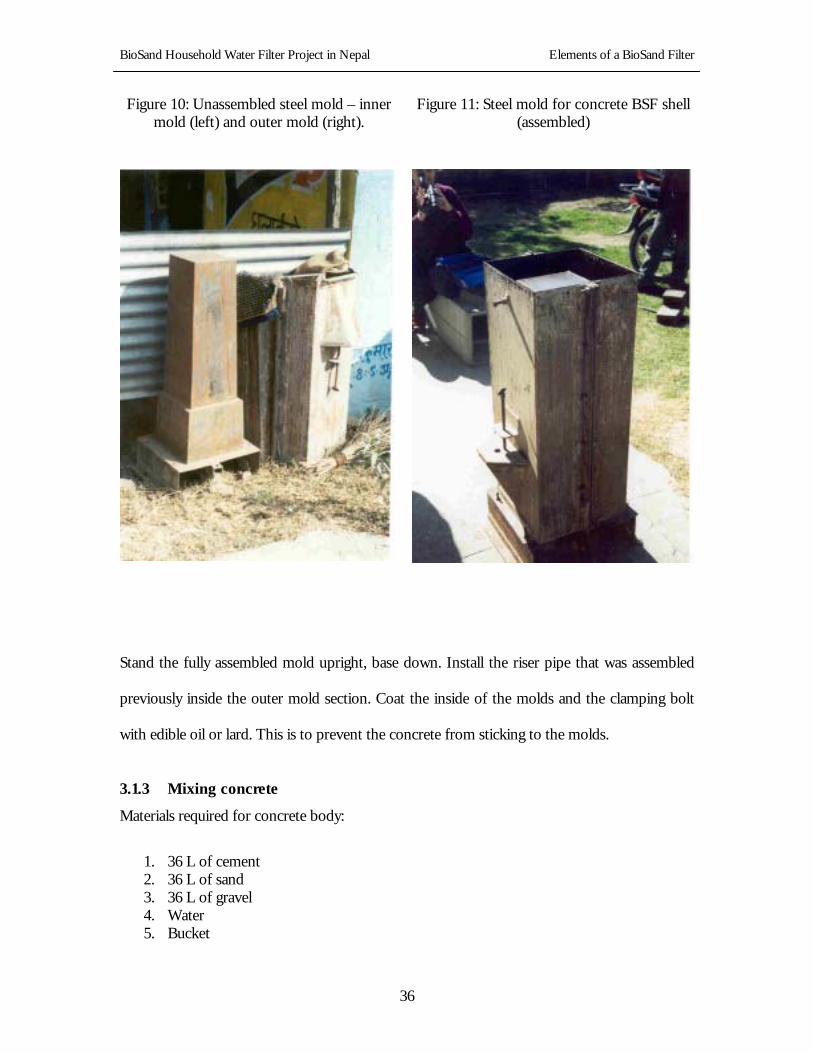
Figure 11: Steel mold for concrete BSF shell (assembled)
Stand the fully assembled mold upright, base down. Install the riser pipe that was assembled
previously inside the outer mold section. Coat the inside of the molds and the clamping bolt
with edible oil or lard. This is to prevent the concrete from sticking to the molds.
3.1.3 Mixing concrete
Materials required for concrete body:
1. 36 L of cement 2. 36 L of sand 3. 36 L of gravel 4. Water 5. Bucket
BioSand Household Water Filter Project in Nepal Elements of a BioSand Filter
37
6. Shovel 7. Mixing tray/slab or wheel barrow 8. Steel or wood rod 9. Piece of wood (to use as a trowel)
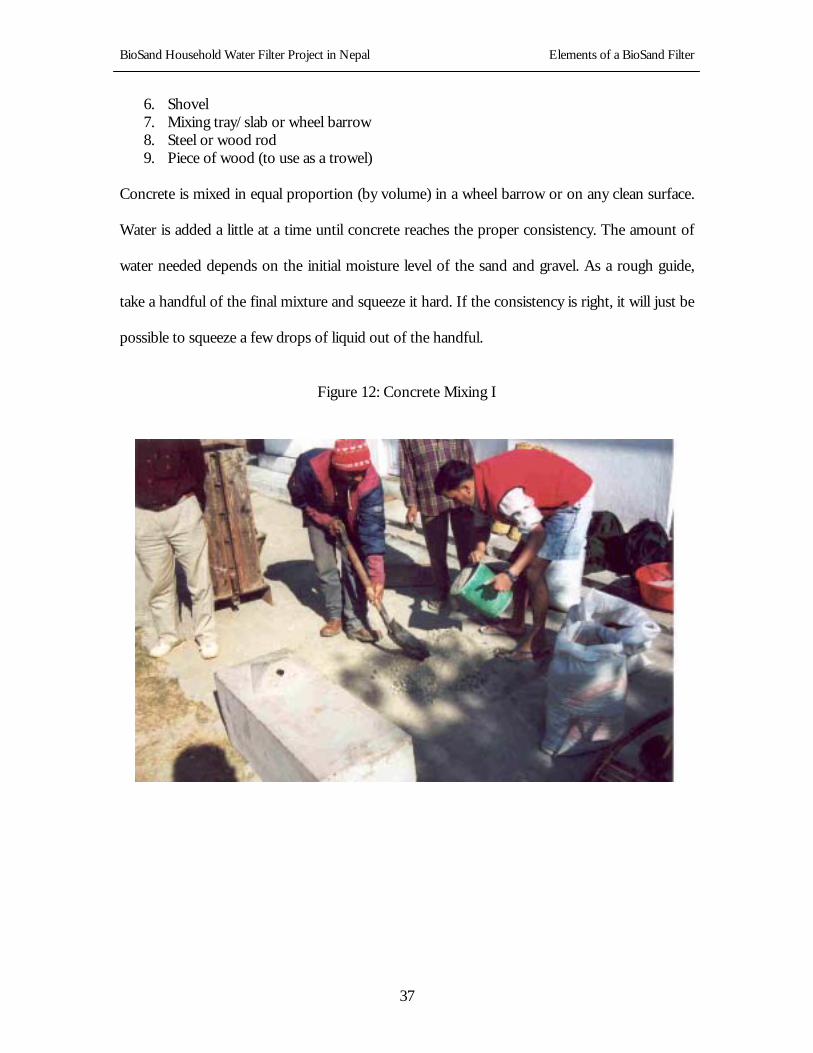
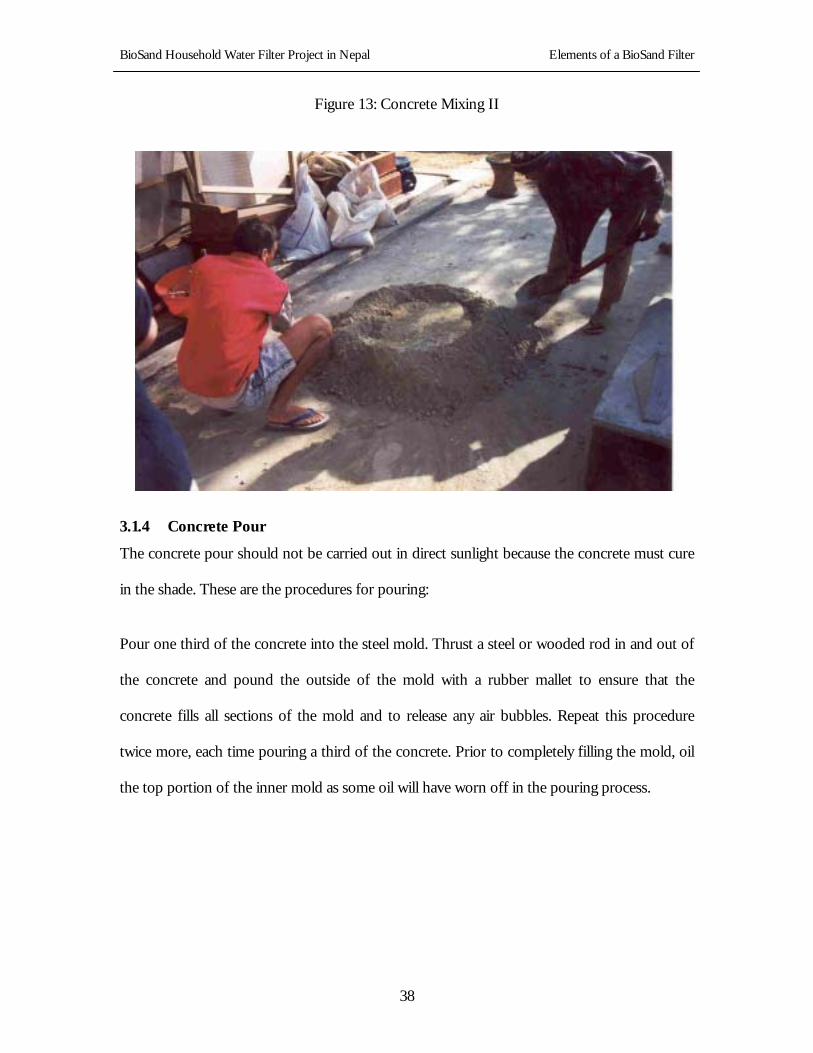
Concrete is mixed in equal proportion (by volume) in a wheel barrow or on any clean surface.
Water is added a little at a time until concrete reaches the proper consistency. The amount of
water needed depends on the initial moisture level of the sand and gravel. As a rough guide,
take a handful of the final mixture and squeeze it hard. If the consistency is right, it will just be
possible to squeeze a few drops of liquid out of the handful.
Figure 12: Concrete Mixing I
BioSand Household Water Filter Project in Nepal Elements of a BioSand Filter
38
Figure 13: Concrete Mixing II
3.1.4 Concrete Pour
The concrete pour should not be carried out in direct sunlight because the concrete must cure
in the shade. These are the procedures for pouring:
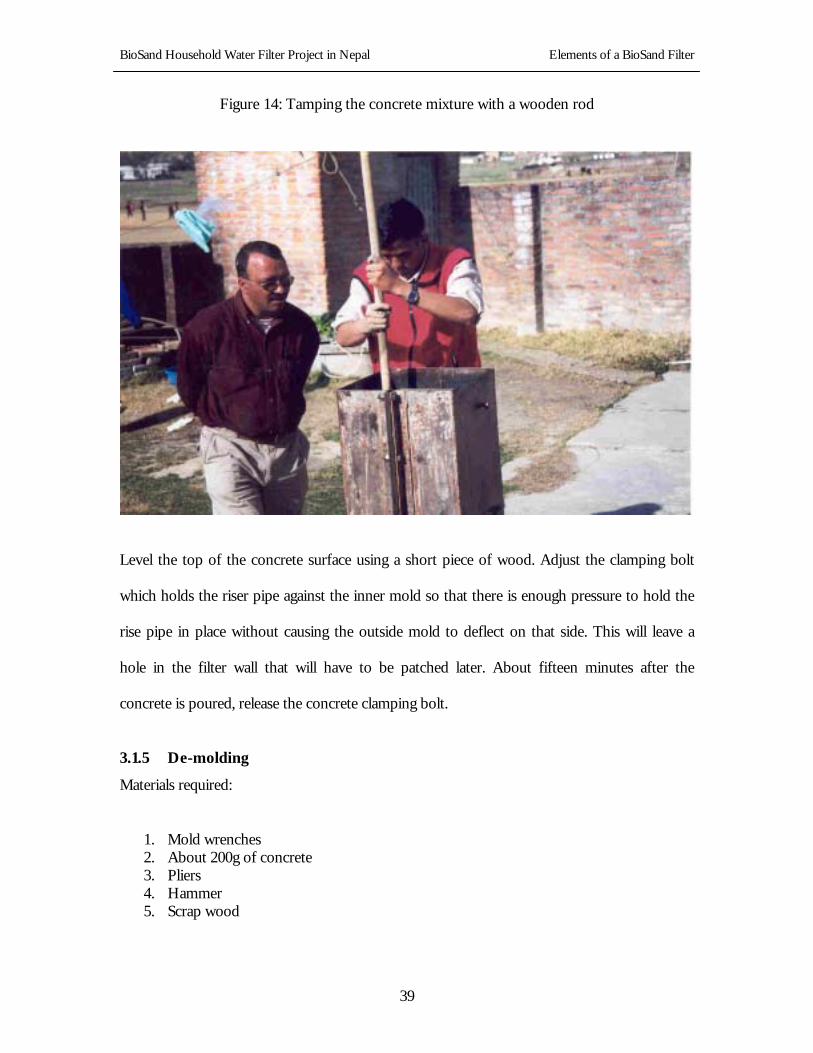
Pour one third of the concrete into the steel mold. Thrust a steel or wooded rod in and out of
the concrete and pound the outside of the mold with a rubber mallet to ensure that the
concrete fills all sections of the mold and to release any air bubbles. Repeat this procedure
twice more, each time pouring a third of the concrete. Prior to completely filling the mold, oil
the top portion of the inner mold as some oil will have worn off in the pouring process.
BioSand Household Water Filter Project in Nepal Elements of a BioSand Filter
39
Figure 14: Tamping the concrete mixture with a wooden rod
Level the top of the concrete surface using a short piece of wood. Adjust the clamping bolt
which holds the riser pipe against the inner mold so that there is enough pressure to hold the
rise pipe in place without causing the outside mold to deflect on that side. This will leave a
hole in the filter wall that will have to be patched later. About fifteen minutes after the
concrete is poured, release the concrete clamping bolt.
3.1.5 De-molding
Materials required:
1. Mold wrenches 2. About 200g of concrete 3. Pliers 4. Hammer 5. Scrap wood
BioSand Household Water Filter Project in Nepal Elements of a BioSand Filter
40
Carefully turn the mold right side up (inner mold legs up). Since the mold, now charged with
concrete, has an enhanced capacity to smash fingers, set a piece of wood down to avoid setting
the mold flat on the ground. Remove the riser pipe clamping-bolt using a wrench. Clean this
bolt and its threading nut with a wire brush after each casting.
Place the puller-support in its slots and screw in the threaded rod. The rod only needs to be
threaded the depth of the base nut. Once in place, hand tighten the floating nut against the
puller-support crossbar. Remove base bolts. Using a wrench, continue to tighten the floating
nut against the crossbar to break the inner mold free. Raise it about 5cm. At this point, the
inner mold should be sufficiently loose for two people to lift it out by hand. If the inner mold
sticks, tap the outer mold with a rubber mallet while tightening the nut. Set the inner mold
aside. Remove the nuts and bolts connecting the two sections of the outer mold. Remove the
riser pipe spout using a pair of pliers. Remove the pour spout clamp plate and gasket.
Starting with the rear outer mold section, use both hands to slowly pull back on the mold base
and remove this section. Pull gently and evenly, avoiding jerking motion. If the mold does not
budge, tap the connection edge (where the halves bolt together) using a piece of wood and a
hammer, alternating from one side to another. Be careful not to strike the concrete with the
hammer and always use a piece of wood. One person should be pulling on the mold while
another is tapping. Remove the front section of the mold.
Using some concrete, patch the hole created by the clamping bolt, any cracks that appear, and
any other significant imperfections in the concrete. Scrape the rough edges off the filter. These
usually occur at the top of the filter and along the two sides where the seam of the outer mold
section was. Scraping should be done while the concrete is still curing.
BioSand Household Water Filter Project in Nepal Elements of a BioSand Filter
41
Keep the filter wet and out of the sun for 2 to 3 days to allow the concrete to cure properly.
Water can be poured in to keep the filter body wet. If it cures too quickly due to sun exposure
or a warm, dry wind, cracking may occur. Clean the mold and all its parts. If an even, debris-
free layer of lard or oil remains on the mold, it may be left for the next casting.
3.2 DIFFUSER PLATE
The diffuser plate is a thin plate with 3mm perforations spaced 2cm apart in a square grid. The
plate rests on the inner ledge above the resting water level. (see Figure 17). The main function
of the diffuser plate/basin is to distribute the fall of the water over the whole filtering surface
to avoid damage to the upper sand layer and the destruction of the biological layer (Module 5,
1998). The diffuser plate/basin also serves to sieve the larger impurities carried by the water,
such as leaves, branches and larger insects.
3.2.1 Materials
The diffuser plate can be made of various common materials such as metal, wood, or plastic.
This flexibility in the choice of materials allows the tailoring of the diffuser plate according to
which material is locally available and therefore the lowest cost. In Nepal, most diffuser plates
are made of galvanized zinc or plastic. A main criterion for the choice of metal is non-
corrosiveness. Figure 15 shows a typical galvanized zinc diffuser plate in Nepal.
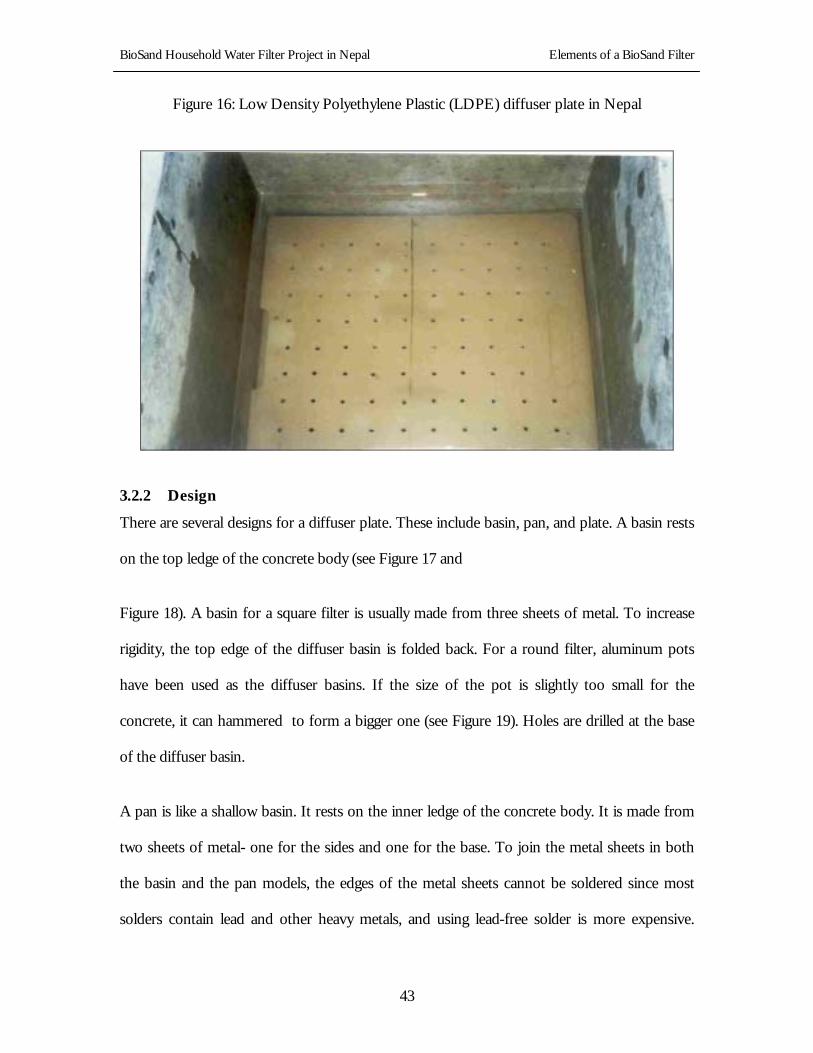
Most plastic diffuser plates in Nepal are made of low density polyethylene (LDPE) cutting
boards, which are widely available in Nepal and locally known as “Korea plastic” (Magar,
2001) (see Figure 16). The design of the Nepali LDPE diffuser plate owes to the ingenuity of
one of the local technicians, Durga Bahadur Ale Magar. He found that the breadth of the
cutting board is about the same as the inner edge of the filter. This simplifies the steps to make
a diffuser plate to just sawing off the length of the cutting board to make a square. To save
BioSand Household Water Filter Project in Nepal Elements of a BioSand Filter
42
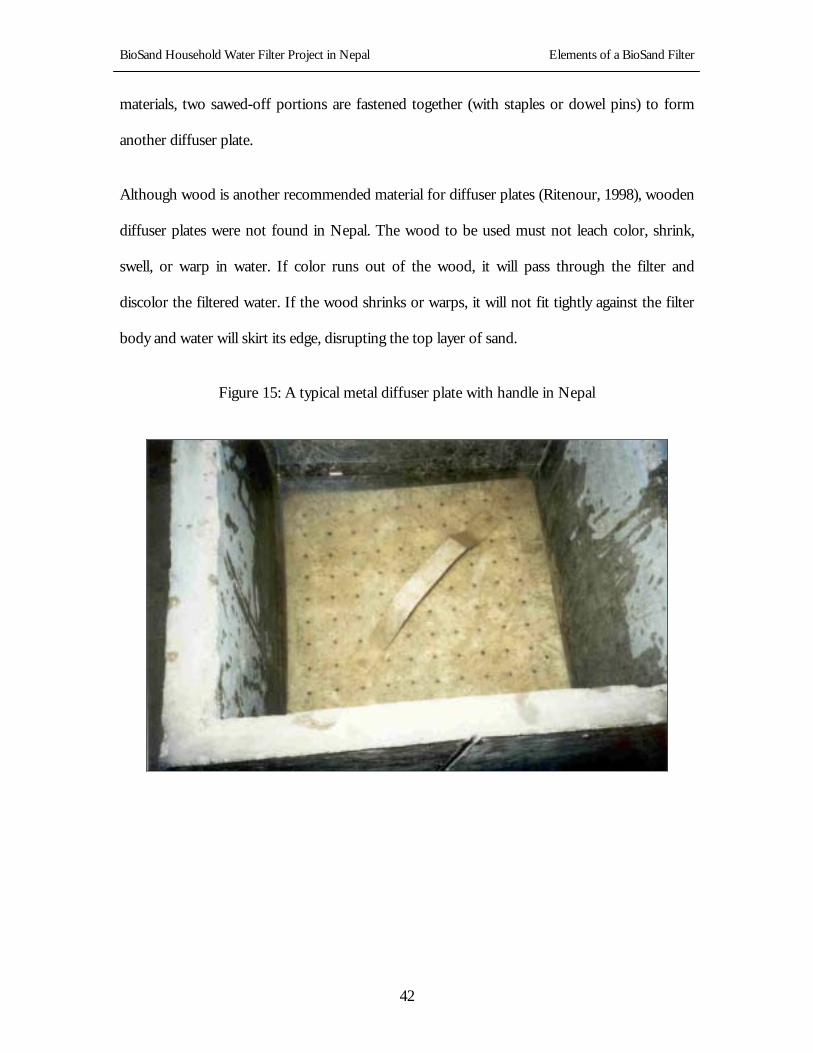
materials, two sawed-off portions are fastened together (with staples or dowel pins) to form
another diffuser plate.
Although wood is another recommended material for diffuser plates (Ritenour, 1998), wooden
diffuser plates were not found in Nepal. The wood to be used must not leach color, shrink,
swell, or warp in water. If color runs out of the wood, it will pass through the filter and
discolor the filtered water. If the wood shrinks or warps, it will not fit tightly against the filter
body and water will skirt its edge, disrupting the top layer of sand.
Figure 15: A typical metal diffuser plate with handle in Nepal
BioSand Household Water Filter Project in Nepal Elements of a BioSand Filter
43
Figure 16: Low Density Polyethylene Plastic (LDPE) diffuser plate in Nepal
3.2.2 Design
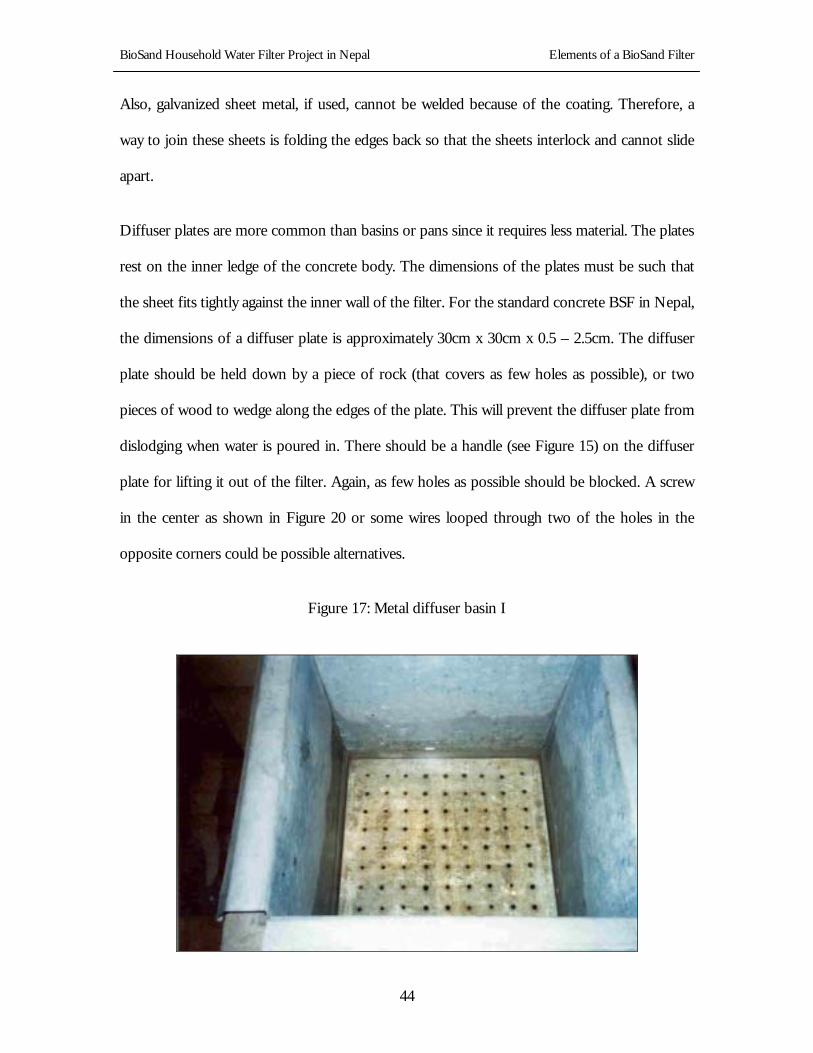
There are several designs for a diffuser plate. These include basin, pan, and plate. A basin rests
on the top ledge of the concrete body (see Figure 17 and
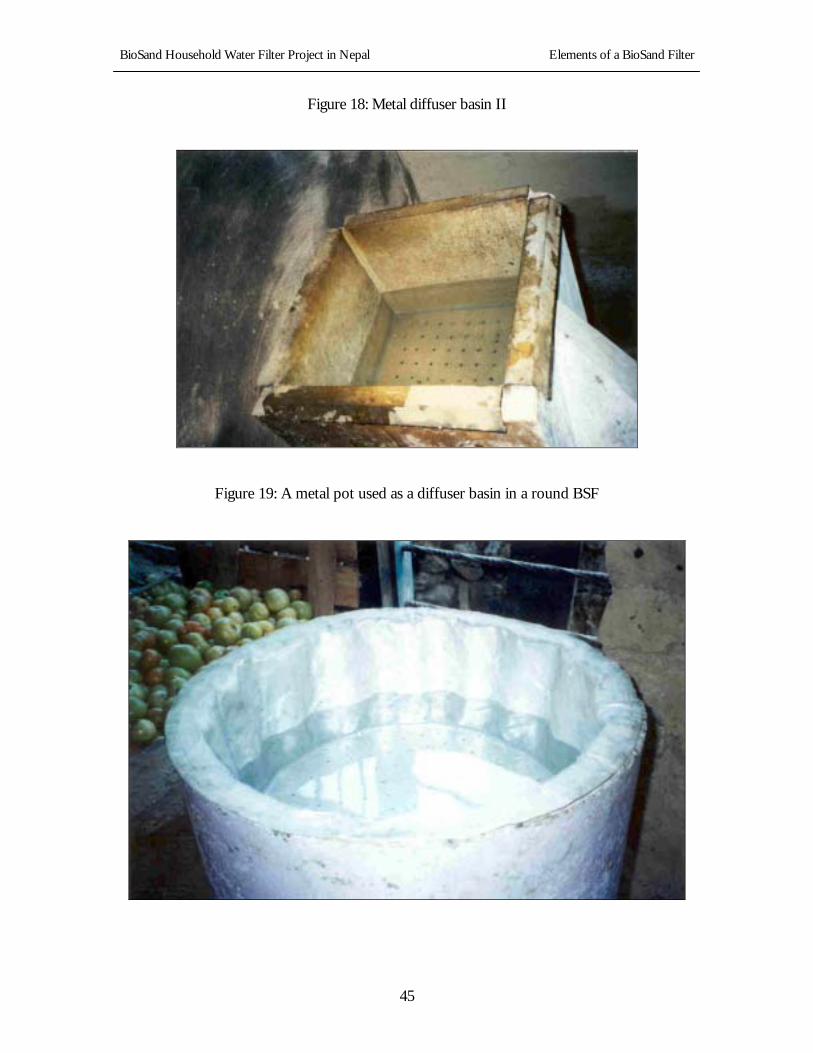
Figure 18). A basin for a square filter is usually made from three sheets of metal. To increase
rigidity, the top edge of the diffuser basin is folded back. For a round filter, aluminum pots
have been used as the diffuser basins. If the size of the pot is slightly too small for the
concrete, it can hammered to form a bigger one (see Figure 19). Holes are drilled at the base
of the diffuser basin.
A pan is like a shallow basin. It rests on the inner ledge of the concrete body. It is made from
two sheets of metal- one for the sides and one for the base. To join the metal sheets in both
the basin and the pan models, the edges of the metal sheets cannot be soldered since most
solders contain lead and other heavy metals, and using lead-free solder is more expensive.
BioSand Household Water Filter Project in Nepal Elements of a BioSand Filter
44
Also, galvanized sheet metal, if used, cannot be welded because of the coating. Therefore, a
way to join these sheets is folding the edges back so that the sheets interlock and cannot slide
apart.
Diffuser plates are more common than basins or pans since it requires less material. The plates
rest on the inner ledge of the concrete body. The dimensions of the plates must be such that
the sheet fits tightly against the inner wall of the filter. For the standard concrete BSF in Nepal,
the dimensions of a diffuser plate is approximately 30cm x 30cm x 0.5 – 2.5cm. The diffuser
plate should be held down by a piece of rock (that covers as few holes as possible), or two
pieces of wood to wedge along the edges of the plate. This will prevent the diffuser plate from
dislodging when water is poured in. There should be a handle (see Figure 15) on the diffuser
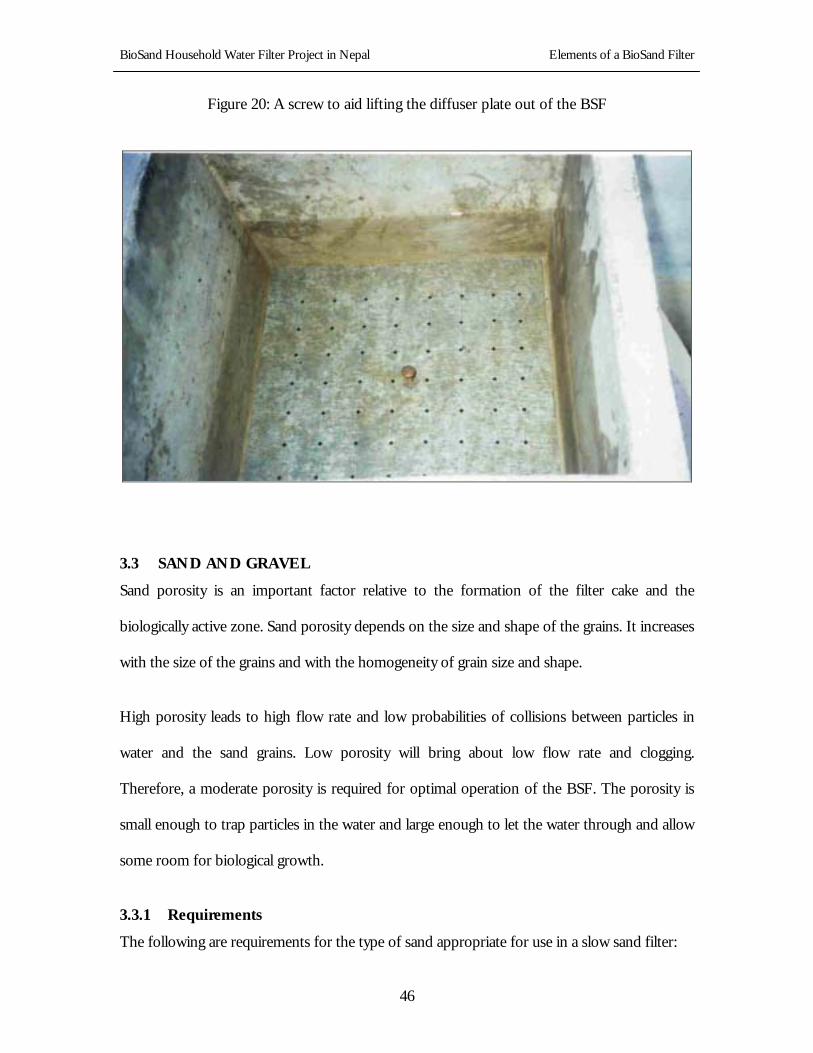
plate for lifting it out of the filter. Again, as few holes as possible should be blocked. A screw
in the center as shown in Figure 20 or some wires looped through two of the holes in the
opposite corners could be possible alternatives.
Figure 17: Metal diffuser basin I
BioSand Household Water Filter Project in Nepal Elements of a BioSand Filter
45
Figure 18: Metal diffuser basin II
Figure 19: A metal pot used as a diffuser basin in a round BSF
BioSand Household Water Filter Project in Nepal Elements of a BioSand Filter
46
Figure 20: A screw to aid lifting the diffuser plate out of the BSF
3.3 SAND AND GRAVEL
Sand porosity is an important factor relative to the formation of the filter cake and the
biologically active zone. Sand porosity depends on the size and shape of the grains. It increases
with the size of the grains and with the homogeneity of grain size and shape.
High porosity leads to high flow rate and low probabilities of collisions between particles in
water and the sand grains. Low porosity will bring about low flow rate and clogging.
Therefore, a moderate porosity is required for optimal operation of the BSF. The porosity is
small enough to trap particles in the water and large enough to let the water through and allow
some room for biological growth.
3.3.1 Requirements
The following are requirements for the type of sand appropriate for use in a slow sand filter:
BioSand Household Water Filter Project in Nepal Elements of a BioSand Filter
47
1. Hard, durable, angular grains free from loam, clay and organic matter. Angular grains
decrease porosity and increase resistance to flowing water.
2. An effective diameter (d10) range of 0.15-0.35mm.
3. A uniformity coefficient (Cu) of less than 3. Uniformity coefficient is a ratio calculated
as the size opening that will just pass 60 percent (by weight) of a representative sample
of the filter material divided by the size opening that will just pass 10 percent (by
weight) of the same sample (Sims and Slezak, 1991). This implies a fairly narrow range
of grain sizes with an almost even distribution between the smallest 10% and the
largest 10% and with most of the grains being a size in the middle. This distribution of
sizes decreases the porosity of the sand, increasing the surface area per volume and the
likelihood of collisions in the top portions of the sand.
3.3.2 Preparation
There are several steps to the preparation of the sand and gravel.
Locating source of gravel and sand
Sand from a crushing operation is pure, clean and relatively uniform in size and shape. It
requires the least preparation and is the best possible sand source. In the absence of a
manufactured source, it is necessary to locate a natural hillside sand deposit. If there are no
other choices, one could use riverbed sand. This is not highly recommended because riverbed
sand could be contaminated from animal wastes. In addition, riverbed sand grains are more
rounded and smooth (as opposed to angular) in their shape, which decreases the effectiveness
in trapping contaminants. Sand from high on a riverbank where there is no visible
contamination should be used in preference to river bottom sand.
BioSand Household Water Filter Project in Nepal Elements of a BioSand Filter
48
Biological quality testing
Each sand source needs to be tested for its biological quality. A sand source that is regularly
used should be tested every 6 months. The following is the recommended procedure
(Ritenour, 1998):
1. Boil about 1 liter of the cleanest and purest water available (not distilled, mineral, or chlorinated water) for about 5 minutes.
2. Let the water cool to room temperature
3. Test a sample of this water for microbial contamination. This is used as a control.
4. Add 5g of sand to 100ml of water. Stir to mix, cover and let sit indoors or in the shade for 12 hours.
5. Decant the water into a clean container.
6. Test a sample of this water for microbial contamination.
The boiled water should show negative results. If it does not, there has been a sampling error
or the water was not boiled long enough. Positive results in the water with sand sample means
the contamination is coming from the sand. Sand from this sand source is not suitable for use
in the filter; however it could be used for the construction of the concrete body. More sand
sources should be sought out and tested for biological quality as outlined above until a clean
source is found (Ritenour, 1998). Alternatively, the sand could be disinfected by boiling or
spread out in the sun (Murcott, 2001).
Sifting
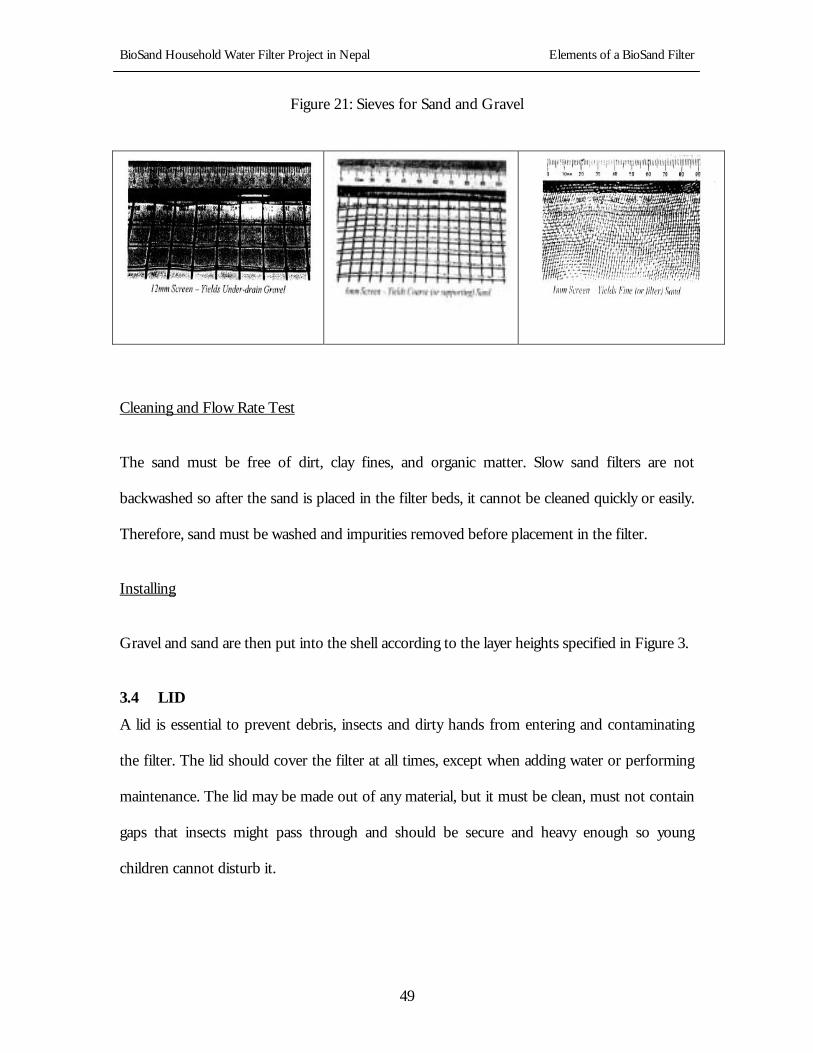
Sifting is required to separate coarse and fine sands from underdrain gravel and larger rocks. A
total of three different size screens are needed: 12mm screen for under-drain gravel, 6mm
screen for the coarse (or supporting) sand, and 1mm screen for the fine (or filter) sand.
BioSand Household Water Filter Project in Nepal Elements of a BioSand Filter
49
Figure 21: Sieves for Sand and Gravel
Cleaning and Flow Rate Test
The sand must be free of dirt, clay fines, and organic matter. Slow sand filters are not
backwashed so after the sand is placed in the filter beds, it cannot be cleaned quickly or easily.
Therefore, sand must be washed and impurities removed before placement in the filter.
Installing
Gravel and sand are then put into the shell according to the layer heights specified in Figure 3.
3.4 LID
A lid is essential to prevent debris, insects and dirty hands from entering and contaminating
the filter. The lid should cover the filter at all times, except when adding water or performing
maintenance. The lid may be made out of any material, but it must be clean, must not contain
gaps that insects might pass through and should be secure and heavy enough so young
children cannot disturb it.
BioSand Household Water Filter Project in Nepal Evaluation Methodology of BioSand Filter
50
4 EVALUATION METHODOLOGY OF BIOSAND FILTER
As stated earlier in Section 1, the purpose of this study was to investigate the effectiveness and
the performance of the BioSand Filter in Nepal. The effectiveness and the performance of the
BSF can be evaluated by various means. The ones used by the author included microbial tests,
turbidity, flow rate and physical observation.
4.1 MICROBIAL TESTS
The microbial tests used in this study evaluated the effectiveness of the BSF in removing
indicator organisms. The concept of indicator organisms was introduced in 1892 and is the
basis for most microbiological quality standards in water today (Hach, 2000). Pathogens in
water are usually few in number and difficult to isolate (Metcalf and Eddy, 1991). Instead of
determining the actual concentrations of pathogens, indicator organism concentrations are
often measured to determine the level of contamination in water. Indicator organisms are
typically microbes that do not cause diseases themselves, but are found in conjunction and in
higher concentrations than waterborne pathogens. Coliforms are one of the most common
indicator organisms because they are so numerous in fecal matter. A problem arises when
trying to determine the origin of coliform because they may come from benign sources, such
as soil, as well as from harmful fecal sources (Metcalf and Eddy, 1991). One coliform entirely
of fecal origin, Escherichia coli, is considered direct evidence of fecal contamination from warm-
blooded animals (Meyers and Sylvester, 1997).
The WHO guidelines for microbial contamination in drinking water is set at zero CFU/100mL
for total coliform and zero CFU/100mL for E.coli. Broadly speaking, there are two types of
BioSand Household Water Filter Project in Nepal Evaluation Methodology of BioSand Filter
51
microbial testing methods: qualitative or Presence/Absence (P/A) tests and
quantitative/enumeration techniques.
Presence/absence (P/A) tests give a simple yes or no answer to whether certain bacteria are in
a water sample, but does not indicate its quantity in the water. The advantage of these tests is
that they are simple, inexpensive and sensitive.
During the field work in Nepal, we used two tests from Hach Company. The first, the
Presence/Absence (P/A) test is an U.S. EPA-equivalent4 testing method; it gives a positive or
negative response to total coliform as well as E.coli (Hach, 2001). This test is easy to perform:
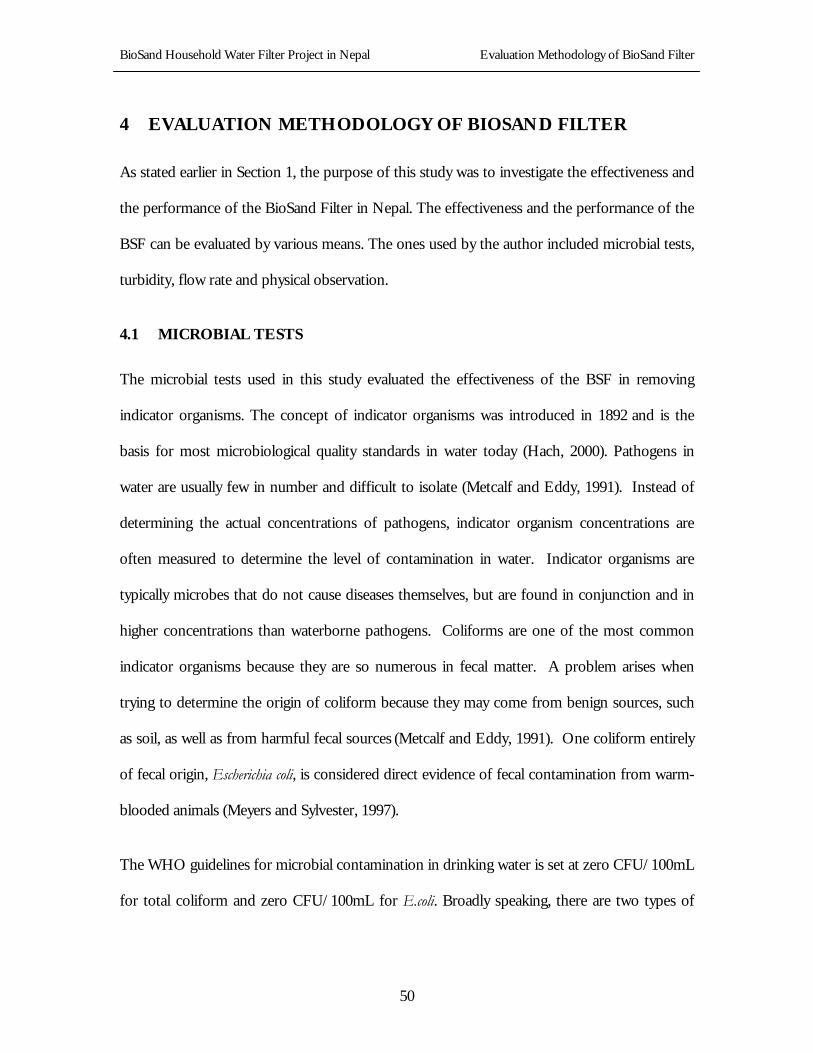
it only requires that the reactive medium (P-A Broth - see Figure 22) be combined with 100
mL of sample and incubated for 24 to 48 hours at 35°C. The culture medium acts as the food
source for the bacteria present in the water sample. During the incubation period, these
bacteria, if present, reproduce in large numbers, resulting in a color change (from purple to
yellow) of the liquid mixture, thus making their presence apparent. The analysis is modified to
test for E.coli by using a 4-methylumbelliferyl-β-D-glucuronide (MUG) reagent that fluoresces
under long-wave ultraviolet light when E.coli are present.5
4 Method is accepted for presence/absence testing of drinking water in Code of Federal Regulations 40 CFR, Part 141.21
subpart (F)(3) and Standard Methods for the Examination of Water and Wastewater 908A, 19th edition (Hach, 2001).
5 MUG produces a fluorogenic product when hydrolyzed by glucuronidase, an enzyme specific to E.coli. (Products for Analysis, 2001).
BioSand Household Water Filter Project in Nepal Evaluation Methodology of BioSand Filter
52
Figure 22: P/A Broth in Glass Ampule.
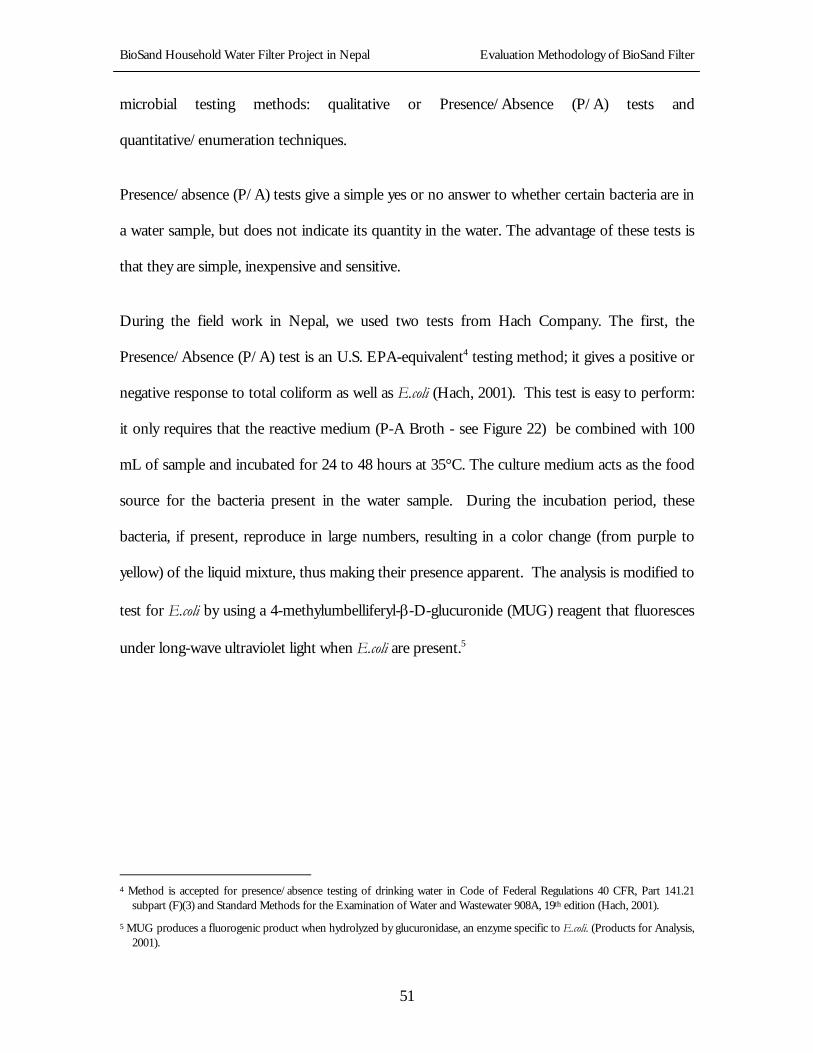
Another P/A test from HACH used during the trip was the PathoScreen Medium Pillows
for 20-mL sample bottles (see Figure 23). This test detects the presence of H2S-producing
bacteria including Salmonella, Citrobacter, Proteus, Edwardsiella and some species of Klebsiella
(Hach, 2001) with a color change from yellow to black to indicate H2S bacteria presence.
Figure 23: PathoScreen™ Medium pillows.
BioSand Household Water Filter Project in Nepal Evaluation Methodology of BioSand Filter
53
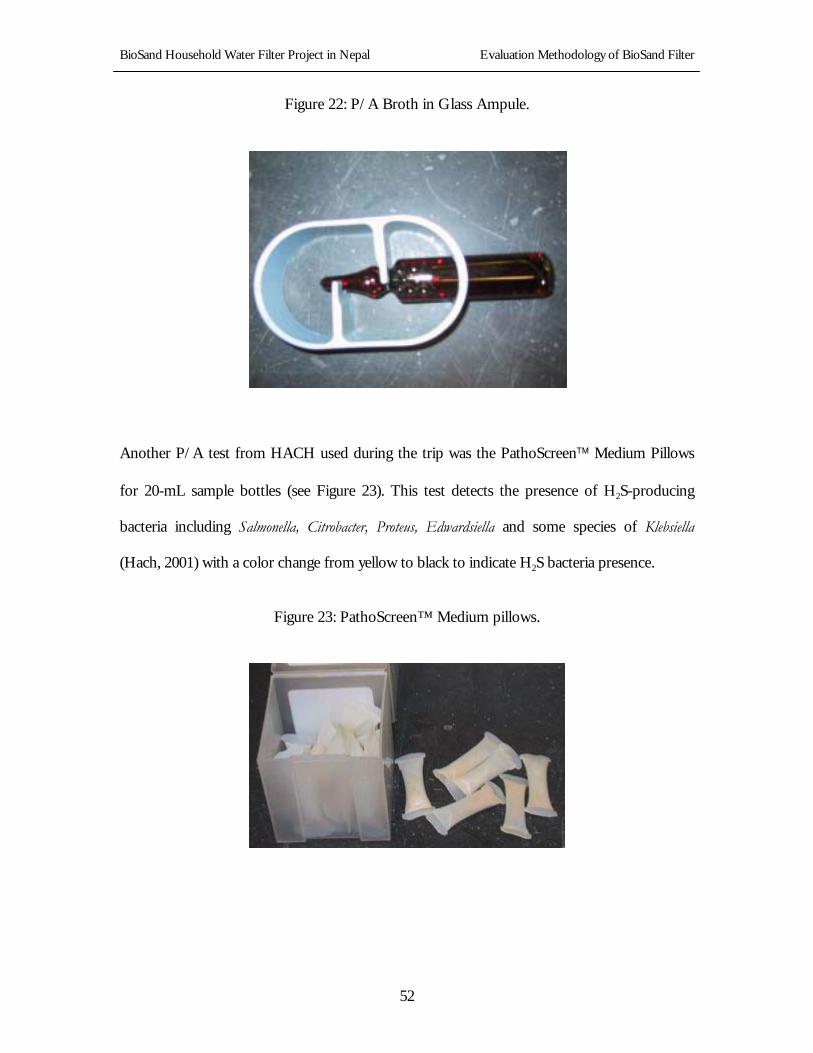
Other P/A tests include using the EBPI6 WaterCheck test kit (also known as ColiBag) and
International Development Research Center (IDRC) hydrogen sulfide paper strip test.
Figure 24: WaterCheck™ test kit
WaterCheck (see Figure 24) detects fecal coliform bacteria (fcb) and it is recommended by
Samaritan’s Purse for water quality testing of BSF (Ritenour, 1998). The test-kit comes in a
sterilized plastic bag. Water sample collection, mixing, incubation, and observation are all done
in the same bag. If the water sample is contaminated with a single colony forming unit (CFU)
per 100mL of water, there will be a color change from yellow to bluish-green. Currently,
WaterCheck is more costly than the HACH P/A test.7
The IDRC hydrogen sulfide test uses a paper strip that is treated with a medium prepared
from dissolving peptone, dipotassium hydrogen phosphate, ferric ammonium citrate, sodium
thiosulfate and teepol (detergent) in water. The treated paper strip is incubated with the water
sample. If bacteria are present in the sample, they produce hydrogen sulfide, which turns the
6 Environmental Biodetection Products Incorporated. See company website: http://www.ebpi-kits.com/
7 One WaterCheck test kit costs CAD$4.00 (US$2.70) (http://www.ebpi-kits.com ) and one HACH P/A test costs $1.50 (Products For Analysis, 2001). Shipping not included.
BioSand Household Water Filter Project in Nepal Evaluation Methodology of BioSand Filter
54
paper black. This method was developed through a project funded by IDRC (Manja et al.,
1982) and it was first tested during an epidemic of hepatitis A infection in Gwalior, India. The
IDRC H2S test is low-cost, easy-to-use, and could be carried out by a local person after being
trained (Pillai et al., 1997). The cost of one test is $0.13 (Murcott, 2001).
We planned to carry out microbial testing using the H2S method. For that purpose, about 100
homemade test kits were brought to Nepal. However, these test kits were not used, after a
discovery that our method of preparation was erroneous due to a typographical mistake in the
IDRC instructions (Murcott, 2001).
Quantitative tests measure the amount of fecal coliform bacteria in CFU per 100mL water.
One such method is the membrane filtration technique. This method requires filtering a
sample of appropriate volume through a membrane filter of sufficiently small pore size to
retain the organism(s) sought. Then the filter is placed on an appropriate agar medium, or
pad saturated with an appropriate broth medium, and incubated. If the organisms sought are
present, colonies will grow on the membrane filter. Colonies are examined and identified by
size, color, shape and sheen. Typical colonies are counted and the number is reported as the
number of colony forming units per 100 mL of sample. This technique is sensitive enough to
detect 1 CFU/100mL. However, this method was not used in the field because it was
expensive and it was too difficult to conduct under field conditions encountered in Nepal.
In April and May 2001, membrane filtration tests were carried out on water samples prior to
and after filtration through a plastic BSF in a laboratory at MIT, Cambridge, Massachusetts.
Test results are presented in section 6.
BioSand Household Water Filter Project in Nepal Evaluation Methodology of BioSand Filter
55
4.2 TURBIDITY
Turbidity is a water quality parameter that quantifies the degree to which light traveling
through a water column is scattered by suspended organic and inorganic particles. The
scattering of light increases with the increased suspended load. Turbidity is commonly
measured in Nephelometric Turbidity Units (NTU), but may also be measured in Jackson
Turbidity Units (JTU) (Metcalf and Eddy, 1991).
Excessive turbidity, or cloudiness, in drinking water is aesthetically unappealing, and may also
represent a health concern. Turbidity can provide food and shelter for pathogens. If not
removed, turbidity can promote regrowth of pathogens in the distribution system, leading to
waterborne disease outbreaks, which have caused significant cases of gastroenteritis
throughout the United States and the world. Although turbidity is not a direct indicator of
health risk, numerous studies show a strong relationship between removal of turbidity and
removal of protozoa (U.S. EPA, 1999). The WHO guideline for the non-microbial turbidity
level in drinking water is set at 5 NTU. In Nepal, the inflow water from the Sundarigat water
treatment plant was found to have turbidity levels varying between 8 and 15 NTU (Sagara,
2000).
BioSand Household Water Filter Project in Nepal Evaluation Methodology of BioSand Filter
56
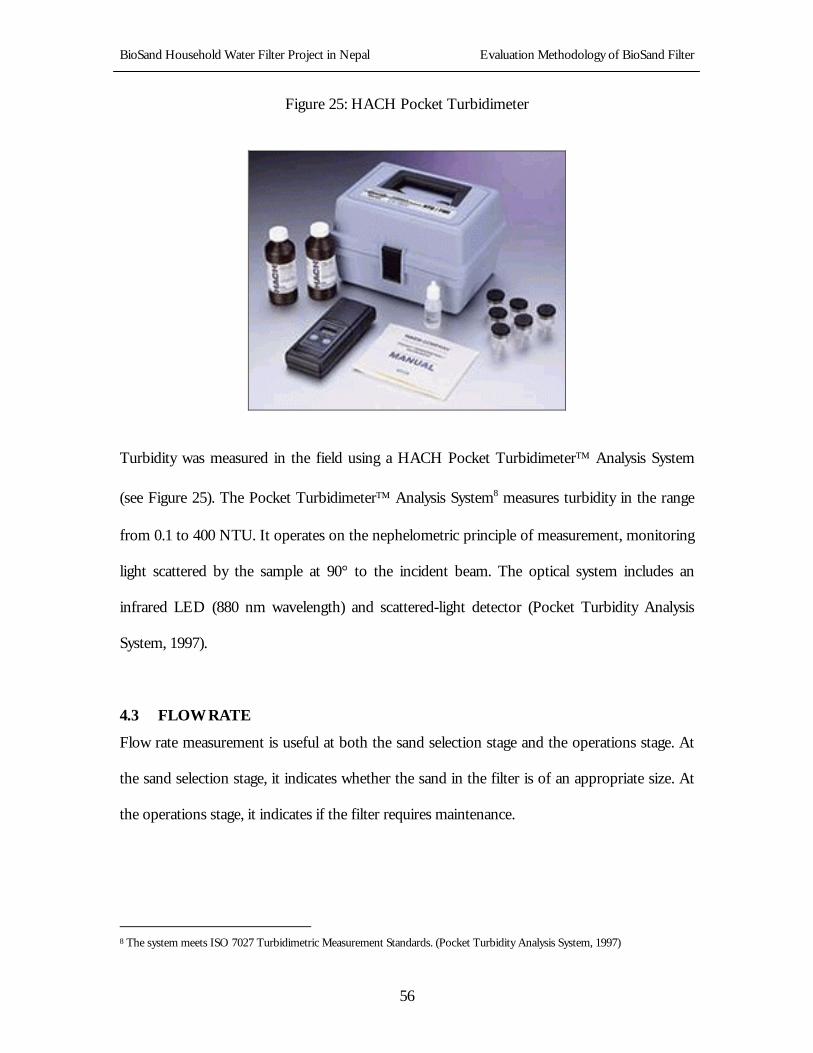
Figure 25: HACH Pocket Turbidimeter
Turbidity was measured in the field using a HACH Pocket Turbidimeter Analysis System
(see Figure 25). The Pocket Turbidimeter Analysis System8 measures turbidity in the range
from 0.1 to 400 NTU. It operates on the nephelometric principle of measurement, monitoring
light scattered by the sample at 90° to the incident beam. The optical system includes an
infrared LED (880 nm wavelength) and scattered-light detector (Pocket Turbidity Analysis
System, 1997).
4.3 FLOW RATE
Flow rate measurement is useful at both the sand selection stage and the operations stage. At
the sand selection stage, it indicates whether the sand in the filter is of an appropriate size. At
the operations stage, it indicates if the filter requires maintenance.
8 The system meets ISO 7027 Turbidimetric Measurement Standards. (Pocket Turbidity Analysis System, 1997)
BioSand Household Water Filter Project in Nepal Evaluation Methodology of BioSand Filter
57
The flow rate of a filter is determined by the effective size and uniform coefficient of the sand
grains. The recommended initial flow rate (for the purpose of sand selection) is 10 ± 3L per
square meter per minute (Ritenour, 1998).
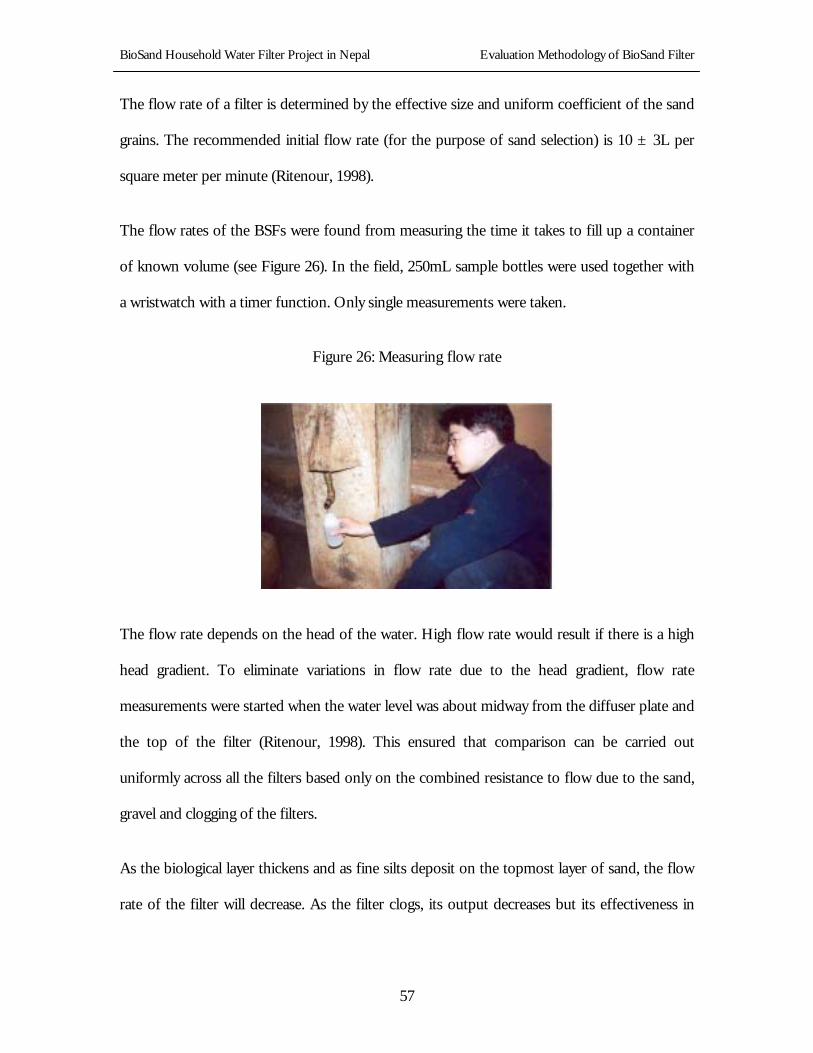
The flow rates of the BSFs were found from measuring the time it takes to fill up a container
of known volume (see Figure 26). In the field, 250mL sample bottles were used together with
a wristwatch with a timer function. Only single measurements were taken.
Figure 26: Measuring flow rate
The flow rate depends on the head of the water. High flow rate would result if there is a high
head gradient. To eliminate variations in flow rate due to the head gradient, flow rate
measurements were started when the water level was about midway from the diffuser plate and
the top of the filter (Ritenour, 1998). This ensured that comparison can be carried out
uniformly across all the filters based only on the combined resistance to flow due to the sand,
gravel and clogging of the filters.
As the biological layer thickens and as fine silts deposit on the topmost layer of sand, the flow
rate of the filter will decrease. As the filter clogs, its output decreases but its effectiveness in
BioSand Household Water Filter Project in Nepal Evaluation Methodology of BioSand Filter
58
purifying water does not. In fact, the effectiveness is expected to increase, since slower flow
rate allows longer contact time between the biofilm and the raw water.
However, low output may not be sufficient to meet the needs of the family. If the water is
coming out at a slight trickle, it is time to service the filter.
The frequency of clogging is directly related to the quality of the water being treated. Very
turbid waters, as in the case of surface water sources in Nepal during the monsoon seasons,
contain a large amount of fine silts, which are trapped in the uppermost layer of sand and
biology. The higher the content of fine silts, the more quickly the filter will clog. Also, if the
water contains a large population of biology, the biofilm that feeds on this content will rapidly
grow or thicken. This will also result in clogging at the top of the filter.
4.4 PHYSICAL OBSERVATIONS
There are several observations that can be made regarding different aspects of the filter. These
observations are important in detecting possible operating problems with the filters. The
different aspects of the filter are spouts attachment, diffuser plates, sand layers and cracks in
the concrete body.
4.4.1 Spouts Attachment
There should not be any types of attachment to the spout. This is because the flow in a
BioSand filter should be continuous and not stopped. Stopping the flow for extended periods
of time (especially when water has just been poured in) is not favorable to the growth or
sustenance of the biology in the filter since oxygen diffusion is reduced.
BioSand Household Water Filter Project in Nepal Evaluation Methodology of BioSand Filter
59
4.4.2 Diffuser Plate
The diffuser plate must be kept in good condition to keep the force of pouring water from
disturbing the layer. If the biological layer is disturbed, the effectiveness of the filter will be
compromised and more significant numbers of harmful organisms may pass through the filter.
4.4.3 Sand Layer
The sand in the BSF is crucial to the filtration process of the BSF. If this layer is disturbed or
damaged, the effectiveness of the filter will be compromised and more significant numbers of
harmful organisms may pass through the filter. If the top layer of sand is uneven, it is a sign
that there is water is skirting the edge of the diffuser plate and scouring the surface.
The resting water level must be below the diffuser plate for the biofilm to receive enough
oxygen, and it must be 5cm above the sand level to buffer the sand from incoming water.
Also, the biological layer cannot take high loads of toxic chemicals, such as bleach.
4.4.4 Cracks in the Concrete Body
The filter has to be checked for cracks below the resting water level. If there are such cracks,
the filter could be leaking and the flow rate would decrease. This is because the cracks create
paths of less resistance for the water. Correspondingly, there will be less filtration.
BioSand Household Water Filter Project in Nepal Results and Discussion
60
5 RESULTS AND DISCUSSION
The author spent four days in the district of Palpa and nine days in the district of Nawalparasi
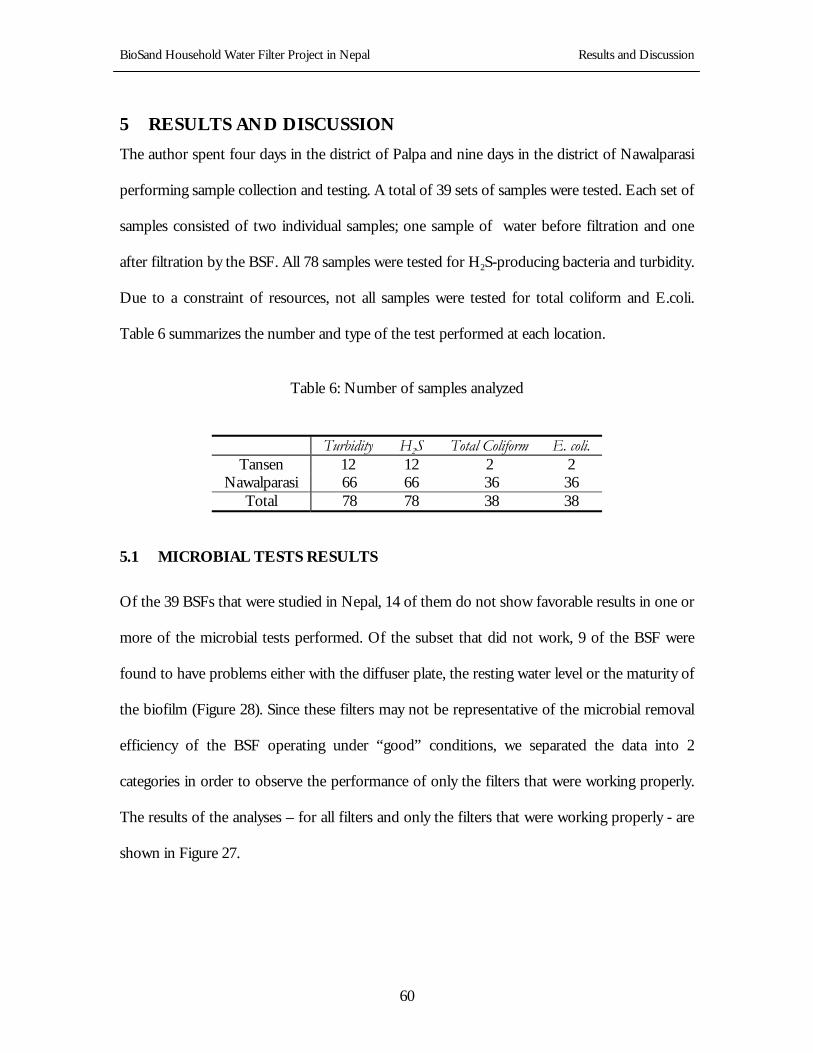
performing sample collection and testing. A total of 39 sets of samples were tested. Each set of
samples consisted of two individual samples; one sample of water before filtration and one
after filtration by the BSF. All 78 samples were tested for H2S-producing bacteria and turbidity.
Due to a constraint of resources, not all samples were tested for total coliform and E.coli.
Table 6 summarizes the number and type of the test performed at each location.
Table 6: Number of samples analyzed
Turbidity H2S Total Coliform E. coli. Tansen 12 12 2 2
Nawalparasi 66 66 36 36 Total 78 78 38 38
5.1 MICROBIAL TESTS RESULTS
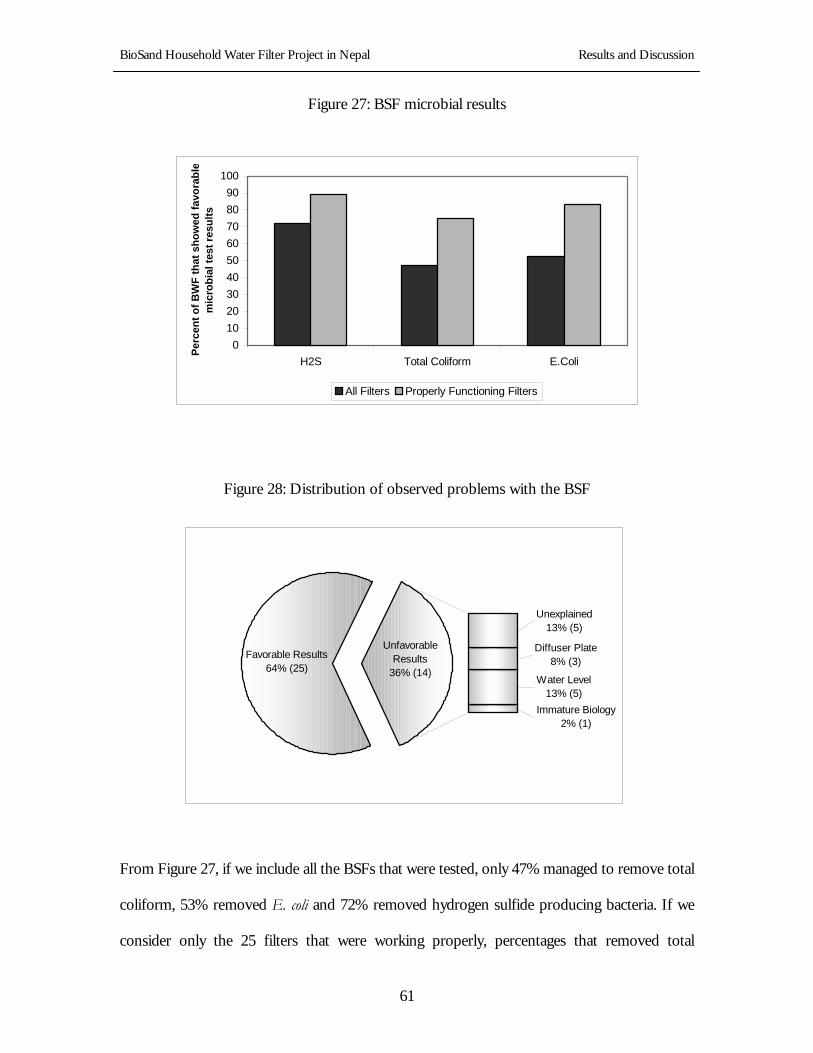
Of the 39 BSFs that were studied in Nepal, 14 of them do not show favorable results in one or
more of the microbial tests performed. Of the subset that did not work, 9 of the BSF were
found to have problems either with the diffuser plate, the resting water level or the maturity of
the biofilm (Figure 28). Since these filters may not be representative of the microbial removal
efficiency of the BSF operating under “good” conditions, we separated the data into 2
categories in order to observe the performance of only the filters that were working properly.
The results of the analyses – for all filters and only the filters that were working properly - are
shown in Figure 27.
BioSand Household Water Filter Project in Nepal Results and Discussion
61
Unexplained13% (5)
Diffuser Plate8% (3)
Water Level13% (5)
Immature Biology2% (1)
Favorable Results64% (25)
Unfavorable Results
36% (14)
Figure 27: BSF microbial results
0102030405060708090
100
H2S Total Coliform E.Coli
Perc
ent o
f BW
F th
at s
how
ed fa
vora
ble
mic
robi
al te
st re
sults
All Filters Properly Functioning Filters
Figure 28: Distribution of observed problems with the BSF
From Figure 27, if we include all the BSFs that were tested, only 47% managed to remove total
coliform, 53% removed E. coli and 72% removed hydrogen sulfide producing bacteria. If we
consider only the 25 filters that were working properly, percentages that removed total
BioSand Household Water Filter Project in Nepal Results and Discussion
62
coliform, E. coli and hydrogen sulfide producing organisms increased to 75%, 83% and 89%
respectively.
As shown in Appendix C, only 12 properly functioning were tested for total coliform and
E.coli.. Of these 12 BSFs, 9 meet the WHO guidelines for drinking water of zero CFU/100mL
for total coliform, and 10 meet the WHO guidelines for drinking water of zero CFU/100mL
for E. coli. This is a significant improvement in the drinking water quality as compared to the
Indian and Nepali ceramic candle filters and the Haitian Gift of the Water Filter that were
tested in Nepal by the previous MIT M.Eng group, none of which removed total coliform and
only the Indian filter removed E. coli (Sagara, 2000). The Haitian Gift of Water Filter, which
includes a chlorination step was successful at bacterial disinfection. However, it also suggests
that the BSF is not a perfect technology since about 30% of the BSFs did not meet the WHO
guidelines, for subset of BSF that were identified to be working properly.
5.2 TURBIDITY RESULTS
The average turbidity of the influent water is 10NTU for all BSFs and 13NTU for BSFs that
were working properly. Both are below the maximum recommended turbidity limit of 100
NTU (Davnor Water Treatment Technology Ltd.). This suggests that the BSF could be
suitable for use in Palpa and Nawalparasi during non-monsoon season. In the monsoon
season, it may be necessary to pretreat the source water simply by letting the water settle
before pouring it into the BSF. Otherwise, it becomes necessary to clean the filter more
frequently since more clogging is expected to occur with higher levels of source water
turbidity. If the frequency of maintenance is so high that the there is not enough time for the
biology to mature, then the effectiveness of the BSF is reduced.
BioSand Household Water Filter Project in Nepal Results and Discussion
63
The turbidity of water coming out of a BSF is 0.9 NTU if averaged over all the filters and 0.8
NTU if averaged over only the ones that were observed to be functioning properly. Both
values are lower than 5 NTU, which is the WHO guideline for maximum allowable turbidity in
drinking water.
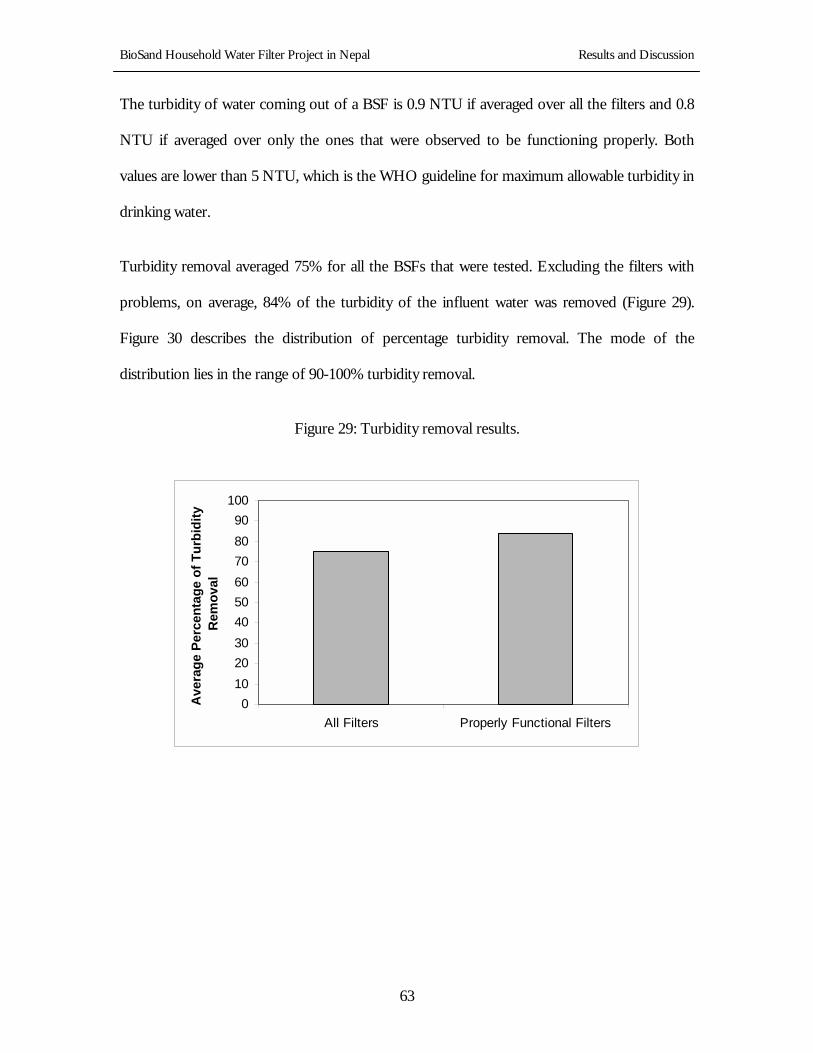
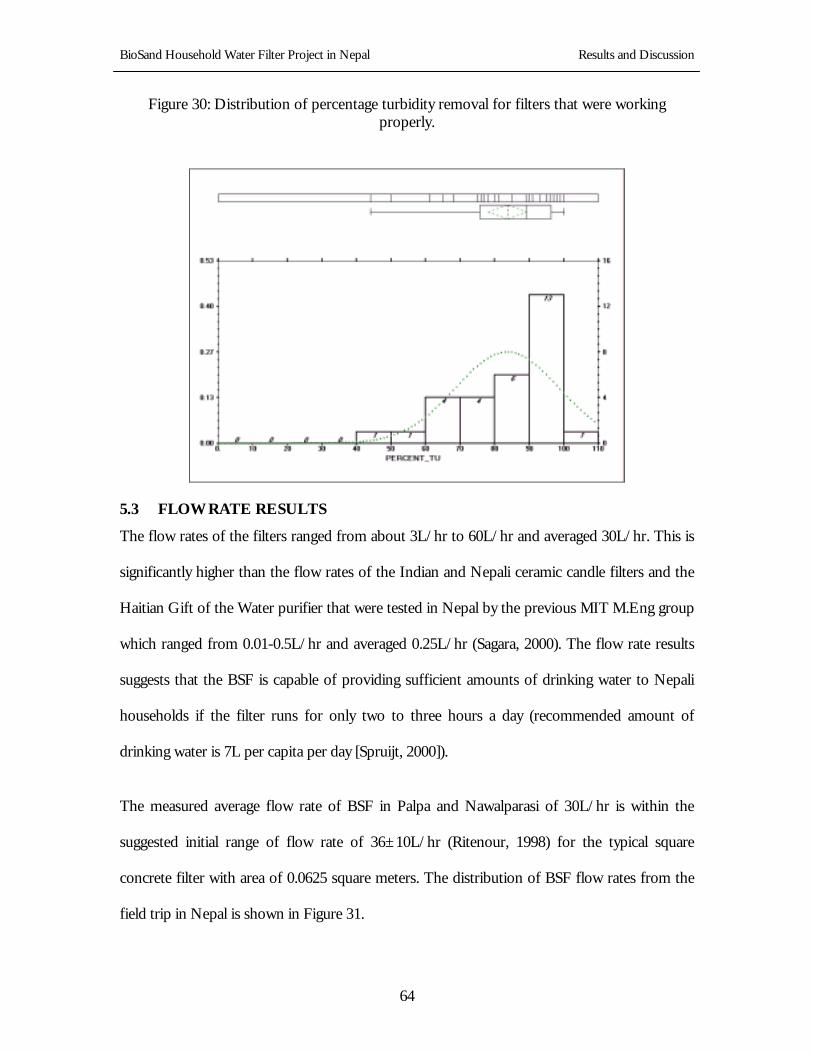
Turbidity removal averaged 75% for all the BSFs that were tested. Excluding the filters with
problems, on average, 84% of the turbidity of the influent water was removed (Figure 29).
Figure 30 describes the distribution of percentage turbidity removal. The mode of the
distribution lies in the range of 90-100% turbidity removal.
Figure 29: Turbidity removal results.
0102030405060708090
100
All Filters Properly Functional Filters
Ave
rage
Per
cent
age
of T
urbi
dity
R
emov
al
BioSand Household Water Filter Project in Nepal Results and Discussion
64
Figure 30: Distribution of percentage turbidity removal for filters that were working properly.
5.3 FLOW RATE RESULTS
The flow rates of the filters ranged from about 3L/hr to 60L/hr and averaged 30L/hr. This is
significantly higher than the flow rates of the Indian and Nepali ceramic candle filters and the
Haitian Gift of the Water purifier that were tested in Nepal by the previous MIT M.Eng group
which ranged from 0.01-0.5L/hr and averaged 0.25L/hr (Sagara, 2000). The flow rate results
suggests that the BSF is capable of providing sufficient amounts of drinking water to Nepali
households if the filter runs for only two to three hours a day (recommended amount of
drinking water is 7L per capita per day [Spruijt, 2000]).
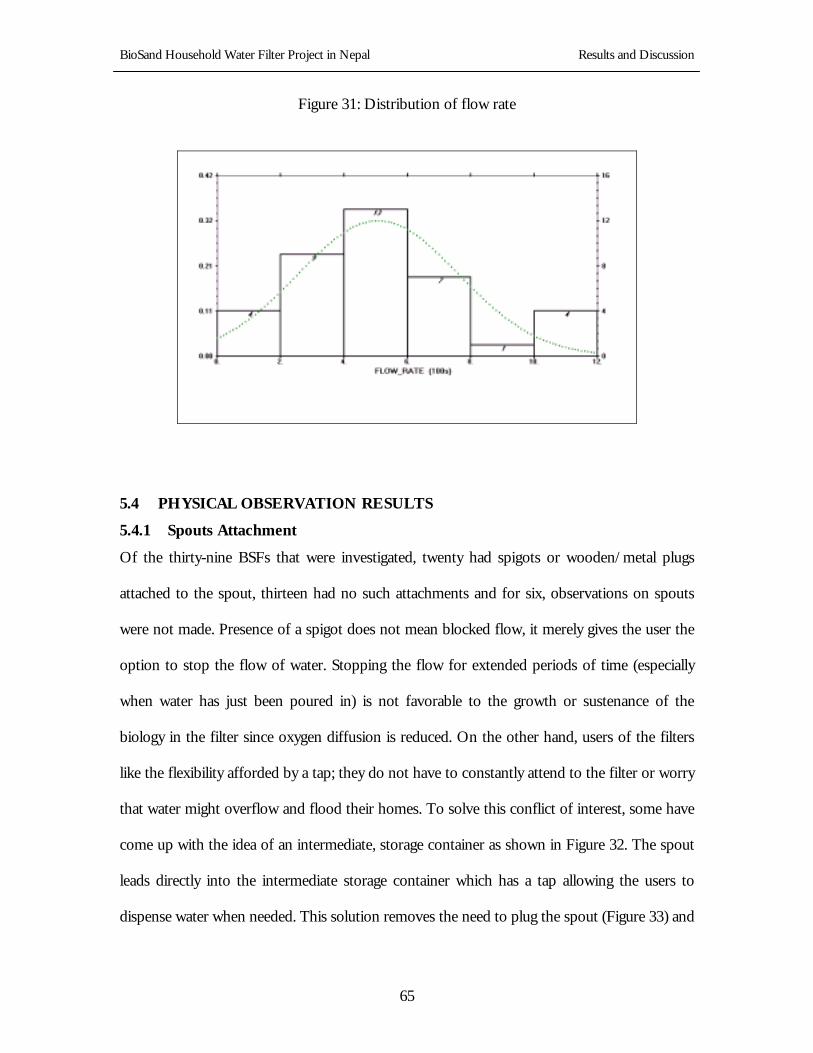
The measured average flow rate of BSF in Palpa and Nawalparasi of 30L/hr is within the
suggested initial range of flow rate of 36±10L/hr (Ritenour, 1998) for the typical square
concrete filter with area of 0.0625 square meters. The distribution of BSF flow rates from the
field trip in Nepal is shown in Figure 31.
BioSand Household Water Filter Project in Nepal Results and Discussion
65
Figure 31: Distribution of flow rate
5.4 PHYSICAL OBSERVATION RESULTS
5.4.1 Spouts Attachment
Of the thirty-nine BSFs that were investigated, twenty had spigots or wooden/metal plugs
attached to the spout, thirteen had no such attachments and for six, observations on spouts
were not made. Presence of a spigot does not mean blocked flow, it merely gives the user the
option to stop the flow of water. Stopping the flow for extended periods of time (especially
when water has just been poured in) is not favorable to the growth or sustenance of the
biology in the filter since oxygen diffusion is reduced. On the other hand, users of the filters
like the flexibility afforded by a tap; they do not have to constantly attend to the filter or worry
that water might overflow and flood their homes. To solve this conflict of interest, some have
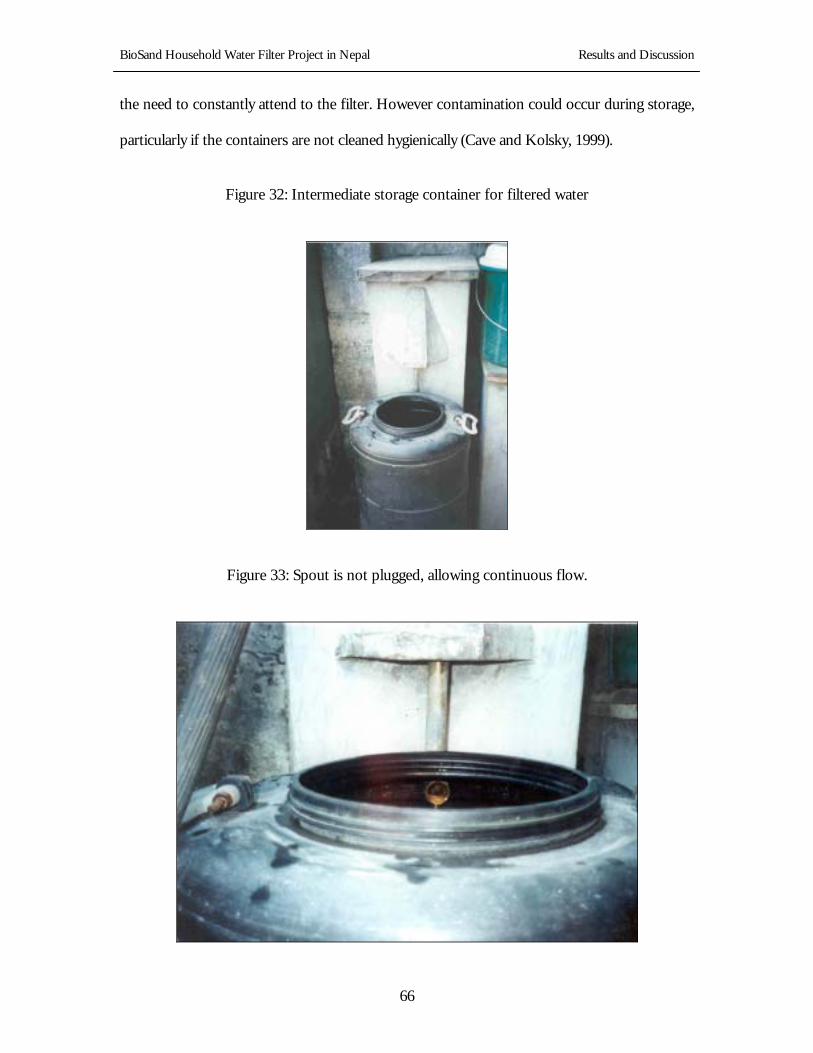
come up with the idea of an intermediate, storage container as shown in Figure 32. The spout
leads directly into the intermediate storage container which has a tap allowing the users to
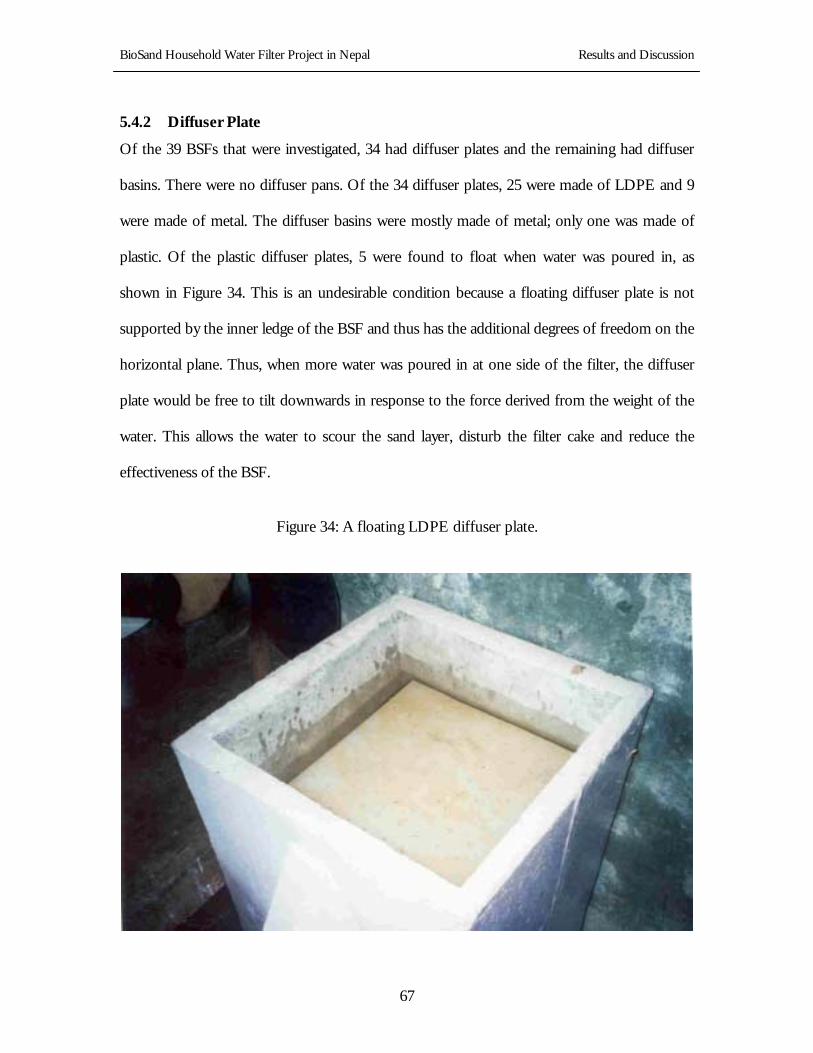
dispense water when needed. This solution removes the need to plug the spout (Figure 33) and
BioSand Household Water Filter Project in Nepal Results and Discussion
66
the need to constantly attend to the filter. However contamination could occur during storage,
particularly if the containers are not cleaned hygienically (Cave and Kolsky, 1999).
Figure 32: Intermediate storage container for filtered water
Figure 33: Spout is not plugged, allowing continuous flow.
BioSand Household Water Filter Project in Nepal Results and Discussion
67
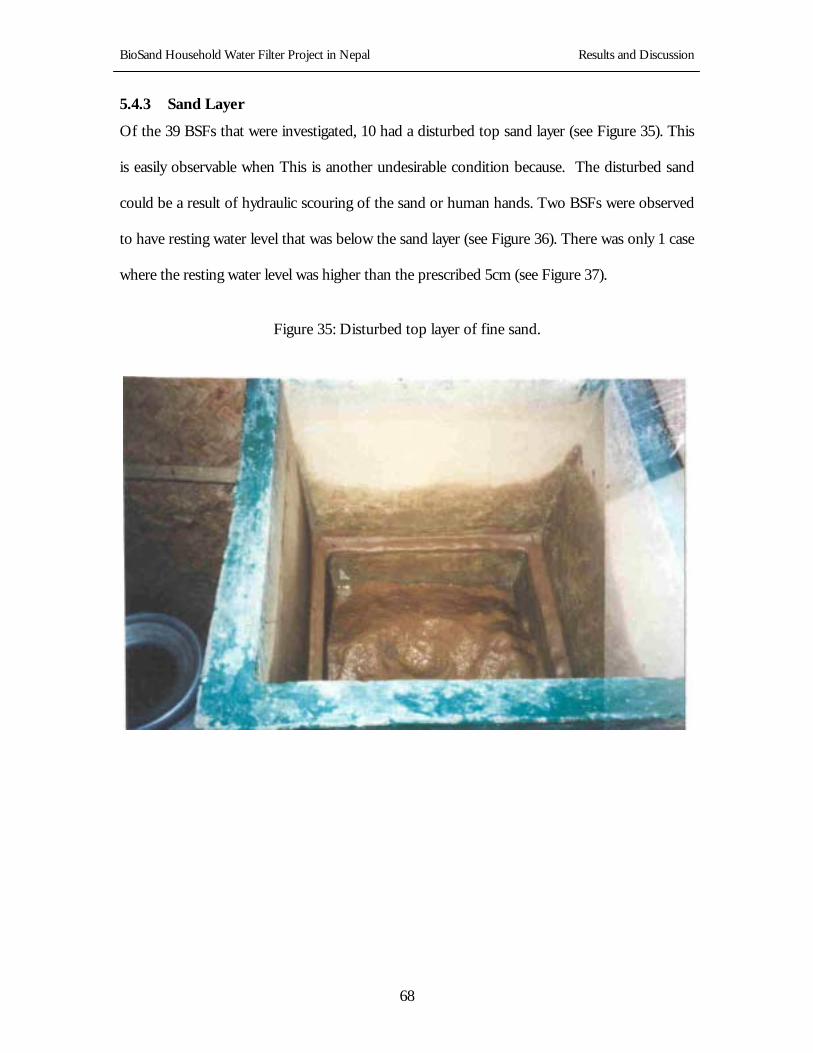
5.4.2 Diffuser Plate
Of the 39 BSFs that were investigated, 34 had diffuser plates and the remaining had diffuser
basins. There were no diffuser pans. Of the 34 diffuser plates, 25 were made of LDPE and 9
were made of metal. The diffuser basins were mostly made of metal; only one was made of
plastic. Of the plastic diffuser plates, 5 were found to float when water was poured in, as
shown in Figure 34. This is an undesirable condition because a floating diffuser plate is not
supported by the inner ledge of the BSF and thus has the additional degrees of freedom on the
horizontal plane. Thus, when more water was poured in at one side of the filter, the diffuser
plate would be free to tilt downwards in response to the force derived from the weight of the
water. This allows the water to scour the sand layer, disturb the filter cake and reduce the
effectiveness of the BSF.
Figure 34: A floating LDPE diffuser plate.
BioSand Household Water Filter Project in Nepal Results and Discussion
68
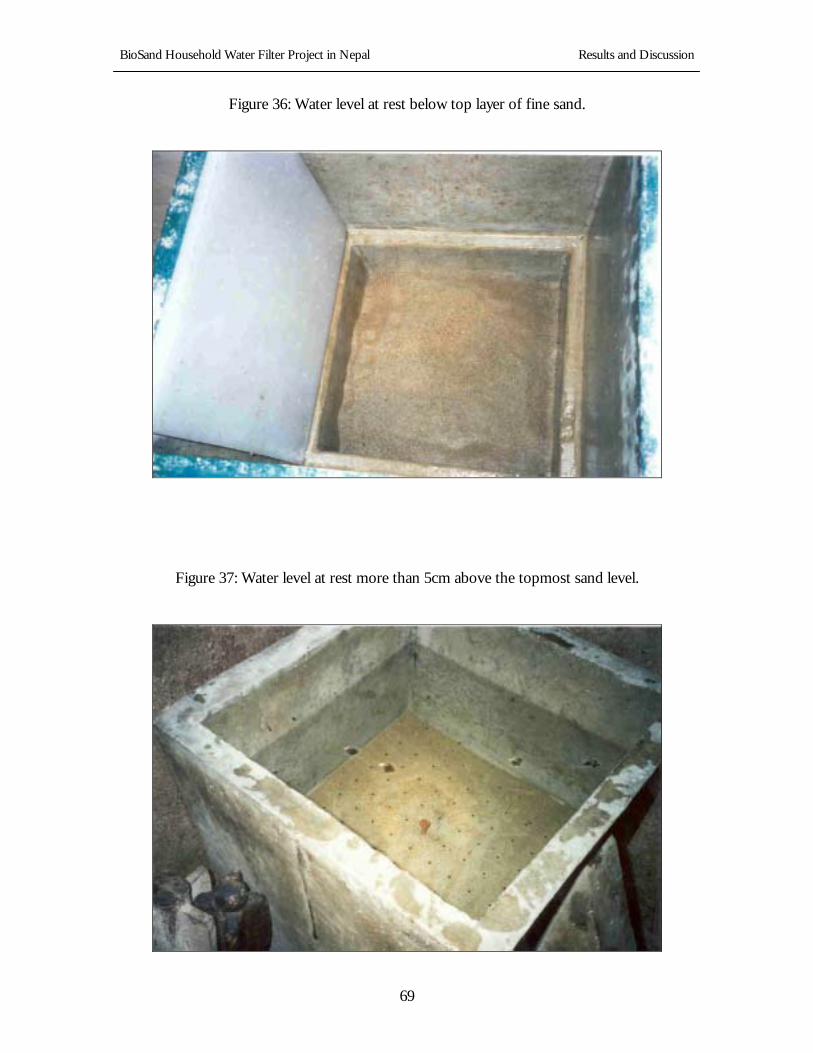
5.4.3 Sand Layer
Of the 39 BSFs that were investigated, 10 had a disturbed top sand layer (see Figure 35). This
is easily observable when This is another undesirable condition because. The disturbed sand
could be a result of hydraulic scouring of the sand or human hands. Two BSFs were observed
to have resting water level that was below the sand layer (see Figure 36). There was only 1 case
where the resting water level was higher than the prescribed 5cm (see Figure 37).
Figure 35: Disturbed top layer of fine sand.
BioSand Household Water Filter Project in Nepal Results and Discussion
69
Figure 36: Water level at rest below top layer of fine sand.
Figure 37: Water level at rest more than 5cm above the topmost sand level.
BioSand Household Water Filter Project in Nepal Results and Discussion
70
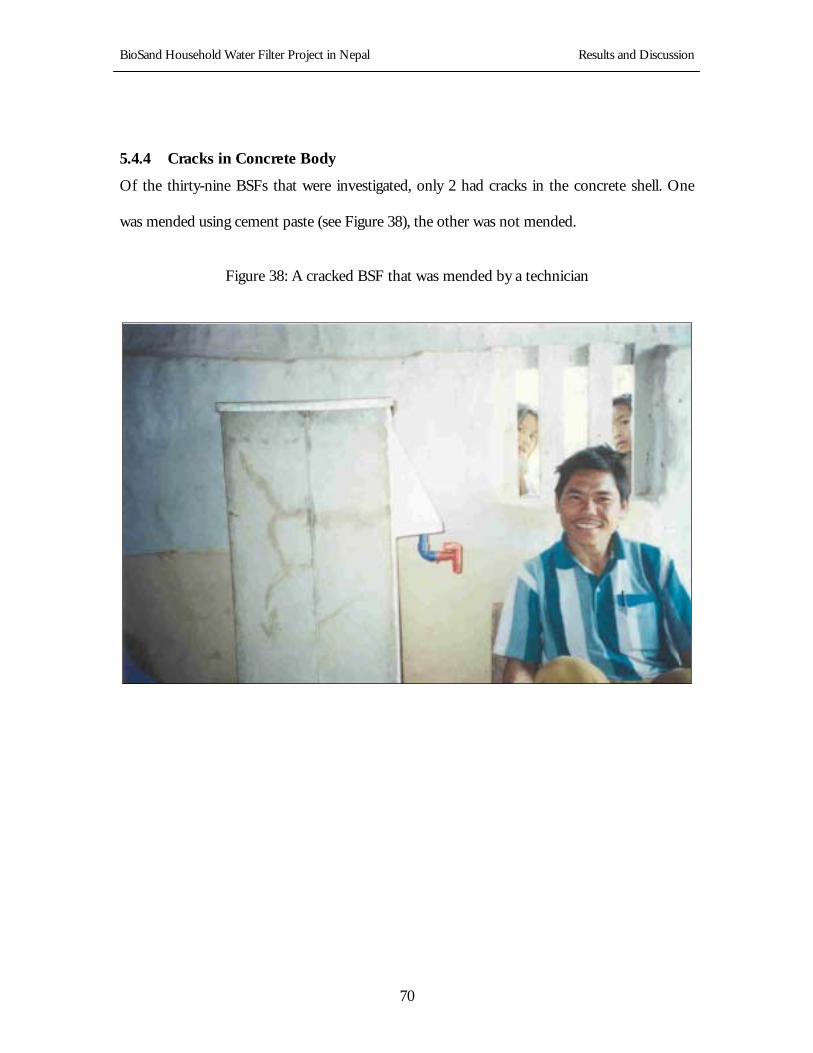
5.4.4 Cracks in Concrete Body
Of the thirty-nine BSFs that were investigated, only 2 had cracks in the concrete shell. One
was mended using cement paste (see Figure 38), the other was not mended.
Figure 38: A cracked BSF that was mended by a technician
BioSand Household Water Filter Project in Nepal Results and Discussion
71
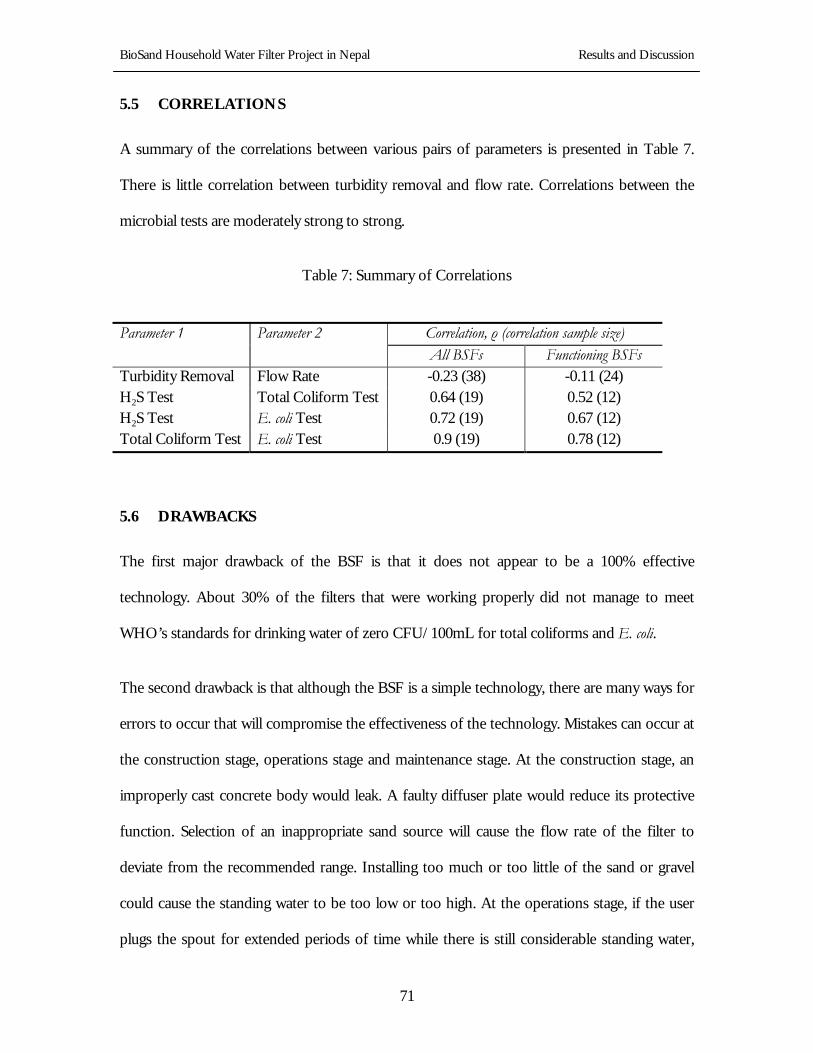
5.5 CORRELATIONS
A summary of the correlations between various pairs of parameters is presented in Table 7.
There is little correlation between turbidity removal and flow rate. Correlations between the
Turbidity Removal Flow Rate -0.23 (38) -0.11 (24) H2S Test Total Coliform Test 0.64 (19) 0.52 (12) H2S Test E. coli Test 0.72 (19) 0.67 (12) Total Coliform Test E. coli Test 0.9 (19) 0.78 (12)
5.6 DRAWBACKS
The first major drawback of the BSF is that it does not appear to be a 100% effective
technology. About 30% of the filters that were working properly did not manage to meet
WHO’s standards for drinking water of zero CFU/100mL for total coliforms and E. coli.
The second drawback is that although the BSF is a simple technology, there are many ways for
errors to occur that will compromise the effectiveness of the technology. Mistakes can occur at
the construction stage, operations stage and maintenance stage. At the construction stage, an
improperly cast concrete body would leak. A faulty diffuser plate would reduce its protective
function. Selection of an inappropriate sand source will cause the flow rate of the filter to
deviate from the recommended range. Installing too much or too little of the sand or gravel
could cause the standing water to be too low or too high. At the operations stage, if the user
plugs the spout for extended periods of time while there is still considerable standing water,
BioSand Household Water Filter Project in Nepal Results and Discussion
72
the biology in the filter might not get sufficient oxygen. In the maintenance stage, the user
might not know the proper procedures to clean the filter and therefore decide not to clean it.
The third drawback of the filter is that it takes time for the biology to fully mature. During this
ripening period, which is estimated to be 2 weeks, the filter is less effective in removing
contamination.
The fourth drawback is that the efficiency of the filter is limited by the turbidity of the source
water. In the monsoon season, the performance of the filter will be compromised.
Pretreatment steps may be necessary to reduce the turbidity of the influent water to the filter.
BioSand Household Water Filter Project in Nepal Experiments Carried Out at MIT
73
6 EXPERIMENTS CARRIED OUT AT MIT
Microbial results from the Nepal field trip were less satisfactory than that reported by previous
studies on the BSF (see Table 4). Also, we did not carry out any quantitative (enumeration)
tests in Nepal. There was a need to further evaluate the effectiveness of the BSF technology in
removing microbial contamination if we wanted to recommend it for adoption.
At MIT, the author conducted membrane filtration tests and pH tests on a plastic BSF (Figure
4). The experiment started on March 13 and ended on May 7, 2001. During the test period,
about 20L of water from the Charles River was collected every day (except weekends) and
passed through the filter. The BSF was allowed 45 days to mature. Membrane filtration tests
were then carried out. The pH was also measured, in response to a comment made at the
presentation given by this year’s MIT Masters of Engineering Program at the headquarters of
the Federation of Business and Professional Women - Nepal.
6.1 MEMBRANE FILTRATION
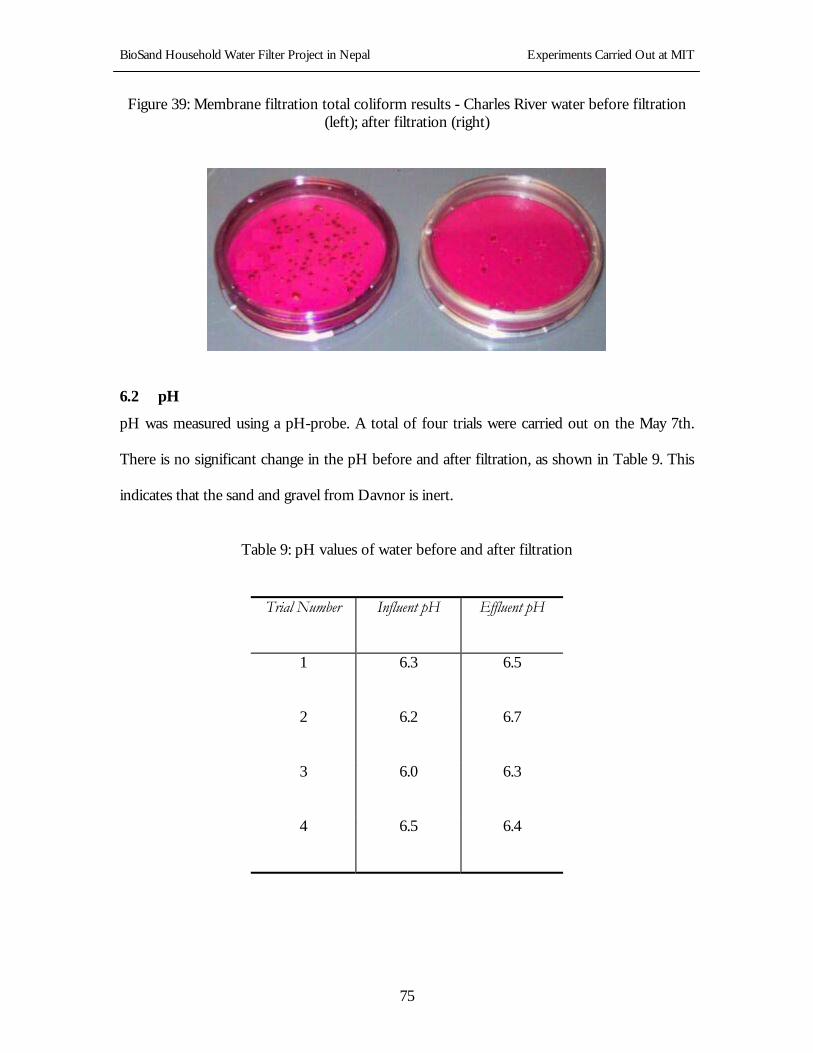
A total of five trials were carried out. Each trial consists of two 100mL of water samples: one
before and one after the passing through the filter. Dilution was required for the influent water
sample because the total coliform bacteria were too numerous to count (TNTC) in the original
water sample. Dilution of 1/10 made the counts fall in the recommended range of 20 to 80
(American Public Health Association, 1992). The medium used was the m-Endo broth
manufactured by Millipore, which tests for total coliform. The results of the membrane
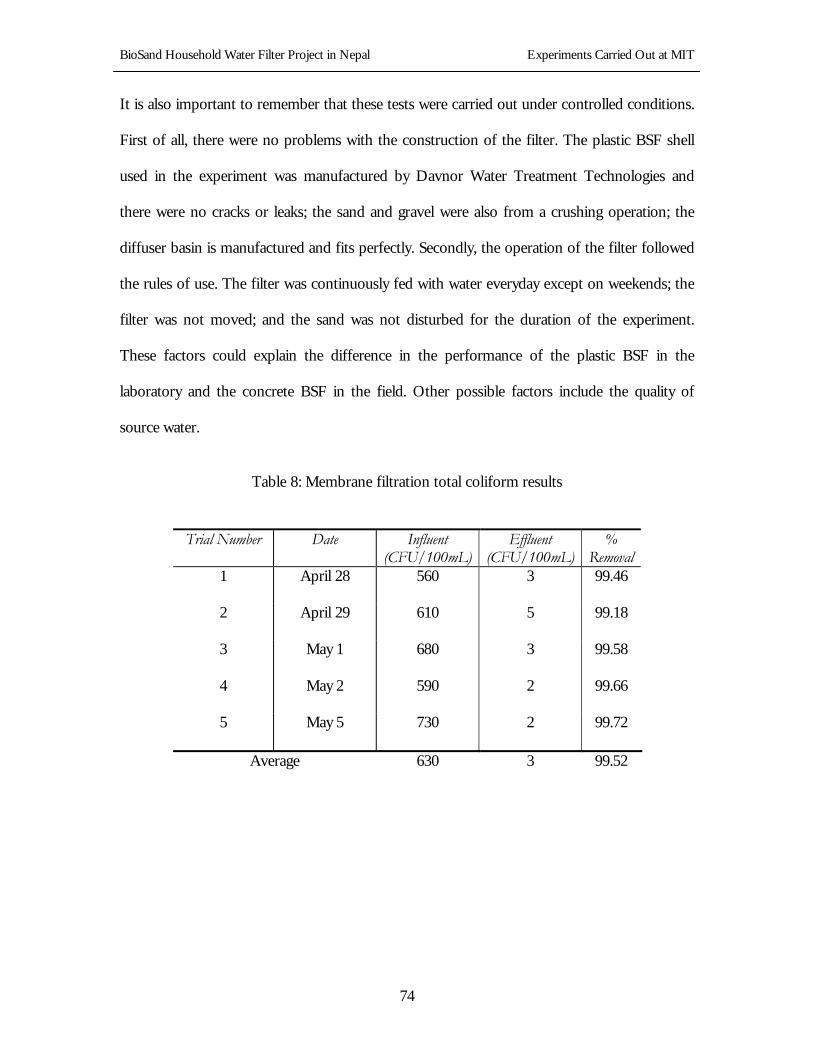
filtration tests are shown in Table 8. Average percentage removal of total coliforms is 99.5%.
This result confirms the results reported in Table 4. This indicates that the BSF is a fairly
effective technology at removing total coliforms.
BioSand Household Water Filter Project in Nepal Experiments Carried Out at MIT
74
It is also important to remember that these tests were carried out under controlled conditions.
First of all, there were no problems with the construction of the filter. The plastic BSF shell
used in the experiment was manufactured by Davnor Water Treatment Technologies and
there were no cracks or leaks; the sand and gravel were also from a crushing operation; the
diffuser basin is manufactured and fits perfectly. Secondly, the operation of the filter followed
the rules of use. The filter was continuously fed with water everyday except on weekends; the
filter was not moved; and the sand was not disturbed for the duration of the experiment.
These factors could explain the difference in the performance of the plastic BSF in the
laboratory and the concrete BSF in the field. Other possible factors include the quality of
source water.
Table 8: Membrane filtration total coliform results
Trial Number Date Influent (CFU/100mL)
Effluent (CFU/100mL)
% Removal
1 April 28 560 3 99.46
2 April 29 610 5 99.18
3 May 1 680 3 99.58
4 May 2 590 2 99.66
5 May 5 730 2 99.72
Average 630 3 99.52
BioSand Household Water Filter Project in Nepal Experiments Carried Out at MIT
75
Figure 39: Membrane filtration total coliform results - Charles River water before filtration (left); after filtration (right)
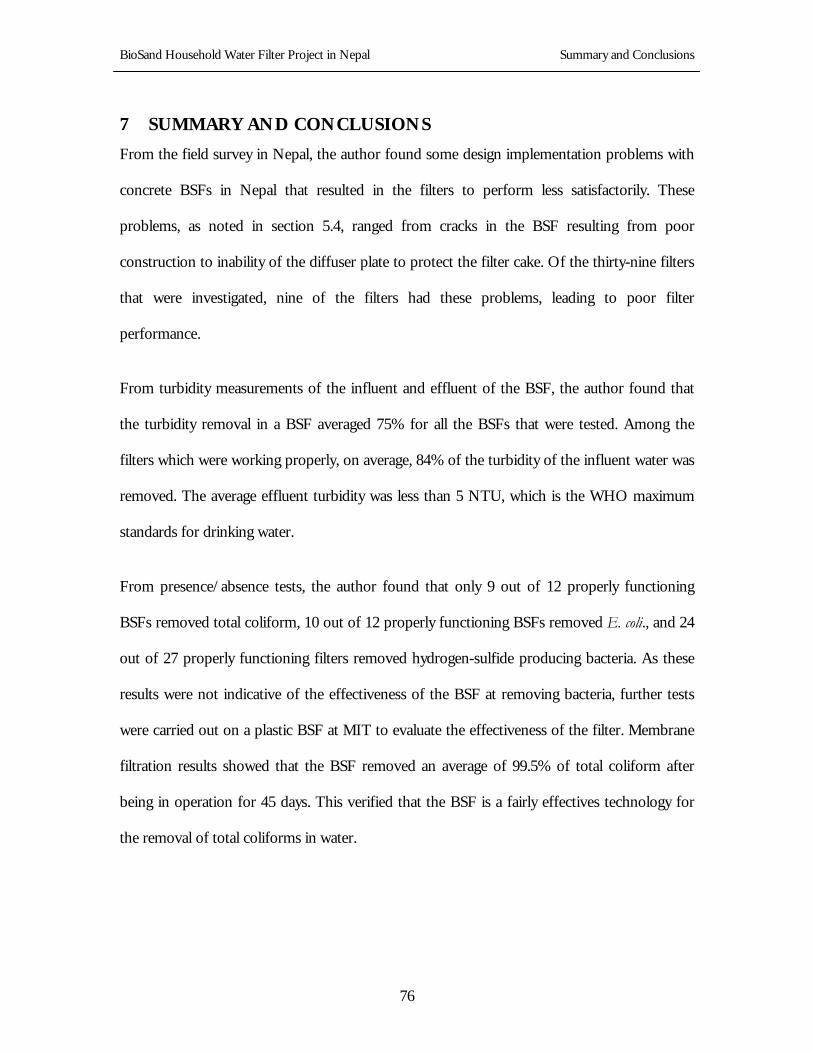
6.2 pH
pH was measured using a pH-probe. A total of four trials were carried out on the May 7th.
There is no significant change in the pH before and after filtration, as shown in Table 9. This
indicates that the sand and gravel from Davnor is inert.
Table 9: pH values of water before and after filtration
Trial Number Influent pH Effluent pH
1 6.3 6.5
2 6.2 6.7
3 6.0 6.3
4 6.5 6.4
BioSand Household Water Filter Project in Nepal Summary and Conclusions
76
7 SUMMARY AND CONCLUSIONS
From the field survey in Nepal, the author found some design implementation problems with
concrete BSFs in Nepal that resulted in the filters to perform less satisfactorily. These
problems, as noted in section 5.4, ranged from cracks in the BSF resulting from poor
construction to inability of the diffuser plate to protect the filter cake. Of the thirty-nine filters
that were investigated, nine of the filters had these problems, leading to poor filter
performance.
From turbidity measurements of the influent and effluent of the BSF, the author found that
the turbidity removal in a BSF averaged 75% for all the BSFs that were tested. Among the
filters which were working properly, on average, 84% of the turbidity of the influent water was
removed. The average effluent turbidity was less than 5 NTU, which is the WHO maximum
standards for drinking water.
From presence/absence tests, the author found that only 9 out of 12 properly functioning
BSFs removed total coliform, 10 out of 12 properly functioning BSFs removed E. coli., and 24
out of 27 properly functioning filters removed hydrogen-sulfide producing bacteria. As these
results were not indicative of the effectiveness of the BSF at removing bacteria, further tests
were carried out on a plastic BSF at MIT to evaluate the effectiveness of the filter. Membrane
filtration results showed that the BSF removed an average of 99.5% of total coliform after
being in operation for 45 days. This verified that the BSF is a fairly effectives technology for
the removal of total coliforms in water.
BioSand Household Water Filter Project in Nepal Summary and Conclusions
77
Flow rate measurements of the effluent water from the BSFs in Nepal yields an average of
30L/hr, which means that the BSF could provide an adequate supply of drinking water for a
typical Nepali household.
Based on the result of the study, namely, effective removal of total coliforms, reduction of
turbidity and high flow rate, the author recommends the BSF technology to be adopted on a
large scale in Nepal. However, this needs to go hand-in-hand with a monitoring plan to ensure
correct construction, operation and maintenance procedures are followed. The monitoring
plan is necessary to reduce the fraction of BioSand filters that were not working properly. The
author also recommends further studies on developing such a monitoring plan.
Other drawbacks to the system, as mentioned in section 5.6, should also be addressed. For
example, pretreatment of higher turbidity water in the monsoon season is necessary to reduce
the silt/clay loading which would clog up the filter. For further discussion on how
pretreatment may be carried out, the reader is recommended to refer to Paynter (2001).
BioSand Household Water Filter Project in Nepal References
78
REFERENCES
American Public Health Association, (1992). Standard Methods for the Examination of Water and Wastewater, 18th Edition, 1992. Baker, M. N. (1981),The Quest for Pure Water: The History of Water Purification from the Earliest Records to the Twentieth Century. 2nd Ed., American Water Works Association
Barbier, J.M. (1992), ‘Paris Improves Its Drinking Water Treatment Plants’. Journal Institute of Water and Environmental Management, vol. 6, no. 3, pp.2.
Bellamy, W. D., Silverman, G. P., Hendricks, D. W., & Logsdon, G. S. (1985), ‘Removing Giardia cysts with slow sand filtration’, Journal of American Water Works Association, vol. 77, no. 2, pp. 52-60
Burch, J. D., & Thomas, K. E. (1998), ‘Water Disinfection for Developing Countries and Potential for Solar Thermal Pasteurization’, Solar Energy, vol. 64, no 1, pp. 87-97
Cave, Ben, and Kolsky, Pete. (1999). “Groundwater, Latrines and Health”, London School of Hygiene and Tropical Medicine
Cleasby, J.L. (1991), ‘Source Water Quality and Pre-treatment Options for Slow Sand Filters’. Slow Sand Filtration. Gary Logsdon, ed. American Society of Civil Engineers. New York.
Cleasby, J.L., Hilmoe, D.J., & Dimitracopoulos, C.J. (1984), ‘Slow Sand Filtration and Direct In-Line Filtration of a Surface Water’. Journal of American Water Works Association, vol. 76, no. 12, pp. 44-60
Collins, R. M., Eighmy, T.T., Fenstermacher J.M., & Spanos, S.K. (1992), ‘Removing Natural Organic Matter by Conventional Slow Sand Filtration’, Journal of the American Water Works Association, vol. 84 no. 5, pp. 80-90.
Collins, R. M. (1998).“Assessing Slow Sand Filtration and Proven Modifications.’’In Small Systems Water Treatment Technologies:State of the Art Workshop .NEWWA Joint Regional Operations Conference and Exhibition. Marlborough, Massachusetts. Davnor Water Treatment Technologies Ltd.: Company website: http://www.davnor.com
EBPI: Company website: http://www.ebpi-kits.com
Fogel, D., Judith I., Guasparini, R., Moorehead, W. & Ongerth, J. (1993), ‘Removing Giardia and Cryptosporidium by Slow Sand Filtration.’ Journal of the American Water Works Association, vol. 85, no. 11, pp. 77-84.
Graham, N. J. D. (1988), Slow sand filtration: Recent Developments in Water Treatment Technology, Ellis Horwood, Ltd., Chichester, England.
BioSand Household Water Filter Project in Nepal References
79
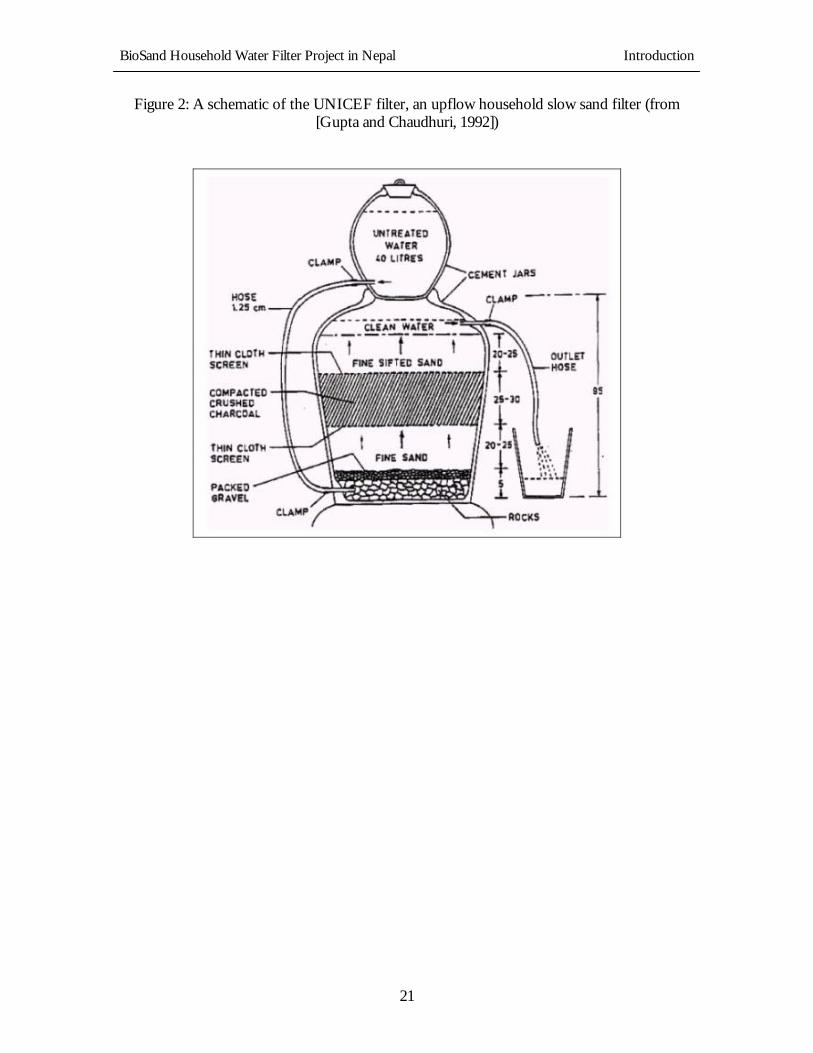
Gupta A. & Chaudhuri M. (1992), ‘Domestic water purification for developing countries’. Aqua vol. 41, no. 5, pp. 290–298
Haarhoff, Johannes, and John L. Cleasby. (1991), ‘Biological and Physical Mechanisms in Slow Sand Filtration.’ Slow Sand Filtration. Gary Logsdon, ed. American Society of Civil Engineers, New York
Hach, (2000), “The Use of Indicator Organisms to Assess Public Water Safety”, Technical Information Series- Booklet No. 13.
Hach Company website: http://www.hach.com
Huisman, L. & Wood, W.E. (1974) Slow Sand Filtration, World Health Organization, Geneva.
IDRC Module 5. 1998: Slow Sand Filters
J.C. Van Duk & J.H.C.M. Oomer, (1978), ‘Slow Sand Filtration for Community Water Supply in Developing Countries,’ Technical Paper No. 2, WHO International Reference Center for Community Water Supply, Voorburg (The Hague), The Netherlands.
Jellison, K. L., Dick, R. I., Weber-Shirk, M. L. (2000), ‘Enhanced Ripening of Slow Sand Filters’, Journal of Environmental Engineering, vol. 126, no. 12.
Letterman, R. D. (1991), ‘Operation and Maintenance’, Slow Sand Filtration. American Society of Civil Engineers, New York.
Logsdon, G. S. and Fox, K. R. (1998), ‘Slow Sand Filtration in the United States’, Slow Sand Filtration: Recent Developments in Water Treatment Technology, Ellis Horwood, Ltd., Chichester, England.
Logsdon, G. S. (1991) Foreword to Slow Sand Filtration, American Society of Civil Engineers, New York.
Manja, K. S., Maurya, M. S. & Rao, K. M. (1982), ‘A simple field test for the detection of fecal pollution in drinking water’, Bulletin of the World Health Organization, vol. 60, pp. 797-801.
Metcalf and Eddy Inc. (1991), Waste water engineering; Treatment, disposal and reuse (3rd ed.). McGraw-Hill Inc., New York.
Meyers, D. N. and Sylvester, M. A. (1997), “7.1 Fecal Indicator Bacteria.” U.S. Geological Survey TWRI Book 9. USGS.
Murcott, S., (2001), Personal Communication
Palmateer, G., Manz, D., Jurkovic, A., McInnis, R., Unger, S., Kwan, K. K., Dudka, B. J. (1999) ‘Toxicant and Parasite Challenge of Manz Intermittent Slow Sand Filter’, Environmental Toxicology, vol. 14, pp. 217-225.
BioSand Household Water Filter Project in Nepal References
80
Chettri, A. (Arjun) G. C. (2001a), Hope For The Nation, Nepal. Personal Communication
Chettri, U. (Uttam) G. C. (2001b), Hope For The Nation, Nepal. Translation of Flyer
Chettri, K. (Kishore) G. C. (2001c), Hope For The Nation, Nepal. Personal Communication
Magar, D. B. A. (2001), Personal Communication
Pillai, J., Gibbs, R., Mathew, K., and Ho, G. E. (1997). ‘Bacteriological water testing by H2S method’, 23rd WEDC Conference Proceedings, Durban, South Africa.
Hach Company. (2001), ‘Products for Analysis’, Loveland, CO.
Legge, G. (1996), “Relief for the Developing World: City Man Makes Water Safe”, Calgary Herald, Sunday, August 17. Article is available online at http://www.davnor.com/news/archives/august1796.htm
Lowey, M. (1993), “Water, water…”, Calgary Herald, Saturday, July 10. Article is available online at http://www.davnor.com/news/archives/july1093.htm
Paynter, N. (2001), Household Water Use and Treatment Practices in Rural Nepal: BioSand Filter Evaluation and Considerations for Future Projects. Masters thesis, Massachusetts Institute of Technology. Pearce-McLeay, S. (1996) “Filter Offers Healthy Hope for Safer Water Supply”, The Pegg. Article is available online at http://www.davnor.com/news/archives/september96.htm
Pyper, G. R., & Logsdon, G. S., (1991) ‘Slow Sand Filter Design’, Slow Sand Filtration. American Society of Civil Engineers, New York.
Ritenour, R. (1998), BioSand household water filter: A transfer of slow sand filtration technology to developing countries. 3rd ed. Samaritan’s Purse, Canada.
Sagara, J. (2000) Study of Filtration for Point-of-Use Drinking Water Treatment in Nepal. Master thesis, Massachusetts Institute of Technology.
Schuler, P. F., Ghosh, M. M., & Gopalan, P. (1991). ‘Slow sand and diatomaceous earth filtration of cysts and other particulates’, Water Resources, vol. 25, no.8, pp. 995–1005.
Schulz, C. R. & Okum, D. A. (1984). Surface Water Treatment for Communities in Developing Countries. John Wiley & Sons, New York.
Sims, R. C. & Slezak, L. A. (1991), ‘Slow Sand Filtration: Present Practice in the United States." Slow Sand Filtration. Gary Logsdon, ed. American Society of Civil Engineers, New York.
BioSand Household Water Filter Project in Nepal References
81
Spruijt, Hans. (2000). Head of Water and Environmental Studies, UNICEF-Nepal, Personal Communication with Nat Paynter.
Timms, S., Slade, J.S. & Fricker, C. S. (1994), ‘Removal of cryptosporidium by slow sand filtration’, Water Science and Technology, vol. 31 no. 5, pp. 81-84.
University of Calgary (1994), News Release. Article is available online at http://www.davnor.com/news/archives/november1694.htm
Uniworld (1995), “Discoveries: University of Calgary”. Article is available online at http://www.davnor.com/news/archives/october95.htm
U.S. EPA. (1999), “The Importance of Turbidity” Guidance Manual Turbidity Provision.
University Technologies International. (1998), “Clean Drinking Water to the World” , UTI Link. Article is available online at http://www.davnor.com/news/archives/researchpg3.htm
Visscher, J.T., Paramasivam, R., Raman, A. & Heijnen, H. A. (1987). Slow Sand Filtration for Community Water Supply. International Water and Sanitation Center, The Hague.
Weber-Shirk, M. L. and Dick, R. I. (1997a), ‘Biological Mechanisms in Slow Sand Filters’ Journal American Water Works Association, vol. 89, no.2, pp. 72-83.
Weber-Shirk, M. L. and Dick, R. I. (1997b), ‘Physical-Chemical Mechanisms in Slow Sand Filters’ Journal American Water Works Association, vol. 89, no.1, pp. 87-100.
Weber-Shirk, M. L. and Dick, R. I. (1999), ‘Bacterivory by a Chrysophyte in Slow Sand Filters’ Water Research, vol. 33, no. 3, pp. 631-638.
WHO, (1993) Guidelines for drinking-water quality, 2nd ed. Geneva, Vol. 1, pp. 131-143
BioSand Household Water Filter Project in Nepal Appendix A
82
APPENDIX A: LIST OF EQUIPMENT USED DURING FIELD TRIP
IN NEPAL
1. Hach Pocket Turbidimeter x 1
2. P/A Ampules with MUG Reagent x 40
3. Hach PathoScreen Medium x 100
4. 100mL Bottles x 12
5. 20ml Bottles x 50
6. Fluorescent Light with Spare Tube x 1
7. Toenail clipper x 1
8. Rubbing Alcohol x 1
9. Candle and Matches x 1
10. Ampule breaker x 1
11. Incubator equipment: 20mL x 2, 100mL x 2
12. Plastic Sample Bottle x 12
BioSand Household Water Filter Project in Nepal Appendix B
83
APPENDIX B: TURBIDITY MEASUREMENT STATISTICS
Influent Turbidity
All Filters
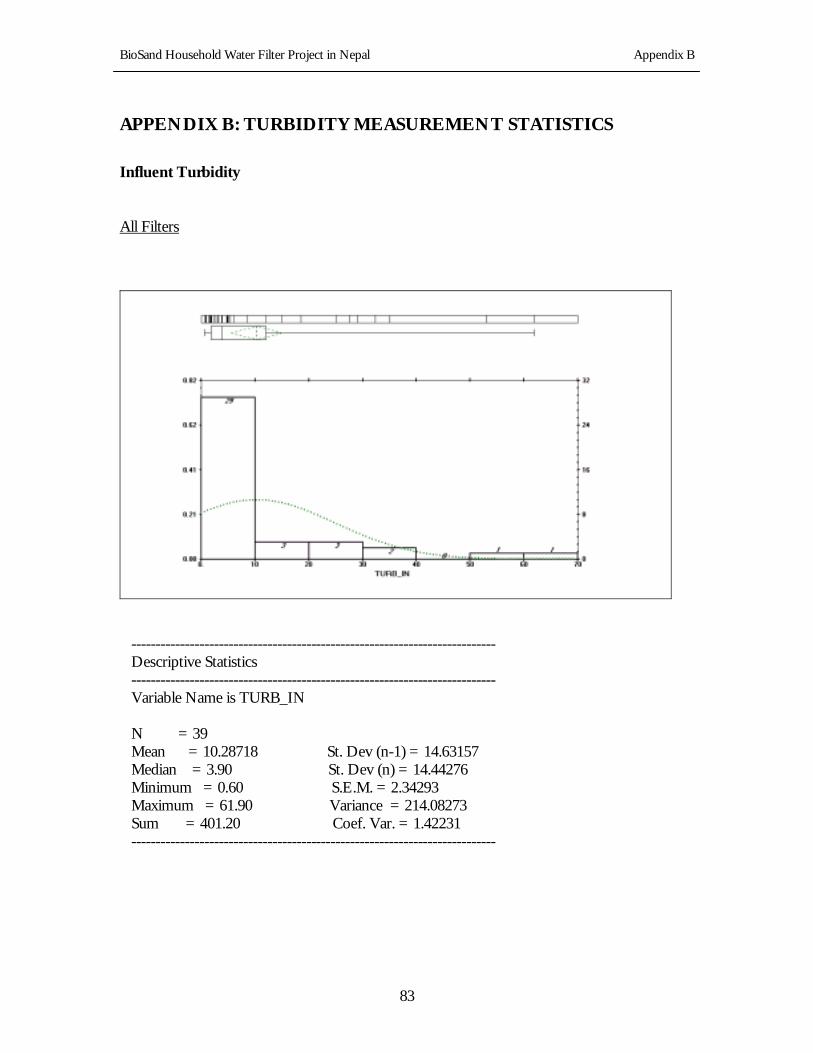
--------------------------------------------------------------------------- Descriptive Statistics --------------------------------------------------------------------------- Variable Name is TURB_IN N = 39 Mean = 10.28718 St. Dev (n-1) = 14.63157 Median = 3.90 St. Dev (n) = 14.44276 Minimum = 0.60 S.E.M. = 2.34293 Maximum = 61.90 Variance = 214.08273 Sum = 401.20 Coef. Var. = 1.42231 ---------------------------------------------------------------------------
BioSand Household Water Filter Project in Nepal Appendix B
84
Filters that were working properly
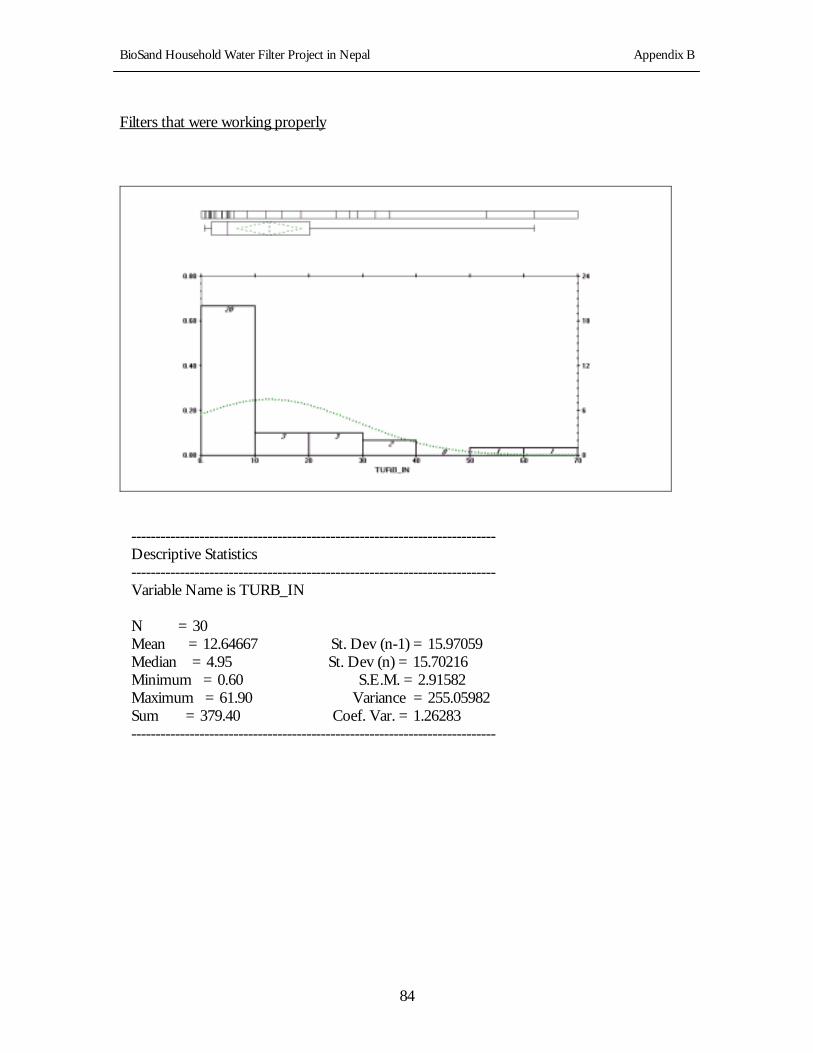
--------------------------------------------------------------------------- Descriptive Statistics --------------------------------------------------------------------------- Variable Name is TURB_IN N = 30 Mean = 12.64667 St. Dev (n-1) = 15.97059 Median = 4.95 St. Dev (n) = 15.70216 Minimum = 0.60 S.E.M. = 2.91582 Maximum = 61.90 Variance = 255.05982 Sum = 379.40 Coef. Var. = 1.26283 ---------------------------------------------------------------------------
BioSand Household Water Filter Project in Nepal Appendix B
85
Effluent turbidity
All Filters
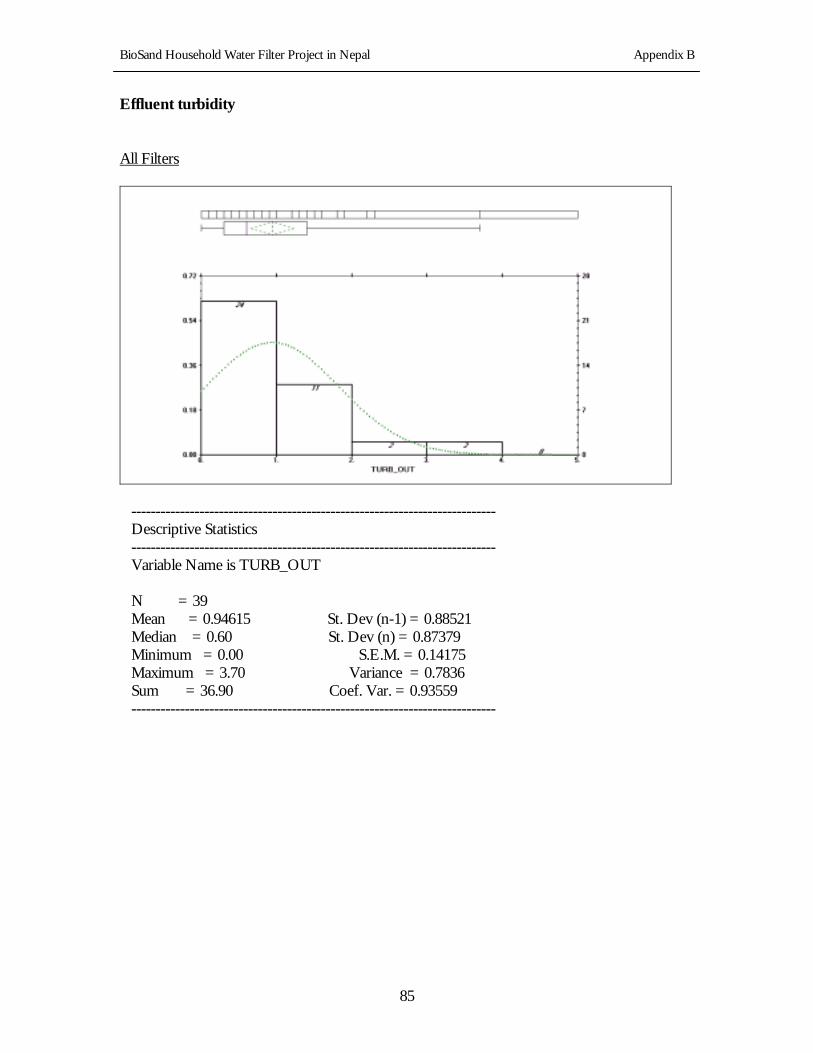
--------------------------------------------------------------------------- Descriptive Statistics --------------------------------------------------------------------------- Variable Name is TURB_OUT N = 39 Mean = 0.94615 St. Dev (n-1) = 0.88521 Median = 0.60 St. Dev (n) = 0.87379 Minimum = 0.00 S.E.M. = 0.14175 Maximum = 3.70 Variance = 0.7836 Sum = 36.90 Coef. Var. = 0.93559 ---------------------------------------------------------------------------
BioSand Household Water Filter Project in Nepal Appendix B
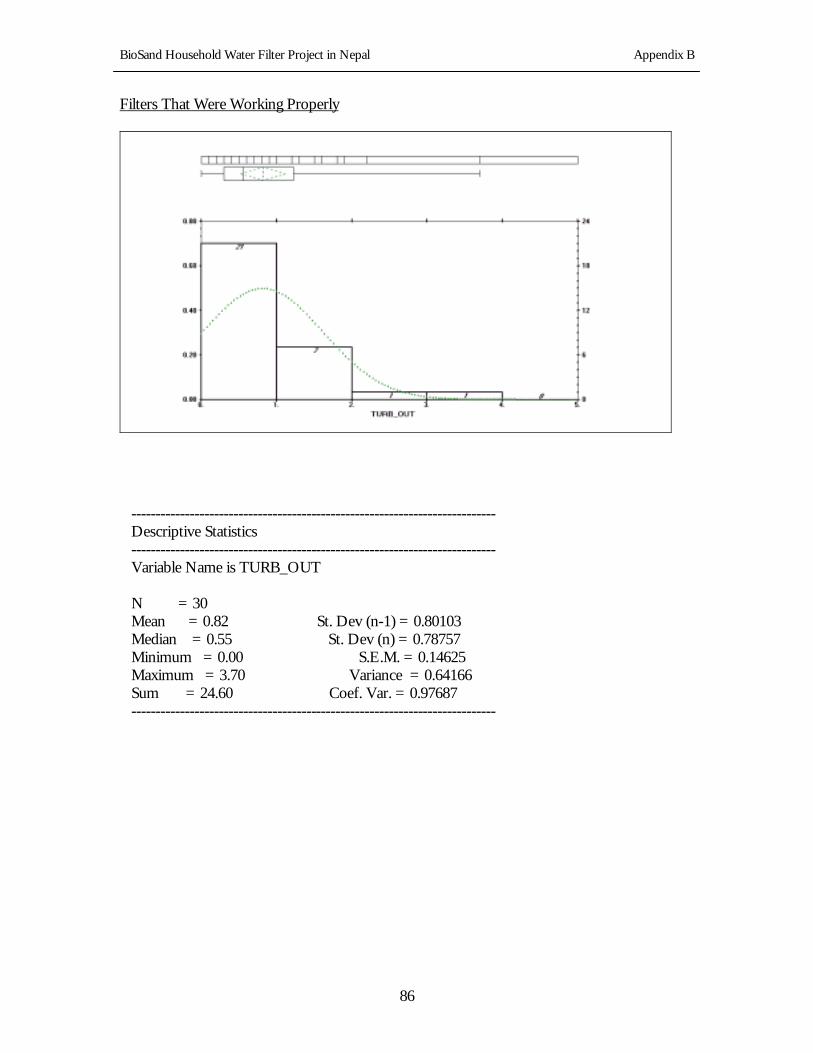
86
Filters That Were Working Properly
--------------------------------------------------------------------------- Descriptive Statistics --------------------------------------------------------------------------- Variable Name is TURB_OUT N = 30 Mean = 0.82 St. Dev (n-1) = 0.80103 Median = 0.55 St. Dev (n) = 0.78757 Minimum = 0.00 S.E.M. = 0.14625 Maximum = 3.70 Variance = 0.64166 Sum = 24.60 Coef. Var. = 0.97687 ---------------------------------------------------------------------------
BioSand Household Water Filter Project in Nepal Appendix B
87
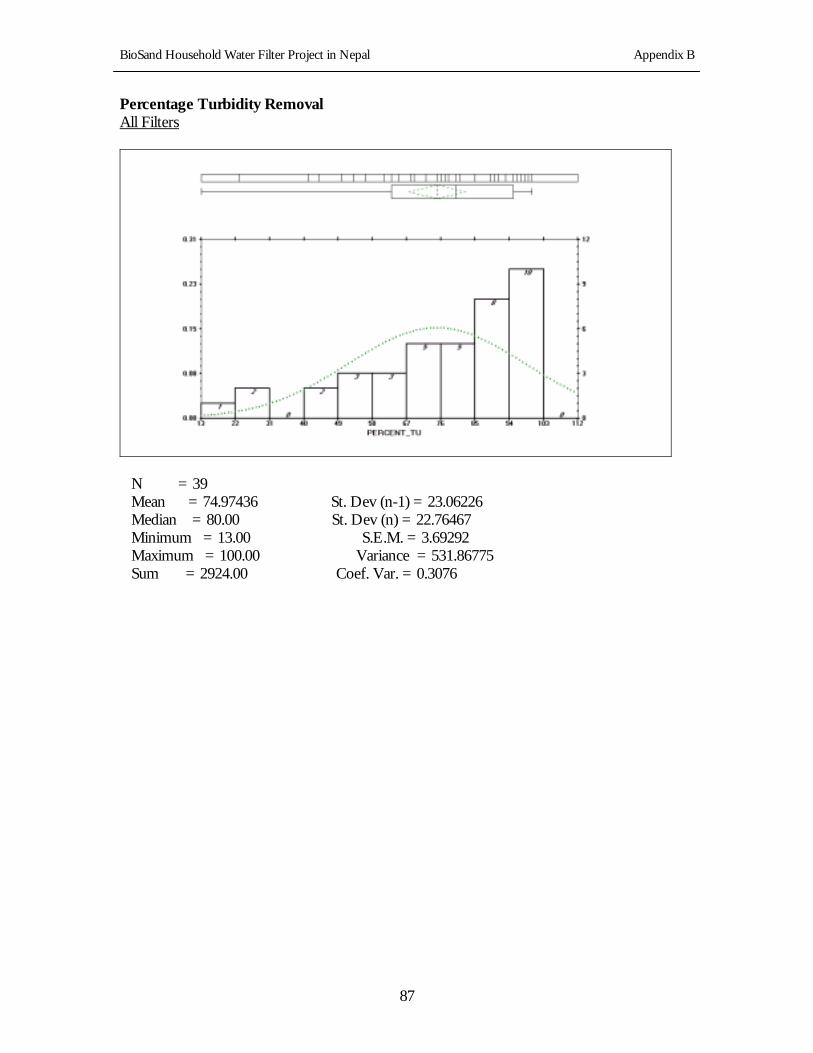
Percentage Turbidity Removal All Filters
N = 39 Mean = 74.97436 St. Dev (n-1) = 23.06226 Median = 80.00 St. Dev (n) = 22.76467 Minimum = 13.00 S.E.M. = 3.69292 Maximum = 100.00 Variance = 531.86775 Sum = 2924.00 Coef. Var. = 0.3076
BioSand Household Water Filter Project in Nepal Appendix B
88
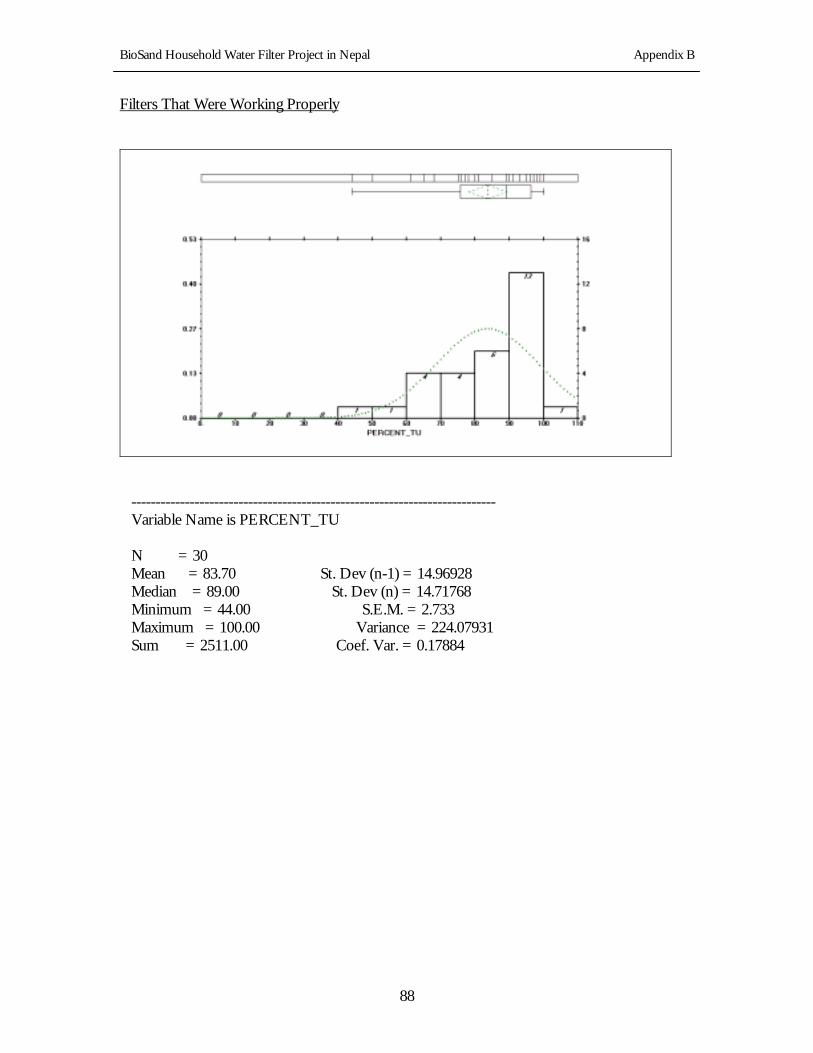
Filters That Were Working Properly
--------------------------------------------------------------------------- Variable Name is PERCENT_TU N = 30 Mean = 83.70 St. Dev (n-1) = 14.96928 Median = 89.00 St. Dev (n) = 14.71768 Minimum = 44.00 S.E.M. = 2.733 Maximum = 100.00 Variance = 224.07931 Sum = 2511.00 Coef. Var. = 0.17884
BioSand Household Water Filter Project in Nepal Appendix C
89
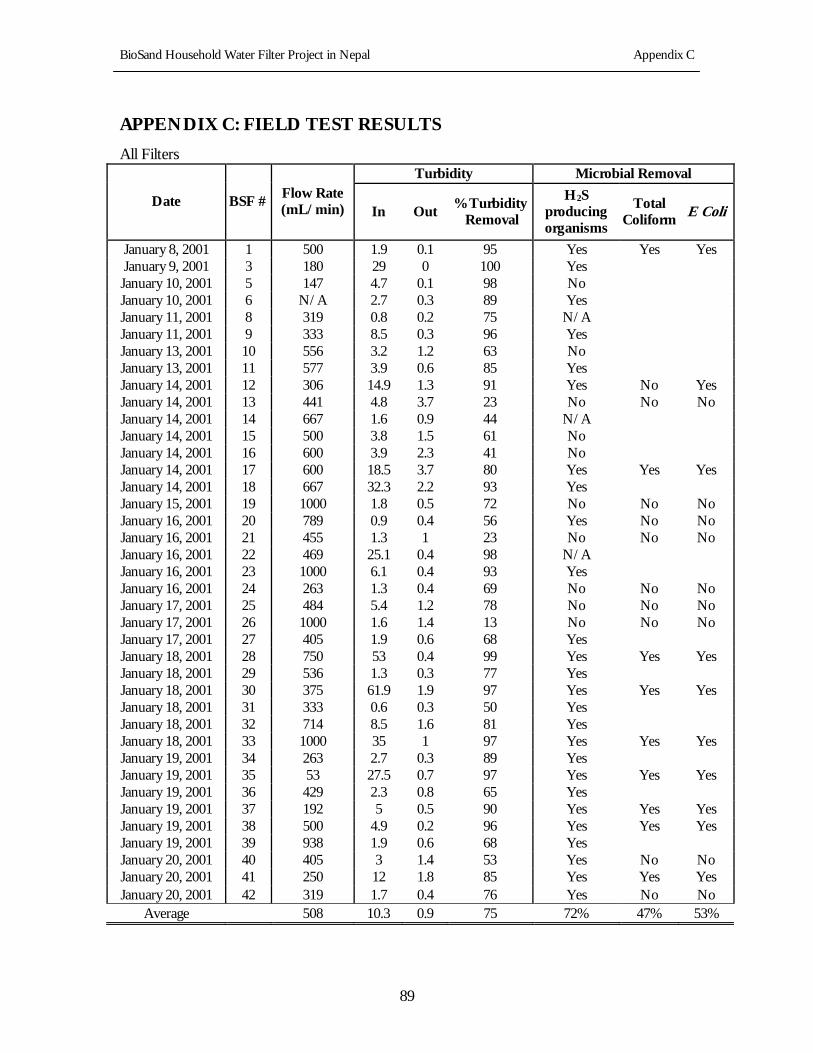
APPENDIX C: FIELD TEST RESULTS
All Filters Turbidity Microbial Removal
Date BSF # Flow Rate (mL/min) In Out
% Turbidity Removal
H2S producing organisms
Total Coliform
E Coli
January 8, 2001 1 500 1.9 0.1 95 Yes Yes Yes January 9, 2001 3 180 29 0 100 Yes January 10, 2001 5 147 4.7 0.1 98 No January 10, 2001 6 N/A 2.7 0.3 89 Yes January 11, 2001 8 319 0.8 0.2 75 N/A January 11, 2001 9 333 8.5 0.3 96 Yes January 13, 2001 10 556 3.2 1.2 63 No January 13, 2001 11 577 3.9 0.6 85 Yes January 14, 2001 12 306 14.9 1.3 91 Yes No Yes January 14, 2001 13 441 4.8 3.7 23 No No No January 14, 2001 14 667 1.6 0.9 44 N/A January 14, 2001 15 500 3.8 1.5 61 No January 14, 2001 16 600 3.9 2.3 41 No January 14, 2001 17 600 18.5 3.7 80 Yes Yes Yes January 14, 2001 18 667 32.3 2.2 93 Yes January 15, 2001 19 1000 1.8 0.5 72 No No No January 16, 2001 20 789 0.9 0.4 56 Yes No No January 16, 2001 21 455 1.3 1 23 No No No January 16, 2001 22 469 25.1 0.4 98 N/A January 16, 2001 23 1000 6.1 0.4 93 Yes January 16, 2001 24 263 1.3 0.4 69 No No No January 17, 2001 25 484 5.4 1.2 78 No No No January 17, 2001 26 1000 1.6 1.4 13 No No No January 17, 2001 27 405 1.9 0.6 68 Yes January 18, 2001 28 750 53 0.4 99 Yes Yes Yes January 18, 2001 29 536 1.3 0.3 77 Yes January 18, 2001 30 375 61.9 1.9 97 Yes Yes Yes January 18, 2001 31 333 0.6 0.3 50 Yes January 18, 2001 32 714 8.5 1.6 81 Yes January 18, 2001 33 1000 35 1 97 Yes Yes Yes January 19, 2001 34 263 2.7 0.3 89 Yes January 19, 2001 35 53 27.5 0.7 97 Yes Yes Yes January 19, 2001 36 429 2.3 0.8 65 Yes January 19, 2001 37 192 5 0.5 90 Yes Yes Yes January 19, 2001 38 500 4.9 0.2 96 Yes Yes Yes January 19, 2001 39 938 1.9 0.6 68 Yes January 20, 2001 40 405 3 1.4 53 Yes No No January 20, 2001 41 250 12 1.8 85 Yes Yes Yes January 20, 2001 42 319 1.7 0.4 76 Yes No No
Average 508 10.3 0.9 75 72% 47% 53%
BioSand Household Water Filter Project in Nepal Appendix C
90
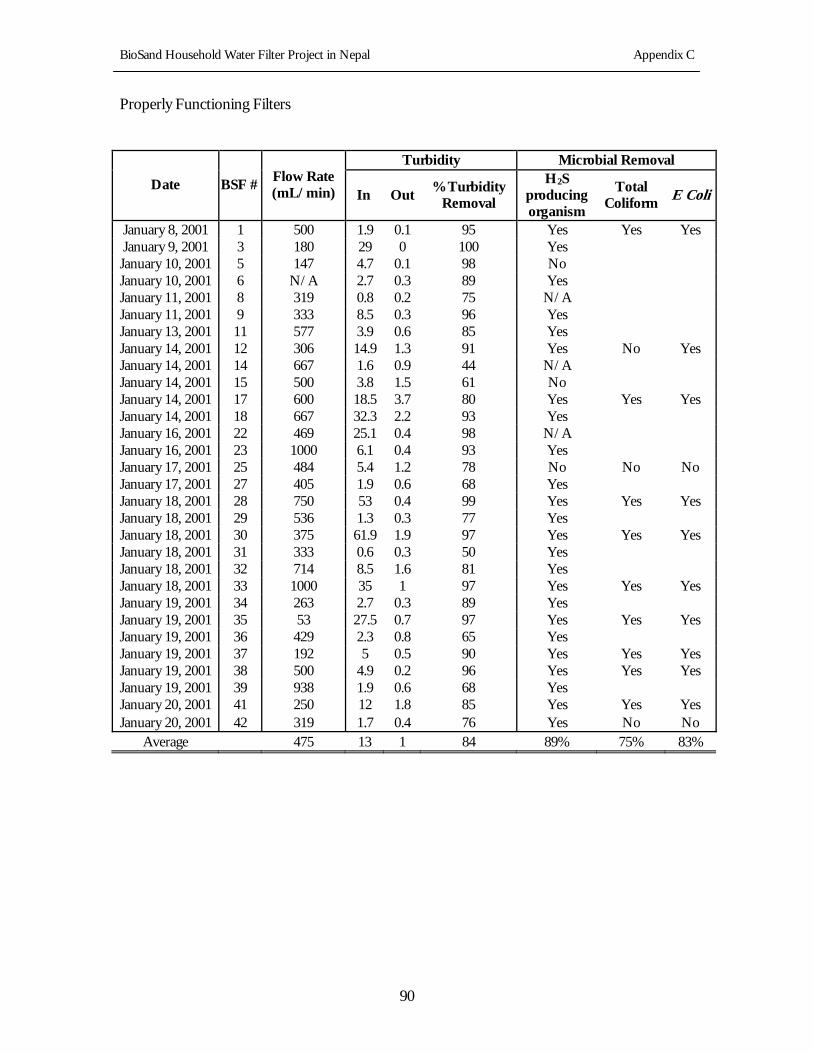
Properly Functioning Filters
Turbidity Microbial Removal
Date BSF # Flow Rate (mL/min) In Out
% Turbidity Removal
H2S producing organism
Total Coliform
E Coli
January 8, 2001 1 500 1.9 0.1 95 Yes Yes Yes January 9, 2001 3 180 29 0 100 Yes January 10, 2001 5 147 4.7 0.1 98 No January 10, 2001 6 N/A 2.7 0.3 89 Yes January 11, 2001 8 319 0.8 0.2 75 N/A January 11, 2001 9 333 8.5 0.3 96 Yes January 13, 2001 11 577 3.9 0.6 85 Yes January 14, 2001 12 306 14.9 1.3 91 Yes No Yes January 14, 2001 14 667 1.6 0.9 44 N/A January 14, 2001 15 500 3.8 1.5 61 No January 14, 2001 17 600 18.5 3.7 80 Yes Yes Yes January 14, 2001 18 667 32.3 2.2 93 Yes January 16, 2001 22 469 25.1 0.4 98 N/A January 16, 2001 23 1000 6.1 0.4 93 Yes January 17, 2001 25 484 5.4 1.2 78 No No No January 17, 2001 27 405 1.9 0.6 68 Yes January 18, 2001 28 750 53 0.4 99 Yes Yes Yes January 18, 2001 29 536 1.3 0.3 77 Yes January 18, 2001 30 375 61.9 1.9 97 Yes Yes Yes January 18, 2001 31 333 0.6 0.3 50 Yes January 18, 2001 32 714 8.5 1.6 81 Yes January 18, 2001 33 1000 35 1 97 Yes Yes Yes January 19, 2001 34 263 2.7 0.3 89 Yes January 19, 2001 35 53 27.5 0.7 97 Yes Yes Yes January 19, 2001 36 429 2.3 0.8 65 Yes January 19, 2001 37 192 5 0.5 90 Yes Yes Yes January 19, 2001 38 500 4.9 0.2 96 Yes Yes Yes January 19, 2001 39 938 1.9 0.6 68 Yes January 20, 2001 41 250 12 1.8 85 Yes Yes Yes January 20, 2001 42 319 1.7 0.4 76 Yes No No