124
Biosphere 2

Biosphere 2

Warm Up (3-30-15)
• Explain what a biomass pyramid is and how much energy is transferred to the next level.
Outline
• Objectives• Population Ecology• Chapter 13 – biology book

Objectives
• Students will explain interactions of populations within biomes.
• Students will practice measuring off sections of land for the quadrant method of site identification and separation.

Population Ecology
• Notes chapter 13 biology book

Survivorship Curves
• Type 1– Common in large mammals (humans)– Low infant mortality– Population generally survives to old age– Common behavior: parental care for young
• Infants can’t care for themselves• Parents can better ensure offspring will stay alive until
they can care for themselves

Survivorship Curves
• Type 2– Birds, small mammals, some reptiles– Survivorship rate is roughly equal at all ages
• Equal chance of living and dying at all ages– Either because of disease or predation
• Type 3– Invertebrates, fish, amphibians, plants– High birthrate, high infant mortality rate– Many offspring will die – predation, few will survive
to adulthood and pass on genes


QuickLab: Survivorship Curves
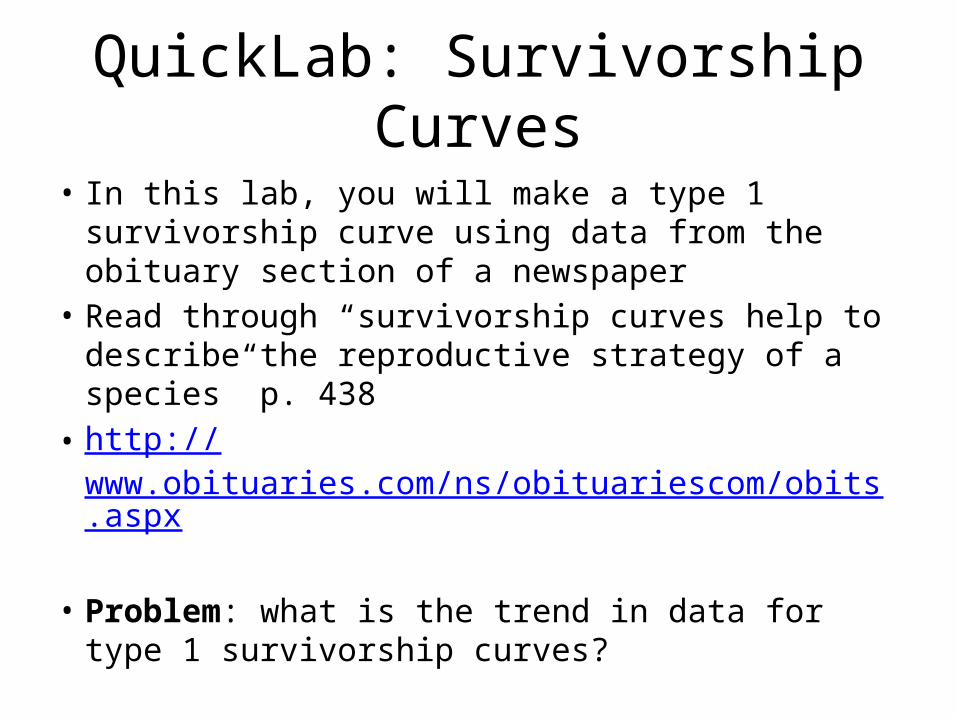
• In this lab, you will make a type 1 survivorship curve using data from the obituary section of a newspaper
• Read through “survivorship curves help to describe the reproductive strategy of a species” p. 438
• http://www.obituaries.com/ns/obituariescom/obits.aspx
• Problem: what is the trend in data for type 1 survivorship curves?

QuickLab: Survivorship Curves
• Procedure:– Obtain the obituary section of the newspaper– Create a data table like the one at the right of page 438 that
extends to include five-year age groups up to 91-95 years.– For 35 obituaries, place a tally next to the age group in
which the individual died– Subtract the number of individuals that died from the
number of remaining survivors, and record the answer in the third column of your data table. Calculate the percent surviving in each age group by dividing the number of survivors by 35 and multiplying by 100. Repeat this step for all age groups
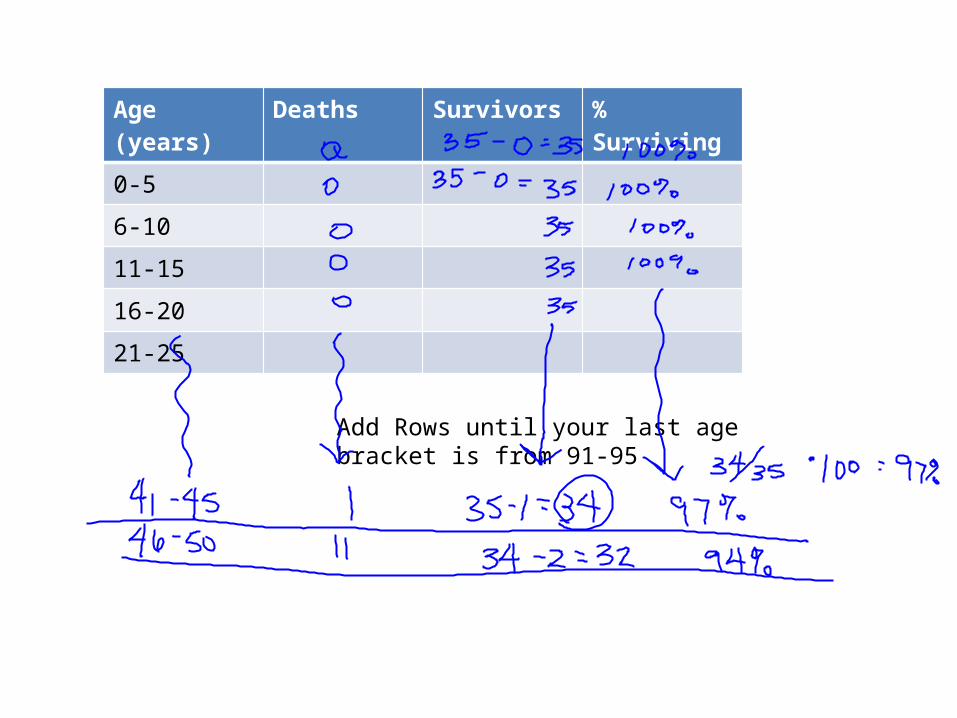
Age (years) Deaths Survivors % Surviving
0-5
6-10
11-15
16-20
21-25
Add Rows until your last age bracket is from 91-95

QuickLab: Survivorship Curves
• Analyze and Conclude:– Draw a survivorship curve by plotting the age
group on the x-axis and the percent surviving on the y-axis
– Explain the trend in the data by looking at your graph.

Warm Up (3-31-15)
• What is population ecology and why is it useful?

Outline
• Objectives• Population Ecology• Jackson Lake walk through

Objectives
• Students will explain interactions of populations within biomes.
• Students will practice measuring off sections of land for the quadrant method of site identification and separation.
• Students will practice the tests and observations that they will need to make during the population ecology study of Jackson Lake

Marine Ecosystems
• Global– Ocean can be divided into zones
• Intertidal zone: strip of land between high and low tide lines
• Neritic zone: extends from the intertidal zone out to the edge of the continental shelf. (Cm deep – 200m)
• Bathyal zone: extends from edge of neritic zone to the base of the continental shelf (200-2000m)
• Abyssal zone: below 2000m, complete darkness
– Coastal waters contain unique habitats

Estuaries and Freshwater Ecosystems
• Freshwater ecosystems include estuaries and flowing / standing water– Estuaries: dynamic environments where rivers
flow into the oceans• Phytoplankton and zooplankton
– Fish and crustaceans
• Protected refuge for many species
– Moving / Standing Water• Water temp, O2 levels, pH, and flow rate all determine
the variety of species

Water Quality
• Water pollution affects ecosystems– Indicator species: bioindicator, species provides sign or
indication of quality of ecosystem’s environmental conditions• Scientists use the indicator species to determine the health of an
ecosystem
• Biomagnification causes accumulation of toxins in the food chain– Biomagnification: a pollutant moves up the food chain as
predators eat prey, accumulating in higher concentrations in the bodies of predators
– Read 495 – last paragraph

Modeling Biomagnification (20min)
• P. 496

Population Ecology
• Notes chapter 13 biology book

13.1 KEY CONCEPT Ecology is the study of the relationships among organisms and their environment.

Ecologists study environments at different levels of organization.
• Ecology is the study of the interactions among living things, and between living things and their surroundings.

• An organism is an individual living thing, such as an alligator.
• A population is a group of the same species that lives in one area.
• A community is a group of different species that live together in one area.
• An ecosystem includes all of the organisms as well as the climate, soil, water, rocks and other nonliving things in a given area.
• A biome is a major regional or global community of organisms characterized by the climate conditions and plant communities that thrive there.

Ecological research methods include observation, experimentation, and modeling.
• Observation is the act of carefully watching something over time.
• Observations of populations can be done by visual surveys.
– Direct surveys for easy to spot species employ binoculars or scopes.
– Indirect surveys are used for species that are difficult to track and include looking for other signs of their presence.

• Experiments are performed in the lab or in the field.– Lab experiments give researchers more control. – Lab experiments are not reflective of the complex
interactions in nature.– Field experiments give a
more accurate picture of natural interactions.
– Field experiments may not help determine actual cause and effect.

• Computer and mathematical models can be used to describe and model nature.
• Modeling allows scientists to learn about organisms or ecosystems in ways that would not be possible in a natural or lab setting.
Ecologists use data transmitted by GPS receivers worn by
elephants to develop computer models of the animal’s
movements.

13.2 KEY CONCEPT Every ecosystem includes both living and nonliving factors.

An ecosystem includes both biotic and abiotic factors.
• Biotic factors are living things.– plants– animals– fungi– bacteria
plants

• Abiotic factors are nonliving things. – moisture– temperature– wind– sunlight – soil
moisture
sunlight

13.3 KEY CONCEPT Life in an ecosystem requires a source of energy.
Producers provide energy for other organisms in an ecosystem.
• Producers get their energy from non-living resources.• Producers are also called autotrophs because they make their
own food.

Producers provide energy for other organisms in an ecosystem.
• Consumers are organisms that get their energy by eating other living or once-living resources.
• Consumers are also called heterotrophs because they feed off of different things.

Almost all producers obtain energy from sunlight.
• Photosynthesis in most producers uses sunlight as an energy source.
• Chemosynthesis in prokaryote producers uses chemicals as an energy source.
carbon dioxide + water +hydrogen sulfide + oxygen
sugar + sulfuric acid

13.4 KEY CONCEPT Food chains and food webs model the flow of energy in an ecosystem.

A food chain is a model that shows a sequence of feeding relationships.
• A food chain links species by their feeding relationships. • A food chain follows the connection between one producer and
a single chain of consumers within an ecosystem.
DESERT COTTONTAILGRAMA GRASS HARRIS’S HAWK

• Consumers are not all alike.– Herbivores eat only plants.– Carnivores eat only animals.– Omnivores eat both plants and animals.– Detritivores eat dead organic matter.– Decomposers are detritivores that break down organic
matter into simpler compounds.
carnivore decomposer

• Specialists are consumers that primarily eat one specific organism or a very small number of organisms.
• Generalists are consumers that have a varying diet.

• Trophic levels are the nourishment levels in a food chain.– Primary consumers are herbivores that eat producers. – Secondary consumers are carnivores that eat
herbivores.– Tertiary consumers are carnivores that eat secondary
consumers.– Omnivores, such as humans that eat both plants and
animals, may be listed at different trophic levels in different food chains.

A food web shows a complex network of feeding relationships.
• An organism may have multiple feeding relationships in an ecosystem.
• A food web emphasizes complicated feeding relationships and energy flow in an ecosystem.

Changing one factor in an ecosystem can affect many other factors.
• Biodiversity is the assortment, or variety, of living things in an ecosystem.
• Rain forests have more biodiversity than other locations in the world, but are threatened by human activities.

• A keystone species is a species that has an unusually large effect on its ecosystem.
keystone

• Keystone species form and maintain a complex web of life.
creation ofwetlandecosystem
increased waterfowlPopulation
increased fishpopulation
nesting sites for birds
keystone species
13.5 KEY CONCEPT Matter cycles in and out of an ecosystem.

Water cycles through the environment.
• The hydrologic, or water, cycle is the circular pathway of water on Earth.
• Organisms all have bodies made mostly of water.
precipitation condensation
transpiration
evaporation
water storagein ocean
surfacerunoff
lake
groundwater
seepage

Elements essential for life also cycle through ecosystems.
• A biogeochemical cycle is the movement of a particular chemical through the biological and geological parts of an ecosystem.
• The main processes involved in the oxygen cycle are photosynthesis and respiration.

• Oxygen cycles indirectly through an ecosystem by the cycling of other nutrients.
oxygen
respiration
carbondioxide
photosynthesis
fossil fuels
photosynthesis
carbon dioxidedissolved in water
decompositionof organisms
respiration
carbondioxidein air
photosynthesis
combustionrespiration
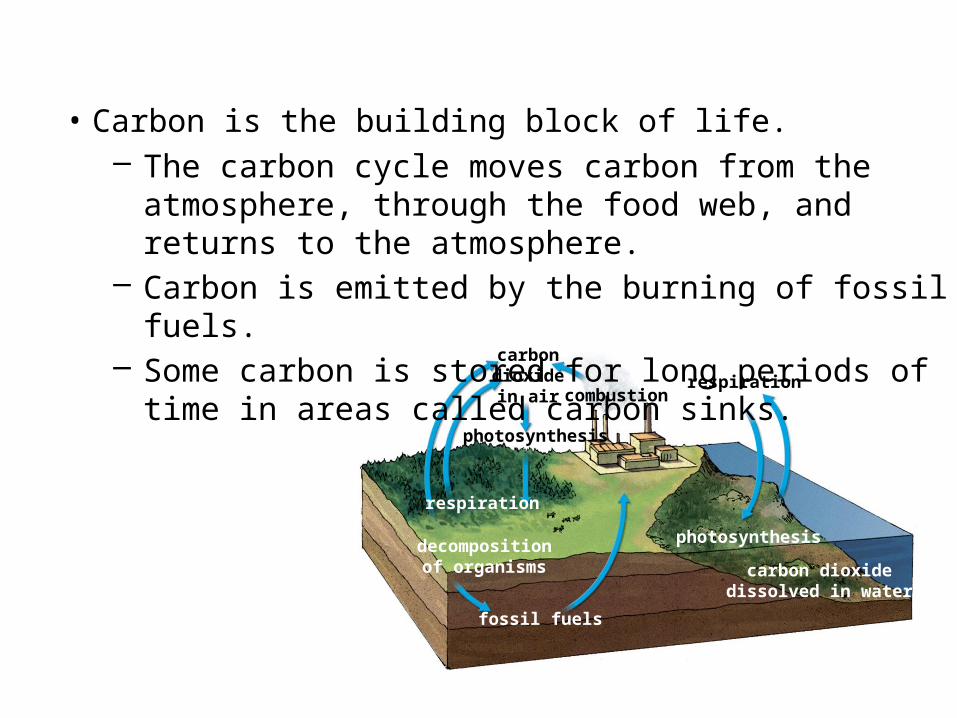
• Carbon is the building block of life.– The carbon cycle moves carbon from the atmosphere,
through the food web, and returns to the atmosphere.– Carbon is emitted by the burning of fossil fuels.– Some carbon is stored for long periods of time in areas
called carbon sinks.

nitrogen inatmosphere
animals
denitrifyingbacteria
nitrifyingbacteria
nitrifyingbacteria
ammonium
ammonification
decomposers
plant
nitrogen-fixingbacteria in soil
nitrogen-fixingbacteria in
roots
nitrates
nitrites
• The nitrogen cycle mostly takes place underground.– Some bacteria convert gaseous nitrogen into ammonia
through a process called nitrogen fixation.– Some nitrogen-fixing bacteria live in
nodules on theroots of plants;others livefreely inthe soil.

– Ammonia released into the soil is transformed into ammonium.
– Nitrifying bacteria change the ammonium into nitrate.– Nitrogen moves through the food
web and returnsto the soil duringdecomposition.
geologic upliftingrain
weathering ofphosphate from rocks
runoff
sedimentationforms new rocks
leaching
phosphate in solutionanimals
plants
decomposers
phosphatein soil
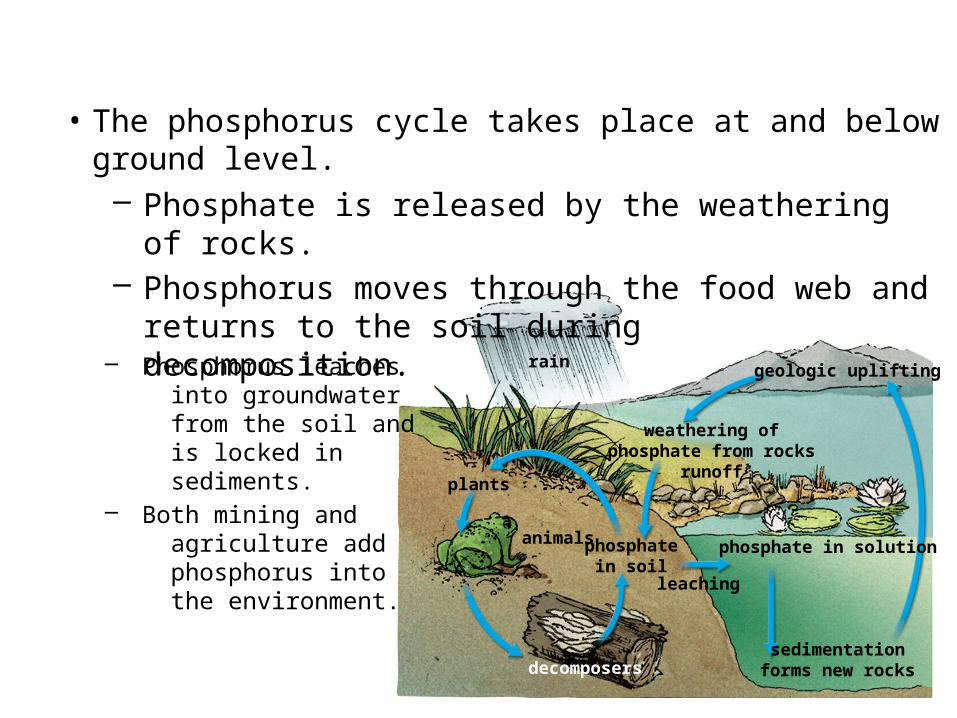
• The phosphorus cycle takes place at and below ground level.
– Phosphate is released by the weathering of rocks. – Phosphorus moves through the food web and returns to
the soil duringdecomposition.– Phosphorus leaches
into groundwater from the soil and is locked in sediments.
– Both mining and agriculture add phosphorus into the environment.

13.6 KEY CONCEPT Pyramids model the distribution of energy and matter in an ecosystem.

energy transferredenergy
lost
An energy pyramid shows the distribution of energy among trophic levels.
• Energy pyramids compare energy used by producers and other organisms on trophic levels.
• Between each tier of an energy pyramid, up to 90 percent of the energy is lost into the atmosphere as heat.
• Only 10 percent of the energy at each tier is transferred from one trophic level to the next.

Other pyramid models illustrate an ecosystem’s biomass and distribution of organisms.
• Biomass is a measure of the total dry mass of organisms in a given area.
tertiaryconsumers
secondaryconsumers
primaryconsumers
producers
75 g/m2
150g/m2
675g/m2
2000g/m2producers 2000g/m2

• A pyramid of numbers shows the numbers of individual organisms at each trophic level in an ecosystem.
tertiaryconsumers
secondaryconsumers
primaryconsumers
producers
5
5000
500,000
5,000,0005,000,000producers
• A vast number of producers are required to support even a few top level consumers.

Jackson Lake Walk through
• We are going to walk through all of the tests that you will be required to do while at Jackson Lake.
• Please ask questions along the way because you will be expected to be able to demonstrate knowledge of all of these tests when we go out into the field on our field trip.

Warm Up (4-1-15)
• What are some of the questions that you still have about the tests that you will be required to do while at Jackson lake?

Outline
• Objectives• Population Ecology• Jackson Lake Walk Through

Objectives
• Students will be able to explain what population ecology is and how population ecology works within the biomes.
• Students will be able to identify interactions between organisms within a particular biome

Quadrants and Population Size
• P. 401• Read through this as a class and work through
some of the sample problems together.• T=NA• T is total population estimate• N is total # of individuals counted / number of
quadrants• A is total area / area of quadrant

Quadrats and Population Size
• Example Problems– A scientist uses a Quadrat of 2sq.m. to estimate
the population of daisies in a field. She counts 173 individuals in 15 quadrats. The total area of the field is 150 sq.m.

Quadrats and Population Size
• Example Problems– A scientist uses a 0.25 sq.m. quadrat to sample a
population of dandelions in a garden that is 500sq.m. The number of dandelions counted in 10 quadrats is 63

Random Sampling
• P. 420• In this activity, you will use random sampling
to calculate the number of big bluestems, a typical tall-grass species, found in a restored prairie.
• Problem: How many big bluestems are in the field?

Random Sampling• Procedure:
– Cut 14 equal-sized paper squares– Letter seven of the squares A-G. Number seven of the squares 1-7. Place
the lettered squares and numbered squares in separate containers.– In your notebook, draw a data table like the one below. Include 12 rows in
your table– The pictured grid is your study plot. It is part of a larger grassland. The
study plot measures 7 meters on each side, and each grid segment measures 1 m by 1m. A single big bluestem plant is represented by each dot.
– Determine which segment you will count by taking one square from each container without looking. Locate the letter-number combination on the grid and count the number of big bluestem plants. Record this number in your data table. Place each square back in its container. Repeat step 5 until you have collected data for 12 different grid-segments. Do not count the same segment twice.

Random Sampling
• Calculate– Complete the calculation datasheet to estimate the
population size• Analyze and conclude
– Experimental design: why were paper squares used to determine which grid segment to count? Why didn’t you just choose ten grid segments on your own?
– Evaluate: How could you change the procedure to reduce your percent error?
– Analyze: What are the advantages of using random sampling to estimate population size? What are the disadvantages?
Jackson Lake Walk through
• We are going to walk through all of the tests that you will be required to do while at Jackson Lake.
• Please ask questions along the way because you will be expected to be able to demonstrate knowledge of all of these tests when we go out into the field on our field trip.

Warm Up (4-2-15)
• Explain what a pyramid of numbers is and how that is different from a biomass pyramid or a food pyramid.

Outline
• Objectives• Jackson Lake Walk through• Population notes• Practice Jackson Lake analysis

Objectives
• Students will be able to explain what population ecology is and how population ecology works within the biomes.
• Students will be able to identify interactions between organisms within a particular biome

Quadrats and Population Size
• Example Problems– A scientist uses a Quadrat of 2sq.m. to estimate
the population of daisies in a field. She counts 173 individuals in 15 quadrats. The total area of the field is 150 sq.m.

Quadrats and Population Size
• Example Problems– A scientist uses a 0.25 sq.m. quadrat to sample a
population of dandelions in a garden that is 500sq.m. The number of dandelions counted in 10 quadrats is 63

Random Sampling
• P. 420• In this activity, you will use random sampling
to calculate the number of big bluestems, a typical tall-grass species, found in a restored prairie.
• Problem: How many big bluestems are in the field?

Random Sampling• Procedure:
– Cut 14 equal-sized paper squares– Letter seven of the squares A-G. Number seven of the squares 1-7. Place
the lettered squares and numbered squares in separate containers.– In your notebook, draw a data table like the one below. Include 12 rows in
your table– The pictured grid is your study plot. It is part of a larger grassland. The
study plot measures 7 meters on each side, and each grid segment measures 1 m by 1m. A single big bluestem plant is represented by each dot.
– Determine which segment you will count by taking one square from each container without looking. Locate the letter-number combination on the grid and count the number of big bluestem plants. Record this number in your data table. Place each square back in its container. Repeat step 5 until you have collected data for 12 different grid-segments. Do not count the same segment twice.

Random Sampling
• Calculate– Complete the calculation datasheet to estimate the
population size• Analyze and conclude
– Experimental design: why were paper squares used to determine which grid segment to count? Why didn’t you just choose ten grid segments on your own?
– Evaluate: How could you change the procedure to reduce your percent error?
– Analyze: What are the advantages of using random sampling to estimate population size? What are the disadvantages?

Jackson Lake Walk through
• We are going to walk through all of the tests that you will be required to do while at Jackson Lake.
• Please ask questions along the way because you will be expected to be able to demonstrate knowledge of all of these tests when we go out into the field on our field trip.

Warm Up (4-13-15)
• Explain what is means to have a quadrat. What are quadrats used for?

Outline
• Objectives• Effects of changes in the environment• Modeling Predation

Objectives
• Students will model predation by creating a grid and using rice grains to represent fish.
• Students will be able to explain patterns that result during predation
• Students will be able to identify why random sampling is beneficial to predation.

Effects of Changes in the Environment
• Predict: What are some possible effects to an ecosystem if there was a particular toxin that was introduced? (keep in mind the biomass pyramid when you are answering)

Modeling Predation
• In this lab, you will model predation and the effects of changes in the environment on organisms. Blue herons are large birds that live in aquatic habitats and feed on fish, frogs, salamanders, lizards, small snakes, and dragonflies. You will model a lake filled with fish.
• Problem: How do changes in environmental factors affect the predation habits of the blue heron?

Modeling Predation• Procedure:
– Spread 200 rice grains over the grid. The grid represents the lake from which the heron feeds, and the rice grains represent fish.
– A blue heron will catch an average of two fish per hour during daylight. To model the heron hunting for fish, close your eyes and lower the end of the toothpick slowly down onto the grid.
– Remove the grains that are in the square touching the toothpick. Count the grains– Rearrange the remaining grains on the grid and repeat steps 2 and 3 five more times
to model one day’s worth of feeding for the heron. Count the total number of grains removed, and record this number in a data table like the one shown below.
– Repeat steps 2-4 five more times to represent six total days of feeding by the heron.– Return all of the removed rice grains to the grid. Runoff containing large amounts of
nitrates causes an algal bloom in the lake. When the algae die and decomposition occurs, the oxygen level in the lake becomes very low, causing fish to die. Remove 150 grains from the grid. Repeat steps 2-5. Make a second data table and record your data.
– Return all of the removed grains to the grid. The fish in the lake spawn during the spring. To model this, add another 200 grains to the grid. Repeat steps 2-5. Make a third data table and record your data.

Modeling Predation
• Analyze and Conclude– Construct a graph to represent your data– How was the amount of food caught by a heron
related to changes in biotic and abiotic factors?– How might abundant amounts of food allow
herons to reproduce more often?– How would the populations of amphibians and
small reptiles be affected if the fish population in the lake remained low for an extended period of time?

Warm Up (4-14-15)
• Explain some of the patterns that can be seen by observing the predation patterns of different species. (Think about the lab we started and what patterns you are seeing so far.)

Outline
• Objectives• Modeling Predation

Objectives
• Students will model predation by creating a grid and using rice grains to represent fish.
• Students will be able to explain patterns that result during predation
• Students will be able to identify why random sampling is beneficial to predation.

Modeling Predation
• In this lab, you will model predation and the effects of changes in the environment on organisms. Blue herons are large birds that live in aquatic habitats and feed on fish, frogs, salamanders, lizards, small snakes, and dragonflies. You will model a lake filled with fish.
• Problem: How do changes in environmental factors affect the predation habits of the blue heron?

Modeling Predation• Procedure:
– Spread 200 rice grains over the grid. The grid represents the lake from which the heron feeds, and the rice grains represent fish.
– A blue heron will catch an average of two fish per hour during daylight. To model the heron hunting for fish, close your eyes and lower the end of the toothpick slowly down onto the grid.
– Remove the grains that are in the square touching the toothpick. Count the grains– Rearrange the remaining grains on the grid and repeat steps 2 and 3 five more times
to model one day’s worth of feeding for the heron. Count the total number of grains removed, and record this number in a data table like the one shown below.
– Repeat steps 2-4 five more times to represent six total days of feeding by the heron.– Return all of the removed rice grains to the grid. Runoff containing large amounts of
nitrates causes an algal bloom in the lake. When the algae die and decomposition occurs, the oxygen level in the lake becomes very low, causing fish to die. Remove 150 grains from the grid. Repeat steps 2-5. Make a second data table and record your data.
– Return all of the removed grains to the grid. The fish in the lake spawn during the spring. To model this, add another 200 grains to the grid. Repeat steps 2-5. Make a third data table and record your data.

Modeling Predation
• Analyze and Conclude– Construct a graph to represent your data– How was the amount of food caught by a heron
related to changes in biotic and abiotic factors?– How might abundant amounts of food allow
herons to reproduce more often?– How would the populations of amphibians and
small reptiles be affected if the fish population in the lake remained low for an extended period of time?

Warm Up (4-15-15)
• If you were to try to identify the biome that is located here in Wiggins, what are some things we would need to know?

Outline
• Objectives• Jackson Lake Walk Through

Objectives
• Students will perform a trial run of all of the tests that they will be required to complete when they are out at Jackson Lake by choosing ecosystems to analyze here in Wiggins.

Jackson Lake Walk through
• We are going to walk through all of the tests that you will be required to do while at Jackson Lake.
• Please ask questions along the way because you will be expected to be able to demonstrate knowledge of all of these tests when we go out into the field on our field trip.

Warm Up (4-16-15)
• What are some of the most difficult aspects about the walk through analysis that you have come to so far.

Outline
• Objectives• Jackson Lake Walk Through

Objectives
• Students will perform a trial run of all of the tests that they will be required to complete when they are out at Jackson Lake by choosing ecosystems to analyze here in Wiggins.

Jackson Lake Walk through
• We are going to walk through all of the tests that you will be required to do while at Jackson Lake.
• Please ask questions along the way because you will be expected to be able to demonstrate knowledge of all of these tests when we go out into the field on our field trip.

Warm Up (4-17-15)
• What do you think the word climatograph means?
• Try to break the word apart… Can you find any smaller words inside of the larger word?

Outline
• Objectives• Climatographs• Practice creating climatographs

Objectives
• Students will practice creating climatographs and comparing those climatographs to determine the type of biome for a particular area. (More specifically Wiggins, CO)

Climatographs

Climatograms
• Elements of the climate (temperature and rainfall) are plotted against each other on a graph.
• This can aid in the identification of a biome• Determine the mean monthly rainfall• Determine the mean monthly temperatures

Climatograms of the Biomes
• Let’s take a look at the climatograms of the biomes.
• This will be a good comparison for when we create our own. This will help us determine which biome particular locations are classified by according to their mean monthly temperatures and their mean monthly rainfall

Practice Creating Climatographs

Warm Up (4-20-15)
• Explain what a climatogram is and how this information is useful.

Outline
• Objectives• Climatographs• Practice creating climatographs

Objectives
• Students will practice creating climatographs and comparing those climatographs to determine the type of biome for a particular area. (More specifically Wiggins, CO)

Climatographs

Climatograms
• Elements of the climate (temperature and rainfall) are plotted against each other on a graph.
• This can aid in the identification of a biome• Determine the mean monthly rainfall• Determine the mean monthly temperatures

Climatograms of the Biomes
• Let’s take a look at the climatograms of the biomes.
• This will be a good comparison for when we create our own. This will help us determine which biome particular locations are classified by according to their mean monthly temperatures and their mean monthly rainfall

Practice Creating Climatographs

Warm Up (4-21-15)
• Make a list of the questions that you have about going to Jackson Lake.
• Is there anything that you are confused about or need clarification on?

Outline
• Objectives• Climatographs• Practice creating climatographs

Objectives
• Students will practice creating climatographs and comparing those climatographs to determine the type of biome for a particular area. (More specifically Wiggins, CO)

Finish up Climatograms

Jackson Lake Preparations
• We need to make a list of all of the equipment that we will need.
• We need to get all of the equipment set out so that way in the morning you all can help me load the equipment onto the bus.
• We need to make sure that the LabQuests are charged – if we need to plug them into the wall chargers just to make sure then that is fine!
• We need to make sure that all permission slips are turned in!
• We need to make final decisions about lunch!

Warm Up (4-22-15)
• We will be at Jackson Lake today, you will not have a warm up!
Outline
• Objectives• Jackson Lake Field Trip

Objectives
• Students will perform ecological analysis and behavioral studies at a particular quadrat at Jackson Lake.
• Students will take ecological samples and will be prepared to analyze those samples and determine the meaning of the analysis.

Warm Up (4-23-15)
• Explain something interesting you learned while conducting the ecological analysis at Jackson Lake.

Outline
• Objectives• Jackson Lake Field Trip – Discussion and
Analysis

Objectives
• Students will perform ecological analysis and behavioral studies at a particular quadrat at Jackson Lake.
• Students will take ecological samples and will be prepared to analyze those samples and determine the meaning of the analysis.

Warm Up (4-24-15)
• What is your next step? Write down your plan to finish your analysis of the information and data that you gathered while at Jackson Lake. Provide a plan to complete all of the tests that need to be completed.

Outline
• Objectives• Jackson Lake Field Trip – Discussion and
Analysis

Objectives
• Students will perform ecological analysis and behavioral studies at a particular quadrat at Jackson Lake.
• Students will take ecological samples and will be prepared to analyze those samples and determine the meaning of the analysis.


![UNESCO - Man and the Biosphere (MAB) …...a biosphere reserve which are given in order below.] UNESCO - Man and the Biosphere (MAB) Programme - Biosphere reserve nomination form:](https://static.documents.pub/doc/80x56/5f0db46a7e708231d43bac72/unesco-man-and-the-biosphere-mab-a-biosphere-reserve-which-are-given-in.jpg)


