120
Biotechnological Routes to Biomass Conversion James D. McMillan National Bioenergy Center National Renewable Energy Laboratory DOE/NASULGC Biomass & Solar Energy Workshops August 3-4, 2004
Biotechnological Routes to Biomass Conversion
James D. McMillan
National Bioenergy CenterNational Renewable Energy Laboratory
DOE/NASULGC Biomass & Solar Energy WorkshopsAugust 3-4, 2004

While the growing need for sustainable electric power can be met by other renewables…
The Unique Role of Biomass
Biomass is our only renewable source of carbon-based fuels and chemicals

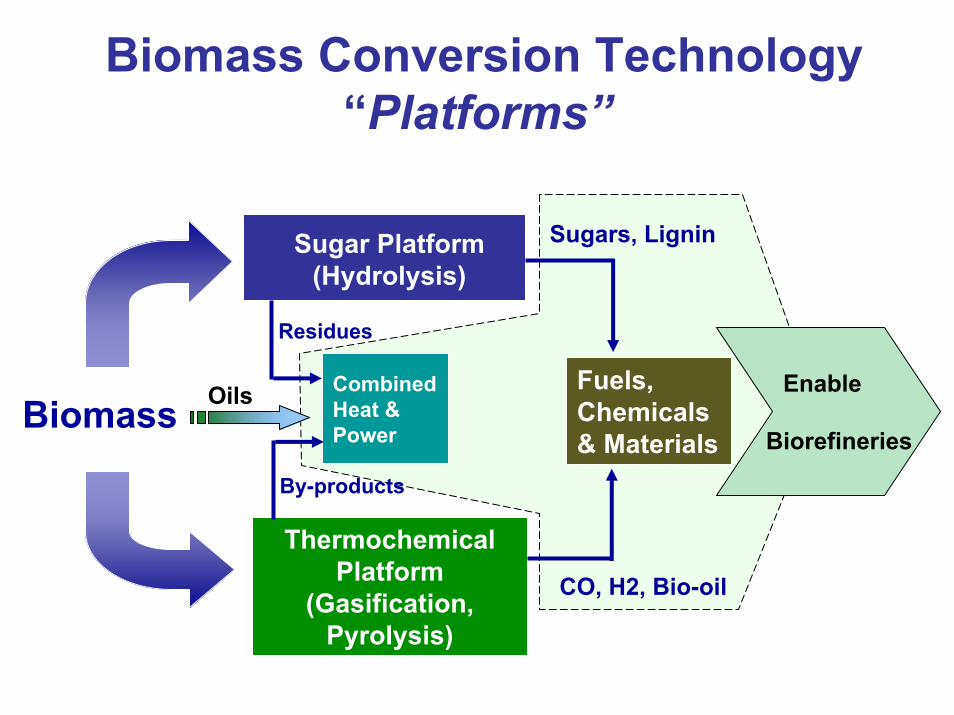
Biomass Conversion Technology“Platforms”
Fuels,Chemicals,& Materials
ThermochemicalPlatform
(Gasification,Pyrolysis)
Sugar Platform(Hydrolysis)
BiomassCombined Heat & Power
Residues
By-products
CO, H2, Bio-oil
Sugars, Lignins (Aromatics)

• Biomass Basics• Overview of Conversion Options• Details of Enzyme-based Technology• Biorefining Now and in the Future
Outline

Biomass Feedstock Types
• “Starchy”: Grains (e.g., corn and wheat)• “Oily”: Seeds (e.g., soya and rape) • “Fibrous”: Lignocellulose (e.g., ag and forestry
residues, grasses, trees, etc.
Emphasis of today’s presentation will be conversion of lignocellulosic biomass– Comparison to illustrate the differences between starchy and
fibrous feedstocks: corn grain versus corn stover

http://maize.agron.iastate.edu/corngrows.html
Corn Grain vs. Corn Stover
GRAIN STOVER
http://www.bisonfarm.com/images/fsp-corn.jpg
http://arnica.csustan.edu/key/corn.jpg

Biomass Basics
• Grain contains– ≥80% carbohydrates, dry basis– Major component is starch
• Lignocellulosic biomass contains– 60-70% carbohydrates, dry basis– Major components are cellulose, hemicellulose, and lignin
• Biomass types exhibit differences in– Macro structure and cell wall architecture– Types and levels of lignins and hemicelluloses– Types and levels of minor constituents

Composition: Grain vs. Stover
ComponentCorn Kernel
(Grain)Corn Stover
(Lignocellulose)72-73 Trace
63-77Lignin Trace 10-16Other Sugars 1-2 3-6Protein 8-10 1-3Oil/Other Extractives 4-5 3-6Ash 1-2 5-7
34-39Xylan/Arabinan 22-26Galactan/Mannan 1-2Acetate & Uronics 6-10
Total 96-104 85-115
10-12StarchCellulose/Hemicellulose
Cellulose

SawdustWood wastePulp mill wastes
Corn stoverRice hullsSugarcane bagasseAnimal waste
SwitchgrassHybrid poplarWillow
Wood Residues
Agricultural Residues
Energy Crops
Biomass Resources and Key Issues
• Quality – Composition
– Ease of Conversion
• Cost– Production
– Collection and Transportation
– Quantity Available
• Sustainability– Land, Air and Water
Resources

Biomass Composition
38-50% 5-13%
23-32%15-25%
Lignin
OtherCellulose
(Glucose sugar)
Hemicellulose(Pentose sugars)
(Phenylpropyl-based)
Softwoods
Grasses
Hardwoods
Crop residues
MSW
(Extractives, ash, etc.)

Lignin: 10-25%- Complex aromatic structure- Resistant to biochemical conversion- Different depolymerization chemistry
Hemicellulose: 15-30%- Heteropolymer of pentoses and hexoses- Variably substituted (acetyl, uronics)- More easily depolymerized
Cellulose: 30-50%- Crystalline polymer of glucose (cellobiose)- Difficult to chemically hydrolyze- Susceptible to enzymatic attack by cellulases
Major Plant Major Plant Cell WallCell WallComponentsComponents

0%
20%
40%
60%
80%
100%
poplarsawdust
corn stover(fresh)
bagasse(fresh)
protein
chlorophyll
soil
acetyl
Uronic acids
ash
extractives
lignin
galactan
arabinan
mannan
xylan
glucan
Not All Biomass is Created Equal!Important Compositional and Structural Differences Exist

Biomass Structure
• Surface and structural property measurement are key to developing a sound understanding of recalcitrance and conversion mechanisms– Very difficult system to study
• Extremely heterogeneous at both macro- and micro-scales (ultrastructure complexity)
– Tools and techniques emerging• E.g., NREL’s Biomass Surface Characterization
Laboratory, NMR Laboratory, etc.

Biomass Surface Characterization Laboratory
TEMTecnai G2 Quanta 400 FEG
SEMQuanta 400 FEG
AFMMultiMode PicoForce
NSOMAURORA-3

Heterogeneity Across a Single Corn Stem*
Light microscopyToluidine Blue O
200x
Epidermis
Bundle sheath
Parenchyma
Xylem vessels
Tracheids
Schlerenchyma
PhloemCompanion cell
Sieve tube
Xylem
Vascular bundle
*Photomicrograph courtesyof Stephanie Porter (NREL)

White light, 100xStem
Structural Complexity at Many Scales*
UV Fluorescence, 600x
Stem vascular bundle
Confocal, 1000x
Stem pith
SEM, 100xLeaf cross section
*Images courtesy of S. Porter (NREL)

Test molecular models
Advanced imaging facilities (such as NREL’s BSCL) provide new tools to study the fundamentals of
biomass conversion processesMonitor cellulose surfaces during pretreatment and enzymatic hydrolysis
Cellulose surface
Visualize changes to biomass surfaces caused by various
pretreatment processes

SEM of Corn Stems – How small are pits?
Photomicrographs courtesyof NREL’s M. Himmel. Workconducted in collaborationwith the CSM EM Facility.
1 mm
Pretreatment chemicals andenzymes penetrate corn tissuethrough vessels and pits

Height Phase
Original parenchyma cell
0.1 M NaOH, 3 mg/ml/NaBH4, RT 1h
AFM pith parenchyma
cell cell-wall structure
Tapping modeScan size: 5x5µm

• Biomass Basics• Overview of Conversion Options• Details of Enzyme-based Technology• Biorefining Now and in the Future
Outline
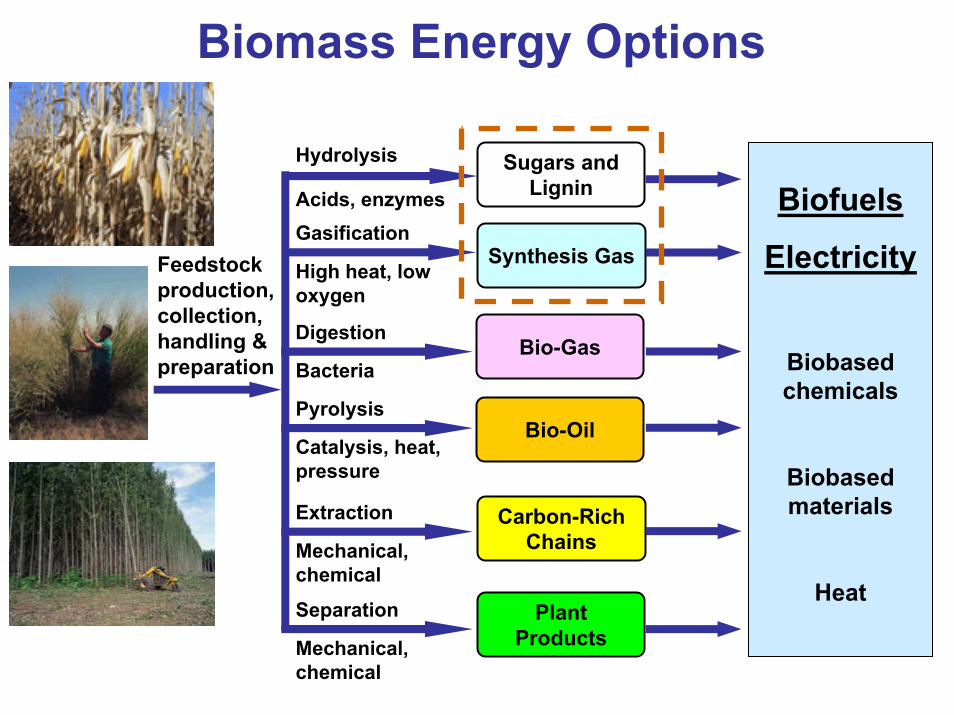
Biomass Energy Options
Biofuels
Electricity
Biobasedchemicals
Biobasedmaterials
Heat
Bio-Gas
Synthesis Gas
Sugars and Lignin
Bio-Oil
Carbon-RichChains
Plant Products
Hydrolysis
Acids, enzymesGasification
High heat, low oxygen
Digestion
Bacteria
Pyrolysis
Catalysis, heat, pressure
Extraction
Mechanical, chemical
Separation
Mechanical, chemical
Feedstock production,collection, handling & preparation
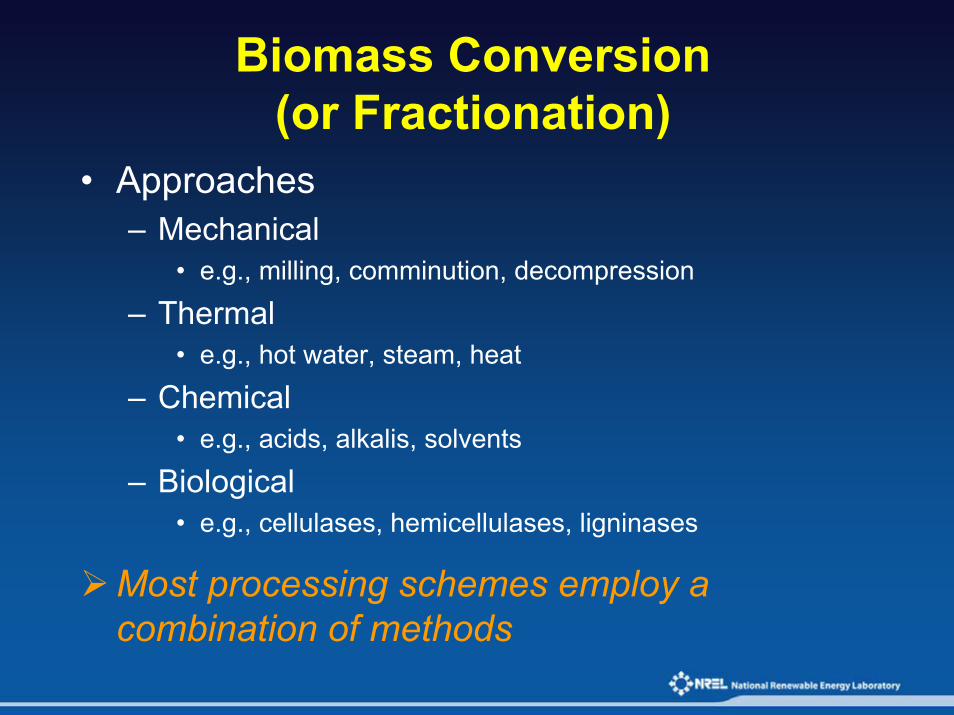
Biomass Conversion(or Fractionation)
• Approaches– Mechanical
• e.g., milling, comminution, decompression
– Thermal• e.g., hot water, steam, heat
– Chemical• e.g., acids, alkalis, solvents
– Biological• e.g., cellulases, hemicellulases, ligninases
Most processing schemes employ a combination of methods

Process Technology Options
• Major categories of biomass conversion process technology– Sugar Platform
• Dilute acid cellulose conversion• Concentrated acid cellulose conversion • Enzymatic cellulose conversion (jump directly to this ?)
– Using any of a variety of different primary fractionation or “pretreatment” methods
– Syngas Platform• Gasification followed by synthesis gas fermentation

Two-Stage Dilute Acid Process
Gypsum
SizeReduction
1st StageDilute AcidPretreatment
2nd StageDilute AcidHydrolysis
LigninUtilization
EthanolRecovery
Neutralization/Detoxification
Fermentor
L S
L S
S L
Biomass

Dilute Acid Hydrolysis• Driving Forces
– Adapt existing infrastructure, use recycled equip.– Exploit recombinant fermentation technology for hexose and
pentose sugar conversion
• Strengths– Proven: oldest, most extensive history of all wood sugar
processes, with the first commercial process dating back to 1898.
• Active Companies/Institutions include– BC International– Swedish government

Concentrated Acid ProcessConc. H2SO4
Water
Gypsum
Water
PurifiedSugar Solution
Lignin Utilization
Ethanol Recovery
Fermentor
Neutralization Tank
Acid Reconcentration
Acid/Sugar Separation
DecrystallizationPrimary
HydrolysisSecondary Hydrolysis
L S
L S
L S
Biomass
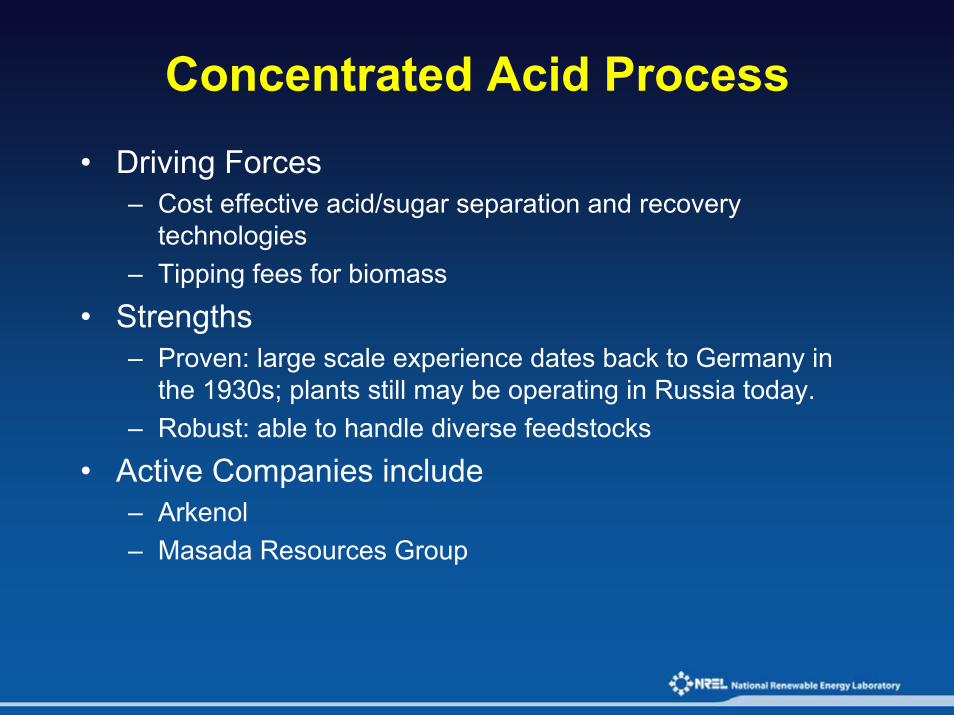
Concentrated Acid Process• Driving Forces
– Cost effective acid/sugar separation and recovery technologies
– Tipping fees for biomass
• Strengths– Proven: large scale experience dates back to Germany in
the 1930s; plants still may be operating in Russia today.– Robust: able to handle diverse feedstocks
• Active Companies include– Arkenol– Masada Resources Group

Historical Enzymatic Process
Waste water
SizeReduction
DiluteAcid
Pretreat-ment
LigninUtilization
EthanolRecovery
Saccharification/Fermentor
Neutralization/Conditioning
Cellulaseenzymes
L S
Biomass
Gypsum
L S
S L

Enzymaticcellulose
saccharification
Pre-processing
Pretreatment(hemicellulose
extraction)
Conditioning
Beer Slurry to Ethanol
and Solids Recovery
Biomasssugar
fermentation
Many options exist for each of these steps….….and there are many
interactions to consider
Evolving Enzymatic Process
Feedstock collection and
delivery
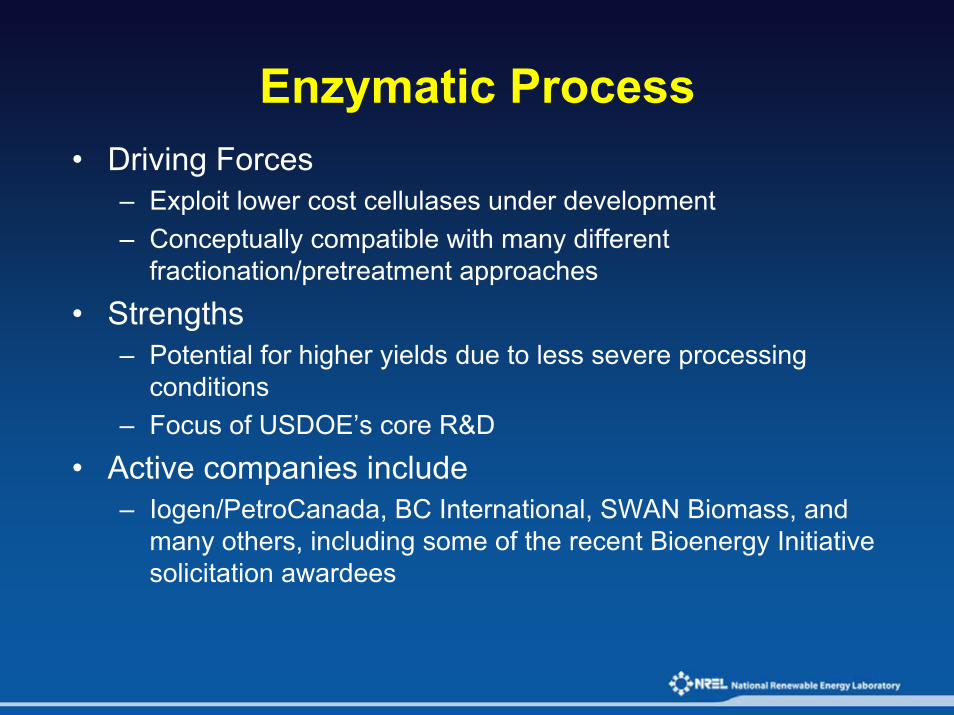
Enzymatic Process• Driving Forces
– Exploit lower cost cellulases under development– Conceptually compatible with many different
fractionation/pretreatment approaches
• Strengths– Potential for higher yields due to less severe processing
conditions– Focus of USDOE’s core R&D
• Active companies include– Iogen/PetroCanada, BC International, SWAN Biomass, and
many others, including some of the recent Bioenergy Initiative solicitation awardees
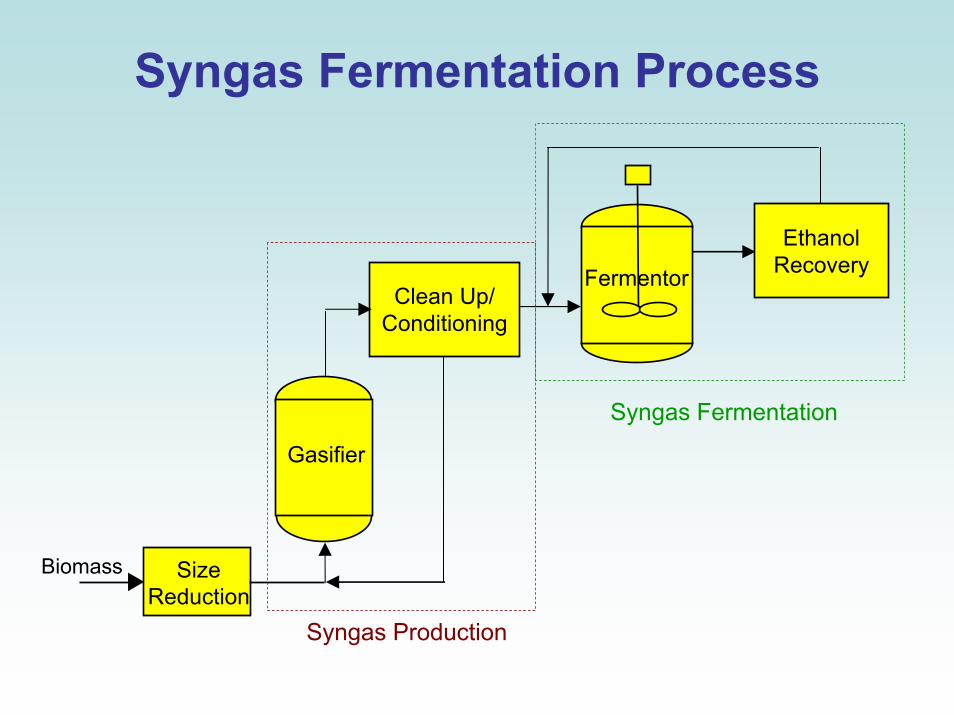
Syngas Fermentation Process
SizeReduction
Gasifier
Biomass
Clean Up/ Conditioning
Fermentor
EthanolRecovery
Syngas Production
Syngas Fermentation

Syngas Fermentation
• Bacterial fermentation of CO, CO2 and H2 to ethanol
6 CO + 3 H2O C2H5OH + 4 CO2
6H2 + 2 CO2 C2H5OH + 3 H2O
• Syngas fermentation strains and processes remain relatively poorly characterized compared to other routes; many issues need to be resolved
– Overall process economics– Required performance targets for
• Gasification, e.g., yield = f(gas mixture)• Syngas fermentation, e.g., ethanol prod. yield, titer, and rate

Syngas Fermentation Process
• Driving Forces– While unproven, may enable higher yields through
conversion of non-carbohydrate fractions (e.g., lignin) to syngas components
• Strengths– Build off previous gasification/clean up knowledge– Ability to process a diverse range of feedstocks to a common
syngas intermediate
• Active groups include– Bioresource Engineering Inc.– Oklahoma State– Mississippi State

Status of Conversion Options • Many options based on Sugar and Syngas Platform technology
routes exist and are being pursued• Sugar Platform technologies are at a more advanced
development stage because of their longer history• Recent programmatic emphasis has been on Enzymatic
Hydrolysis route
• Further information on process options is available at:– http://www.eere.energy.gov/biomass/sugar_platform.html
• USDOE EERE Biomass Program web site
• Also see:– http://www.nrel.gov/biomass/publications.html
• Biomass research publications (several searchable databases) – http://www.bioproducts-bioenergy.gov/
• Joint USDOE-USDA Biomass R&D Initiative

Process Development Challenges
• Processing at high solids levels• Understanding process chemistries• Closing carbon, mass & energy balances
– Requires accurate measurement/analysis methods
• Identifying critical process interactions – Integration efforts must focus on key issues
• Producing realistic intermediates and residues– Essential to evaluate potential coproduct values

Commercialization Challenges
• Demonstrated market competitiveness– Compelling economics with acceptable risk
• Established feedstock infrastructure– Collection, storage, delivery & valuation methods
• Proven societal & environmental benefits– Sustainable– Supportive policies
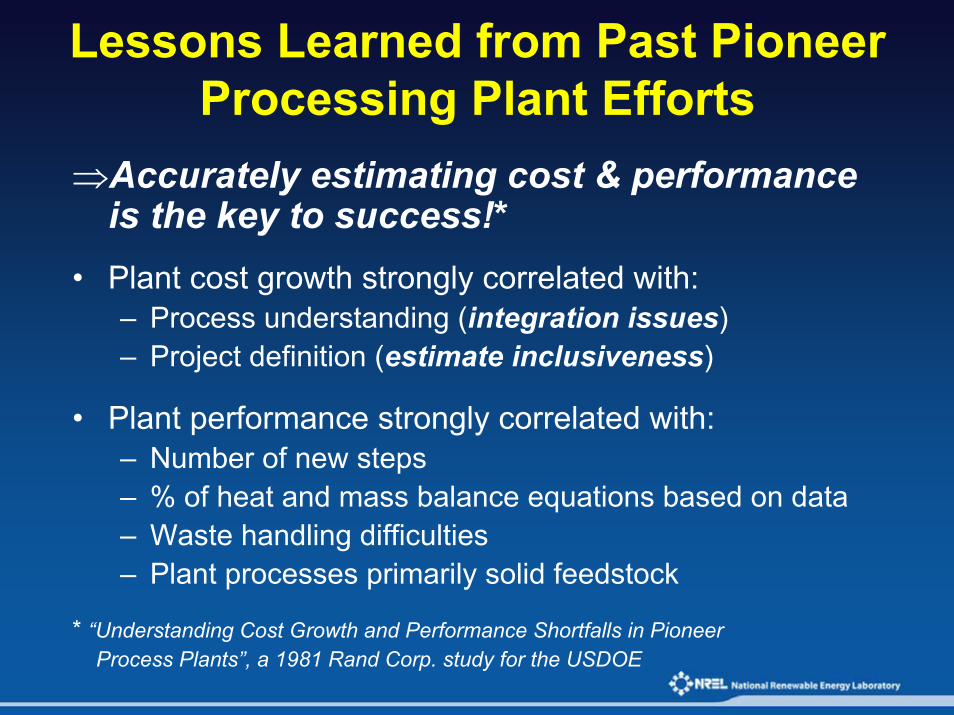
Lessons Learned from Past Pioneer Processing Plant Efforts
⇒Accurately estimating cost & performance is the key to success!*
• Plant cost growth strongly correlated with:– Process understanding (integration issues)– Project definition (estimate inclusiveness)
• Plant performance strongly correlated with:– Number of new steps– % of heat and mass balance equations based on data– Waste handling difficulties– Plant processes primarily solid feedstock
* “Understanding Cost Growth and Performance Shortfalls in PioneerProcess Plants”, a 1981 Rand Corp. study for the USDOE

• Biomass Basics• Overview of Conversion Options• Details of Enzyme-based Technology• Biorefining Now and in the Future
Outline
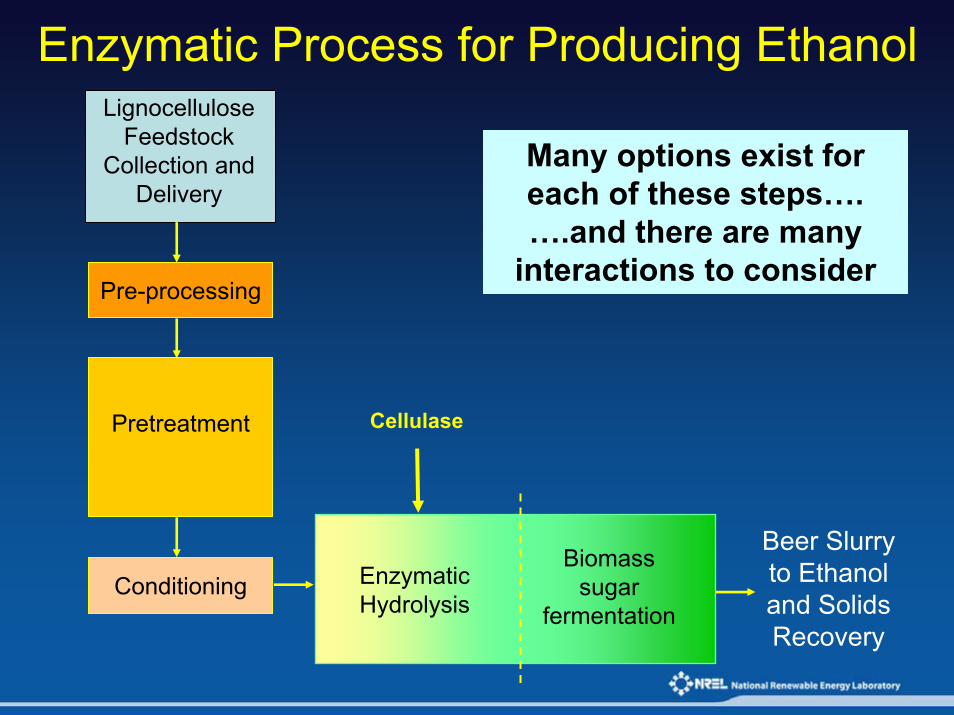
Lignocellulose Feedstock
Collection and Delivery
Pre-processing
Pretreatment
Conditioning
Enzymatic Process for Producing Ethanol
Many options exist for each of these steps….….and there are many
interactions to consider
EnzymaticHydrolysis
Cellulase
Beer Slurry to Ethanol and Solids Recovery
Biomasssugar
fermentation
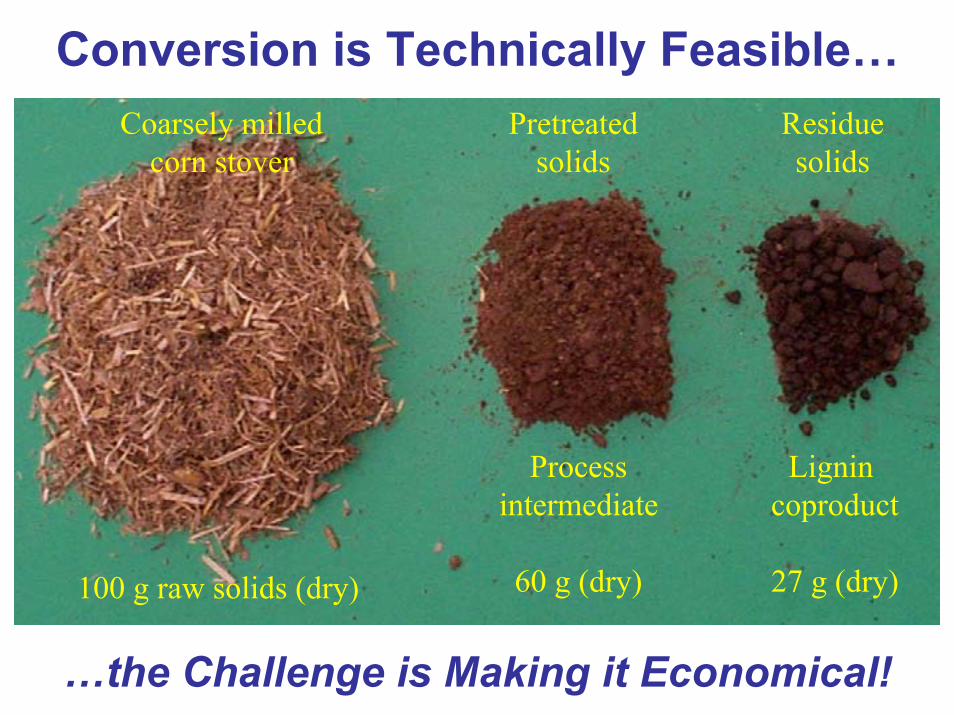
100 g raw solids (dry)
Lignin coproduct
27 g (dry)
Processintermediate
60 g (dry)
Coarsely milledcorn stover
Pretreated solids
Residue solids
Conversion is Technically Feasible…
…the Challenge is Making it Economical!

Technical Barriers• Feedstock Valuation and Delivery
– Analytical methods/sensors– Supply systems– Soil sustainability
• Biomass Recalcitrance to Conversion– Pretreatment– Enzymatic hydrolysis– Pentose fermentation
• Process Integration– Solids handling
Interactions– Process chemistry

Understanding Integration Issues
BiomassSugar
Fermentation
EnzymaticCellulose
Saccharification
BiomassPretreatment
Amount of celluloseCellulose crystallinityAvailable surface area
Amount and nature of ligninType/amount of hemicellulose
Sugar concentrations
pH and conditioning req.
Amount and types of acids,
HMF and furfural,
phenolics, and cations
Tempe
ratu
re op
tima
pH op
tima
Suga
r con
cent
ratio
ns
Ethan
ol co
ncen
tratio
n
Hydro
lysis
rate
BiomassFeedstock

Cellulose Conversion in SSF
Cellulose Cellobiose
Glucose
r1
r2 r3
r4
Ethanol

Enzymatic Hydrolysis Configurations Using Simultaneous Saccharification&Fermentation
SSF with Combined C5 and C6 Sugar CoFermentation (SSCF)
Pretreatment & Hydrolyzate Conditioning
EnzymaticSaccharification
& CoFermentationEthanol
RecoveryBiomass
Feedstock
C5 SugarFermentation
Pretreatment & Hydrolyzate Conditioning
EnzymaticSaccharification
& C6 Fermentation
EthanolRecovery
BiomassFeedstock
Separate C5 and C6 Sugar Fermentation (SSF or SSCF)
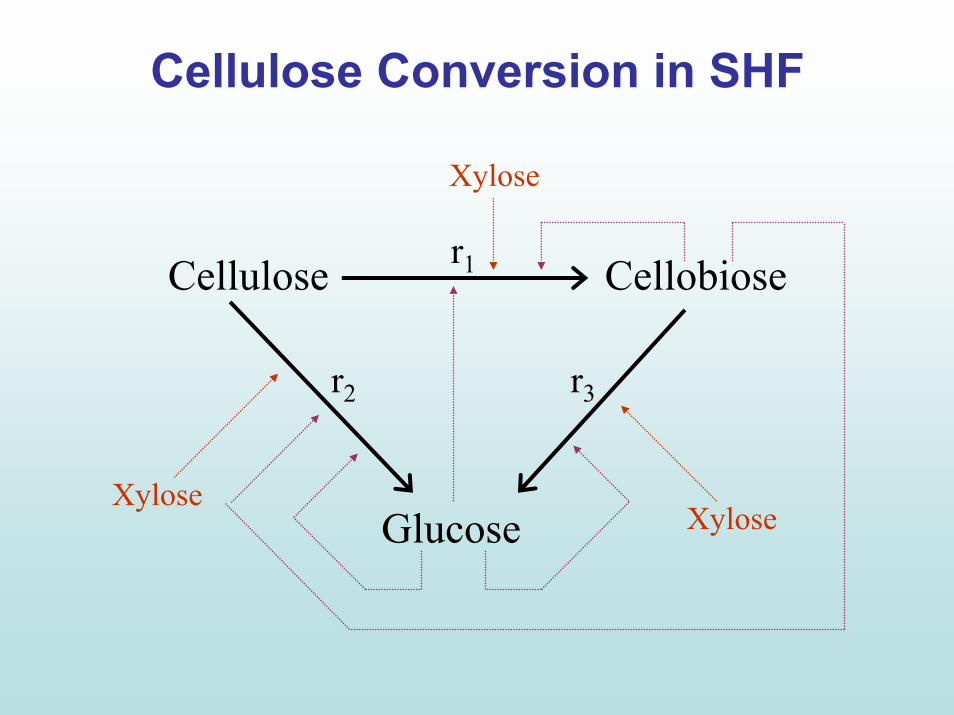
Cellulose Conversion in SHF
Cellulose Cellobiose
Glucose
r1
r2 r3
Xylose
XyloseXylose

Process Configurations Based onSequential Hydrolysis and Fermentation
C5 SugarFermentation
Pretreatment & Hydrolyzate Conditioning
EnzymaticCellulose
Saccharification
EthanolRecovery
C6 SugarFermentation
BiomassFeedstock
SHF with Separate C5 and C6 Sugar Fermentation
BiomassFeedstock
Pretreatment & Hydrolyzate Conditioning
EnzymaticCellulose
Saccharification
EthanolRecovery
C5 & C6 SugarCoFermentation
SHF with Combined C5 and C6 Sugar Fermentation

Comparing the Attributes of SSF and SHF Process Configurations
Simultaneous (SSF/SSCF)• Minimize enzyme inhibition by
accumulating sugars• Achieve high cellulose conversion
yields• Reduce process complexity via
“one step” approach• Increase pentose utilization and
fermentative strain robustness through sustained production and co-utilization of glucose
• Minimize the potential for contaminant outgrowth by maintaining a low free sugar concentration
Sequential (SHF)• Run enzymatic hydrolysis and
fermentation at their respective temperature and pH optima
– large benefits possible when optima are significantly different
• Generate intermediate sugar product(s)
– Upgrade for sale or use as substrates to manufacture other value-added products…enable multi-product biorefineries
• Easier mixing in fermentation– Lower levels of solids in
fermentation (or absence of solids if S/L separation used prior to fermentation)

Probable Commercial Configuration• Anticipate exploiting next generation thermostable cellulases using a
two stage hybrid hydrolysis and fermentation process that leverages the strengths of both SSF and SHF• Stage 1: Operate at high temperature to exploit enzymes’ thermostability
• Stage 2: Operate as SSF/SSCF to achieve high cellulose conversion yield
Beer product slurry to
distillation and solids recovery
Pretreated and conditioned biomass slurry
1st Stage 2nd Stage
Hybrid Hydrolysis and Fermentation (HHF)
HigherTemperature
EnzymaticCellulose
Saccharification
HigherTemperature
EnzymaticCellulose
Saccharification
MesophilicEnzymatic
Hydrolysis &Biomass SugarFermentation
MesophilicEnzymatic
Hydrolysis &Biomass SugarFermentation

Technical Barriers• Feedstock Valuation and Delivery
– Analytical methods/sensors– Supply systems– Soil sustainability
• Biomass Recalcitrance to Conversion– Pretreatment– Enzymatic hydrolysis– Pentose fermentation
• Process Integration– Solids handling– Interactions
Process chemistry

Biomass Chemistry and Ultrastructure
• Our understanding of biomass chemistry and structure and of conversion mechanisms continues to grow, but many issues remain unknown– Further work needed to advance analysis tools and
fundamental understanding of biomass ultrastructure and process chemistry during conversion processes

Tracking Composition and MassPretreatment Example
Cellulose Xylan Lignin
Extractives
Other Hemi.
Uronic Acid
Acetyl Ash
Protein Sucrose
Corn Stover
6.6%
60.3% 30.7%
3.6%
1.9%
2.4%
Pretreated Corn Stover Solids Liquor Furfural
Other XyloseGlucose
Pretreatment

The Role of Technoeconomic Analysis
• Quantify relative impacts of process improvements
• Identify research directions with largest cost reduction potential, or highest perceived benefit/investment ratio

Rigorous Material & Energy Balance
ASPEN +
Capital & ProjectCost Estimation
Discounted Cash FlowEconomic Model
Product MinimumSelling Price
Process Flow Diagrams
Process Design and Economic Modeling Methodology
DOE/NREL SponsoredResearch Results
Outside EngineeringStudies, e.g., WWT,
Burner, EtOH Recovery
Estimates of Other Commercial Technology
ICARUS - Cost Estimation Software
Vendor Cost Quotations
Engineering CompanyCost Estimations
Engineering Co. Consultingon Process Configuration
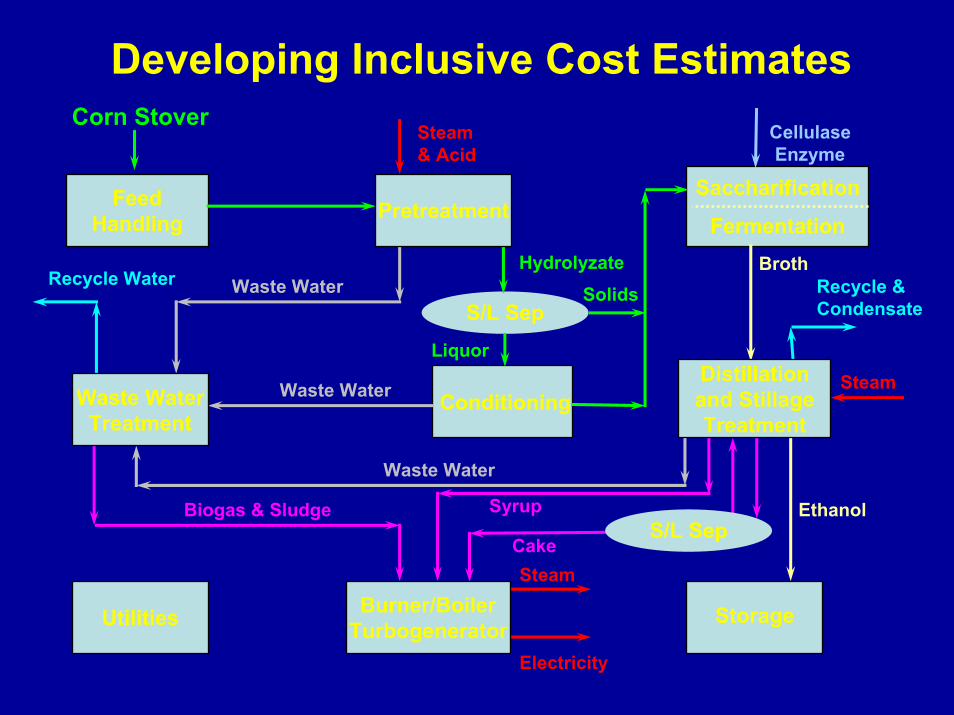
Developing Inclusive Cost Estimates
FeedHandling
Utilities
Saccharification
Fermentation
Conditioning
Storage
Corn Stover
Hydrolyzate BrothRecycle &Condensate
Waste Water
Ethanol
Cake
Biogas & Sludge
Waste Water
CellulaseEnzyme
Recycle Water
Steam
Electricity
Steam
Steam& Acid
S/L SepSolids
Liquor
Waste Water
S/L SepSyrup
Pretreatment
Waste WaterTreatment
Burner/BoilerTurbogenerator
Distillationand StillageTreatment
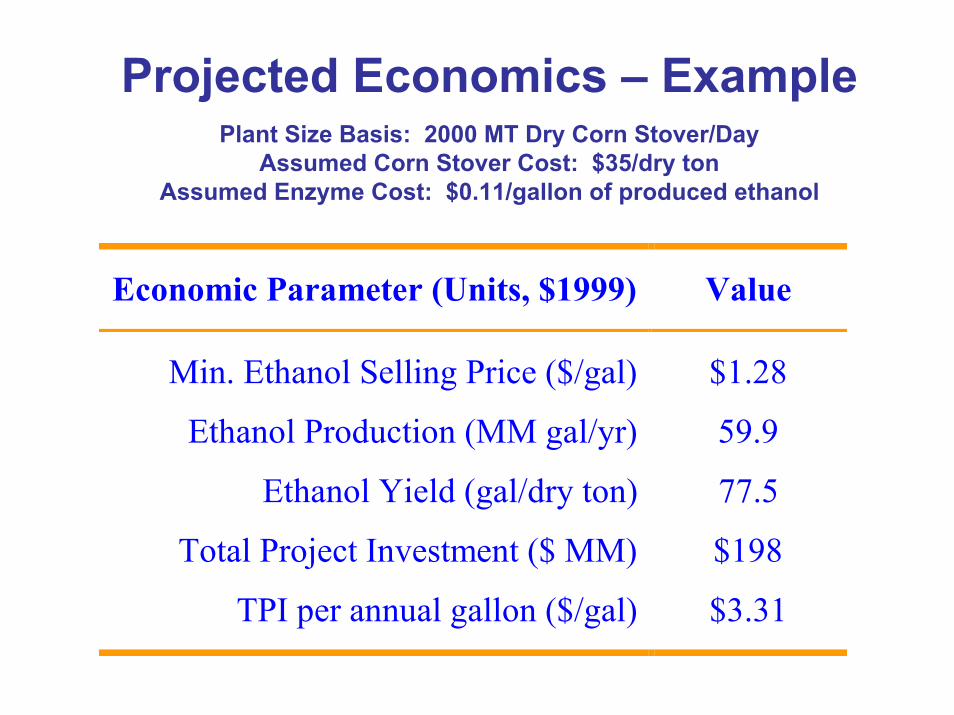
Projected Economics – ExamplePlant Size Basis: 2000 MT Dry Corn Stover/Day
Assumed Corn Stover Cost: $35/dry tonAssumed Enzyme Cost: $0.11/gallon of produced ethanol
Economic Parameter (Units, $1999)
Value
Min. Ethanol Selling Price ($/gal)
$1.28
Ethanol Production (MM gal/yr) 59.9
Ethanol Yield (gal/dry ton) 77.5
Total Project Investment ($ MM) $198
TPI per annual gallon ($/gal) $3.31

Corn Stover Case - % Costs by Area
Corn Stover
FeedstockHandling
Pretreatmentand Conditioning
Saccharificationand Fermentation
Cellulase
Distillation andSolids Recovery
Waste WaterTreatment
Boiler/TurbogeneratorUtilities
Storage
-20% -10% 0% 10% 20% 30% 40%
Capital Recovery Charge Raw Materials Process ElectricityGrid Electricity Total Plant Electricity Fixed Costs
34%
5%
19%
9%
8%
11%
2%
7%
4%
1%
(after ~4-10x cost reduction!)

Highlight Economic Findings
• Enzymatic ethanol production costs dominated by– Feedstock– Enzymes - cellulases– Capital equipment throughout the plant
• Syngas production costs dominated by– Feedstock– Capital equipment
⇒ Current USDOE and NBC (ANL, INEEL, NREL, ORNL, and PNNL) Biomass Program efforts focused on decreasing these key cost centers

Economic Modeling Highlights, cont’d
• Estimated operating costs are becoming competitive, although capital costs remain high– Process intensification and the ability to produce additional
value-added coproducts are both approaches being pursued to reduce the capitalization/financing burden
⇒There has been significant progress in reducing projected sugar platform costs through a variety of approaches, including co-location, feedstock valuation, enzyme cost reduction, high solids processing, etc.– Selected highlights follow….

Potential to Reduce Capital Costs through Co-location – An Example
Economic Parameter
(Units, $1999)
Process
Case
Dry-mill
Co-location
Coal-fired Power Plant Co-location
MESP ($/gal)
$1.30
$1.23
$1.18
EtOH Production (MM gal/yr) 60 30 / 30
60
EtOH Yield (gal/dry ton stover)(gal/bushel corn)
77.5 77.5 2.85
77.5
TPI ($ MM) $200 $109 / $70
$130
TPI per Annual Gallon ($/gal) $3.34 $1.83 / $1.16
$2.17
Net Operating Costs ($/gal) $0.73 $0.72 $0.82

Towards a Low Cost Feedstock Infrastructure
• Reducing feedstock cost is a significant opportunity – Apply innovative harvesting & storage methods
• Whole stalk harvest?• Dry or wet densification?
– Value the feedstock based on its composition• In-field or point-of-delivery rapid compositional analysis, e.g., using
calibrated Near InfraRed Spectroscopy (NIRS)
⇒Application of NIRS shows that significant knowledge gaps remain about the magnitude and sources of feedstock compositional variability

Impact of Reducing Feedstock Cost
$0.13/gal change for every $10/BDT change
$0.85$0.80
$0.90
$1.00
$1.10
$1.20
$1.30
$1.40
$1.50
$1.60
$0 $5 $10 $15 $20 $25 $30 $35 $40 $45 $50
Delivered Feedstock Cost ($/dry ton)
MES
P ($
/gal
EtO
H)
$35 / dry ton
Market Targetat $20/dry ton
Corn Stover Case Example

R2 = 0.028
14
16
18
20
22
24
26
28 30 32 34 36 38 40Structural Glucan (% dry weight)
Xyla
n (%
dry
wei
ght)
Substantial Feedstock VariabilityNIR Composition of 731 corn stover samples from the 2001 harvest

Corn Stover Variability

Reducing Cellulase CostObjective: Reduce cost of cellulases for biomass conversion applications to enable large volume sugar platform technology• The program’s enzyme cost target is $0.10/gallon ethanol or less
NREL’s role:• Issue subcontracts to industry and facilitate their success
• Supply “standard” pretreated feedstock
• Develop cost metric to translate enzyme performance into economic terms, i.e., enzyme cost ($/gallon EtOH)
• Experimentally validate key results
• Review/Audit key results that can’t be independently validated
• Provide supporting information, consultation, and guidance as requested or needed to facilitate subcontractor success
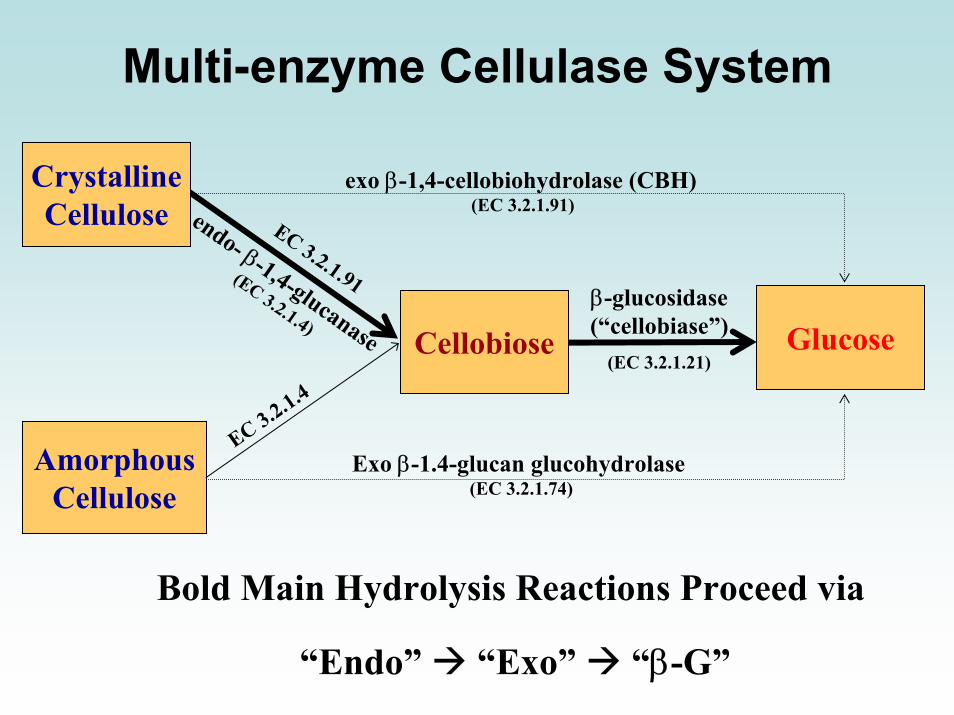
Multi-enzyme Cellulase System
CrystallineCellulose
AmorphousCellulose
Cellobiose Glucose
endo- β-1,4-glucanase
(EC 3.2.1.4)
EC 3.2.1.4
Exo β-1.4-glucan glucohydrolase(EC 3.2.1.74)
EC 3.2.1.91
exo β-1,4-cellobiohydrolase (CBH) (EC 3.2.1.91)
β-glucosidase(“cellobiase”)
(EC 3.2.1.21)
Bold Main Hydrolysis Reactions Proceed via
“Endo” “Exo” “β-G”

NREL’s Enzymatic Hydrolysis Partnerships
• 4-year Partnerships with Genencor & Novozymes– Enzyme biochemistry and specific activity– Cellulase - cellulose surface interaction– Lower the cost of enzyme
CBH1 from T. reesei
E1 from A. cellulotiticus

Metrifying Enzyme Cost Reduction
Where:– CE = Enzyme cost ($/gal ethanol)– EP = Enzyme price ($/L product) (subcontractor supplied)
– EL = Enzyme loading (g protein/g cellulose entering hydrolysis) (measured)
– BN = Enzyme concentration in product (g protein/L product) (measured)
– Y = Ethanol Process Yield (gal EtOH/g cellulose entering hydrolysis)(calculated from process model; a constant)
see Andy Aden and Mark Ruth’s tech memo #4988 for further details
YBEECN
LPE =

Approach1. Measure enzyme concentration, BN
• Use accepted protein measurement method (Pierce BCA)2. Measure required enzyme loading on “standard” pretreated corn
stover (PCS) substrate, EL
• Use variation of traditional shakeflask SSF digestibility test3. Calculate CE using subcontractor supplied EP and metric Y
4. Compare CE of improved preparations against subcontract benchmark
5. Repeat
YBEECN
LPE =
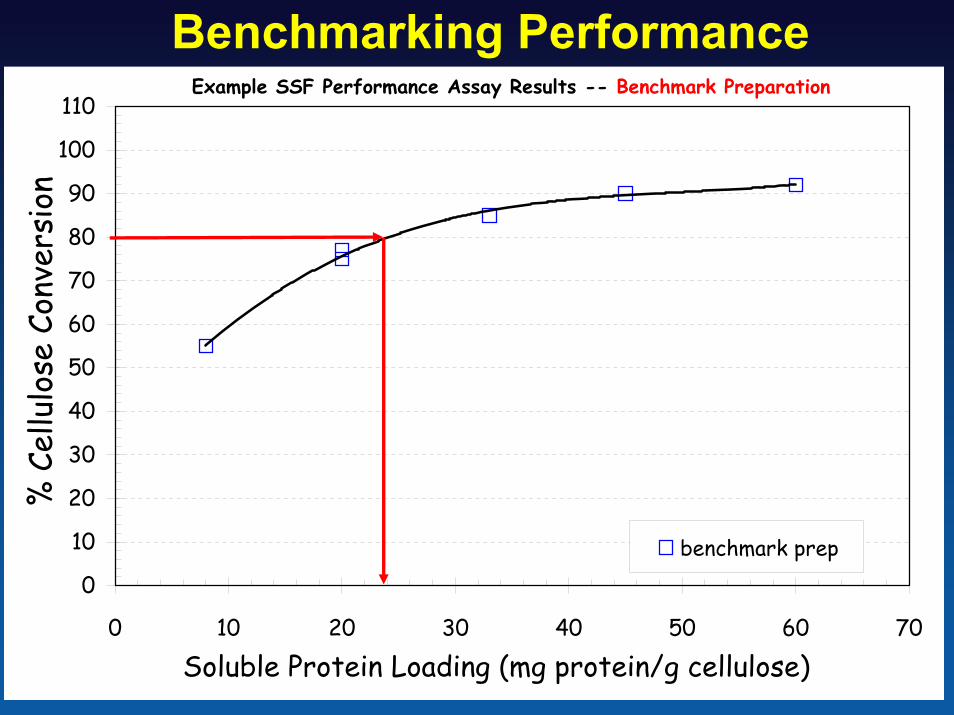
0
10
20
30
40
50
60
70
80
90
100
110
0 10 20 30 40 50 60 70
Soluble Protein Loading (mg protein/g cellulose)
% C
ellu
lose
Con
vers
ion
benchmark prep
Example SSF Performance Assay Results -- Benchmark Preparation
Benchmarking Performance

0
10
20
30
40
50
60
70
80
90
100
110
0 10 20 30 40 50 60 70Soluble Protein Loading (mg protein/g cellulose)
% C
ellu
lose
Con
vers
ion
Improved prep
Example SSF Performance Assay Results -- Improved Preparation
Measuring Improvement

Overall Improvement Matrix
Enzyme Preparation
Benchmark
Improved
Lot 1
P010129
A mg/g A’ mg/g W
Feed
stoc
k PC
S L
ot
Lot 2
P020502
B mg/g B’ mg/g X
Y Z
Substrate-relatedImprovements (NREL)
Enzyme-related
Improvements (Subcontractor)

Industry-led Cellulase Cost Reduction• Similar Subcontracts set up with Genencor and Novozymes to
reduce cost of commodity cellulases by tenfold or greater– 3 year periods of performance + 1 year extensions– 20% cost share by industry– Annual performance milestones with ultimate 3 yr 10X goal relative to
benchmark established at start of subcontracts; in extensions, goal adjusted to reaching an enzyme cost of $0.10/gallon of ethanol or less
• Status– Details proprietary. Both companies presented updates at a May ‘03
project review and have since issued press releases. See internet.• http://www.ott.doe.gov/biofuels/enzyme_sugar_platform.html• http://www.genencor.com• http://www.novozymes.com
– Go to the companies press web site archives and search on “biomass”
• Highlights/Summary of Reported Accomplishments– Both companies exceeded 3 yr 10X cost reduction goal, decreasing
estimated enzyme costs from ~$5.00 to $0.30-0.40 per gal EtOH– Cost reduction efforts continuing
• One year extensions finished in 11/04 (Genencor) or 1/05 (Novozymes)

0.00
0.50
1.00
1.50
2.00
2.50
3.00
3.50
4.00
4.50
5.00
5.50
1/2/2000 1/1/2001 1/1/2002 1/1/2003 1/1/2004 1/1/2005
Date
Cel
lula
se C
ost (
$/ga
llon
EtO
H)
Cellulase Costs Falling RapidlyExcellent progress being made by industry through DOE subcontracts

Reducing Performance Risk:Demonstrating High-solids Processing
Cost Impact of Pretreatment Reactor Solids Loading
$1.48
$1.34
$1.28$1.30
$1.25
$1.30
$1.35
$1.40
$1.45
$1.50
15% 20% 25% 30% 35%
Reactor Feed Solids Concentration
ME
SP
($/g
al E
tOH
)
ProcessMinimum
Target
ParrReactor
Limit<10%
Achievedin 2000,
Standard Condition
in 2001StandardCondition
in 2002
Achievedin spring
2002
Recently completed modifications to the Sundsreactor system permit reliable, continuous
operation at high solids levels (≥ 30%)
Achievedin summer
2002
Achievedin spring
2003

Reducing Deployment Risk: Showing Base-line Engineering Feasibility
• Dilute-acid pretreatment showstoppers overcome– Some performance levels remain below targets
Parameter Achieved TargetCatalyst Type Dilute Acid
30-35 %0.75-1.25 min
1.5 %190 °C80%-----
Dilute AcidReactor Solids Conc. 30 %
Residence Time 2 minAcid Concentration 1.1 %
Temperature 190 °CXylose Yield 85%
Reactor Metallurgy Incoloy 825-clad
Minimum Pretreatment Performance Targets
• Process samples produced for evaluation– Pretreated solids and hemicellulose hydrolyzate liquors– Lignin-rich process residues

Dilute Sulfuric Acid Pretreatment of Corn Stover
Stover harvested from northeastern Colorado in the fall of 2002

Dilute Sulfuric Acid Pretreatment of Corn Stover
Pretreatment at solids loadings from 25% to 35%

High Solids Pretreatment PerformancePilot-scale dilute acid pretreatment of corn stover at 25%-35% w/w solids
Xylan Solubilization as a Measureof Hemicellulose Extraction/Hydrolysis Efficiency
Enzymatic Digestibilityof Pretreated Solids
Monomeric Xylose Yield Total Xylose Yield Cellulose Digestibility
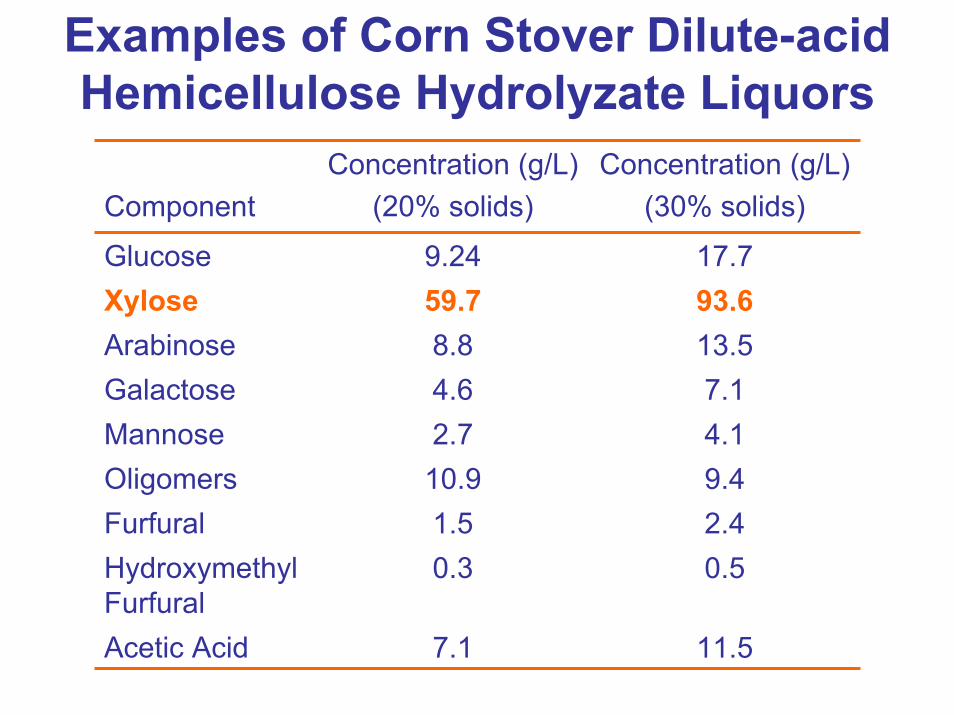
Examples of Corn Stover Dilute-acid Hemicellulose Hydrolyzate Liquors
ComponentConcentration (g/L)
(20% solids)Concentration (g/L)
(30% solids)
9.24 17.793.613.57.14.19.42.40.5
11.5
59.78.84.62.710.91.50.3
7.1
GlucoseXyloseArabinoseGalactoseMannoseOligomersFurfuralHydroxymethyl Furfural Acetic Acid

Sugar Concentration = f(Solids Loading)Ranges in Monomeric Sugar Concentrations
70
80
90
100
110
120
130
140
150
17.5 20.0 22.5 25.0 27.5 30.0 32.5 35.0Pretreatment Solids Loading (% w/w)
Hyd
roly
sate
Mon
omer
ic S
ugar
Con
c. (g
/L)
Iowa Stover
Colorado Stover

Sugar Concentration = f(Solids Loading)Ranges in Total Sugar Concentrations
70
80
90
100
110
120
130
140
150
160
170
17.5 20.0 22.5 25.0 27.5 30.0 32.5 35.0Pretreatment Solids Loading (% w/w)
Hyd
roly
sate
Tot
al S
ugar
Con
cent
ratio
n (g
/L)
Iowa Stover
Colorado Stover
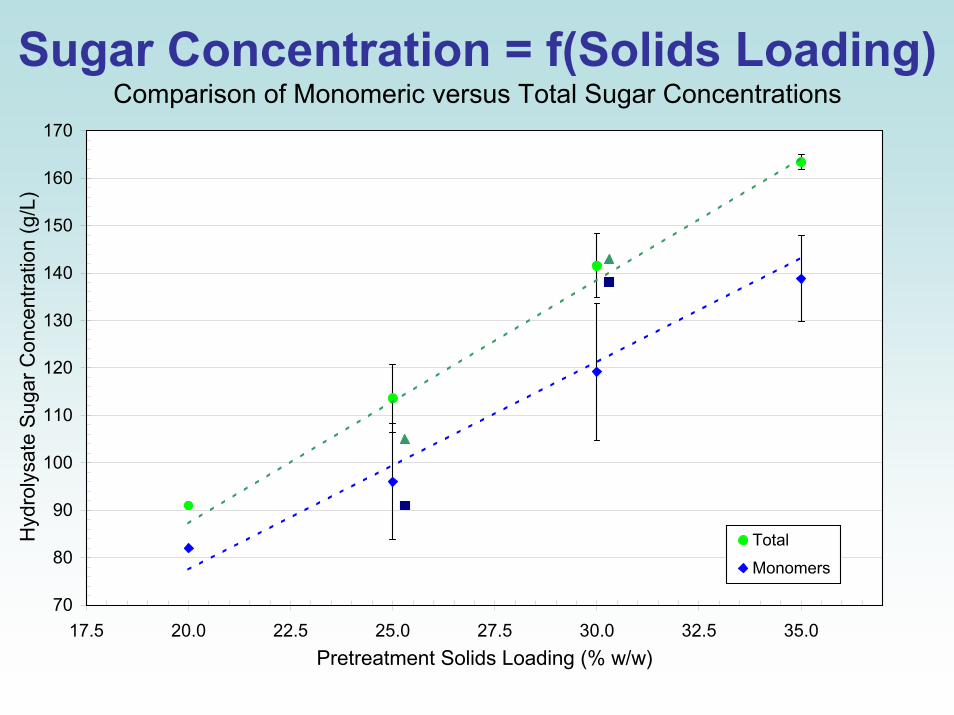
Sugar Concentration = f(Solids Loading)Comparison of Monomeric versus Total Sugar Concentrations
70
80
90
100
110
120
130
140
150
160
170
17.5 20.0 22.5 25.0 27.5 30.0 32.5 35.0Pretreatment Solids Loading (% w/w)
Hyd
roly
sate
Sug
ar C
once
ntra
tion
(g/L
)
Total
Monomers

Impact of Saccharification Solids LoadingResults of Preliminary Techno-Economic Modeling
$0.95
$0.98
$1.01
$1.04
$1.07
$1.10
20% 21% 22% 23% 24% 25% 26% 27% 28% 29% 30%
Solids to Saccharification (wt%)
Eth
anol
Sel
ling
Pri
ce (
$ /
gal
)

Cellulose SaccharificationAssessing Potential Scale-up Issues
Pretreated corn stover, 10% solids loading, 20 mg cellulase† protein/g cellulose, 45°C
†Genencor Spezyme
0
10
20
30
40
50
60
70
80
90
100
0 20 40 60 80 100 120 140 160 180Time (h)
Cel
lulo
se C
onve
rsio
n (%
)
100 mL Working Volume (WV)-Flask3.5 L WV-Vessel13.5 L WV-Vessel

Cellulose SaccharificationImpact of Solids Loading – Preliminary Results
Pretreated corn stover, 20 mg cellulase† protein/g cellulose, 45°C
3.5 L working vol, insulated 7-L Bioflo 3000 fermentors fitted with two oversized marine impellers and using modified temperature control
†Genencor Spezyme
Initial PCS Loading
0%
10%
20%
30%
40%
50%
60%
70%
80%
90%
0 24 48 72 96 120 144 168 192Time (h)
Cel
lulo
se C
onve
rsio
n (%
)
5.0%10.0% (A)10.0% (B)13.5%15.0%

Combining Enzymatic Saccharification and Mixed Biomass Sugar Fermentation
• Complex process integration issue influenced by– Characteristics of substrate, enzyme(s), and microbe
• Substrate: What ranges of sugars and toxins are present after pretreatment, what enzyme activities are required to complete saccharification, and how reactive/susceptible is the substrate?
• Microbe: What sugars can be fermented, and what temperatures andinhibitors tolerated?
• What Enzyme: How effectively are pretreated solids hydrolyzed, how thermostable are enzymes, and how resistant is the enzyme system to end product inhibition?
– Many potential substrates, enzyme preparations, and fermentationstrain combinations are possible
Robust pentose fermentation remains the most critical bottleneck!

0
10
20
30
40
50
0 24 48 72 96 120 144 168 192
GlucoseXyloseCellobioseEthanolTotal CO2
Total solids = 20% (70% v/v liquor) Purchased enzyme at 25 FPU/g cellulose
Carbon balance closure = 99%
Mini-pilot Scale Integrated SSCFC
once
ntra
tion
or T
otal
CO
2 (g/
L)
Pretreated Yellow Poplar (PYP)CPN cellulase
Adapted rDNA Z. mobilis
Time (h)
40
50
60
70
80
90
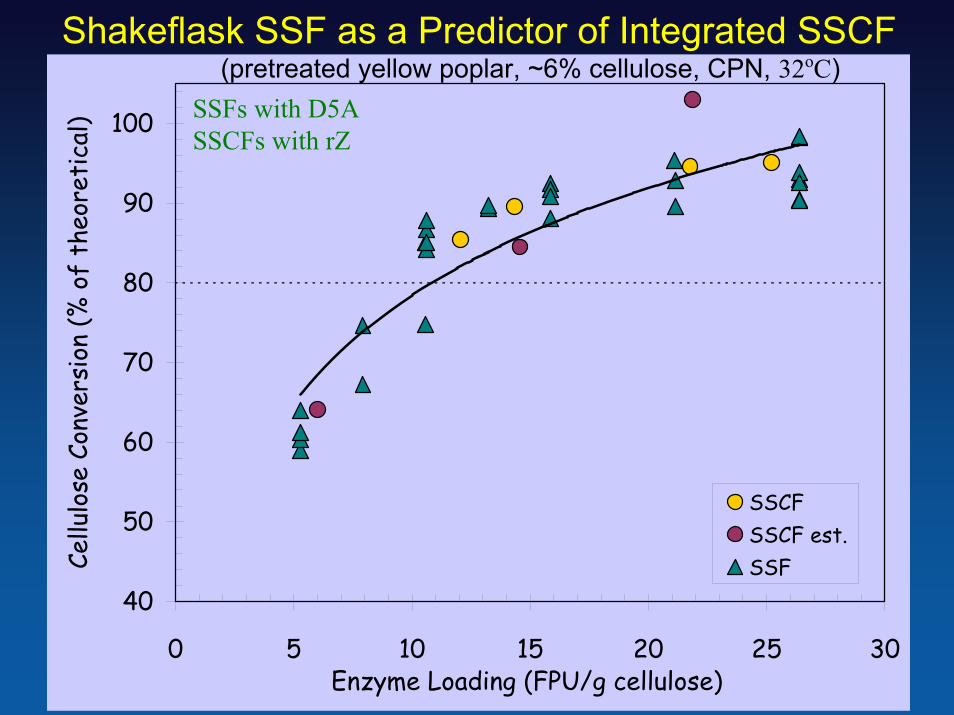
100
0 5 10 15 20 25 30Enzyme Loading (FPU/g cellulose)
Cellu
lose
Con
vers
ion
(% o
f th
eore
tica
l)
SSCFSSCF est.SSF
Shakeflask SSF as a Predictor of Integrated SSCF(pretreated yellow poplar, ~6% cellulose, CPN, 32oC)
SSFs with D5ASSCFs with rZ
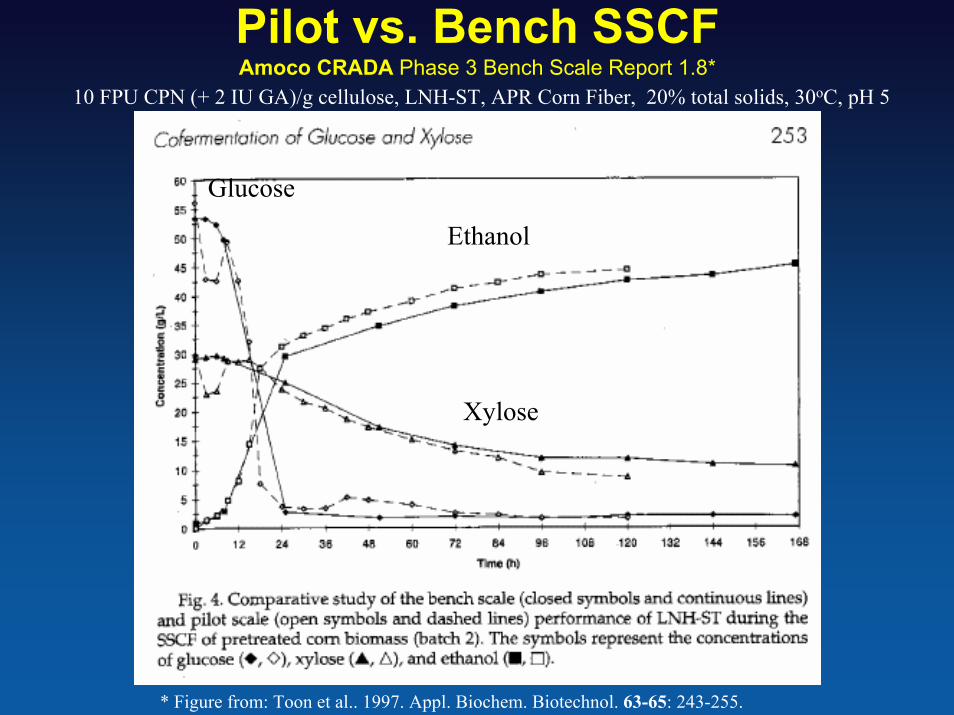
Pilot vs. Bench SSCFAmoco CRADA Phase 3 Bench Scale Report 1.8*
* Figure from: Toon et al.. 1997. Appl. Biochem. Biotechnol. 63-65: 243-255.
Xylose
Ethanol
Glucose
10 FPU CPN (+ 2 IU GA)/g cellulose, LNH-ST, APR Corn Fiber, 20% total solids, 30oC, pH 5
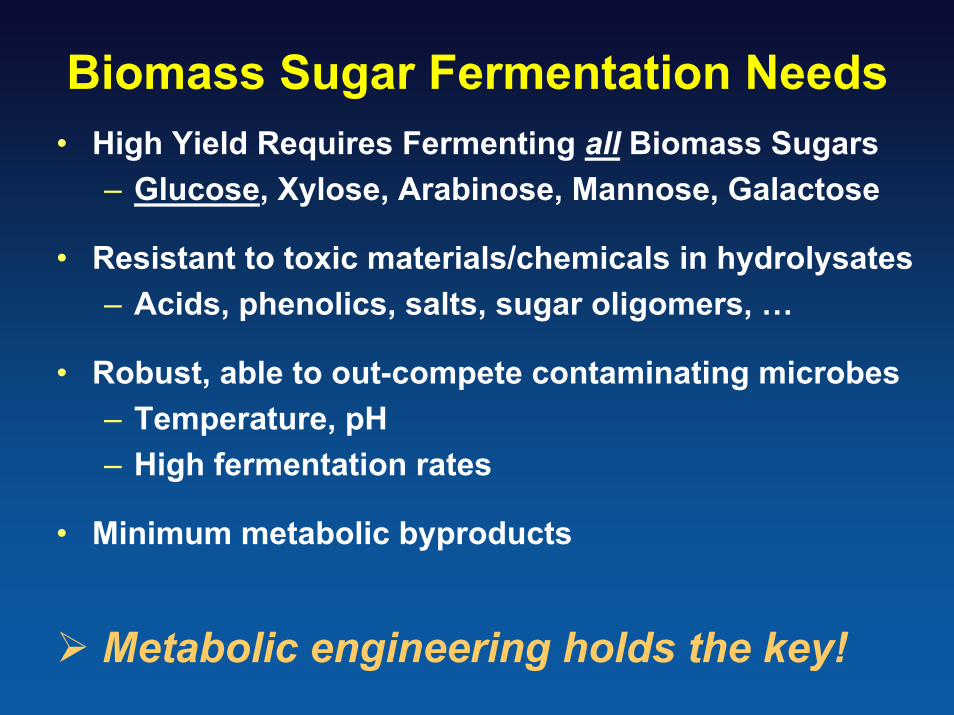
Biomass Sugar Fermentation Needs• High Yield Requires Fermenting all Biomass Sugars
– Glucose, Xylose, Arabinose, Mannose, Galactose
• Resistant to toxic materials/chemicals in hydrolysates– Acids, phenolics, salts, sugar oligomers, …
• Robust, able to out-compete contaminating microbes– Temperature, pH– High fermentation rates
• Minimum metabolic byproducts
Metabolic engineering holds the key!

Pentose Metabolism
Achieving Robust Pentose Fermentation
Ethanol
D-Glucose
Pyruvate
Fructose-6-P
Fructose 1,6-P
Glyceraldehyde-3-P
Phosphoenolpyruvate
Acetaldehyde + CO2
ATPADP
D-Xylulose-5-P Ribulose-5-P Ribose-5-P
Sedoheptulose-7-P Glyceraldehyde-3-P
Erythrose-4-P
Fructose-6-P
Glyceraldehyde-3-P
Fructose-6-P
Transketolase
Transaldolase
Transketolase
L-Arabinose
L-Ribulose
L-arabinose isomerase
L-ribulokinase
L-Ribulose-5-P
L-ribulose-5-P 4-epimerase
ATPADP
GlycolysisD-Xylose
ATPXylulokinase
D-Xylulose
ADP
ATPADP
Dihydroxyacetone-P
1,3-P-Glycerate
3-P-Glycerate
2-P-Glycerate
ADPATP
Xylose Reductase
XylitolXylitol Dehydrogenase
ATPADP
Cell Wall
CO2

IntegratedInformatics
DirectedEvolution
Proteomics
MetaboliteProfiling
Transcriptional Profiling
Flux Analysis
Genome Sequence
FunctionalGenomics
Metabolic Eng “Omics” Tool Kit
• Biomass Basics• Overview of Conversion Options• Details of Enzyme-based Technology• Biorefining Now and in the Future
Outline

Todays Sugar Platform BiorefineriesExamples
• Domestic– Corn mills (wet and dry)– Paper mills (virgin and recycle)
• International– Sugar Mills (cane and beet)
• Especially Brazil’s sugar-ethanol mills

Today’s Corn Grain Biorefineries
Processed to
• Oil• Gluten• Foods• Starch• Industrial ProductsStarch to Sugar Products• Syrups• Ethanol• Industrial Fermentation
Products (many)
DirectlyConsumed• Sweet corn• Popcorn
Processed to• Flours• Grits• Bran• Tortillas• Chips
Processed to• Ethanol• Feed
Emerging products• polymers & chemicals
4%4%
Seed2%
3%
75%
15%
Biomass Conversion Technology “Platforms”
Thermochemical Platform
(Gasification, Pyrolysis)
Sugar Platform(Hydrolysis)
Fuels,Chemicals & Materials
BiomassCombined Heat & Power
Residues
By-products
CO, H2, Bio-oil
Sugars, Lignin
Enable
Biorefineries
Oils

Cellulosic Biorefinery Vision
An integrated biorefinery will make use of:
– Thermochemical conversion technology
– Biochemical conversion technology
– Existing technology• Available today

Challenges to Deploying Future Lignocellulosic Biorefineries
• Demonstrating economic competitiveness in the marketplace– Must be able to show compelling economics with acceptable
risk relative to the competition, i.e., provide a value proposition that can compete with the current industrial sugar platform
Example: Compare process economics of an existing corn dry mill versus a hypothetical enzymatic process using corn stover. Both producing ethanol and one coproduct.

Probable Commercial Configuration
Highertemperatureenzymaticcellulose
saccharification
Beer product slurry to
distillation and solids recovery
Mesophilicenzymatic
hydrolysis &biomass sugarfermentation
Pretreated and conditioned biomass slurry
1st Stage 2nd Stage
• Anticipate exploiting cost effective cellulase preparations in a two stage saccharification/fermentation process• 1st stage: Operate at enzymes’ Topt to exploit thermostability and produce
an intermediate sugar stream (consistent with “sugar platform” concept)
• 2nd stage: Inoculate, run in SSF/SSCF mode to achieve high cellulose conversion yield

Feedstock Collection and
Delivery
Pre-processing
Conversion Process Steps
Ethanol and Solids Recovery, Water Recycle
Grain MashingUsing Acid,Jet Cooking,and Enzymes
GlucoseSugar
Fermentation
Amylases
STARCH PROCESS
Hexose Utilizing Microbe
ThemochemicalPretreatmentUsing Acid
or Alkali
ConditioningCelluloseHydrolysis
UsingEnzymes
Cellulases
MixedBiomass
SugarFermentation STOVER
PROCESS
Hexose and Pentose Utilizing Microbe

Comparative EconomicsWhere We Were: Estimated Process Economics as of Late 1990s
-1.0
0.0
1.0
2.0
3.0
4.0
5.0
6.0
7.0
Grain Dry Mill Stover Enzymatic Process
Man
ufac
turin
g C
ost (
$/ga
llon)
FeedstockNutrients & Raw Matls
EnzymesFixed (incl. Waste Disp)Capital DepreciationCoproduct (DDGS or Elec.)
Total
Greenfield, non-niche, single co-product scenarios

Key Findings
• Costs driven by– Feedstock (grain or stover)– Enzymes (stover)– Utilities prices (gas and electricity; grain)– Capital equipment (stover)
Observation of enzyme cost hurdle led USDOE to emphasize cellulase cost reduction RFP that ultimately led to contracts with Genencor and Novozymes.What will comparative economics look like when cost targets achieved?

Target EconomicsFuture Goal
-0.50
-0.25
0.00
0.25
0.50
0.75
1.00
1.25
1.50
1.75
Grain Dry Mill Stover Enzymatic Process
Man
ufac
turin
g C
ost (
$/ga
llon)
Feedstock Nutrients & Raw Matls EnzymesFixed (incl. Waste Disp) Capital Depreciation Coproduct (DDGS or Elec.)Total
Greenfield, non-niche, single co-product scenarios

Opportunities and Challenges• Lower operating cost
– Operating cost less enzymes potentially 20-40% lower processing stover
– Diversifying feedstock options provide hedge against rising grain prices
• Higher capital cost– $2.5-4.0/annual gal for stover vs. $1.0-1.5 for grain– Co-location and co-products can reduce capital burden

Current Situation• Technology becoming market competitive
– Cost of enzymes falling dramatically– Process chemistry gaps being elucidated– Capital cost decreasing through process intensification
• Deployment risk being reduced– Many commercial projects underway– Iogen operating demonstration plant in Ottawa, ON (Canada)– Engineering of hardier ethanologens progressing
• Societal and environmental benefits being proved– First “crade to grave” Life Cycle Analysis completed

Potential for Novel Coproducts from Enzymatic Sugar Platform Process
Soluble Lignin (Low/Medium
MW Phenolics)
HemicelluloseHydrolyzate
(Xylose)
Cellulose Hydrolyzate(Glucose or
Mixed Sugars)
Insoluble Lignin (High
MW Phenolics)
1o EnzymaticCelluloseHydrolysis
PretreatmentHemicellulose
Hydrolysis
2o EnzymaticHydrolysis &Fermentation
EthanolRecovery &Purification
Cell Mass, Enzymes
(Protein, etc.)
Process Residue Solids
Process Residue Liquids
Biomass EtOH

Potential Opportunities for D-Xylose(as an alternative to existing sugar products, esp. glucose)
• Chiral molecule for specialty products– Build off unique structure and properties of xylose, e.g. xylitol– Exploit chirality for new product synthesis
• Novel monomer for biomaterials and biopolymers• Carbon source for fermentation processes
– Avoid glucose catabolite repression– Reduce operational constraints, e.g., ↓ µmax, ↓ OURmax
α-D-Xyloseα-D-Glucose
Concentration & Purification of
Sugar Product(s)
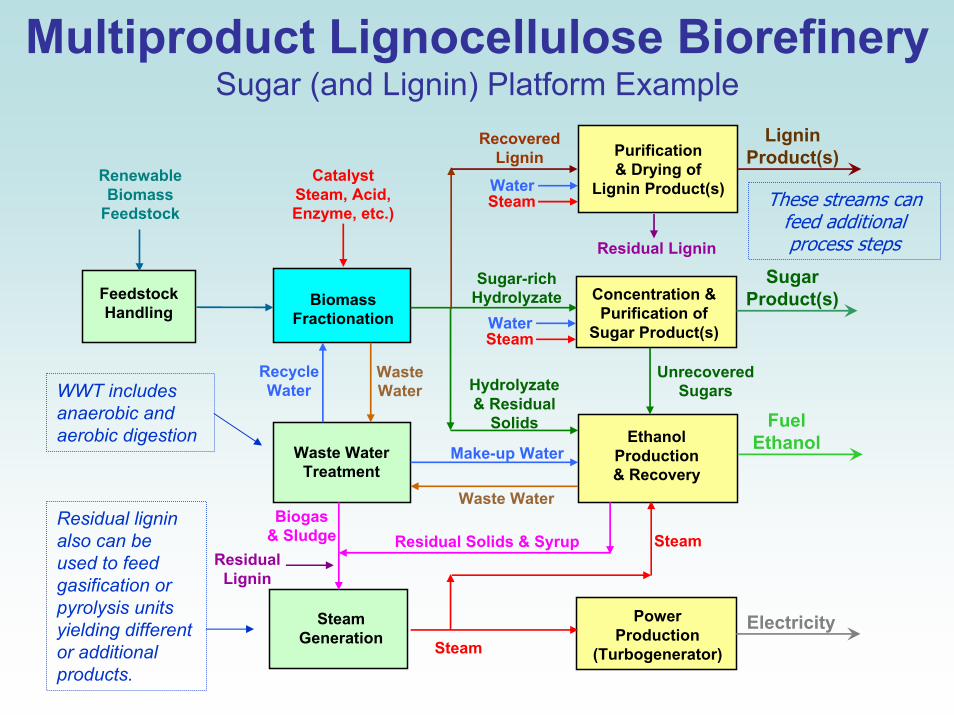
Multiproduct Lignocellulose BiorefinerySugar (and Lignin) Platform Example
Sugar-rich HydrolyzateFeedstock
HandlingBiomass
Fractionation
Waste WaterTreatment
Renewable Biomass
Feedstock
WasteWater
Residual Solids & SyrupBiogas
& Sludge
Sugar Product(s)
RecycleWater
Steam
Steam
CatalystSteam, Acid,Enzyme, etc.)
SteamGeneration
PowerProduction
(Turbogenerator)
Ethanol Production& Recovery
Hydrolyzate& Residual
Solids FuelEthanolMake-up Water
Waste Water
Unrecovered Sugars
Electricity
SteamWater
RecoveredLignin Purification
& Drying ofLignin Product(s)
LigninProduct(s)
SteamWater
Residual Lignin
ResidualLignin
Residual lignin also can be used to feed gasification or pyrolysis units yielding different or additional products.
WWT includes anaerobic and aerobic digestion
These streams can feed additional process steps

Outlook• Sustainability benefits must be validated
• Great progress being made….– Compelling operating costs within reach– Commercialization risks diminishing
• …But more needed to achieve market competitiveness– Process(es) must be proved at scale– Feedstock supply systems must be developed/validated
• Breakthroughs will spur deployment– Robust ethanologens (>10% EtOH on pentoses)– Supportive legislation/policies

Challenges Ahead – Conversion Tech.Scientific
FundamentalsEngineering
Fundamentals Demonstration and Commercialization
•Biomass chemistry and physical properties
•Fractionation •Catalysis
• Chemical• Biological (enzymes and microorganisms)
•Genetic and protein engineering
•Process integration•Material and energy balances
•Solids handling and feeding
•Reactor design•Catalyst production•Reaction kinetics •Separation technology •Materials of construction•Control systems and automation
•Decrease financial risk (in the context of energy price fluctuations)
•Process knowledge at large scale
•Lower capital and operating costs
•Reduce environmental risk (minimize waste)
• Integrate systems for fuels, chemicals, materials, and power for optimum product slate
Increasing costs and industry involvement

Alternative Fuels User Facility (AFUF)• Unique modern user facility developed to support
biomass and bioprocess R&D– Completed in 1994– 10,000 ft2 Process Demonstration Unit– 6,000 ft2 supporting bench scale laboratories
• Mission:– Enable commercial development partners– Facilitate rapid identification of economically attractive
biomass/bioprocessing opportunities– Develop, test and validate bioconversion processes at
bench, minipilot and pilot scales
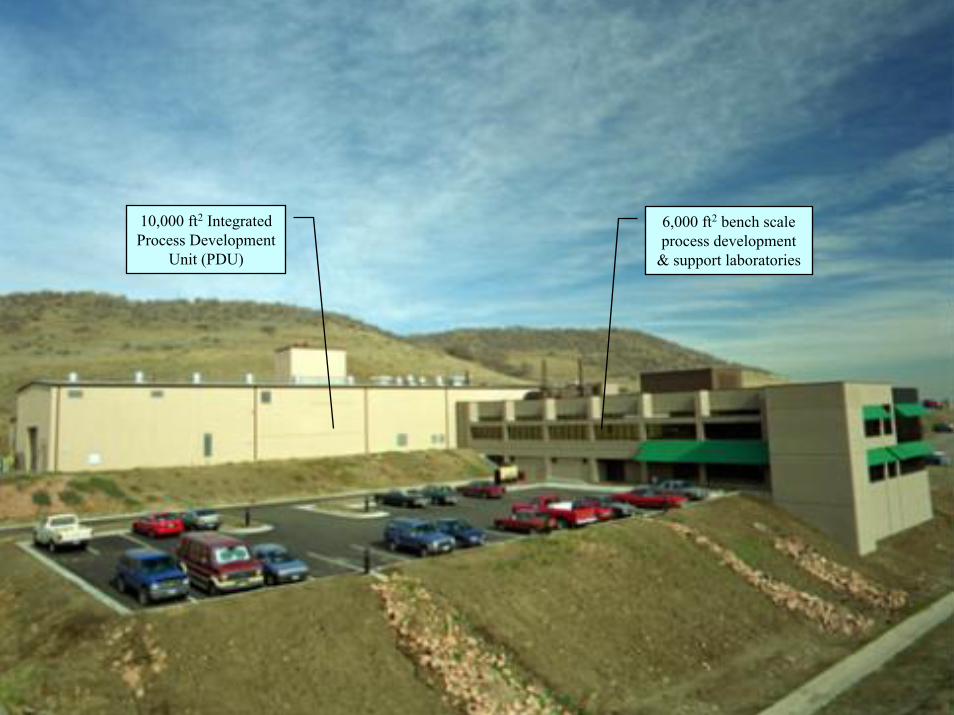
6,000 ft2 bench scale process development
& support laboratories
10,000 ft2 IntegratedProcess Development
Unit (PDU)

Alternative Fuels User Facility (AFUF)Process Development Unit
A fully integrated biomass to ethanol plant• Processes one ton biomass per day• Extensive pre-treatment equipment
options • Batch & continuous fermentation • State-of-art process control and data
handling

Testing Capabilities at the AFUF• Integrated Process Development Unit (PDU)
– Designed to process one (1) ton dry biomass per dayThis is the smallest scale at which continuous high solids pretreatment and liquor conditioning can be performed
– Major components include:• Sunds Hydrolyzer vertical pretreatment reactor• AST continuous column system for liquor conditioning• Four (4) 9000 L fermentors• Supporting equipment
– Feedstock handling– Seed production– Distillation (ethanol stripping)– Various S/L separations devices– Etc.

AFUF Testing Capabilities, cont’d• Minipilot systems for biomass pretreatment and integrated
bioprocess testingsmallest scale for performing batch high solids pretreatment and continuous high solids bioprocessing
– Major components include several smaller pretreatment systems (3-4 L scales) and a variety of highly configurable bioprocessing systems (10-100 L scales)
• Extensive small scale bench systems for batch screening of prospective conversion processes
Together, these capabililities enable high quality validation of batch, fed-batch and continuous bioprocesses prior to scaling up to more costly pilot scale– Assess performance of continuous processes at high solids (biomass)
concentrations (>20% total solids, >15% insoluble solids)– Produce accurate performance data supported by reliable carbon mass
balance closures (100% ±5%)

Microbial Fermentation Examples• Microorganisms:
– Bacteria, yeast and fungi• Zymomonas mobilis, Escherichia coli• Saccharomyces cerevisiae, Pichia stipitis• Trichoderma reesei, Aspergillus niger
• Processes:– EtOH fermentation (± enzymatic
hydrolysis)– Protein (e.g., hydrolase production)– Valued-added products from xylose
• Experimental systems:– Test tube through 9000-L fermentors– With or without solids (slurries)– Batch, fed-batch, or continuous– Anaerobic, microaerophilic, or aerobic
• Biomass Basics• Overview of Conversion Options• Details of Enzyme-based Technology• Biorefining Now and in the Future
Wrap Up
Outline

Additional Information• EERE Biomass Program
– http://www.eere.energy.gov/biomass/Multi-year Technical Plan (MYTP)Biomass feedstocks, sugars platform, and products R&DProcess engineering and life cycle analysis (LCA)Capabilities, facilities and expertise
• NREL Biomass Research– http://www.nrel.gov/biomass/
Capabilities, staff, projectsEnergy analysis and LCA toolsPublications database
• Joint USDOE-USDA Biomass R&D Initiative– www.bioproducts-bioenergy.gov
Status/archives detailing initiative strategies and recent high-level progress, including RFPs issued and funds/projects awardedBiomass “Fact Sheets” for each state in the US (see publications)

Thank You
“…fossil fuels are a one-time gift that lifted us up from subsistence agriculture and eventually should lead us to a future based on renewable resources”
Kenneth Deffeyes, Hubbert’s Peak, 2001
Final Thought…

• Data from NREL’s Sugar Platform R&D– Sugar Platform Integration team (Dan Schell et al.)
– Enzyme Subcontract Liaison (Jim McMillan et a.)
• Comparative economics from NREL-USDA joint study– USDOE/NREL: Kelly Ibsen, Robert Wallace
– USDA ARS: Andrew McAloon, Frank Taylor, Winnie Yee
• Funding– USDOE’s EERE’s Office of the Biomass Program
Acknowledgments


