The phyllosphere and soil are two of the most important reservoirs of antibiotic resistance genes (ARGs) in terrestrial ecosystems.However, comparative studies on the biogeographic patterns of ARGs in these two habitats are lacking. Based on the construction ofARG abundance atlas across a > 4,000 km transect in eastern and northern Australia, we found contrasting biogeographic patterns ofthe phyllosphere and soil resistomes, which showed their distinct responses to the biotic and abiotic stresses. The similarity of ARGcompositions in soil, but not in the phyllosphere, exhibited significant distance-decay patterns. ARG abundance in the phyllospherewas mainly correlated with the compositions of co-occurring bacterial, fungal and protistan communities, indicating that bioticstresses were the main drivers shaping the phyllosphere resistome. Soil ARG abundance was mainly associated with abiotic factorsincluding mean annual temperature and precipitation as well as soil total carbon and nitrogen. Our findings demonstrated thedistinct roles of biotic and abiotic factors in shaping resistomes in different environmental habitats. These findings constitute a majoradvance in our understanding of the current environmental resistomes and contribute to better predictions of the evolution ofenvironmental ARGs by highlighting the importance of habitat difference in shaping environmental resistomes.
INTRODUCTIONThe links between microbial distribution patterns and theirunderlying drivers are a core topic of microbial ecology.1 Previousstudies have revealed that the distribution patterns of soilmicrobial communities can vary markedly across space.2–6
Endemic abiotic factors, including climate,4,6 the availability ofgrowth-limiting nutrients,2,3 soil salinity,7 and soil pH,5 have beendemonstrated to be important in determining the biogeographicpatterns of soil microbial communities. In addition to abioticfactors, the inter-kingdom interactions among co-occurringmicrobial communities also play important roles in governingthe biogeographic patterns and functional diversity of soilmicrobial communities.8–10 For example, the antagonism betweenbacterial and fungal communities can lead to the production ofantibiotics by some bacterial and fungal cells, which exertselection pressure for the evolution of antibiotic resistance genes(ARGs).8,11 ARGs, which are estimated to have existed in naturalecosystems since 2 Gyr ago, play important roles in ecosystemmultifunctionality (i.e. multiple ecosystem functions and ser-vices).12–14 Other than as a defense strategy of bacteria to thwartthe onslaught of antibiotics,15 ARGs are associated with a varietyof other ecosystem functions such as trafficking signals, facilitatingthe detoxification of metabolic intermediates and enhancingbacterial pathogenicity.14,16 Therefore, an adequate evaluation ofthe biogeographic patterns of the resistomes (the collection ofARGs in communities of both pathogenic and non-pathogenic
bacteria17) and their main driving factors is critical to advance ourunderstanding of the spread and evolution of antibiotic resistancein natural settings under the on-going global change.The phyllosphere (the aerial part of plants)18 and soil19,20 have
been ranked as two of the most important reservoirs ofenvironmental antibiotic resistance in terrestrial ecosystems.Owing to the inherently close relationship between plants andsoil, there is a constant exchange of microbes between thephyllosphere and soil habitat, and thus the phyllosphere and soilcould be important sources of ARGs for each other.21–23 However,because of the different conditions of plant surface and soil, thephyllosphere microbiota can be significantly different fromthe microbiota in the soils surrounding the plants.24–26 Due tothe covering of hydrophobic cuticles and influences by ultravioletradiation and plant metabolisms, the phyllosphere is an oligo-trophic and stressful environment with a relatively lower microbialdiversity compared to soil.22 Regardless of the plant species,phyllosphere microbiota from different locations is dominated byonly a few bacteria phyla including Actinobacteria, Bacteroidetes,Firmicutes and Proteobacteria.27,28 By contrast, the soil isconsidered to harbour the most diverse microbial groups onEarth29 which are highly variable among different locations acrossthe globe.30 In addition, a previous study found that some ARGswere not shared by the phyllosphere and surrounding soil23
suggesting that the evolutionary mechanisms of the phyllosphereand soil resistomes might be unique from each other. The
Received: 6 November 2020 Revised: 2 March 2021 Accepted: 11 March 2021
1School of Agriculture and Food, Faculty of Veterinary and Agricultural Sciences, The University of Melbourne, Parkville, VIC, Australia. 2Key Laboratory of Urban Environment andHealth, Institute of Urban Environment, Chinese Academy of Sciences, Xiamen, China. ✉email: [email protected]; [email protected]
comparative studies on the biogeographic patterns of thephyllosphere and soil resistomes, however, are lacking. Thisknowledge gap greatly impedes our ability in predicting thedissemination and evolution of antibiotic resistance in naturalterrestrial ecosystems. Here, we conducted a large-scale investiga-tion of the resistomes in the phyllosphere of predominantherbaceous vegetation types and soil from an >4000 km transect,which encompassed the major representative ecosystem typesacross eastern and northern Australia (i.e., forest, shrubland andgrassland; Fig. 1). We aimed to address a set of questions that arecritical to the understanding of environmental ARGs in naturalterrestrial ecosystems including (i) How do the biogeographicpatterns of resistomes in distinct environmental habitats of thephyllosphere and soil differ across a large spatial scale? (ii) Whatare the roles of spatial distance, co-occurring microbial commu-nities and abiotic climatic and edaphic factors in shaping thebiogeographic patterns of resistomes in these two habitats? Wehypothesized that the different natures of the phyllosphere andsoil environments would lead to unique responses of microbialcommunities to biotic and abiotic factors which would lead todistinct biogeographic patterns of resistomes for the two habitats.
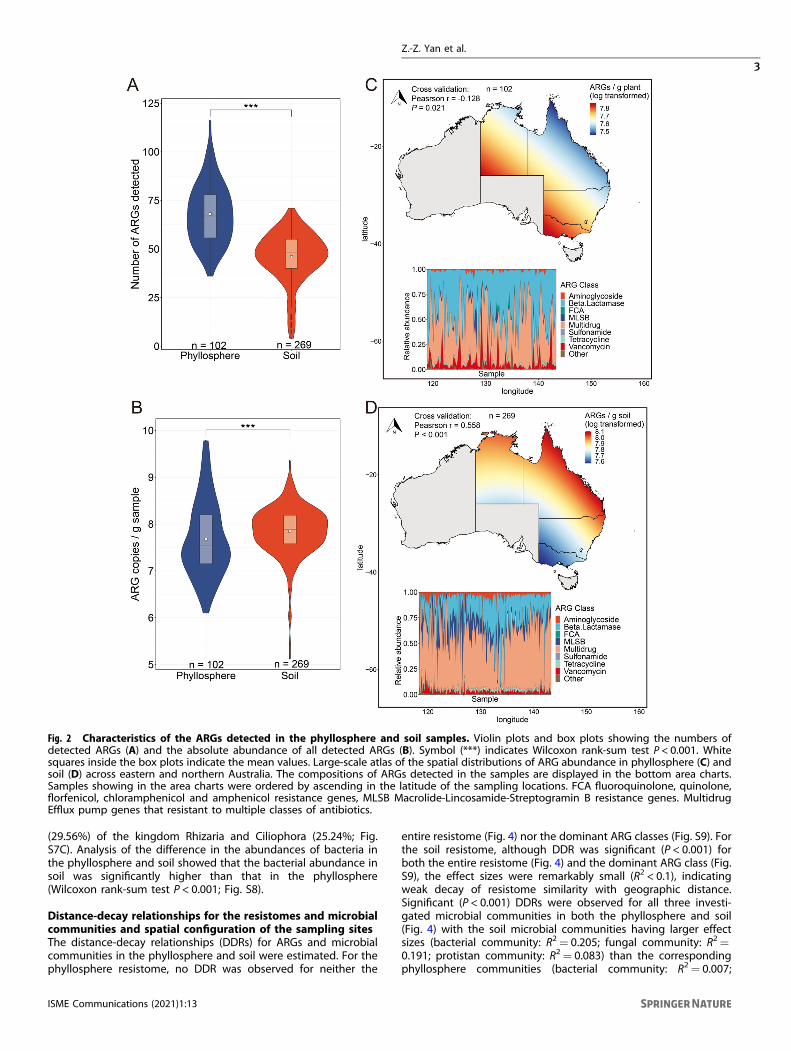
RESULTSLarge-scale atlas of the phyllosphere and soil resistomesUsing high-throughput quantitative PCR (HT-qPCR), we detected264 and 268 ARGs in the 103 phyllosphere and 295 soil samples,respectively. More diverse (Fig. 2A) but less abundant (Fig. 2B)ARGs were detected in the phyllosphere than in soil (Wilcoxonrank-sum test, P < 0.001). The abundance of ARGs (copies/gramsample) ranged from 1.25 × 10⁶ to 5.98 × 10⁹ (with a median valueof 3.43 × 10⁷) for the phyllosphere (Fig. S1) and 1.12 × 10⁷ to2.26 × 109 (with a median of 7.73 × 10⁷) for soil (Fig. S2). Theubiquitous (detected in all samples) and abundant (accounting for>40% of the total abundance) ARG classes were identified asdominant ARG classes. Multidrug resistance genes (i.e., effluxpumps that resistant to multiple classes of antibiotics), and beta-lactamase resistance genes were dominant in the phyllosphereresistome, which accounted for 85.26% of the total ARGabundance (Fig. 2C, insertion). The soil resistome was dominatedby multidrug resistance genes which accounted for 54.25% of thetotal ARG abundance (Fig. 2D, insertion).
The resistomes in the phyllosphere and soil were well separatedfrom each other as revealed by the nonmetric multidimensionalscaling (NMDS) ordinations (ANOSIM R= 0.555, P < 0.001; Fig. S3).The distribution patterns of the ARG abundances were predictedusing the kriging interpolation method. The results revealed that,for the phyllosphere resistome, more abundant ARGs werepredicted in the southern and western parts of Australia than inthe northern and eastern parts (Fig. 2C). An almost opposite trendof ARG abundance was observed for the soil resistome with thehighest ARG abundance to be predicted in the northeast coastalregions of Australia (Fig. 2D). Similar trends in biogeographicpatterns were observed for the dominant ARG class(es) in bothphyllosphere (Fig. S4) and soil (Fig. S5).
Characteristics of bacterial, fungal and protistan communitiesThe high-quality sequences obtained from amplicon sequencingof the 16 S rRNA gene, the internal transcribed spacer (ITS) region,and the 18 S rRNA gene were clustered into 40,997 bacterial,29,525 fungal and 23,545 protistan operational taxonomic units(OTUs) at 97% similarity level, respectively. The alpha-diversity ofall the three investigated microbial communities in soil wassignificantly higher than that in the phyllosphere (Wilcoxon rank-sum test, P < 0.001; Figs. 3A and S6). Clear separations betweenthe microbial communities in the phyllosphere and soil wererevealed by the NMDS ordinations (bacterial community: ANOSIMR= 0.948, P < 0.001, fungal community: ANOSIM R= 0.228, P <0.001; protistan community: ANOSIM R= 0.652, P < 0.001; Fig. 3B).Proteobacteria was the most abundant bacterial phylum in thephyllosphere, which accounted for 79.38% of the 16 S rRNA genesequences, followed by Actinobacteria (9.61%; Fig. S7A). Actino-bacteria was the most abundant bacterial phylum in the soil whichaccounted for 37.73% of the 16 S rRNA gene sequences. Thesecond most abundant bacterial phylum in soil was Proteobacteriawhich accounted for 24.86% of the 16 S rRNA gene sequences(Fig. S7A). The majority of the ITS region sequences belonged tothe fungal phylum Ascomycota, which accounted for 92.32% and78.59% of total sequences in the phyllosphere and soil,respectively (Fig. S7B). The three most abundant protistan phylain the phyllosphere were Metazoa (54.73%) of the kingdomOpisthokonta, and Ciliophora (20.78%), and Apicomplexa (13.91%)of the kingdom AlveolataM (Fig. S7C). For soil, Metazoa (44.20%)was the most abundant protistan phylum, followed by Cercozoa
Fig. 1 Locations and photos of the sampling sites. The blue spots represent the 100 sites where both plant and soil samples were collected.The red spots represent the 19 sites where only soil samples were collected.
Z.-Z. Yan et al.
2
ISME Communications (2021) 1:13
1234567890();,:
(29.56%) of the kingdom Rhizaria and Ciliophora (25.24%; Fig.S7C). Analysis of the difference in the abundances of bacteria inthe phyllosphere and soil showed that the bacterial abundance insoil was significantly higher than that in the phyllosphere(Wilcoxon rank-sum test P < 0.001; Fig. S8).
Distance-decay relationships for the resistomes and microbialcommunities and spatial configuration of the sampling sitesThe distance-decay relationships (DDRs) for ARGs and microbialcommunities in the phyllosphere and soil were estimated. For thephyllosphere resistome, no DDR was observed for neither the
entire resistome (Fig. 4) nor the dominant ARG classes (Fig. S9). Forthe soil resistome, although DDR was significant (P < 0.001) forboth the entire resistome (Fig. 4) and the dominant ARG class (Fig.S9), the effect sizes were remarkably small (R2 < 0.1), indicatingweak decay of resistome similarity with geographic distance.Significant (P < 0.001) DDRs were observed for all three investi-gated microbial communities in both the phyllosphere and soil(Fig. 4) with the soil microbial communities having larger effectsizes (bacterial community: R2= 0.205; fungal community: R2=0.191; protistan community: R2= 0.083) than the correspondingphyllosphere communities (bacterial community: R2= 0.007;
Fig. 2 Characteristics of the ARGs detected in the phyllosphere and soil samples. Violin plots and box plots showing the numbers ofdetected ARGs (A) and the absolute abundance of all detected ARGs (B). Symbol (***) indicates Wilcoxon rank-sum test P < 0.001. Whitesquares inside the box plots indicate the mean values. Large-scale atlas of the spatial distributions of ARG abundance in phyllosphere (C) andsoil (D) across eastern and northern Australia. The compositions of ARGs detected in the samples are displayed in the bottom area charts.Samples showing in the area charts were ordered by ascending in the latitude of the sampling locations. FCA fluoroquinolone, quinolone,florfenicol, chloramphenicol and amphenicol resistance genes, MLSB Macrolide-Lincosamide-Streptogramin B resistance genes. MultidrugEfflux pump genes that resistant to multiple classes of antibiotics.
Z.-Z. Yan et al.
3
ISME Communications (2021) 1:13
fungal community: R2= 0.071; protistan community: R2= 0.015).In addition, the slopes of distance-decay curves were steeper forthe soil microbial communities (bacterial community: slope=−0.841; fungal community: slope=−0.191; protistan community:slope=−0.083,) than the corresponding phyllosphere commu-nities (bacterial community: slope=−0.206; fungal community:slope=−0.524; protistan community: slope=−0.281).Variations in the spatial configuration among the sampling sites
were explored by the Moran’s eigenvector maps (MEMs).31 Theeigenvalues and Moran’s I of the MEMs for the sampling sites aresummarised in Fig. S10A and Table S1, respectively. The MEMs
revealed that our sampling sites showed a significant clusteringpattern (autocorrelation) at a large-scale. The autocorrelations ofthe sampling sites get weaker with the decrease in spatial scale.Examples of some significant MEMs (MEMs with positiveeigenvalues and significant Moran’s I) are mapped in geographicspace (Fig. S10B).
Drivers of ARG abundance in the phyllosphere and the soilenvironmentsSpearman’s correlation analysis revealed that ARG abundance inthe phyllosphere was not only significantly (P < 0.001) positively
Fig. 3 Characteristics of bacterial, fungal and protistan communities in phyllosphere and soils. A Violin plots and boxplots showing theShannon index of bacterial, fungal and protistan communities in phyllosphere and soils. Symbol (***) indicates Wilcoxon rank-sum test P <0.001. White squares inside the box plots indicate the mean values. B Nonmetric multidimensional ordinations of the microbial communitystructures at the OTU level among the phyllosphere and soil samples based on the Bray–Curtis distance. Symbol (***) indicates ANOSIM P <0.001.
Fig. 4 Distance-decay relationships for ARGs, bacterial, fungal and protistan communities at the OTU level in the phyllosphere and soilsamples. Symbol (***) indicates ordinary least regression P < 0.001. Significant correlations (P < 0.05) and no significant correlation (P > 0.05)are shown in solid lines and dashed line, respectively.
Z.-Z. Yan et al.
4
ISME Communications (2021) 1:13
correlated with the bacterial community composition, but alsowas significantly (P < 0.05) correlated with the communitycompositions of fungal and protistan communities. However,none of the investigated abiotic factors was significantlycorrelated with the phyllosphere ARG abundance (Table 1). Incontrast, soil ARG abundance was significantly (P < 0.05) positivelycorrelated with abiotic factors including mean annual temperature(MAT) and mean annual precipitation (MAP), as well as soil totalcarbon (TC) and total nitrogen (TN), but not with the compositionsof any investigated microbial communities (Table 1). Similarrelationships between the abundances of ARGs of the dominantclass(es) with these biotic and abiotic factors were found for boththe phyllosphere and soil samples (Table S2).To further explore how space differently impacts the observed
distinct biogeographic patterns of the soil and phyllosphere
resistomes, distance-based redundancy analysis (dbRDA) wasconducted with the most influential MEMs (top five largest axesof the MEMs) and edaphic as well climatic factors of eachsampling sites as explanatory variables. The dbRDA results revealthat the soil resistome was not only significantly influenced byedaphic factors but also significantly impacted by changes inspatial configurations and corresponding changes in MAT andMAP (Fig. S11A). However, the phyllosphere resistome was onlysignificantly impacted by spatial configuration at large-scale(MEM1) and MAP (Fig. S11B).The direct and indirect contributions of different factors to the
variations in the ARG abundances were further illustrated withstructural equation models (SEMs), which explained 21 and 35% ofthe variations in the ARG abundance for the phyllosphere and thesoil resistomes, respectively (Fig. 5). For the phyllosphere
Table 1. Spearman’s correlation between ARG abundance and selected biotic and abiotic factors.
Microbial community compositions Climatic factors Edaphic factors
P= 0.472 P= 0.731 P= 0.086 P= 0.004 P= 0.001 P < 0.001 P < 0.001 P= 0.501
Significant correlations (P < 0.05) are indicated as bold fonts.
Fig. 5 Drivers of ARG abundances in phyllosphere and soils. Structure equation models (SEMs) illustrating the direct and indirect effects ofmultiple factors on the variations in ARG abundance in phyllosphere (A) and soils (B). The width of the arrows is proportional to the strengthof path coefficients shown by the numbers adjacent to the arrows. R2 indicates the proportion of variations in ARG abundance explained bythe models. Symbol (*) indicates < 0.05; symbol (**) indicates P < 0.01; symbol (***) indicates P < 0.001. Standardised effects were derived fromthe SEMs. GFI goodness of fit index, RMSEA root mean square error of approximation.
Z.-Z. Yan et al.
5
ISME Communications (2021) 1:13
resistome, bacterial and fungal community compositions andbacterial abundance had direct impacts on ARG abundance.Fungal and protistan community compositions had indirectimpacts on ARG abundance through impacting bacterial commu-nity composition and abundance. However, climatic factors onlyhad a weak impact on phyllosphere ARG abundance throughinfluencing fungal and protistan community compositions(Fig. 5A). For the soil resistome, the only biotic factor directlyimpacting the ARG abundance was the abundance of bacteria.Fungal and protistan community compositions only had indirectimpacts on ARG abundance through impacting on bacterialabundance. Compared to fungal and protistan communities,climatic and edaphic factors had relatively strong impacts on thevariation in soil ARG abundance. Particularly, climatic factors hadboth direct and indirect impacts on the variation in soil ARGabundance (Fig. 5B).
DISCUSSIONContrasting resistome profiles in the phyllosphere and soilIn this study, we presented a large-scale investigation into thephyllosphere and soil resistomes across a variety of naturalecosystems. Our results revealed contrasting resistome profiles inthe phyllosphere and soil with the phyllosphere harbouring morediverse but less abundant ARGs than soil (Fig. 2). A possible reasonfor the higher ARG diversity in the phyllosphere than soil is that, asan open habitat, the phyllosphere is subject to wide sources ofmicroorganisms, and ARGs, including those transmitted by insectsand aerosols.21 A previous study reported that for phyllosphereand soil from the same location, the types of phyllospherespecialist ARGs are more than soil specialist ARGs.23 Thedifferences in the abundance of ARGs in the phyllosphere andsoil may mainly be attributed to the differences in the backgroundbacteria abundances, which are the potential hosts of ARGs. Thecomparison of 16 S rRNA gene copy numbers revealed that thebacterial abundance in the soil was more than one order ofmagnitude higher than that in the phyllosphere (Fig. S8). Inaddition, the accumulation of ARGs in soil may also contribute tothe significantly higher ARG abundance in soil than in thephyllosphere.32 Therefore, the ARGs transmitted from the phyllo-sphere may also accumulate in soil and contribute to the increasein soil ARG abundance. We observed similar trends of ARGabundances of the dominant ARG class(es) and the entireresistomes in both the phyllosphere and soil habitats, whichindicate that there might be predictable biogeographic patternsof environmental ARGs in natural ecosystems. The biogeographicpatterns of ARG abundance in the phyllosphere and soil werealmost opposite, implying that the resistome profiles in the above-ground plant surface habitat and underground soil habitat mightbe differently shaped by biotic and abiotic factors.
The soil resistome varies more significantly across space thanthe phyllosphere resistomeThe MEMs revealed that there were autocorrelation patterns ofour sampling sites at a large spatial scale, indicating thatgeographic distance might play a role in driving the communitystructures for our samples. The distance-decay relationship is afundamental ecological pattern to describe the relationshipbetween community similarity and geographic distance.33,34 Inthis study, we observed significant (P < 0.001) DDRs for ARGs insoil but not in the phyllosphere. The effect sizes of the DDRs forthe microbial communities in the phyllosphere were substantiallylower than those of the microbial communities in surroundingsoils (Fig. 4) and reported in other natural soil ecosystems.35 Theseresults demonstrated that compared to those in soil, the phyllo-sphere microbial communities and resistomes vary less signifi-cantly across space which is further supported by the dbRDAresults (Fig. S11). The distinct impacts of spatial distance on the
phyllosphere and soil resistomes could be derived from thedifferences in microbial dispersal limitation.36 The phyllosphere isan environment subjected to the fluctuations of the surroundingenvironment, for example, changes in wind and rainfall, which canfacilitate the transmission of microbes in the phyllosphere fromsite to site.22 The low dispersal limitation in the phyllosphereenvironment would lead to relatively similar microbial commu-nities, and thus similar resistome profiles, among sites spatially farfrom each other.37 Different from the phyllosphere, the soil is arelatively stable environment in which microorganisms are subjectto slow-changing processes.38,39 Therefore, soil microorganismswould experience high dispersal limitation which would result inmore similar resistome profiles between sites closer to each otherthan those further apart.40
Distinct drivers of the biogeographic patterns of thephyllosphere and soil resistomesOur results revealed that the ARG abundance in the phyllospherewas significantly correlated with the community compositions ofbacterial, fungal and protistan communities but not with any ofthe investigated abiotic factors. While for soil, the ARG abundancewas more apparently influenced by abiotic factors, including MAT,MAP, soil TC and TN, than by microbial community compositions.These results suggest that microbial interactions and abioticclimatic and edaphic factors might be the main drivers shapingthe phyllosphere and soil resistomes, respectively. These contrast-ing responses could be potentially derived from the intrinsicdifferences of the two habitats. Compared to the soil resistome,the phyllosphere resistome and bacterial community were lessheterogeneous across geographic locations (Fig. 4). Therefore, forthe phyllosphere resistome the impacts of abiotic factors, whichshift with geography, would be relatively weak and the roles ofinter-kingdom interactions among microbial communities wouldbecome more important. The bacteria-fungal antagonism is a kindof very important inter-kingdom interaction that can lead to theproduction of considerable amounts of antibiotics by somebacterial and fungal cells which select against bacteria lackingARGs.8,11 Another inter-kingdom interaction that could greatlyinfluence the expression of ARGs by bacterial cells is the predationof bacteria by protists, which could pose substantial biotic stressto the bacterial community.41 The expression of some ARGs (forexample, some efflux pump genes) can increase the generaltolerance of bacteria to stresses other than the presence ofantibiotics. Under protistan predation, bacterial cells wouldincrease the expression of ARGs as a strategy to survive, whichmay partially explain the correlations between phyllosphereARG abundance with the protistan community.42 On the contrary,the soil is a stable habitat with relatively high spatialheterogeneity.38,39 In soil habitat, the microbial interactions andgene expressions are underpinned by endemic abiotic factors.39,43
A potential explanation for the observed significant correlationsbetween MAT and MAP with soil ARG abundance could be thatgenotypic alternations of bacterial cells induced by environmentalstresses (e.g. temperature extremes and water shortage) aresimilar to those induced by the action of antibiotics.44 Theavailability of soil nutrients could also be closely related to theARG abundance by influencing the types of microbial interac-tions.45 The stress gradient hypothesis assumes that an increase innutrient availability would enhance the frequency of negativemicrobial interactions which may induce antibiotic production.45
Such a relationship between growth-limiting nutrient availabilityand the direction of microbial interactions could potentiallyexplain the observed positive relationships between soil TC andTN with soil ARG abundance.Nevertheless, it should be noted that there are some potential
caveats in the interpretation of our results. The plant host specieswere not considered in the present study, but it has beenidentified as a potential influencing factor of phyllosphere
Z.-Z. Yan et al.
6
ISME Communications (2021) 1:13
resistomes.46,47 In addition, the presence of stochastic events andpersistent microbial trait variations were not addressed, but thosefactors could play a role in shaping microbial communityassembly1 and thus resistome profiles. These limitations togetherwith the potential sampling effects could explain why >60% of thevariations in the ARG abundance remain unexplained for both thephyllosphere and the soils (Fig. 5). It is impractical to address allpotential variables for a large-scale survey, and this is inconsistentwith previous large-scale microbial studies which explained10–50% of the variations in microbial patterns.1,48–50 Despitethese limitations, our results revealed that the biotic interactionsamong bacterial, fungal and protistan communities and abioticfactors, including MAT, MAP, soil TC and TN, differently drive thevariations in the phyllosphere and soil resistome profiles.
CONCLUSIONIn this study, we provided a systematic investigation into thebiogeographic patterns of the phyllosphere and soil resistomes innatural ecosystems. We found contrasting biogeographic patternsof the phyllosphere and soil resistomes, which may derive from thedistinct impacts of biotic and abiotic factors on the microbialcommunities in these two environmental habitats. The phyllo-sphere resistome, which was not sensitive to the changes in abioticfactors across space, was mainly impacted by the inter-kingdominteractions among bacterial, fungal and protistan communities. Bycontrast, MAT, MAP and soil nutrients were the main driversshaping the soil resistome. Our results imply that the characteristicsof microbial habitat are critical in underpinning the biogeographicpatterns of resistomes in natural ecosystems. Therefore, it isnecessary to consider the intrinsic differences in habitats whenpredicting the evolution and spread of environmental ARGs.
MATERIALS AND METHODSSampling campaignHerbaceous plant and soil samples were collected during May 2019 from atotal of 118 locations across eastern and northern Australia with minimalanthropogenic impacts (Fig. 1). MAT and MAP of the sampling sites rangedfrom 12.93–26.54 °C and 254–1901mm, respectively. At each location, weestablished a 20 × 20m plot in which three subplots (1 × 1m) wereestablished on the most predominant herbaceous vegetation type. Theaerial parts of the herbaceous plants were collected using sterilized scissorsto form a composite plant sample for each plot. Three independent soilsamples were collected from each plot by mixing five soil cores (0–10 cm)into one composite sample. Our large-scale sampling collected a total of103 herbaceous plant samples and 295 soil samples, which weretransported to the laboratory on dry ice. The plant samples wereimmediately used for DNA extraction from the phyllosphere microbes.The soil samples were sieved through a 2mm mesh and divided into twoportions. One portion was air-dried for soil physicochemical characteriza-tion, and the other portion was stored at−20 °C before molecular analyses.
Soil physicochemical characterization and climatic dataacquisitionSoil physicochemical properties including soil TC, TN and soil pH weredetermined using standardized protocols.51 Briefly, soil TC and TN weredetermined using the Dumas combustion method on a LECO EP628analyser (LECO Australia Pty, Ltd, Baulkham Hills, NSW, Australia). Soil pHwas measured in 1:5 soil water suspension using an Orion Star A215 pH/Conductivity Benchtop Multiparameter Metre (Thermo Scientific Inc.,Waltham, MA, USA). Detailed information on soil physicochemical proper-ties is provided in Supplementary File 2. Estimates of MAT and MAP at 30arc seconds (~1 km2) were obtained from the WorldClim database (https://worldclim.org/).52 MAT and MAP values of each sampling location areshown in Supplementary File 3.
Molecular analysesPlant phyllosphere genomic DNA and soil genomic DNA were extractedusing the DNeasy Power Soil kit (QIAGEN). Pty. Ltd, Chadstone Centre, VIC,
Australia) as per the manufacture’s instruction. The plant samplepreparation for phyllosphere genomic DNA extraction was conductedaccording to a previous method.23,53 Briefly, around 5 g leaf tissue wasweighted into a conical flask (25 mmL) containing 100mL of 0.01 Mautoclaved phosphate-buffered saline (PBS). The mixture was sonicated for7 min and shaken at 180 rpm at 30 °C for 1 h. The obtained solution wasfiltered with nylon gauze and then a 0.22 µM cellulose membrane. Thecellulose membrane was cut into pieces and used for DNA extraction. ARGabundance was determined using an HT-qPCR technique on the WafergenSmartChip Real-Time Platform (Fremont, CA, USA). The HT-qPCR arraycontains primers targeting 285 ARGs that confer resistance to all majorclasses of antibiotics commonly used in humans and animals and the16 S rRNA gene. Detailed information on the primers is provided inSupplementary File 4. Amplification of ARGs was conducted in a 100 nLreaction system. The thermal cycle for the amplification was as follows: andinitial enzyme activation at 95 °C for 10min, followed by 40 cycles of 95 °Cfor 30 s and 60 °C for 30 s. The melting process was automaticallygenerated by the Wafergen SmartChip software (V2.7.0). Only well datawith a single melting peak and an amplification efficiency within 1.8–2.2were retained. A cycle threshold (CT) value of 31 was used as the detectionlimit. The relative copy numbers of ARGs were calculated according to thefollowing equation: Relative gene copy number= 10(31-Ct)/ (10/3).54,55 Therelative copy numbers of ARGs were transformed to absolute copynumbers by normalization with 16 S rRNA gene copy number quantifiedusing a Bio-Rad CFX384 Real-Time PCR detection system (Bio-Rad,Hercules, USA). The 20 μl PCR reaction system for 16 S rRNA genequantification contained 10 μl Sensimix SYBR NO-ROX reagent (Bioline,London, UK), 0.8 μl each primer (10 μM) and 2 μl DNA template. Theamplicon condition was the same as that for the amplification of ARGs. Itshould be noted that because the surface areas of the plant cannot beaccurately measured and the mass of the herbaceous plants is marginalcompared to their surface area, we reported the ARG abundance in boththe phyllosphere samples as ARG copies/gram plant tissue according toprevious studies.23,56 The ARG classes that are ubiquitously (detected in allsamples) and abundant (accounted for >40% of total ARG abundance)were identified as dominant ARG classes in the phyllosphere and soilsamples.The 16 S rRNA gene, the ITS region, and the 18 S rRNA gene were
amplified for the characterization of bacterial, fungal and protistancommunities, respectively, on an Illumina Miseq EP300 platform atShanghai Majorbio Bio-pharm Technology Co., Ltd. Primer sets used forthe amplicon sequencings were 515FmodF and 806RmodR for 16 S rRNAgene,57 ITS1F and ITS2R for ITS region58 and TAReukFWD1F andTAReukREV3R for 18 S rRNA gene.59 Raw sequencing reads were mergedusing FLASH60 and quality filtered according to the following criteria: rawpair-end reads containing more than three ambiguous nucleotides, readswith an average quality score <20, short reads (< 100 nt) and the barcodewas discarded. The generated high-quality sequences were analysed andprocessed using Quantitative Insight into Microbial Ecology (QIIME).61
OTUs were picked at 97% similarity level using UCLUST.62 Singleton OTUsand chimeric sequences, chloroplast and mitochondrial OTUs werediscarded from the OTU table before downstream analysis. Taxonomicclassification of OTUs was conducted using the SILVA database for the 16 SrRNA gene,63 UNITE database 8.0 for the ITS region,64 and ProtistsRibosomal Reference (PR2) database for the 18 S rRNA gene PR2.65
Statistical analysesAll statistical analyses were conducted in the R platform (V3.6.3; http://www.r-project.org/) and visualised using the ‘ggplot2’ package.66 Statistical resultswere considered significant at P < 0.05 level. P values for multiplecomparisons were corrected using the Benjamini–Hochberg procedure. Thedifferences in the numbers of the detected ARGs, the abundance of thedetected ARGs, and microbial alpha-diversity indices between the phyllo-sphere and the soil samples were determined using Wilcoxon rank-sum testwith the ‘stats’ package.67 Log-transformed ARG abundances in all plantphyllosphere and soil samples were shown in heatmaps constructed with the‘pheatmap’ package.68 The relationships of resistomes (based on ARGabundance) and microbial communities (at the OTU level) in the phyllo-sphere and the soils were visualised by NMDS ordinations based onBray–Curtis distance with the ‘vegan’ package.69 The significant differences inthe resistome compositions and microbial beta-diversities between thephyllosphere and the soils were determined using PERMANOVA analysis withANOSIM function in the ‘vegan’ package.69 The spatial distributions of theabundance of all detected ARGs and the ARGs belonging to the dominant
ARG classes in the phyllosphere and the soils were estimated using thekriging interpolation method with the ‘automap’ package.70 Cross-validationsof the predicted maps were based on the Pearson correlation betweenthe prediction values and the observed values of the ARG abundances for thesame site. MEMs for the sampling sites were constructed using the‘adespatial’ package71 based on the spatial weight matrix defined usingthe ‘spdep’ package.72 Each MEM eigenvalue quantified a spatial auto-correlation at a given spatial scale. The eigenvalues of the MEMs areautomatically sorted from large-scale to fine-scale. Moran’s I for the spatialautocorrelation were calculated with 999 permutations using the ‘adespatial’package.71 MEMs with a positive eigenvalue and a significant Moran’sIwereconsidered to describe significant spatial autocorrelations.73 DDRs for theresistomes and the microbial community compositions were calculated asthe slopes of the OLS regression relationships between the communitysimilarity (1-Bray–Curtis dissimilarity matrices) calculated with the ‘vegan’package69 and geographic distance calculated with the ‘sp’ package.74
Spearman’s correlations between the ARG abundances and NMDS1 values ofbacterial, fungal and protistan communities as well as MAT, MAP, soil TC, TNand pH were explored with the ‘stats’ package.67 dbRDA to explore theimpacts of changes in spatial configurations and edaphic as well as climaticfactors on the soil and phyllosphere resistomes were conducted with the‘vegan’ package.69
Structure equation modellingThe SEMs75 were conducted using IBM SPSS Amos (V25; Amos DevelopmentCorporation, Chicago, IL, USA) to evaluate the direct and indirect impacts ofa variety of biotic and abiotic factors on variations in ARG abundance in thephyllosphere and the soils. A prior model was established based onhypothesized effects and relationships among the drivers of the ARGabundances (Fig. S12). NMDS1 values of the NMDS analysis were used forthe representation of bacterial, fungal and protistan community structures inthe SEMs. Bacterial abundance was estimated by the copy numbers of 16 SrRNA genes. The overall goodness of fit for the SEMs was determined bymultiple criteria: chi-square test P > 0.05, goodness of fit index (GFI) > 0.90and root mean square error of approximation (RMSEA) < 0.08.76
DATA AVAILABILITYThe raw sequence data reported have been deposited in the National Centre forBiotechnology Information (NCBI) Sequence Read Archive (SRA) under the accessionnumber PRJNA659980 (soil and plant samples titled with S and G).
REFERENCES1. Bay, S. K. et al. Soil bacterial communities exhibit strong biogeographic patterns
at fine taxonomic resolution. mSystems 5, 4 (2020).2. Fierer, N., Strickland, M. S., Liptzin, D., Bradford, M. A. & Cleveland, C. C. Global
patterns in belowground communities. Ecol. Lett. 12, 1238–1249 (2009).3. Leff, J. W. et al. Consistent responses of soil microbial communities to elevated
nutrient inputs in grasslands across the globe. Proc. Natl Acad. Sci. USA 112,10967–10972 (2015).
4. Maestre, F. T. et al. Increasing aridity reduces soil microbial diversity andabundance in global drylands. Proc. Natl Acad. Sci. USA 112, 15684–15689 (2015).
5. Rousk, J. et al. Soil bacterial and fungal communities across a pH gradient in anarable soil. ISME J. 4, 1340–1351 (2010).
6. Zhou, J. et al. Temperature mediates continental-scale diversity of microbes inforest soils. Nat. Commun. 7, 1–10 (2016).
7. Zhang, Y. J. et al. Salinity as a predominant factor modulating the distributionpatterns of antibiotic resistance genes in ocean and river beach soils. Sci. TotalEnviron. 668, 193–203 (2019).
8. Bahram, M. et al. Structure and function of the global topsoil microbiome. Nature560, 233–237 (2018).
9. Faust, K. & Raes, J. Microbial interactions: from networks to models. Nat. Rev.Microbiol. 10, 538–550 (2012).
10. Oliverio, A. M. et al. The global-scale distributions of soil protists and their con-tributions to belowground systems. Sci. Adv. 6, eeax8787. (2020).
11. Boer, W., Folman, L. B., Summerbell, R. C. & Boddy, L. Living in a fungal world:impact of fungi on soil bacterial niche development. FEMS Microbiol. Rev. 29,795–811 (2005).
12. Allen, H. K. et al. Call of the wild: antibiotic resistance genes in natural environ-ments. Nat. Rev. Microbiol. 8, 251–259 (2010).
13. D’Costa, V. M. et al. Antibiotic resistance is ancient. Nature 477, 457–461 (2011).14. Martínez, J. L. Antibiotics and antibiotic resistance genes in natural environments.
Science 321, 365–367 (2008).
15. Goh, E.-B. et al. Transcriptional modulation of bacterial gene expression bysubinhibitory concentrations of antibiotics. Proc. Natl Acad. Sci. USA 99,17025–17030 (2002).
16. Piddock, L. J. Multidrug-resistance efflux pumps? Not just for resistance. Nat. Rev.Microbiol. 4, 629–636 (2006).
17. Wright, G. D. The antibiotic resistome: the nexus of chemical and geneticdiversity. Nat. Rev. Microbiol. 5, 175–186 (2007).
18. Chen, Q.-L., Cui, H. L., Su, J. Q., Penuelas, J. & Zhu, Y. G. Antibiotic resistomes inplant microbiomes. Trends Plant Sci. 24, 530–541 (2019).
19. Forsberg, K. J. et al. Bacterial phylogeny structures soil resistomes across habitats.Nature 509, 612–616 (2014).
20. Zhu, Y. G. et al. Soil biota, antimicrobial resistance and planetary health. Environ.Int. 131, 105059 (2019).
21. Bai, Y. et al. Functional overlap of the Arabidopsis leaf and root microbiota. Nature528, 364–369 (2015).
22. Vorholt, J. A. Microbial life in the phyllosphere. Nat. Rev. Microbiol. 10, 828–840(2012).
23. Chen, Q. L. et al. Application of struvite alters the antibiotic resistome in soil,rhizosphere, and phyllosphere. Environ. Sci. Technol. 51, 8149–8157 (2017).
24. Leveau, J. H. & Lindow, S. E. Appetite of an epiphyte: quantitative monitoring ofbacterial sugar consumption in the phyllosphere. Proc. Natl Acad. Sci. USA 98,3446–3453 (2001).
25. Vacher, C. et al. the phyllosphere: microbial jungle at the plant–climate interface.Annu. Rev. Ecol. Evol. Syst. 47, 1–24 (2016).
26. Yan, Z. Z., Chen, Q. L., Zhang, Y. J., He, J. Z. & Hu, H. W. Industrial development as akey factor explaining variances in soil and grass phyllosphere microbiomes inurban green spaces. Environ. Pollut. 261, 114201 (2020).
27. Delmotte, N. et al. Community proteogenomics reveals insights into the phy-siology of phyllosphere bacteria. Proc. Natl Acad. Sci. USA 106, 16428–16433(2009).
28. Horton, M. W. et al. Genome-wide association study of Arabidopsis thaliana leafmicrobial community. Nat. Commun. 5, 1–7 (2014).
29. Bardgett, R. D. & van der Putten, W. H. Belowground biodiversity and ecosystemfunctioning. Nature 515, 505–511 (2014).
30. Delgado-Baquerizo, M. et al. A global atlas of the dominant bacteria found in soil.Science 359, 320–325 (2018).
31. Dray, S., Legendre, P. & Peres-Neto, P. R. Spatial modelling: a comprehensiveframework for principal coordinate analysis of neighbour matrices (PCNM). Ecol.Model 196, 483–493 (2006).
32. Zhang, Y. J. et al. Transfer of antibiotic resistance from manure-amended soils tovegetable microbiomes. Environ. Int. 130, 104932 (2019).
33. Morlon, H. et al. A general framework for the distance-decay of similarity inecological communities. Ecol .Lett. 11, 904–917 (2008).
34. Srivastava, D. S., Cadotte, M. W., MacDonald, A. A. M., Marushia, R. G. & Mir-otchnick, N. Phylogenetic diversity and the functioning of ecosystems. Ecol Lett.15, 637–648 (2012).
35. Wang, X. B. et al. Habitat-specific patterns and drivers of bacterial β-diversity inChina’s drylands. ISME J. 1, 1345–1358 (2017).
36. Jiao, S., Xu, Y., Zhang, J. & Lu, Y. Environmental filtering drives distinct continentalatlases of soil archaea between dryland and wetland agricultural ecosystems.Microbiome. 7, 1–13 (2019).
37. Nemergut, D. R. et al. Patterns and processes of microbial community assembly.Microbiol. Mol. Biol. Rev. 77, 342–356 (2013).
38. Delgado-Baquerizo, M. et al. Changes in belowground biodiversity during eco-system development. Proc. Natl Acad. Sci. USA 116, 6891–6896 (2019).
39. Fierer, N. Embracing the unknown: disentangling the complexities of the soilmicrobiome. Nat. Rev. Microbiol. 15, 579–590 (2017).
40. Bell, T. Experimental tests of the bacterial distance-decay relationship. ISME J. 4,1357–1365 (2010).
41. Gao, Z., Karlsson, I., Geisen, S., Kowalchuk, G. & Jousset, A. Protists: puppetmasters of the rhizosphere microbiome. Trends Plant Sci. 24, 165–176 (2019).
42. Bengtsson-Palme, J., Kristiansson, E. & Larsson, D. G. J. Environmental factorsinfluencing the development and spread of antibiotic resistance. FEMS Microbiol.Rev. 42, fux053 (2018).
43. Tedersoo, L. et al. Global diversity and geography of soil fungi. Science 346, 6213(2014).
44. McMahon, M. A. S., Xu, J., Moore, J. E., Blair, I. S. & McDowell, D. A. Environmentalstress and antibiotic resistance in food-related pathogens. Appl Environ. Microbiol.73, 211–217 (2007).
45. Hammarlund, S. P. & Harcombe, W. R. Refining the stress gradient hypothesis in amicrobial community. Proc. Natl Acad. Sci. USA 116, 15760–15762 (2019).
47. Lajoie, G., Maglione, R. & Kembel, S. W. Adaptive matching between phyllospherebacteria and their tree hosts in a neotropical forest. Microbiome. 8, 1–10 (2020).
Z.-Z. Yan et al.
8
ISME Communications (2021) 1:13
48. Chen, W. et al. Stochastic processes shape microeukaryotic community assemblyin a subtropical river across wet and dry seasons. Microbiome. 7, 1–16 (2019).
49. Jiao, S., Yang, Y., Xu, Y., Zhang, J. & Lu, Y. Balance between community assemblyprocesses mediates species coexistence in agricultural soil microbiomes acrosseastern China. ISME J. 14, 202–216 (2020).
50. Ramette, A. & Tiedje, J. M. Multiscale responses of microbial life to spatial distanceand environmental heterogeneity in a patchy ecosystem. Proc. Natl Acad. Sci. USA104, 2761–2766 (2007).
51. Rayment G. E., Lyons D. J. Soil chemical methods: Australasia. Vol. 3. CSIROPublishing; 2011.
52. Fick, S. E. & Hijmans, R. J. WorldClim 2: new 1‐km spatial resolution climatesurfaces for global land areas. Int. J. Climatol. 37, 4302–4315 (2017).
53. Yan, Z. Z., Chen, Q. L., Zhang, Y. J., He, J. Z. & Hu, H. W. Antibiotic resistance inurban green spaces mirrors the pattern of industrial distribution. Environ. Int. 132,105106 (2019).
54. Klappenbach, J. A., Saxman, P. R., Cole, J. R. & Schmidt, T. M. rrndb: the ribosomalRNA operon copy number database. Nucleic Acids Res. 29, 181–184 (2001).
55. Stalder, T. et al. Quantitative and qualitative impact of hospital effluent on dis-semination of the integron pool. ISME J. 8, 768–777 (2014).
56. Chen, Q. L. et al. Effect of biochar amendment on the alleviation of antibioticresistance in soil and phyllosphere of Brassica chinensis L. Soil Biol. Biochem. 119,74–82 (2018).
57. Walters, W. et al. Improved bacterial 16S rRNA gene (V4 and V4-5) and fungalinternal transcribed spacer marker gene primers for microbial community sur-veys. mSystems 1, e00009–e00015 (2016).
58. Adams, R. I., Miletto, M., Taylor, J. W. & Bruns, T. D. Dispersal in microbes: fungi inindoor air are dominated by outdoor air and show dispersal limitation at shortdistances. ISME J. 7, 1262–1273 (2013).
59. Stoeck, T. et al. Multiple marker parallel tag environmental DNA sequencingreveals a highly complex eukaryotic community in marine anoxic water. Mol Ecol.19, 21–31 (2010).
60. Magoč, T. & Salzberg, S. L. FLASH: fast length adjustment of short reads toimprove genome assemblies. Bioinformatics 27, 2957–2963 (2011).
61. Caporaso, J. G. et al. QIIME allows analysis of high-throughput communitysequencing data. Nat. Methods 7, 335–336 (2010).
62. Edgar, R. C. Search and clustering orders of magnitude faster than BLAST.Bioinformatics. 26, 2460–2461 (2010).
63. Quast, C. et al. The SILVA ribosomal RNA gene database project: improveddata processing and web-based tools. Nucleic Acids Res. 41, D590–D596(2012).
64. Nilsson, R. H. et al. The UNITE database for molecular identification of fungi:handling dark taxa and parallel taxonomic classifications. Nucleic Acids Res. 47,D259–D264 (2019).
65. Guillou, L. et al. The protist ribosomal reference database (PR2): a catalog ofunicellular eukaryote small sub-unit rRNA sequences with curated taxonomy.Nucleic Acids Res. 41, D597–D604 (2012).
66. Wickham, H. ggplot2: Elegant Graphics for Data Analysis (Springer, Berlin, 2016)..67. Field, A., Miles, J. & Field, Z. Discovering-Statistics-Using-R. (Sage publications,
California, 2012).68. Kolde, R. Pheatmap: pretty heatmaps. R Package. 61, 617 (2012).69. Oksanen, J. et al. Package ‘vegan’. Commun. Ecol. Package 2, 1–295 (2013).70. Hiemstra, P. H., Pebesma, E. J., Twenhöfel, C. J. & Heuvelink, G. B. Real-time
automatic interpolation of ambient gamma dose rates from the Dutch radio-activity monitoring network. Comput. Geosci. 35, 1711–1721 (2009).
71. Dray, S. et al. Package ‘adespatial’. R Package 2018, 3–8 (2018).72. Bivand, R. & Wong, D. W. S. Comparing implementations of global and local
indicators of spatial association. TEST 27, 716–748 (2018).73. Widenfalk, L. A., Malmström, A., Berg, M. P. & Bengtsson, J. Small-scale collembola
community composition in a pine forest soil–overdispersion in functional traits
indicates the importance of species interactions. Soil Biol. Biochem. 103, 52–62(2016). 2016.
74. Pebesma, E. & Bivand, R. Classes and methods for spatial data in R. R-news. 5,9–13 (2005).
75. Pugesek B. H., Tomer A., von Eye A. Structural Equation Modeling: Applications inEcological and Evolutionary Biology. Cambridge: Cambridge University Press,2003.
76. Schermelleh-Engel, K., Moosbrugger, H. & Müller, H. Evaluating the fit of structuralequation models: Tests of significance and descriptive goodness-of-fit measures.MPR Online 8, 23–74 (2003).
ACKNOWLEDGEMENTSWe thank the Melbourne Trace Analysis for Chemical, Earth and EnvironmentalSciences (TrACEES) Platform—Soil Node for the help with soil physicochemicalcharacterization. We thank Qing Xie, School of Agriculture and Food, Faculty ofVeterinary and Agricultural Sciences, The University of Melbourne, for the assistancewith sample processing. This work was financially supported by the AustraliaResearch Council (DP170103628, DE210100271).
AUTHOR CONTRIBUTIONSQ.-L.C and H.-W.H. conceived and designed the research. Z.-Z.Y performed theexperiments and drafted the manuscript. Z-Z.Y. and Q.-L.C analysed the data. C.-Y.L.contributed to sample collection and preparation. Q.-L.C, H.-W.H., J.-Z.H., Y.-G.Z. andB.-A.T.N. amended the manuscript. All authors read and accepted the finalmanuscript.
CONFLICT OF INTERESTSThe authors declare no competing interests.
ADDITIONAL INFORMATIONSupplementary information The online version contains supplementary materialavailable at https://doi.org/10.1038/s43705-021-00012-4.
Correspondence and requests for materials should be addressed to Q.-L.C. or H.-W.H.
Reprints and permission information is available at http://www.nature.com/reprints
Publisher’s note Springer Nature remains neutral with regard to jurisdictional claimsin published maps and institutional affiliations.
Open Access This article is licensed under a Creative CommonsAttribution 4.0 International License, which permits use, sharing,
adaptation, distribution and reproduction in anymedium or format, as long as you giveappropriate credit to the original author(s) and the source, provide a link to the CreativeCommons license, and indicate if changes were made. The images or other third partymaterial in this article are included in the article’s Creative Commons license, unlessindicated otherwise in a credit line to the material. If material is not included in thearticle’s Creative Commons license and your intended use is not permitted by statutoryregulation or exceeds the permitted use, you will need to obtain permission directlyfrom the copyright holder. To view a copy of this license, visit http://creativecommons.org/licenses/by/4.0/.
Title:Biotic and abiotic factors distinctly drive contrasting biogeographic patterns betweenphyllosphere and soil resistomes in natural ecosystems
Date:2021-12
Citation:Yan, Z. -Z., Chen, Q. -L., Li, C. -Y., Thi Nguyen, B. -A., Zhu, Y. -G., He, J. -Z. & Hu, H. -W. (2021). Biotic and abiotic factors distinctly drive contrasting biogeographic patternsbetween phyllosphere and soil resistomes in natural ecosystems. ISME Communications, 1(1), https://doi.org/10.1038/s43705-021-00012-4.