1 Data relates to the period April 1 st – Sept 30 th 2018 taken from the ChAT tool (Annex A dataset). Three month data is for the period July 1 st – Sept 30 th 2018 Birmingham Children’s Trust 6 Month Performance Summary April 2018 – October 2018 Compiled by Penny Arcatinis Performance and Intelligence Manager
Transcript
1 Data relates to the period April 1st – Sept 30th 2018 taken from the ChAT tool (Annex A dataset). Three month data is for the period July 1st – Sept 30th 2018
Birmingham Children’s Trust
6 Month Performance Summary
April 2018 – October 2018
Compiled by Penny Arcatinis
Performance and Intelligence Manager
2 Data relates to the period April 1st – Sept 30th 2018 taken from the ChAT tool (Annex A dataset). Three month data is for the period July 1st – Sept 30th 2018
Purpose of Report ................................................................................................................................... 5
High level summary of indicators ........................................................................................................... 7
What has gone well ................................................................................................................................. 8
What we need to improve ...................................................................................................................... 8
KPI 1: % of all referrals with a decision within 24 hours ..................................................................... 9
KPI 2: % of re-referrals to children’s social care within 12 months .................................................... 9
KPI 3: % assessments completed within 45 working days ................................................................ 10
KPI 4: CIN cases open > 2 years ......................................................................................................... 10
KPI 5: %CP conferences held in 15 working days .............................................................................. 11
KPI6: % of children who become the subject of a CP plan for a second or subsequent time within the last 2 years .................................................................................................................................. 11
KPI7: % of children (under 16 years) who have been looked after for 2.5 years or more, and in the same placement (or placed for adoption) continuously for 2 years or more .................................. 12
KPI8: % of looked after reviews held on time ................................................................................... 12
KPI9: % of care leavers who are in Education, Employment, and Training (EET) ............................. 13
KPI10: Average time between the LA receiving court authority to place a child and deciding on a match (A2) ......................................................................................................................................... 13
KPI12: % of agency social workers (including team managers) ........................................................ 14
PI13: % child protection plans ending within 3 months or less ........................................................ 15
KPI14: Average caseload of qualified social workers ........................................................................ 15
KPI15: % of social workers who have had supervision (in month) ................................................... 16
LIST 1 - CONTACTS ............................................................................................................................. 17
LIST 2 - EARLY HELP (6 months default) ............................................................................................ 18
LIST 3 - REFERRALS (3 months default) ............................................................................................. 18
LIST 4 - ASSESSMENTS (6 months default) ........................................................................................ 19
3 Data relates to the period April 1st – Sept 30th 2018 taken from the ChAT tool (Annex A dataset). Three month data is for the period July 1st – Sept 30th 2018
LIST 5 - SECTION 47s (6 months default) .......................................................................................... 20
LIST 6 - CHILDREN IN NEED (3 months default) ................................................................................ 21
LIST 8 - LOOKED AFTER CHILDREN (6 months default) ..................................................................... 25
LIST 9 - CARE LEAVERS (CURRENT) .................................................................................................... 29
LIST 10 - ADOPTIONS (12 months default)........................................................................................ 32
LIST 11 - ADOPTERS (12 months default) .......................................................................................... 34
4 Data relates to the period April 1st – Sept 30th 2018 taken from the ChAT tool (Annex A dataset). Three month data is for the period July 1st – Sept 30th 2018
Introduction Having a detailed overview of our performance is key to understanding the strengths, needs and challenges within our services.
By analysing our performance, alongside learning from audit and observations of practice, and also by listening to the views of children and families who use our services, we triangulate what we find and this provides us with a clear overview of our work.
We will continue to review our performance information to ensure that all children and their families receive the most appropriate services to meet their needs.
We must constantly ask ourselves about the difference we are we making to children’s lives. This report supports us in asking this important question.
The summary report will be regularly updated and reported to the Trust Board, the Council and the Commissioner of the Trust services.
Jenny Turnross
Director of Practice
5 Data relates to the period April 1st – Sept 30th 2018 taken from the ChAT tool (Annex A dataset). Three month data is for the period July 1st – Sept 30th 2018
Purpose of Report To provide a summary of progress against the Trust contractural performance
indicators for the period April to October 2018.
Highlight areas of particular success, issues requiring attention and remedial activity in place to deal with these.
To assist us in understanding the progress and impact of practice since the Trust began on 1st April 2018.
Relevant background The performance of Birmingham Children’s Trust is monitored monthly through the
Operational Commissioning Group and quarterly via the Children’s Trust Partnership Governance Group.
Information contained within this report will include all 15 of the Key Performance Indicators judged against target, tolerance, trend charts and a narrative account of performance, issues and mitigation.
The performance information relates to the period 1st April to 30th September 2018. This report therefore provides an overview of practice since the Trust began on 1st April 2018.
6 Data relates to the period April 1st – Sept 30th 2018 taken from the ChAT tool (Annex A dataset). Three month data is for the period July 1st – Sept 30th 2018
Trust Performance Indicators No. Indicator
KPI 1 % of all referrals with a decision within 24 hours
KPI 2 % of re-referrals to children’s social care within 12 months
KPI 3 % assessments completed within 45 working days
KPI 4 Child in Need cases open for more than 2 years
KPI 5 % Initial CP Conferences (ICPCs) held within 15 working days
KPI 6 % of children who become the subject of a CP plan for a second or subsequent time within the last 2 years
KPI 7 % of children (under 16 years) who have been looked after for 2.5 years or more, and in the same placement (or placed for adoption) continuously for 2 years or more
KPI8 % of looked after reviews held on time
KPI9 % of care leavers who are in Education, Employment, and Training (EET)
KPI 10 Average time between the LA receiving court authority to place a child and deciding on a match (A2)
KPI 11 % of young offenders that re-offend
KPI 12 % of agency social workers (including team managers)
KPI 13 % child protection plans ending within 3 months or less
KPI 14 Average caseload of qualified social workers
KPI 15 % of social workers who have had supervision (in month)
Bi-monthly Practice Quality: Audit and Evaluation Report, setting out what practice evaluation/audit/review work has been done in the period and the impact of this work for children and their families.
7 Data relates to the period April 1st – Sept 30th 2018 taken from the ChAT tool (Annex A dataset). Three month data is for the period July 1st – Sept 30th 2018
High level summary of indicators PI Measure Target met or within tolerances last 6 months
1 % of all referrals with a decision within 24 hours 5 out of 6 months
2 % of re-referrals to children’s social care within 12 months
4 out of 6 months
3 *% assessments completed within 45 working days
6 out of 6 months
4 Child in Need cases open for more than 2 years 6 out of 6 months
5 % Initial CP Conferences (ICPCs) held within 15 working days
5 out of 6 months
6 % of children who become the subject of a CP plan for a second or subsequent time within the last 2 years
6 out of 6 months
7 *% of children (under 16 years) who have been looked after for 2.5 years or more, and in the same placement (or placed for adoption) continuously for 2 years or more
6 out of 6 months
8 % of looked after reviews held on time 6 out of 6 months
9 *% of care leavers who are in Education, employment, and Training (EET)
6 out of 6 months
10 *Average time between the LA receiving court authority to place a child and deciding on a match (A2)
6 out of 6 months
11 *% of young offenders that re-offend 6 out of 6 months
12 % of agency social workers (including team managers)
6 out of 6 months
13 % child protection plans ending within 3 months or less
6 out of 6 months
14 Average caseload of qualified social workers 6 out of 6 months
15 % of social workers who have had supervision (in month)
6 out of 6 months
12 out of 15 indicators within the 6 months met target or were within the agreed tolerances.
*5 indicators consistently exceeded target for the whole period.
8 Data relates to the period April 1st – Sept 30th 2018 taken from the ChAT tool (Annex A dataset). Three month data is for the period July 1st – Sept 30th 2018
What has gone well 1. Overall performance against the contractual KPI’s has been strong since the Trust’s
inception. 12 out of 15 have been on target since the Trust went live.
2. Assessment timeliness is strong.
3. The timescales for children achieving permanence through adoption are improving.
4. The numbers of care leavers in education, employment and training, in suitable accommodation and who we are in touch with.
5. We continue to offer a good service to children who offend.
6. CP & IRO functions work efficiently & effectively.
What we need to improve A deep dive of practice in respect of re-referrals in the Children’s Advice and Support Service on 1 October 2018 found that in a small number of cases inconsistent management decisions between CASS & ASTI managers led to needs not being fully assessed and a subsequent referral being made.
Action has been taken to reduce the occurrence of this practice:
• A joint session with the CASS and ASTI managers to test threshold decision making.
• An expectation that the CASS team undertake detailed screening including contacting the referrer prior to making their recommendation to the ASTI team. This practice has not been routinely followed due to capacity issues. The CASS team is now fully staffed and the expectation is that routine lateral checks are undertaken for all contacts prior to being recommended as a referral for statutory services or any other services.
• Weekly dip sampling of the decision making at the CASS and MASH interface by the responsible head of service to ensure that lateral checks are undertaken and decisions are made in accordance with the right help, right time guidance.
• We have continued to look at this indicator to understand practice decision making. On 18 October 2018 the referral rate is within the tolerance allowed in the contract, providing evidence that decision making at the front door of our services has improved.
9 Data relates to the period April 1st – Sept 30th 2018 taken from the ChAT tool (Annex A dataset). Three month data is for the period July 1st – Sept 30th 2018
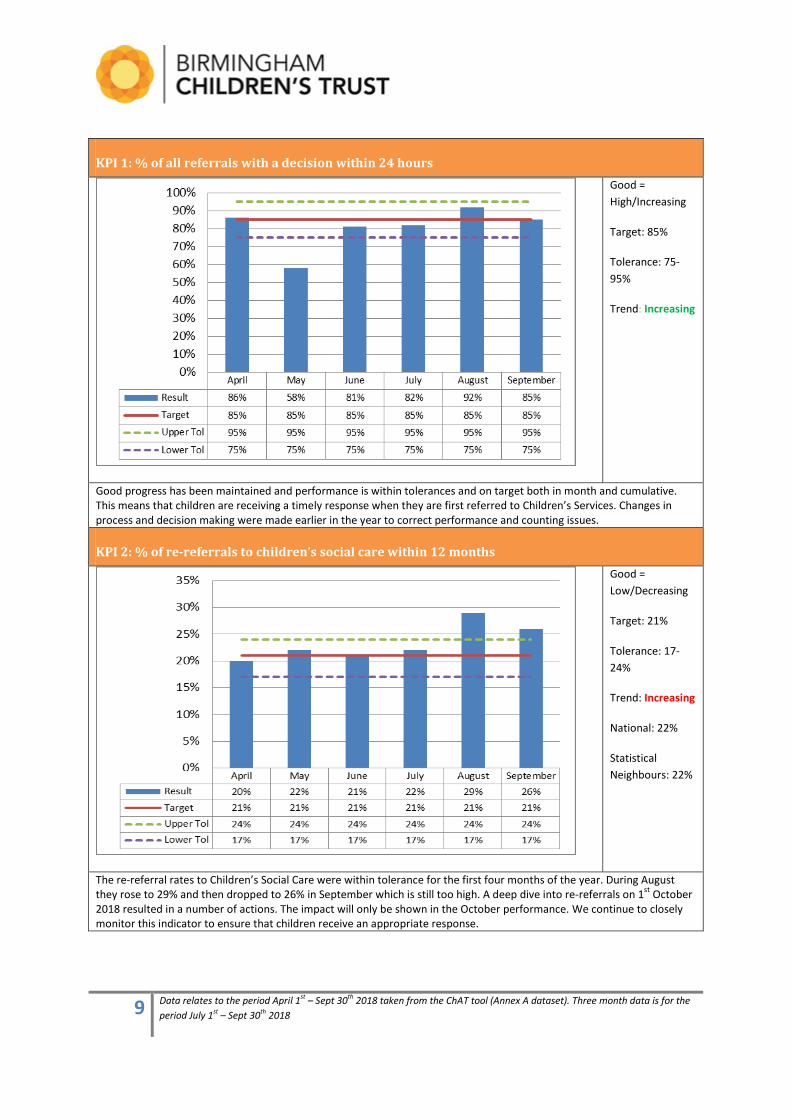
KPI 1: % of all referrals with a decision within 24 hours
Good = High/Increasing
Target: 85%
Tolerance: 75-95%
Trend: Increasing
Good progress has been maintained and performance is within tolerances and on target both in month and cumulative. This means that children are receiving a timely response when they are first referred to Children’s Services. Changes in process and decision making were made earlier in the year to correct performance and counting issues.
KPI 2: % of re-referrals to children’s social care within 12 months
Good = Low/Decreasing
Target: 21%
Tolerance: 17-24%
Trend: Increasing
National: 22%
Statistical Neighbours: 22%
The re-referral rates to Children’s Social Care were within tolerance for the first four months of the year. During August they rose to 29% and then dropped to 26% in September which is still too high. A deep dive into re-referrals on 1st October 2018 resulted in a number of actions. The impact will only be shown in the October performance. We continue to closely monitor this indicator to ensure that children receive an appropriate response.
10 Data relates to the period April 1st – Sept 30th 2018 taken from the ChAT tool (Annex A dataset). Three month data is for the period July 1st – Sept 30th 2018
KPI 3: % assessments completed within 45 working days
Good = High/Increasing
Target: 85%
Tolerance: 80-90%
Trend: stable
National: 83%
Statistical Neighbours: 87%
We are maintaining good performance in this area, particularly in the ASTI teams where most assessment activity takes place. We are still performing above the national average and statistical neighbours. A high figure is better and therefore being above tolerance is very good performance.
KPI 4: CIN cases open > 2 years
Good = Low/stable
Target: 30%
Tolerance: 24-36%
Trend: stable
National: 31%
Statistical Neighbours: 29%
Performance is stable and remains within tolerance. We are always likely to have a lower than national average of open CiN cases, because we have a strong Family Support service working with families below the CiN threshold, and effective step-down processes that mean social work teams can close some cases earlier.
11 Data relates to the period April 1st – Sept 30th 2018 taken from the ChAT tool (Annex A dataset). Three month data is for the period July 1st – Sept 30th 2018
KPI 5: %CP conferences held in 15 working days
Good = High/Increasing
Target: 80%
Tolerance: 80-90%
Trend: Increasing
National: 77%
Statistical Neighbours: 84%
A focus on practice and administration earlier in the year has led to a sustained improved performance.
KPI6: % of children who become the subject of a CP plan for a second or subsequent time within the last 2 years
Good = Low/Decreasing
Target: 12%
Tolerance: 9-14%
Trend: stable
Performance in this area has fluctuated in the period and while improved in September it will remain an area of management focus. Performance on this indicator and KPI 13 are examined in parallel.
12 Data relates to the period April 1st – Sept 30th 2018 taken from the ChAT tool (Annex A dataset). Three month data is for the period July 1st – Sept 30th 2018
KPI7: % of children (under 16 years) who have been looked after for 2.5 years or more, and in the same placement (or placed for adoption) continuously for 2 years or more
Good = High/Increasing
Target: 65%
Tolerance: 62-69%
Trend: Increasing
National: 70%
Statistical Neighbours: 69
This is a long-term indicator that should not vary greatly month by month. Performance has improved and is now above target and tolerance. We are aligned with the national average and in line with our statistical neighbours. The majority of children in care experience stable, long term placements.
KPI8: % of looked after reviews held on time
Good = High/Increasing
Target: 96%
Tolerance: 86-100%
Trend: Increasing
Performance has been strong with targets meet consistently since June. Management action is taken to ensure that for the 4% whose reviews are out of timescale, there is no impact on drift or delay for the children.
13 Data relates to the period April 1st – Sept 30th 2018 taken from the ChAT tool (Annex A dataset). Three month data is for the period July 1st – Sept 30th 2018
KPI9: % of care leavers who are in Education, Employment, and Training (EET)
Good = High/Increasing Target: 55% Tolerance: 50% to 80% Trend: Increasing National: 50% Statistical Neighbours: 48%
Care leavers aged 19 to 21 who are in education, employment or training. Performance continues to improve in this area. This is an area of good practice. We are performing better than statistical neighbours and the national average. Work continues to maintain performance and to ensure that Care Leavers have the best possible opportunities to access education, employment and training. We continue to support those young people who are not in EET.
KPI10: Average time between the LA receiving court authority to place a child and deciding on a match (A2)
Good = Low/Decreasing
Target: 240 days
Tolerance: 220-260 days
Trend: Decreasing
National: 220
Statistical Neighbours: 252
Performance on the three year figure is within tolerance whilst the rolling 12 month figure is considerably better than target. There has been a sustained and significant improvement in performance over last 12 months which reflects a greater focus. Despite some challenges in the timeliness of court care proceedings, children are matched to their adopters quickly.
14 Data relates to the period April 1st – Sept 30th 2018 taken from the ChAT tool (Annex A dataset). Three month data is for the period July 1st – Sept 30th 2018
KPI11: % of young offenders that re-offend
Good = Low/Decreasing
Target: 45%
Tolerance: 30-60%
Trend: Increasing
National: 41%
WM average: 40.5%
YOT Family: 44.7%
The cohort consists of all young people who received a pre-court or court disposal or were released from custody in a 12 month period. This indicator is reported after a big time lag nationally to determine how many offenders go on to reoffend in subsequent year. Our rate is 5% below the National Average and 4% below the WM average. Performance is in the top quartile of all YOTs which means that we perform consistently well in this area.
KPI12: % of agency social workers (including team managers)
Good = Low/Decreasing
Target: 13%
Tolerance: 10-15% days
Trend: Increasing
Rapid recruitment campaigns have added drive and pace to permanent recruitment. This will in turn reduce the reliance on agency workers. Closer monitoring of agency staff has been introduced to ensure that assignments are closed promptly when a position is filled. The recruitment and retention of good quality social workers and team managers continues to be a challenge both within the Trust and regionally. We have introduced a number of initiatives to improve the sufficiency of our workforce. This is an area of continuous high activity and recently candidate quality has improved.
15 Data relates to the period April 1st – Sept 30th 2018 taken from the ChAT tool (Annex A dataset). Three month data is for the period July 1st – Sept 30th 2018
PI13: % child protection plans ending within 3 months or less
Good = Low/Decreasing
Target: 25% days
Tolerance: 20%-30%
Trend: Increasing
National: 20%
Statistical Neighbours: 26%
We are performing better than statistical neighbours, but remain slightly above the national average. We continue to monitor performance to ensure that child protection plans do not end too soon. We monitor this indicator alongside KPI6 (plans for a second time) to ensure that children do not step down from child protection too soon.
KPI14: Average caseload of qualified social workers
Good = Low/Decreasing
Target: 16
Tolerance: 12-20
Trend: Increasing
National: 18
Statistical Neighbours: 18
Caseload averages in BCT remain better than the national average and statistical neighbours. Caseload is counted by children. The caseload figure by family would be lower. This is an area of high scrutiny as we know that excessive caseloads do not support purposeful practice or staff retention.
16 Data relates to the period April 1st – Sept 30th 2018 taken from the ChAT tool (Annex A dataset). Three month data is for the period July 1st – Sept 30th 2018
KPI15: % of social workers who have had supervision (in month)
Good = High/Increasing
Target: 86%
Tolerance: 80-90%
Trend: Decreasing
Performance remains within the tolerance and above the target, which is good. Social workers are being supervised to the required level and we would expect to see social workers supervised at least 10 times per year. We saw a dip in performance during August; this was due to summer annual leave. Within area performance meetings, staff who have not been supervised for one or two months are flagged and a review is undertaken by the HoS.
17 Data relates to the period April 1st – Sept 30th 2018 taken from the ChAT tool (Annex A dataset). Three month data is for the period July 1st – Sept 30th 2018
ChAT Commentary / Live data on 1 October 2018
LIST 1 - CONTACTS
Data as at 01/10/2018
Period 3 months
no.
Total number of contacts 8,459 Total for ages 0-17 8,378 Children with a contact 7,326
Commentary: Appears on referral list
Yes 3,323 39% No 5,136 61%
Commentary: Contact source
Police 2507 30%
Health services 2172 26%
LA services 1081 13%
Schools 848 10%
Legal agency / Court / CAFCASS, etc. 516 6%
Individual 500 6%
Anonymous 379 4%
Education services 217 3%
Housing 210 2%
Unknown 22 0%
Other 0 0%
Not recorded 7 0.082%
Referral comparison
Police 1,087 32% Health services 725 21% LA services 488 14% Schools 322 9% Legal agency / Court / CAFCASS, etc. 225 7% Individual 182 5% Anonymous 187 5% Education services 88 3% Housing 57 2% Unknown 4 0% Other 45 1% Not recorded 0 0%
Commentary: Police and health continue to be our greatest referrers which we would expect. Every contact with the Trust is recorded as a ‘contact’ including requests for information. 39% of contacts progress to a referral, this is in line with SN and EA. Contacts in period (contacts)
Commentary: A very small number of multiple contacts are made to the Trust which indicates that we are taking appropriate action when children come to our attention.
18 Data relates to the period April 1st – Sept 30th 2018 taken from the ChAT tool (Annex A dataset). Three month data is for the period July 1st – Sept 30th 2018
Contacts in period (children)
1 contact 6387 87% 2 contacts 786 11% 3 contacts 122 1.7% 4 or more 31 0.4%
Commentary: We have audited the repeat contacts to assure ourselves that children receive a timely and appropriate response.
LIST 2 - EARLY HELP (6 months default)
no. % Total number of CAF/EHA 1,401
Total for ages 0-17 1,385
Children with CAF/EHA 1,388 96%
Appears on referral list
Yes 68 5% No 1,333 95%
Commentary: A very small number of CAFS/EHA appears on the referral list; this means that children are receiving targeted services without the involvement of statutory services, which is good.
Organisation completed
NWC 549 39% South 435 31% East 417 30%
Commentary: Currently we only record EHA/CAF completed by the Trust on the electronic case recording system. However, we do collate the activity of partners and other agencies. EHAs in period (by assessment)
1 1,375 98%
2 26 2%
EHAs in period (by child)
1 EHA/CAFs 1375 99% 2 EHA/CAFs 13 1% 3 EHA/CAFs 0 0% 4 or more 0 0%
Commentary: The low numbers of repeat EHA/CAFs represents evidence that the use of early help assessments and plans are successful in supporting children and families.
LIST 3 - REFERRALS (3 months default) Data as at 01/10/2018
Period 3 months
no. rate per 10,000
Total number of referrals 3,410 473 Total for ages 0-17 3,377
Commentary: 2017/18 referral rate per 10K: England 553, Birmingham 605, SN 685 Referrals result in NFA
NFA 245 7% Further action 3,165 93%
Commentary: Only 7% of referrals result in NFA; this means that children receive a service to support them when we are
19 Data relates to the period April 1st – Sept 30th 2018 taken from the ChAT tool (Annex A dataset). Three month data is for the period July 1st – Sept 30th 2018
aware of their needs. This is good practice. Multiple Referrals
Re-referral 720 21% First referral 2514 74% Not recorded 0 0%
Commentary: Re-referrals in last 12 months
Yes 720 21% No 2514 74% Not recorded 0 0%
Commentary: See KPI 2 for further information – we continue to monitor this area of practice. Referral source
Individual 182 5% Schools 322 9% Education services 88 3% Health services 725 21% Housing 57 2% LA services 488 14% Police 1,087 32% Legal agency / Court / CAFCASS, etc. 225 7% Other 45 1% Anonymous 187 5% Unknown 4 0% Not recorded 0 0%
Commentary: No. referrals in the last 12 months
1 referral 2514 74% 2 referrals 563 17% 3 referrals 128 4% 4 or more 29 1% Not recorded 0 0%
Commentary: The majority of children receive a response at the first referral. We dip sample re-referrals to ensure that children are receiving a proportionate response.
LIST 4 - ASSESSMENTS (6 months default) Data as at 01/10/2018
Period 6 months
no. Rate per 10k
Total no. of assessments 7,214 501 Total for ages 0-17 7,117 Completed assessments 6,459 448
Ongoing assessments 755
Assessment timeliness (completed)
In time 6014 93% Not in time 445 7% Date error 0 0%
Assessment duration (completed) We continue to maintain excellent practice in this area.
20 Data relates to the period April 1st – Sept 30th 2018 taken from the ChAT tool (Annex A dataset). Three month data is for the period July 1st – Sept 30th 2018
same day 451 7% 1 - 10 days 697 11% 11 - 20 days 2,083 32% 21 - 30 days 1,317 20% 31 - 40 days 985 15% 41 - 45 days 481 7% 46 - 50 days 160 2% 51 - 60 days 132 2% 61+ days 153 2% Date error 0 0%
Commentary: The vast majority of assessments are completed within 35 days. We continue to sample short assessments and longer assessments to assure ourselves of an appropriate response and that there is no drift. Assessment duration (completed)
Average (working days) 24 1%
Child seen during assessment (completed)
Child seen 6,119 95% Not seen 340 5% Unknown 0 0%
Commentary: Dip sampling of the 5% indicates that the children concerned are babies or unborn children.
LIST 5 - SECTION 47s (6 months default) S47 where ICPC not required
no. Rate per 10K Total number of S47s 2,531 176 Number of ICPCs 766 53
Commentary: Over half of s47s do not progress to ICPC; we know that we currently complete too many s47s; this is due to partner confidence and our own confidence in managing risk. Multiple S47s
Yes 302 12% No 2224 88% Not recorded 5 0%
Commentary: A very small number of children are subject to subsequent s47s – this is effective practice. ICPC result in CPP
Yes 691 90% No 75 10% Not recorded 0 0%
Commentary: The majority of ICPCs result in child protection plans. This means that the management decision to progress to ICPC is appropriate. Multiple ICPCs
Yes 10 0.4% No 2521 100% Not recorded 0 0%
Commentary: A very small number of children are subject to multiple ICPCs; this is good practice. ICPC timeliness
In time 640 84%
21 Data relates to the period April 1st – Sept 30th 2018 taken from the ChAT tool (Annex A dataset). Three month data is for the period July 1st – Sept 30th 2018
Not in time 126 16% Date error 0 0%
Commentary: The majority of ICPCs are in time; we monitor those that take place over 15 days to ensure minimal delay. ChAT dataset relies on S47 to record and therefore our performance in ChAT looks lower. KPI dataset shows 94% achievement. No. of S47s in the last 12 months
1 S47 enquiry 2,224 88% 2 S47s 244 10% 3+ S47s 58 2% Not recorded 5 0%
Commentary: Good performance is maintained No. ICPCs in the last 12 months
None 1,765 70% 1 ICPC 756 30% More than 1 10 0% Not recorded 0 0%
Commentary: The majority of children are not subjected to unnecessary multi-agency involvement. Where there is more than one ICPC in 12 months this is looked at to ensure response has been proportionate and children are safe. S47 to ICPC duration
a) 0 - 10 working days 73 10% b) 11 - 15 days 567 74% c) 16 - 20 days 60 8% d) 21+ days 66 9%
Commentary: We are currently auditing the cases that do not progress to ICPC within 21 days (66 children)
LIST 6 - CHILDREN IN NEED (3 months default)
no. Rate per 10k
Total CIN in period 11,864
CIN started in period 3,526 490
CIN ceased in period 3,546 492
Current open CIN 8,318 289 Current open CIN age 0-17 7,419
Commentary: The children in need numbers appear static. However we can see that a considerable number of plans have started and the same have ceased during the period. These are not the same children. CIN ceased - duration open case
CIN ceased - reason ceased We are completing a diagnostic of CIN plans as we can see from the data that the majority of plans end within 3 months.
Adopted 7 0% Died 7 0% Residence Order 2 0% Special Guardianship Order 1 0% Transfer to another LA 16 0% Transfer to Adult Social Services 13 0% Other' incl. Child no longer in need 1,045 29% Child not in need after assessment 2,158 61%
22 Data relates to the period April 1st – Sept 30th 2018 taken from the ChAT tool (Annex A dataset). Three month data is for the period July 1st – Sept 30th 2018
Not recorded / error 297 8%
Commentary: This large figure of plans that have ceased after an assessment represents the work of ASTI where social workers complete short term interventions. As above, a diagnostic of the effectiveness of child in need plans will be completed by 30 November 2018 Current CIN - category of need
Abuse or neglect 5,059 61% Child's disability 483 6% Parents illness or disability 111 1% Family in acute stress 701 8% Family dysfunction 534 6% Socially unacceptable behaviour 152 2% Low income 43 1% Absent parenting 329 4% Other than CIN 1 0% Not stated 763 9% Code error 142 2%
Commentary: We would expect that the majority of CIN plans would be due to abuse or neglect. Current CIN - duration open case
In the last 6 weeks 3,986 48% 6 - 12 weeks ago 1,295 16% 12 - 18 weeks ago 339 4% 18 or more weeks ago 908 11% No visit (New CIN<1month) 592 7% No visit (CIN 1+month) 992 12% Date error 206 2%
Commentary: We are completing a diagnostic of CIN and we will consider the rate of visits and children seen by 30 November 2018. The context of CIN refers to all open cases, not just CIN plans. CIN cohort on other lists
LIST 7 - CHILD PROTECTION PLANS (3 months default)
no. Rate per 10k
23 Data relates to the period April 1st – Sept 30th 2018 taken from the ChAT tool (Annex A dataset). Three month data is for the period July 1st – Sept 30th 2018
Total CPP in period 1,707
CPP started in period 371 52
CPP ceased in period 379 53
Current open CPP 1,328 46 Total for ages 0-17
1,327
Commentary: 2017/18 rate per 10K: Birmingham 41, England 45, SN 61 CPP starters - second or subsequent plan
Re-registration 99 27% No previous plan 272 73% Not recorded 0 0%
Commentary: The majority of subsequent plans appear high at 27%. However this is ‘ever’. We are measured on subsequent plans within the last 12 months which is 11% CPP Ceased - 2+ years
Yes 8 2% No 371 98% Not recorded 0 0%
Commentary: We are satisfied that the 8 children who are subject to 2+ year plans are appropriate. CPP starters - Initial abuse category
Neglect 164 44% Physical abuse 25 7% Sexual abuse 16 4% Emotional abuse 166 45% Multiple 0 0% Not recorded 0 0%
Commentary: We recognise that the numbers/rate of children subject to plans through neglect is high. This is a true reflection of our population. The neglect strategy aims to address this matter. CPP ceased - Length of time on plan
Commentary: Recent work has seen that there have been a small number of instances where children have been taken off plans too soon. Performance is beginning to improve. CURRENT OPEN CPP
Subject to EPO / CO / SO or PP
Yes 19 1% No 1,309 99% Not recorded 0 0%
Commentary: Additional protective action is rarely used; this evidences that we are planning appropriately for the vast majority of our children. CPP current - Latest abuse category
24 Data relates to the period April 1st – Sept 30th 2018 taken from the ChAT tool (Annex A dataset). Three month data is for the period July 1st – Sept 30th 2018
Emotional abuse 661 50% Multiple 0 0% Not recorded 0 0%
Commentary: Additional protective action is rarely used; this evidences that we are planning appropriately for the vast majority of our children. CPP current - Length of time on plan
Commentary: As above, work has been completed to ensure that children are not removed from plans too soon. Time since last statutory visit (open CPP)
In the last 4 weeks 1,046 79% 4 - 8 weeks ago 212 16% 8 - 12 weeks ago 23 2% 12 or more weeks ago 20 2% No visit (New CPP<1month) 19 1% No visit (CPP 1+month) 6 0% Date error 2 0%
Commentary: The majority of children subject to plans are seen in accordance with the timescales agreed in their plan. We are currently auditing those children who appear not to have been seen in accordance with the plan. Child seen alone (of those recorded)
Yes 671 100% No 0 0% Not recorded or N/A 657 49%
Commentary: This is good practice. OPEN CPP DURATIONS (MONTHS)
25 Data relates to the period April 1st – Sept 30th 2018 taken from the ChAT tool (Annex A dataset). Three month data is for the period July 1st – Sept 30th 2018
LIST 8 - LOOKED AFTER CHILDREN (6 months default)
no. Rate per 10k
Total CLA in the last 6 months 2,222
CLA started in the last 6 months 304 21
CLA ceased in the last 6 months 308 21
Current open CLA 1,914 66 Total for ages 0-17 1,910
We are assured through audit that our rate and numbers of children in care is appropriate and not out of line with SN and EA. A number of strategies are in place to ensure that children are suitably placed, achieve permanence and exit care safely. Placement location in / out borough (open CLA)
Out of borough 795 42% In borough 1,119 58% Not recorded 0 0%
Commentary: We know that too many children are placed outside of Birmingham. This is not unusual for a large city. We are reassured that only 5% of our children live outside of a 20 mile radius of their home address. Short term placement stability (open CLA)
1-2 placements 1690 88% 3+ placements 224 12% Not recorded 0 0%
Commentary: The vast majority of children experience stable placements. Work is underway to see how we can further support the children who have had 2+ placements. Long term placement stability (open CLA 30+ months aged under 16)
Less than 2 years 225 32% 2+ years 475 68% Not recorded 0 0%
Commentary: We continue to perform well in this area against EA and SN HEALTH
Dental check in time
Yes 1,169 82% No 263 18%
Commentary: Work is underway to further improve performance. Health assessment in time
Yes 1,278 89% No 154 11%
Commentary: Work is underway to further improve performance. Health in time for current open CLA for 12+ months looked after
AGED UNDER FIVE
Yes in the last 6 months 136 72% No 52 28%
AGED FIVE-PLUS
Yes in the last 12 months 1,142 92% No 102 8%
Commentary: We know that this is an area of strength; however we continue to look at ways of strengthening practice and completion of assessments in a more timely way.
26 Data relates to the period April 1st – Sept 30th 2018 taken from the ChAT tool (Annex A dataset). Three month data is for the period July 1st – Sept 30th 2018
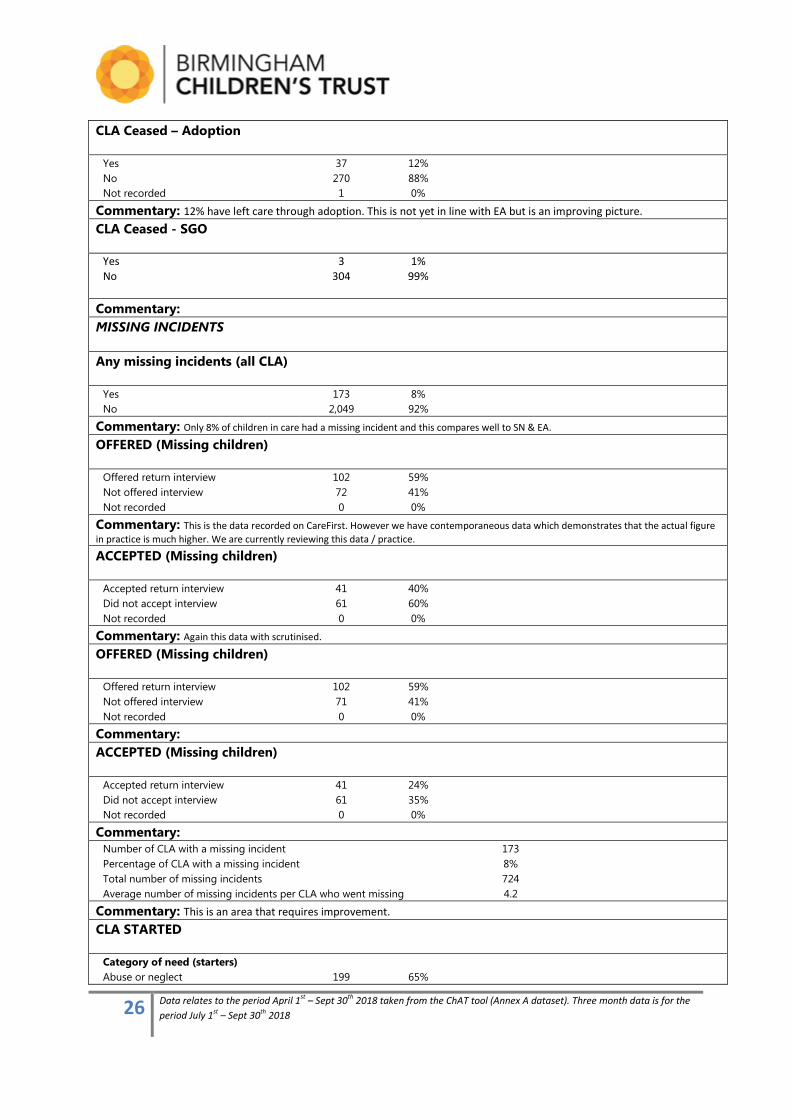
CLA Ceased – Adoption
Yes 37 12% No 270 88% Not recorded 1 0%
Commentary: 12% have left care through adoption. This is not yet in line with EA but is an improving picture. CLA Ceased - SGO
Yes 3 1% No 304 99%
Commentary: MISSING INCIDENTS
Any missing incidents (all CLA)
Yes 173 8% No 2,049 92%
Commentary: Only 8% of children in care had a missing incident and this compares well to SN & EA. OFFERED (Missing children)
Offered return interview 102 59% Not offered interview 72 41% Not recorded 0 0%
Commentary: This is the data recorded on CareFirst. However we have contemporaneous data which demonstrates that the actual figure in practice is much higher. We are currently reviewing this data / practice.
ACCEPTED (Missing children)
Accepted return interview 41 40% Did not accept interview 61 60% Not recorded 0 0%
Commentary: Again this data with scrutinised.
OFFERED (Missing children)
Offered return interview 102 59% Not offered interview 71 41% Not recorded 0 0%
Commentary: ACCEPTED (Missing children)
Accepted return interview 41 24% Did not accept interview 61 35% Not recorded 0 0%
Commentary: Number of CLA with a missing incident 173 Percentage of CLA with a missing incident 8% Total number of missing incidents 724 Average number of missing incidents per CLA who went missing 4.2
Commentary: This is an area that requires improvement. CLA STARTED
Category of need (starters)
Abuse or neglect 199 65%
27 Data relates to the period April 1st – Sept 30th 2018 taken from the ChAT tool (Annex A dataset). Three month data is for the period July 1st – Sept 30th 2018
Child's disability 2 1% Parents illness or disability 3 1% Family in acute stress 24 8% Family dysfunction 21 7% Socially unacceptable behaviour 10 3% Low income 0 0% Absent parenting 43 14% Other than CIN 0 0% Not recorded 0 0% Code error 2 1%
Commentary: Second/Subsequent episode (new CLA)
Yes 17 6% No 287 94% Not recorded 0 0%
Commentary: CLA CEASED
Reason Ceased (ceased)
Adopted 37 12% Died 0 0% Care taken by another LA 1 0% Returned home to live with parents/ relatives 120 39% Live with parents/relatives (not PR) 3 1% Residence order granted 6 2% Special Guardianship Orders 3 1% Moved into independent living 35 11% Transferred to residential care funded by ASS 8 3% Sentenced to custody 11 4% Accommodation on remand ended 1 0% Age assessment determined child was 18+ 2 1% Child moved abroad 0 0% Any other reason 80 26% Not recorded / Error 1 0%
CURRENT OPEN CLA
Plan to reunify 232
Commentary: A large number of children (39%) return to live with their parents; work is underway to assure ourselves that the outcomes for these young people are appropriate. Placement type (current open CLA)
Placement type (current open CLA) a) Own LA b) Private c) Other Total
Foster placement 0 554 708 1262 Placed for adoption 18 1 47 66 Placed with parents 1 2 123 126 Independent living 10 9 19 38 Residential employment 0 0 0 0 Residential accommodation 16 116 16 148 Secure Children’s Homes 1 1 2 4 Children’s Homes 0 131 23 154 Residential Care Home 1 1 0 2
28 Data relates to the period April 1st – Sept 30th 2018 taken from the ChAT tool (Annex A dataset). Three month data is for the period July 1st – Sept 30th 2018
NHS/Health Trust 0 1 1 2 Family Centre 0 4 3 7 Young Offender Institution 0 5 13 18 Residential school 0 2 1 3 Other placements 2 0 80 82 Temporary placement 0 0 0 0
Own provision 49 3% Other provision 1,777 93% Not recorded 88 5%
Foster placements 1,262 66% Other placements 650 34% Not recorded 2 0%
Legal status (current open CLA)
a) Interim care orders 235 12% b) Full care orders 1,153 60% c) Freed for Adoption 0 0% d) Placement order granted 170 9% e) Accommodated under S20 335 18% f) Detained on child protection grounds in LA accommodation 0 0% g) Youth justice legal Statuses 21 1.1% Not recorded / code error 0 0.0%
Commentary: The majority of our children are subject to care orders or an interim care order which is good practice. Child last seen by SW (current open CLA)
In the last 6 weeks 1,480 77% 6 - 12 weeks ago 350 18% 12 - 18 weeks ago 37 2% 18 or more weeks ago 28 1% No visit (New CLA<1month) 6 0% No visit (CLA 1+month) 13 1% Date error 0 0%
Commentary: The vast majority of children in care are seen in accordance with statute which is good practice. Visits to children are monitored in Area Performance Meetings and anywhere they have not been visited are interrogated and action required identified. Time since last CLA Review (current open CLA)
a) 0 > 3 months 962 50% b) 3 > 6 months 834 44% c) 6 > 9 months 70 4% d) 9 > 12 months 7 0% e) 1 year or more 7 0% No review (New CLA <1month) 21 1% No review (CLA 1+ month) 7 0% Date error 6 0%
Commentary: We are reviewing the 5% of children in care who have not been reviewed within 6 months. Review in time (current open CLA)
Yes 1,846 96% No 39 2% Not recorded 29 2%
Commentary: As above PLACEMENTS (CURRENT OPEN CLA)
29 Data relates to the period April 1st – Sept 30th 2018 taken from the ChAT tool (Annex A dataset). Three month data is for the period July 1st – Sept 30th 2018
Commentary: A placements causing concern meeting has been established, we look at any child where we are concerned that their placement is not meeting their needs and ensure appropriate actions are in place to find a suitable placement which can meet their needs Placement duration (Under16s open CLA for 30+ms)
0 > 3 months 40 6% 3 >= 6 months 31 4% 6 months > 1 year 56 8% 1 year > 2 years 98 14% 2+ years 475 68% Date error 0 0%
Commentary: TOTAL MISSING EPISODES PER CLA
Commentary:
LIST 9 - CARE LEAVERS (CURRENT) Data as at 01/10/2018
no. Rate per 10k Total care leavers 759
Care leavers aged 17-18 264 86 Care leavers aged 19-21 448 70
Suitable accommodation (17-18YOs)
Cohort 17-18s (minus excluded) 264
Suitable 228 86% Not 13 5% No info 23 9% Suitable accommodation (19-21YOS)
Cohort 19-21s (minus excluded) 447
Suitable 391 87% Not 24 5% No info 32 7%
30 Data relates to the period April 1st – Sept 30th 2018 taken from the ChAT tool (Annex A dataset). Three month data is for the period July 1st – Sept 30th 2018
Commentary: We are in touch with the vast majority of our care leavers and most of them are in suitable accommodation. EET (17-18YOS)
Cohort 17-18s (minus excluded) 264
EET 192 73% NEET 49 19% No info 23 9% EET (19-21YOS)
Cohort 19-21s (minus excluded) 448
EET 264 59% NEET 152 34% No info 32 7%
Commentary: Practice in this area is very strong Aged 16+ in care till 18th bday
(from LAC list)
Yes till 18th bday 112 76% No before 18th bday 35 24% Total 16-plus ceased 147 100%
Commentary: The majority of children remain in care until their 18th birthday ELIGIBILITY CATEGORY:
Relevant 15 2% Former relevant 717 94% Qualifying 16 2% Other 11 1% Not recorded / code error 0 0%
Care leaver ages (all)
Age 17 24 Age 18 240 Age 19 185 Age 20 166 Age 21 97 Age 17-18 264 Age 19-21 448
Commentary: We now consider young people aged 21-25. LA in touch - Cohort
Age 17 24 2% Age 18 238 17% Age 19 185 13% Age 20 166 12% Age 21 97 7% Age 17-18 262 18% Age 19-21 448 31%
Commentary: As above LA in touch
Age 17 6 25% Age 18 235 99% Age 19 174 94% Age 20 152 92% Age 21 90 93%
31 Data relates to the period April 1st – Sept 30th 2018 taken from the ChAT tool (Annex A dataset). Three month data is for the period July 1st – Sept 30th 2018
Age 17-18 241 92% Age 19-21 416 93%
Commentary: As above In EET - Cohort
Age 17 6 25% Age 18 186 78% Age 19 115 62% Age 20 88 53% Age 21 61 63% Age 17-18 192 73% Age 19-21 264 59%
Commentary: In Suitable Accommodation - Cohort
Age 17 5 21% Age 18 223 93% Age 19 163 89% Age 20 141 85% Age 21 87 90% Age 17-18 228 86% Age 19-21 391 87%
Commentary: Education, Employment, Training (EET) - 17-18 Yos
Education, Employment, Training (EET) - 17-18 Yos EET: In higher education (beyond A level) 1 0% EET: In education other than higher 154 58% EET: In training or employment 37 14% NEET: illness/ disability 2 1% NEET: other reasons 38 14% NEET: pregnancy or parenting 9 3% LA does not have information 23 9% Education, Employment, Training (EET) - 19-21 Yos EET: In higher education (beyond A level) 47 10% EET: In education other than higher 105 23% EET: In training or employment 112 25% NEET: illness/ disability 13 3% NEET: other reasons 103 23% NEET: pregnancy or parenting 36 8% LA does not have information 32 7%
Accommodation 17-18 years Accommodation - 17-18 Yos
a) With parents or relatives 24 9% b) Community home 14 5% c) Semi-independent transitional accommodation 68 26% d) Supported lodgings 13 5% e) Gone abroad 0 0% f) Deported 0 0% g) Ordinary lodgings 2 1% h) Residence not known 0 0% i) No fixed abode / homeless 0 0% j) Foyers 2 1% k) Independent living 39 15% l) Emergency accommodation 1 0% m) Bed and breakfast 1 0%
32 Data relates to the period April 1st – Sept 30th 2018 taken from the ChAT tool (Annex A dataset). Three month data is for the period July 1st – Sept 30th 2018
n) In custody 14 5% o) With Former Foster Carer 59 23% p) Other accommodation 4 2% q) Local authority does not have information 23 9% r) Not recorded 0 0% Accommodation - 19-21YOs
a) With parents or relatives 71 16% b) Community home 18 4% c) Semi-independent transitional accommodation 43 10% d) Supported lodgings 9 2% e) Gone abroad 0 0% f) Deported 0 0% g) Ordinary lodgings 2 0% h) Residence not known 1 0% i) No fixed abode / homeless 0 0% j) Foyers 4 1% k) Independent living 182 41% l) Emergency accommodation 1 0% m) Bed and breakfast 2 0% n) In custody 25 6% o) With Former Foster Carer 48 11% p) Other accommodation 10 2% q) Local authority does not have information 32 7% r) Not recorded 0 0%
Houses of multiple occupancy
Yes in HMO 0 0% No 0 0% Not recorded 759 100%
Commentary: A large number of care leavers live with their former foster carers which is positive.
LIST 10 - ADOPTIONS (12 months default) Data as at 01/10/2018
Period 12 months
Total children 334
Children adopted in period 87
Children waiting to be adopted 202
Children waiting with PO 146
Children with decision reversed 45
Commentary: Adoption Scorecard 1
Ave days btwn entering care and moving in 467
Adoption Scorecard 2 Ave days btwn PO and match 199
Adoption Scorecard 3
Waited less than 14m btwn entering care and place 162 49% 16+ months 172 51% Total 334 100%
CLA Ceased aged 5+
(from LAC list)
Total CLA ceased aged 5+ 233
33 Data relates to the period April 1st – Sept 30th 2018 taken from the ChAT tool (Annex A dataset). Three month data is for the period July 1st – Sept 30th 2018
CLA Ceased aged 5+ adopted 3 1%
Decision reversed 45 13%
Commentary: Performance against A1 and A2 indicators continues to improve. DETAILED BREAKDOWNS
Reason decision changed
Child’s needs changed 0
Court did not make a PO 4
Prospective adopters cannot be found 29
Any other reason 12
Not recorded / code error 0
ADOPTION INDICATOR A1 - GROUPINGS
0 > 6 months 4 5% 6 months > 1 year 40 46% 1 year > 1½ years 26 30% 1½ years > 2 years 6 7% 2+ years 11 13%
ADOPTION INDICATOR A2 - GROUPINGS
0 > 6 months 61 72% 6 months > 1 year 20 24% 1 year > 1½ years 3 4% 1½ years > 2 years 0 0% 2+ years 1 1%
TIMELINESS OF STAGES
(using Ofsted Adoption Tool)
Ave. days Children Stage 1 to 2 249 329 Stage 2 to 3 55 244 Stage 3 to 4 199 152 Stage 4 to 5 22 148 Stage 5 to 6 254 87
Stage 1 to 5 519 149
SHORTEST AND LONGEST CASES
(using Ofsted Adoption Tool)
Shortest Longest Stage 1 to 2 64 2218 Stage 2 to 3 0 251 Stage 3 to 4 14 1313 Stage 4 to 5 0 224 Stage 5 to 6 35 837
Stage 1 to 5 121 2702
Commentary: A1 groupings show that the highest proportion of children placed took between 6 months to a year from entering care to being placed (46%). Regarding stage timeliness, we have seen improvements in both average days between entering care and having an adoption plan approved (Stage 1 to 2) and average days from placement order to finding a match (Stage 3 to 4). Historically we have had many outliers due to delays with these stages so it is good to see such an improvement. AS3: DURATIONS
34 Data relates to the period April 1st – Sept 30th 2018 taken from the ChAT tool (Annex A dataset). Three month data is for the period July 1st – Sept 30th 2018
2012-15 threshold 639 639 608 547 487 426
2012-15 threshold
213 213 182 152 121 121
Commentary: The DfE threshold for A1 is currently 426 days and 121 days for A2. Therefore, this cohort of children in the 12 month period are on average 41 days over the A1 threshold and 78 days over the A2 threshold; however we continue to move closer to these thresholds compared to previous years.
LIST 11 - ADOPTERS (12 months default) Data as at 01/10/2018
Period 12 months
Total individuals 112 Enquirer 21
Applicant 34
Adopter with placement 26
Adopter without placement 16
Other 15
Not recorded / code error 0
Commentary: List 11 includes any individual who has enquired, been approved or had a child placed with them in the 12 month period – in this 12 month period there were 112 individuals who fit this criteria. In next month’s cohort, we will expect to see an increase in enquirers due to marketing for National Adoption Week.
TIMELINESS OF STAGES
Ave days Adults
Stage 1 to 2 54 89 Stage 2 to 3 112 66 Stage 3 to 4 108 56 Stage 4 to 5 41 56 Stage 5 to 6 142 6 Stage 6 to 7 373 6 Stage 7 to 8 187 15
Stage 2 to 7 559 41
Commentary Stage 2 to 7 is Application to Placement – 41 individuals in this cohort with a child placed with them took on average 559 days from their application date to placement. We know about outliers in stage 1 due to delays with medical and DBS checks as well as applicants personal circumstances that cause delays. SHORTEST AND LONGEST CASES
Shortest Longest Stage 1 to 2 8 214 Stage 2 to 3 0 487
35 Data relates to the period April 1st – Sept 30th 2018 taken from the ChAT tool (Annex A dataset). Three month data is for the period July 1st – Sept 30th 2018
Stage 3 to 4 0 386 Stage 4 to 5 0 270 Stage 5 to 6 62 260 Stage 6 to 7 223 774 Stage 7 to 8 106 244
Stage 2 to 7 91 1432
Commentary: As above to explain the longest cases. APPICATION TO PLACEMENT STAGES
Commentary: The graph above displays the duration between application and placement for the 41 individuals in the cohort with a child placed with them. 24 out of 41 individuals (59%) took between 12 and 24 months from application to placement.