29
Introducing Birst 5X featuring Elekta Healthcare Analytics Transforming the way you work with data

Introducing Birst 5X featuringElekta Healthcare Analytics
Transforming the way you work with data

2
Please send questions using the online interface
Attendees muted upon entry
Webinar Notes

3
Featured Speakers
Pedro ArellanoSenior Director,Product Strategy
Mike BozekVP of Business Line, Cancer Care Solutions

4
Agenda
• Introducing Birst 5X
• Product demonstration
• Elekta Healthcare Analytics
• Q&A

5
Who is Birst?
• Leader in Cloud Analytics
• 10,000+ organizations rely on Birst across all verticals
• Founded by Siebel Analytics veterans
• 80+ Strategic Partners
“Birst has defined the pioneering vision of what a set of cloud BI and analytics
capabilities should look like.”
2015 Business Intelligence and Analytics Magic Quadrant

6
Yesterday – Tools Out
Next Generation BI UX is Adaptive
• Hardwired Producer-Consumer
• Tools walled off from each other
• Lock-in
Today – People In
• Make Consumers Producers
• Blend the experiences across capabilities
• Open Client Interface
7
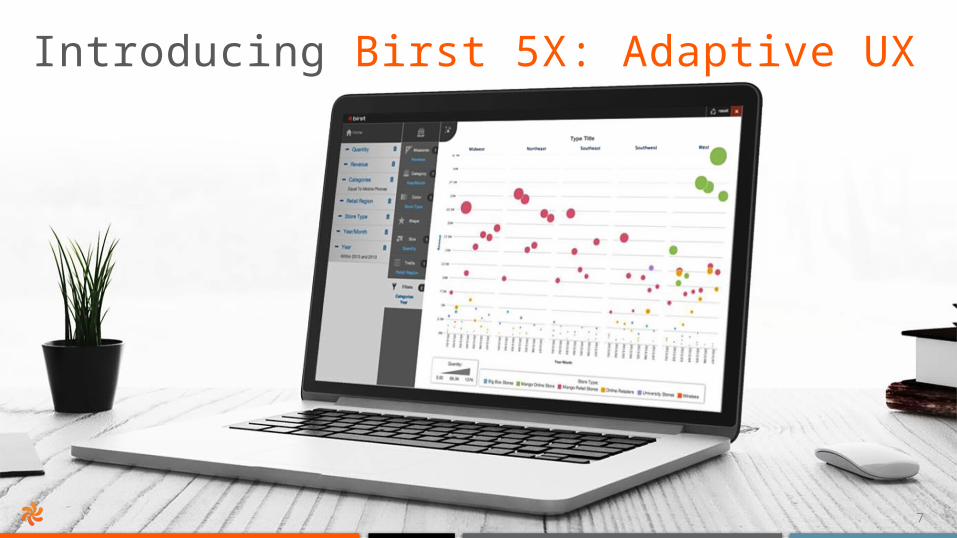
Business Data Gone Wild
Introducing Birst 5X: Adaptive UX

8
What is Birst 5X: Adaptive UX?
“People in”, not “Tools out”Transforming how people work with data
Every consumer becomes a producerBreak down the wall between dashboards and discovery
Adapts to your modern mobile work styleAccess data anytime, anywhere, connected or disconnected
Fit Your Current ExperienceEmbrace different tools while avoiding analytical chaos

9
Integrated dashboards and discovery
• Soft boundary between content creation and production
• HTML 5 code base for portability
• Application-ready

10
Adapting to the modern mobile work style
• % of technology decision-makers who make BI applications available on mobile devices has quadrupled since 2012
• % of decision-makers who state BI is delivered exclusively via mobile devices up from 1% to 7%
• Offline Capabilities Can Make Or Break Any Type Of Mobile BI Deployment
• Mobile BI’s transformational potential remains underexplored

11
Birst mobile: Insights anywhere, anytime
• Offline anywhere
• Create once - Use anywhere
• Responsive Design
• Simple Gestures
• Easy to Use
• Business User Ready

12
By 2016, only 10% of self-service business intelligence initiatives will be sufficiently well governed to prevent inconsistencies that adversely affect the business.
“
”Gartner: Embrace Self-Service Data Preparation Tools for Agility, but Govern to Avoid Data Chaos,
March 2015

13
Open Client Interface
#1 Spreadsheet Application
#1 VisualAnalyst Tool
#1 Predictive Analyst Tool
Driving the Use of Analytically Ready Data Everywhere

14
Enterprise reporting
Predictive analytics
Interactivedashboards
Visual discovery
Design studio
Mobile analytics
Open ClientInterfaceA
dapti
ve U
ser
Exp
eri
en
ce
Ente
rpri
seD
ata
Tie
rU
ser
Data
Tie
r
Live A
ccess
User-ready Data Store
AutomatedData Refinement
Business Model and Data Navigator
Live A
ccess
ERP, CRM, SCM
Data Warehouse Existing Data Stores Apps + Big Data
Adaptive UX is part of Birst’s 2-tier model

15
Demonstration
16
Elekta Healthcare Analytics

17
33 million cancer patients in the world
Source: Globocan 2012. Within 5-year of diagnosis

18
Elekta at a glance
• Elekta is a human care company pioneering solutions for treating cancer and brain disorders
• Around 3,800 employees worldwide
• Close to 45 offices in 30 countries

19
Information-guided cancer care™
Application-based process
Cross-functional organization
Information-assisted tools
More streamlined systems with improved Integration, automation, and recording
Role-based process
Seamless organization
Information-guided tools
Fully automated, connected, modular systems with a
simplified, common interface
Task-based process
Siloed organization
Film and paper tools
Manual systems
1990’s2000’s
Next

20
Clinical and Practice Management tools.
Treatment planning, delivery, and assessment tools
Clinical and business intelligence applications.
TreatmentManagement
Care Management
KnowledgeManagement
Elekta Software Portfolio
21
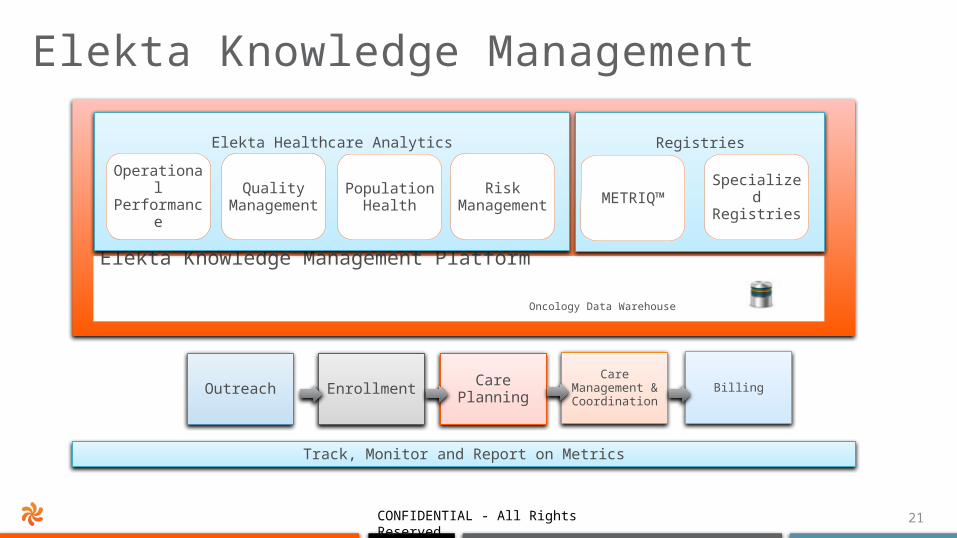
Elekta Knowledge Management
Elekta Knowledge Management Platform Oncology Data Warehouse
Outreach Enrollment Care Planning
Care Management &
CoordinationBilling
Elekta Healthcare Analytics
Track, Monitor and Report on Metrics
Operational Performanc
e
CONFIDENTIAL - All Rights Reserved
Registries
Quality Manageme
nt
Population Health
Risk Manageme
ntMETRIQ™
Specialized Registries

22
Today’s Challenges
Volume to value-based
Readmission Rates
Bundled Payments ACOs
Drive quality and reduce costs
Deliver the right treatment the 1st time
Manage patient populations and coordinate care
Reduce network costs and improve customer satisfaction
Deliver on a vision of Information-guided care™
Support a learning healthcare IT system
23
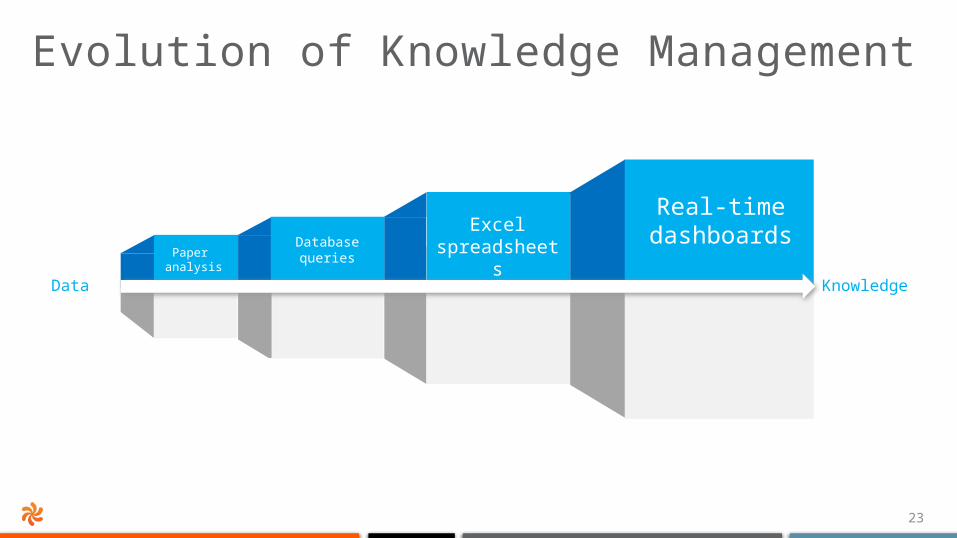
Data Knowledge
Paper analysis
Database queries
Excel spreadsheets
Real-time dashboards
Evolution of Knowledge Management

24
Overview dashboard provides high-level measures to quickly identify utilization performance to ensure patient access to care
1
1
Machine or location appointment duration (time) distribution
2
2 Average daily use by machine or location over time
3
3 Total hours usage by machine or location over time
Healthcare Analytics: Asset Utilization Overview

25
Provides the ability to measure by machine or location utilization on:• Appointments• Scheduled Hours• Treatment Sessions• Treatment Fields• Treatment Fractions
1
1
Applied to both historic and future activities to show distribution pattern 2
2Trend analysis can be shown for an individual location or multiple locations
Healthcare Analytics: Asset Utilization

26
Location utilization by demographics. Demographic measures include:• Age• Gender• Race
1
1 2
Can change from machine to non-machines based on scheduled appointments
2Additional filters include:- Diagnosis Group- Technique
Healthcare Analytics: Asset Utilization

27
Next Steps

28
Next steps
• Read 2015 Gartner Critical Capabilities report– Gartner ranked the top 12 vendors from the 2015 BI Magic Quadrant– Birst ranked # 1 for Centralized BI and OEM/Embedded BI use cases– Visit info.birst.com/Gartner-Critical-Capabilities
• Join Birst on the Road– See Birst 5X in action– June 2-4 in various cities in the U.S.– More information at www.birst.com/events
• Contact Birst– 866-940-1496 / 415-766-4800– [email protected]

29
Thank you


