BIS Quarterly Review, March 2018 A1 Annexes BIS Statistics: Charts The statistics published by the BIS are a unique source of information about the structure of and activity in the global financial system. BIS statistics are presented in graphical form in this annex and in tabular form in the BIS Statistical Bulletin, which is published concurrently with the BIS Quarterly Review. For introductions to the BIS statistics and a glossary of terms used in this annex, see the BIS Statistical Bulletin. The data shown in the charts in this annex can be downloaded from the BIS Quarterly Review page on the BIS website (www.bis.org/publ/quarterly.htm). Data may have been revised or updated subsequent to the publication of this annex. For the latest data and to download additional data, see the statistics pages on the BIS website (www.bis.org/statistics/index.htm). A release calendar provides advance notice of publication dates (www.bis.org/statistics/relcal.htm). A Locational banking statistics A.1 Cross-border claims, by sector, currency and instrument ........................................ A4 A.2 Cross-border claims, by borrowing region..................................................................... A5 A.3 Cross-border claims, by borrowing country .................................................................. A6 A.4 Cross-border claims, by nationality of reporting bank and currency of denomination ............................................................................................................................. A7 A.5 Cross-border liabilities of reporting banks..................................................................... A8 B Consolidated banking statistics B.1 Consolidated claims of reporting banks on advanced economies....................... A9 B.2 Consolidated claims of reporting banks on emerging market economies ..... A10 C Debt securities statistics C.1 Global debt securities markets .......................................................................................... A11 C.2 Total debt securities, by sector of issuer ....................................................................... A11 C.3 Net issuance of international debt securities .............................................................. A12 C.4 International debt securities issued by financial and non-financial corporations..............................................................................................................................A12 D Derivatives statistics D.1 Exchange-traded derivatives ..............................................................................................A13
Transcript
BIS Quarterly Review, March 2018 A1
Annexes
BIS Statistics: Charts
The statistics published by the BIS are a unique source of information about the structure of and activity in the global financial system. BIS statistics are presented in graphical form in this annex and in tabular form in the BIS Statistical Bulletin, which is published concurrently with the BIS Quarterly Review. For introductions to the BIS statistics and a glossary of terms used in this annex, see the BIS Statistical Bulletin.
The data shown in the charts in this annex can be downloaded from the BIS Quarterly Review page on the BIS website (www.bis.org/publ/quarterly.htm). Data may have been revised or updated subsequent to the publication of this annex. For the latest data and to download additional data, see the statistics pages on the BIS website (www.bis.org/statistics/index.htm). A release calendar provides advance notice of publication dates (www.bis.org/statistics/relcal.htm).
A Locational banking statistics
A.1 Cross-border claims, by sector, currency and instrument ........................................ A4
A.2 Cross-border claims, by borrowing region ..................................................................... A5
A.3 Cross-border claims, by borrowing country .................................................................. A6
A.4 Cross-border claims, by nationality of reporting bank and currency of denomination ............................................................................................................................. A7
A.5 Cross-border liabilities of reporting banks ..................................................................... A8
B Consolidated banking statistics
B.1 Consolidated claims of reporting banks on advanced economies ....................... A9
B.2 Consolidated claims of reporting banks on emerging market economies ..... A10
C Debt securities statistics
C.1 Global debt securities markets .......................................................................................... A11
C.2 Total debt securities, by sector of issuer ....................................................................... A11
C.3 Net issuance of international debt securities .............................................................. A12
C.4 International debt securities issued by financial and non-financial corporations .............................................................................................................................. A12
D.8 Concentration in global OTC derivatives markets ..................................................... A17
E Global liquidity indicators
E.1 Growth of international bank credit ................................................................................ A18
E.2 Global bank credit to the private non-financial sector, by residence of borrower .................................................................................................................................... A19
E.3 Global credit to the non-financial sector, by currency ............................................ A20
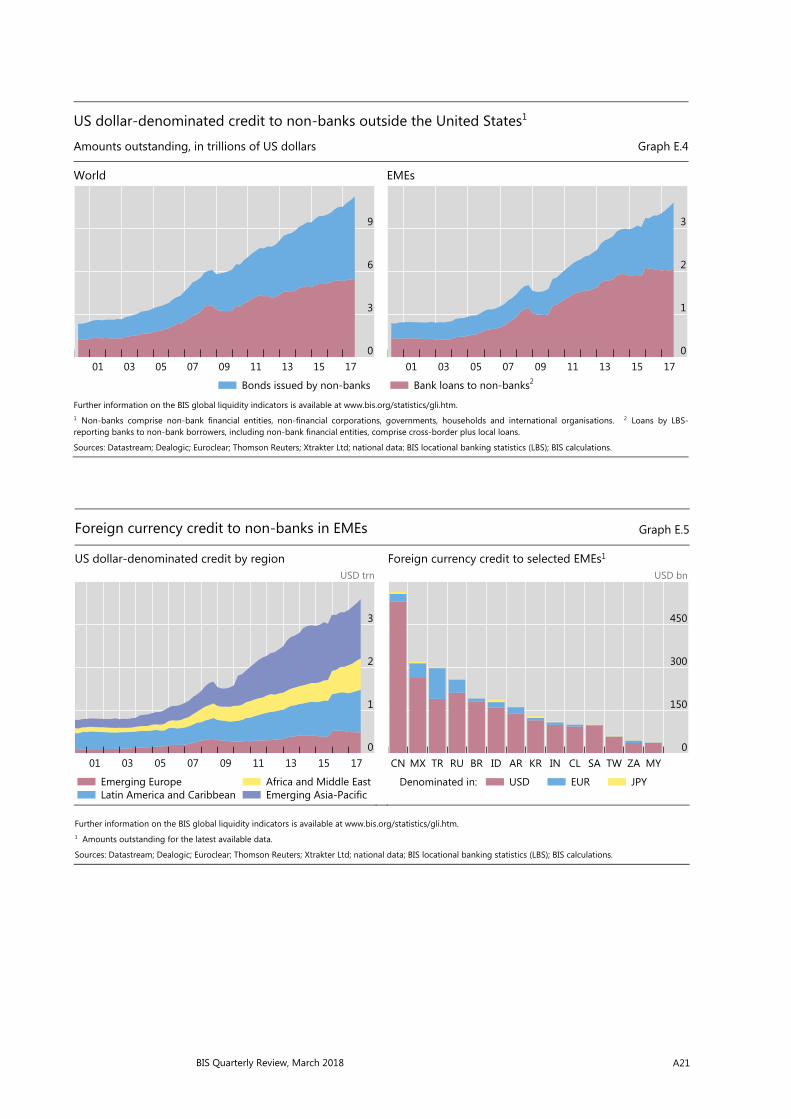
E.4 US dollar-denominated credit to non-banks outside the United States ......... A21
E.5 Foreign currency credit to non-banks in EMEs ......................................................... A21
F Statistics on total credit to the non-financial sector
F.1 Total credit to the non-financial sector (core debt) ................................................. A22
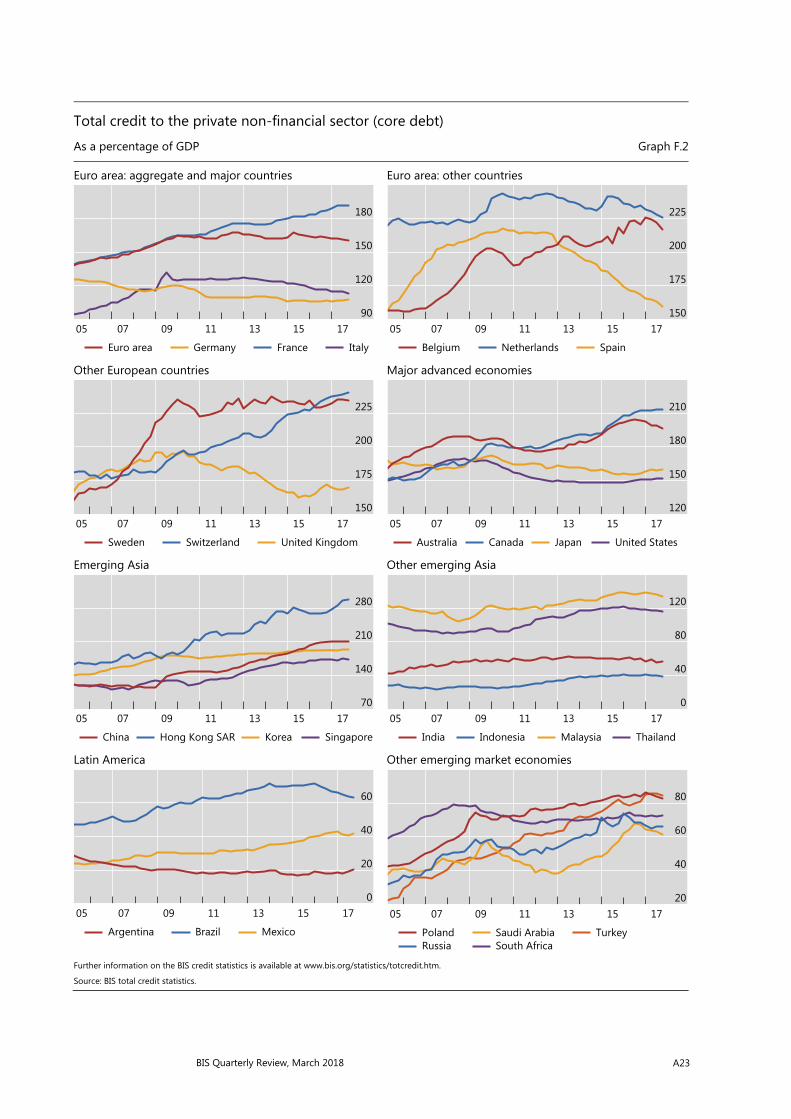
F.2 Total credit to the private non-financial sector (core debt) ................................. A23
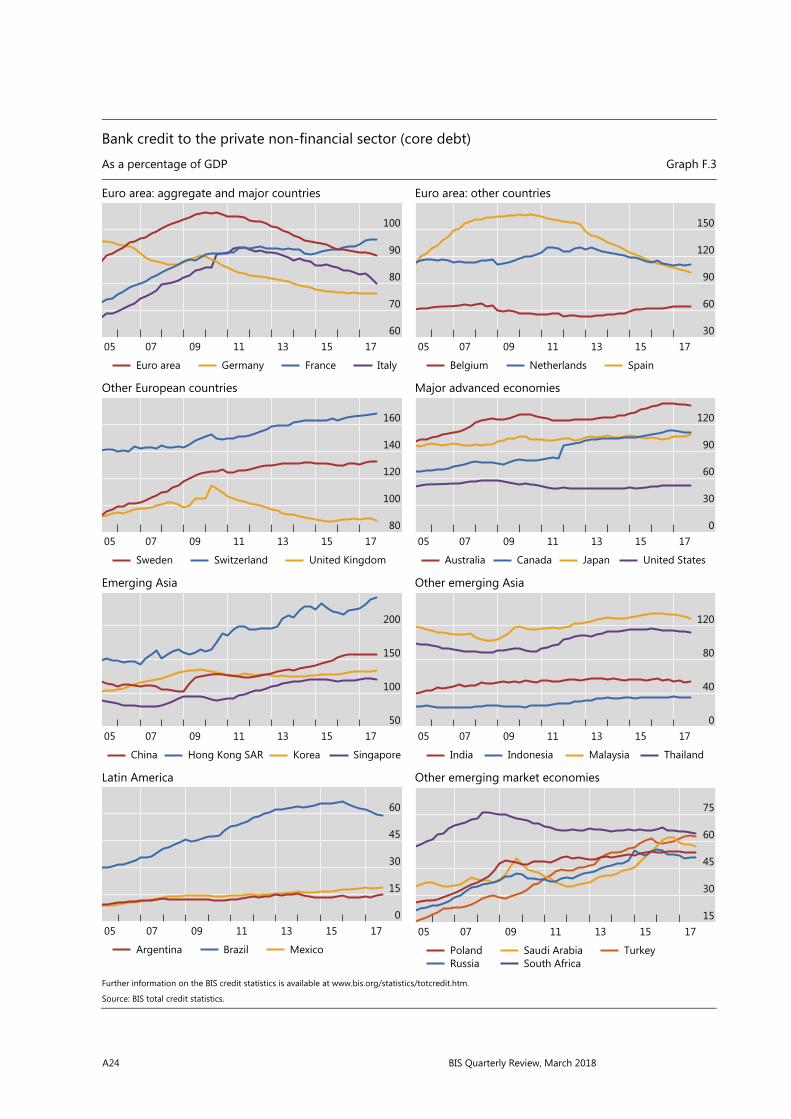
F.3 Bank credit to the private non-financial sector (core debt) .................................. A24
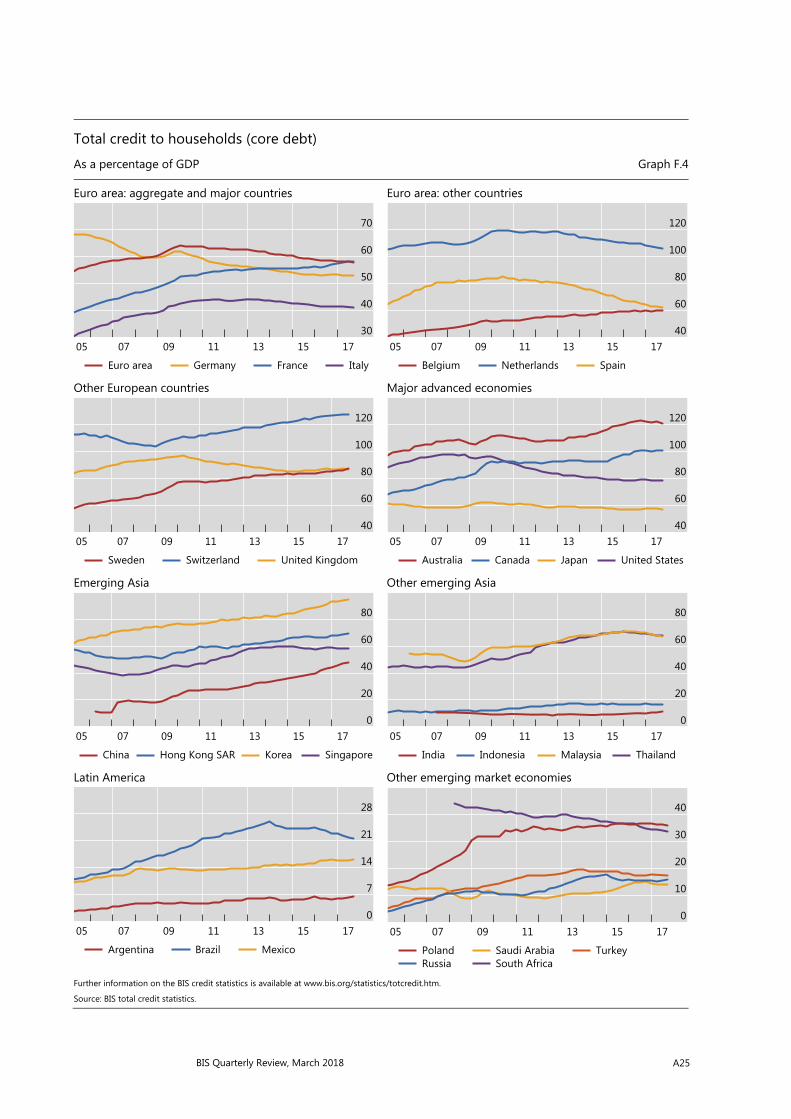
F.4 Total credit to households (core debt) .......................................................................... A25
F.5 Total credit to non-financial corporations (core debt) ............................................ A26
F.6 Total credit to the government sector at market value (core debt)................... A27
F.7 Total credit to the government sector at nominal value (core debt) ................ A28
G Debt service ratios for the private non-financial sector
G.1 Debt service ratios of the private non-financial sector ........................................... A29
G.2 Debt service ratios of households ................................................................................... A30
G.3 Debt service ratios of non-financial corporations ..................................................... A31
H Property price statistics
H.1 Real residential property prices ........................................................................................ A32
BIS Quarterly Review, March 2018 A3
I Effective and US dollar exchange rate statistics
I.1 Real effective exchange rates ............................................................................................ A33
I.2 US dollar exchange rates ..................................................................................................... A34
L.1 Central bank policy or representative rates ................................................................. A37
A4 BIS Quarterly Review, March 2018
A Locational banking statistics
Cross-border claims, by sector, currency and instrument Graph A.1
Amounts outstanding, in USD trn1 Adjusted changes, in USD bn2 Annual change, in per cent3
By sector of counterparty
By currency
By instrument
Further information on the BIS locational banking statistics is available at www.bis.org/statistics/bankstats.htm. 1 At quarter-end. Amounts denominated in currencies other than the US dollar are converted to US dollars at the exchange rate prevailing on the reference date. 2 Quarterly changes in amounts outstanding, adjusted for the impact of exchange rate movements between quarter-ends and methodological breaks in the data. 3 Geometric mean of quarterly percentage adjusted changes. 4 Includes central banks and banks unallocated by subsector between intragroup and unrelated banks. 5 Other reported currencies, calculated as all currencies minus US dollar, euro, yen and unallocated currencies. The currency is known but reporting is incomplete.
Source: BIS locational banking statistics.
30
20
10
01716151413
Non-bank Related offices
500
0
–500
–1,000171615141312
Unrelated banks4 Unallocated
10
0
–10
–201716151413
30
20
10
01716151413
US dollar Euro Yen
500
0
–500
–1,000171615141312
Other currencies5 Unallocated
10
0
–10
–201716151413
30
20
10
01716151413
Loans and deposits Debt securities
500
0
–500
–1,000171615141312
Other instruments Unallocated
15
0
–15
–301716151413
BIS Quarterly Review, March 2018 A5
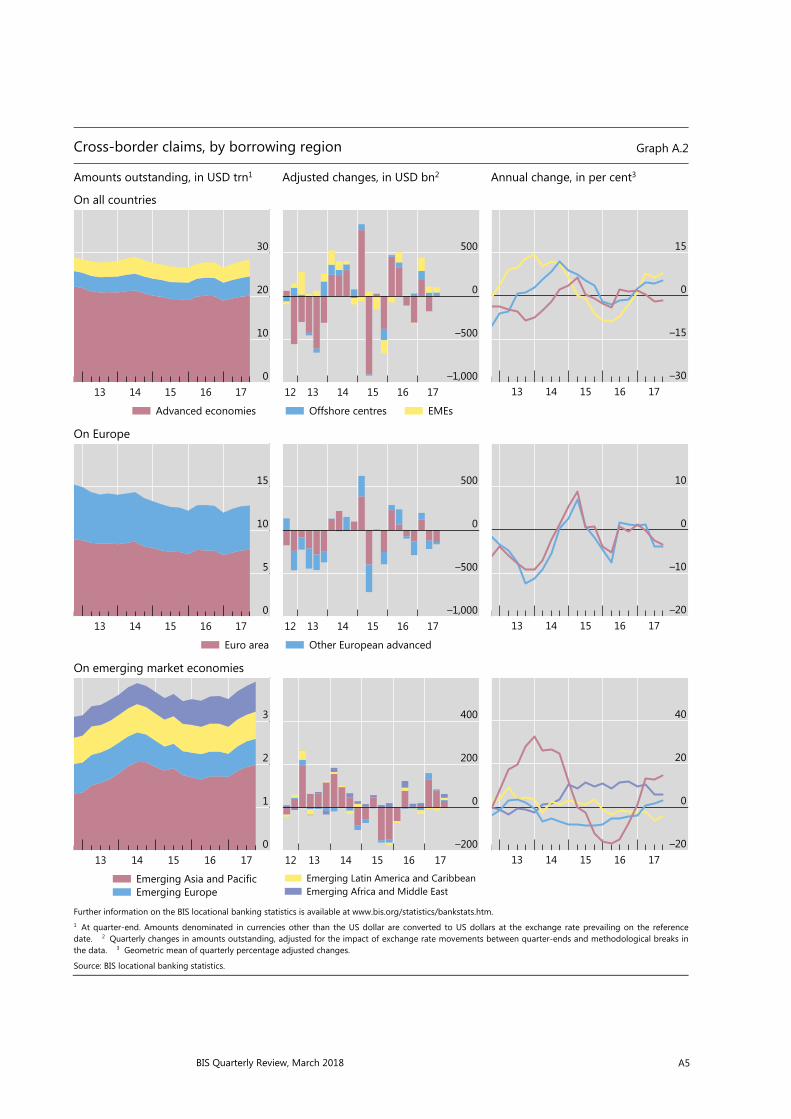
Cross-border claims, by borrowing region Graph A.2
Amounts outstanding, in USD trn1 Adjusted changes, in USD bn2 Annual change, in per cent3
On all countries
On Europe
On emerging market economies
Further information on the BIS locational banking statistics is available at www.bis.org/statistics/bankstats.htm. 1 At quarter-end. Amounts denominated in currencies other than the US dollar are converted to US dollars at the exchange rate prevailing on the reference date. 2 Quarterly changes in amounts outstanding, adjusted for the impact of exchange rate movements between quarter-ends and methodological breaks in the data. 3 Geometric mean of quarterly percentage adjusted changes.
Source: BIS locational banking statistics.
30
20
10
01716151413
Advanced economies
500
0
–500
–1,000171615141312
Offshore centres EMEs
15
0
–15
–301716151413
15
10
5
01716151413
Euro area
500
0
–500
–1,000171615141312
Other European advanced
10
0
–10
–201716151413
3
2
1
01716151413
Emerging Asia and PacificEmerging Europe
400
200
0
–200171615141312
Emerging Latin America and CaribbeanEmerging Africa and Middle East
40
20
0
–201716151413
A6 BIS Quarterly Review, March 2018
Cross-border claims, by borrowing country Graph A.3
Amounts outstanding, in USD trn1 Adjusted changes, in USD bn2 Annual change, in per cent3
On selected advanced economies
On selected offshore centres
On selected emerging market economies
Further information on the BIS locational banking statistics is available at www.bis.org/statistics/bankstats.htm. 1 At quarter-end. Amounts denominated in currencies other than the US dollar are converted to US dollars at the exchange rate prevailing on the reference date. 2 Quarterly changes in amounts outstanding, adjusted for the impact of exchange rate movements between quarter-ends and methodological breaks in the data. 3 Geometric mean of quarterly percentage adjusted changes.
Source: BIS locational banking statistics.
15
10
5
01716151413
United States United Kingdom
450
0
–450
–900171615141312
France Germany Japan
15
0
–15
–301716151413
3
2
1
01716151413
Cayman Islands Hong Kong SAR
200
0
–200
–400171615141312
Singapore Jersey Bahamas
30
0
–30
–601716151413
1.5
1.0
0.5
0.01716151413
China Brazil India
300
150
0
–150171615141312
Russia South Africa
100
50
0
–501716151413
BIS Quarterly Review, March 2018 A7
Cross-border claims, by nationality of reporting bank and currency of denomination Graph A.4
Amounts outstanding, in USD trn1 Adjusted changes, in USD bn2 Annual change, in per cent3
All currencies
US dollar
Euro
Further information on the BIS locational banking statistics is available at www.bis.org/statistics/bankstats.htm. 1 At quarter-end. Amounts denominated in currencies other than the US dollar are converted to US dollars at the exchange rate prevailing on the referencedate. 2 Quarterly changes in amounts outstanding, adjusted for the impact of exchange rate movements between quarter-ends and methodological breaks in the data. 3 Geometric mean of quarterly percentage adjusted changes.
Source: BIS locational banking statistics.
30
20
10
01716151413
JapanUnited States
500
0
–500
–1,000171615141312
FranceGermany
Other
10
0
–10
–201716151413
15
10
5
01716151413
JapanUnited States
500
0
–500
–1,000171615141312
United KingdomSwitzerland
Other
15
0
–15
–301716151413
12
8
4
01716151413
GermanyFrance
300
0
–300
–600171615141312
NetherlandsUnited Kingdom
Other
20
0
–20
–401716151413
A8 BIS Quarterly Review, March 2018
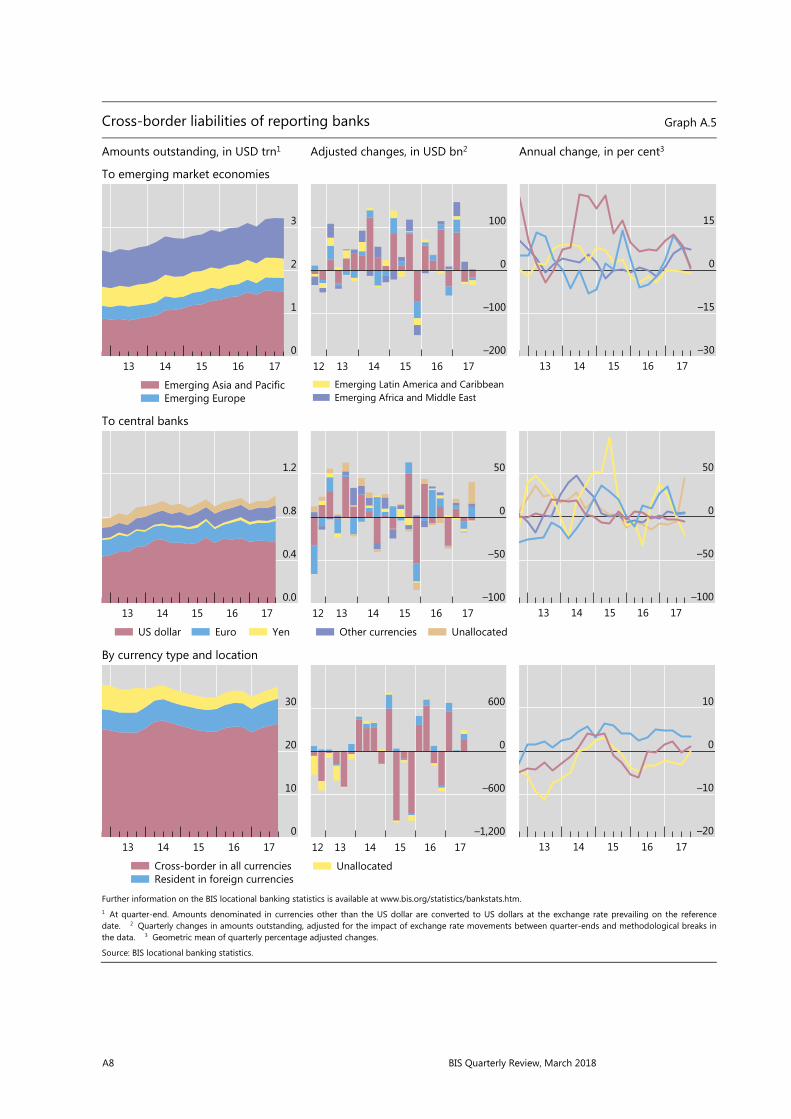
Cross-border liabilities of reporting banks Graph A.5
Amounts outstanding, in USD trn1 Adjusted changes, in USD bn2 Annual change, in per cent3
To emerging market economies
To central banks
By currency type and location
Further information on the BIS locational banking statistics is available at www.bis.org/statistics/bankstats.htm. 1 At quarter-end. Amounts denominated in currencies other than the US dollar are converted to US dollars at the exchange rate prevailing on the reference date. 2 Quarterly changes in amounts outstanding, adjusted for the impact of exchange rate movements between quarter-ends and methodological breaks in the data. 3 Geometric mean of quarterly percentage adjusted changes.
Source: BIS locational banking statistics.
3
2
1
01716151413
Emerging Asia and PacificEmerging Europe
100
0
–100
–200171615141312
Emerging Latin America and CaribbeanEmerging Africa and Middle East
15
0
–15
–301716151413
1.2
0.8
0.4
0.01716151413
US dollar Euro Yen
50
0
–50
–100171615141312
Other currencies Unallocated
50
0
–50
–1001716151413
30
20
10
01716151413
Cross-border in all currenciesResident in foreign currencies
600
0
–600
–1,200171615141312
Unallocated
10
0
–10
–201716151413
BIS Quarterly Review, March 2018 A9
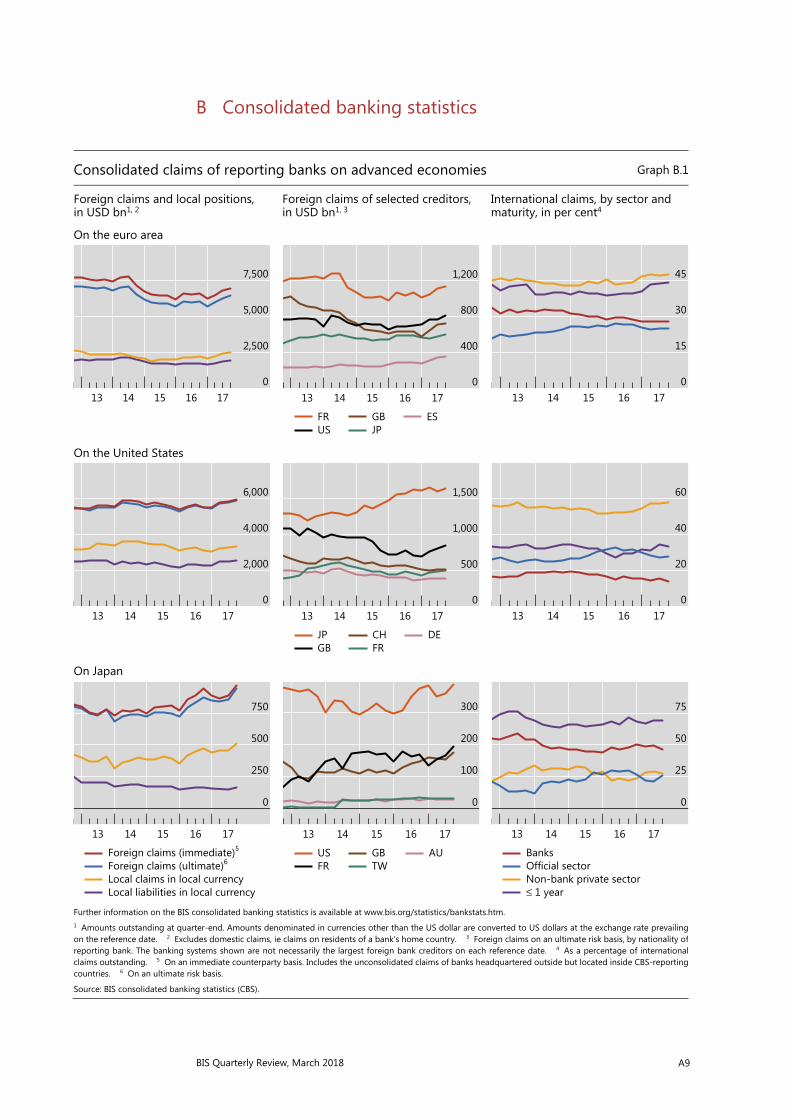
B Consolidated banking statistics
Consolidated claims of reporting banks on advanced economies Graph B.1
Foreign claims and local positions, in USD bn1, 2
Foreign claims of selected creditors,in USD bn1, 3
International claims, by sector and maturity, in per cent4
On the euro area
On the United States
On Japan
Further information on the BIS consolidated banking statistics is available at www.bis.org/statistics/bankstats.htm. 1 Amounts outstanding at quarter-end. Amounts denominated in currencies other than the US dollar are converted to US dollars at the exchange rate prevailingon the reference date. 2 Excludes domestic claims, ie claims on residents of a bank’s home country. 3 Foreign claims on an ultimate risk basis, by nationality of reporting bank. The banking systems shown are not necessarily the largest foreign bank creditors on each reference date. 4 As a percentage of international claims outstanding. 5 On an immediate counterparty basis. Includes the unconsolidated claims of banks headquartered outside but located inside CBS-reporting countries. 6 On an ultimate risk basis.
Source: BIS consolidated banking statistics (CBS).
7,500
5,000
2,500
01716151413
1,200
800
400
01716151413
FRUS
GBJP
ES
45
30
15
01716151413
6,000
4,000
2,000
01716151413
1,500
1,000
500
01716151413
JPGB
CHFR
DE
60
40
20
01716151413
750
500
250
0
1716151413
Foreign claims (immediate)5
Foreign claims (ultimate)6
Local claims in local currencyLocal liabilities in local currency
300
200
100
0
1716151413
USFR
GBTW
AU
75
50
25
0
1716151413
BanksOfficial sectorNon-bank private sector≤ 1 year
A10 BIS Quarterly Review, March 2018
Consolidated claims of reporting banks on emerging market economies Graph B.2
Foreign claims and local positions, in USD bn1, 2
Foreign claims of selected creditors,in USD bn1, 3
International claims, by sector and maturity, in per cent4
On China
On Turkey
On Brazil
Further information on the BIS consolidated banking statistics is available at www.bis.org/statistics/bankstats.htm. 1 Amounts outstanding at quarter-end. Amounts denominated in currencies other than the US dollar are converted to US dollars at the exchange rate prevailingon the reference date. 2 Excludes domestic claims, ie claims on residents of a bank’s home country. 3 Foreign claims on an ultimate risk basis, by nationality of reporting bank. The banking systems shown are not necessarily the largest foreign bank creditors on each reference date. 4 As a percentage of international claims. 5 On an immediate counterparty basis. Includes the unconsolidated claims of banks headquartered outside but located inside CBS-reporting countries. 6 On an ultimate risk basis.
Source: BIS consolidated banking statistics (CBS).
1,200
800
400
01716151413
180
120
60
01716151413
GBUS
JPTW
FR
75
50
25
01716151413
300
200
100
01716151413
75
50
25
01716151413
ESFR
GBUS
DE
60
40
20
01716151413
450
300
150
01716151413
Foreign claims (immediate)5
Foreign claims (ultimate)6
Local claims in local currencyLocal liabilities in local currency
180
120
60
01716151413
ESUS
GBJP
FR
60
40
20
0
1716151413
BanksOfficial sectorNon-bank private sector≤ 1 year
BIS Quarterly Review, March 2018 A11
C Debt securities statistics
Global debt securities markets1
Amounts outstanding, in trillions of US dollars2 Graph C.1
By market of issue By sector of issuer By currency of denomination3
DDS = domestic debt securities; IDS = international debt securities; TDS = total debt securities.
FC = financial corporations; GG = general government; HH = households and non-profit institutions serving households; IO = international organisations; NFC = non-financial corporations.
Further information on the BIS debt securities statistics is available at www.bis.org/statistics/secstats.htm. 1 Sample of countries varies across breakdowns shown. For countries that do not report TDS, data are estimated by the BIS as DDS plus IDS. For countries that do not report either TDS or DDS, data are estimated by the BIS as IDS. 2 At quarter-end. Amounts denominated in currencies other than the US dollar are converted to US dollars at the exchange rate prevailing on the reference date. 3 Where a currency breakdown is not available, DDS are assumed to be denominated in thelocal currency.
Sources: Dealogic; Euroclear; Thomson Reuters; Xtrakter Ltd; national data; BIS debt securities statistics; BIS calculations.
Total debt securities, by residence and sector of issuer1
Amounts outstanding at end-June 2017, in trillions of US dollars2 Graph C.2
Further information on the BIS debt securities statistics is available at www.bis.org/statistics/secstats.htm. 1 For countries that do not report TDS, data are estimated by the BIS as DDS plus IDS. 2 Amounts denominated in currencies other than the US dollar are converted to US dollars at the exchange rate prevailing on the reference date.
Sources: National data; BIS debt securities statistics.
90
60
30
0
171615141312
TDS DDS IDS
45
30
15
0
171615141312
GGFC
NFCHH
IO
45
30
15
0
1716151413
USD EUR JPY OTH
40
30
20
10
0
4
3
2
1
0IEKYKRESAUNLCAITDEFRGBCNJPUS
Lhs Rhs
General governmentFinancial corporations
Non-financial corporationsHouseholds and non-profit institutions serving households
A12 BIS Quarterly Review, March 2018
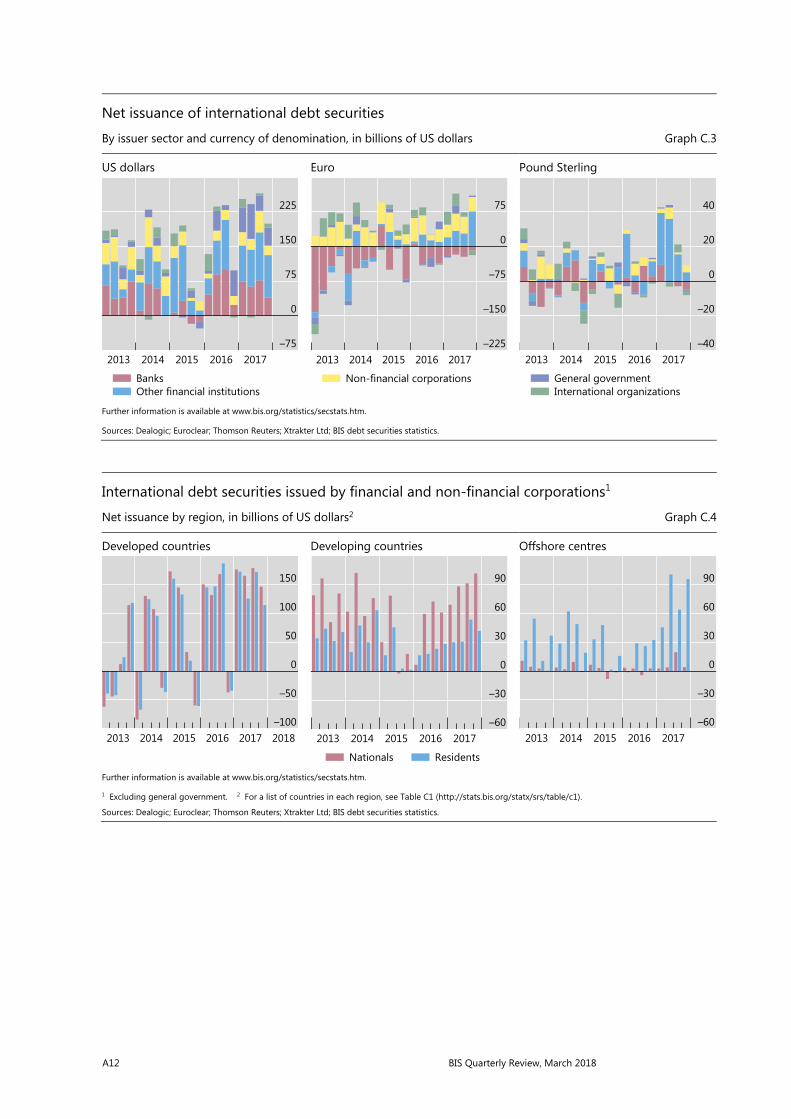
Net issuance of international debt securities
By issuer sector and currency of denomination, in billions of US dollars Graph C.3
US dollars Euro Pound Sterling
Further information is available at www.bis.org/statistics/secstats.htm.
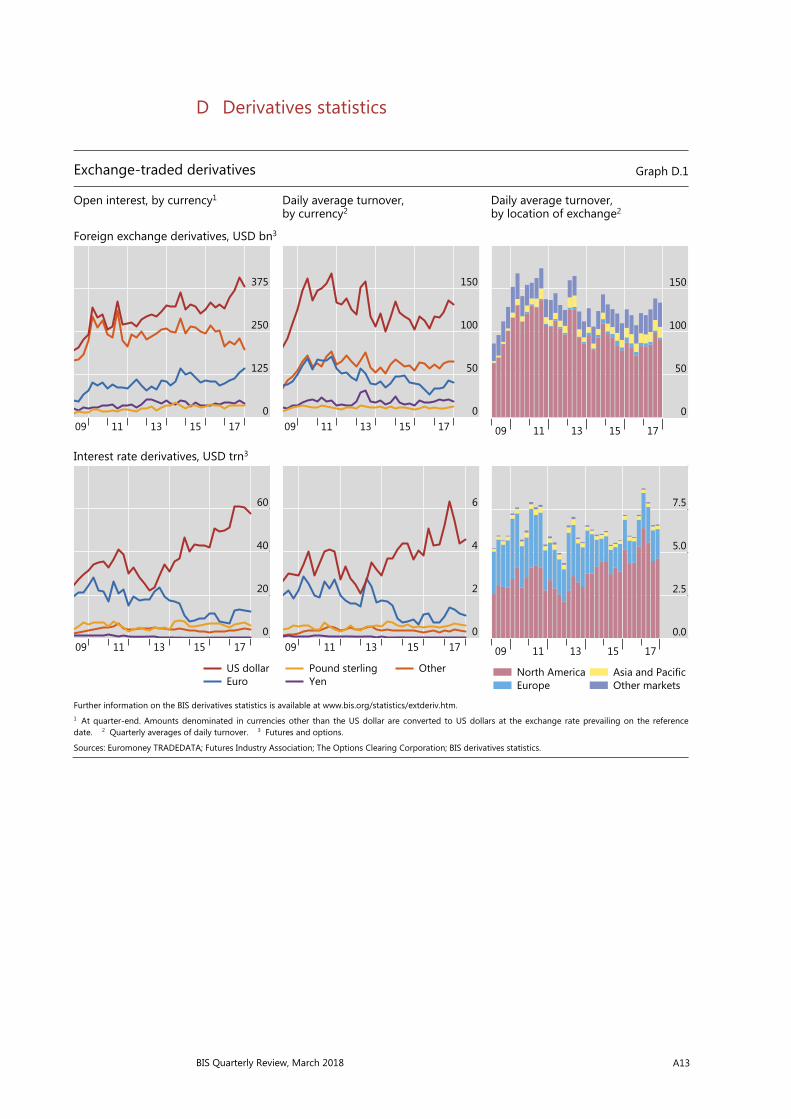
Open interest, by currency1 Daily average turnover, by currency2
Daily average turnover, by location of exchange2
Foreign exchange derivatives, USD bn3
Interest rate derivatives, USD trn3
Further information on the BIS derivatives statistics is available at www.bis.org/statistics/extderiv.htm. 1 At quarter-end. Amounts denominated in currencies other than the US dollar are converted to US dollars at the exchange rate prevailing on the referencedate. 2 Quarterly averages of daily turnover. 3 Futures and options.
Sources: Euromoney TRADEDATA; Futures Industry Association; The Options Clearing Corporation; BIS derivatives statistics.
375
250
125
01715131109
150
100
50
01715131109
150
100
50
0
1715131109
60
40
20
01715131109
US dollarEuro
6
4
2
01715131109
Pound sterlingYen
Other
7.5
5.0
2.5
0.0
1715131109
North AmericaEurope
Asia and PacificOther markets
A14 BIS Quarterly Review, March 2018
Global OTC derivatives markets1 Graph D.2
Notional principal Gross market value Gross credit exposure USD trn USD trn Per cent USD trn
Further information on the BIS derivatives statistics is available at www.bis.org/statistics/derstats.htm. 1 At half-year end (end-June and end-December). Amounts denominated in currencies other than the US dollar are converted to US dollars at the exchange rateprevailing on the reference date.
Source: BIS derivatives statistics.
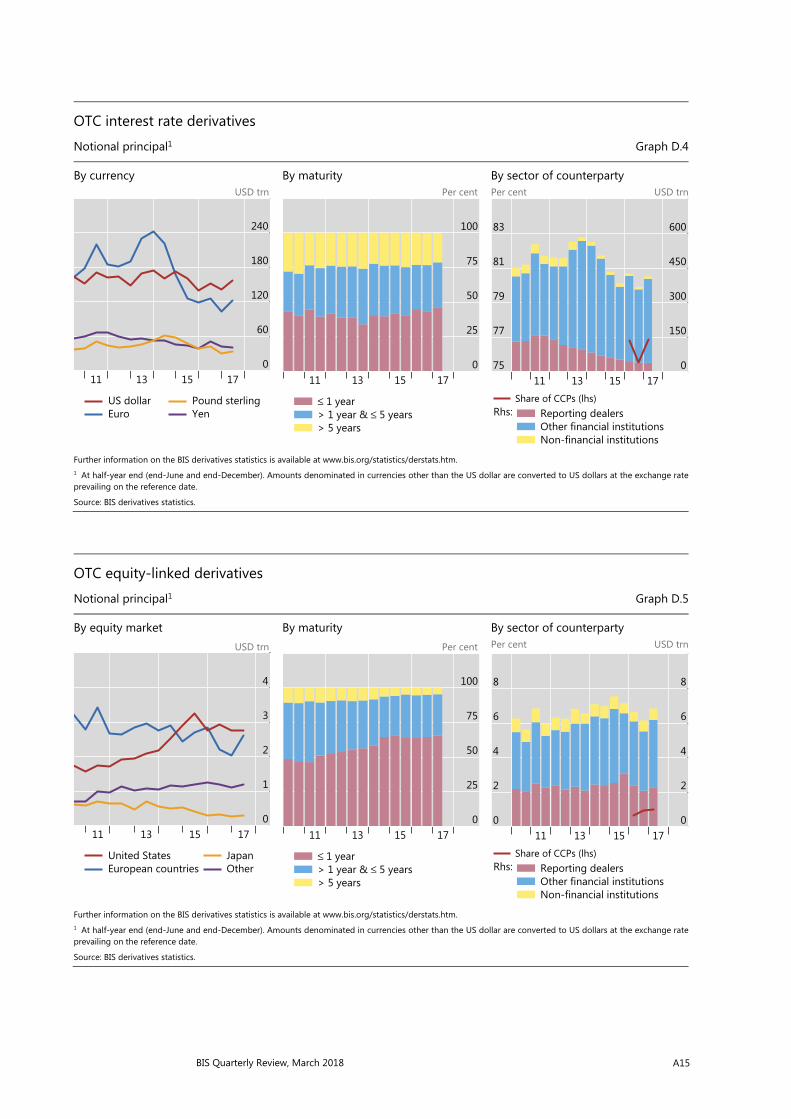
OTC foreign exchange derivatives
Notional principal1 Graph D.3
By currency By maturity By sector of counterparty USD trn Per cent Per cent USD trn
Further information on the BIS derivatives statistics is available at www.bis.org/statistics/derstats.htm. 1 At half-year end (end-June and end-December). Amounts denominated in currencies other than the US dollar are converted to US dollars at the exchange rate prevailing on the reference date.
By currency By maturity By sector of counterparty USD trn Per cent Per cent USD trn
Further information on the BIS derivatives statistics is available at www.bis.org/statistics/derstats.htm. 1 At half-year end (end-June and end-December). Amounts denominated in currencies other than the US dollar are converted to US dollars at the exchange rateprevailing on the reference date.
Source: BIS derivatives statistics.
OTC equity-linked derivatives
Notional principal1 Graph D.5
By equity market By maturity By sector of counterparty USD trn Per cent Per cent USD trn
Further information on the BIS derivatives statistics is available at www.bis.org/statistics/derstats.htm. 1 At half-year end (end-June and end-December). Amounts denominated in currencies other than the US dollar are converted to US dollars at the exchange rate prevailing on the reference date.
Notional principal, by instrument Notional principal, by commodity Gross market value, by commodity Per cent USD trn USD trn
Further information on the BIS derivatives statistics is available at www.bis.org/statistics/derstats.htm. 1 At half-year end (end-June and end-December). Amounts denominated in currencies other than the US dollar are converted to US dollars at the exchange rate prevailing on the reference date.
Source: BIS derivatives statistics.
Credit default swaps1 Graph D.7
Notional principal Notional principal with central counterparties (CCPs)
Impact of netting
Per cent USD trn Per cent USD trn Per cent USD trn
Further information on the BIS derivatives statistics is available at www.bis.org/statistics/derstats.htm. 1 At half-year end (end-June and end-December). Amounts denominated in currencies other than the US dollar are converted to US dollars at the exchange rateprevailing on the reference date.
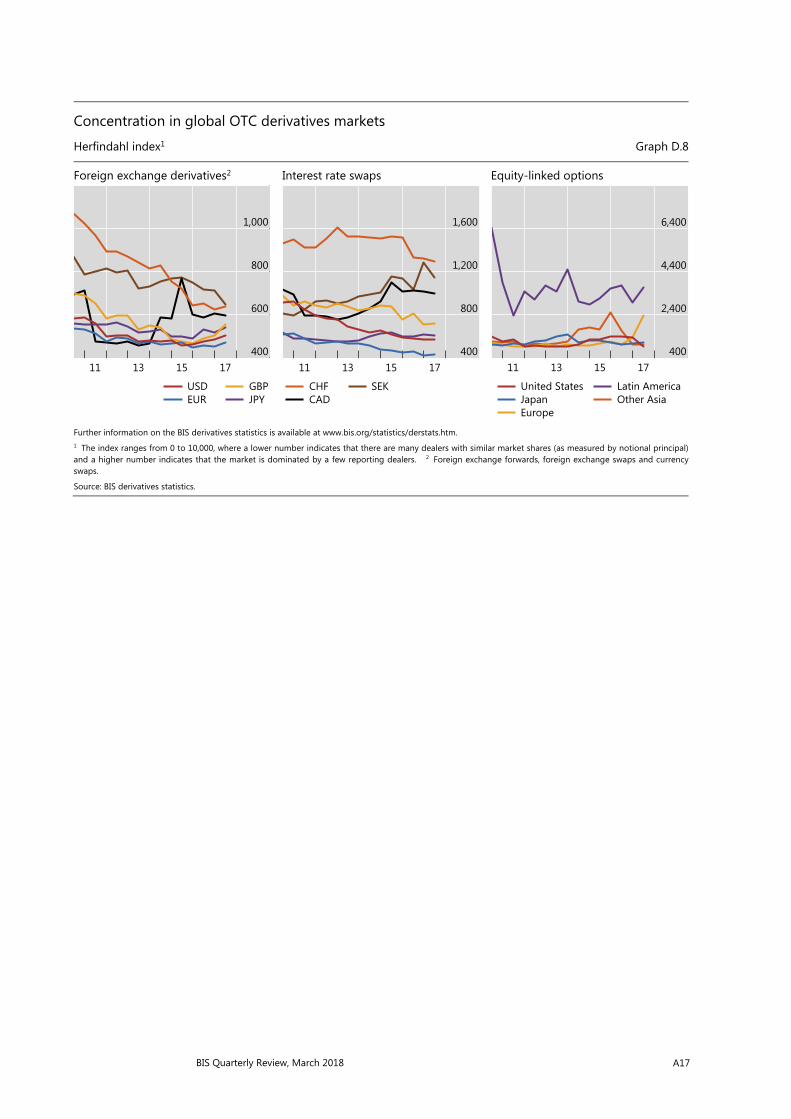
Further information on the BIS derivatives statistics is available at www.bis.org/statistics/derstats.htm. 1 The index ranges from 0 to 10,000, where a lower number indicates that there are many dealers with similar market shares (as measured by notional principal)and a higher number indicates that the market is dominated by a few reporting dealers. 2 Foreign exchange forwards, foreign exchange swaps and currency swaps.
Source: BIS derivatives statistics.
1,000
800
600
40017151311
USDEUR
GBPJPY
1,600
1,200
800
40017151311
CHFCAD
SEK
6,400
4,400
2,400
40017151311
United StatesJapanEurope
Latin AmericaOther Asia
A18 BIS Quarterly Review, March 2018
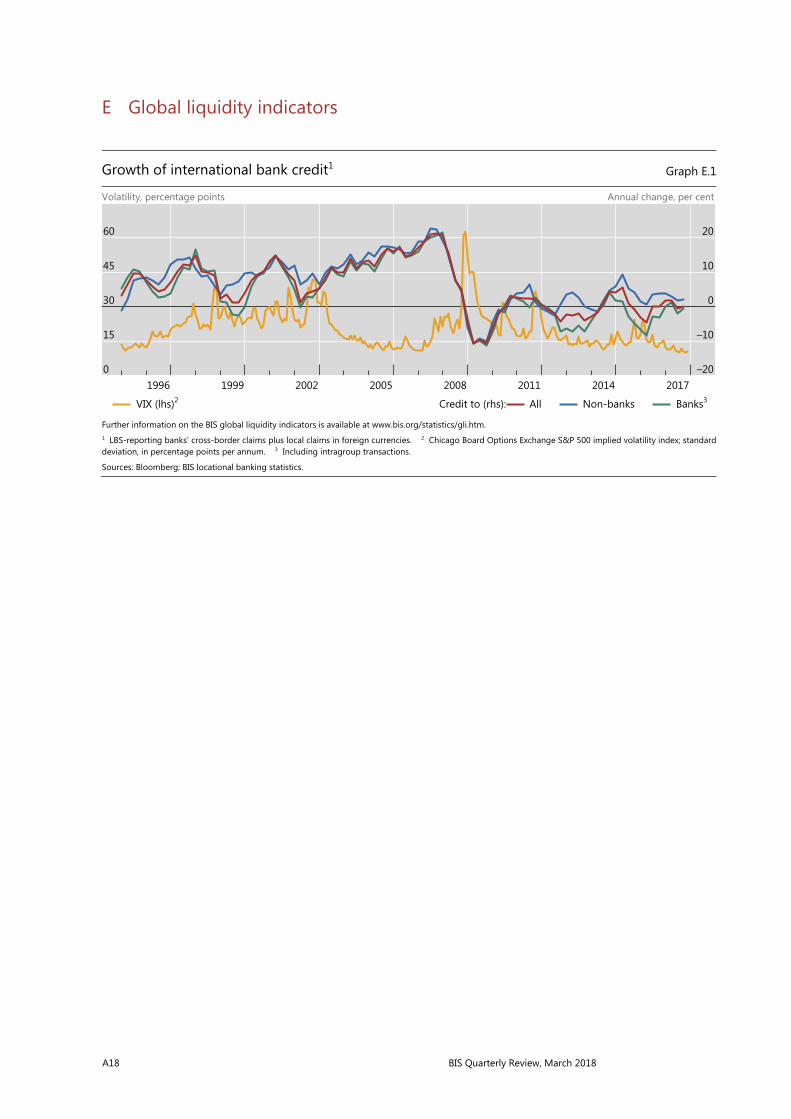
E Global liquidity indicators
Growth of international bank credit1 Graph E.1
Volatility, percentage points Annual change, per cent
Further information on the BIS global liquidity indicators is available at www.bis.org/statistics/gli.htm. 1 LBS-reporting banks’ cross-border claims plus local claims in foreign currencies. 2 Chicago Board Options Exchange S&P 500 implied volatility index; standard deviation, in percentage points per annum. 3 Including intragroup transactions.
Sources: Bloomberg; BIS locational banking statistics.
60
45
30
15
0
20
10
0
–10
–2020172014201120082005200219991996
VIX (lhs)2 AllCredit to (rhs): Non-banks Banks3
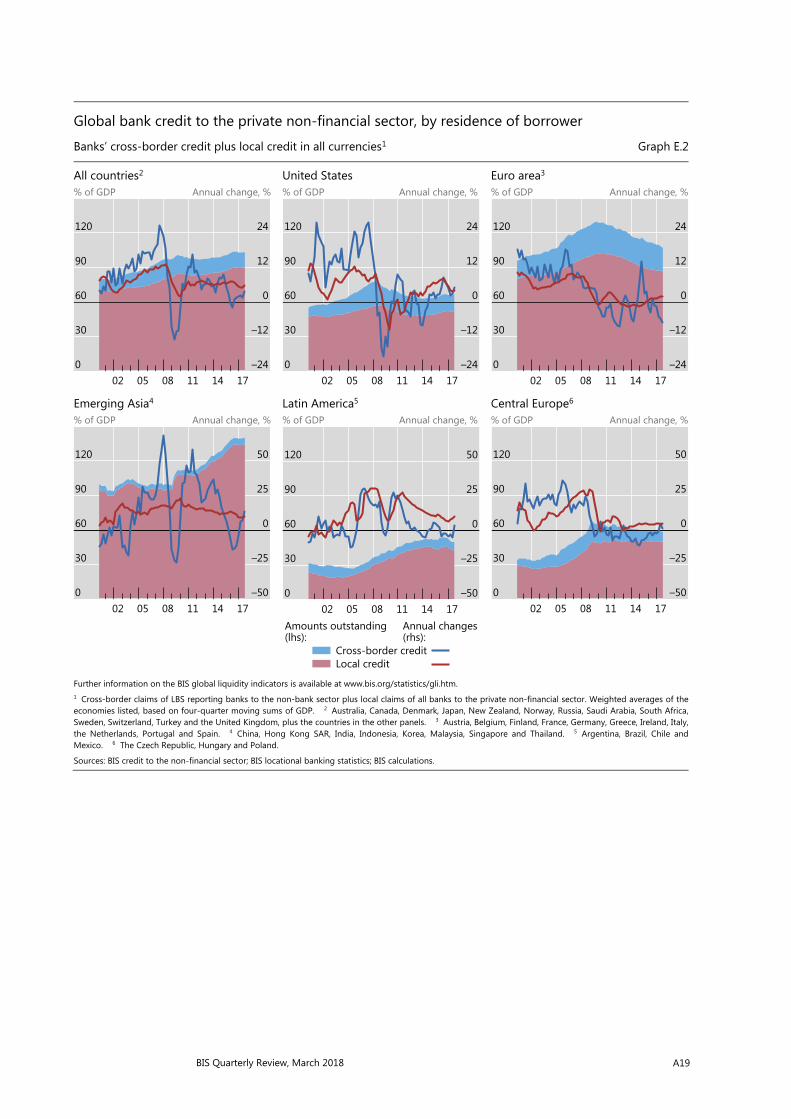
BIS Quarterly Review, March 2018 A19
Global bank credit to the private non-financial sector, by residence of borrower
Banks’ cross-border credit plus local credit in all currencies1 Graph E.2
All countries2 United States Euro area3
% of GDP Annual change, % % of GDP Annual change, % % of GDP Annual change, %
Emerging Asia4 Latin America5 Central Europe6
% of GDP Annual change, % % of GDP Annual change, % % of GDP Annual change, %
Further information on the BIS global liquidity indicators is available at www.bis.org/statistics/gli.htm. 1 Cross-border claims of LBS reporting banks to the non-bank sector plus local claims of all banks to the private non-financial sector. Weighted averages of the economies listed, based on four-quarter moving sums of GDP. 2 Australia, Canada, Denmark, Japan, New Zealand, Norway, Russia, Saudi Arabia, South Africa,Sweden, Switzerland, Turkey and the United Kingdom, plus the countries in the other panels. 3 Austria, Belgium, Finland, France, Germany, Greece, Ireland, Italy, the Netherlands, Portugal and Spain. 4 China, Hong Kong SAR, India, Indonesia, Korea, Malaysia, Singapore and Thailand. 5 Argentina, Brazil, Chile and Mexico. 6 The Czech Republic, Hungary and Poland.
Sources: BIS credit to the non-financial sector; BIS locational banking statistics; BIS calculations.
120
90
60
30
0
24
12
0
–12
–24171411080502
120
90
60
30
0
24
12
0
–12
–24171411080502
120
90
60
30
0
24
12
0
–12
–24171411080502
120
90
60
30
0
50
25
0
–25
–50171411080502
120
90
60
30
0
50
25
0
–25
–50171411080502
(rhs):Annual changes
(lhs):Amounts outstanding
Cross-border creditLocal credit
120
90
60
30
0
50
25
0
–25
–50171411080502
A20 BIS Quarterly Review, March 2018
Global credit to the non-financial sector, by currency Graph E.3
Amounts outstanding, in trillions of currency units1 Annual change, in per cent2
Credit denominated in US dollars (USD)
Credit denominated in euros (EUR)
Credit denominated in yen (JPY)
Further information on the BIS global liquidity indicators is available at www.bis.org/statistics/gli.htm. 1 Amounts outstanding at quarter-end. 2 Based on quarterly break- and exchange rate-adjusted changes. 3 Credit to non-financial borrowers residing in the United States/euro area/Japan. National financial accounts are adjusted using BIS banking and securities statistics to exclude credit denominated in non-local currencies. 4 Excluding debt securities issued by special purpose vehicles and other financial entities controlled by non-financial parents. EUR-denominated debt securities exclude those issued by institutions of the European Union. 5 Loans by LBS-reporting banks to non-bank borrowers, including non-bank financial entities, comprise cross-border plus local loans.
Sources: Datastream; Dealogic; Euroclear; Thomson Reuters; Xtrakter Ltd; national data; BIS locational banking statistics (LBS); BIS calculations.
48
36
24
12
0171513110907050301
30
15
0
–15
–3013110907050301
30
15
0
–15
–301716
28
21
14
7
0171513110907050301
30
15
0
–15
–3013110907050301
30
15
0
–15
–301716
2,000
1,500
1,000
500
0171513110907050301
Of which:Credit to residents3
Debt securities4
Loans5
Credit to non-residents:
Credit to government
40
20
0
–20
–4013110907050301
Credit toresidents3 Debt securities4
Loans5
Credit to non-residents:
40
20
0
–20
–401716
BIS Quarterly Review, March 2018 A21
Foreign currency credit to non-banks in EMEs Graph E.5
US dollar-denominated credit by region Foreign currency credit to selected EMEs1
USD trn USD bn
3
2
1
0171513110907050301
Emerging EuropeLatin America and Caribbean
Africa and Middle EastEmerging Asia-Pacific
450
300
150
0MYZATWSACLINKRARIDBRRUTRMXCN
USDDenominated in: EUR JPY
US dollar-denominated credit to non-banks outside the United States1
Amounts outstanding, in trillions of US dollars Graph E.4
World EMEs
Further information on the BIS global liquidity indicators is available at www.bis.org/statistics/gli.htm. 1 Non-banks comprise non-bank financial entities, non-financial corporations, governments, households and international organisations. 2 Loans by LBS-reporting banks to non-bank borrowers, including non-bank financial entities, comprise cross-border plus local loans.
Sources: Datastream; Dealogic; Euroclear; Thomson Reuters; Xtrakter Ltd; national data; BIS locational banking statistics (LBS); BIS calculations.
Further information on the BIS global liquidity indicators is available at www.bis.org/statistics/gli.htm. 1 Amounts outstanding for the latest available data.
Sources: Datastream; Dealogic; Euroclear; Thomson Reuters; Xtrakter Ltd; national data; BIS locational banking statistics (LBS); BIS calculations.
9
6
3
0171513110907050301
Bonds issued by non-banks
3
2
1
0171513110907050301
Bank loans to non-banks2
A22 BIS Quarterly Review, March 2018
F Statistics on total credit to the non-financial sector
Total credit to the non-financial sector (core debt)
As a percentage of GDP Graph F.1
Euro area: aggregate and major countries Euro area: other countries
Other European countries Major advanced economies
Emerging Asia Other emerging Asia
Latin America Other emerging market economies
Further information on the BIS credit statistics is available at www.bis.org/statistics/totcredit.htm.
Source: BIS total credit statistics.
280
240
200
16017151311090705
Euro area Germany France Italy
320
280
240
20017151311090705
Belgium Netherlands Spain
300
270
240
210
18017151311090705
Sweden Switzerland United Kingdom
360
300
240
180
12017151311090705
Australia Canada Japan United States
360
270
180
9017151311090705
China Hong Kong SAR Korea Singapore
160
120
80
4017151311090705
India Indonesia Malaysia Thailand
140
100
60
2017151311090705
Argentina Brazil Mexico
120
90
60
3017151311090705
PolandRussia
Saudi ArabiaSouth Africa
Turkey
BIS Quarterly Review, March 2018 A23
Total credit to the private non-financial sector (core debt)
As a percentage of GDP Graph F.2
Euro area: aggregate and major countries Euro area: other countries
Other European countries Major advanced economies
Emerging Asia Other emerging Asia
Latin America Other emerging market economies
Further information on the BIS credit statistics is available at www.bis.org/statistics/totcredit.htm.
Source: BIS total credit statistics.
180
150
120
9017151311090705
Euro area Germany France Italy
225
200
175
15017151311090705
Belgium Netherlands Spain
225
200
175
15017151311090705
Sweden Switzerland United Kingdom
210
180
150
12017151311090705
Australia Canada Japan United States
280
210
140
7017151311090705
China Hong Kong SAR Korea Singapore
120
80
40
017151311090705
India Indonesia Malaysia Thailand
60
40
20
017151311090705
Argentina Brazil Mexico
80
60
40
2017151311090705
PolandRussia
Saudi ArabiaSouth Africa
Turkey
A24 BIS Quarterly Review, March 2018
Bank credit to the private non-financial sector (core debt)
As a percentage of GDP Graph F.3
Euro area: aggregate and major countries Euro area: other countries
Other European countries Major advanced economies
Emerging Asia Other emerging Asia
Latin America Other emerging market economies
Further information on the BIS credit statistics is available at www.bis.org/statistics/totcredit.htm.
Source: BIS total credit statistics.
100
90
80
70
6017151311090705
Euro area Germany France Italy
150
120
90
60
3017151311090705
Belgium Netherlands Spain
160
140
120
100
8017151311090705
Sweden Switzerland United Kingdom
120
90
60
30
017151311090705
Australia Canada Japan United States
200
150
100
5017151311090705
China Hong Kong SAR Korea Singapore
120
80
40
017151311090705
India Indonesia Malaysia Thailand
60
45
30
15
017151311090705
Argentina Brazil Mexico
75
60
45
30
1517151311090705
PolandRussia
Saudi ArabiaSouth Africa
Turkey
BIS Quarterly Review, March 2018 A25
Total credit to households (core debt)
As a percentage of GDP Graph F.4
Euro area: aggregate and major countries Euro area: other countries
Other European countries Major advanced economies
Emerging Asia Other emerging Asia
Latin America Other emerging market economies
Further information on the BIS credit statistics is available at www.bis.org/statistics/totcredit.htm.
Source: BIS total credit statistics.
70
60
50
40
3017151311090705
Euro area Germany France Italy
120
100
80
60
4017151311090705
Belgium Netherlands Spain
120
100
80
60
4017151311090705
Sweden Switzerland United Kingdom
120
100
80
60
4017151311090705
Australia Canada Japan United States
80
60
40
20
017151311090705
China Hong Kong SAR Korea Singapore
80
60
40
20
017151311090705
India Indonesia Malaysia Thailand
28
21
14
7
017151311090705
Argentina Brazil Mexico
40
30
20
10
017151311090705
PolandRussia
Saudi ArabiaSouth Africa
Turkey
A26 BIS Quarterly Review, March 2018
Total credit to non-financial corporations (core debt)
As a percentage of GDP Graph F.5
Euro area: aggregate and major countries Euro area: other countries
Other European countries Major advanced economies
Emerging Asia Other emerging Asia
Latin America Other emerging market economies
Further information on the BIS credit statistics is available at www.bis.org/statistics/totcredit.htm.
Source: BIS total credit statistics.
120
100
80
60
4017151311090705
Euro area Germany France Italy
160
140
120
100
8017151311090705
Belgium Netherlands Spain
150
125
100
75
5017151311090705
Sweden Switzerland United Kingdom
120
105
90
75
6017151311090705
Australia Canada Japan United States
180
120
60
017151311090705
China Hong Kong SAR Korea Singapore
100
75
50
25
017151311090705
India Indonesia Malaysia Thailand
45
30
15
017151311090705
Argentina Brazil Mexico
60
45
30
1517151311090705
PolandRussia
Saudi ArabiaSouth Africa
Turkey
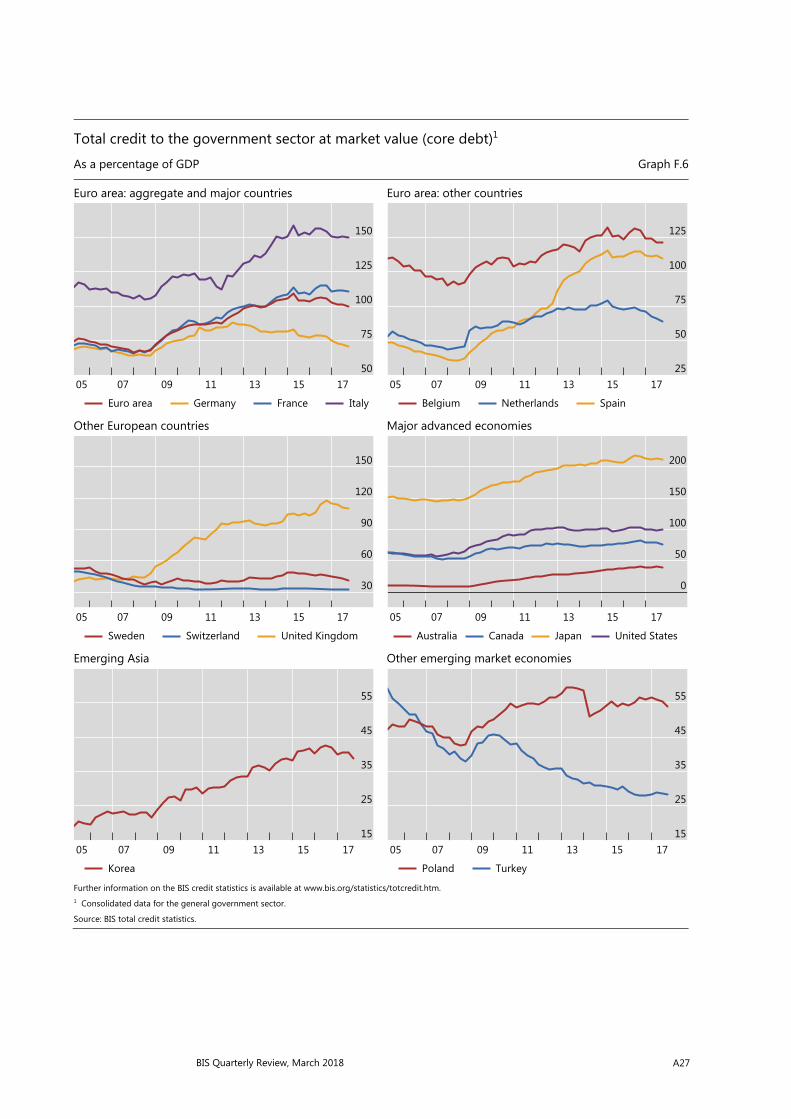
BIS Quarterly Review, March 2018 A27
Total credit to the government sector at market value (core debt)1
As a percentage of GDP Graph F.6
Euro area: aggregate and major countries Euro area: other countries
Other European countries Major advanced economies
Emerging Asia Other emerging market economies
Further information on the BIS credit statistics is available at www.bis.org/statistics/totcredit.htm. 1 Consolidated data for the general government sector.
Source: BIS total credit statistics.
150
125
100
75
5017151311090705
Euro area Germany France Italy
125
100
75
50
2517151311090705
Belgium Netherlands Spain
150
120
90
60
30
17151311090705
Sweden Switzerland United Kingdom
200
150
100
50
0
17151311090705
Australia Canada Japan United States
55
45
35
25
1517151311090705
Korea
55
45
35
25
1517151311090705
Poland Turkey
A28 BIS Quarterly Review, March 2018
Total credit to the government sector at nominal value (core debt)1
As a percentage of GDP Graph F.7
Euro area: aggregate and major countries Euro area: other countries
Other European countries Major advanced economies
Emerging Asia Other emerging Asia
Latin America Other emerging market economies
Further information on the BIS credit statistics is available at www.bis.org/statistics/totcredit.htm. 1 Consolidated data for the general government sector; central government for Argentina, Indonesia, Malaysia, Mexico, Saudi Arabia and Thailand.
Source: BIS total credit statistics.
125
100
75
5017151311090705
Euro area Germany France Italy
100
75
50
2517151311090705
Belgium Netherlands Spain
90
75
60
45
30
17151311090705
Sweden Switzerland United Kingdom
200
150
100
50
0
17151311090705
Australia Canada Japan United States
100
75
50
25
0
17151311090705
China Hong Kong SAR Singapore
75
60
45
30
15
17151311090705
India Indonesia Malaysia Thailand
100
75
50
25
0
17151311090705
Argentina Brazil Mexico
80
60
40
20
0
17151311090705
PolandRussia
Saudi ArabiaSouth Africa
Turkey
BIS Quarterly Review, March 2018 A29
G Debt service ratios for the private non-financial sector
Debt service ratios of the private non-financial sector
Deviation from country-specific mean, in percentage points1 Graph G.1
Euro area: major countries Euro area: other countries
Other European countries Other economies
Major emerging markets2 Emerging Asia2
Other emerging markets2
Further information on the BIS debt service ratio statistics is available at www.bis.org/statistics/dsr.htm. 1 Country-specific means are based on all available data from 1999 onwards. 2 Countries which are using alternative measures of income and interest rates. Further information is available under “Metholodogy and data for DSR calculation” at www.bis.org/statistics/dsr.htm.
Source: BIS debt service ratios statistics.
6
3
0
–3
–6
–917151311090705030199
France Germany Italy Spain
4
2
0
–2
–4
–617151311090705030199
Belgium Finland Netherlands Portugal
6
3
0
–3
–617151311090705030199
Denmark Norway Sweden United Kingdom
4
2
0
–2
–417151311090705030199
AustraliaCanada
JapanUnited States
Korea
20
10
0
–1017151311090705030199
Brazil China Russia Turkey
14
7
0
–717151311090705030199
Hong Kong SARIndia
IndonesiaMalaysia
Thailand
4
2
0
–2
–417151311090705030199
Mexico Poland South Africa
A30 BIS Quarterly Review, March 2018
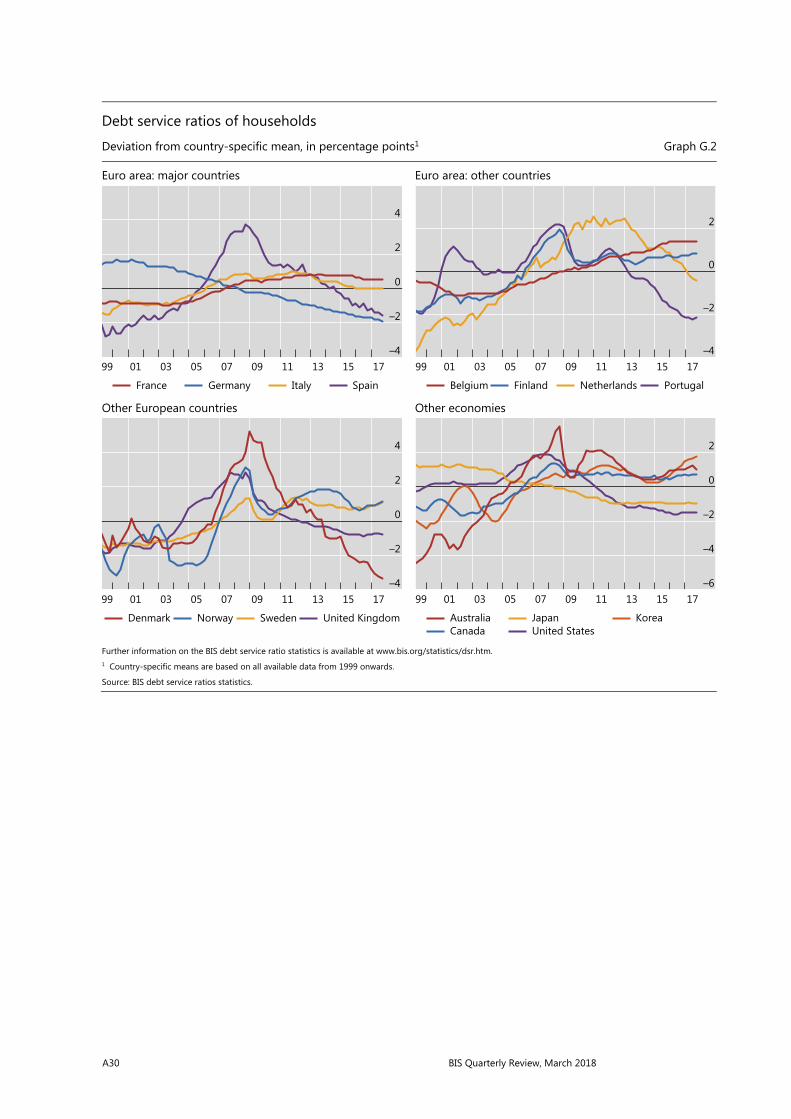
Debt service ratios of households
Deviation from country-specific mean, in percentage points1 Graph G.2
Euro area: major countries Euro area: other countries
Other European countries Other economies
Further information on the BIS debt service ratio statistics is available at www.bis.org/statistics/dsr.htm. 1 Country-specific means are based on all available data from 1999 onwards.
Source: BIS debt service ratios statistics.
4
2
0
–2
–417151311090705030199
France Germany Italy Spain
2
0
–2
–417151311090705030199
Belgium Finland Netherlands Portugal
4
2
0
–2
–417151311090705030199
Denmark Norway Sweden United Kingdom
2
0
–2
–4
–617151311090705030199
AustraliaCanada
JapanUnited States
Korea
BIS Quarterly Review, March 2018 A31
Debt service ratios of non-financial corporations
Deviation from country-specific mean, in percentage points1 Graph G.3
Euro area: major countries Euro area: other countries
Other European countries Other economies
Further information on the BIS debt service ratio statistics is available at www.bis.org/statistics/dsr.htm. 1 Country-specific means are based on all available data from 1999 onwards.
Source: BIS debt service ratios statistics.
20
10
0
–10
–2017151311090705030199
France Germany Italy Spain
20
10
0
–10
–2017151311090705030199
Belgium Finland Netherlands Portugal
20
10
0
–10
–2017151311090705030199
Denmark Norway Sweden United Kingdom
20
10
0
–10
–2017151311090705030199
AustraliaCanada
JapanUnited States
Korea
A32 BIS Quarterly Review, March 2018
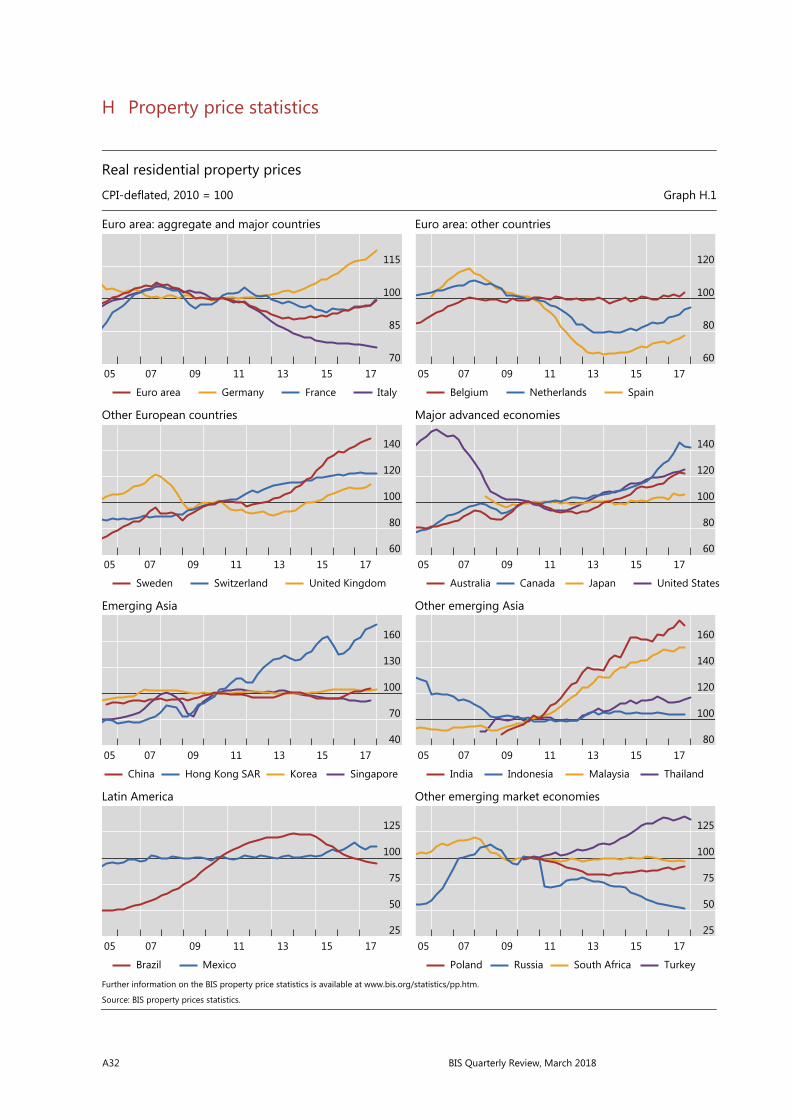
H Property price statistics
Real residential property prices
CPI-deflated, 2010 = 100 Graph H.1
Euro area: aggregate and major countries Euro area: other countries
Other European countries Major advanced economies
Emerging Asia Other emerging Asia
Latin America Other emerging market economies
Further information on the BIS property price statistics is available at www.bis.org/statistics/pp.htm.
Source: BIS property prices statistics.
115
100
85
7017151311090705
Euro area Germany France Italy
120
100
80
6017151311090705
Belgium Netherlands Spain
140
120
100
80
6017151311090705
Sweden Switzerland United Kingdom
140
120
100
80
6017151311090705
Australia Canada Japan United States
160
130
100
70
4017151311090705
China Hong Kong SAR Korea Singapore
160
140
120
100
8017151311090705
India Indonesia Malaysia Thailand
125
100
75
50
2517151311090705
Brazil Mexico
125
100
75
50
2517151311090705
Poland Russia South Africa Turkey
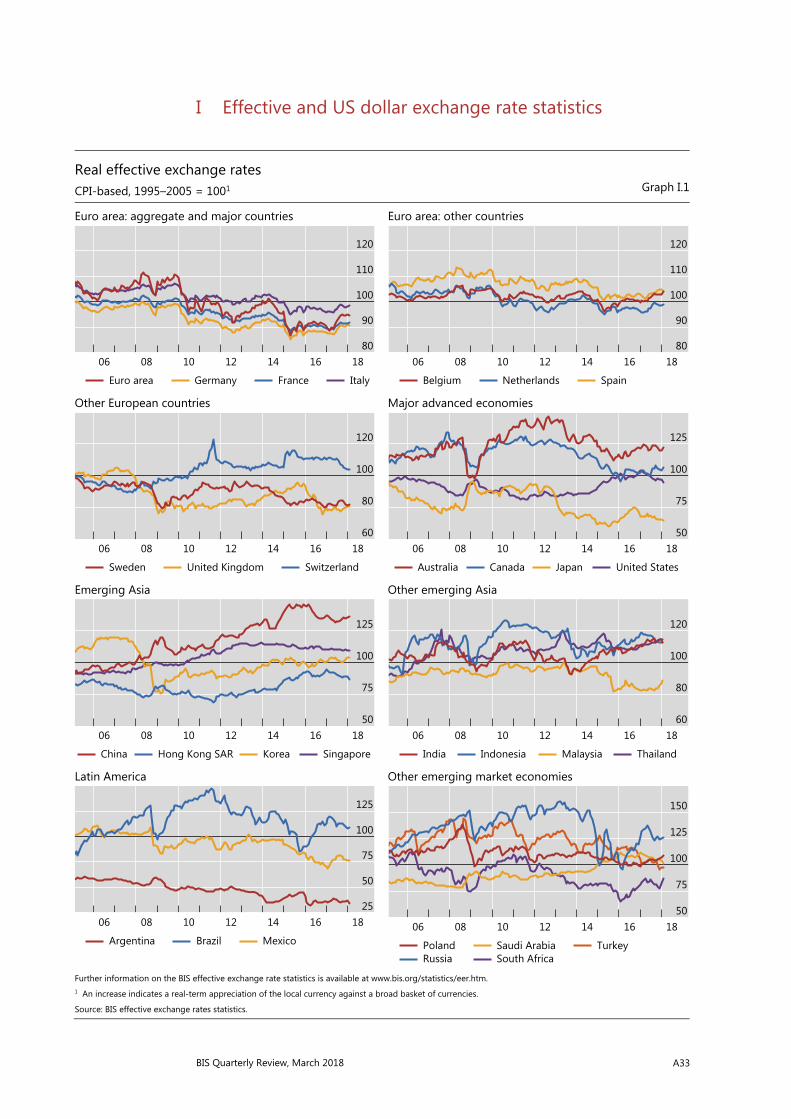
BIS Quarterly Review, March 2018 A33
I Effective and US dollar exchange rate statistics
Real effective exchange rates CPI-based, 1995–2005 = 1001 Graph I.1
Euro area: aggregate and major countries Euro area: other countries
Other European countries Major advanced economies
Emerging Asia Other emerging Asia
Latin America Other emerging market economies
Further information on the BIS effective exchange rate statistics is available at www.bis.org/statistics/eer.htm. 1 An increase indicates a real-term appreciation of the local currency against a broad basket of currencies.
Source: BIS effective exchange rates statistics.
120
110
100
90
8018161412100806
Euro area Germany France Italy
120
110
100
90
8018161412100806
Belgium Netherlands Spain
120
100
80
6018161412100806
Sweden United Kingdom Switzerland
125
100
75
5018161412100806
Australia Canada Japan United States
125
100
75
5018161412100806
China Hong Kong SAR Korea Singapore
120
100
80
6018161412100806
India Indonesia Malaysia Thailand
125
100
75
50
2518161412100806
Argentina Brazil Mexico
150
125
100
75
5018161412100806
PolandRussia
Saudi ArabiaSouth Africa
Turkey
A34 BIS Quarterly Review, March 2018
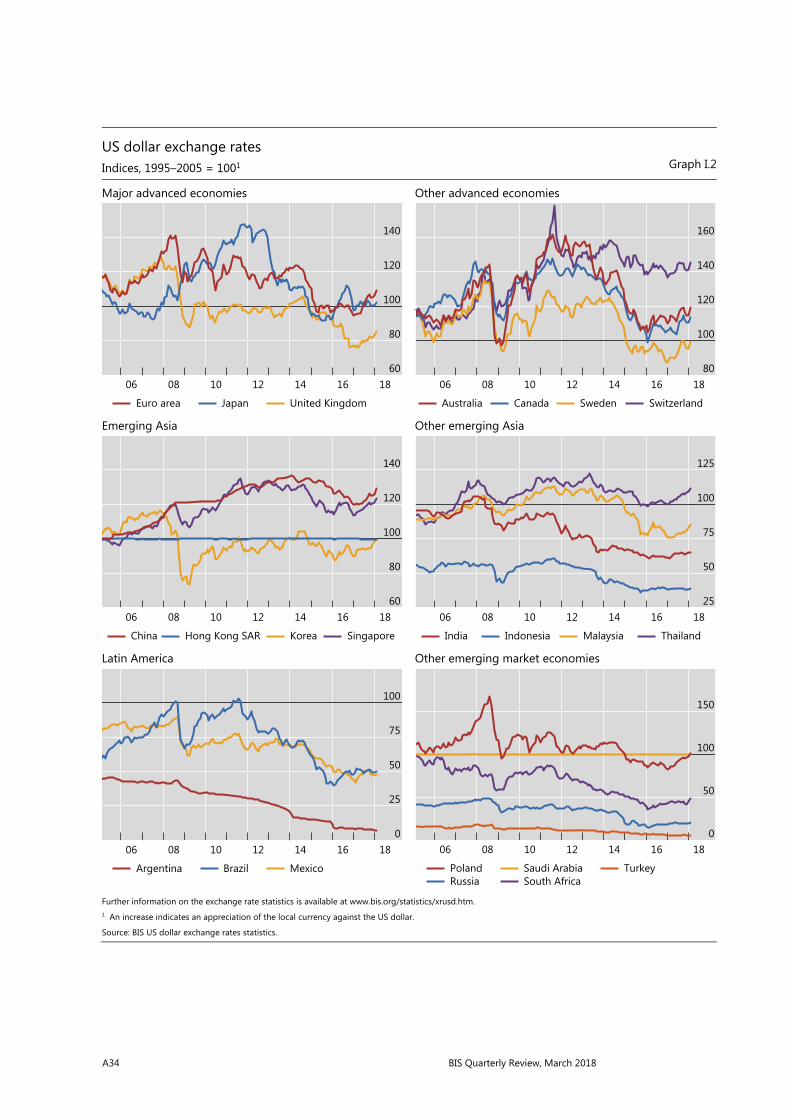
US dollar exchange rates Indices, 1995–2005 = 1001 Graph I.2
Major advanced economies Other advanced economies
Emerging Asia Other emerging Asia
Latin America Other emerging market economies
Further information on the exchange rate statistics is available at www.bis.org/statistics/xrusd.htm. 1 An increase indicates an appreciation of the local currency against the US dollar.
Source: BIS US dollar exchange rates statistics.
140
120
100
80
6018161412100806
Euro area Japan United Kingdom
160
140
120
100
8018161412100806
Australia Canada Sweden Switzerland
140
120
100
80
6018161412100806
China Hong Kong SAR Korea Singapore
125
100
75
50
2518161412100806
India Indonesia Malaysia Thailand
100
75
50
25
018161412100806
Argentina Brazil Mexico
150
100
50
018161412100806
PolandRussia
Saudi ArabiaSouth Africa
Turkey
BIS Quarterly Review, March 2018 A35
J Credit-to-GDP gaps
Credit-to-GDP gaps
In percentage points of GDP Graph J.1
Euro area: aggregate and major countries Euro area: other countries
Other European countries Major advanced economies
Emerging Asia Other emerging Asia
Latin America Other emerging market economies
1 Estimates based on series on total credit to the private non-financial sector. The credit-to-GDP gap is defined as the difference between the credit-to-GDP ratio and its long-term trend; the long-term trend is calculated using a one-sided Hodrick-Prescott filter with a smoothing parameter of 400,000. Further information on the BIS credit-to-GDP gaps is available at www.bis.org/statistics/c_gaps.htm.
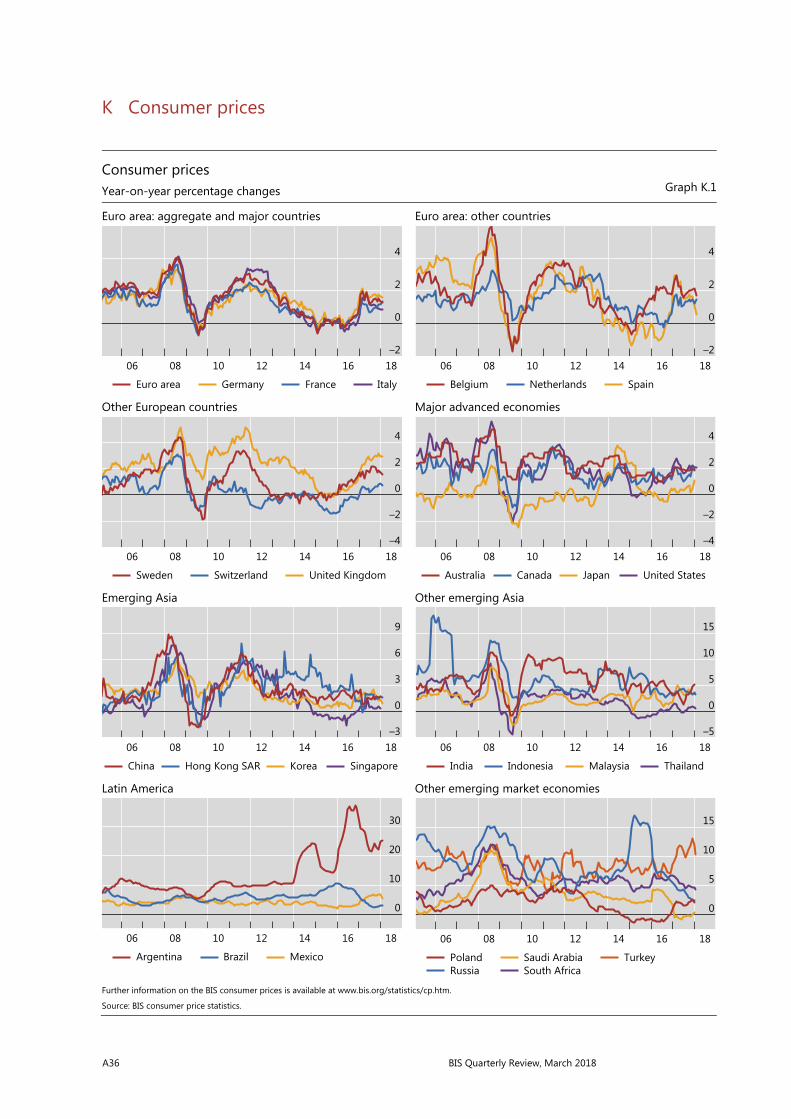
Euro area: aggregate and major countries Euro area: other countries
Other European countries Major advanced economies
Emerging Asia Other emerging Asia
Latin America Other emerging market economies
Further information on the BIS consumer prices is available at www.bis.org/statistics/cp.htm.
Source: BIS consumer price statistics.
4
2
0
–218161412100806
Euro area Germany France Italy
4
2
0
–218161412100806
Belgium Netherlands Spain
4
2
0
–2
–418161412100806
Sweden Switzerland United Kingdom
4
2
0
–2
–418161412100806
Australia Canada Japan United States
9
6
3
0
–318161412100806
China Hong Kong SAR Korea Singapore
15
10
5
0
–518161412100806
India Indonesia Malaysia Thailand
30
20
10
0
18161412100806
Argentina Brazil Mexico
15
10
5
0
18161412100806
PolandRussia
Saudi ArabiaSouth Africa
Turkey
BIS Quarterly Review, March 2018 A37
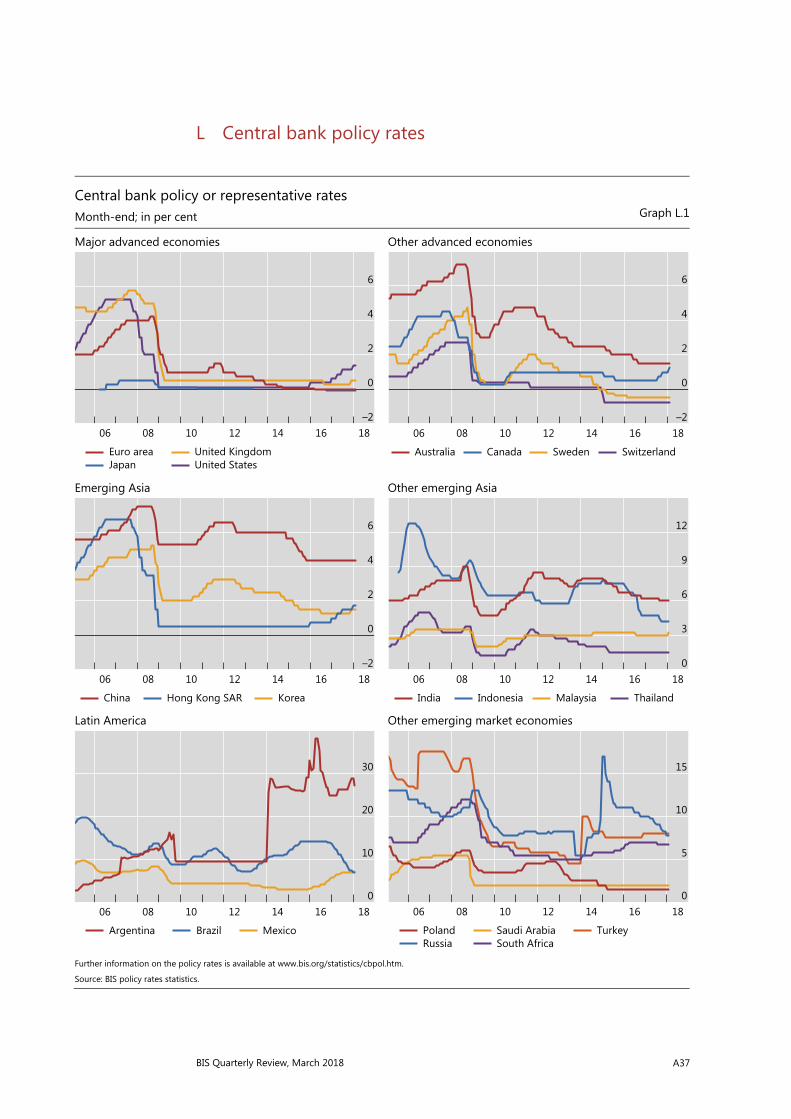
L Central bank policy rates
Central bank policy or representative rates Month-end; in per cent Graph L.1
Major advanced economies Other advanced economies
Emerging Asia Other emerging Asia
Latin America Other emerging market economies
Further information on the policy rates is available at www.bis.org/statistics/cbpol.htm.
Source: BIS policy rates statistics.
6
4
2
0
–218161412100806
Euro areaJapan
United KingdomUnited States
6
4
2
0
–218161412100806
Australia Canada Sweden Switzerland
6
4
2
0
–218161412100806
China Hong Kong SAR Korea
12
9
6
3
018161412100806
India Indonesia Malaysia Thailand
30
20
10
018161412100806
Argentina Brazil Mexico
15
10
5
018161412100806
PolandRussia
Saudi ArabiaSouth Africa
Turkey
BIS Quarterly Review, March 2018 B1
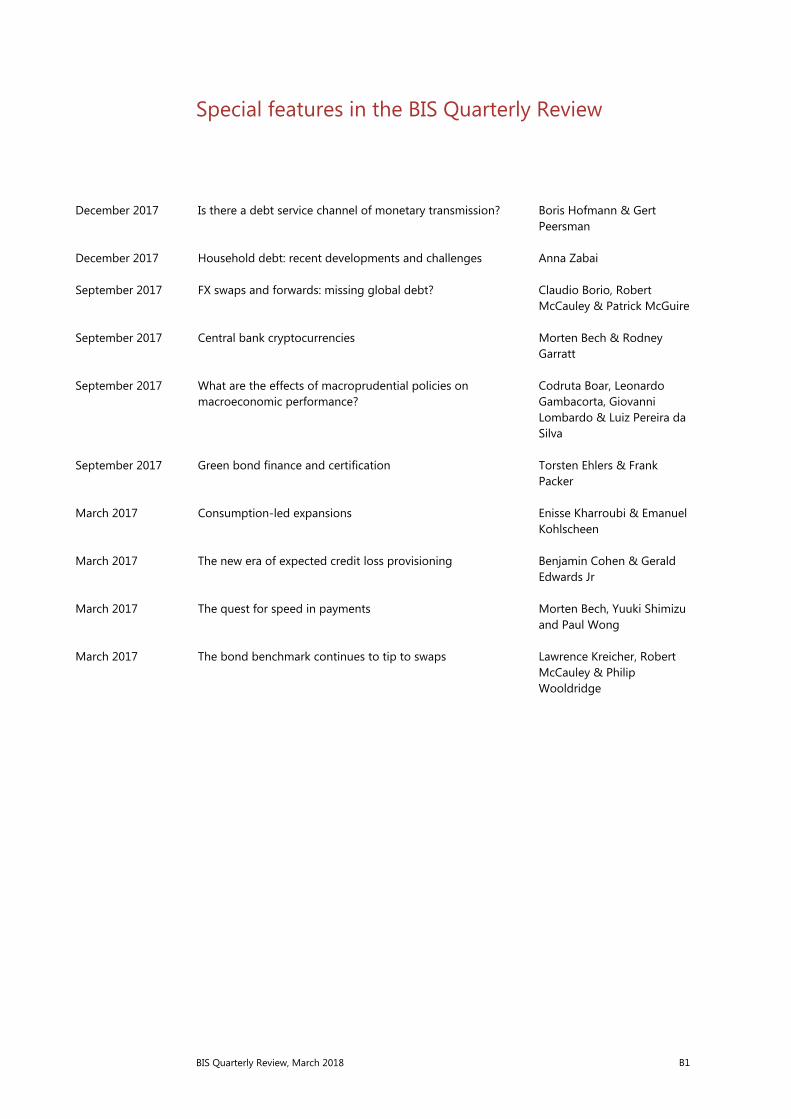
Special features in the BIS Quarterly Review
December 2017 Is there a debt service channel of monetary transmission? Boris Hofmann & Gert Peersman
December 2017 Household debt: recent developments and challenges Anna Zabai
September 2017 FX swaps and forwards: missing global debt? Claudio Borio, Robert McCauley & Patrick McGuire
September 2017 Central bank cryptocurrencies Morten Bech & Rodney Garratt
September 2017 What are the effects of macroprudential policies on macroeconomic performance?
Codruta Boar, Leonardo Gambacorta, Giovanni Lombardo & Luiz Pereira da Silva
September 2017 Green bond finance and certification Torsten Ehlers & Frank Packer
March 2017 Consumption-led expansions Enisse Kharroubi & Emanuel Kohlscheen
March 2017 The new era of expected credit loss provisioning Benjamin Cohen & Gerald Edwards Jr
March 2017 The quest for speed in payments Morten Bech, Yuuki Shimizu and Paul Wong
March 2017 The bond benchmark continues to tip to swaps Lawrence Kreicher, Robert McCauley & Philip Wooldridge
BIS Quarterly Review, March 2018 C1
Recent BIS publications1
BIS Papers
Frontiers of macrofinancial linkages BIS Papers No 95, January 2018
The Great Financial Crisis of 2007-09 confirmed the vital importance of advancing our understanding of macrofinancial linkages, the two-way interactions between the real economy and the financial sector. The crisis was a bitter reminder of how sharp fluctuations in asset prices, credit and capital flows can have dramatic impact on the financial positions of households, corporations and sovereign nations. As fluctuations were amplified, the global financial system was brought to the brink of collapse and the deepest contraction in world output in more than half a century followed. Moreover, unprecedented challenges for fiscal, monetary and financial regulatory policies resulted.
The crisis revived an old debate in the economics profession about the importance of macrofinancial linkages. Some argue that the crisis was a painful reminder of our limited knowledge of these linkages. Others claim that the profession had already made substantial progress in understanding them but that there was too much emphasis on narrow approaches and modelling choices. Yet, most also recognise that the absence of a unifying framework to study these two-way interactions has limited the practical applications of existing knowledge and impeded the formulation of policies.
With these observations in mind, this paper presents a systematic review of the rapidly expanding literature on macrofinancial linkages. It first surveys the literature on the linkages between asset prices and macroeconomic outcomes. It then reviews the literature on the macroeconomic implications of financial imperfections. It also examines the global dimensions of macrofinancial linkages and documents the main stylized facts about the linkages between the real economy and the financial sector. The topic of macrofinancial linkages promises to remain an exciting area of research, given the many open questions and significant policy interest. The paper concludes with a discussion of possible directions for future research, stressing the need for richer theoretical models, more robust empirical work and better quality data so as to advance knowledge and help guide policymakers going forward.
Macroprudential frameworks, implementation and relationship with other policies BIS Papers No 94, December 2017
Papers in this volume were prepared for a meeting of senior officials from central banks held at the Bank for International Settlements.
Emerging market central banks have a long history of using macroprudential instruments. But while most central banks carry a heavy responsibility for financial stability, legal objectives are generally vague, do not define success or failure, and say nothing about competing objectives. This complicates both accountability and the communication of macroprudential decisions.
Participants drew several lessons from their experience with implementing macroprudential instruments. First, macroprudential authorities need to act early if they want to address systemic risk effectively. Second, building buffers or shifting the composition of credit is easier than managing the cycle. Third, macroprudential measures tend to be better at
1 Requests for publications should be addressed to Bank for International Settlements, Press &
Communications, Centralbahnplatz 2, CH-4002 Basel. These publications are also available on the BIS website (http://www.bis.org/).
C2 BIS Quarterly Review, March 2018
constraining booms than at dampening busts. Fourth, although macroprudential tools could, in principle, be targeted very precisely, circumvention by lenders and borrowers require more broad-based approaches. Fifth, macroprudential measures and monetary policy can reinforce each other when used in the same direction. Sixth, the jury is still out whether macroprudential instruments could be used effectively to address regional disparities within economies.
This volume collects the background papers of a meeting of Deputy Governors of central banks from emerging market economies to exchange their experience with designing macroprudential frameworks and implementing macroprudential instruments.
BIS Working Papers
Monetary policy in the grip of a pincer movement Claudio Borio, Piti Disyatat, Mikael Juselius and Phurichai Rungcharoenkitkul February 2018, No 706
Monetary policy has been in the grip of a pincer movement, caught between growing financial cycles, on the one hand, and an inflation process that has become quite insensitive to domestic slack, on the other. This two-pronged attack has laid bare some of the limitations of prevailing monetary policy frameworks, particularly in the analytical notions that have guided much of its practice. We argue that the natural rate of interest as a guidepost for monetary policy has a couple of limitations: the concept, as traditionally conceived, neglects the state of the financial cycle in the definition of equilibrium; in addition, it underestimates the role that monetary policy regimes may play in persistent real interest rate movements. These limitations may expose monetary policy to blindsiding by the collateral damage that comes from an unhinged financial cycle. We propose a more balanced approach that recognises the difficulties monetary policy has in fine-tuning inflation and responds more systematically to the financial cycle.
An explanation of negative swap spreads: demand for duration from underfunded pension plans Sven Klingler and Suresh Sundaresan February 2018, No 705
The 30-year U.S. swap spreads have been negative since September 2008. We offer a novel explanation for this persistent anomaly. Through an illustrative model, we show that underfunded pension plans optimally use swaps for duration hedging. Combined with dealer banks' balance sheet constraints, this demand can drive swap spreads to become negative. Empirically, we construct a measure of the aggregate funding status of Defined Benefit pension plans and show that this measure is a significant explanatory variable of 30-year swap spreads. We find a similar link between pension funds' underfunding and swap spreads for two other regions.
Are credit rating agencies discredited? Measuring market price effects from agency sovereign debt announcements Mahir Binici, Michael M Hutchison and Evan Weicheng Miao February 2018, No 704
This paper investigates whether the price response to credit rating agency (CRA) announcements on sovereign bonds has diminished since the Global Financial Crisis (GFC). We characterize credit rating events more precisely than previous work, controlling agency announcements for the prior credit state - outlook, watch/review, or stable status as well as the level of the credit rating. Emphasizing the transition from one state to another allows us to distinguish between different types of announcement (rating changes, watch and outlook events) and their price effects. We employ an event study methodology and gauge market response by standardized cumulative abnormal returns (SCAR) and directional change statistics in daily credit default swap (CDS) spreads. We find that rating announcements provide a rich and varied set of information on how credit rating agencies influence market perceptions of sovereign default risk. CRA announcements continued to have significant
BIS Quarterly Review, March 2018 C3
effects on CDS spreads after the GFC, but the magnitude of the responses generally fell. Moreover, we find that accurate measurement of these effects depends on conditioning for the prior credit state of the sovereign bond.
The negative interest rate policy and the yield curve Dora Xia and Jing Cynthia Wu February 2018, No 703
We extract the market's expectations about the ECB's negative interest rate policy from the euro area's yield curve and study its impact on the yield curve. To capture the rich dynamics taking place at the short end of the yield curve, we introduce two policy indicators that summarise the immediate and longer-horizon future monetary policy stances. The ECB has cut interest rates four times under zero. We find that the June 2014 and December 2015 cuts were expected one month ahead but that the September 2014 cut was unanticipated. Most interestingly, the March 2016 cut was expected four months ahead of the actual cut.
Cross-stock market spillovers through variance risk premiums and equity flows Masazumi Hattori, Ilhyock Shim and Yoshihiko Sugihara February 2018, No 702
We estimate variance risk premiums (VRPs) in the stock markets of major advanced economies (AEs) and emerging market economies (EMEs) over 2007–15 and decompose the VRP into variance-diffusive risk premium (DRP) and variance-jump risk premium (JRP). Daily VAR analysis reveals significant spillovers from the VRPs of the United States and eurozone's AEs to the VRPs of other economic areas, especially during the post-Global Financial Crisis (GFC) period. We also find that during the post-GFC period, shocks to the DRPs of the United States and the eurozone's AEs have relatively strong and long-lived positive effects on the VRPs of other economic areas whereas shocks to their JRPs have relatively weak and short-lived positive effects. In addition, we show that increases in the size of US VRP, DRP and JRP tend to significantly reduce weekly equity fund flows to all other AEs and some EMEs during the post-GFC period. Finally, US DRP plays a more important role than US JRP in the determination of equity fund flows to all other AEs and some EMEs after the GFC, while the opposite holds true for equity fund flows to all other AEs during the GFC. Such results indicate the possibility of equity fund flows working as a channel of cross-market VRP spillovers.
Mapping shadow banking in China: structure and dynamics Torsten Ehlers, Steven Kong and Feng Zhu February 2018, No 701
We develop a stylised shadow banking map for China with the aim of providing a coherent picture of its structure and the associated financial system interlinkages. Five key characteristics emerge. One defining feature of the shadow banking system in China is the dominant role of commercial banks, true to the adage that shadow banking in China is the "shadow of the banks". Moreover, it differs from shadow banking in the United States in that securitisation and market-based instruments play only a limited role. With a series of maps we show that the size and dynamics of shadow banking in China have been changing rapidly. This reveals a marked shift in the relative importance of different shadow banking activities. New and more complex "structured" shadow credit intermediation has emerged and quickly reached a large scale, while the bond market has become highly dependent on funding channelled through wealth management products. As a result, the structure of shadow banking in China is growing more complex.
The perils of approximating fixed-horizon inflation forecasts with fixed-event forecasts James Yetman February 2018, No 700
A common practice in studies using inflation forecasts is to approximate fixed-horizon forecasts with fixed-event ones. Here we show that this may be problematic. In a panel of US inflation forecast data that allows us to compare the two, the approximation results in a mean absolute approximation error of around 0.2–0.3 percentage points (around 10% of the level of inflation), and statistically significant differences in both the variances and persistence of the approximate inflation forecasts relative to the actual forecasts. To reduce these problems,
C4 BIS Quarterly Review, March 2018
we propose an adjustment to the approximation, consistent with a model where longer-horizon forecasts are more heavily "anchored", while shorter-horizon forecasts more closely reflect current inflation levels.
Deflation expectations Ryan Niladri Banerjee and Aaron Mehrotra February 2018, No 699
We analyse the behaviour of inflation expectations during periods of deflation, using a large cross-country data set of individual professional forecasters' expectations. We find some evidence that expectations become less well anchored during deflations. Deflations are associated with a downward shift in inflation expectations and a somewhat higher backward-lookingness of those expectations. We also find that deflations are correlated with greater forecast disagreement. Delving deeper into such disagreement, we find that deflations are associated with movements in the lefthand tail of the distribution. Econometric evidence indicates that such shifts may have consequences for real activity.
Money and trust: lessons from the 1620s for money in the digital age Isabel Schnabel and Hyun Song Shin February 2018, No 698
Money is a social convention where one party accepts it as payment in the expectation that others will do so too. Over the ages, various forms of private money have come and gone, giving way to central bank money. The reasons for the resilience of central bank money are of particular interest given current debates about cryptocurrencies and how far they will supplant central bank money. We draw lessons from the role of public deposit banks in the 1600s, which quelled the hyperinflation in Europe during the Thirty Years War (1618–1648). As the precursors of modern central banks, public deposit banks established trust in monetary exchange by making the value of money common knowledge.
Are banks opaque? Evidence from insider trading Fabrizio Spargoli and Christian Upper February 2018, No 697
We use trades by US corporate insiders to investigate bank opacity, both in absolute terms and relative to other firms. On average, bank insider sales do not earn an abnormal return and do not predict stock returns. By contrast, bank insider purchases do, even though less than other firms. Our within-banking sector and over-time analyses also fail to provide evidence of greater opacity of banks vis-à-vis other firms. These results challenge conventional wisdom and suggest that, to assess bank opacity, the type of benchmark (transparency vs. other firms) and transaction/information (purchase/positive vs. sale/negative) are crucial.
Monetary policy spillovers, global commodity prices and cooperation Andrew Filardo, Marco Jacopo Lombardi, Carlos Montoro and Massimo Ferrari January 2018, No 696
Commodity price swings are key drivers of inflation and naturally factor into monetary policy decisions. Our paper assesses the soundness of the conventional wisdom that central banks should largely ignore the initial impact of commodity prices on headline inflation. This approach is based on the 1970s experience, when commodity prices soared because of supply shortages. Now, demand plays a more prominent role. Trying to distinguish between demand and supply, however, raises the risk of misdiagnosing commodity price falls as being driven primarily by external supply shocks, such as new discoveries of oil reserves, when they are in fact driven by global demand shocks, such as a fall in consumer confidence. We look at how misdiagnoses may affect the stability of the global business cycle.
The dollar exchange rate as a global risk factor: evidence from investment Stefan Avdjiev, Valentina Bruno, Catherine Koch and Hyun Song Shin January 2018, No 695
Exchange rate fluctuations influence economic activity not only via the standard trade channel, but also through a financial channel, which operates through the impact of exchange rate fluctuations on borrowers' balance sheets and lenders' risk-taking capacity.
BIS Quarterly Review, March 2018 C5
This paper explores the "triangular" relationship between (i) the strength of the US dollar, (ii) cross-border bank flows and (iii) real investment. We conduct two sets of empirical exercises - a macro (country-level) study and a micro (firm-level) study. We find that a stronger dollar is associated with lower growth in dollar-denominated cross-border bank flows and lower real investment in emerging market economies. An important policy implication of our findings is that a stronger dollar has real macroeconomic effects that go in the opposite direction to the standard trade channel.
Exchange rates and the working capital channel of trade fluctuations Valentina Bruno, Se-Jik Kim and Hyun Song Shin January 2018, No 694
Our paper provides a fresh take on the way the US dollar exchange rate influences the volume of global trade. We take as our starting point the substantial financing needs of the long supply chains, or global value chains (GVCs), that underpin trade in manufactured goods. These financial needs make GVCs susceptible to fluctuations in the supply of dollar-denominated trade credit. As a stronger dollar goes hand-in-hand with tighter dollar credit supply, the impact of a strong dollar can run counter to the traditional understanding of the impact of exchange rates on trade.
Family first? Nepotism and corporate investment Gianpaolo Parise, Fabrizio Leone and Carlo Sommavilla January 2018, No 693
Nepotism emerges in a multiplicity of contexts from political assignments to firm hiring decisions, but what are its real effects on the economy? This paper explores how nepotism affects corporate investment. To measure nepotism, we build a unique dataset of family connections among individuals employed in strategic positions by the same firm. We address endogeneity concerns by exploiting the heterogeneity in ancestries across U.S. counties to construct a measure of inherited family values. We find that firms headquartered in counties where locals inherited strong family values exhibit more nepotism. Using this measure and the percentage of family households in the county as instrumental variables, we provide evidence that nepotism hinders investment. Overall, our results suggest that underinvestment in these firms is driven by both lower quality of hired workers and lower incentive to exert effort.
Central bank forward guidance and the signal value of market prices Stephen Morris and Hyun Song Shin January 2018, No 692
The paper examines the relationship between monetary policy and market prices through the lens of central bank communication. Central bankers use forward guidance to steer market expectations of future monetary policy moves. At the same time, they rely on market prices to gauge the likely path of the economy and the appropriate stance of monetary policy. This two-way flow between market prices and forward guidance can create a circularity, and raises questions on how best to read market signals without distorting those same prices.
Effectiveness of unconventional monetary policies in a low interest rate environment Andrew Filardo and Jouchi Nakajima January 2018, No 691
Have unconventional monetary policies (UMPs) become less effective at stimulating economies in persistently low interest rate environments? This paper examines that question with a time-varying parameter VAR for the United States, the United Kingdom, the euro area and Japan. One advantage of our approach is the ability to measure an economy's evolving interest rate sensitivity during the post-GFC macroeconomy. Another advantage is the ability to capture time variation in the "natural", or steady state, rate of interest, which allows us to separate interest rate movements that are associated with changes in the stance of monetary policy from those that are not.
C6 BIS Quarterly Review, March 2018
Nonlinear state and shock dependence of exchange rate pass through on prices Hernán Rincón-Castro and Norberto Rodríguez-Niño January 2018, No 690
This paper examines the nature of the pass-through of exchange rate shocks on prices along the distribution chain, and estimates its short and long-term path. It uses monthly data from a small open economy and a smooth transition auto-regressive vector model estimated by Bayesian methods. The main finding is that exchange rate pass-through is nonlinear and state and shock dependent. There are two main policy implications of these findings. First, models used by central banks for policymaking should take into account the nonlinear and endogenous nature of the pass-through. Second, a specific rule on pass-through for monetary policy decisions should be avoided.
Estimating unknown arbitrage costs: evidence from a three-regime threshold vector error correction model Kristyna Ters and Jörg Urban January 2018, No 689
We present a methodology for estimating a 3-regime threshold vector error correction model (TVECM) with an unknown cointegrating vector based on a new dynamic grid evaluation. This model is particularly suited to estimating deviations from parity conditions such as unknown arbitrage costs in markets with a persistent non-zero basis between two similar financial market instruments traded in the spot and the derivative markets. Our proposed 3-regime TVECM can estimate the area where arbitrageurs have no incentives for trading. Only when the basis exceeds a critical threshold, where the potential gain from the basis trade exceeds the overall transaction costs, do we expect arbitrageurs to step in and carry out the respective trade. This leads to non-linear adjustment dynamics and regimes with different characteristics. The overall transaction costs for the basis trades can be inferred from the estimated no-arbitrage regime. Our methodology allows us to quantify overall transaction costs for an arbitrage trade in markets where trading costs are opaque or unknown, as in credit risk or index arbitrage trading. The key contributions of this paper are the further development of the 2-threshold VECM, together with the numerical evaluation of the model through numerous simulations to prove its robustness. We present two short applications of the model in arbitrage trades in the palladium market and index trading for the S&P 500.
Global factors and trend inflation Güneş Kamber and Benjamin Wong January 2018, No 688
We develop a model to empirically study the influence of global factors in driving trend inflation and the inflation gap.We apply our model to five established inflation targeters and a group of heterogeneous Asian economies. Our results suggest that while global factors can have a sizeable influence on the inflation gap, they play only a marginal role in driving trend inflation. Much of the influence of global factors in the inflation gap may be reflecting commodity price shocks. We also find global factors have a greater influence on inflation, and especially trend inflation, for the group of Asian economies relative to the established inflation targeters. A possible interpretation is that inflation targeting may have reduced the influence of global factors on inflation, and especially so on trend inflation.
Searching for yield abroad: risk-taking through foreign investment in U.S. bonds John Ammer, Stijn Claessens, Alexandra Tabova and Caleb Wroblewski January 2018, No 687
The risk-taking effects of low interest rates, now prevailing in many advanced countries, ("search-for-yield") are hard to analyze due to both a paucity of data and challenges in identification. Unique, security-level data on portfolio investment into the United States allow us to overcome both problems. Analyzing holdings of investors from 36 countries in close to 15,000 unique U.S. corporate bonds between 2003 and 2016, we show that declining home-country interest rates lead investors to shift their international bond portfolios toward riskier U.S. corporate bonds, consistent with "search-for-yield". We estimate even stronger effects
BIS Quarterly Review, March 2018 C7
when home interest rates reach a low level, suggesting that risk-taking in securities accelerates as rates decline.
Determinants of bank profitability in emerging markets Emanuel Kohlscheen, Andrés Murcia Pabón and Julieta Contreras January 2018, No 686
We analyse key determinants of bank profitability based on the evolution of balance sheets of 534 banks from 19 emerging market economies. We find that higher long-term interest rates tend to boost profitability, while higher short-term rates reduce profits by raising funding costs. We also find that in normal times credit growth tends to be more important for bank profitability than GDP growth. The financial cycle thus appears to predict bank profitability better than the business cycle. We also show that increases in sovereign risk premia reduce bank profits in a significant way, underscoring the role of credible fiscal frameworks in supporting the overall financial stability.
Why so low for so long? A long-term view of real interest rates Claudio Borio, Piti Disyatat, Mikael Juselius and Phurichai Rungcharoenkitkul December 2017, No 685
Prevailing explanations of the decline in real interest rates since the early 1980s are premised on the notion that real interest rates are driven by variations in desired saving and investment. But based on data stretching back to 1870 for 19 countries, our systematic analysis casts doubt on this view. The link between real interest rates and saving-investment determinants appears tenuous. While it is possible to find some relationships consistent with the theory in some periods, particularly over the last 30 years, they do not survive over the extended sample. This holds both at the national and global level. By contrast, we find evidence that persistent shifts in real interest rates coincide with changes in monetary regimes. Moreover, external influences on countries' real interest rates appear to reflect idiosyncratic variations in interest rates of countries that dominate global monetary and financial conditions rather than common movements in global saving and investment. All this points to an underrated role of monetary policy in determining real interest rates over long horizons.
Triffin: dilemma or myth? Michael Bordo and Robert N McCauley December 2017, No 684
Triffin gained enormous influence by reviving the interwar story that gold scarcity threatened deflation. In particular, he held that central banks needed to accumulate claims on the United States to back money growth. But the claims would eventually surpass the US gold stock and then central banks would inevitably stage a run on it. He feared that the resulting high US interest rates would cause global deflation. However, we show that the US gold position after WWII was no worse than the UK position in 1900. Yet it took WWI to break sterling's gold link. And better and feasible US policies could have kept Bretton Woods going.
This history serves as a backdrop to our critical review of two later extensions of Triffin. One holds that the dollar's reserve role required US current account deficits. This current account Triffin is popular, but anachronistic, and flawed in logic and fact. Nevertheless, it pops up in debates over the euro's and the renminbi's reserve roles. A fiscal Triffin holds that global demand for safe assets will either remain dangerously unsatisfied, or force excessive US fiscal debt. Less flawed, this story posits implausibly inflexible demand for and supply of safe assets. Thus, these stories do not convince in their own terms. Moreover, each lacks Triffin's clear cross-over point from a stable system to an unstable one.
Triffin's seeming predictive success leads economists to wrap his brand around dissimilar stories. Yet Triffin's dilemma in its most general form correctly points to the conflicts and difficulties that arise when a national currency plays a role as an international public good.
C8 BIS Quarterly Review, March 2018
Can macroprudential measures make cross-border lending more resilient? Előd Takáts and Judit Temesvary December 2017, No 683
We study the effect of macroprudential measures on cross-border lending during the taper tantrum, which a saw strong slowdown in cross-border bank lending to some jurisdictions. We use a novel dataset combining the BIS Stage 1 enhanced banking statistics on bilateral cross-border lending flows with the IBRN's macroprudential database. Our results suggest that macroprudential measures implemented in borrowers' host countries prior to the taper tantrum significantly reduced the negative effect of the tantrum on cross-border lending growth. The shock-mitigating effect of host country macroprudential rules are present both in lending to banks and non-banks, and are strongest for lending flows to borrowers in advanced economies and to the non-bank sector in general. Source (lending) banking system measures do not affect bilateral lending flows, nor do they enhance the effect of host country macroprudential measures. Our results imply that policymakers may consider applying macroprudential tools to mitigate international shock transmission through cross-border bank lending.
Bank business models: popularity and performance Nikola Tarashev, Kostas Tsatsaronis and Alan Villegas December 2017, No 682
We allocate banks to distinct business models by experimenting with various combinations of balance sheet characteristics as inputs in cluster analysis. Using a panel of 178 banks for the period 2005-15, we identify a retail-funded and a wholesale-funded commercial banking model that are robust to the choice of inputs. In comparison, a model emphasising trading activities and a universal banking model are less robustly identified. Both commercial banking models exhibit lower cost-to-income ratios and more stable return-on-equity than the trading model. In a reversal of a pre-crisis trend, the crisis aftermath witnessed mainly switches away from wholesale-funded and into retail-funded banking. Over the entire sample period, banks that switched into the retail-funded model saw their return-on-equity improve by 2.5 percentage points on average relative to non-switchers. By contrast, the relative performance of banks switching into the wholesale-funded model deteriorated by 5 percentage points on average.
Corporate leverage in EMEs: did the global financial crisis change the determinants? Snehal S Herwadkar December 2017, No 681
This paper evaluates whether the GFC was instrumental in changing the determinants of corporate leverage in EMEs. This issue is addressed using a panel-GMM framework and quantile analysis with a database comprising more than 2,000 firms in 10 EMEs over a 19-year period. We find that, post-GFC, global financial market and macroeconomic conditions facilitated build-up of corporate leverage. Specifically, global factors, such as the growth of world GDP and the FED shadow rate, have assumed centre stage as determinants of leverage in EMEs. At the same time, some traditional drivers, such as domestic growth and firm-specific factors, have become less important.
The macroeconomic effects of asset purchases revisited Henning Hesse, Boris Hofmann and James Weber December 2017, No 680
This paper revisits the macroeconomic effects of the large-scale asset purchase programmes launched by the Federal Reserve and the Bank of England from 2008. Using a Bayesian VAR, we investigate the macroeconomic impact of shocks to asset purchase announcements and assess changes in their effectiveness based on subsample analysis. The results suggest that the early asset purchase programmes had significant positive macroeconomic effects, while those of the subsequent ones were weaker and in part not significantly different from zero. The reduced effectiveness seems to reflect in part better anticipation of asset purchase programmes over time, since we find significant positive macroeconomic effects when we consider shocks to survey expectations of the Federal Reserve's last asset purchase
BIS Quarterly Review, March 2018 C9
programme. Finally, in all estimations we find a significant and persistent positive impact of asset purchase shocks on stock prices.
Syndicated loans and CDS positioning Iñaki Aldasoro and Andreas Barth December 2017, No 679
This paper analyzes banks' usage of CDS. Combining bank-firm syndicated loan data with a unique EU-wide dataset on bilateral CDS positions, we find that stronger banks in terms of capital, funding and profitability tend to hedge more. We find no evidence of banks using the CDS market for capital relief. Banks are more likely to hedge exposures to relatively riskier borrowers and less likely to sell CDS protection on domestic firms. Lead arrangers tend to buy more protection, potentially exacerbating asymmetric information problems. Dealer banks seem insensitive to firm risk, and hedge more than non-dealers when they are more profitable. These results allow for a better understanding of banks' credit risk management.
The Basel Committee on Banking Supervision has today issued for consultation Pillar 3 disclosure requirements - updated framework. Pillar 3 of the Basel framework seeks to promote market discipline through regulatory disclosure requirements. Many of the proposed disclosure requirements published today are related to the finalisation of the Basel III post-crisis regulatory reforms in December 2017 and include new or revised requirements:
for credit risk (including provisions for prudential treatment of assets), operational risk, the leverage ratio and credit valuation adjustment (CVA);
that would benchmark a bank's risk-weighted assets (RWA) as calculated by its internal models with RWA calculated according to the standardised approaches; and
that provide an overview of risk management, key prudential metrics and RWA.
In addition, today's publication proposes new disclosure requirements on asset encumbrance and capital distribution constraints.
Separately, the Committee is seeking feedback on the scope of application of the disclosure requirement on the composition of regulatory capital that was introduced in March 2017.
Together with the first phase and second phase of the revised Pillar 3 disclosure requirements issued in January 2015 and March 2017 respectively, the proposed disclosure requirements would comprise the single Pillar 3 framework.
Sound Practices: implications of fintech developments for banks and bank supervisors February 2018
This paper therefore combines historical research, analysis of current media and industry periodicals, fintech product analysis and scenario analysis as well as surveys on BCBS members’ activities, to provide a forward-looking perspective on fintech and its potential impact on the banking industry and bank supervision. Based on this work, the BCBS has identified 10 key implications and related considerations for banks and bank supervisors. The BCBS will continue to monitor fintech developments and assess whether and how these implications and considerations should be updated as appropriate.
Progress report on the implementation of principles for effective supervisory colleges December 2017
Supervisory colleges play a valuable role in the supervision of internationally active banks by helping their members to develop a more comprehensive understanding of a banking group’s risk profile globally and they provide a framework for addressing topics that are
C10 BIS Quarterly Review, March 2018
relevant to the group’s supervision. Home and host supervisors are responsible for assessing the bank’s risks in their respective jurisdictions, while activities organised in the supervisory colleges serve as important contributions to these assessments.
Although they started out as a tool for addressing cross-border supervisory coordination issues related to Basel implementation, supervisory colleges now serve the broader objectives of supervisory cooperation and coordination. Given the evolution in the use and functioning of colleges, they will continue to play a key role in fostering international cooperation among supervisors to promote effective supervision of cross-border banking groups.
Basel III: Treatment of extraordinary monetary policy operations in the Net Stable Funding Ratio - consultative version December 2017
The Committee today released its first technical amendment, which is related to the treatment of extraordinary monetary policy operations in the Net Stable Funding Ratio. To provide greater flexibility in the treatment of extraordinary central bank liquidity-absorbing monetary policy operations, the technical amendment proposes to allow for reduced required stable funding factors for central bank claims with maturity of more than 6 months.
Technical amendments are defined as changes in standards that are not substantial in nature but that cannot be unambiguously resolved based on the current text.
The Committee invites comments on the proposed amendment by 5 February 2018. All comments will be published on the website of the Bank for International Settlements unless a respondent specifically requests confidential treatment.
Stress testing principles - consultative document December 2017
The Basel Committee on Banking Supervision has released a consultative document on stress testing principles in which it proposes to replace the existing principles published in May 2009.
The existing principles were designed to address key weaknesses in stress testing practices that were highlighted by the global financial crisis. Since then, the role of stress testing has rapidly evolved and grown in importance in many jurisdictions. Stress testing is now a critical element of risk management for banks and a core tool for banking supervisors and macroprudential authorities.
The increasing importance of stress testing, combined with a significant range of approaches adopted by supervisory authorities and banks, highlights the continued need for a set of principles to govern stress testing frameworks. These factors also suggest that the principles themselves should be stated at a sufficiently high level to avoid impeding innovation in this rapidly evolving area.
During the course of 2017, the Committee undertook a review of its current set of stress testing principles. As a result of this review it proposes to replace the existing set of principles with a new streamlined version that states the principles at a high enough level to be applicable across many banks and jurisdictions and remain relevant as stress testing practices continue to develop. National authorities may wish to use the principles in designing their own stress testing rules, guidance or frameworks.
The Committee welcomes comments on all aspects of the proposed new principles. Comments should be uploaded here by 23 March 2018. All comments will be published on the website of the Bank for International Settlements (BIS) unless a respondent specifically requests confidential treatment.
Supervisory and bank stress testing: range of practices December 2017
This range of practices report describes and compares supervisory and bank stress testing practices and highlights areas of evolution. The report finds that, in recent years, both banks and authorities have made significant advances in stress testing methodologies and
BIS Quarterly Review, March 2018 C11
infrastructure. Stress testing is now a critical element of risk management for banks and a core tool for banking supervisors and macroprudential authorities.
The report draws primarily on the results of two surveys, completed respectively by Basel Committee member authorities and by banks (54 respondent banks from across 24 countries, including 20 global systemically important banks). The survey results are supplemented by case studies and other supervisory findings. A stress testing taxonomy is included with a common set of definitions for stress testing terms to aid the dialogue among banks and supervisors.
Basel III: Finalising post-crisis reforms December 2017
The Basel III framework is a central element of the Basel Committee's response to the global financial crisis. It addresses shortcomings of the pre-crisis regulatory framework and provides a regulatory foundation for a resilient banking system that supports the real economy.
A key objective of the revisions incorporated into the framework is to reduce excessive variability of risk-weighted assets (RWA). At the peak of the global financial crisis, a wide range of stakeholders lost faith in banks' reported risk-weighted capital ratios. The Committee's own empirical analyses also highlighted a worrying degree of variability in banks' calculation of RWA. The revisions to the regulatory framework will help restore credibility in the calculation of RWA by:
enhancing the robustness and risk sensitivity of the standardised approaches for credit risk and operational risk, which will facilitate the comparability of banks' capital ratios
constraining the use of internally modelled approaches
complementing the risk-weighted capital ratio with a finalised leverage ratio and a revised and robust capital floor.
Basel III Monitoring Report - Results of the cumulative quantitative impact study December 2017
Alongside the finalisation of the Basel III post-crisis reforms, the Basel Committee published the results of a cumulative quantitative impact study (QIS) conducted while developing the standards. The Committee believes that the information contained in the report will provide relevant stakeholders with a useful benchmark for analysis and provide an estimated impact of the Committee's finalisation of the Basel III reforms.
The QIS is based on end-2015 data provided by 248 banks that participated in the exercise. The QIS did not take into account any transitional arrangements, nor make any assumptions about banks' profitability or behavioural responses. The report also does not reflect any additional capital requirements under Pillar 2 of the Basel II framework, any higher loss absorbency requirements for domestic systemically important banks or any countercyclical capital buffer requirements. Such factors may result in the report overstating the actual impact. On that basis, the report shows that the finalisation of Basel III results in no significant increase in overall capital requirements, although effects vary among banks.
The regulatory treatment of sovereign exposures - discussion paper December 2017
In January 2015, the Basel Committee on Banking Supervision set up a high-level Task Force on Sovereign Exposures to review the regulatory treatment of sovereign exposures and recommend potential policy options. The Task Force's report analysed issues concerning the regulatory treatment of sovereign exposures in the Basel framework. This discussion paper is derived from the Task Force's report.
The Committee's view is that the issues raised by the Task Force and the ideas outlined in this paper are important, and could benefit from a broader discussion. However, at this stage the Committee has not reached a consensus to make any changes to the treatment of sovereign exposures, and has therefore decided not to consult on the ideas presented in this paper.
C12 BIS Quarterly Review, March 2018
The views of interested stakeholders will nevertheless be useful in informing the Committee's longer-term thinking on this issue. The Committee welcomes comments, which should be uploaded here by Friday 9 March 2018. All comments will be published on the website of the Bank for International Settlements unless a respondent specifically requests confidential treatment.
Committee on the Global Financial System
Structural changes in banking after the crisis January 2018 No 60
Report prepared by a Working Group established by the Committee on the Global Financial System. The Group was chaired by Claudia Buch (Deutsche Bundesbank) and B Gerard Dages (Federal Reserve Bank of New York).
The experience of the global financial crisis, the post-crisis market environment and changes to regulatory frameworks have had a marked impact on the banking sector globally. The CGFS Working Group examined trends in bank business models, performance and market structure over the past decade, and assessed their implications for the stability and efficiency of banking markets.
The report contains several key observations on structural changes in the banking sector after the crisis. First, while many large advanced economy banks have moved away from trading and cross-border activities, there does not appear to be clear evidence of a systemic retrenchment from core credit provision. Second, bank return on equity has declined across countries, and individual banks have experienced persistently weak earnings and poor investor sentiment, suggesting a need for further cost cutting and structural adjustments. Third, in line with the intended direction of the regulatory reforms, banks have significantly enhanced their balance sheet and funding resilience and curbed their involvement in certain complex activities.
The report also provides a comprehensive country-level dataset encompassing indicators of market structure, balance sheet composition, capitalisation and performance. The data, covering 21 countries over the 2000–2016 period, are provided in the annex tables of the report and in a data file for ease of use.
Committee on Payments and Market Infrastructure
Cross-border retail payments February 2018 No 173
There is room to improve the infrastructure for payments made by individuals, firms and government agencies that cross borders, according to a report by the Committee on Payments and Market Infrastructures (CPMI), the global standard setter for payment, clearing and settlement services.
Innovations such as mobile or e-banking have made cross-border payments more convenient but the key to making these payments faster and cheaper is better choice and diversity of clearing and settlement arrangements.
BIS Quarterly Review, March 2018 C13
Speeches
Supervision in a post-Basel III world
Keynote address by Mr Agustín Carstens, General Manager of the BIS, at the 13th Asia-Pacific High-level Meeting on Banking Supervision, Singapore, 28 February 2018.
Three key messages:
First, completion of the Basel III reforms is a significant milestone and provides much needed regulatory certainty to the banking sector.
Second, effective supervision continues to be an important, but sometimes forgotten, element of the post-crisis reforms. It provides context to, and reinforces, Basel III. In a post-crisis world, supervisors will need to stay focused on traditional risks such as asset quality. At the same time, they must keep an eye on emerging risks, such as the evolving fintech landscape and the way it can transform our traditional approaches to identifying and assessing risk. In both cases, they will need to utilise new forward-looking assessment tools and to better employ existing ones to identify and resolve problems at an early stage.
And third, although it may not be sufficiently emphasised, perhaps the most powerful countercyclical tool available to prudential authorities is their army of front-line supervisors. They are the eyes and ears of policymakers and they see first-hand the impact of, for instance, monetary policy decisions on bank behaviour and risk-taking. Working in concert with risk managers at banks, supervisors are best positioned to say "no", even when society and indeed some governments are saying "yes".
With these considerations in mind, I believe that our Financial Stability Institute (FSI) can play a key role in advancing the supervisory agenda. Through its publications and outreach events such as this High-level Meeting, the FSI facilitates the exchange of supervisory experiences and approaches on a range of prudential issues. It also contributes to capacity-building for supervisors around the world.
The post-crisis regulatory agenda: What is missing?
English translation of speech in Spanish by Mr Fernando Restoy, Chairman, Financial Stability Institute, Bank for International Settlements, to Círculo Financiero La Caixa, Barcelona, Spain, 19 February 2018.
At the beginning of these remarks, I told you that, despite the significant progress that has been made, the regulatory community still has a lot of work to do. The tasks ahead are derived not only from the various sources of risk that affect the international financial system, but from the need to rigorously translate international principles into the regulations and supervisory practices of each jurisdiction. As I have said, this means adopting specific policies when international guidelines are not prescriptive enough - as in the case of identifying and measuring non-performing loans. It also means accurately defining the scope of application of the international standards, aiming for careful application of the principle of proportionality. Finally, it entails designing complementary measures that maximise the benefits and reduce the risks associated with the practical application of the international principles - such as those required by the new powers to resolve credit institutions.
All these tasks should be carried out by national authorities (or European ones in the case of the EU). Still, experience shows that in this area of implementation cooperation between supervisors can add significant value rooted in the exchange of experiences, mutual learning and the identification of effective ways of overcoming challenges. This is precisely the area of focus of the FSI.
How to transition out of a "Goldilocks economy" without creating a new "Minsky moment"?
Remarks by Mr Luiz Awazu Pereira da Silva, Deputy General Manager of the BIS, and Mr Jochen Schanz, Senior Economist, on the occasion of the joint conference by the National Bank of the
C14 BIS Quarterly Review, March 2018
Republic of Macedonia and the Reinventing Bretton Woods Committee on "Monetary policy and asset management", Skopje, 16 February 2018.
A long episode of very calm markets appears to have come to an end. During the first eight days of February 2018, concerns about the joint impact on inflation of rising wage pressures against the backdrop of the US fiscal expansion and dollar depreciation challenged investors' complacency about inflation risks. Yield curves shifted up, apparently driven mostly by higher inflation expectations. The S&P 500 fell by 10%, the first sharp decline since January 2016 when market participants reacted with alarm to events in China. The VIX, a measure of expected stock market volatility, reached levels unseen since August 2015. For a moment, the risk appeared to emerge that the Goldilocks economy, with robust growth, low unemployment, and low inflation, could come to an abrupt end, giving rise to a "Minsky moment" in which speculative positions are unwound quickly, asset prices fall and the economy plunges into recession.
The policy life cycle and capacity-building needs of financial sector authorities
Keynote address by Mr Agustín Carstens, General Manager of the BIS, at the BIS-IMF symposium on "Capacity-building in financial sector regulation and supervision", Basel, 8 February 2018.
Money in the digital age: what role for central banks?
Lecture by Mr Agustín Carstens, General Manager of the BIS, at the House of Finance, Goethe University, Frankfurt, 6 February 2018.
Reviewing the economic functions and historical foundations of money, this lecture asks whether new technology fundamentally alters the advantages of central banks being the ultimate issuer. The inquiry sheds light on current policy questions surrounding cryptocurrencies. It concludes that authorities should focus on the ties linking cryptocurrencies to the conventional financial system and apply the level playing field principle of "same risk, same regulation".
Post-crisis bank resolution: what are the main challenges now?
Concluding remarks by Mr Agustín Carstens, General Manager of the BIS, at the 8th FSI-IADI conference on "Bank resolution, crisis management and deposit insurance", Basel, 2 February 2018.
This conference has provided an overview of the standards in crisis management and resolution as well as of the challenges so far and those to come.
A lot of ground has been covered, but we clearly need to road-test the new standards and requirements. Time will tell which ones work best.
In the meantime, implementation of the standards will continue to teach us important lessons, and it is key that authorities carry forward their cooperation, nationally and internationally, and further strengthen their resolution frameworks.
Events like today's conference convened by the IAID and the FSI can only help to support the development of best practices, so allow me to congratulate both bodies on the success of this occasion.
A level playing field in banking
Keynote address by Mr Agustín Carstens, General Manager of the BIS, at the Institute of International Finance Board of Directors dinner, Zurich, 21 January 2018.
A blind spot in today's macroeconomics?
Panel remarks by Mr Claudio Borio, Head of the Monetary and Economic Department of the BIS, at the BIS-IMF-OECD Joint Conference on "Weak productivity: the role of financial factors and policies", Paris, 10-11 January 2018.
A standard presumption in today's macroeconomics is that when making sense of first-order macroeconomic outcomes we can treat the economy as if its output were a single good
BIS Quarterly Review, March 2018 C15
produced by a single firm. This means that issues of resource misallocation can be safely ignored. But the link between resource misallocations and macroeconomic outcomes may well be tighter than we think. This speech illustrates the point with reference to two examples that highlight the link between finance and macroeconomics: the impact of resource misallocations induced by financial booms and busts on productivity growth, and an intriguingly close relationship between the growing incidence of "zombie" firms and declining interest rates since the 1980s.
Fernando Restoy's intervention before the Spanish Parliament
Intervention of Mr Fernando Restoy, Chairman of the Financial Stability Institute, before the Spanish Parliament's Committee of Inquiry about the financial crisis in Spain and the financial assistance programme, Madrid, 20 December 2017.
The nature of evolving risks to financial stability
Keynote address by Mr Agustín Carstens, General Manager of the BIS, at the 53rd SEACEN Governors' Conference/High-level Seminar and 37th Meeting of the SEACEN Board of Governors, Bangkok, 15 December 2017.
While the risks I have outlined above are significant, they are by no means unmanageable. We can learn from previous tightening episodes and prepare ourselves for the risk of sharp snapbacks in the level of interest rates. We can do a better job in both spreading and selling to the body politic the benefits of economic and financial integration. Globalisation is not off the rails; it is just in need of maintenance.
We should continue to enhance our capacity to respond to the challenges posed by some disruptive innovations in financial services. At the same time, we should not allow for the revolution in IT and innovation to blur the distinction between money and virtual currencies.
And let's also continue to buttress domestic policies with international cooperation that monitors and addresses global linkages - through both global bodies such as the BIS, the IMF and the FSB, and regional ones such as ASEAN and SEACEN. Not least, let's fully implement the internationally agreed financial reforms - such as Basel III - in a timely and consistent manner to ensure the resilience of our financial systems.