71
BIS Quarterly Review June 2019 International banking and financial market developments BIS
BIS Quarterly Review
June 2019
International banking and financial market developments
BIS
BIS Quarterly Review Monetary and Economic Department
Editorial Committee:
Claudio Borio Stijn Claessens Benoît Mojon Hyun Song Shin Philip Wooldridge
General queries concerning this commentary should be addressed to Philip Wooldridge (tel +41 61 280 8006, e-mail: [email protected]), queries concerning specific parts to the authors, whose details appear at the head of each section, and queries concerning the statistics to Patrick McGuire (tel +41 61 280 8921, e-mail: [email protected]).
This publication is available on the BIS website (www.bis.org/publ/qtrpdf/r_qt1906.htm).
© Bank for International Settlements 2019. All rights reserved. Brief excerpts may be reproduced or translated provided the source is stated.
ISSN 1683-0121 (print) ISSN 1683-013X (online)
BIS Quarterly Review, June 2019 iii
BIS Quarterly Review
June 2019
The June issue focuses on BIS statistics. Analyses of financial market developments will be included in the BIS Annual Economic Report to be published on 30 June 2019. International banking and financial market developments
Concentration in cross-border banking ................................................................................... 1
Iñaki Aldasoro and Torsten Ehlers
Key takeaways ........................................................................................................................... 2
Distribution of cross-border banking relationships ................................................... 2
Box A: Analysing bilateral country links using the BIS international banking statistics ............................................................................ 4
Concentration and the fall in cross-border interbank credit .................................. 5
Conclusions ................................................................................................................................ 8
Box B: The importance of small cross-border banking links for emerging market economies ...................................................................... 9
BIS statistics: Charts ............................................................................................................... A1
Special features in the BIS Quarterly Review ..................................................... B1
List of recent BIS publications ....................................................................................... C1
Notations used in this Review
billion thousand million e estimated lhs, rhs left-hand scale, right-hand scale $ US dollar unless specified otherwise … not available . not applicable – nil or negligible Differences in totals are due to rounding. The term “country” as used in this publication also covers territorial entities that are not states as understood by international law and practice but for which data are separately and independently maintained.
iv BIS Quarterly Review, June 2019
Abbreviations
Currencies
ARS Argentine peso MAD Moroccan dirham
AUD Australian dollar MXN Mexican peso
BGN Bulgarian lev MYR Malaysian ringgit
BHD Bahraini dinar NOK Norwegian krone
BRL Brazilian real NZD New Zealand dollar
CAD Canadian dollar OTH all other currencies
CHF Swiss franc PEN Peruvian sol
CLP Chilean peso PHP Philippine peso
CNY (RMB) Chinese yuan (renminbi) PLN Polish zloty
COP Colombian peso RON Romanian leu
CZK Czech koruna RUB Russian rouble
DKK Danish krone SAR Saudi riyal
EUR euro SEK Swedish krona
GBP pound sterling SGD Singapore dollar
HKD Hong Kong dollar THB Thai baht
HUF Hungarian forint TRY Turkish lira
IDR Indonesian rupiah TWD New Taiwan dollar
ILS Israeli new shekel USD US dollar
INR Indian rupee VES bolívar soberano
JPY Japanese yen ZAR South African rand
KRW Korean won

BIS Quarterly Review, June 2019 v
Countries
AE United Arab Emirates CY Cyprus
AF Afghanistan CZ Czech Republic
AL Albania DE Germany
AM Armenia DJ Djibouti
AO Angola DK Denmark
AR Argentina DM Dominica
AT Austria DO Dominican Republic
AU Australia DZ Algeria
AZ Azerbaijan EA euro area
BA Bosnia and Herzegovina EC Ecuador
BD Bangladesh EE Estonia
BE Belgium EG Egypt
BF Burkina Faso ER Eritrea
BG Bulgaria ES Spain
BH Bahrain ET Ethiopia
BI Burundi FI Finland
BJ Benin FJ Fiji
BM Bermuda FO Faeroe Islands
BN Brunei FR France
BO Bolivia GA Gabon
BR Brazil GB United Kingdom
BS The Bahamas GD Grenada
BT Bhutan GE Georgia
BY Belarus GH Ghana
BZ Belize GN Guinea
CA Canada GQ Equatorial Guinea
CD Democratic Republic of the Congo GR Greece
CF Central African Republic GT Guatemala
CG Republic of Congo GW Guinea-Bissau
CH Switzerland GY Guyana
CI Côte d’Ivoire HN Honduras
CL Chile HK Hong Kong SAR
CM Cameroon HR Croatia
CN China HT Haiti
CO Colombia HU Hungary
CR Costa Rica ID Indonesia
CV Cape Verde IE Ireland
vi BIS Quarterly Review, June 2019
Countries (cont)
IL Israel MW Malawi
IN India MX Mexico
IQ Iraq MY Malaysia
IR Iran MZ Mozambique
IS Iceland NG Nigeria
IT Italy NL Netherlands
JE Jersey NO Norway
JM Jamaica NR Nauru
JO Jordan NZ New Zealand
JP Japan OM Oman
KE Kenya PA Panama
KG Kyrgyz Republic PE Peru
KH Cambodia PG Papua New Guinea
KR Korea PH Philippines
KW Kuwait PK Pakistan
KY Cayman Islands PL Poland
KZ Kazakhstan PT Portugal
LA Laos PY Paraguay
LB Lebanon QA Qatar
LC St Lucia RO Romania
LK Sri Lanka RS Serbia
LR Liberia RU Russia
LS Lesotho RW Rwanda
LT Lithuania SA Saudi Arabia
LU Luxembourg SC Seychelles
LV Latvia SD Sudan
LY Libya SE Sweden
MA Morocco SG Singapore
MD Moldova SK Slovakia
ME Montenegro SI Slovenia
MK Macedonia FYR SR Suriname
MM Myanmar SS South Sudan
MN Mongolia ST São Tomé and Príncipe
MO Macao SAR SV El Salvador
MR Mauritania SZ Eswatini
MT Malta TD Chad
MU Mauritius TG Togo
MV Maldives TH Thailand
BIS Quarterly Review, June 2019 vii
Countries (cont)
TJ Tajikistan UZ Uzbekistan
TL East Timor VC St Vincent and the Grenadines
TM Turkmenistan VE Venezuela
TO Tonga VG British Virgin Islands
TR Turkey VN Vietnam
TT Trinidad and Tobago XM euro area
TW Chinese Taipei ZA South Africa
UA Ukraine ZM Zambia
US United States AE advanced economy
UY Uruguay EME emerging market economy

BIS Quarterly Review, June 2019 1
Concentration in cross-border banking1
Cross-border bank credit is dominated by a small number of very sizeable links between banks in one country and borrowers in another. The largest-sized cross-border banking links are mainly between major advanced economies. Concentration increased up until the Great Financial Crisis (GFC) and has abated only slightly since. It is higher for interbank credit than for credit to the non-bank sector. Despite the substantial decline in interbank credit in the aftermath of the GFC, concentration in the interbank segment has remained high.
JEL classification: G15, F30, G21.
A structural feature of cross-border banking is its high degree of concentration, with a small number of very large bilateral links accounting for the lion’s share of total global cross-border bank credit. The largest links are almost exclusively between advanced economies, while links involving emerging market economies (EMEs) tend to be of smaller size. Concentration in cross-border bank links increased up to the Great Financial Crisis (GFC) and remained high. Overall, it is higher for cross-border interbank credit compared with bank credit to the non-bank sector. While the share of cross-border interbank credit has fallen significantly since the GFC, concentration has remained high for interbank links.
The concentration of cross-border bank linkages is highly relevant for financial spillovers, as the GFC revealed (Ehlers and McGuire (2017), Avdjiev and Takáts (2014), Herrmann and Mihaljek (2013), Borio et al (2011)). In this article, we take a closer look at the size distribution as well as the sectoral composition of cross-border banking links at the country level. Cross-border interbank credit was particularly affected during the GFC (Claessens (2017)), including the model whereby local banks tap cross-border funding from global banks (Bruno and Shin (2014)). Using the BIS locational banking statistics (LBS), we document the pattern of bilateral (country-level) cross-border bank credit (assets) of banks located in one country vis-à-vis bank and non-bank borrowers in another.2
1 The authors would like to thank Stefan Avdjiev, Claudio Borio, Stijn Claessens, Bryan Hardy, Swapan-
Kumar Pradhan, Patrick McGuire, Benoît Mojon, Hyun Song Shin, Nikola Tarashev and Philip Wooldridge for valuable comments and suggestions, as well as Deimantė Kupčiūnienė for excellent research assistance. The views expressed in this article are those of the authors and do not necessarily reflect those of the BIS.
2 Creditor banks in a given country are in most cases also cross-border borrowers. This article, however, focuses only on one direction of cross-border bank linkages. While this greatly simplifies the analysis, it misses some relevant liabilities such as cross-border deposits. Nonetheless, it covers cross-border interbank linkages, which proved to be particularly important during the GFC.
Iñaki Aldasoro
Torsten Ehlers
2 BIS Quarterly Review, June 2019
The first section of this article documents the size distribution of cross-border banking links. It then shows that concentration is mainly due to links within advanced economies. The second section looks at the sectoral composition, focusing on the persistently higher concentration in cross-border interbank links relative to links vis-à-vis the non-bank sector.
Distribution of cross-border banking relationships
At end-2018, the outstanding stock of cross-border bank claims stood at $28.5 trillion.3 This stock consisted of the sum of 4,822 bilateral relationships between creditor banks in one country and borrowers in another (see Box A for a more detailed data description and a comparison with consolidated data). The concentration in cross-border links can be characterised along two complementary dimensions: the number of country-level links between banks and borrowers; and the size or volume of each link.4
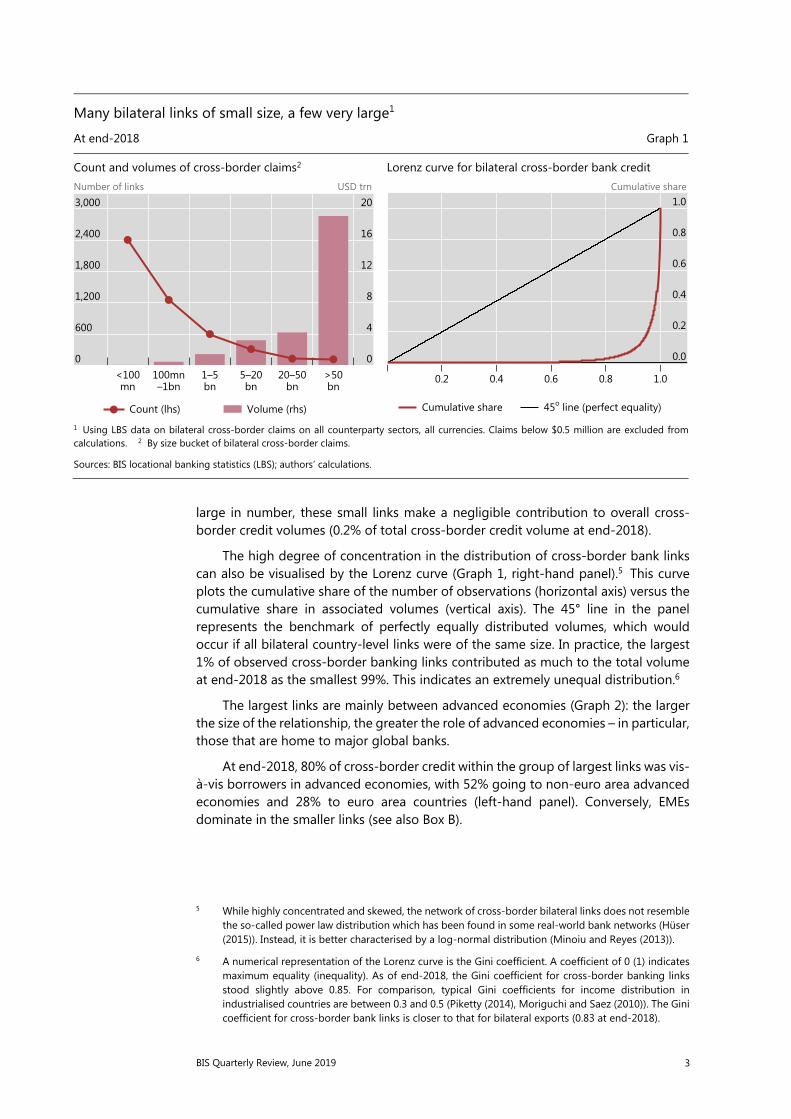
A small number of links are exceptionally large in size and are behind the lion’s share of overall volumes (Graph 1, left-hand panel, bars). Two thirds of the $28.5 trillion in total lending as of end-2018 were accounted for by 117 bilateral relationships larger than $50 billion in size.
The flip side of the small number of very sizeable links is the high number of small-sized links (left-hand panel, line). As of end-2018, around 50% of all existing bilateral links at the country level were smaller than $100 million in volume. While
3 As our interest lies in country-to-country relationships, throughout our analysis we exclude cross-
border claims unallocated by counterparty country and vis-à-vis international organisations.
4 The precision of reporting in the LBS has improved with time. Up to Q2 2012, values were reported to the BIS in integers of millions of US dollars. Since then, values have been reported down to thousands of US dollars by most reporters. This can artificially influence the number of bilateral links. For this reason, in this article we set a threshold of $0.5 million for bilateral links to be considered, ie bilateral links smaller than that amount are set to zero.
Key takeaways
A small number of very large cross-border links dominate global cross-border bank credit. Only 2.4% of all bilateral links between banks in one country and borrowers in another were greater than $50 billion in size at end-2018, but they constituted a full two thirds of global cross-border bank credit volumes.
Concentration in cross-border bank credit is mainly due to links involving advanced economies. Just five major creditor countries – France, Germany, Japan, the United Kingdom and the United States – account for 55% of global cross-border credit and close to 70% of the volume of the largest bilateral country-level links.
Concentration is a structural feature of cross-border bank credit. Even amid a significant drop in cross-border interbank credit after the Great Financial Crisis (GFC), concentration in interbank links remained high. Concentration in cross-border credit to non-banks has increased since the GFC.
Small cross-border links account for an insignificant share of global bank credit but can be economically important for emerging market economies (Box B).
BIS Quarterly Review, June 2019 3
large in number, these small links make a negligible contribution to overall cross-border credit volumes (0.2% of total cross-border credit volume at end-2018).
The high degree of concentration in the distribution of cross-border bank links can also be visualised by the Lorenz curve (Graph 1, right-hand panel).5 This curve plots the cumulative share of the number of observations (horizontal axis) versus the cumulative share in associated volumes (vertical axis). The 45° line in the panel represents the benchmark of perfectly equally distributed volumes, which would occur if all bilateral country-level links were of the same size. In practice, the largest 1% of observed cross-border banking links contributed as much to the total volume at end-2018 as the smallest 99%. This indicates an extremely unequal distribution.6
The largest links are mainly between advanced economies (Graph 2): the larger the size of the relationship, the greater the role of advanced economies – in particular, those that are home to major global banks.
At end-2018, 80% of cross-border credit within the group of largest links was vis-à-vis borrowers in advanced economies, with 52% going to non-euro area advanced economies and 28% to euro area countries (left-hand panel). Conversely, EMEs dominate in the smaller links (see also Box B).
5 While highly concentrated and skewed, the network of cross-border bilateral links does not resemble
the so-called power law distribution which has been found in some real-world bank networks (Hüser (2015)). Instead, it is better characterised by a log-normal distribution (Minoiu and Reyes (2013)).
6 A numerical representation of the Lorenz curve is the Gini coefficient. A coefficient of 0 (1) indicates maximum equality (inequality). As of end-2018, the Gini coefficient for cross-border banking links stood slightly above 0.85. For comparison, typical Gini coefficients for income distribution in industrialised countries are between 0.3 and 0.5 (Piketty (2014), Moriguchi and Saez (2010)). The Gini coefficient for cross-border bank links is closer to that for bilateral exports (0.83 at end-2018).
Many bilateral links of small size, a few very large1
At end-2018 Graph 1
Count and volumes of cross-border claims2 Lorenz curve for bilateral cross-border bank credit Number of links USD trn Cumulative share
1 Using LBS data on bilateral cross-border claims on all counterparty sectors, all currencies. Claims below $0.5 million are excluded fromcalculations. 2 By size bucket of bilateral cross-border claims.
Sources: BIS locational banking statistics (LBS); authors’ calculations.
3,000
2,400
1,800
1,200
600
0
20
16
12
8
4
0
bnbnbnbn–1bnmn>5020–505–201–5100mn<100
Count (lhs) Volume (rhs)
1.0
0.8
0.6
0.4
0.2
0.0
1.00.80.60.40.2
Cumulative share 45o line (perfect equality)

4 BIS Quarterly Review, June 2019
Box A
Analysing bilateral country links using the BIS international banking statistics
The BIS international banking statistics (IBS) are collected by national authorities at the bank level but reported to the BIS at the country level; all banks in a given reporting country are aggregated together. Therefore, the IBS measure country-to-country links but do not measure the much larger number of bilateral links between individual banks and borrowers. At end-2018, the locational banking statistics (LBS) captured the positions of more than 8,000 banks, reported as 47 country aggregates. Banks reported their positions against borrowers in more than 215 countries, resulting in 5,927 country-to-country links. Many of these links are for insignificant amounts of less than $0.5 million. Excluding these small links results in 4,822 links greater than $0.5 million.
The LBS include intragroup business and measure the geographical concentration of cross-border business. For example, a US bank might route its cross-border business via a financial centre such as London, resulting in two links: from the United States to the United Kingdom, and from the United Kingdom to the country where the final borrower resides. Therefore, the LBS potentially underestimate concentration of bank creditors because the same banking group may operate in different countries at the same time. The BIS consolidated banking statistics (CBS) take a nationality perspective and consolidate the worldwide claims of a given banking group to the country where it is headquartered.
Not surprisingly, the number of links is much higher in the LBS than the CBS: 4,822 versus 3,550 at end-2018 (Graph A, left-hand panel). In part, this is due to differences in the number of reporting countries: 47 in the LBS, compared with 31 in the CBS. But the different reporting concepts of the LBS and the CBS mean that they cover different elements of international banking links. The CBS, by definition, do not contain claims between affiliates of the same banking group. The CBS, however, include credit extended locally by a foreign office of a given banking group. They distinguish between international claims (cross-border and local claims in foreign currency) and local claims in local currency. Internationally active banking groups tend to have large subsidiaries in advanced economies and in many major emerging market economies, reflected in a relatively high share of local claims in local currency.
In terms of how concentrated international banking is, the cross-border claims in the LBS and foreign claims in the CBS present a very similar picture (Graph A, right-hand panel; see also Graph 1, left-hand panel). The largest size group (>$50 billion) constitutes 3.1% of all consolidated links by number (versus 2.4% for LBS), which amount to 70% of all claims by volume (67% in the LBS). The smallest bilateral links (<$100 million) make up 49% of all consolidated links (50% for LBS) while they amount to only 0.1% of consolidated claims by volume (0.2% for LBS).
Concentration and composition of consolidated banking links At end-2018 Graph A
Volume and count by counterparty country region CBS foreign claims, count and volume2, 3 Number of links USD trn Number of links USD trn
1 BIS locational banking statistics (LBS). Claims below $0.5 million are excluded from calculations. 2 BIS consolidated banking statistics (CBS). Claims below $0.5 million are excluded from calculations. 3 By size bucket of bilateral foreign claims.
Sources: BIS consolidated banking statistics on an immediate counterparty basis; BIS locational banking statistics; authors’ calculations.
3,200
2,400
1,600
800
0
10.0
7.5
5.0
2.5
0.0OffshoreEMEsOther AEsEuro area
LBS cross-border claims1
CBS foreign claims2
Count (lhs):LBS cross-border claims1
CBS international claims2
CBS local claims inlocal currency2
Volume (rhs):
1,600
1,200
800
400
0
16
12
8
4
0
bnbnbnbn–1bnmn>5020–505–201–5100mn<100
Count (lhs) Volume (rhs)

BIS Quarterly Review, June 2019 5
Turning to the creditor country perspective, the concentration around advanced economies is even more pronounced. Across all size groups, advanced economies provide at least 50% of cross-border credit, and more than 80% within the largest size group. Close to 70% of the volume of the largest-sized links, and 55% of total global cross-border credit, is explained by creditors in only five major advanced economies: France, Germany, Japan, the United Kingdom and the United States.
Concentration and the fall in cross-border interbank credit
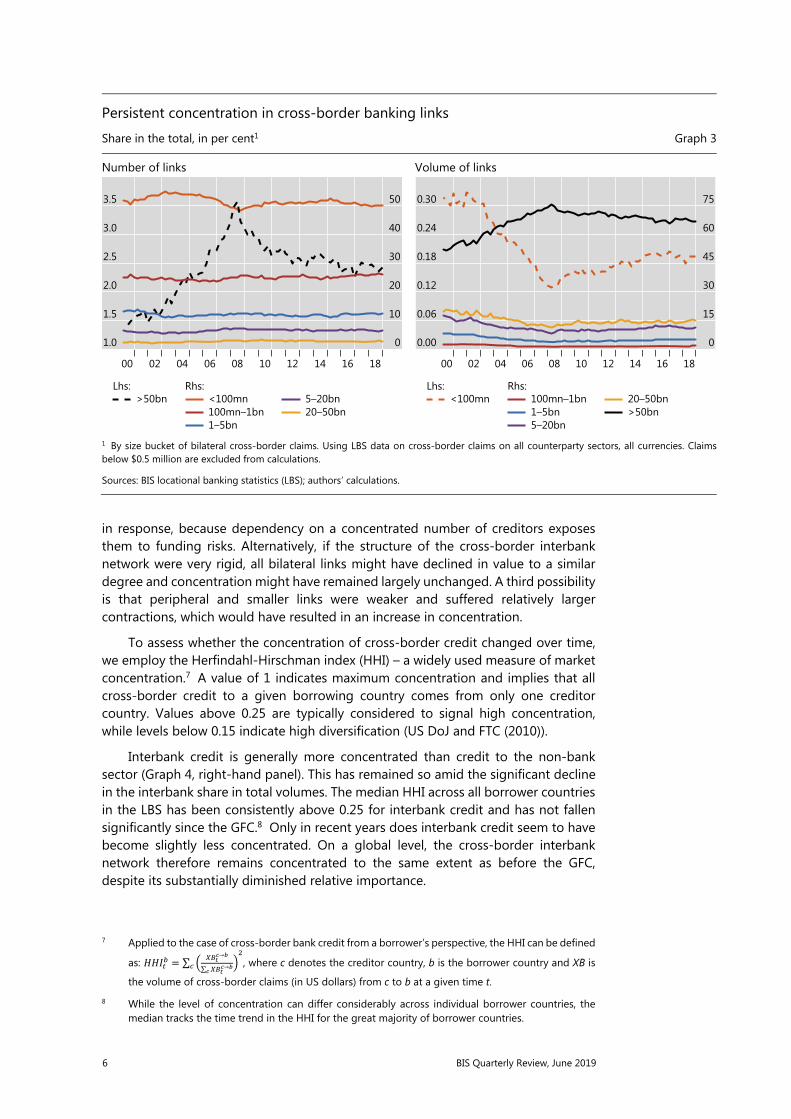
The distribution of links across the different size buckets has been very stable over time. This suggests that concentration is a structural feature of the cross-border banking network. The increase in the share of very large links (Graph 3, left-hand panel, dashed line) in the years before the GFC exacerbated the already high concentration (right-hand panel, black line). The share in total cross-border bank credit volumes of the largest links rose from around 50% to 75% in the six years up to 2008. It has declined only gradually since, to 67% at end-2018.
The structural nature of concentration is underscored by how concentration in interbank links responded to the significant fall in cross-border interbank credit in the aftermath of the GFC. While global cross-border bank credit to the non-bank sector has continued to grow since the GFC, cross-border interbank credit has been falling (Graph 4, left-hand panel). This has resulted in a significant and persistent reduction in the share of interbank credit, from around 65% at end-2008 to 53% at end-2018 (red line).
The rapid initial decline in interbank cross-border credit, and the fall in its share, could conceivably have affected concentration in several possible ways. One possibility is that interbank borrowers could have tried to diversify their creditor base
Concentration by recipient and lender country region
At end-2018, in per cent1 Graph 2
By region of borrowing country By region of creditor country
1 By size bucket of bilateral cross-border claims. Using LBS data on bilateral cross-border claims on all counterparty sectors, all currencies. Claims below $0.5 million are excluded from calculations. Regional composition is different between the two panels since only a limited number of countries within a region report LBS.
Sources: BIS locational banking statistics (LBS); authors’ calculations.
100
80
60
40
20
0
bnbnbnbn–1bnmn>5020–505–201–5100mn<100
Euro area Other AEs EMEs
100
80
60
40
20
0
bnbnbnbn–1bnmn>5020–505–201–5100mn<100
Offshore Big 5: DE, FR, GB, JP and US
6 BIS Quarterly Review, June 2019
in response, because dependency on a concentrated number of creditors exposes them to funding risks. Alternatively, if the structure of the cross-border interbank network were very rigid, all bilateral links might have declined in value to a similar degree and concentration might have remained largely unchanged. A third possibility is that peripheral and smaller links were weaker and suffered relatively larger contractions, which would have resulted in an increase in concentration.
To assess whether the concentration of cross-border credit changed over time, we employ the Herfindahl-Hirschman index (HHI) – a widely used measure of market concentration.7 A value of 1 indicates maximum concentration and implies that all cross-border credit to a given borrowing country comes from only one creditor country. Values above 0.25 are typically considered to signal high concentration, while levels below 0.15 indicate high diversification (US DoJ and FTC (2010)).
Interbank credit is generally more concentrated than credit to the non-bank sector (Graph 4, right-hand panel). This has remained so amid the significant decline in the interbank share in total volumes. The median HHI across all borrower countries in the LBS has been consistently above 0.25 for interbank credit and has not fallen significantly since the GFC.8 Only in recent years does interbank credit seem to have become slightly less concentrated. On a global level, the cross-border interbank network therefore remains concentrated to the same extent as before the GFC, despite its substantially diminished relative importance.
7 Applied to the case of cross-border bank credit from a borrower’s perspective, the HHI can be defined
as: = ∑ →∑ → , where c denotes the creditor country, b is the borrower country and XB is
the volume of cross-border claims (in US dollars) from c to b at a given time t.
8 While the level of concentration can differ considerably across individual borrower countries, the median tracks the time trend in the HHI for the great majority of borrower countries.
Persistent concentration in cross-border banking links
Share in the total, in per cent1 Graph 3
Number of links Volume of links
1 By size bucket of bilateral cross-border claims. Using LBS data on cross-border claims on all counterparty sectors, all currencies. Claims below $0.5 million are excluded from calculations.
Sources: BIS locational banking statistics (LBS); authors’ calculations.
3.5
3.0
2.5
2.0
1.5
1.0
50
40
30
20
10
0
18161412100806040200
>50bnLhs:
<100mn100mn–1bn1–5bn
Rhs:5–20bn20–50bn
0.30
0.24
0.18
0.12
0.06
0.00
75
60
45
30
15
0
18161412100806040200
<100mnLhs:
100mn–1bn1–5bn5–20bn
Rhs:20–50bn>50bn

BIS Quarterly Review, June 2019 7
The drop in the interbank share was to a significant extent driven by the well documented contraction in credit extended by European banks following the GFC and the euro area crisis (McCauley et al (2017)). Interbank lending to euro area countries and other advanced economies was particularly affected. Hence, concentration in interbank credit may have responded differently across recipient country regions.
Despite the sharp drop in cross-border interbank credit to euro area countries, concentration in the euro area did not abate but intensified (Graph 5, first panel). This can be explained by the relative stability of interbank links to major euro area countries, which tend to be of large size, while interbank credit to periphery countries recorded strong declines.
Other advanced economies and recipients in offshore centres did see a decline in the concentration of cross-border interbank credit (Graph 5). However, this did not occur in the immediate aftermath of the GFC. The decrease in the concentration of interbank credit for advanced economy borrowers outside of the euro area occurred in more recent years (second panel), and is largely explained by the contraction in the volume of large links coming from offshore centres. Concentration for borrowers in offshore centres (fourth panel) dropped substantially from the peak in 2010, but has not abated further with the continued decline in the interbank share. For borrowers in EMEs, interbank shares have increased slightly since the GFC, mainly driven by China. Concentration in interbank credit is much higher for EME borrowers than for borrowers in advanced economies, but shows no clear trend (third panel).
Interbank claims have been declining while their concentration has remained high1 Graph 4
Cross-border claims by counterparty sector HHI by counterparty sector3 Per cent USD trn HHI
1 Using LBS data on bilateral cross-border claims in all currencies. Claims below $0.5 million are excluded from calculations. Reporting of LBSstatistics improves over time; from end-December 2015, this includes China and Russia as reporting countries. 2 Interbank share is calculated as the ratio of claims on the bank sector over claims on all counterparty sectors. 3 Median value of Herfindahl-Hirschman index (HHI) across the counterparty countries within a sector. HHI is calculated as the sum of squared market shares, where market share is the share of claims held by a creditor in total claims on a counterparty country.
Sources: BIS locational banking statistics (LBS); authors’ calculations.
65
60
55
50
30
20
10
018161412100806040200
Interbank share2Lhs:
BankRhs:
Non-bank
0.35
0.30
0.25
0.20181614121008060402
Bank
Non-bank

8 BIS Quarterly Review, June 2019
Interbank concentration remains high despite the decline in interbank credit1 Graph 5
Euro area Other AEs EMEs Offshore centres Per cent HHI Per cent HHI Per cent HHI Per cent HHI
1 Using LBS data on bilateral cross-border claims on the bank sector in all currencies. Claims below $0.5 million are excluded fromcalculations. 2 Interbank share is calculated as the ratio of claims on the bank sector over claims on all counterparty sectors. 3 Median value of the Herfindahl-Hirschman index (HHI) across the counterparty countries within a region. HHI is calculated as the sum of squaredmarket shares, where market share is the share of claims held by a creditor in total claims on a counterparty country.
Sources: BIS locational banking statistics (LBS); authors’ calculations.
Conclusions
Cross-border interbank links are highly concentrated. A small number of very large country-level links (>$50 billion), mostly between advanced economies, dominate cross-border bank credit. Just five major creditor countries – France, Germany, Japan, the United Kingdom and the United States – account for 55% of global cross-border credit and close to 70% of the volume of the largest bilateral links. The share of the largest links increased in the run-up to the GFC and has declined only slightly since.
Concentration in cross-border credit is of a structural nature. This is corroborated by the high concentration in interbank links, which persisted amid the significant decline of cross-border interbank credit after the GFC. From a research perspective, a relevant implication of the structurally high concentration in cross-border banking links is that empirical analyses that give equal weight to all observations are likely to yield unreliable results for a number of important questions (Amiti et al (2017)). From a policy perspective, the persistently high concentration in links implies that cross-border banking remains a potentially important channel for transmitting financial shocks.
70
60
50
40
0.4
0.3
0.2
0.118130803
70
60
50
40
0.4
0.3
0.2
0.118130803
Interbank share2Lhs:
70
60
50
40
0.4
0.3
0.2
0.118130803
HHI3Rhs:
70
60
50
40
0.4
0.3
0.2
0.118130803

BIS Quarterly Review, June 2019 9
Box B
The importance of small cross-border banking links for emerging market economies
While small links – smaller than $100 million in size – account for a minor share of the total volume of cross-border credit, they account for a significant share of credit to borrowers in many emerging market economies (EMEs). For example, cross-border credit to borrowers in Gambia and Sierra Leone is entirely through small links (Graph B1). But small links are not equally important for all EMEs. For the largest, such as Brazil and China, small links are negligible.
Small links matter for small EME recipient countries1
At end-2018, percentage of GDP Graph B1
1 Using LBS data on cross-border claims on all counterparty sectors, all currencies. Claims below $0.5 million are excluded from calculations.
Sources: IMF, World Economic Outlook; BIS locational banking statistics (LBS); authors’ calculations.
Small cross-border banking links and the fall in interbank links1
By counterparty country region Graph B2
Emerging Asia Central and eastern Europe Latin America Middle East and Africa Average count USD bn Average count USD bn Average count USD bn Average count USD bn
1 Using data on bilateral cross-border claims on all counterparty sectors, in all currencies, where claims are below $100 million and above$0.5 million. For a list of countries in each region, see Table A3 on the BIS website (https://stats.bis.org/statx/srs/table/a3). 2 Average count of links is calculated as the ratio of total bilateral links with volume below $100 million to the number of creditors reporting links of any size.
Sources: BIS locational banking statistics; authors’ calculations.
12
10
8
6
4
2
0
Gam
bia Si
erra L
eone
Micr
onesia
Centra
l Afr.
Rep.
Leso
tho G
renad
a Bh
utan
Moldova H
aiti
Burki
na Fa
so Bo
tswan
a Be
nin
Turkm
enist
an Tu
nisia
Parag
uay
Niger
Boliv
ia Ta
nzan
ia G
uatem
ala Ka
zakh
stan
Bosn
ia an
d Herz
. M
orocc
o Ko
rea Br
azil
China
Small links (<$100mn) Other links (≥$100mn)
12
10
8
6
4
16
12
8
4
01814100602
6
5
4
3
2
8
6
4
2
018130803
BanksNon-banks
Count2 (lhs):
10
8
6
4
2
12
9
6
3
01814100602
BanksNon-banks
Volume (rhs):
18
15
12
9
6
20
15
10
5
01814100602
10 BIS Quarterly Review, June 2019
The volume of lending to EMEs associated with small cross-border relationships has increased steadily over the past two decades. This trend is evident for lending to both the non-bank and the bank sector (Graph B2). However, volumes disguise a fall in the average number of small bilateral links between banks and borrowers in EMEs. The only exception is non-bank borrowing in emerging Asia, which saw an increase in the average number of country-to-country links. Since 2014, the average number of interbank bilateral links has been declining for many EMEs, particularly in the Middle East and Africa and in emerging Asia. The decline in correspondent banking relationships in recent years may have contributed to the fall in the number of small bilateral links (CPMI (2019)).

BIS Quarterly Review, June 2019 A1
Annexes
BIS Statistics: Charts
The statistics published by the BIS are a unique source of information about the structure of and activity in the global financial system. BIS statistics are presented in graphical form in this annex and in tabular form in the BIS Statistical Bulletin, which is published concurrently with the BIS Quarterly Review. For introductions to the BIS statistics and a glossary of terms used in this annex, see the BIS Statistical Bulletin.
The data shown in the charts in this annex can be downloaded from the BIS Quarterly Review page on the BIS website (www.bis.org/publ/quarterly.htm). Data may have been revised or updated subsequent to the publication of this annex. For the latest data and to download additional data, see the statistics pages on the BIS website (www.bis.org/statistics/index.htm). A release calendar provides advance notice of publication dates (www.bis.org/statistics/relcal.htm).
A Locational banking statistics
A.1 Cross-border claims, by sector, currency and instrument ........................................ A4
A.2 Cross-border claims, by borrowing region..................................................................... A5
A.3 Cross-border claims, by borrowing country .................................................................. A6
A.4 Cross-border claims, by nationality of reporting bank and currency of denomination ............................................................................................................................. A7
A.5 Cross-border liabilities of reporting banks..................................................................... A8
B Consolidated banking statistics
B.1 Consolidated claims of reporting banks on advanced economies ....................... A9
B.2 Consolidated claims of reporting banks on emerging market economies ..... A10
C Debt securities statistics
C.1 Global debt securities markets .......................................................................................... A11
C.2 Total debt securities, by sector of issuer ....................................................................... A11
C.3 Net issuance of international debt securities .............................................................. A12
C.4 International debt securities issued by financial and non-financial corporations .............................................................................................................................. A12
D Derivatives statistics
D.1 Exchange-traded derivatives .............................................................................................. A13
A2 BIS Quarterly Review, June 2019
D.2 Global OTC derivatives markets ....................................................................................... A14
D.3 OTC foreign exchange derivatives ................................................................................... A14
D.4 OTC interest rate derivatives .............................................................................................. A15
D.5 OTC equity-linked derivatives ........................................................................................... A15
D.6 OTC commodity derivatives ............................................................................................... A16
D.7 Credit default swaps .............................................................................................................. A16
D.8 Concentration in global OTC derivatives markets ..................................................... A17
D.9 Growth of central clearing .................................................................................................. A17
E Global liquidity indicators
E.1 Growth of international bank credit................................................................................ A18
E.2 Global bank credit to the private non-financial sector, by residence of borrower .................................................................................................................................... A19
E.3 Global credit to the non-financial sector, by currency ............................................ A20
E.4 US dollar-denominated credit to non-banks outside the United States ......... A21
E.5 Foreign currency credit to non-banks in EMDEs ...................................................... A21
F Statistics on total credit to the non-financial sector
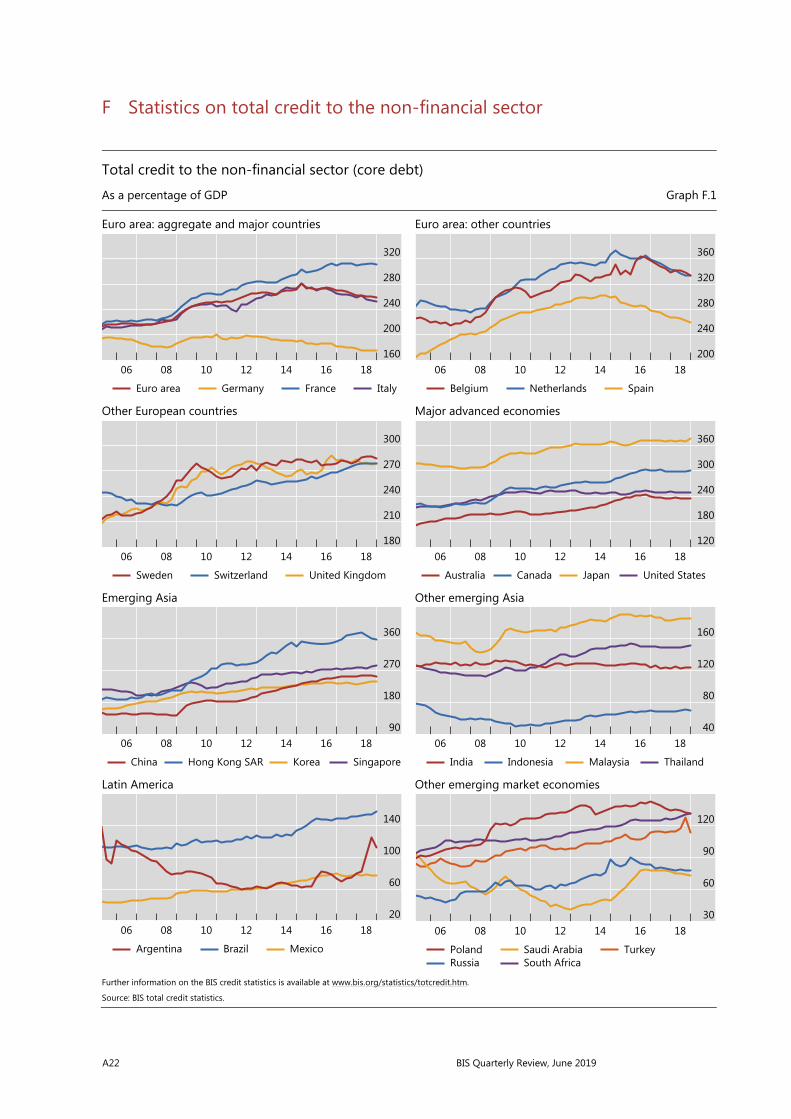
F.1 Total credit to the non-financial sector (core debt) ................................................. A22
F.2 Total credit to the private non-financial sector (core debt) ................................. A23
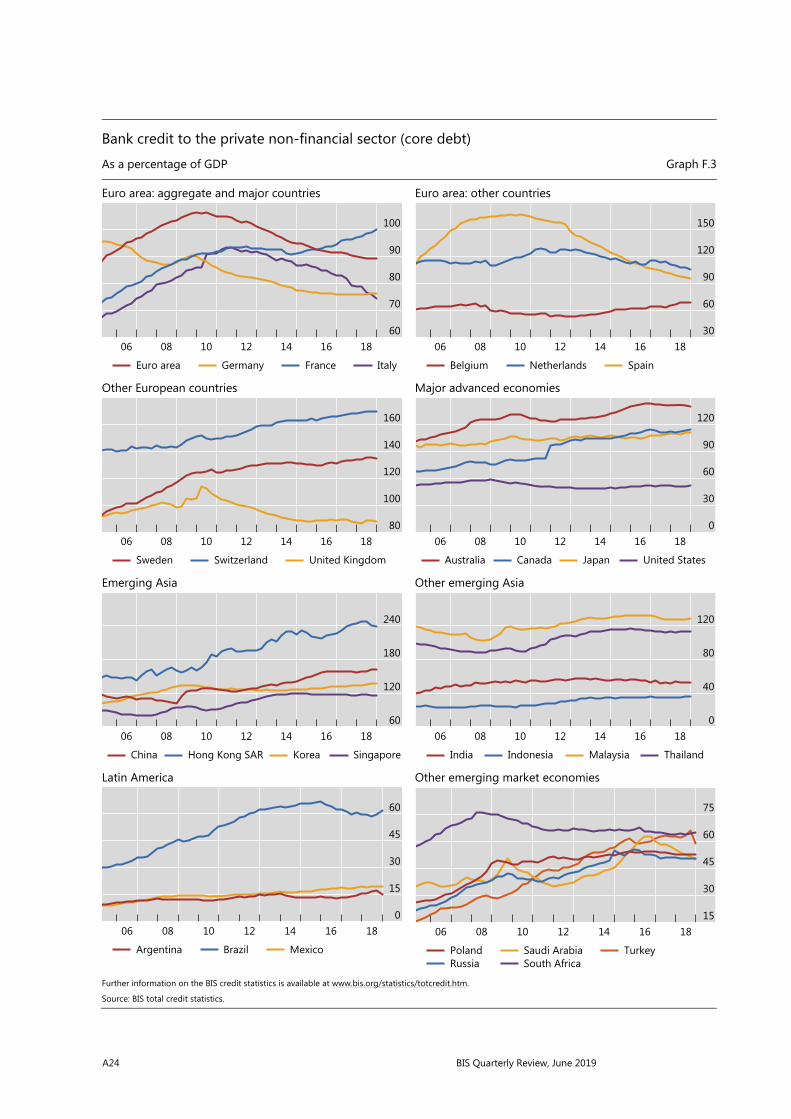
F.3 Bank credit to the private non-financial sector (core debt) .................................. A24
F.4 Total credit to households (core debt) .......................................................................... A25
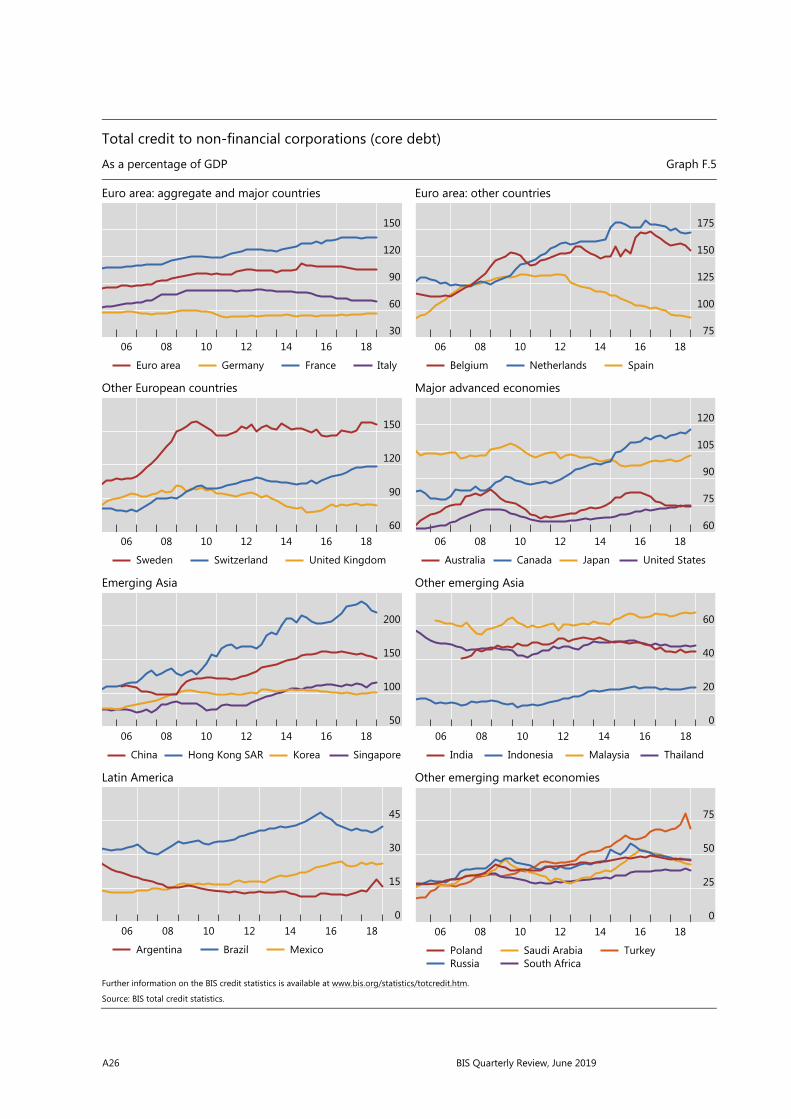
F.5 Total credit to non-financial corporations (core debt) ............................................ A26
F.6 Total credit to the government sector at market value (core debt) .................. A27
F.7 Total credit to the government sector at nominal value (core debt) ................ A28
G Debt service ratios for the private non-financial sector
G.1 Debt service ratios of the private non-financial sector ........................................... A29
G.2 Debt service ratios of households ................................................................................... A30
G.3 Debt service ratios of non-financial corporations ..................................................... A31
BIS Quarterly Review, June 2019 A3
H Property price statistics
H.1 Real residential property prices ........................................................................................ A32
I Effective and US dollar exchange rate statistics
I.1 Real effective exchange rates ............................................................................................ A33
I.2 US dollar exchange rates ..................................................................................................... A34
J Credit-to-GDP gaps
J.1 Credit-to-GDP gaps ............................................................................................................... A35
K Consumer price indices
K.1 Consumer prices ..................................................................................................................... A36
L Central bank policy rates
L.1 Central bank policy or representative rates ................................................................. A37
A4 BIS Quarterly Review, June 2019
A Locational banking statistics
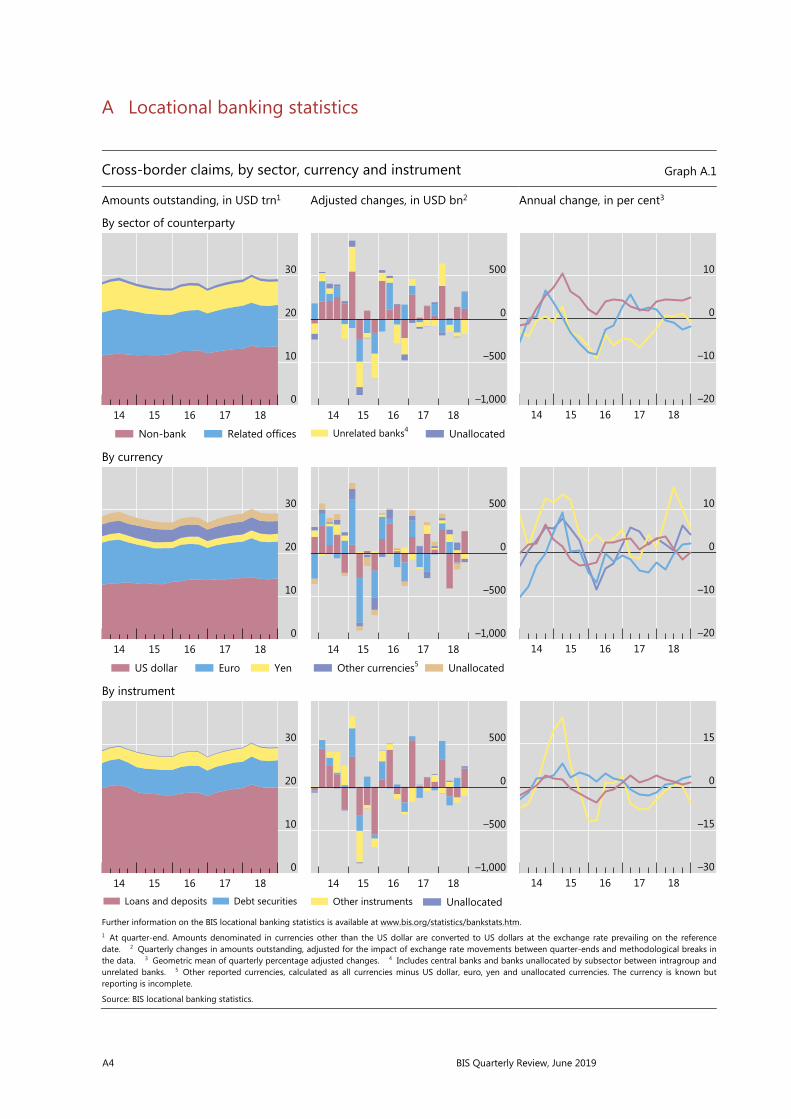
Cross-border claims, by sector, currency and instrument Graph A.1
Amounts outstanding, in USD trn1 Adjusted changes, in USD bn2 Annual change, in per cent3
By sector of counterparty
By currency
By instrument
Further information on the BIS locational banking statistics is available at www.bis.org/statistics/bankstats.htm. 1 At quarter-end. Amounts denominated in currencies other than the US dollar are converted to US dollars at the exchange rate prevailing on the reference date. 2 Quarterly changes in amounts outstanding, adjusted for the impact of exchange rate movements between quarter-ends and methodological breaks in the data. 3 Geometric mean of quarterly percentage adjusted changes. 4 Includes central banks and banks unallocated by subsector between intragroup and unrelated banks. 5 Other reported currencies, calculated as all currencies minus US dollar, euro, yen and unallocated currencies. The currency is known but reporting is incomplete.
Source: BIS locational banking statistics.
30
20
10
01817161514
Non-bank Related offices
500
0
–500
–1,0001817161514
Unrelated banks4 Unallocated
10
0
–10
–201817161514
30
20
10
01817161514
US dollar Euro Yen
500
0
–500
–1,0001817161514
Other currencies5 Unallocated
10
0
–10
–201817161514
30
20
10
01817161514
Loans and deposits Debt securities
500
0
–500
–1,0001817161514
Other instruments Unallocated
15
0
–15
–301817161514
BIS Quarterly Review, June 2019 A5
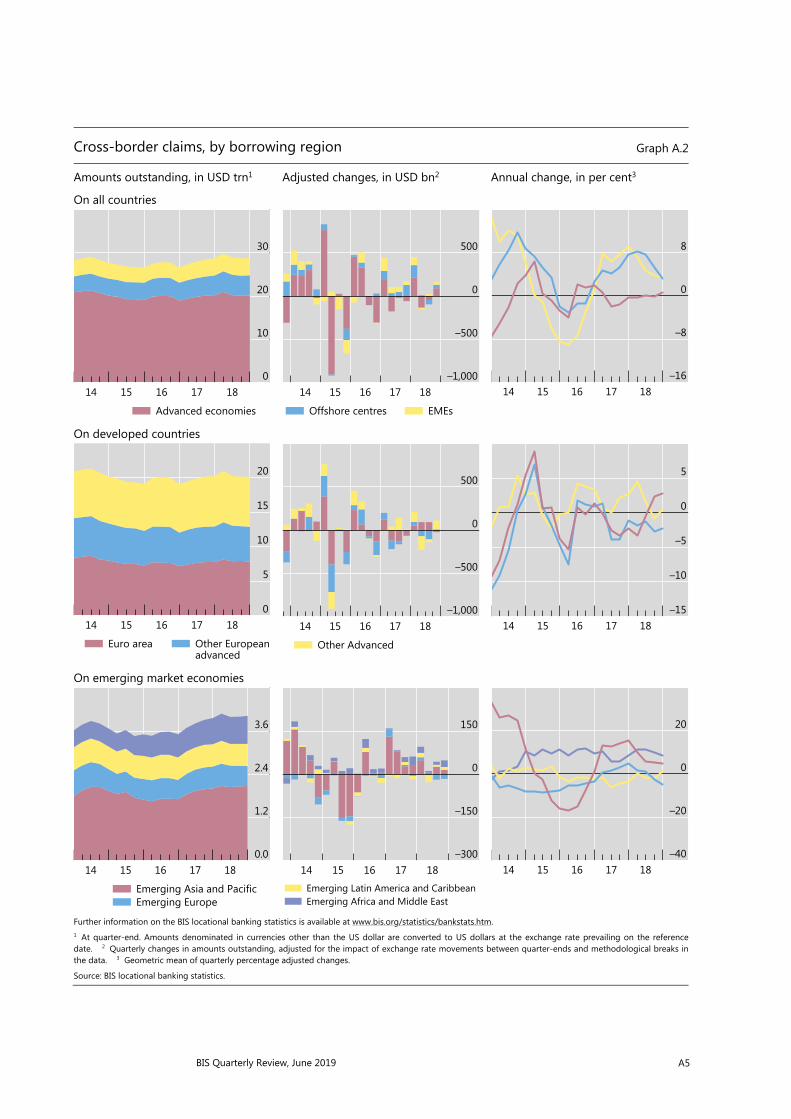
Cross-border claims, by borrowing region Graph A.2
Amounts outstanding, in USD trn1 Adjusted changes, in USD bn2 Annual change, in per cent3
On all countries
On developed countries
On emerging market economies
Further information on the BIS locational banking statistics is available at www.bis.org/statistics/bankstats.htm. 1 At quarter-end. Amounts denominated in currencies other than the US dollar are converted to US dollars at the exchange rate prevailing on the reference date. 2 Quarterly changes in amounts outstanding, adjusted for the impact of exchange rate movements between quarter-ends and methodological breaks in the data. 3 Geometric mean of quarterly percentage adjusted changes.
Source: BIS locational banking statistics.
30
20
10
01817161514
Advanced economies
500
0
–500
–1,0001817161514
Offshore centres EMEs
8
0
–8
–161817161514
20
15
10
5
01817161514
Euro areaadvancedOther European
500
0
–500
–1,0001817161514
Other Advanced
5
0
–5
–10
–151817161514
3.6
2.4
1.2
0.01817161514
Emerging Asia and PacificEmerging Europe
150
0
–150
–3001817161514
Emerging Latin America and CaribbeanEmerging Africa and Middle East
20
0
–20
–401817161514
A6 BIS Quarterly Review, June 2019
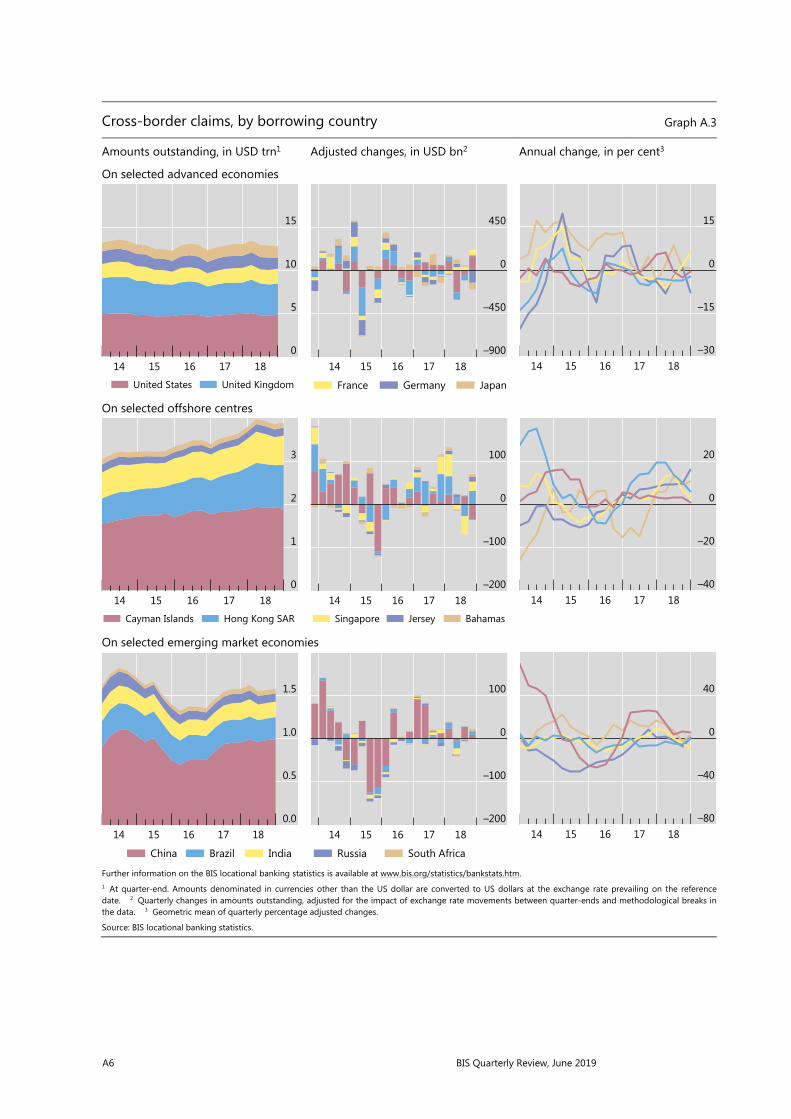
Cross-border claims, by borrowing country Graph A.3
Amounts outstanding, in USD trn1 Adjusted changes, in USD bn2 Annual change, in per cent3
On selected advanced economies
On selected offshore centres
On selected emerging market economies
Further information on the BIS locational banking statistics is available at www.bis.org/statistics/bankstats.htm. 1 At quarter-end. Amounts denominated in currencies other than the US dollar are converted to US dollars at the exchange rate prevailing on the reference date. 2 Quarterly changes in amounts outstanding, adjusted for the impact of exchange rate movements between quarter-ends and methodological breaks in the data. 3 Geometric mean of quarterly percentage adjusted changes.
Source: BIS locational banking statistics.
15
10
5
01817161514
United States United Kingdom
450
0
–450
–9001817161514
France Germany Japan
15
0
–15
–301817161514
3
2
1
01817161514
Cayman Islands Hong Kong SAR
100
0
–100
–2001817161514
Singapore Jersey Bahamas
20
0
–20
–401817161514
1.5
1.0
0.5
0.01817161514
China Brazil India
100
0
–100
–2001817161514
Russia South Africa
40
0
–40
–801817161514
BIS Quarterly Review, June 2019 A7
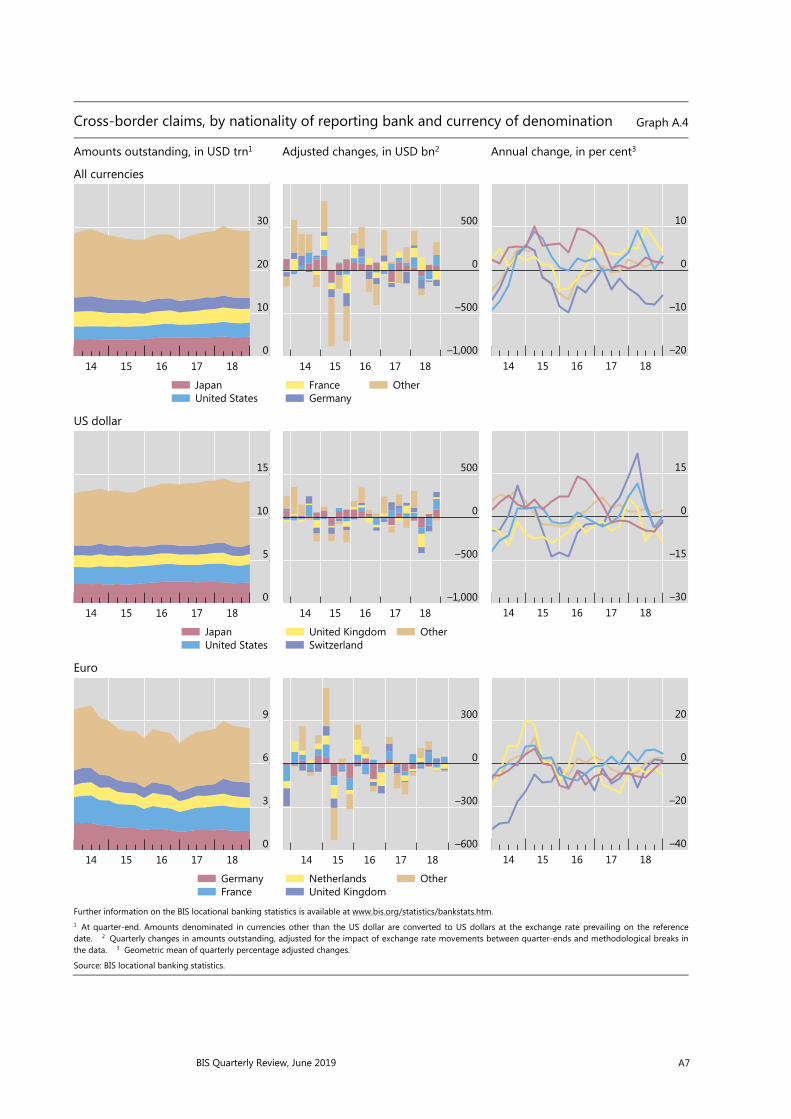
Cross-border claims, by nationality of reporting bank and currency of denomination Graph A.4
Amounts outstanding, in USD trn1 Adjusted changes, in USD bn2 Annual change, in per cent3
All currencies
US dollar
Euro
Further information on the BIS locational banking statistics is available at www.bis.org/statistics/bankstats.htm. 1 At quarter-end. Amounts denominated in currencies other than the US dollar are converted to US dollars at the exchange rate prevailing on the reference date. 2 Quarterly changes in amounts outstanding, adjusted for the impact of exchange rate movements between quarter-ends and methodological breaks in the data. 3 Geometric mean of quarterly percentage adjusted changes.
Source: BIS locational banking statistics.
30
20
10
01817161514
JapanUnited States
500
0
–500
–1,0001817161514
FranceGermany
Other
10
0
–10
–201817161514
15
10
5
01817161514
JapanUnited States
500
0
–500
–1,0001817161514
United KingdomSwitzerland
Other
15
0
–15
–301817161514
9
6
3
01817161514
GermanyFrance
300
0
–300
–6001817161514
NetherlandsUnited Kingdom
Other
20
0
–20
–401817161514
A8 BIS Quarterly Review, June 2019
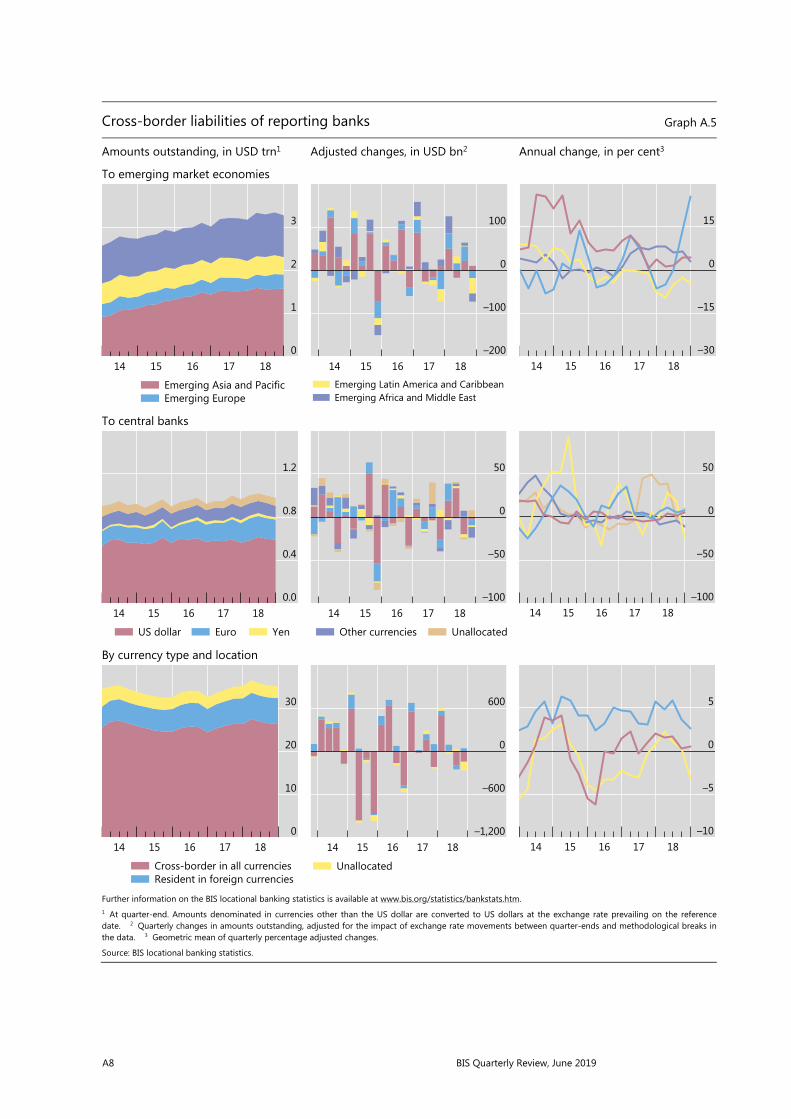
Cross-border liabilities of reporting banks Graph A.5
Amounts outstanding, in USD trn1 Adjusted changes, in USD bn2 Annual change, in per cent3
To emerging market economies
To central banks
By currency type and location
Further information on the BIS locational banking statistics is available at www.bis.org/statistics/bankstats.htm. 1 At quarter-end. Amounts denominated in currencies other than the US dollar are converted to US dollars at the exchange rate prevailing on the reference date. 2 Quarterly changes in amounts outstanding, adjusted for the impact of exchange rate movements between quarter-ends and methodological breaks in the data. 3 Geometric mean of quarterly percentage adjusted changes.
Source: BIS locational banking statistics.
3
2
1
01817161514
Emerging Asia and PacificEmerging Europe
100
0
–100
–2001817161514
Emerging Latin America and CaribbeanEmerging Africa and Middle East
15
0
–15
–301817161514
1.2
0.8
0.4
0.01817161514
US dollar Euro Yen
50
0
–50
–1001817161514
Other currencies Unallocated
50
0
–50
–1001817161514
30
20
10
01817161514
Cross-border in all currenciesResident in foreign currencies
600
0
–600
–1,2001817161514
Unallocated
5
0
–5
–101817161514
BIS Quarterly Review, June 2019 A9
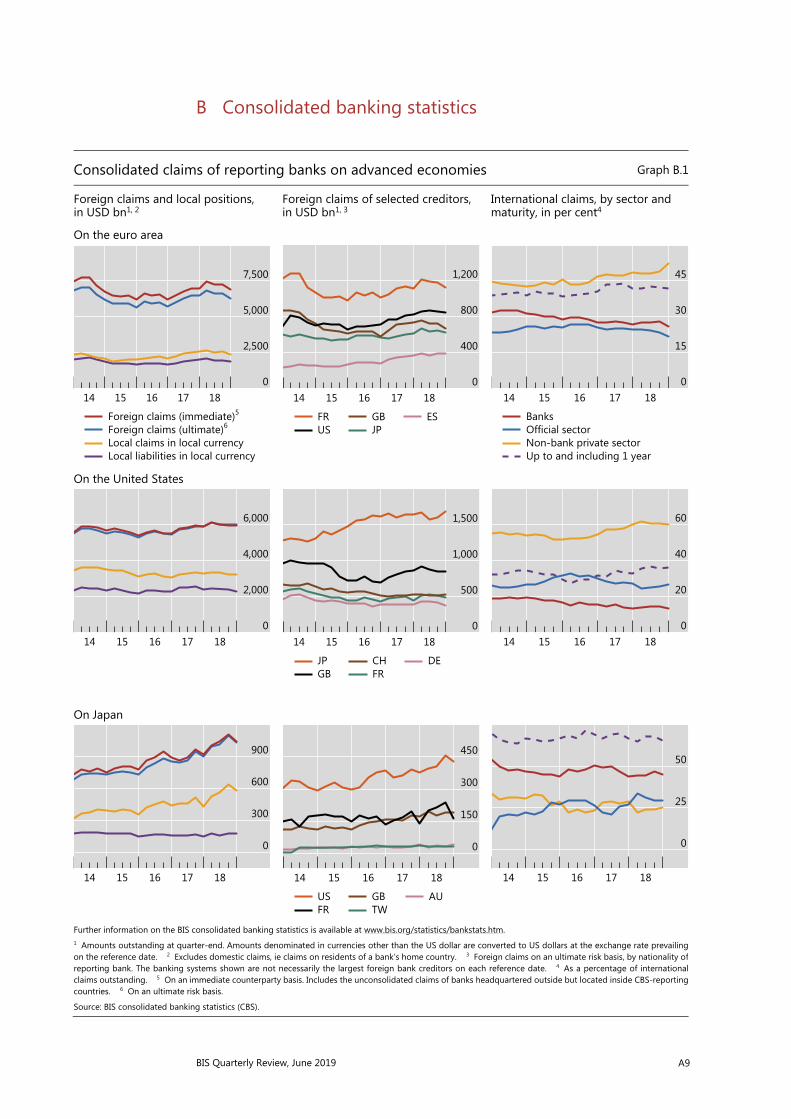
B Consolidated banking statistics
Consolidated claims of reporting banks on advanced economies Graph B.1
Foreign claims and local positions, in USD bn1, 2
Foreign claims of selected creditors,in USD bn1, 3
International claims, by sector and maturity, in per cent4
On the euro area
On the United States
On Japan
Further information on the BIS consolidated banking statistics is available at www.bis.org/statistics/bankstats.htm. 1 Amounts outstanding at quarter-end. Amounts denominated in currencies other than the US dollar are converted to US dollars at the exchange rate prevailing on the reference date. 2 Excludes domestic claims, ie claims on residents of a bank’s home country. 3 Foreign claims on an ultimate risk basis, by nationality of reporting bank. The banking systems shown are not necessarily the largest foreign bank creditors on each reference date. 4 As a percentage of international claims outstanding. 5 On an immediate counterparty basis. Includes the unconsolidated claims of banks headquartered outside but located inside CBS-reporting countries. 6 On an ultimate risk basis.
Source: BIS consolidated banking statistics (CBS).
7,500
5,000
2,500
01817161514
Foreign claims (immediate)5
Foreign claims (ultimate)6
Local claims in local currencyLocal liabilities in local currency
1,200
800
400
01817161514
FRUS
GBJP
ES
45
30
15
01817161514
BanksOfficial sectorNon-bank private sectorUp to and including 1 year
6,000
4,000
2,000
01817161514
1,500
1,000
500
01817161514
JPGB
CHFR
DE
60
40
20
01817161514
900
600
300
0
1817161514
450
300
150
0
1817161514
USFR
GBTW
AU
50
25
0
1817161514

A10 BIS Quarterly Review, June 2019
Consolidated claims of reporting banks on emerging market economies Graph B.2
Foreign claims and local positions, in USD bn1, 2
Foreign claims of selected creditors,in USD bn1, 3
International claims, by sector and maturity, in per cent4
On China
On Turkey
On Brazil
Further information on the BIS consolidated banking statistics is available at www.bis.org/statistics/bankstats.htm. 1 Amounts outstanding at quarter-end. Amounts denominated in currencies other than the US dollar are converted to US dollars at the exchange rate prevailing on the reference date. 2 Excludes domestic claims, ie claims on residents of a bank’s home country. 3 Foreign claims on an ultimate risk basis, by nationality of reporting bank. The banking systems shown are not necessarily the largest foreign bank creditors on each reference date. 4 As a percentage of international claims. 5 On an immediate counterparty basis. Includes the unconsolidated claims of banks headquartered outside but located inside CBS-reporting countries. 6 On an ultimate risk basis.
Source: BIS consolidated banking statistics (CBS).
1,200
800
400
0
1817161514
Foreign claims (immediate)5
Foreign claims (ultimate)6
Local claims in local currencyLocal liabilities in local currency
180
120
60
0
1817161514
GBUS
JPTW
FR
75
50
25
0
1817161514
BanksOfficial sectorNon-bank private sectorUp to and including 1 year
300
200
100
0
1817161514
75
50
25
0
1817161514
ESFR
GBUS
DE
60
40
20
0
1817161514
450
300
150
0
1817161514
180
120
60
0
1817161514
ESUS
GBJP
FR
60
40
20
0
1817161514
BIS Quarterly Review, June 2019 A11
C Debt securities statistics
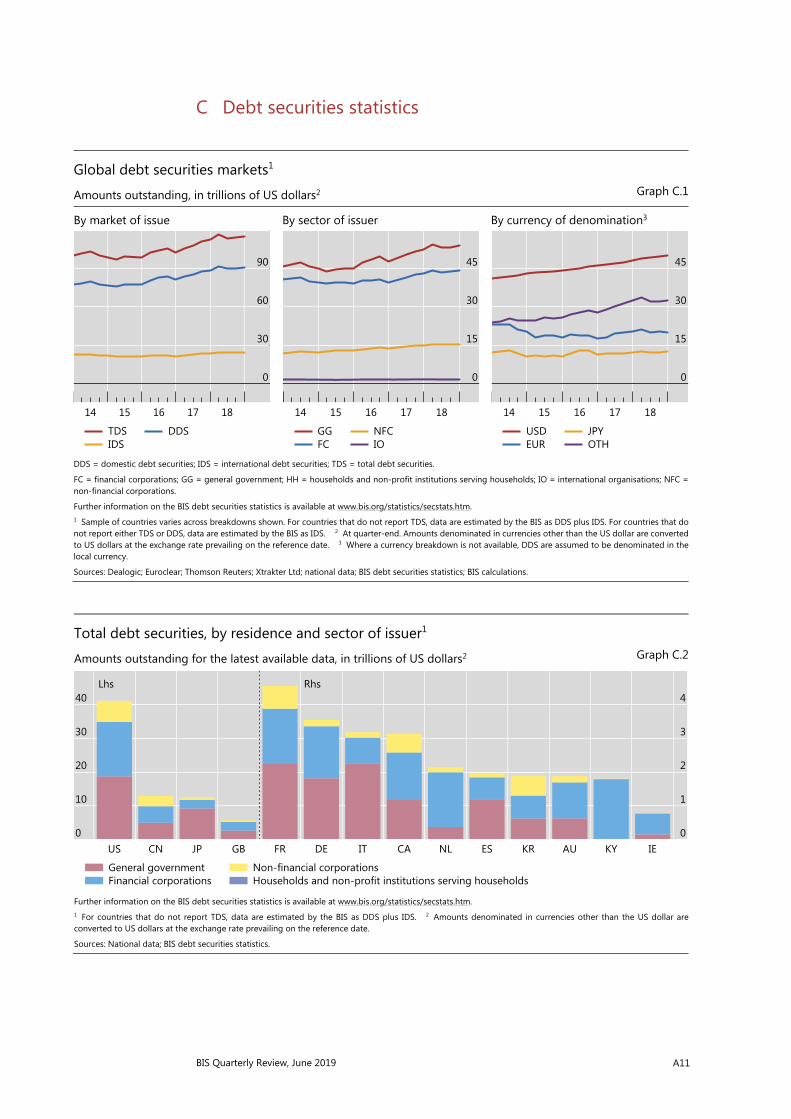
Global debt securities markets1
Amounts outstanding, in trillions of US dollars2 Graph C.1
By market of issue By sector of issuer By currency of denomination3
DDS = domestic debt securities; IDS = international debt securities; TDS = total debt securities.
FC = financial corporations; GG = general government; HH = households and non-profit institutions serving households; IO = international organisations; NFC = non-financial corporations.
Further information on the BIS debt securities statistics is available at www.bis.org/statistics/secstats.htm. 1 Sample of countries varies across breakdowns shown. For countries that do not report TDS, data are estimated by the BIS as DDS plus IDS. For countries that do not report either TDS or DDS, data are estimated by the BIS as IDS. 2 At quarter-end. Amounts denominated in currencies other than the US dollar are converted to US dollars at the exchange rate prevailing on the reference date. 3 Where a currency breakdown is not available, DDS are assumed to be denominated in thelocal currency.
Sources: Dealogic; Euroclear; Thomson Reuters; Xtrakter Ltd; national data; BIS debt securities statistics; BIS calculations.
Total debt securities, by residence and sector of issuer1
Amounts outstanding for the latest available data, in trillions of US dollars2 Graph C.2
Further information on the BIS debt securities statistics is available at www.bis.org/statistics/secstats.htm. 1 For countries that do not report TDS, data are estimated by the BIS as DDS plus IDS. 2 Amounts denominated in currencies other than the US dollar are converted to US dollars at the exchange rate prevailing on the reference date.
Sources: National data; BIS debt securities statistics.
90
60
30
0
1817161514
TDSIDS
DDS
45
30
15
0
1817161514
GGFC
NFCIO
45
30
15
0
1817161514
USDEUR
JPYOTH
40
30
20
10
0
4
3
2
1
0IEKYAUKRESNLCAITDEFRGBJPCNUS
Lhs Rhs
General governmentFinancial corporations
Non-financial corporationsHouseholds and non-profit institutions serving households
A12 BIS Quarterly Review, June 2019
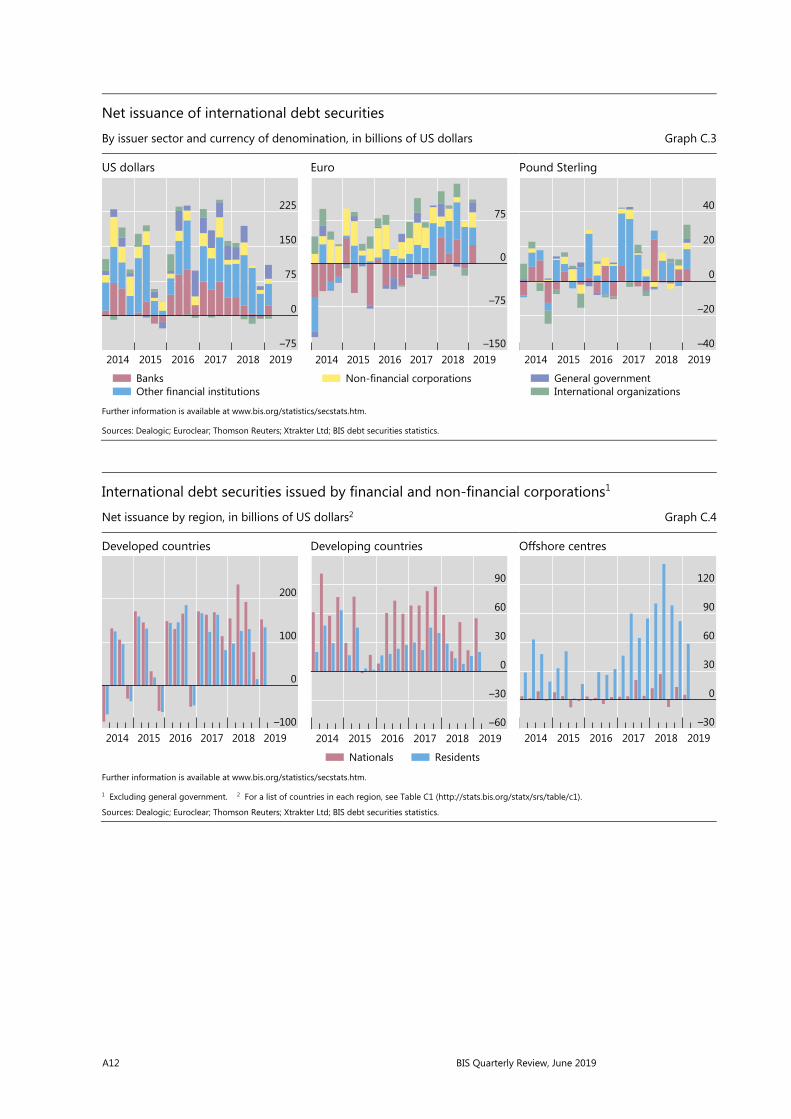
Net issuance of international debt securities
By issuer sector and currency of denomination, in billions of US dollars Graph C.3
US dollars Euro Pound Sterling
Further information is available at www.bis.org/statistics/secstats.htm.
Sources: Dealogic; Euroclear; Thomson Reuters; Xtrakter Ltd; BIS debt securities statistics.
International debt securities issued by financial and non-financial corporations1
Net issuance by region, in billions of US dollars2 Graph C.4
Developed countries Developing countries Offshore centres
Further information is available at www.bis.org/statistics/secstats.htm.
1 Excluding general government. 2 For a list of countries in each region, see Table C1 (http://stats.bis.org/statx/srs/table/c1).
Sources: Dealogic; Euroclear; Thomson Reuters; Xtrakter Ltd; BIS debt securities statistics.
225
150
75
0
–75201920182017201620152014
BanksOther financial institutions
75
0
–75
–150201920182017201620152014
Non-financial corporations
40
20
0
–20
–40201920182017201620152014
General governmentInternational organizations
200
100
0
–100201920182017201620152014
90
60
30
0
–30
–60201920182017201620152014
Nationals Residents
120
90
60
30
0
–30201920182017201620152014
BIS Quarterly Review, June 2019 A13
D Derivatives statistics
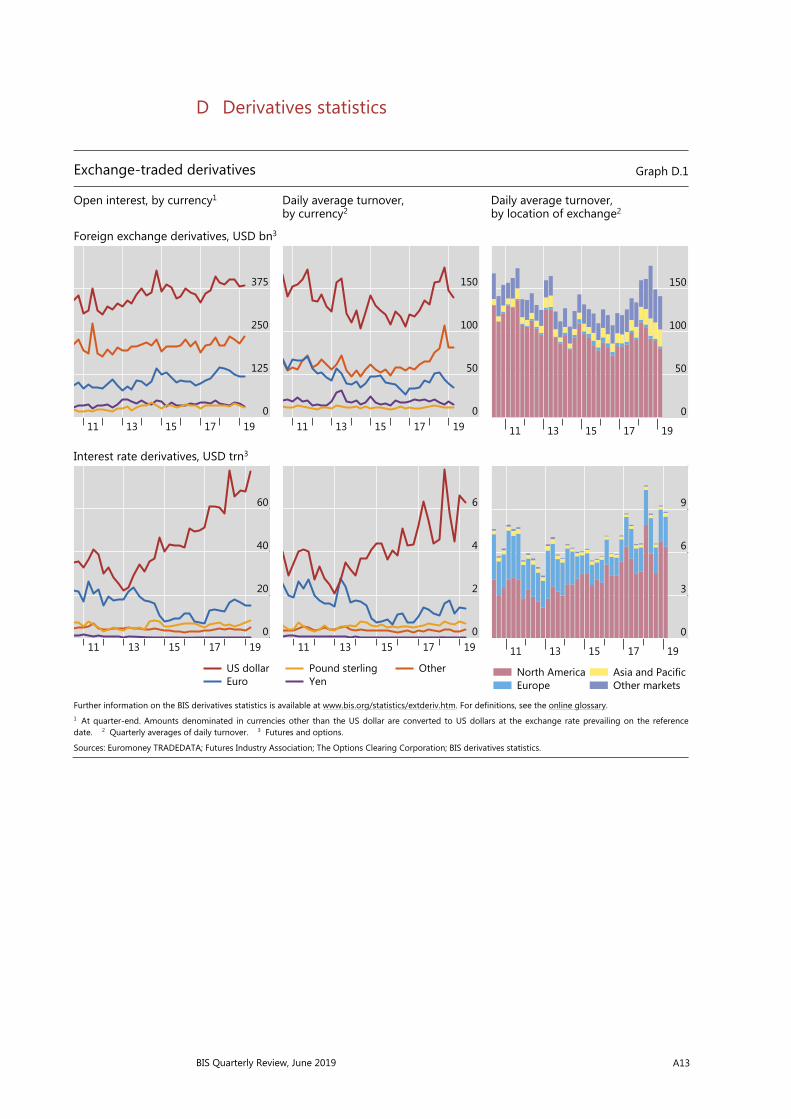
Exchange-traded derivatives Graph D.1
Open interest, by currency1 Daily average turnover, by currency2
Daily average turnover, by location of exchange2
Foreign exchange derivatives, USD bn3
Interest rate derivatives, USD trn3
Further information on the BIS derivatives statistics is available at www.bis.org/statistics/extderiv.htm. For definitions, see the online glossary. 1 At quarter-end. Amounts denominated in currencies other than the US dollar are converted to US dollars at the exchange rate prevailing on the reference date. 2 Quarterly averages of daily turnover. 3 Futures and options.
Sources: Euromoney TRADEDATA; Futures Industry Association; The Options Clearing Corporation; BIS derivatives statistics.
375
250
125
01917151311
150
100
50
01917151311
150
100
50
0
1917151311
60
40
20
01917151311
US dollarEuro
6
4
2
01917151311
Pound sterlingYen
Other
9
6
3
0
1917151311
North AmericaEurope
Asia and PacificOther markets
A14 BIS Quarterly Review, June 2019
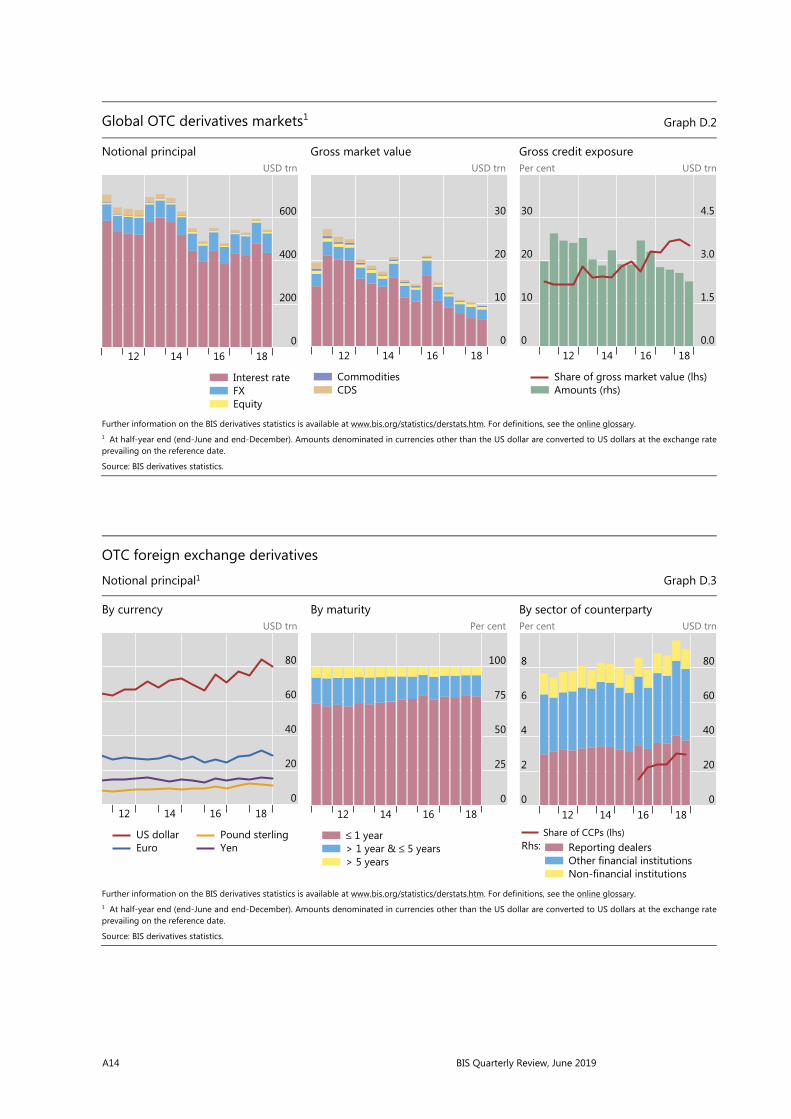
Global OTC derivatives markets1 Graph D.2
Notional principal Gross market value Gross credit exposure USD trn USD trn Per cent USD trn
Further information on the BIS derivatives statistics is available at www.bis.org/statistics/derstats.htm. For definitions, see the online glossary. 1 At half-year end (end-June and end-December). Amounts denominated in currencies other than the US dollar are converted to US dollars at the exchange rateprevailing on the reference date.
Source: BIS derivatives statistics.
OTC foreign exchange derivatives
Notional principal1 Graph D.3
By currency By maturity By sector of counterparty USD trn Per cent Per cent USD trn
Further information on the BIS derivatives statistics is available at www.bis.org/statistics/derstats.htm. For definitions, see the online glossary. 1 At half-year end (end-June and end-December). Amounts denominated in currencies other than the US dollar are converted to US dollars at the exchange rate prevailing on the reference date.
Source: BIS derivatives statistics.
600
400
200
018161412
Interest rateFXEquity
30
20
10
018161412
CommoditiesCDS
30
20
10
0
4.5
3.0
1.5
0.018161412
Share of gross market value (lhs)Amounts (rhs)
80
60
40
20
018161412
US dollarEuro
Pound sterlingYen
100
75
50
25
018161412
≤ 1 year> 1 year & ≤ 5 years> 5 years
8
6
4
2
0
80
60
40
20
018161412
Rhs:Share of CCPs (lhs)
Reporting dealersOther financial institutionsNon-financial institutions
BIS Quarterly Review, June 2019 A15
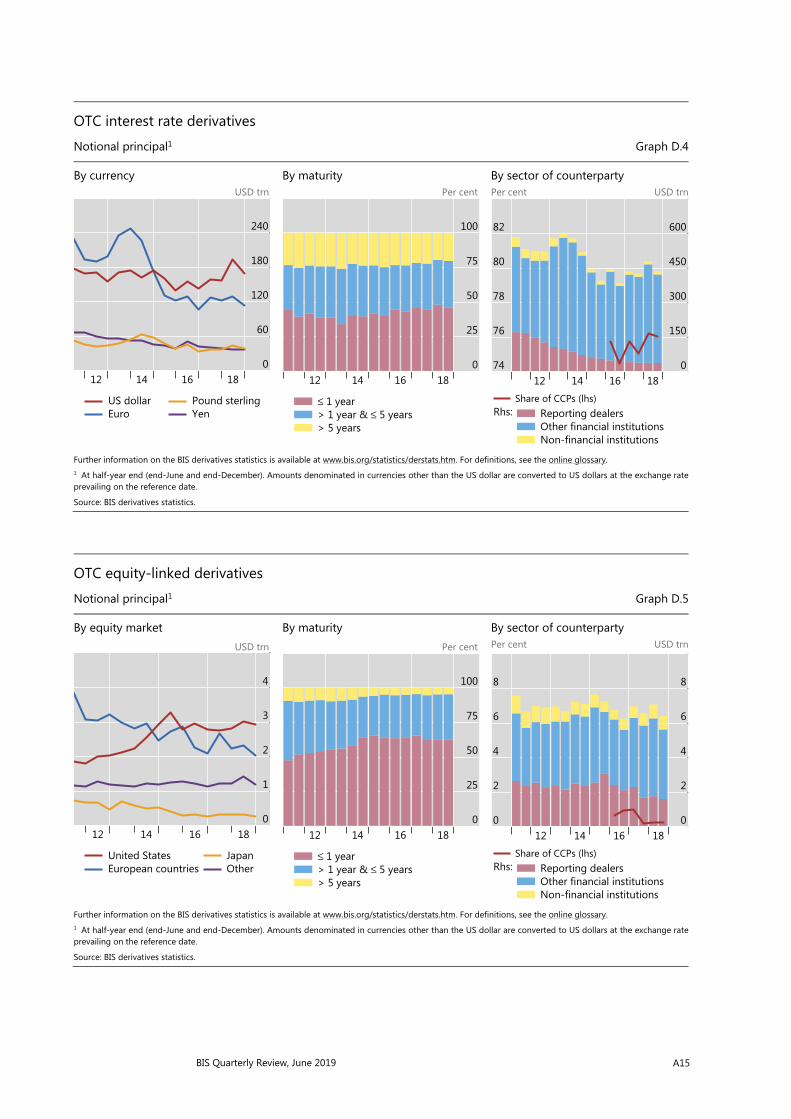
OTC interest rate derivatives
Notional principal1 Graph D.4
By currency By maturity By sector of counterparty USD trn Per cent Per cent USD trn
Further information on the BIS derivatives statistics is available at www.bis.org/statistics/derstats.htm. For definitions, see the online glossary. 1 At half-year end (end-June and end-December). Amounts denominated in currencies other than the US dollar are converted to US dollars at the exchange rateprevailing on the reference date.
Source: BIS derivatives statistics.
OTC equity-linked derivatives
Notional principal1 Graph D.5
By equity market By maturity By sector of counterparty USD trn Per cent Per cent USD trn
Further information on the BIS derivatives statistics is available at www.bis.org/statistics/derstats.htm. For definitions, see the online glossary. 1 At half-year end (end-June and end-December). Amounts denominated in currencies other than the US dollar are converted to US dollars at the exchange rate prevailing on the reference date.
Source: BIS derivatives statistics.
240
180
120
60
018161412
US dollarEuro
Pound sterlingYen
100
75
50
25
018161412
≤ 1 year> 1 year & ≤ 5 years> 5 years
82
80
78
76
74
600
450
300
150
018161412
Rhs:Share of CCPs (lhs)
Reporting dealersOther financial institutionsNon-financial institutions
4
3
2
1
018161412
United StatesEuropean countries
JapanOther
100
75
50
25
018161412
≤ 1 year> 1 year & ≤ 5 years> 5 years
8
6
4
2
0
8
6
4
2
018161412
Rhs:Share of CCPs (lhs)
Reporting dealersOther financial institutionsNon-financial institutions
A16 BIS Quarterly Review, June 2019
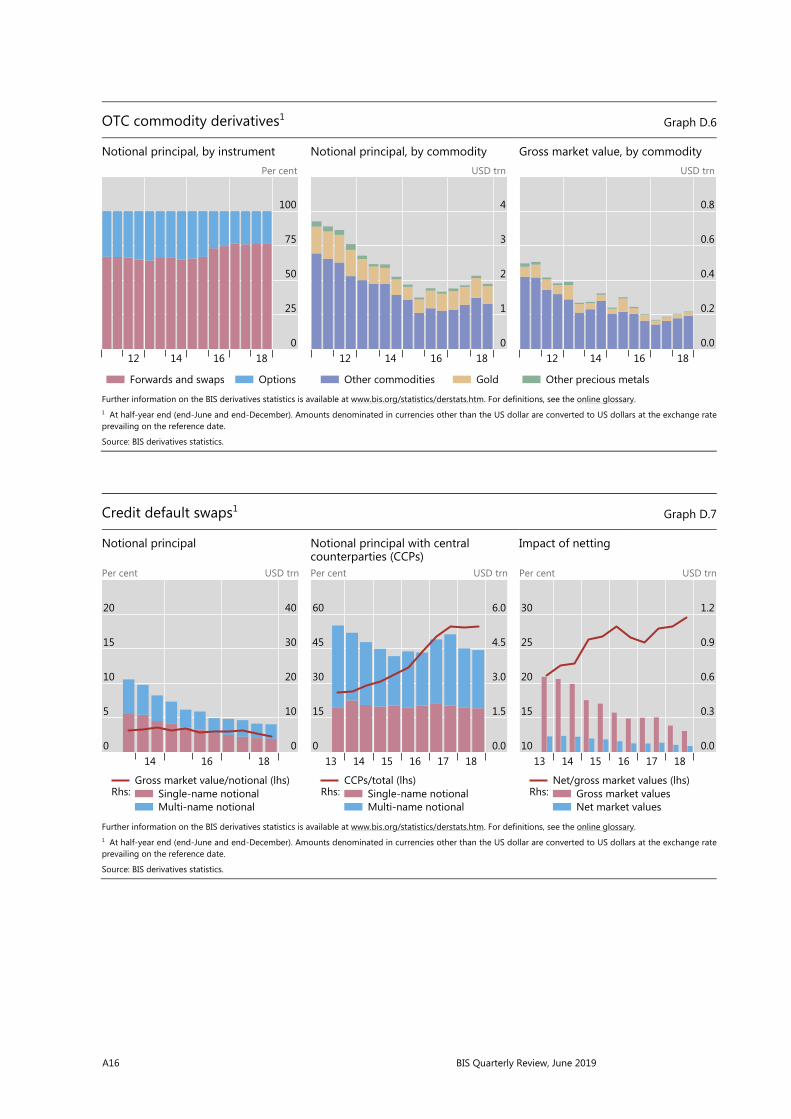
OTC commodity derivatives1 Graph D.6
Notional principal, by instrument Notional principal, by commodity Gross market value, by commodity Per cent USD trn USD trn
Further information on the BIS derivatives statistics is available at www.bis.org/statistics/derstats.htm. For definitions, see the online glossary. 1 At half-year end (end-June and end-December). Amounts denominated in currencies other than the US dollar are converted to US dollars at the exchange rate prevailing on the reference date.
Source: BIS derivatives statistics.
Credit default swaps1 Graph D.7
Notional principal Notional principal with central counterparties (CCPs)
Impact of netting
Per cent USD trn Per cent USD trn Per cent USD trn
Further information on the BIS derivatives statistics is available at www.bis.org/statistics/derstats.htm. For definitions, see the online glossary. 1 At half-year end (end-June and end-December). Amounts denominated in currencies other than the US dollar are converted to US dollars at the exchange rate prevailing on the reference date.
Source: BIS derivatives statistics.
100
75
50
25
018161412
Forwards and swaps Options
4
3
2
1
018161412
Other commodities Gold
0.8
0.6
0.4
0.2
0.018161412
Other precious metals
20
15
10
5
0
40
30
20
10
0181614
Rhs:Gross market value/notional (lhs)
Single-name notionalMulti-name notional
60
45
30
15
0
6.0
4.5
3.0
1.5
0.0181716151413
Rhs:CCPs/total (lhs)
Single-name notionalMulti-name notional
30
25
20
15
10
1.2
0.9
0.6
0.3
0.0181716151413
Rhs:Net/gross market values (lhs)
Gross market valuesNet market values

BIS Quarterly Review, June 2019 A17
Growth of central clearing
Notional amounts outstanding by counterparty, in per cent Graph D.9
Interest rate derivatives Credit default swaps
Further information on the BIS derivatives statistics is available at www.bis.org/statistics/derstats.htm. For definitions, see the online glossary. 1 As a percentage of notional amounts outstanding against all counterparties. 2 Including central counterparties but excluding reporting dealers. 3 For interest rate derivatives, data for CCPs prior to end-June 2016 are estimated by indexing the amounts reported at end-June 2016 to the growth since 2008 of notional amounts outstanding cleared through LCH’s SwapClear service. 4 Proportion of trades that are cleared, estimated as (CCP / 2) / (1 – (CCP / 2)), where CCP represents the share of notional amounts outstanding that dealers report against CCPs. CCPs’ share is halved to adjust for the potential double-counting of inter-dealer trades novated to CCPs.
Sources: LCH.Clearnet Group Ltd; BIS OTC derivatives statistics (Table D7 and Table D10.1); BIS calculations.
80
60
40
20
018161412100806
Reporting dealers1
Other financial institutions1, 2
80
60
40
20
018161412100806
Central counterparties1, 3
Estimated minimum clearing rate4
Concentration in global OTC derivatives markets
Herfindahl index1 Graph D.8
Foreign exchange derivatives2 Interest rate swaps Equity-linked options
Further information on the BIS derivatives statistics is available at www.bis.org/statistics/derstats.htm. For definitions, see the online glossary. 1 The index ranges from 0 to 10,000, where a lower number indicates that there are many dealers with similar market shares (as measured by notional principal)and a higher number indicates that the market is dominated by a few reporting dealers. 2 Foreign exchange forwards, foreign exchange swaps and currency swaps.
Source: BIS derivatives statistics.
1,000
800
600
40018161412
USDEUR
GBPJPY
1,400
1,000
600
20018161412
CHFCAD
SEK
6,400
4,400
2,400
40018161412
United StatesJapanEurope
Latin AmericaOther Asia

A18 BIS Quarterly Review, June 2019
E Global liquidity indicators
US dollar credit outside the United States1
Annual change, in per cent Graph E.1
Further information on the BIS global liquidity indicators is available at www.bis.org/statistics/gli.htm. 1 Annual growth of US dollar-denominated credit to non-banks outside the United States. 2 Annual growth of the US dollar nominal effective exchange rate.
Sources: Datastream; Dealogic; Euroclear; Thomson Reuters; Xtrakter Ltd; national data; BIS locational banking statistics; BIS effective exchange rate statistics; BIS calculations.
20
10
0
–10
–20201820162014201220102008200620042002
Total credit Loans Debt securities NEER2
BIS Quarterly Review, June 2019 A19
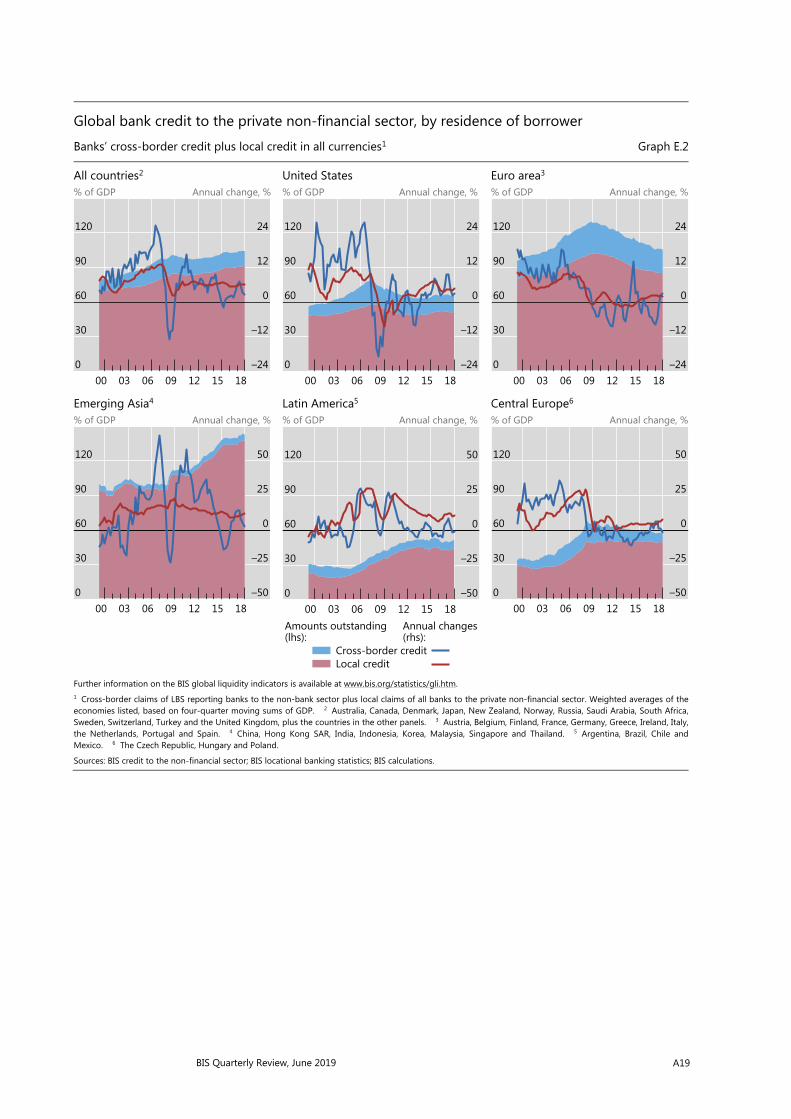
Global bank credit to the private non-financial sector, by residence of borrower
Banks’ cross-border credit plus local credit in all currencies1 Graph E.2
All countries2 United States Euro area3
% of GDP Annual change, % % of GDP Annual change, % % of GDP Annual change, %
Emerging Asia4 Latin America5 Central Europe6
% of GDP Annual change, % % of GDP Annual change, % % of GDP Annual change, %
Further information on the BIS global liquidity indicators is available at www.bis.org/statistics/gli.htm. 1 Cross-border claims of LBS reporting banks to the non-bank sector plus local claims of all banks to the private non-financial sector. Weighted averages of the economies listed, based on four-quarter moving sums of GDP. 2 Australia, Canada, Denmark, Japan, New Zealand, Norway, Russia, Saudi Arabia, South Africa,Sweden, Switzerland, Turkey and the United Kingdom, plus the countries in the other panels. 3 Austria, Belgium, Finland, France, Germany, Greece, Ireland, Italy, the Netherlands, Portugal and Spain. 4 China, Hong Kong SAR, India, Indonesia, Korea, Malaysia, Singapore and Thailand. 5 Argentina, Brazil, Chile and Mexico. 6 The Czech Republic, Hungary and Poland.
Sources: BIS credit to the non-financial sector; BIS locational banking statistics; BIS calculations.
120
90
60
30
0
24
12
0
–12
–2418151209060300
120
90
60
30
0
24
12
0
–12
–2418151209060300
120
90
60
30
0
24
12
0
–12
–2418151209060300
120
90
60
30
0
50
25
0
–25
–5018151209060300
120
90
60
30
0
50
25
0
–25
–5018151209060300
(rhs):Annual changes
(lhs):Amounts outstanding
Cross-border creditLocal credit
120
90
60
30
0
50
25
0
–25
–5018151209060300
A20 BIS Quarterly Review, June 2019
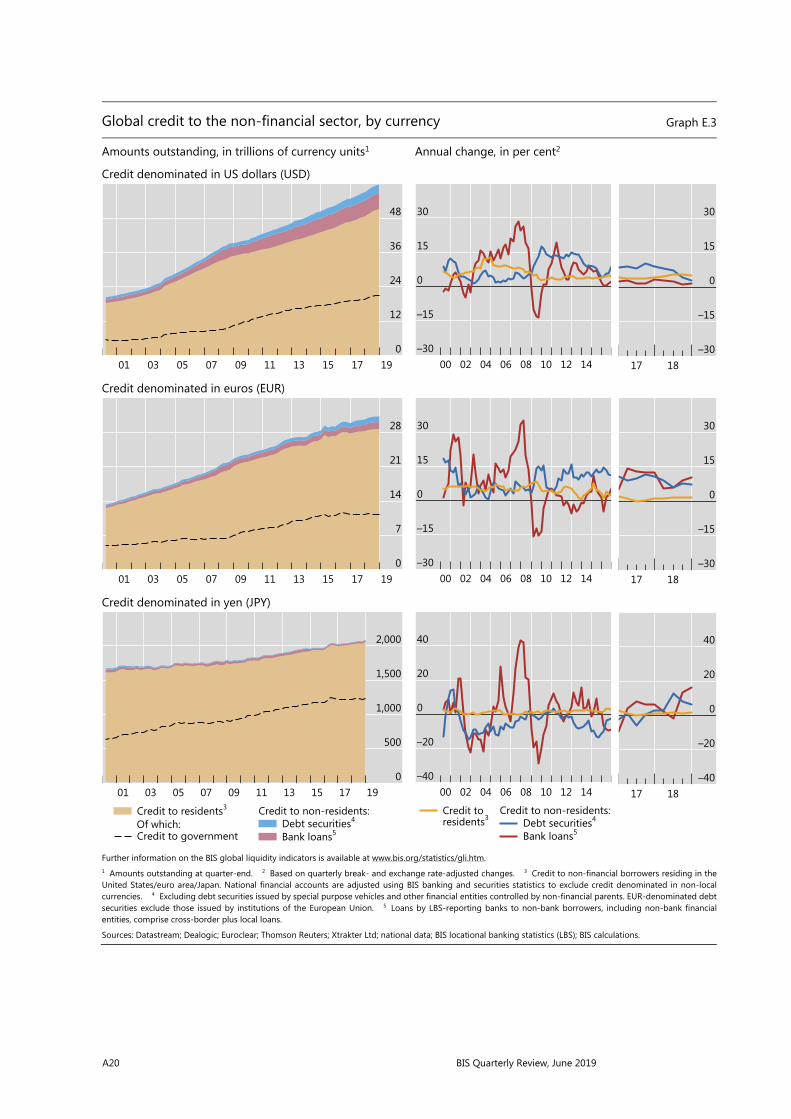
Global credit to the non-financial sector, by currency Graph E.3
Amounts outstanding, in trillions of currency units1 Annual change, in per cent2
Credit denominated in US dollars (USD)
Credit denominated in euros (EUR)
Credit denominated in yen (JPY)
Further information on the BIS global liquidity indicators is available at www.bis.org/statistics/gli.htm. 1 Amounts outstanding at quarter-end. 2 Based on quarterly break- and exchange rate-adjusted changes. 3 Credit to non-financial borrowers residing in the United States/euro area/Japan. National financial accounts are adjusted using BIS banking and securities statistics to exclude credit denominated in non-local currencies. 4 Excluding debt securities issued by special purpose vehicles and other financial entities controlled by non-financial parents. EUR-denominated debt securities exclude those issued by institutions of the European Union. 5 Loans by LBS-reporting banks to non-bank borrowers, including non-bank financial entities, comprise cross-border plus local loans.
Sources: Datastream; Dealogic; Euroclear; Thomson Reuters; Xtrakter Ltd; national data; BIS locational banking statistics (LBS); BIS calculations.
48
36
24
12
019171513110907050301
30
15
0
–15
–301412100806040200
30
15
0
–15
–301817
28
21
14
7
019171513110907050301
30
15
0
–15
–301412100806040200
30
15
0
–15
–301817
2,000
1,500
1,000
500
019171513110907050301
Of which:Credit to residents3
Debt securities4
Bank loans5
Credit to non-residents:
Credit to government
40
20
0
–20
–401412100806040200
Credit toresidents3 Debt securities4
Bank loans5
Credit to non-residents:
40
20
0
–20
–401817

BIS Quarterly Review, June 2019 A21
Foreign currency credit to non-banks in EMDEs Graph E.5
US dollar-denominated credit by region Foreign currency credit to selected EMDEs1
USD trn USD bn
Further information on the BIS global liquidity indicators is available at www.bis.org/statistics/gli.htm. 1 Amounts outstanding for the latest available data.
Sources: Datastream; Dealogic; Euroclear; Thomson Reuters; Xtrakter Ltd; national data; BIS locational banking statistics (LBS); BIS calculations.
3
2
1
0181614121008060402
Emerging EuropeLatin America and Caribbean
Africa and Middle EastEmerging Asia-Pacific
450
300
150
0MYZATWCLINSAKRARBRIDRUTRMXCN
USDDenominated in: EUR JPY
US dollar-denominated credit to non-banks outside the United States1 Graph E.4
World EMDEs Per cent USD tn Per cent USD tn
Further information on the BIS global liquidity indicators is available at www.bis.org/statistics/gli.htm. 1 Non-banks comprise non-bank financial entities, non-financial corporations, governments, households and international organisations. 2 Loans by LBS-reporting banks to non-bank borrowers, including non-bank financial entities, comprise cross-border plus local loans.
Sources: Datastream; Dealogic; Euroclear; Thomson Reuters; Xtrakter Ltd; national data; BIS locational banking statistics (LBS); BIS calculations.
58
54
50
46
9
6
3
018161412100806040200
Share of bank loansLhs:
65
60
55
50
3
2
1
018161412100806040200
Bonds issued by non-banksBank loans to non-banks2
Amounts outstanding (rhs):
A22 BIS Quarterly Review, June 2019
F Statistics on total credit to the non-financial sector
Total credit to the non-financial sector (core debt)
As a percentage of GDP Graph F.1
Euro area: aggregate and major countries Euro area: other countries
Other European countries Major advanced economies
Emerging Asia Other emerging Asia
Latin America Other emerging market economies
Further information on the BIS credit statistics is available at www.bis.org/statistics/totcredit.htm.
Source: BIS total credit statistics.
320
280
240
200
16018161412100806
Euro area Germany France Italy
360
320
280
240
20018161412100806
Belgium Netherlands Spain
300
270
240
210
18018161412100806
Sweden Switzerland United Kingdom
360
300
240
180
12018161412100806
Australia Canada Japan United States
360
270
180
9018161412100806
China Hong Kong SAR Korea Singapore
160
120
80
4018161412100806
India Indonesia Malaysia Thailand
140
100
60
2018161412100806
Argentina Brazil Mexico
120
90
60
3018161412100806
PolandRussia
Saudi ArabiaSouth Africa
Turkey

BIS Quarterly Review, June 2019 A23
Total credit to the private non-financial sector (core debt)
As a percentage of GDP Graph F.2
Euro area: aggregate and major countries Euro area: other countries
Other European countries Major advanced economies
Emerging Asia Other emerging Asia
Latin America Other emerging market economies
Further information on the BIS credit statistics is available at www.bis.org/statistics/totcredit.htm.
Source: BIS total credit statistics.
180
150
120
9018161412100806
Euro area Germany France Italy
275
225
175
12518161412100806
Belgium Netherlands Spain
225
200
175
15018161412100806
Sweden Switzerland United Kingdom
210
180
150
12018161412100806
Australia Canada Japan United States
280
210
140
7018161412100806
China Hong Kong SAR Korea Singapore
120
80
40
018161412100806
India Indonesia Malaysia Thailand
60
40
20
018161412100806
Argentina Brazil Mexico
80
60
40
2018161412100806
PolandRussia
Saudi ArabiaSouth Africa
Turkey
A24 BIS Quarterly Review, June 2019
Bank credit to the private non-financial sector (core debt)
As a percentage of GDP Graph F.3
Euro area: aggregate and major countries Euro area: other countries
Other European countries Major advanced economies
Emerging Asia Other emerging Asia
Latin America Other emerging market economies
Further information on the BIS credit statistics is available at www.bis.org/statistics/totcredit.htm.
Source: BIS total credit statistics.
100
90
80
70
6018161412100806
Euro area Germany France Italy
150
120
90
60
3018161412100806
Belgium Netherlands Spain
160
140
120
100
8018161412100806
Sweden Switzerland United Kingdom
120
90
60
30
018161412100806
Australia Canada Japan United States
240
180
120
6018161412100806
China Hong Kong SAR Korea Singapore
120
80
40
018161412100806
India Indonesia Malaysia Thailand
60
45
30
15
018161412100806
Argentina Brazil Mexico
75
60
45
30
1518161412100806
PolandRussia
Saudi ArabiaSouth Africa
Turkey

BIS Quarterly Review, June 2019 A25
Total credit to households (core debt)
As a percentage of GDP Graph F.4
Euro area: aggregate and major countries Euro area: other countries
Other European countries Major advanced economies
Emerging Asia Other emerging Asia
Latin America Other emerging market economies
Further information on the BIS credit statistics is available at www.bis.org/statistics/totcredit.htm.
Source: BIS total credit statistics.
70
60
50
40
3018161412100806
Euro area Germany France Italy
120
100
80
60
4018161412100806
Belgium Netherlands Spain
120
100
80
60
4018161412100806
Sweden Switzerland United Kingdom
120
100
80
60
4018161412100806
Australia Canada Japan United States
80
60
40
20
018161412100806
China Hong Kong SAR Korea Singapore
80
60
40
20
018161412100806
India Indonesia Malaysia Thailand
28
21
14
7
018161412100806
Argentina Brazil Mexico
40
30
20
10
018161412100806
PolandRussia
Saudi ArabiaSouth Africa
Turkey
A26 BIS Quarterly Review, June 2019
Total credit to non-financial corporations (core debt)
As a percentage of GDP Graph F.5
Euro area: aggregate and major countries Euro area: other countries
Other European countries Major advanced economies
Emerging Asia Other emerging Asia
Latin America Other emerging market economies
Further information on the BIS credit statistics is available at www.bis.org/statistics/totcredit.htm.
Source: BIS total credit statistics.
150
120
90
60
3018161412100806
Euro area Germany France Italy
175
150
125
100
7518161412100806
Belgium Netherlands Spain
150
120
90
6018161412100806
Sweden Switzerland United Kingdom
120
105
90
75
6018161412100806
Australia Canada Japan United States
200
150
100
5018161412100806
China Hong Kong SAR Korea Singapore
60
40
20
018161412100806
India Indonesia Malaysia Thailand
45
30
15
018161412100806
Argentina Brazil Mexico
75
50
25
018161412100806
PolandRussia
Saudi ArabiaSouth Africa
Turkey

BIS Quarterly Review, June 2019 A27
Total credit to the government sector at market value (core debt)1
As a percentage of GDP Graph F.6
Euro area: aggregate and major countries Euro area: other countries
Other European countries Major advanced economies
Emerging Asia Other emerging market economies
Further information on the BIS credit statistics is available at www.bis.org/statistics/totcredit.htm. 1 Consolidated data for the general government sector.
Source: BIS total credit statistics.
150
125
100
75
5018161412100806
Euro area Germany France Italy
125
100
75
50
2518161412100806
Belgium Netherlands Spain
150
120
90
60
30
18161412100806
Sweden Switzerland United Kingdom
200
150
100
50
0
18161412100806
Australia Canada Japan United States
55
45
35
25
1518161412100806
Korea
55
45
35
25
1518161412100806
Poland Turkey
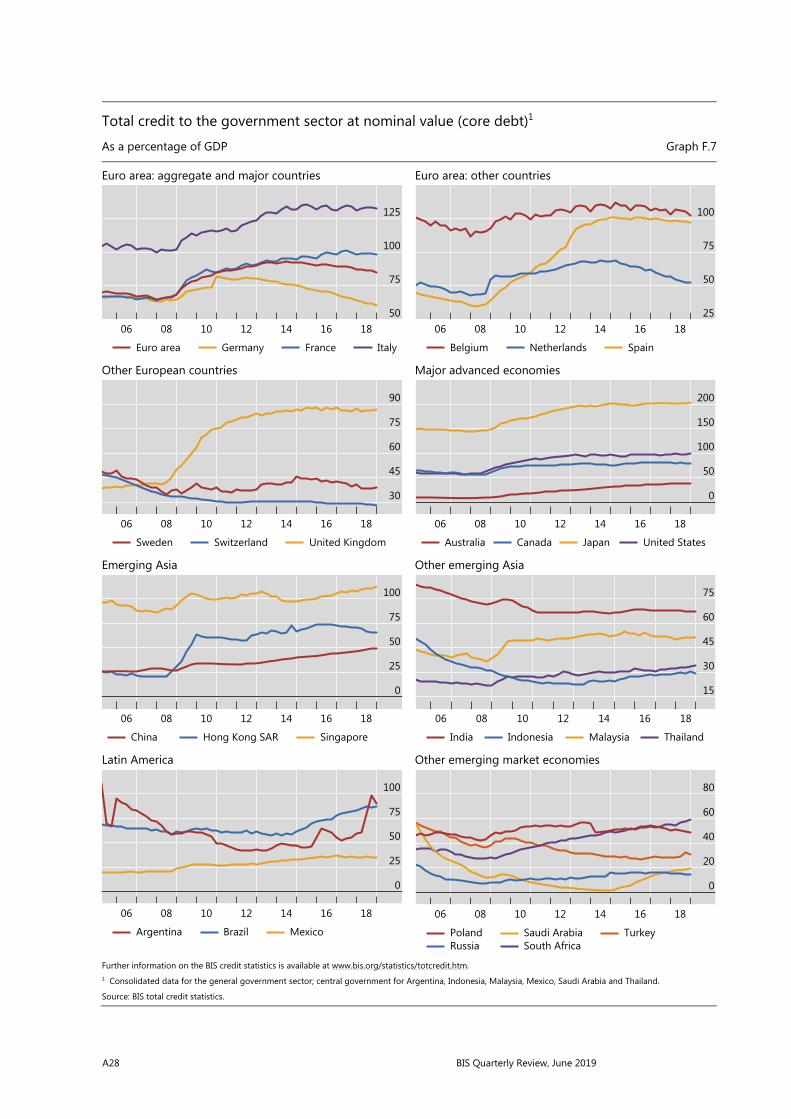
A28 BIS Quarterly Review, June 2019
Total credit to the government sector at nominal value (core debt)1
As a percentage of GDP Graph F.7
Euro area: aggregate and major countries Euro area: other countries
Other European countries Major advanced economies
Emerging Asia Other emerging Asia
Latin America Other emerging market economies
Further information on the BIS credit statistics is available at www.bis.org/statistics/totcredit.htm. 1 Consolidated data for the general government sector; central government for Argentina, Indonesia, Malaysia, Mexico, Saudi Arabia and Thailand.
Source: BIS total credit statistics.
125
100
75
5018161412100806
Euro area Germany France Italy
100
75
50
2518161412100806
Belgium Netherlands Spain
90
75
60
45
30
18161412100806
Sweden Switzerland United Kingdom
200
150
100
50
0
18161412100806
Australia Canada Japan United States
100
75
50
25
0
18161412100806
China Hong Kong SAR Singapore
75
60
45
30
15
18161412100806
India Indonesia Malaysia Thailand
100
75
50
25
0
18161412100806
Argentina Brazil Mexico
80
60
40
20
0
18161412100806
PolandRussia
Saudi ArabiaSouth Africa
Turkey
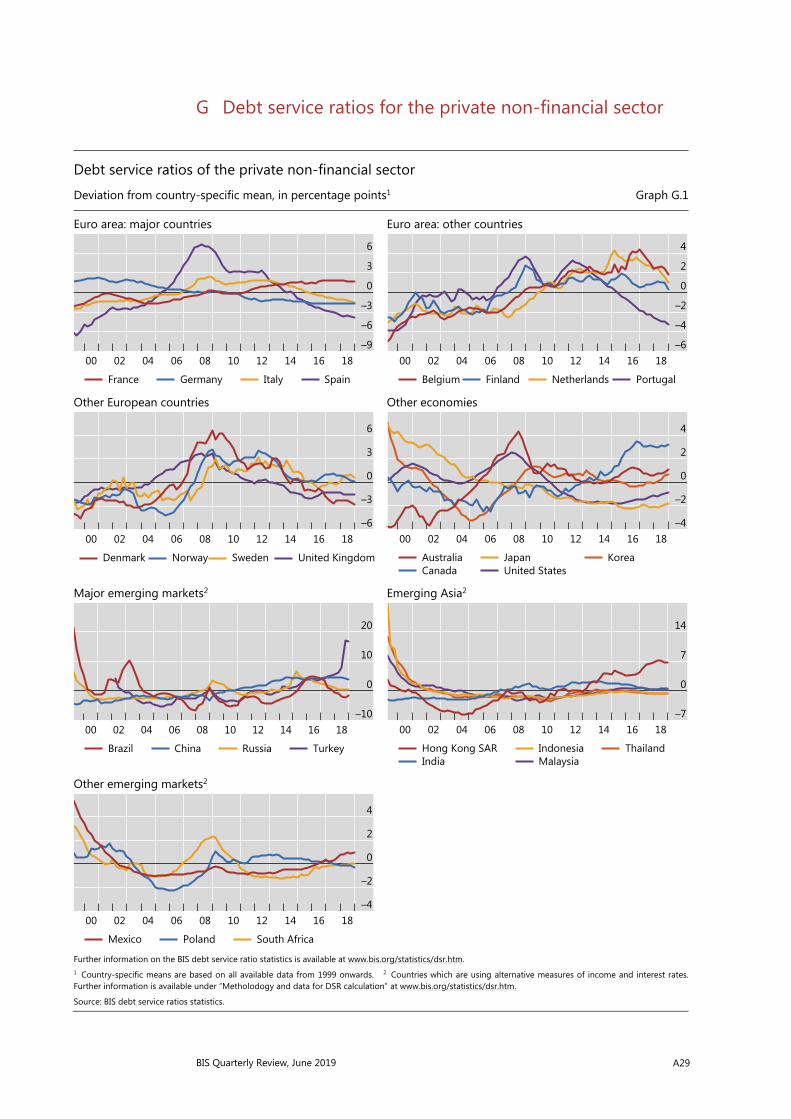
BIS Quarterly Review, June 2019 A29
G Debt service ratios for the private non-financial sector
Debt service ratios of the private non-financial sector
Deviation from country-specific mean, in percentage points1 Graph G.1
Euro area: major countries Euro area: other countries
Other European countries Other economies
Major emerging markets2 Emerging Asia2
Other emerging markets2
Further information on the BIS debt service ratio statistics is available at www.bis.org/statistics/dsr.htm. 1 Country-specific means are based on all available data from 1999 onwards. 2 Countries which are using alternative measures of income and interest rates. Further information is available under “Metholodogy and data for DSR calculation” at www.bis.org/statistics/dsr.htm.
Source: BIS debt service ratios statistics.
6
3
0
–3
–6
–918161412100806040200
France Germany Italy Spain
4
2
0
–2
–4
–618161412100806040200
Belgium Finland Netherlands Portugal
6
3
0
–3
–618161412100806040200
Denmark Norway Sweden United Kingdom
4
2
0
–2
–418161412100806040200
AustraliaCanada
JapanUnited States
Korea
20
10
0
–1018161412100806040200
Brazil China Russia Turkey
14
7
0
–718161412100806040200
Hong Kong SARIndia
IndonesiaMalaysia
Thailand
4
2
0
–2
–418161412100806040200
Mexico Poland South Africa
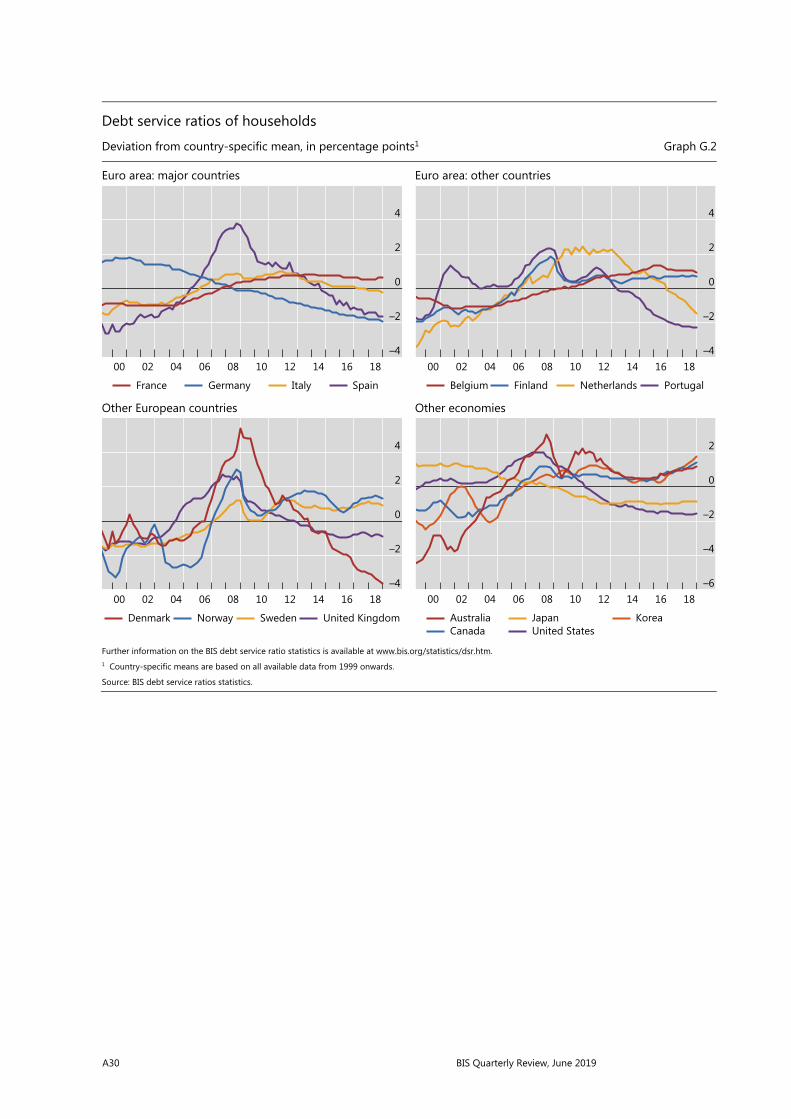
A30 BIS Quarterly Review, June 2019
Debt service ratios of households
Deviation from country-specific mean, in percentage points1 Graph G.2
Euro area: major countries Euro area: other countries
Other European countries Other economies
Further information on the BIS debt service ratio statistics is available at www.bis.org/statistics/dsr.htm. 1 Country-specific means are based on all available data from 1999 onwards.
Source: BIS debt service ratios statistics.
4
2
0
–2
–418161412100806040200
France Germany Italy Spain
4
2
0
–2
–418161412100806040200
Belgium Finland Netherlands Portugal
4
2
0
–2
–418161412100806040200
Denmark Norway Sweden United Kingdom
2
0
–2
–4
–618161412100806040200
AustraliaCanada
JapanUnited States
Korea
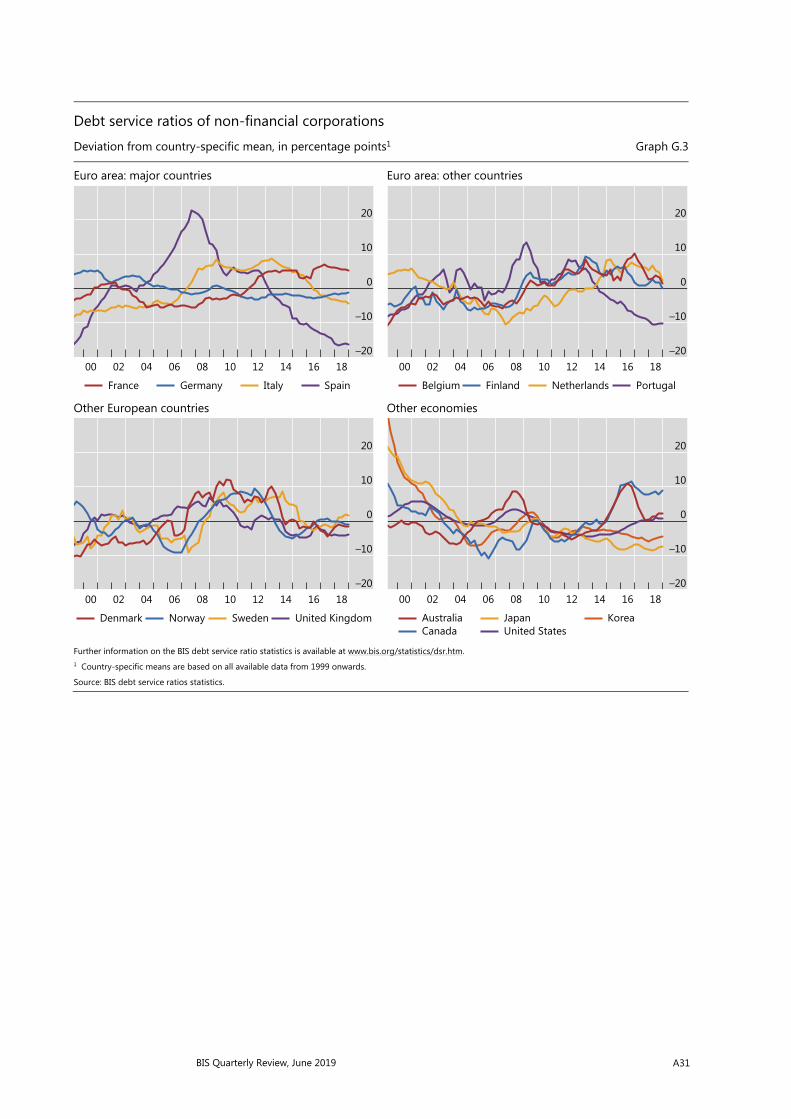
BIS Quarterly Review, June 2019 A31
Debt service ratios of non-financial corporations
Deviation from country-specific mean, in percentage points1 Graph G.3
Euro area: major countries Euro area: other countries
Other European countries Other economies
Further information on the BIS debt service ratio statistics is available at www.bis.org/statistics/dsr.htm. 1 Country-specific means are based on all available data from 1999 onwards.
Source: BIS debt service ratios statistics.
20
10
0
–10
–2018161412100806040200
France Germany Italy Spain
20
10
0
–10
–2018161412100806040200
Belgium Finland Netherlands Portugal
20
10
0
–10
–2018161412100806040200
Denmark Norway Sweden United Kingdom
20
10
0
–10
–2018161412100806040200
AustraliaCanada
JapanUnited States
Korea
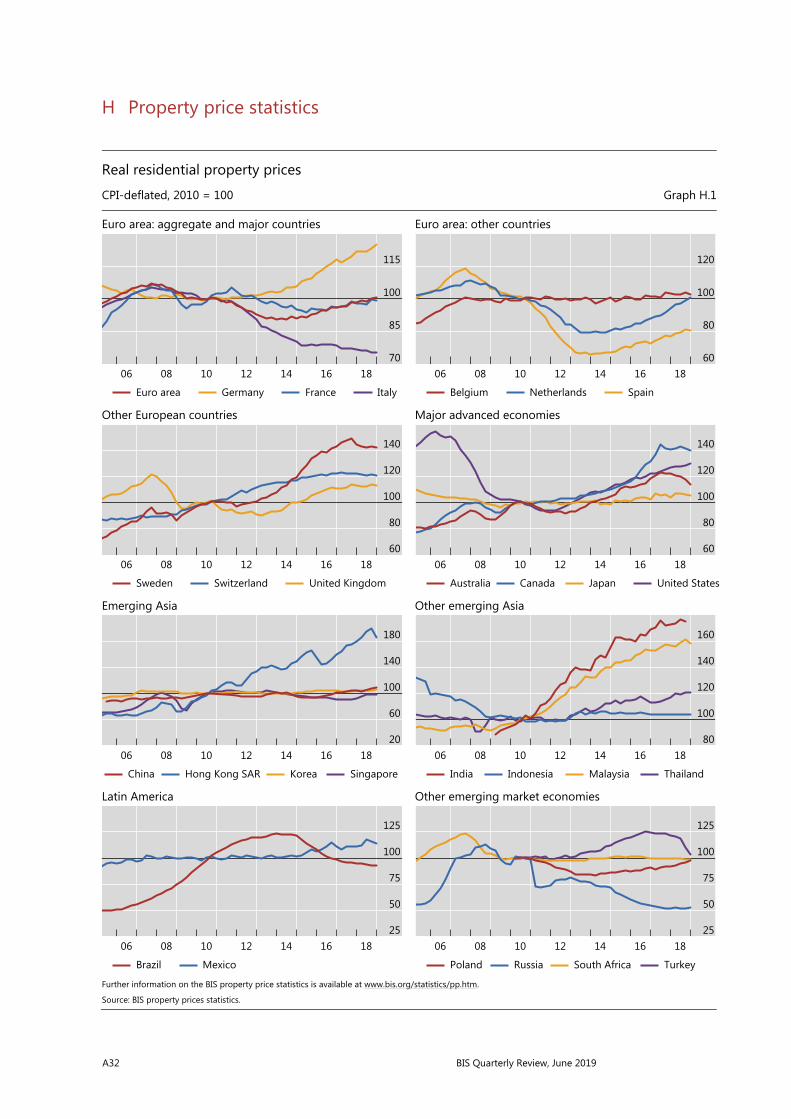
A32 BIS Quarterly Review, June 2019
H Property price statistics
Real residential property prices
CPI-deflated, 2010 = 100 Graph H.1
Euro area: aggregate and major countries Euro area: other countries
Other European countries Major advanced economies
Emerging Asia Other emerging Asia
Latin America Other emerging market economies
Further information on the BIS property price statistics is available at www.bis.org/statistics/pp.htm.
Source: BIS property prices statistics.
115
100
85
7018161412100806
Euro area Germany France Italy
120
100
80
6018161412100806
Belgium Netherlands Spain
140
120
100
80
6018161412100806
Sweden Switzerland United Kingdom
140
120
100
80
6018161412100806
Australia Canada Japan United States
180
140
100
60
2018161412100806
China Hong Kong SAR Korea Singapore
160
140
120
100
8018161412100806
India Indonesia Malaysia Thailand
125
100
75
50
2518161412100806
Brazil Mexico
125
100
75
50
2518161412100806
Poland Russia South Africa Turkey
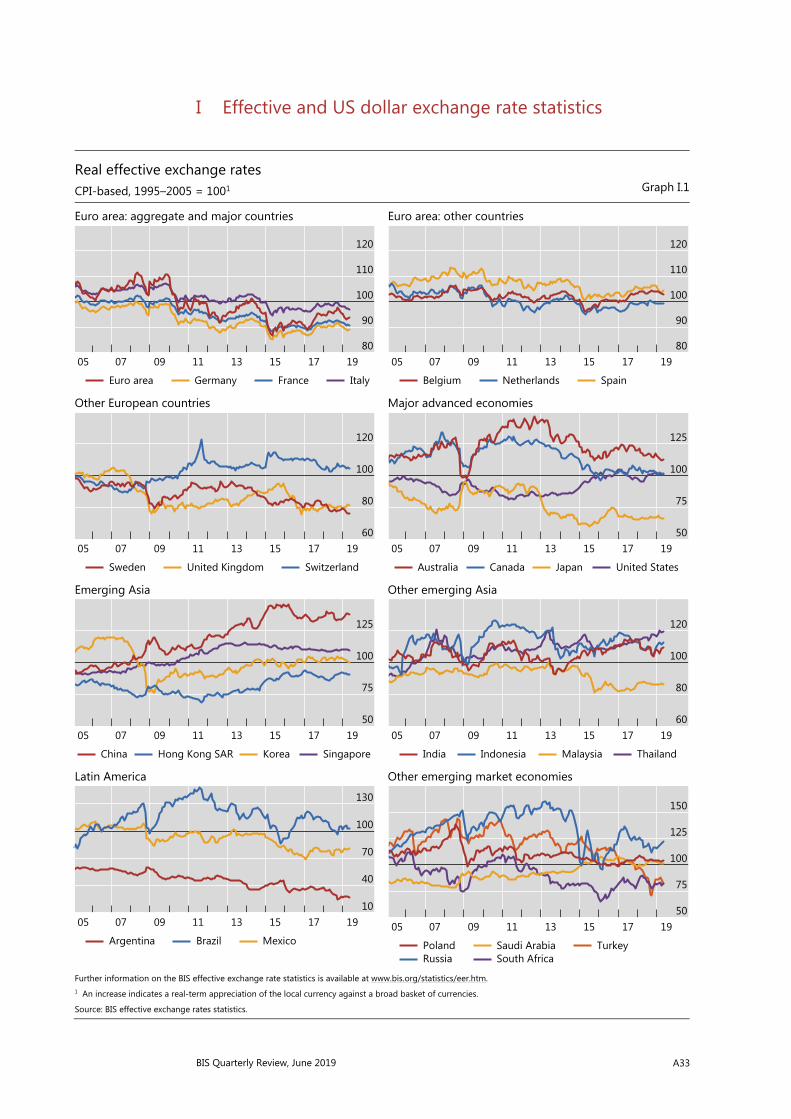
BIS Quarterly Review, June 2019 A33
I Effective and US dollar exchange rate statistics
Real effective exchange rates CPI-based, 1995–2005 = 1001 Graph I.1
Euro area: aggregate and major countries Euro area: other countries
Other European countries Major advanced economies
Emerging Asia Other emerging Asia
Latin America Other emerging market economies
Further information on the BIS effective exchange rate statistics is available at www.bis.org/statistics/eer.htm. 1 An increase indicates a real-term appreciation of the local currency against a broad basket of currencies.
Source: BIS effective exchange rates statistics.
120
110
100
90
801917151311090705
Euro area Germany France Italy
120
110
100
90
801917151311090705
Belgium Netherlands Spain
120
100
80
601917151311090705
Sweden United Kingdom Switzerland
125
100
75
501917151311090705
Australia Canada Japan United States
125
100
75
501917151311090705
China Hong Kong SAR Korea Singapore
120
100
80
601917151311090705
India Indonesia Malaysia Thailand
130
100
70
40
101917151311090705
Argentina Brazil Mexico
150
125
100
75
501917151311090705
PolandRussia
Saudi ArabiaSouth Africa
Turkey
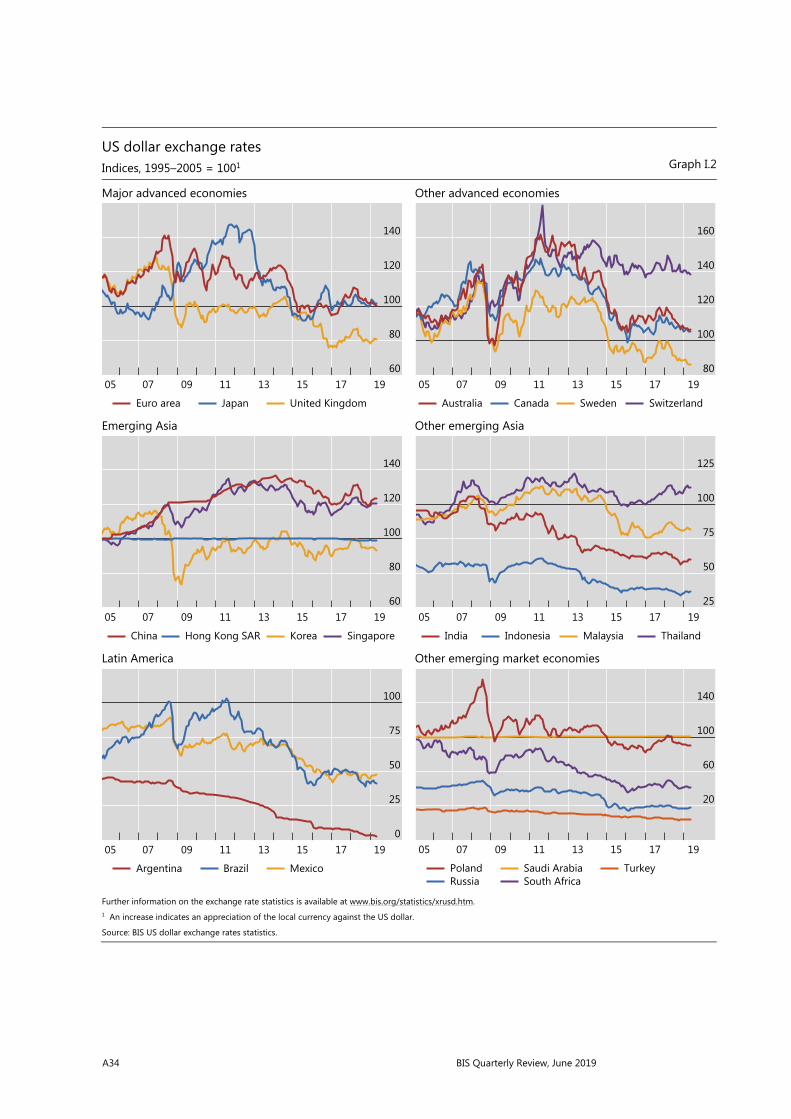
A34 BIS Quarterly Review, June 2019
US dollar exchange rates Indices, 1995–2005 = 1001 Graph I.2
Major advanced economies Other advanced economies
Emerging Asia Other emerging Asia
Latin America Other emerging market economies
Further information on the exchange rate statistics is available at www.bis.org/statistics/xrusd.htm. 1 An increase indicates an appreciation of the local currency against the US dollar.
Source: BIS US dollar exchange rates statistics.
140
120
100
80
601917151311090705
Euro area Japan United Kingdom
160
140
120
100
801917151311090705
Australia Canada Sweden Switzerland
140
120
100
80
601917151311090705
China Hong Kong SAR Korea Singapore
125
100
75
50
251917151311090705
India Indonesia Malaysia Thailand
100
75
50
25
01917151311090705
Argentina Brazil Mexico
140
100
60
20
1917151311090705
PolandRussia
Saudi ArabiaSouth Africa
Turkey

BIS Quarterly Review, June 2019 A35
J Credit-to-GDP gaps
Credit-to-GDP gaps
In percentage points of GDP Graph J.1
Euro area: aggregate and major countries Euro area: other countries
Other European countries Major advanced economies
Emerging Asia Other emerging Asia
Latin America Other emerging market economies
1 Estimates based on series on total credit to the private non-financial sector. The credit-to-GDP gap is defined as the difference between the credit-to-GDP ratio and its long-term trend; the long-term trend is calculated using a one-sided Hodrick-Prescott filter with a smoothing parameter of 400,000. Further information on the BIS credit-to-GDP gaps is available at www.bis.org/statistics/c_gaps.htm.
Source: BIS credit-to-GDP gaps statistics.
10
0
–10
–2018161412100806
Euro area Germany France Italy
25
0
–25
–50
–7518161412100806
Belgium Netherlands Spain
40
20
0
–20
–4018161412100806
Sweden Switzerland United Kingdom
10
0
–10
–20
–3018161412100806
Australia Canada Japan United States
40
20
0
–20
–4018161412100806
China Hong Kong SAR Korea Singapore
20
0
–20
–40
–6018161412100806
India Indonesia Malaysia Thailand
10
0
–10
–2018161412100806
Argentina Brazil Mexico
10
0
–10
–2018161412100806
PolandRussia
Saudi ArabiaSouth Africa
Turkey

A36 BIS Quarterly Review, June 2019
K Consumer prices
Consumer prices Year-on-year percentage changes Graph K.1
Euro area: aggregate and major countries Euro area: other countries
Other European countries Major advanced economies
Emerging Asia Other emerging Asia
Latin America Other emerging market economies
Further information on the BIS consumer prices is available at www.bis.org/statistics/cp.htm.
Source: BIS consumer price statistics.
4
2
0
–21917151311090705
Euro area Germany France Italy
4
2
0
–21917151311090705
Belgium Netherlands Spain
4
2
0
–2
–41917151311090705
Sweden Switzerland United Kingdom
4
2
0
–2
–41917151311090705
Australia Canada Japan United States
9
6
3
0
–31917151311090705
China Hong Kong SAR Korea Singapore
15
10
5
0
–51917151311090705
India Indonesia Malaysia Thailand
40
20
0
1917151311090705
Argentina Brazil Mexico
20
10
0
1917151311090705
PolandRussia
Saudi ArabiaSouth Africa
Turkey

BIS Quarterly Review, June 2019 A37
L Central bank policy rates
Central bank policy or representative rates Month-end; in per cent Graph L.1
Major advanced economies Other advanced economies
Emerging Asia Other emerging Asia
Latin America Other emerging market economies
Further information on the policy rates is available at www.bis.org/statistics/cbpol.htm.
Source: BIS policy rates statistics.
6
4
2
0
–21917151311090705
Euro areaJapan
United KingdomUnited States
6
4
2
0
–21917151311090705
Australia Canada Sweden Switzerland
6
4
2
0
–21917151311090705
China Hong Kong SAR Korea
12
9
6
3
01917151311090705
India Indonesia Malaysia Thailand
60
40
20
01917151311090705
Argentina Brazil Mexico
20
15
10
5
01917151311090705
PolandRussia
Saudi ArabiaSouth Africa
Turkey

BIS Quarterly Review, June 2019 B1
Special features in the BIS Quarterly Review
March 2019 Beyond LIBOR: a primer on the new reference rates Andreas Schrimpf & Vladyslav Sushko
March 2019 Impact of financial regulations: insights from an online repository of studies
Frederic Boissay, Carlos Cantú, Stijn Claessens & Alan Villegas
March 2019 Following the imprint of the ECB's asset purchase programme on global bond and deposit flows
Stefan Avdjiev, Mary Everett & Hyun Song Shin
March 2019 The zero lower bound, forward guidance and how markets respond to news
Richhild Moessner & Phurichai Rungcharoenkitkul
December 2018 The growing footprint of EME banks in the international banking system
Eugenio Cerutti, Catherine Koch & Swapan-Kumar Pradhan
December 2018 The 2008 crisis: transpacific or transatlantic? Robert N McCauley
December 2018 The financial cycle and recession risk Claudio Borio, Mathias Drehmann & Dora Xia
December 2018 Clearing risks in OTC derivatives markets: the CCP-bank nexus
Umar Faruqui, Wenqian Huang & Előd Takáts
September 2018 Fintech credit markets around the world: size, drivers and policy issues
Stijn Claessens, Jon Frost, Grant Turner & Feng Zhu
September 2018 Regulating cryptocurrencies: assessing market reactions Raphael Auer & Stijn Claessens
September 2018 The rise of zombie firms: causes and consequences Ryan Banerjee & Boris Hofmann
September 2018 Term premia: models and some stylised facts Benjamin H Cohen, Peter Hördahl & Dora Xia

BIS Quarterly Review, June 2019 C1
Recent BIS publications1
BIS Papers
Asia-Pacific fixed income markets: evolving structure, participation and pricing BIS Papers No 102, April 2019
The Bank of Korea and the Bank for International Settlements (BIS) co-hosted a conference on "Asia-Pacific fixed income markets: evolving structure, participation and pricing" on 19–20 November 2018 in Seoul, Korea. The conference marked the completion of the BIS Asian Office's two-year research programme on fixed income markets that had been endorsed by the Asian Consultative Council of central bank Governors in May 2017.
BIS Working Papers
Dominant currency debt Egemen Eren and Semyon Malamud May 2019, No 783
We propose a "debt view" to explain the dominant international role of the dollar. We develop an international general equilibrium model in which firms optimally choose the currency composition of their nominal debt. Expansionary monetary policy in downturns prevents Fisherian debt deflation through its effects on inflation and exchange rates, and alleviates financial distress. Theoretically, the dominant currency is the one that depreciates in global downturns over horizons of corporate debt maturity. Empirically, the dollar fits this description, despite being a short-run safe-haven currency. We provide broad empirical support for the debt view. We also study the globally optimal monetary policy.
How does the interaction of macroprudential and monetary policies affect cross-border bank lending? Előd Takáts and Judit Temesvary May 2019, No 782
We combine a rarely accessed BIS database on bilateral cross-border lending flows with cross-country data on macroprudential regulations. We study the interaction between the monetary policy of major international currency issuers (USD, EUR and JPY) and macroprudential policies enacted in source (home) lending banking systems. We find significant interactions. Tighter macroprudential policy in a home country mitigates the impact on lending of monetary policy of a currency issuer. For instance, macroprudential tightening in the UK mitigates the negative impact of US monetary tightening on USD-denominated cross-border bank lending outflows from UK banks. Vice-versa, easier macroprudential policy amplifies impacts. The results are economically significant.
1 Requests for publications should be addressed to Bank for International Settlements, Press &
Communications, Centralbahnplatz 2, CH-4002 Basel. These publications are also available on the BIS website (http://www.bis.org/).

C2 BIS Quarterly Review, June 2019
New information and inflation expectations among firms Serafin Frache and Rodrigo Lluberas April 2019, No 781
Using data from a unique and novel monthly firm-level survey on inflation expectations in Uruguay we first present stylized facts about the inflation expectation formation process and then show how information acquisition affects firms' inflation expectations. We show that firms' forecasts are close to observed inflation, that a sizable proportion of firms do not revise their expectations, and that there is substantial disagreement about future inflation among firms. We also present evidence on industrial sector effects on inflation forecasts and show that the correlation between inflation expectations and cost expectations increases with the forecast time horizon. We then exploit peculiarities of the collective wage bargaining negotiation mechanism to estimate the impact of acquiring information about past inflation on expected future inflation. Our results imply that firms that adjust wages expect lower inflation, revise their expectations downwards and make smaller forecast errors than firms that do not adjust wages. We find no effect of wage adjustments on firms' own cost expectations and that disagreement among firms is lower in the months of wage adjustment. The latter suggests that inflation expectations tend to converge as firms are more informed about past inflation.
Can regulation on loan-loss-provisions for credit risk affect the mortgage market? Evidence from administrative data in Chile Mauricio Calani April 2019, No 780
We argue that financial institutions responded by raising their acceptable borrowing standards on borrowers, enhancing the quality of their portfolio, but also contracting their supply of mortgage credit. We reach this conclusion by developing a stylized imperfect information model which we use to guide our empirical analysis. We conclude that the loan-to-value (LTV) ratio was 2.8% lower for the mean borrower, and 9.8% lower for the median borrower, because of the regulation. Our paper contributes to the literature on the evaluation of macro-prudential policies, which has mainly exploited cross-country evidence. In turn, our analysis narrows down to one particular policy in the mortgage market, and dissects its effects by exploiting unique administrative tax data on the census of all real estate transactions in Chilean territory, in the period 2012–2016.
BigTech and the changing structure of financial intermediation Jon Frost, Leonardo Gambacorta, Yi Huang, Hyun Song Shin and Pablo Zbinden April 2019, No 779
We consider the drivers and implications of the growth of "BigTech" in finance - ie the financial services offerings of technology companies with established presence in the market for digital services. BigTech firms often start with payments. Thereafter, some expand into the provision of credit, insurance, and savings and investment products, either directly or in cooperation with financial institution partners. Focusing on credit, we show that BigTech firms lend more in countries with less competitive banking sectors and less stringent regulation. Analysing the case of Argentina, we find support for the hypothesis that BigTech lenders have an information advantage in credit assessment relative to a traditional credit bureau. For borrowers in both Argentina and China, we find that firms that accessed credit expanded their product offerings more than those that did not. It is too early to judge the extent of BigTech's eventual advance into the provision of financial services. However, the early evidence allows us to pose pertinent questions that bear on their impact on financial stability and overall economic welfare.
Does informality facilitate inflation stability? Enrique Alberola-Ila and Carlos Urrutia April 2019, No 778
Informality is an entrenched structural trait in emerging market economies, despite of the progress achieved in macroeconomic management. Informality determines the behavior of labour markets, financial access and the productivity of the overall economy. Therefore it influences the transmission of shocks and also of monetary policy. This paper develops a simple general equilibrium closed economy model with nominal rigidities, labor and financial frictions. Informality is captured by a dual labour market where the share of informal workers is
BIS Quarterly Review, June 2019 C3
endogenous. Only formal sector firms have access to financing, which is instrumental in their production process. Informality has a buffering effect on the propagation of demand and supply shocks to prices; the financial feature of the model exacerbates the impact of financial shocks in the formal sector while the informal sector is in principle unaffected. As a result informality dampens the impact of demand and financial shocks on wages and inflation but heighten the impact of technology shocks. Informality also increases the sacrifice ratio of monetary policy actions. From a Central Bank perspective, the results imply that the presence of an informal sector mitigates inflation volatility for some type of shocks but makes monetary policy less effective.
What anchors for the natural rate of interest? Claudio Borio, Piti Disyatat and Phurichai Rungcharoenkitkul March 2019, No 777
The paper takes a critical look at the conceptual and empirical underpinnings of prevailing explanations for low real (inflation-adjusted) interest rates over long horizons and finds them incomplete. The role of monetary policy, and its interaction with the financial cycle in particular, deserve greater attention. By linking booms and busts, the financial cycle generates important path dependencies that give rise to intertemporal policy trade-offs. Policy today constrains policy tomorrow. Far from being neutral, the policy regime can exert a persistent influence on the economy's evolution, including on the real interest rate. This raises serious conceptual and practical questions about the use of the natural interest rate as a monetary policy guidepost. In developing the analysis, the paper also provides a specific critique of the safe asset shortage hypothesis - a hypothesis that has gained considerable popularity in recent years.
Can an ageing workforce explain low inflation? Benoit Mojon and Xavier Ragot March 2019, No 776
Why is wage inflation so weak in spite of the recent sharp reduction in unemployment? We show that this may be due to an ongoing change in the composition of the labor supply. Indeed, the participation rate of workers aged between 55 and 64 has increased steadily over the last decade, from a third to above a half on average across OECD countries. This is most likely the consequence of ageing and the reform of pensions. We show that the participation rate of workers aged 55 to 64 contributes to explain why wage inflation has remained weak over the last five years. Our second result is that Phillips curves are alive and well. When exploiting the cross-country variance of the data, wage inflation remains highly responsive to domestic unemployment rates, including after the Great Recession.
Bond risk premia and the exchange rate Boris Hofmann, Ilhyock Shim and Hyun Song Shin March 2019, No 775
In emerging market economies, currency appreciation goes hand in hand with compressed sovereign bond spreads, even for local currency sovereign bonds. This yield compression comes from a reduction in the credit risk premium. Crucially, the relevant exchange rate involved in yield compression is the bilateral US dollar exchange rate, not the trade-weighted exchange rate. Our findings highlight endogenous co-movement of bond risk premia and exchange rates through the portfolio choice of global investors who evaluate returns in dollar terms.
FX intervention and domestic credit: Evidence from high-frequency micro data Boris Hofmann, Hyun Song Shin and Mauricio Villamizar-Villegas March 2019, No 774
We employ a rarely available high-frequency micro data set to study the impact of foreign exchange intervention on domestic credit growth. We find that sterilised purchases of dollars by the central bank dampens the flow of new domestic corporate loans in Colombia. Slowing the pace of currency appreciation plays a key role in dampening credit expansion. Our analysis sheds light on the role of FX intervention as part of the financial stability-oriented policy response to credit booms associated with capital inflow surges.
C4 BIS Quarterly Review, June 2019
From carry trades to trade credit: financial intermediation by non-financial corporations Bryan Hardy and Felipe Saffie March 2019, No 773
We use unique firm level data from Mexico to document that non-financial corporations engage in carry trades by borrowing in foreign currency and lending in domestic currency, largely to related partners (trade credit), accumulating currency risk in the process. The interest rate differential between local and foreign currency borrowing largely drives this behavior at a quarterly frequency, inducing an expansion in gross trade credit and sales. Firms that were active in carry-trade have decreased investment following a large depreciation, independent of currency exposure levels and export status, but maintain their supply of trade credit.
On the global Impact of risk-off shocks and policy-put frameworks Josef Schroth March 2019, No 772
Global risk-off shocks can be highly destabilizing for financial markets and, absent an adequate policy response, may trigger severe recessions. Policy responses were more complex for developed economies with very low interest rates after the GFC. We document, however, that the unconventional policies adopted by the main central banks were effective in containing asset price declines. These policies impacted long rates and inspired confidence in a policy-put framework that reduced the persistence of risk-off shocks. We also show that domestic macroeconomic and financial conditions play a key role in benefiting from the spillovers of these policies during risk-off episodes. Countries like Japan, which already had very low long rates, benefited less. However, Japan still benefited from the reduced persistence of risk-off shocks. In contrast, since one of the main channels through which emerging markets are historically affected by global risk-off shocks is through a sharp rise in long rates, the unconventional monetary policy phase has been relatively benign to emerging markets during these episodes, especially for those economies with solid macroeconomic fundamentals and deep domestic financial markets. We also show that unconventional monetary policy in the US had strong effects on long interest rates in most economies in the Asia-Pacific region (which helps during risk-off events but may be destabilizing otherwise -we do not take a stand on this tradeoff).
Basel Committee on Banking Supervision
Sixteenth progress report on adoption of the Basel regulatory framework May 2019
This updated progress report provides a high-level view of Basel Committee members' progress in adopting Basel III standards as of end-March 2019.
It focuses on the status of adoption of all the Basel III standards, including the finalised Basel III post-crisis reforms published in December 2017, to ensure that they are transformed into national law or regulation according to the internationally agreed time frames. The report is based on information provided by individual members as part of the Committee's Regulatory Consistency Assessment Programme (RCAP).
The report includes the status of adoption of the Basel III risk-based capital standards, the leverage ratio, the standards for global and domestic systemically important banks (SIBs) and interest rate risk in the banking book (IRRBB), the Net Stable Funding Ratio (NSFR), the large exposures framework and the disclosure requirements.
Consolidated Basel Framework April 2019
Basel Committee on Banking Supervision launched a new section of its website that sets out a consolidated version of its global standards for the regulation and supervision of banks. The consolidated framework aims to improve the accessibility of the Basel Committee's standards and to promote consistent global interpretation and implementation. The framework has been
BIS Quarterly Review, June 2019 C5
published initially in draft form, together with a consultative document to gather feedback on the website and on various proposed technical amendments to the standards.
Basel standards are currently published on the Committee's section of the website of the Bank for International Settlements (BIS), as a series of pdf documents. These publications may replace prior standards, amend existing standards or introduce new ones. But the current publication format, combined with the expanded scope of the Basel Framework in recent years, make it difficult for website users to find the standards that are currently in force, or track how the framework has developed over time and will develop in the future. The Consolidated Basel Framework that has been launched today addresses these issues.
The publication of the standards in the new format of the consolidated framework has focused on reorganising existing requirements. There was no intention to introduce new requirements or otherwise amend the standards previously agreed and published by the Basel Committee. In preparing the framework, the Basel Committee has taken the opportunity to simplify the standards where possible, clarify provisions known to cause confusion, integrate answers to frequently asked questions (FAQs) and delete redundant review clauses and other outdated provisions.
The preparation of the standards in the new format did, however, reveal some inconsistencies between Basel requirements as well as ambiguities that need to be addressed through policy changes. Such policy changes, which are not substantial but which cannot be resolved unambiguously based on the current text, would normally be subject to consultation as technical amendments. The Committee considers it to be most efficient to consult on all such changes together in the context of the launch of the consolidated framework. The proposed changes have been incorporated into the draft version of the consolidated framework, together with various new FAQs.
As the technical amendments proposed in the consultative document are not substantial in nature and, in the Committee's view, contribute to a more coherent prudential framework, the Committee will encourage its members to implement the final requirements as soon as possible, and no later than 1 January 2022.The Committee welcomes comments on the two questions set out in the consultative document. Comments should be uploaded here by Friday 9 August 2019. All comments will be published on the Bank for International Settlements website unless a respondent specifically requests confidential treatment.
Standardised approach - implementing the mapping process April 2019
This document set out guidelines for supervisors in the process of assigning the credit risk assessments of an eligible external credit assessment institution (ECAI) to the risk weights available under the standardised approach to credit risk. It fully replicates Annex 2 of Basel II (June 2006) and has been issued as a separate publication due to the launch of the Consolidated Basel Framework (see section 1.34 of the consultation document on the consolidated framework for more information).
Towards a sectoral application of the countercyclical capital buffer April 2019
In May 2017, the Basel Committee's Research Task Force initiated a work stream on sectoral countercyclical capital buffers (CCyBs). It was tasked to produce two deliverables that would contribute to the understanding of the sectoral application of the CCyB: (i) a review of the existing literature; and (ii) a report summarising original research conducted within the work stream.
The literature review was published in March 2018 and shows that there is a justified need for sectoral macroprudential tools. Moreover, it argues that a sectoral CCyB may be a useful complement to both the Basel III CCyB and existing targeted instruments in the macroprudential toolkit. Yet, countercyclical capital buffers, both broad-based and sectoral, remain largely untested and more work is needed to assess their ability to achieve the different objectives attributed to them. Furthermore, a sectoral application of the CCyB entails several challenges with respect to the design of the instrument and its interactions with the Basel III CCyB and other (targeted) instruments.
C6 BIS Quarterly Review, June 2019
This research report summarises the RTF-CCyB work stream's findings regarding the open issues identified by the literature review. Two theoretical papers - Galaasen and Solheim (2018) in a partial equilibrium framework and Castro (2018) in a general equilibrium framework - analyse the transmission mechanism of a sectoral CCyB and compare its effectiveness and efficiency to that of the Basel III CCyB. The empirical work conducted by the work stream consists of three papers: two of them - Ferrari and Rovira Kaltwasser (2019) for the United States and Fiori and Pacella (2018) for Italy - focus on the link between sectoral credit cycles and systemic risk, and one - Behncke (2018) - analyses the transmission mechanism of the Swiss sectoral CCyB on banks' lending and risk taking.
Basel III Monitoring Report March 2019
This report presents the results of the Basel Committee's latest Basel III monitoring exercise, based on data as of 30 June 2018. Through a rigorous reporting process, the Committee regularly reviews the implications of the Basel III standards for banks, and has been publishing the results of such exercises since 2012. The report sets out the impact of the Basel III framework that was initially agreed in 2010 as well as the effects of the Committee's December 2017 finalisation of the Basel III reforms. However, it does not yet reflect the finalisation of the market risk framework published in January 2019.
Data are provided for a total of 189 banks, including 106 large internationally active banks. These "Group 1" banks are defined as internationally active banks that have Tier 1 capital of more than €3 billion, and include all 29 institutions that have been designated as global systemically important banks (G-SIBs). The Basel Committee's sample also includes 83 "Group 2" banks (ie banks that have Tier 1 capital of less than €3 billion or are not internationally active).
The final Basel III minimum requirements are expected to be implemented by 1 January 2022 and fully phased in by 1 January 2027. On a fully phased-in basis, the capital shortfalls at the end-June 2018 reporting date are €30.1 billion for Group 1 banks at the target level. These shortfalls are more than 70% smaller than in the end-2015 cumulative QIS exercise, thanks mainly to higher levels of eligible capital. For Group 1 banks, the Tier 1 minimum required capital (MRC) would increase by 5.3% following full phasing-in of the final Basel III standards relative to the initial Basel III standards. This compares with an increase of 3.2% at end-2017.
The increases in both shortfalls and the change in MRC over the last six months are driven partly by a higher market risk contribution; this does not yet reflect the finalisation of the market risk framework published in January 2019, which is expected to offset the increases to some extent. By excluding all revisions to the market risk framework, the current end-June 2018 data show increases in Tier 1 MRC of 1.7%, 1.5% and 8.3% for Group 1 banks, G-SIBs and Group 2 banks, respectively, compared to 1.7%, 1.2% and 5.3% six months earlier.
The report also provides data on the initial Basel III minimum capital requirements, total loss-absorbing capacity (TLAC) and Basel III's liquidity requirements.
Proportionality in bank regulation and supervision - a survey on current practices March 2019
The Basel Committee on Banking Supervision is today publishing the results of a survey it conducted on proportionality practices in bank regulation and supervision. The report summarises the responses received to the survey by Basel Committee member jurisdictions and those of the Basel Consultative Group.
In brief, the majority of respondents to the survey currently apply proportionality measures in their jurisdictions. In most cases, such measures are applied to banks that represent a relatively small share of total banking assets in the relevant jurisdiction, although there is a fair degree of heterogeneity.
Jurisdictions rely on a number of determinants in identifying proportionality thresholds / segments. These include a wide number of balance sheet metrics and differentiation by banks' business models. In most cases, these indicators are coupled with supervisory judgment when determining the scope of banks subject to different requirements.
BIS Quarterly Review, June 2019 C7
Most jurisdictions apply some form of proportionality related to capital and liquidity requirements. These generally take the form of a modified / simpler version of existing Basel standards, particularly for the more complex risk categories, or an exemption from such requirements for certain banks. Jurisdictions similarly apply proportionate reporting and disclosure requirements, with some banks subject to less onerous requirements and submission frequencies. Most jurisdictions also apply a proportionate approach to their supervisory practices, including the intensity of on- and off-site examinations, requirements related to risk management controls and governance, and supervisory stress tests.
Survey on the interaction of regulatory instruments: results and analysis March 2019
This report summarises and analyses the results of the third-wave survey conducted by the Research Task Force on the role of multiple regulatory constraints in the Basel III framework. The latest survey (end-December 2017) retains the format of the end-December 2016 survey: each block of questions tests the impact of a regulatory instrument and provides an indication of the interaction among said instruments and the problems created by the growing complexity of the Basel III framework.
Statement on crypto-assets March 2019
The past few years have seen a growth in crypto-assets. While the crypto-asset market remains small relative to that of the global financial system, and banks currently have very limited direct exposures, the Committee is of the view that the continued growth of crypto-asset trading platforms and new financial products related to crypto-assets has the potential to raise financial stability concerns and increase risks faced by banks.
While crypto-assets are at times referred to as "crypto-currencies", the Committee is of the view that such assets do not reliably provide the standard functions of money and are unsafe to rely on as a medium of exchange or store of value. Crypto-assets are not legal tender, and are not backed by any government or public authority.1 Through this newsletter, the Basel Committee is setting out its prudential expectations related to banks' exposures to crypto-assets and related services, for those jurisdictions that do not prohibit such exposures and services.
Crypto-assets have exhibited a high degree of volatility and are considered an immature asset class given the lack of standardisation and constant evolution. They present a number of risks for banks, including liquidity risk; credit risk; market risk; operational risk (including fraud and cyber risks); money laundering and terrorist financing risk; and legal and reputation risks. Accordingly, the Committee expects that if a bank is authorised and decides to acquire crypto-asset exposures or provide related services, the following should be adopted at a minimum:
• Due diligence: Before acquiring exposures to crypto-assets or providing related services, a bank should conduct comprehensive analyses of the risks noted above. The bank should ensure that it has the relevant and requisite technical expertise to adequately assess the risks stemming from crypto-assets.
• Governance and risk management: The bank should have a clear and robust risk management framework that is appropriate for the risks of its crypto-asset exposures and related services. Given the anonymity and limited regulatory oversight of many crypto-assets, a bank's risk management framework for crypto-assets should be fully integrated into the overall risk management processes, including those related to anti-money laundering and combating the financing of terrorism and the evasion of sanctions, and heightened fraud monitoring. Given the risk associated with such exposures and services, banks are expected to implement risk management processes that are consistent with the high degree of risk of crypto-assets. Its relevant senior management functions are expected to be involved in overseeing the risk assessment framework. Board and senior management should be provided with timely and relevant information related to the bank's crypto-asset risk profile. An assessment of the risks described above related to direct and indirect crypto-asset exposures and
C8 BIS Quarterly Review, June 2019
other services should be incorporated into the bank's internal capital and liquidity adequacy assessment processes.
• Disclosure: A bank should publicly disclose any material crypto-asset exposures or related services as part of its regular financial disclosures and specify the accounting treatment for such exposures, consistent with domestic laws and regulations.
• Supervisory dialogue: The bank should inform its supervisory authority of actual and planned crypto-asset exposure or activity in a timely manner and provide assurance that it has fully assessed the permissibility of the activity and the risks associated with the intended exposures and services, and how it has mitigated these risks.
The Committee continues to monitor developments in crypto-assets, including banks' direct and indirect exposures to such assets. The Committee will in due course clarify the prudential treatment of such exposures to appropriately reflect the high degree of risk of crypto-assets. It is coordinating its work with other global standard setting bodies and the Financial Stability Board.
Regulatory Consistency Assessment Programme (RCAP): Assessment of the Basel Committee's NSFR regulations – Brazil March 2019
Through its Regulatory Consistency Assessment Programme (RCAP), the Basel Committee monitors the timely adoption of regulations by its members, assesses the regulations' consistency with the Basel framework and examines the consistency of banks' calculation of the prudential ratios across jurisdictions. The RCAP also helps member jurisdictions to identify and assess the materiality of any deviations from the Basel framework.
This report describes the Committee's assessment of Brazil's implementation of the Basel Committee's Net Stable Funding Ratio (NSFR) standard. The Brazilian NSFR has been assessed as compliant, which is the highest possible grade
Regulatory Consistency Assessment Programme (RCAP): Assessment of the Basel Committee's large exposures framework - Brazil March 2019
This report describes the Committee's assessment of Brazil's implementation of the Basel Committee's large exposures framework. Brazil's large exposures framework has been assessed as compliant, which is the highest possible grade.
Committee on Payments and Market Infrastructure
CPMI publishes new data on correspondent banking networks showing 20% reduction in relationships over seven years March 2019
The number of correspondent banking relationships has shrunk by 20% over the past seven years, according to analysis of new data, published today by the Committee on Payments and Market Infrastructures (CPMI), the global standard setter for payment, clearing and settlement services.
The new data, which track the size and scope of the network of relationships, show a broad-based and global reduction in their number as their geographical focus narrows.
Correspondent bank networks underpin cross-border payments - vital for global trade and for migrants who send remittances home. Yet these payments are slower, more expensive and more opaque than domestic payments.
"Many families and small businesses rely on remittances to make ends meet but often face a choice between tolerating high costs or risking uncertain delivery of payments. The shrinking correspondent banking network is adding to these concerns. It may push people to use 'shadow' payment services such as cryptocurrencies that put the most disadvantaged at risk,"
BIS Quarterly Review, June 2019 C9
said Benoît Cœuré, Chair of the CPMI, on the sidelines of the High-level Meeting on Financial Inclusion hosted by the Bank for International Settlements.
"Collectively, our efforts can enhance financial inclusion by making payments more efficient and by lowering their costs," he added.
To improve access to payments, it is necessary to understand their associated trends and drivers. This requires detailed analysis, which the CPMI is undertaking. The current analysis builds on the 2016 CPMI report on correspondent banking, and is based on payment message data from over 200 jurisdictions provided by SWIFT.
The CPMI and SWIFT plan to update the analysis annually for the next five years.
Jurisdictions move forward towards implementing standards for payment, clearing and settlement March 2019
The According to the recent update to the Level 1 information made available by the Committee on Payments and Market Infrastructures (CPMI) and the International Organization of Securities Commissions ( IOSCO), jurisdictions are making progress on implementing international standards for payment systems, central securities depositories, securities settlement systems, central counterparties and trade repositories.
The Level 1 implementation monitoring is based on self-assessments by individual jurisdictions of how they have adopted measures to implement the 24 Principles for financial market infrastructures (PFMI) and four of the five Responsibilities for authorities that are included in the PFMI.
Today CPMI and IOSCO jointly released updated information on this progress through the Level 1 assessments online tracker, which is accessible on the CPMI and IOSCO websites. The online tracker does not require the publication of a Level 1 assessment report, thereby permitting jurisdictions to update their information more quickly.
Today's update shows that further progress has been made among some participating jurisdictions that had not completely adopted their implementation measures at the time of the Fifth update to Level 1 assessment report, published in July 2018. Notably, Korea and South Africa have completed the process of adopting measures that will enable them to implement the PFMI for all FMI types. Argentina, Chile and Indonesia have also reported progress in adopting measures that will facilitate their implementation of the PFMI, although additional progress is needed to achieve the highest rating for all FMI types. Thus, 23 of the 28 jurisdictions that participate in the implementation monitoring programme have adopted measures for all FMI types.
The CPMI and IOSCO encourage jurisdictions to continue to adopt measures that will enable them to implement the PFMI. To support future progress, the two bodies will continue to update the information on the Level 1 assessments through the online tracker, based on progress reported by participating jurisdictions.
Speeches
What is behind the recent slowdown?
Presentation by Mr Hyun Song Shin, Economic Adviser and Head of Research of the BIS, at the "Public Finance Dialogue" workshop arranged by German Federal Ministry of Finance and Centre for European Economic Research (ZEW), Berlin, 14 May 2019.
Proportionality in financial regulation: where do we go from here?
Speech by Mr Fernando Restoy, Chairman, Financial Stability Institute, Bank for International Settlements, at the BIS/IMF policy implementation meeting on proportionality in financial regulation and supervision, Basel, Switzerland, 8 May 2019.

C10 BIS Quarterly Review, June 2019
Exchange rates and monetary policy frameworks in emerging market economies
Speech Lecture by Mr Agustín Carstens, General Manager of the BIS, at the London School of Economics, London, 2 May 2019.
Central banking and innovation: partners in the quest for financial inclusion
Speech by Mr Agustín Carstens, General Manager of the BIS, at the Reserve Bank of India, C D Deshmukh Memorial Lecture, Mumbai, 25 April 2019..
Central banks and financial authorities can promote financial inclusion by pursuing their core objectives. By watching over price stability, they ensure that money keeps its value. By ensuring financial stability, they prevent financial institutions from failing and taking people's savings with them. And, by delivering on these objectives, they reinforce trust in the financial system. Still, achieving financial inclusion requires other elements as well. Innovation can play a crucial role in breaking down barriers to inclusion, for citizens and financial institutions alike. Policymakers can catalyse and shape innovation by providing infrastructure and utilities, as well as rules and guidelines. Central banks and innovators should work together to further financial inclusion.
Market integration: the role of regulation
Speech by Mr Fernando Restoy, Chairman, Financial Stability Institute, Bank for International Settlements, at the IIF Market fragmentation roundtable, Washington DC, United States, 10 April 2019.
Global imbalances and the international footprint of firms: what role for exchange rates?
Speech by Mr Hyun Song Shin, Economic Adviser and Head of Research of the BIS, at the Joint G20/IMF seminar on global imbalances, Washington DC, 10 April 2019.
Firms operating globally and enmeshed in global value chains have powered global growth. One indication of global firms' impact on the current account balance is that corporate saving (ie undistributed profits of firms) is an important determinant of the current account balance. Even merchandise exports need to be seen through a new lens, as balance of payments exports diverge from customs-based exports, sometimes by large amounts.
Above all, the exchange rate loses traction in balancing current accounts when global firms are playing such an important role, and instead the financial channel acquired significance through the financing of working capital such as inventories and receivables. The dollar exchange rate emerges as an indicator of financial conditions, with a strong dollar associated with tighter financial conditions. These insights shed some light on the recent slowdown in manufacturing and trade.
There are two takeaways. First, the accounting basis for macroeconomics is looking increasingly creaky in an age of global firms and global value chains. We need to rethink some key elements.
Second, the financial channel of exchange rates has become more potent, even as the traditional trade channels have waned in importance.
The international role of the euro: down but not out
Speech by Mr Claudio Borio, Head of the Monetary and Economic Department of the BIS, at the public hearing before the European Economic and Social Committee on "Strengthening the international role of the euro: European and international perspectives", Brussels, 4 April 2019.
The euro has suffered numerous setbacks as an international currency. But its heft has increased in three significant and yet underappreciated respects. In the bond market, estimates of transatlantic spillovers suggest that their strength from the euro area to the United States has been intensifying and is now practically on a par with that of spillovers going in the opposite direction. In currency markets, the euro now plays an important role as an anchor for other currencies, including China's renminbi. And in commodity markets, although commodities are mainly priced in dollars, the producer countries' currencies have tended to move with the euro against the dollar, so that commodity prices, notably that of oil, are paradoxically less volatile in euros than in dollars - the exchange rate has acted as a shock

BIS Quarterly Review, June 2019 C11
absorber. Regardless of its impact on pricing, denominating commodities in euros would have significant implications in other dimensions.
The work of the Financial Stability Institute: past, present and beyond
Welcoming remarks by Fernando Restoy, Chairman, Financial Stability Institute, Bank for International Settlements, at the Financial Stability Institute's 20th anniversary conference "A cross-sectoral reflection on the past, and looking ahead to the future", Basel, Switzerland, 12 March 2019.
The future of money and payments
Speech by Mr Agustín Carstens, General Manager of the BIS, at the Central Bank of Ireland, 2019 Whitaker Lecture, Dublin, 22 March 2019.
The bitcoin hype is over but attempts to create new forms of money or to engineer new ways to pay still appear almost weekly. Central banks have entered the fray, with about 70 percent either exploring or experimenting with so-called central bank digital currencies (CBDCs). A CBDC would allow ordinary people and businesses to make payments electronically using money issued by the central bank. But what are the consequences of such a system? How would it differ from what we have now? As money and payments form the backbone of the financial system, central banks need to understand the full consequences of opening up the monetary system for major surgery. Hence, central banks are treading cautiously, and only a very few central banks think it is likely that they will issue a CBDC.
Emerging markets aren't out of the woods yet
Extract of an article by Mr Agustín Carstens, General Manager of the BIS, and Mr Hyun Song Shin, Economic Adviser and Head of Research of the BIS, in the magazine Foreign Affa irs, published on 15 March 2019.
Emerging markets had a bumpy 2018. Over the summer, Argentina and Turkey saw their currencies fall sharply as their economies ran into trouble. Argentina had to turn to the International Monetary Fund for a $57 billion loan. Commentators sharpened their pencils, ready to draw parallels with the wave of financial crises that swept over emerging markets in the late 1990s.
Yet most emerging-market economies came through the summer's turbulence more or less unscathed. That is largely thanks to big improvements in economic and financial management since the last major wave of crises in the 1990s. Most countries that succumbed to crises then have moved from pegged exchange rates to largely floating exchange rates and have adopted sounder monetary policies. Most also now have more resilient banking systems, the result of a general shift away from risky short-term bank funding in favor of long-term funding from bond markets.
Perhaps the most remarkable change since the crises of the 1990s has come in the way emerging-market countries finance their debt. Governments now borrow much more in their own currencies than in foreign ones, making them less vulnerable to runs and currency crises. But risks remain. Developing countries still have work to do if they are to shield themselves from the vicissitudes of global financial conditions.
The new role of central banks
Speech by Mr Agustín Carstens, General Manager of the BIS, to the Financial Stability Institute's 20th anniversary conference "A cross-sectoral reflection on the past, and looking ahead to the future", Basel, 12 March 2019.
BIS Quarterly Review, March 2019 - media briefing
Remarks by Claudio Borio and Hyun Song Shin.
BIS Quarterly Review, June 2019 11
References
Amiti, M, P McGuire and D Weinstein (2017): “Supply- and demand-side factors in global banking”, BIS Working Papers, no 639, May.
Avdjiev, S and E Takáts (2014): “Cross-border bank lending during the taper tantrum: the role of emerging market fundamentals”, BIS Quarterly Review, September, pp 49–60.
Borio, C, R McCauley and P McGuire (2011): “Global credit and domestic credit booms”, BIS Quarterly Review, September, pp 43–57.
Bruno, V and H S Shin (2014): “Cross-border banking and global liquidity”, The Review of Economic Studies, vol 82, no 2, pp 535–64.
Claessens, S (2017): “Global banking: recent developments and insights from research”, Review of Finance, vol 21, no 4, pp 1513–55.
Committee on Payments and Market Infrastructures (2019): New correspondent banking data – the decline continues, May.
Ehlers, T and P McGuire (2017): “Foreign banks and credit conditions in EMEs”, BIS Papers, no 91, March.
Herrmann, S and D Mihaljek (2013): ”The determinants of cross-border bank flows to emerging markets: new empirical evidence on the spread of financial crises”, Economics of Transition, vol 21, no 3, pp 479–508.
Hüser, A (2015): “Too interconnected to fail: a survey of the interbank networks literature”, Journal of Network Theory in Finance, vol 1, no 3, pp 1–50.
McCauley, R, A Bénétrix, P McGuire and G von Peter (2017): “Financial deglobalisation in banking?”, BIS Working Papers, no 650, June.
Minoiu, C and J Reyes (2013): “A network analysis of global banking: 1978–2010”, Journal of Financial Stability, no 9, pp 168–84.
Moriguchi, C and E Saez (2010): “The evolution of income concentration in Japan, 1886–2005: evidence from income tax statistics”, in A Atkinson and T Piketty (eds), Top incomes – a global perspective, Oxford University Press.
Piketty, T (2014): Capital in the twenty-first century, Harvard University Press.
United States Department of Justice and Federal Trade Commission (2010): “Horizontal merger guidelines”.


