72
1 BIS RESEARCH PAPER NO. 110 The relationship between graduates and economic growth across countries AUGUST 2013

1
BIS RESEARCH PAPER NO. 110
The relationship between graduates and economic growth across countries
AUGUST 2013

The relationship between graduates and economic growth across countries
Authors: Dawn Holland, Iana Liadze, Cinzia Rienzo and David Wilkinson,
National Institute of Economic and Social Research
Acknowledgements: We would like to thank Simon Kirby, Geoff Mason, Mary
O’Mahony, Rebecca Riley, Ana Rincon-Aznar and members of the project steering
group for helpful comments. All errors are the responsibility of the authors.
Correspondence: [email protected]
2

The relationship between graduates and economic growth across countries
Contents Contents..................................................................................................................... 3
List of Figures............................................................................................................. 5
List of Tables.............................................................................................................. 6
Executive Summary ................................................................................................... 7
1 Introduction ......................................................................................................... 9
2 Graduates and growth: a review of the literature .............................................. 12
2.1 Theories of economic growth ..................................................................... 13
2.2 Existing empirical evidence........................................................................ 16
2.2.1 Measurement and data issues in the literature ................................... 17
2.2.2 The stock of human capital ................................................................. 18
2.2.3 Human capital flows............................................................................ 20
2.2.4 Investment in human capital ............................................................... 21
2.2.5 Human capital measured by cognitive skills ....................................... 21
2.2.6 The impact of higher education and skills ........................................... 22
3 Data sources and descriptive statistics ............................................................. 27
3.1 Countries included, time period and sources of data ................................. 27
3.2 Measures of labour productivity ................................................................. 28
3.3 Measures of human capital ........................................................................ 33
4 Growth accounting estimates............................................................................ 37
3
The relationship between graduates and economic growth across countries
4.1 Measuring the wage and productivity premia of graduates........................ 37
4.2 Growth accounting framework ................................................................... 40
4.3 Decomposing productivity growth .............................................................. 43
4.4 Sensitivity analysis for wage premia .......................................................... 48
5 Regression-based estimates............................................................................. 53
5.1 GDP Growth Models .................................................................................. 53
5.2 Error Correction Models............................................................................. 56
6 Summary and conclusions ................................................................................ 59
References............................................................................................................... 62
Annex ....................................................................................................................... 67
4

The relationship between graduates and economic growth across countries
List of Figures Figure 1. Distribution of the top 100 universities in the world ................................... 10
Figure 2. GDP (PPP) per capita by country, 1982-2005........................................... 29
Figure 3. GDP (PPP) per employment hour, by country 1982-2005 ........................ 30
Figure 4. Relative labour productivity levels, 1982, 1993 and 2005 ......................... 33
Figure 5. Tertiary education employment shares (percentage), by country 1982-2005
................................................................................................................................. 34
Figure 6. Correlation between output per employee hour and tertiary education
employment share (1982-2005) ............................................................................... 36
Figure 7. Average wage premia for high and medium levels of educational
attainment, 1982-2005 ............................................................................................. 38
Figure 8. Wage premia for high skilled workers 1982-2005, high and low
observations............................................................................................................. 39
Figure 9. Average annual growth rates in GDP, hours worked and labour
productivity, 1982-2005 ............................................................................................ 43
Figure 10. Average contributions of growth in capital per hour worked, TFP and skills
to growth in output, 1982-2005................................................................................. 45
Figure 11. Contributions of higher, medium and low skills growth to output growth,
1982-2005 ................................................................................................................ 46
Figure 12. Models for wage premia of higher skills, UK ........................................... 50
Figure 13. Contribution of graduate skills accumulation to GDP growth in the UK
under different assumptions, 1994-2005 .................................................................. 52
5

The relationship between graduates and economic growth across countries
List of Tables Table 1. GDP (PPP) per capita and GDP per employment hour and annual average
change, (index: USA=100 in 1982), by country, 1982-2005..................................... 31
Table 2. Tertiary education employment shares and annual average change by
country, 1982-2005 .................................................................................................. 35
Table 3. Decomposition of average annual growth rates in output, 1982-2005....... 47
Table 4. Contribution of graduate skills accumulation to average productivity growth
under different assumptions, 1994-2005 .................................................................. 51
Table 5. Growth Regression Results: Ordinary Least Squares ................................ 54
Table 6. Error Correction Regression Results: Pooled Mean Group Estimates ....... 58
Table A1. Cross-study comparison .......................................................................... 67
6

The relationship between graduates and economic growth across countries
Executive Summary Higher Education (HE) is recognised as a key economic sector in the UK, having an
impact on economic growth and competitiveness. However, producing estimates of
the impact of HE on growth and competitiveness is a major challenge. In most
countries, there is a dilemma about the amount of public resources that should be
devoted to education, which has been amplified by the period of fiscal adjustment
faced by many of the advanced economies. In this study we consider the evidence
on the impact of HE on economic growth and productivity, drawing conclusions on
the longer-term benefits of current investment in degree-level education.
The objectives of this research are to:
Explore the relationship between graduates and economic growth;
Assess what should be the key variable (or variables) of interest; and
Quantify the relationship.
The empirical literature typically finds a positive relationship between education and GDP growth. However, a multitude of indicators are used,
particularly to capture measures of education, which makes the studies hard to
compare. Most studies focus on GDP growth or the growth in GDP per capita, whilst
measures of education fall into one of four types. Most commonly used are average
years of schooling, but several studies consider school and university enrolment
rates; monetary investment in education; or internationally standardised test scores.
Relatively few studies identify different levels of education, so the impact of
graduates on growth is not often considered.
A theoretical framework derived from a standard Cobb-Douglas production function
indicates that GDP per unit of labour input should be related to the share of labour of
a particular type (graduates or workers at different qualification levels) weighted by
the average human capital of the type of worker (captured by the relative wages of
different types of labour input). Such data has recently been collated for many of the
7

The relationship between graduates and economic growth across countries
advanced economies through the EUKLEMS project. We exploit this data for 15
countries for the period 1982 to 2005.
Our key findings are:
GDP per employment hour increased from 1982-2005 in all countries. The highest annual average percentage change was in Finland (2.7%); Japan
(2.5%) and the UK (2.4%). These countries had the lowest level of GDP per
employment hour in 1982, whilst throughout the period considered the
Netherlands and the US had the highest GDP per employment hour.
The share of employment with tertiary education also increased from 1982-2005 in all countries. The highest annual average percentage change
was in Australia (5.0%) followed by the UK (4.9%). Both of these countries
had relatively low shares of employment with tertiary education in 1982 at
6.0%, compared with 22.1% in the US and 18.7% in Finland. The large
increase closed the gap, but the US and Finland still had higher employment
shares with tertiary education than Australia and the UK in 2005.
Growth accounting analysis indicated that graduate skills accumulation contributed to roughly 20% of GDP growth in the UK from 1982-2005. This approach limits the estimated impact to the productivity enhancement
directly accrued to graduates and misses any externalities to HE which may
raise the productivity of the rest of the economy. Econometric analysis
addresses these issues.
Our econometric analysis indicated that a 1% increase in the share of the workforce with a university degree raises the level of long run productivity by 0.2-0.5%. The long-run adjustment is gradual, with about 5-
15% of the correction absorbed per annum. With the UK share of the
workforce with a university education having increased by 57% between 1994
and 2005, our estimates suggest this will have raised UK long-run productivity
by 11-28%. This means that at least one-third of the 34% increase in labour
productivity between 1994 and 2005 can be attributed to the accumulation of
graduate skills in the labour force.
8

The relationship between graduates and economic growth across countries
1. Introduction The role of Higher Education (HE) in improving economic growth and
competitiveness is widely acknowledged. However, producing estimates of the
impact of HE on growth and competitiveness is a major challenge, and in most
countries there is a dilemma over the amount of public resources that should be
devoted to education. This dilemma has become particularly acute during the difficult
period of fiscal adjustment currently faced by many of the advanced economies. The
aim of this study is to consider the evidence on the impact of HE on economic
growth and productivity, in order to draw conclusions on the longer-term benefits of
current investment in university-based education. Within this, the objectives are to:
Explore the relationship between graduates and economic growth;
Assess what should be the key variables of interest; and,
Quantify the relationship.
Universities come in many guises. Some are centres for elite education, others for
frontier research, whilst the majority may be neither of these. The economic benefits,
both to the individual and to the wider economy, of a university degree will clearly
depend on the quality and breadth of skills imparted. The set of countries covered by
this study contain 90 per cent of the 100 best universities in the world1. This
suggests that the returns to HE in this subset of countries may be higher, on
average, than in many other countries. Barrell et al (2010) found a strong correlation
between the number of such institutes per million of population and productivity
performance. Figure 1 plots the number of elite universities in each country in our
sample per million of population. The US, the largest country in the sample, has 47
9
1 We use the 2012-13 version of the Times Higher Education Supplement world university rankings which uses a combination of research, citations and teaching to rank the top 100 universities in the world. See www.timeshighereducation.co.uk/world-university-rankings.

The relationship between graduates and economic growth across countries
elite universities, whilst the UK has 102. The highest number per million of population
are found in the Netherlands and Australia, followed by Sweden and Belgium.
Figure 1. Distribution of the top 100 universities in the world
0.00
0.05
0.10
0.15
0.20
0.25
0.30
0.35
0.40
0.45
Aus
tral
ia
Aus
tria
Bel
gium
Can
ada
Den
mar
k
Fin
land
Fra
nce
Ger
man
y
Ital
y
Japa
n
Net
hs
Sw
eden
Spa
in
UK
US
per m
illio
n po
pula
tion
Source: Times Higher Education Supplement and NiGEM database
UK universities have an outstanding research performance and reputation, which is
reflected in international university rankings such as the QS ranking, the Times
Higher Education world rankings illustrated above, the Academic Rankings of World
Universities and the Shanghai ranking of the world’s top 10 universities. After the
United States, the UK is the most preferred destination of international students. In
the academic year 2010-11, nearly 300,000 foreign non-EU students, mainly from
China and India, were willing to pay higher, international tuition fee rates to study in
the UK. In addition, 130,000 non-UK students from the EU were enrolled in a full or
part-time course at a UK higher education institution. In total, international students
constitute about 17 per cent of the student population.
The recent report by the LSE Growth Commission, ‘Investing for Prosperity’,
highlights the importance of maintaining funding for research and an open
10
2 There is an English language bias in the evaluation of elite universities, as the core language of science is English, and for instance if universities in France have policies to promote French language journals then their ranking will be affected. This bias does affect our overall conclusion.

The relationship between graduates and economic growth across countries
environment in which universities can compete for the best minds – both in terms of
students and faculty. The report stresses that ‘the knowledge and understanding
created in universities play a central role in building a flexible and adaptable
economy’. Centres of HE benefit the economy through their role in the education and
skill development process as well as providing centres for research that develop
productivity enhancing innovations. They also act as an increasingly important
source of export revenue, as HE becomes a globalised industry with enormous
growth potential.
Below we first review some of the key literature relating graduates and growth. We
then review some key measures of productivity and human capital from a descriptive
perspective to provide context to interpret the existing literature and introduce the
empirical work that follows. This is followed by an analysis of the contribution of HE
skills to GDP growth using growth accounting techniques. This provides a useful
benchmark for assessing the importance of HE relative to other productivity
enhancing factors over the sample period. However, the approach limits the
estimated impact to the productivity enhancement directly accrued to the graduates.
Given the dual role of universities, which provide centres of education as well as
research, this may well underestimate the total macro-economic effects of an
expanded HE system. It will also fail to capture other externalities to HE, such as
improved management techniques that raise productivity at all skill levels. In the final
section we address these issues through a series of econometric estimates that
relate the expansion of HE skills to productivity growth.
11

The relationship between graduates and economic growth across countries
2. Graduates and growth: a review of the literature
Improvements in educational outcomes have been widely recognised as essential in
enhancing growth in both developed and developing countries. In the past few
decades an influential macroeconomic literature has emphasised how education, as
a measure of human capital, could generate long-term sustained economic growth.
On the one hand, as claimed by Stevens and Weale (2003), since education delivers
economic benefits to individuals, we should expect to see effects of education on
groupings of individuals (nations) too. On the other hand, education acquired by
individuals provides social returns at the macroeconomic level, yielding additional
indirect benefits to growth (Sianesi and Van Reenen, 2003).
Theories of economic growth have emphasised the role of human capital and the
different mechanics through which it may affect economic growth. The main
theoretical approaches highlighting the connection between human capital and
economic growth are the augmented Solow neo-classical approach and the new
growth theories.
The standard growth model developed by Solow (1957) extends the basic production
function by adding human capital as an extra input in the aggregate production
function, where the output of the macro economy is a direct function of factor inputs:
physical capital, labour and human capital, augmented by a term known as the
Solow residual, or total factor productivity, which drives technical progress or the
productivity of these factor inputs. The endogenous growth models argue that total
factor productivity is determined within the model, instead of being driven by
exogenous technological progress. Unlike the neoclassical theories, endogenous
growth models have explicitly included education by emphasising its role in
increasing the innovative capacity of the economy through developing new ideas and
technologies.
12

The relationship between graduates and economic growth across countries
In the next section of the report we set out the main approaches to modelling
economic growth (Section 2.1). In Section 2.2 we discuss the main results from the
empirical literature whilst highlighting some of the key measurement issues relating
to modelling the influence of graduates on growth.
2.1 Theories of economic growth
The modelling framework that has been adopted in the vast majority of empirical
studies that assess the relationship between education and economic growth is
constructed around a simple Cobb-Douglas production function such as:
(1) 1HAKY
where Y is output, A is total factor productivity, K is the stock of physical capital, and
H is the stock of human capital. H can also be disaggregated into the average level
of human capital per worker (h) and the amount of labour input (L), so that we can
express equation (1) as:
(2) 1)(hLAKY
Some authors have treated this as a 3-factor production process, where labour input
is disembodied from human capital, as in Mankiw, Romer and Weil’s model (1992).
The key difference being that the elasticity on h is not restricted to be the same as
the elasticity on L or K (although the three are still constrained to sum to one).
Alternatively, L can be disaggregated into different types of labour, where hl is
average human capital of worker type l and Ll is the amount of labour input of type l.
In this case equation (1) can be expressed as:
(3)
1
1
L
l ll LhAKY
Expressing the variables in terms of per unit of labour input and taking logs, equation
(1) can be expressed as:
(4)
L
H
L
KA
L
Yln)1(lnlnln
Or
13

The relationship between graduates and economic growth across countries
(5) hkAy ln)1(lnlnln
Or
(6)
L
LhkAy
L
l ll1ln)1(lnlnln
With y and k being, respectively, output and physical capital stock per unit of labour
input and hlLl/L is the share of labour input of type l weighted by the average human
capital of type l.
In the original model developed by Solow (1957), A is assumed to be exogenous. By
contrast endogenous growth models often include variables such as foreign direct
investment (FDI) and openness to capture the economy’s ability to absorb
technology from abroad; and the domestic stock of R&D or government spending on
R&D to capture the innovative capacity of the domestic economy. In addition, studies
such as Bils and Klenow (2000) look for externalities to education (social returns
beyond returns to the individual) by modelling A as a function of measures of human
capital/schooling in addition to the direct role expressed in equations (5) or (6)
above.
Based on the above derivation, we can describe a full long-run model that underlies
the majority of empirical studies of the relationship between education and growth3
as:
(7) hkZhAy ln)1(ln,lnln
where the variables are as defined above, ε is an error term and Z is a vector of
control variables such as the degree of openness of economies to trade and foreign
investment, R&D spending and various dummy variables to control for country- and
time-related influences on economic activity. The fundamental underlying framework
is adapted in each study, depending on whether the authors are interested in
explaining differences in the levels of productivity across countries, differences in the
growth rates of productivity across country, the development of productivity within a
14
3 The majority of studies surveyed by Sianesi and Van Reenen (2003) have this framework at their foundation, as do most of the studies reported in Table A1 (Annex).

The relationship between graduates and economic growth across countries
country or set of countries, or decomposing growth within a country or group of
countries.
Many authors have focused on explaining differences in the growth rate of
productivity across countries (e.g. Judson (1998), Krueger and Lindahl, 2001 and
Benhabib and Spiegel, 1994) and have utilised the difference version of equation (7)
in estimation:
(8) hkZhAy lnln,lnln 321
Finally, many of the cross-country growth regression studies have combined the
dynamic and level equations, to include some starting level measures, such as the
initial levels of income, physical capital, distance from the technology frontier or
schooling (e.g. Levine and Renelt, 1992; Gemmel, 1996; Barro, 1997; Cohen and
Soto, 2007):
(9) ZhAhkZhAy ,lnlnln,lnln 20121
where 0 indicates starting level values. The cross-section growth regression model
from equation (9) can be readily adapted to a dynamic framework, and expressed as
an error-correction equation, with short-run dynamics around a long-run relationship,
as used, for example, by Mason et al (2012). A full encompassing model, which
allows for the possibility that the relationship is purely dynamic with no long-run
relationship (e.g. δ2 = 0), can be expressed as:
(10)
1,51413
,4432
1,1112111121
lnlnln
lnlnlnln
lnlnlnlnln
tzztt
itzziitiitiiti
tzztttt
Zhk
Zhky
Zhkyy
All of the modelling frameworks used in the empirical studies that we review can be
nested within equation (10), which we will use as the primary framework for our
econometric work.
15

The relationship between graduates and economic growth across countries
2.2 Existing empirical evidence
Theoretical models, based on derivations similar to that presented above, imply that
sustained growth relies on the potential for human capital to grow without bound. As
such, policy on education should be prioritised when considering the determinants of
growth (Temple, 2003). Empirical studies have been undertaken in order to support
this theoretical premise. The most common empirical approach in the literature to
study the impact of education on growth has been through cross-country growth
regressions, using a framework such as that specified in equation (9) above. These
studies relate a measure of the growth rate of productivity to the average level, or
growth rate, of education within a country.
Sianesi and Van Reeenen (2003) provide a thorough survey of the empirical
evidence on the relationship between human capital and growth. They conclude that
there is strong empirical evidence that human capital increases productivity,
suggesting that education really is productivity-enhancing, rather than just a device
used by individuals to signal their ability to potential employers. The studies
surveyed typically suggest that a one-year increase in average education is found to
raise the level of output per capita by between three and six percent, or raise the rate
of potential growth by just over one percentage point per annum – depending on the
type of model adopted.
Table A1 (Annex) summarises the findings of a set of key studies on the relationship
between education and growth. This set includes some of the seminal papers
surveyed by Sianesi and Van Reenen (2003), but is primarily focused on more
recent studies that were not covered by this survey. Most of the papers that we
survey typically present multiple model specifications and proxies to capture the key
variables. However, the table only displays the main result/model for each paper4.
The table also includes information on the measures used, time period and country
coverage of each study.
16
4 Where it is difficult to identify a preferred or main result within a paper, we have selected the model that is most directly comparable to the empirical approach of this study.

The relationship between graduates and economic growth across countries
As the measures and structure of the models surveyed differ across studies, the
empirical results are not strictly comparable. Nonetheless, the key message from
Table A1 supports the conclusions of Sianesi and Van Reenen (2003). Irrespective
of the proxies and measures used in estimation, almost all the studies found a
positive and significant effect of human capital on growth. The only exceptions are
the studies by Benhabib and Spiegel (1994) and Pritchett (2001) who found a
negative, but not statistically significant relationship between human capital and
growth. Holmes (2013) also failed to find a significant relationship between higher
education and GDP growth using a range of cross-country regression frameworks,
and warns that the results of cross-country regression estimates, such as that used
by Gemmell (1996), should be viewed with caution, as the results are sensitive to the
sample period and country coverage.
2.2.1 Measurement and data issues in the literature
Empirical studies have adopted a range of different measures and proxies to
represent the variables underpinning the theoretical framework presented above. For
example, y, which represents output per unit of labour input in equations (5)-(10),
has been most commonly proxied by GDP per capita. A preferred measure would
reflect developments in employment rather than total population – as demographic
and other factors may affect the correlation between the two. However, this variable
is difficult to measure for some countries – especially in studies that use a large
cross-section of countries that include developing as well as developed economies.
If average working time per employee is also non-stationary, output per hour of
labour input would be the preferred measure of y. Some studies have modelled total
factor productivity (TFP) as the dependent variable, although this is not a directly
observable figure and subject to a wide degree of measurement error.
The presumption behind most of the empirical studies is that an educated labour
force is better at creating, implementing, and adopting new technologies, thereby
generating growth (Benhabib and Spiegel, 1994). One of the issues arising when
considering the effect of human capital on economic growth is how human capital
should be measured (Hanushek and Kimko, 2000). The primary measures used to
capture the average level of human capital per worker include:
17

The relationship between graduates and economic growth across countries
the average number of years of schooling of the workforce or population, which assumes a linear relationship with human capital.
the share of the workforce/population with specific educational qualifications school enrolment rates – especially as a starting value. This flow into
education is often used as a proxy for the potential stock of educational qualifications, and is available for a very large cross-section of countries.
a discounted wage premium of education over unskilled labour (Pritchett, 1999)
Mincer-style wage equations or Tornqvist relationships that relate human capital to wage returns.
investment in education – sometimes disaggregated by type (Aghion et al, 2009)
cognitive skills, usually measured through international test scores such as the PISA and TIMSS.
Over time, data improvements have meant that different, and often more appropriate
indicators of human capital have become available for an increasing number of
countries. The EUKLEMS database marks a significant improvement over previous
datasets, as it allows us to identify both the share of actual employment undertaken
by individuals with different levels of educational attainment and also the share of
labour compensation that goes to each group. However, the database is only
available for a relatively small set of advanced economies. Many studies have shown
that splitting cross-section samples according to levels of economic development
shows that the relationship between education and growth is sensitive to the stage of
development. This suggests that employing more appropriate datasets for smaller
groups of countries that are at a similar level of development is likely to lead to more
robust results.
Below we review the key literature, differentiating studies by the measure of human
capital used as the primary education indicator (stock, flow, investment, and
cognitive skills). Finally we discuss studies that specifically consider graduates in
their measure of human capital.
2.2.2 The stock of human capital
The first large cross-country dataset on the stock of human capital was compiled by
Psacharopoulos and Arriagada (1986), and reflected the average years of schooling
18

The relationship between graduates and economic growth across countries
of the labour force for 99 countries at a given point in time. Kyriacou (1991)
extrapolated this cross-section sample to a time series, using the relationship
between these stock measures and school enrolment ratios. This approach has
been used by key studies such as Benhabib and Spiegel (1994), who found a
negative and statistically insignificant relationship between the growth rate of GDP
per capita and the growth rate of human capital, but a positive relationship between
the level of human capital and productivity growth.
Kruger and Lindahl (2001) highlight the potential problems arising from
measurement errors in education, as the average schooling levels are derived from
enrolment flows. They adopt more reliable country-level education micro data, and
find a positive association between the growth rate of education and economic
growth. However, they note the strong correlation between physical and human
capital measures – both of which are subject to severe measurement error – which
makes it difficult to separately identify the effects of the different types of capital.
Cohen and Soto (2007) make further advancements in improving the quality of
human capital measures, and present a new dataset for years of schooling across
countries from 1960 to 2000 that accounts for the age structure of the population and
for three educational categories (primary, secondary, and tertiary). They also find a
significant impact of schooling on growth.
Barro and Lee (2010) provide an improved data set on educational attainment from
1950 to 2010 for 146 countries, which is disaggregated by sex and age. Using these
new education measures they provide further evidence of a significant and positive
effect of education on output.
Mason et al. (2012) differentiate between qualifications gained through academic
study and qualifications gained through vocational education and training. The key
findings are that vocational skills made positive contributions to growth in average
labour productivity (ALP) in six of the seven countries considered. The approach to
measuring human capital is broadly in line with the one used in the analysis
presented in this report, although we focus exclusively on qualifications gained
through academic study.
19

The relationship between graduates and economic growth across countries
2.2.3 Human capital flows
Human capital flows – most commonly proxied by school enrolment rates – have
been widely used in empirical studies of the relationship between human capital and
growth. This is largely due to the availability of long time series of data for a large
cross-section of countries rather than because it is viewed as preferable to the stock
measures. As improved stock measures continue to be developed, it is likely that this
approach will gradually be phased out in preference for stock measures.
Among the first studies to adopt enrolment rates as a proxy for human capital is the
contribution of Barro (1991). This study analyses the relationship between growth
and human capital for 98 countries from 1960 to 1985, using 1960 primary and
secondary-school enrolment rates as a determinant. Barro shows that enrolment
rates are positively correlated with growth in real per capita GDP.
Mankiw, Romer and Weil (1992), focusing on the same time period (1960-1985), use
the percentage of the working-age population in secondary school as a proxy for the
rate of human-capital accumulation. Their results show that including human capital
lowers the estimated effects of saving and population growth; with the augmented
models accounting for 80 percent of the cross country variation in income.
Bils and Klenow (2000) question the studies of both Barro (1991) and Benhabib and
Spiegel (1994) in that the empirical relationship they document does not exclusively
reflect the impact of schooling on growth, due to omitted factors that are related to
both schooling rates and growth rates. They conclude that the direct channel from
schooling to growth can explain less than one-third of the empirically observed
relationship between schooling and growth.
Based on the motivation that school enrolment rates conflate human capital stock
and accumulation effects, and lead to misinterpretations of the role of labour force
growth, Gemmell (1996) constructed an alternative measure of human capital based
on both school enrolment rates and labour force data. He used 1960 school
enrolment rates as a proxy for the proportion of the 1960 labour force with the
relevant level of education (primary, secondary, and tertiary), combining it with data
on the working age population in 1960 to estimate initial stocks of human capital.
20

The relationship between graduates and economic growth across countries
This measure has the advantage of providing a consistent dataset on education
stocks based on school enrolment rates and also provides a closer approximation to
educated labour being more relevant for growth than the educated population.
Estimates based on both developed and less developed countries over the period
1960-1985 support the hypothesis that both initial stocks and subsequent growth of
human capital are important in fostering faster income growth.
2.2.4 Investment in human capital
School enrolment rates have also been interpreted as a measure of the flow of
investment in human capital rather than a proxy for the stock of human capital. A
recent strand of research considers alternative measures of investment in human
capital as a determinant of growth. Keller (2006) examines three measures of
education investment: enrolment rates, public education expenditures as a share of
GDP, and public education expenditures per student as a share of GDP per capita.
She does so by estimating individual effects of primary, secondary, and tertiary
education. Her estimates suggest that the public expenditure per student and
enrolment models explained 69 percent of GDP per capita growth, with secondary
education being highly significant.
In a similar vein to Keller (2006), Aghion et al (2009) focus on the role of investment
in education (measured in actual dollars spent per person by cohorts) across states
in the US. They use a series of political instruments for different types of education
spending. Their analysis supports the existing evidence that investment in education
raises growth.
2.2.5 Human capital measured by cognitive skills
While the most frequently employed measure to capture human capital is the primary
or secondary-school enrolment rates, Hanushek and Kimko (2000) argue that these
measures do not accurately represent either the relevant stock of human capital
embodied in the labour force or changes in this stock during periods of educational
and demographic transition. A few studies have addressed this short-coming through
introducing measures of cognitive skills into the models, rather than enrolment rates
or average years of schooling. As pointed out by Hanushek and Woessmann (2010)
21
The relationship between graduates and economic growth across countries
measuring years of schooling assumes that one year of schooling delivers the same
increase in knowledge and skills, regardless of the education system; and education
systems in different countries can be very different.
Hanushek and Kimko (2000) address this by constructing new measures of
educational quality based on students’ performance on various international tests of
academic achievement in mathematics and science. In so doing they measure the
quality of the labour force by aggregating different test scores into a single measure
for each country. Using these new measures they show that labour-force quality
differences are very strongly related to growth rates for 31 countries between 1960
and 1990. Moreover, they claim that these quality measures are important for
explaining which countries are at the top and at the bottom of the distribution of
economic growth rates.
Hanushek and Woessmann (2010) also consider cognitive skills as a proxy for
education quality5. They focus on the long-run growth differences among OECD
countries, and show that educational outcomes have a crucial role for developed
countries. The empirical analysis is built on a series of cross-country growth
regressions for 24 OECD countries between 1960 and 2000. They measure human
capital using international math and science tests, and show that those tests
dramatically increase the ability of the statistical models to explain growth differences
across OECD countries.
2.2.6 The impact of higher education and skills
To a large extent, long-run changes in average educational attainment are driven by
government policies. However it is possible that as output and tax revenues
increase, governments will allocate more resources to education, and educational
enrolment rates may not be stationary over time. In this context, the human capital
stock measures described above have an advantage over the human capital flow
measures. New entrants are usually a small fraction of the labour force, and a
22
5 Hanushek and Woessmann (2010) outline that the advantages of cognitive skills are that they capture variations in knowledge and ability that schools strive to produce; they incorporate skills from any sources (families, schools, and ability); they allow for investigation of important different policies designed to affect the quality aspects of schools, and finally they are practical to use given the extensive development of consistent and reliable cross-country assessments.

The relationship between graduates and economic growth across countries
change in the flow of educational provision will affect the stock of skills only very
gradually. Measures that take into account differences in the quality of education
across countries, such as students’ performance on various international tests of
academic achievement, may have further advantages. However, these measures
are less relevant for assessing the impact of tertiary education on growth, as these
internationally comparable tests tend to be carried out at earlier stages in education.
In recent years the contribution of tertiary education to countries’ economic success
has become the focus of greater attention, since tertiary education is expected to
support the supply of skilled workers and enhance the conditions for innovation,
bringing substantial social and economic benefits (McNeil and Silim, 2012).
However, amongst the empirical evidence analysing the effect of education on
growth across countries, only a few papers explicitly analyse the role of tertiary
education. For example, Barro and Lee (2010) provide evidence that, for developed
countries, the estimated rate-of-return to an additional year of schooling is higher at
secondary and tertiary levels than at primary level. Similarly, Gemmell (1996)
highlights how the role of different levels of education varies across countries at
different stage of growth. Specifically, he shows that the primary level appears to be
important in the poorest low developed countries; secondary level effects dominate
in 'intermediate' LDCs, while tertiary effects are strongest in OECD countries.
Holmes (2013), using a sample that pools countries across different levels of
development, finds a significant relationship between secondary education and GDP
growth, but not between tertiary education and growth. Keller (2006) identifies a
positive relationship between enrolment in tertiary education rates and economic
growth, while Hanushek and Woessmann (2010) find that the role of tertiary
schooling in OECD countries increased after controlling for cognitive skills, based on
educational attainment tests at the primary and secondary levels of schooling.
In the wake of diffusion of Information and Communications Technologies (ICTs) in
recent decades, an extensive literature has developed around the concept of skill-
biased technical change, i.e. skilled labour is more complementary to the
introduction and/or effective utilisation of new technologies than is unskilled labour
(Autor, Katz and Krueger, 1998; Machin and van Reenen, 1998). US evidence
23

The relationship between graduates and economic growth across countries
suggests that skills play a key role in facilitating the effective utilisation of ICTs
(Bresnahan, Brynjolfsson and Hitt (2002), and that over several decades ICTs have
enhanced the ability of educated labour required to perform non-routine tasks (Autor,
Levy and Murnane, 2003).
A number of studies in European countries have supported the US evidence of a
positive relationship between workforce education or skills and the adoption of new
technologies. Examples include firms in Spain (Bayo-Moriones and Lera-López,
2007), Switzerland (Hollenstein, 2004), Portugal (Barbosa and Faria, 2008) and
Ireland (Haller and Siedschlag, 2008). The principal mechanisms involved are that
high skilled workers can contribute more than low skilled workers to the selection,
installation, operation and maintenance of ICTs and also to the adaptation of ICTs to
firm-specific requirements. This positive relationship between education or skill
levels and ICT adoption also holds in cross-country studies involving European and
other industrial nations (Hargittai, 1999; Gust and Marquez, 2004).
Assessment of the types of skills best suited to ICTs is complicated by the fact that
the level of skills required for rapid adoption of ICTs may differ from the skills
required for their subsequent utilisation. O’Mahony, Robinson and Vecchi (2008)
report that ICT-related demand for university graduates in the US was particularly
strong in the 1980s, suggesting that early adoption of ICT in the US was facilitated
by the greater availability of university-educated workers in the US at that time
compared to European countries such as Britain, France and Germany. However,
O’Mahony et al. (2008) also find that, during the following decade, ICT-related
demand for workers with sub-graduate (intermediate) qualifications increased in the
US.
Chun (2003), in a study of the relationship between ICTs and the demand for
educated workers at industry level in the US, distinguished carefully between the
adoption and use effects of information technology and found that both had
contributed substantially to the increased relative demand for university graduates.
However, his evidence also suggested that while adoption is positively related to
highly skilled workers; as the new technology becomes fully implemented, firms may
be able to replace highly skilled workers with lower-paid less-skilled workers. In a
24

The relationship between graduates and economic growth across countries
similar vein, Ruiz-Arranz (2004) notes that as new technologies become more
established and ICT equipment becomes more user-friendly over time, fewer
graduates are likely to be needed as ICTs become more complementary to workers
with skills below graduate level.
A vast microeconomics literature has focused on identifying the returns to schooling
using regressions methods, where the estimated return is based on the coefficient
on a variable measuring years of education in an equation that controls for work
experience and other individual characteristics (the standard Mincer equation).
Mincer’s derivation of these empirical models is based on the schooling measure
being exogenous, which is open to question as to some degree, education level is a
choice variable for individuals (Harmon, Oosterbeek and Walker, 2003). When it
comes to tertiary education the role of choice is clearly more relevant. While few of
the studies separately identify the role of tertiary education, they nonetheless provide
a useful backdrop to the analysis.
Martins and Pereira (2004) analyse the returns to education at the first and ninth
deciles using micro-data for 16 developed countries during the mid-1990s. They
provide evidence of a common pattern for most of the countries, in that the returns to
education are higher at higher points of the conditional wages.
Using comparable micro-data for 28 countries from 1985 to 1995, Trostel, Walker
and Woolley (2002) estimate the rate of return and find considerable variation in
rates of return across countries, although this variation declined slightly over the
sample period. They document that the highest returns to education are found in
countries with incomes that are relatively high (USA and Japan) and relatively low
(Philippines), as well as in-between (Northern Ireland, GB, Slovenia and Poland).
Moreover, they provide evidence that the rate of return declines with average
educational attainment, per capita income, and relative spending on education.
The empirical evidence clearly supports the assertion that the human capital
embodied in higher education strengthens economic growth prospects. This role has
been particularly prominent during the ICT revolution of recent decades. While ICT
may have evolved to a stage where tertiary skills are less important for absorbing
25

The relationship between graduates and economic growth across countries
productivity enhancements, it does not necessarily follow that HE skills are likely to
become less relevant over time. Freeman and Soete (1997) describe the growth
process over the last two centuries as a sequence of product innovation cycles
where new products are developed, followed by process innovation cycles where
those products are improved. Recent product innovations have been closely linked
to university level research and innovation. It is of course impossible to know where
the next wave of scientific innovation might come from, but a strong research base,
supported by top quality universities, is clearly conducive to leading product
innovation. The diffusion of innovations is also more likely to be accelerated by a
highly-skilled labour force, as observed in the case of the ICT wave of innovation.
26

The relationship between graduates and economic growth across countries
3. Data sources and descriptive statistics
In this section of the report we introduce the data to be used in our analysis and
provide a brief description of key measures of labour productivity and human capital.
3.1 Countries included, time period and sources of data
Most of the required data for analysis is downloadable from our National Institute
Global Econometric Model (NIGEM) database. This includes data on:
GDP GDP per capita GDP per employment hour Investment Size of the Labour Force A measure of country openness – the sum of exports and imports as
percentage of GDP
We also have added data on Research and Development (available from the OECD)
and data on Foreign Direct Investment (available from UNCTAD).
The main data required from other sources is the share of employment by education
level and the share of labour compensation by education level. We have considered
a number of different sources for this information and conclude that the best
available data comes from EUKLEMS. This provides data from 1982-2005 for most
EU as well as some large non-EU countries. More recent data is available for a
smaller number of countries, but given that one of the key aims of the analysis is to
establish the long run relationship between graduates and growth across countries
we decided to limit the period of analysis to 1982-2005 to allow a broader coverage
of countries.
27

The relationship between graduates and economic growth across countries
A comprehensive data set is then available for the following 15 countries covering
the period 1982-2005:
Australia Austria Belgium Canada Denmark Finland France Germany Italy Japan Netherlands Spain Sweden UK US
3.2 Measures of labour productivity
Figures 2 and 3 and Table 1 report descriptive statistics for indexes of labour
productivity measured by GDP per capita and GDP per employment hour for our 15
countries from 1982-2005.
Figure 2 plots for each country the GDP (in Purchasing Power Parity, PPP) per
capita, showing that on average between 1982 and 2005 the level of GDP per capita
has been increasing in all countries, though at a different speed.
The US stands out with the highest level of GDP per capita in both the initial
and final year of the analysis.
Even though the UK had the second lowest GDP per capita in 1982, by the
end of 2005 its GDP per capita became the 9th largest amongst the countries
in our sample.
28

The relationship between graduates and economic growth across countries
Figure 2. GDP (PPP) per capita by country, 1982-2005
10
20
30
40
50
1982
1983
1984
1985
1986
1987
1988
1989
1990
1991
1992
1993
1994
1995
1996
1997
1998
1999
2000
2001
2002
2003
2004
2005
GD
P p
er c
apita
(in
thou
sand
s)
Australia Austria Belgium Canada DenmarkFinland France Germany Italy JapanNetherlands Spain Sweden UK US
Source: NiGEM database
The majority of cross-country regression studies that have assessed the relationship
between growth and educational attainment have relied on GDP per capita as the
measure of productivity. This is due to data limitations, especially when expanding
the sample to include developing and emerging economies. However, the preferred
measure of labour productivity is GDP per employment hour (Figure 3). According to
this measure, differences in growth rates are more marked across countries.
The experiences of Italy and Spain stand out, as in both countries GDP per
employment hour essentially stopped growing from the middle of the 1990s.
29

The relationship between graduates and economic growth across countries
Between 1982 and 2005, the rate of change in output per employment hour
for the UK was amongst the top three highest in our sample of countries.
Figure 3. GDP (PPP) per employment hour, by country 1982-2005
10
20
30
40
50
60
1982
1983
1984
1985
1986
1987
1988
1989
1990
1991
1992
1993
1994
1995
1996
1997
1998
1999
2000
2001
2002
2003
2004
2005
GD
P p
er e
mpl
oym
ent
hour
(in
thou
sand
s)
Australia Austria Belgium Canada DenmarkFinland France Germany Italy JapanNetherlands Spain Sweden UK US
Source: NiGEM database
Table 1 shows GDP per capita and GDP per employment hour in 1982 and 2005
and the annual average growth rate of the two measures between 1982 and 2005.
Spain had the lowest GDP per capita in 1982, followed by the UK.
These countries had the highest growth in GDP per capita over the whole
period (UK 2.7% p.a. and Spain 2.5% p.a.). However, this still leaves Spain
with the lowest GDP per capita in 2005, along with Italy.
30

The relationship between graduates and economic growth across countries
The US, followed by Canada, had the highest level of GDP per capita in both
1982 and 2005.
Despite being the two countries with the lowest share of the workforce with
tertiary level of education, Netherlands and Denmark are the countries with
respectively the third and fourth highest level of GDP per capita in 1982.
Table 1. GDP (PPP) per capi ta and G DP per employ ment hour and annual average change, (index: USA=100 in 1982), by country, 1982-2005
Countries GDP per capita GDP per employment‐hours
Year 1982 2005 1982‐2005 Annual average change, percent
1982 2005 1982‐2005 Annual average change, percent
Australia 83.2 135.2 2.0 83.8 122.4 1.6 Austria 83.6 136.4 2.1 84.7 132.5 1.9 Belgium 82.0 129.6 1.9 96.7 152.3 1.9 Canada 91.2 140.0 1.8 88.4 123.8 1.4 Denmark 86.4 134.0 1.9 86.8 129.8 1.7 Finland 74.0 122.0 2.1 62.9 119.4 2.7 France 84.8 122.0 1.5 91.3 152.7 2.2 Germany 81.2 120.4 1.6 84.2 136.6 2.0 Italy 76.0 112.0 1.6 85.3 122.4 1.5 Japan 76.4 123.2 2.0 57.4 104.0 2.5
Netherlands 87.6 140.4 2.0 106.4 153.6 1.5 Spain 60.8 109.2 2.5 82.5 113.3 1.3 Sweden 85.2 132.8 1.9 82.7 132.0 2.0
United Kingdom 67.6 129.2 2.7 69.8 124.1 2.4 United States 100.0 170.0 2.2 100.0 155.6 1.9
Source: NiGEM database
The pictures change slightly when looking at GDP per employment hour.
In 1982 the three countries with the lowest level are Japan, Finland and the
UK, with Netherlands having the highest level of GDP per employment hour
followed by the US.
31

The relationship between graduates and economic growth across countries
By 2005 the US and the Netherlands swapped positions.
The growth rate of GDP per employment hour was highest in Finland at 2.7%
per annum followed by Japan and the UK (2.5% and 2.4% p.a. respectively).
Despite this, Japan still had the lowest level of GDP per employment hour in
2005.
Spain had the lowest growth in GDP per employment hour (1.3% p.a.), as
productivity stagnated in the second half of the sample period, leaving it next
to bottom of the countries (only above Japan) in terms of GDP per
employment hour in 2005.
Turning to comparisons of GDP per employment hour, or average labour productivity
(ALP) levels (Figure 4).
The productivity leader from 1982 to 2000 was the Netherlands overtaken by
the US since 2001.
Although the Netherlands was ahead of all the countries in the sample (except
for the US) throughout this time period, several countries significantly reduced
the ALP gap between themselves and the Netherlands: Belgium, France and
Germany narrowed the ALP gaps substantially such that by 2005 ALP in
Belgium and France was about 99% of the Dutch level while German ALP
was 89% of the Dutch level6.
The ALP gap for the UK reduced from 66% of the Netherlands in 1982 to 73%
in 1993 and 81% in 2005.
6 These estimates of ALP levels across countries are based on conversion of output values from
domestic currencies to a common currency (US$) using 2005 purchasing power parity (PPP)
exchange rates.
32

The relationship between graduates and economic growth across countries
Figure 4. Relative labour productivity levels, 1982, 1993 and 2005
0
20
40
60
80
100
120
Aus
tral
ia
Aus
tria
Bel
giu
m
Can
ada
Den
mar
k
Fin
land
Fra
nce
Ger
man
y
Ital
y
Japa
n
Net
hs
Spa
in
Sw
eden UK
US
Rel
ativ
e la
bour
pro
duct
ivity
leve
ls (I
ndex
: Net
herl
ands
=10
0)
1982 1993 2005
Source: NiGEM database
3.3 Measures of human capital
Figure 5 and Table 2 provide some descriptive statistics for the share of employment
with tertiary education in the 15 countries from 1982 to 2005. Figure 5 shows that
between 1982 and 2005 the share of workers with a tertiary level of education
increased in all countries, although the rate of increase and the starting level vary
significantly across the countries.
33

The relationship between graduates and economic growth across countries
Figure 5. Tertiary education employment shares (percentage), by country 1982-2005
0
10
20
30
40
1982
1983
1984
1985
1986
1987
1988
1989
1990
1991
1992
1993
1994
1995
1996
1997
1998
1999
2000
2001
2002
2003
2004
2005
Per
cent
Australia Austria Belgium Canada DenmarkFinland France Germany Italy JapanNetherlands Spain Sweden UK US
Source: EUKLEMS
This is better seen from Table 2, which shows the share of workers with tertiary
education in 1982 and 2005, and the corresponding average annual growth rate of
these shares.
In 1982 Denmark was the country with the lowest share of workers with a
tertiary level of education (3.2%), although during the time period analysed its
average annual percentage change is amongst the highest (4.0%).
In 2005 Denmark and Germany are the only two countries with less than 10%
of workers with a tertiary level of education.
34

The relationship between graduates and economic growth across countries
In 1982 United States and Finland had the highest share of the workforce with
tertiary education. They remain the countries with the highest share of tertiary
educated workers in 2005, although growth rates in these employment shares
in other countries have been considerably higher.
Australia had the highest (5.0%) average annual percentage change in the
share of workers with a tertiary level of education followed by the UK (4.9%).
Table 2. Tertiary education employment shares and annual average change b y country, 1982-2005
Country 1982 2005 1982-2005 Annual average change,
percent Australia 6.0 19.6 5.0 Austria 5.5 13.5 3.8 Belgium 7.6 15.4 3.0 Canada 12.6 22.5 2.4 Denmark 3.2 8.3 4.0 Finland 18.7 35.0 2.6 France 6.1 15.3 3.9 Germany 5.8 9.5 2.1 Italy 5.0 12.8 4.0 Japan 14.0 26.3 2.7 Netherlands 4.6 12.9 4.3 Spain 8.4 21.6 4.0 Sweden 10.3 19.9 2.8 United Kingdom 6.0 18.9 4.9 United States 22.1 31.7 1.5
Source: EUKLEMS
Figure 6 plots correlations between output per employee hour and the average share
of the workforce holding tertiary education qualifications over 1982-2005 for each
country. It can be seen that there is a strong correlation between these variables in
all countries. However, correlation coefficients vary. They are very high in thirteen
out of fifteen countries, ranging from 0.95 for Japan to 0.997 for the UK. The lowest
35

The relationship between graduates and economic growth across countries
coefficients are observed in Spain (0.862) and Italy (0.899). However, finding a
correlation is not sufficient to establish a causal relationship between the variables.
We address this point in econometric analysis section, when we test for the
existence of a long-term relationship between the variables.
Figure 6. Correlation between output per employee hour and tertiary education employment share (1982-2005)
0.75
0.80
0.85
0.90
0.95
1.00Australia
Austria
Belgium
Canada
Denmark
Finland
France
GermanyItaly
Japan
Netherlands
Spain
Sweden
UK
US
Source: NiGEM database, EUKLEMS
36

The relationship between graduates and economic growth across countries
4. Growth accounting estimates 4.1 Measuring the wage and productivity premia of graduates
An individual’s expected economic returns to education can be clearly identified
through a comparison of the average wages of individuals with different levels of
educational attainment. The EUKLEMS database allows us to calculate average
wages for workers with different levels of educational attainment. The workforce is
disaggregated into those with “low skills”, which is defined as primary education,
“medium skills”, which includes secondary education and some types of vocational
education, and “high skills”, which is defined as holding a university degree. While
the definitions are not strictly comparable across countries at lower levels of
educational attainment, at the higher level (high skills) there is a high degree of
comparability7. They can also provide insight into within country returns to education
and the evolution of these returns over time.
Figure 7 illustrates the average wage of graduates and those with secondary
education relative to low skilled workers over the sample period 1982-2005.
Within the sample of countries, graduates, on average, are paid 70-180 per
cent more than workers without formal educational qualifications.
There is also a significant wage premium over those with secondary
qualifications below a university degree.
Average wage premium of graduates in our sample is highest in Germany,
followed by the UK.
37
7 Definitions of “high”, “medium” and “low” skilled categories are given in table 5.3 in the EUKLEMS Methodology of the March 2007 Release (http://www.euklems.net/data/EUKLEMS_Growth_and_Productivity_Accounts_Part_I_Methodology.pdf).

The relationship between graduates and economic growth across countries
Figure 7. Average wage premia for high and medium levels of educational attainment, 1982-2005
0
20
40
60
80
100
120
140
160
180
200A
ustr
alia
Aus
tria
Bel
giu
m
Can
ada
Den
mar
k
Fin
land
Fra
nce
Ger
man
y
Ital
y
Japa
n
Net
hs
Spa
in
Sw
eden UK
US
Per
cent
pre
miu
m r
elat
ive
to lo
w s
kille
d
High Medium
Source: Derived from EUKLEMS
The wage premia have been relatively stable across most countries over the course
of our sample period, although we have seen a tendency for the wage premia of
graduates to rise in the US and to a lesser extent in Germany and Canada, while
they have tended to become more compressed in Italy, France and Austria. Figure 8
illustrates the average wage premia for high skilled workers over the full sample
period of 1982-2005, compared to the high and low observations within the sample
period to give an indication of the variance over the sample period.
US, Italy, and Canada show the highest variation in the wage premium for
high skill workers, while Australia, Sweden and Finland the lowest.
38

The relationship between graduates and economic growth across countries
The UK experiences some variation in the wage premium, however it is not
amongst the highest in the sample.
Figure 8. Wage premia for high skilled workers 1982-2005, high and low observations
0
50
100
150
200
250
Aus
tral
ia
Aus
tria
Bel
giu
m
Can
ada
Den
mar
k
Fin
land
Fra
nce
Ger
man
y
Ital
y
Japa
n
Net
hs
Spa
in
Sw
eden UK
US
Per
cent
pre
miu
m r
elat
ive
to lo
w s
kille
d
Average
Source: Derived from EUKLEMS
While it is clear that individuals with a university degree tend to have a significantly
higher wage rate than those without, what is of more interest from a policy
perspective is how this reflects on the overall productive capacity and
competitiveness of the economy as a whole. If some individuals are paid a higher
wage without having a higher productive capacity, when the share of these
individuals increases there would be a loss of competiveness and adverse effects at
the macro-economic level. However, under market principles, there should be a
strong correlation between wage differentials and productivity differentials. Under the
extreme assumption of perfectly competitive markets, a firm will hire an additional
hour of labour up to the point where that person’s marginal product equals his/her
marginal cost. Under this assumption, the wage premium of graduates should reflect
39

The relationship between graduates and economic growth across countries
their productivity premium relative to low-skilled workers. Since relative wages are
determined to a large extent by employer demand, relative productivity is likely to be
at least partly explained by wage differentials. However, employee wages may
deviate from their marginal products due to imperfect labour market conditions and
other factors. Furthermore, the extent of divergence between wages and marginal
products may vary systematically between countries due to the operations of
country-specific labour market institutions such as collective bargaining procedures
and minimum wage legislation, and may also vary over time if the incidence of skill
shortages is time varying.
In the growth accounting work below we employ the assumption that workers are on
average paid their marginal product in order to estimate the contribution of graduate
skills to GDP growth over the sample period. We make the simple assumption of a
constant wage premium over time, reflecting a constant productivity premium of
individuals with a university degree over those without educational qualifications,
using the average premia illustrated in Figure 7 above. We then consider some of
the sensitivities around this assumption.
4.2 Growth accounting framework
Robert Solow (1957) is generally attributed with the introduction of the theoretical
framework for growth accounting. Solow’s framework specifies an explicit model of
potential output as a function of factor inputs, such as capital and labour, and an
efficiency indicator termed total factor productivity (TFP)8. This approach assumes a
general underlying production function that maps the factor inputs to final output,
thereby representing the productive capacity of an economy. With two factors of
production this can be expressed as:
ttt TLKfY ,,
(11)
where Y is the final output good, K is the capital stock, L is labour input and T
indicates the state of technology, or TFP. Totally differentiating this equation with
respect to time, and assuming perfect competition in factor markets and a
homothetic production function, the partial derivatives of the production function may
be rearranged to obtain a decomposition of the growth rate of output into the sum of
40
8 Other terms for the indicator are Solow residual, measure of ignorance, or rate of technical change.

The relationship between graduates and economic growth across countries
the growth rates of each input, weighted by their relative factor share, plus the
growth in TFP.
ttLtKt dALdKdYdtt
)ln()ln()ln( (12)
Where θKt is the share of output accruing to capital, θLt is the labour share and dAt is
the growth rate of TFP, defined as:
)ln( tt
tTt Td
Y
TfdA t (13)
We have assumed constant returns to scale, and hence θLt = (1- θKt). Growth
accounting exercises based on measures of physical units of capital and labour do
not allow us to say whether changes in TFP capture efficiency gains in the
production process achieved thanks to the implementation of technological
innovations or whether they reflect changes in the quality of capital or labour. More
can be learned from growth accounting using measures of the quality of the capital
and labour input. Skills-adjusted labour input (L) can be expressed as:
SHoursEL ** (14)
where E is total employment, Hours is average hours worked and S is a measure of
workforce skills or human capital. The basic growth accounting decomposition can
then be expressed as:
ttKttKtKt dASdHoursEdKdYdttt
)ln()1()*ln()1()ln()ln( (15)
The skill measure that we use in this study is based on the wage premia and change
in shares of the workforce high, medium and low skills, as measured by their
educational attainment. As discussed above, we estimate Sj using a single set of
benchmark qualifications-wage ratios averaged over the full sample period (1982-
2005) for each country.
We integrate the aggregate skills index into the growth accounting framework
specified in equation (15) above, and disaggregate this into the contribution from
each of the three skill categories.
A common growth accounting practice is to subtract the growth rate of (unadjusted)
labour input from both sides of equation (15), to derive a decomposition of labour
productivity into its components:
41

The relationship between graduates and economic growth across countries
ttKtt
tK
tt
t dASdHoursE
Kd
HoursE
Yd
tt
)ln()1(
*ln
*ln (16)
Equation (16) indicates that output per person hour can be decomposed into the
contribution from skills accumulation, a contribution from capital deepening, which is
the units of capital per hour worked, and the residual category, total factor
productivity. In Figure 9 we use the simple relationship between output, labour input
and labour productivity:
HoursE
YHoursEY
*** (17)
in order to decompose GDP growth in to the contribution from labour input (E*Hours)
and labour productivity, defined as output per person hour.
For the fifteen countries in our sample, the fastest average annual rate of
growth in GDP between 1982 and 2005 was in Australia (3.3%), followed by
the US (3.2%), UK and Spain (both 3.1%).
However, as shown in Figure 9, only about half of the Australian growth in
output (1.6 percentage points) reflected average labour productivity growth,
the remainder coming from an expansion in hours worked.
By contrast, average labour productivity (ALP) grew by an average 2.8% per
year in Finland closely followed by Japan and the UK (both 2.6%).
42

The relationship between graduates and economic growth across countries
Figure 9. Average annual growth rates in GDP, hours worked and labour productivity, 1982-2005
1.7
0.7
0.2
1.3
0.5
-0.2 -0.3 -0.20.3
-0.2
0.9
1.6
0.30.5
1.3
1.6
1.8
2.0
1.4
1.7 2.82.4
2.1 1.5
2.6
1.6
1.5
2.0
2.6
1.9
-1.0
-0.5
0.0
0.5
1.0
1.5
2.0
2.5
3.0
3.5
4.0A
ustr
alia
Aus
tria
Bel
giu
m
Can
ada
Den
mar
k
Fin
land
Fra
nce
Ger
man
y
Ital
y
Japa
n
Net
hs
Spa
in
Sw
eden UK
US
Ave
rag
e an
nual
gro
wth
rat
e in
out
put
(%)
Hourly labour input Productivity GDP (ppp)
Source: NiGEM database
4.3 Decomposing productivity growth
In this section we use growth accounting techniques to decompose labour
productivity growth into the contribution from capital deepening, the contribution from
skills accumulation and the residual component, total factor productivity growth.
Finally we decompose the contribution from skills accumulation into the contribution
from each of the three qualification groups. The growth accounting approach
typically splits up the sample period to assess whether the contributions of various
components have shifted over time. It is also typical to consider time periods
corresponding to a single business cycle. Here we split the sample period in half, in
order to consider 1982-1993 and 1994-2005 separately.
43

The relationship between graduates and economic growth across countries
Figure 10 shows that over the whole 1982-2005 period, the contribution of growth in
aggregate skills to output growth in all countries was substantially smaller than the
contributions made by growth in capital per hour worked (capital deepening).
The contribution made by skills was also smaller than the contribution made
by TFP growth in ten out of the fifteen countries.
Out of the five remaining Australia, Belgium and Italy had comparable
contributions made by TFP and skills growth. TFP growth was negative in
Spain and Sweden9. In Spain this probably reflects relatively inefficient use of
capital and labour resources, since the TFP measure is strongly influenced by
the efficiency with which existing resources are combined (Hulten, 2001).
Similarly to other countries, capital deepening in the UK is the main
contributor to growth, while TFP and skills together account for just above 40
percent.
44
9Stronger contribution made by capital deepening to output growth in Sweden may reflect the unavailability of data on capital services for the years 1980-1992, as missing years were filled in by applying moving average of the growth in previous three years to the latest available observation.

The relationship between graduates and economic growth across countries
Figure 10. Average contribut ions of grow th in c apital per hour w orked, TFP and skills to growth in output, 1982-2005
-20
0
20
40
60
80
100A
ustr
alia
Aus
tria
Bel
giu
m
Can
ada
Den
mar
k
Fin
land
Fra
nce
Ger
man
y
Ital
y
Japa
n
Net
hs
Spa
in
Sw
eden UK
US
% c
ontr
ibut
ions
to a
vera
ge
outp
ut g
row
th, 1
982-
2005
Capital deepening TFP Skills
Source: NiGEM database and EUKLEMS
Table 3 below shows details of these decompositions over the two time periods
1982-1993 and 1994-2005.
Skills accumulation made small but positive contributions to output growth in
all countries in each of these time periods.
A contribution of growth in high skills to output growth was positive across the
1982-2005 period in all countries (Figure 11).
In Finland, Germany, Italy, Japan, Netherlands, Sweden and the UK a
positive contribution made by growth in high-level skills across the whole
1982-2005 period exceeded positive contributions of growth of medium skills.
45

The relationship between graduates and economic growth across countries
46
In Austria, Belgium, Denmark, France and Spain a contribution of growth in
medium skills exceeded a contribution from high skills.
The contribution of low skills to GDP growth is negative, which is a reflection
of the declining share of low-skilled workers in the workforce, and does not
suggest that low skilled workers detract from growth.
Figure 11. Contributions of higher, me dium and low skills grow th to output growth, 1982-2005
-40
-30
-20
-10
0
10
20
30
40
Aus
tral
ia
Aus
tria
Bel
giu
m
Can
ada
Den
mar
k
Fin
land
Fra
nce
Ger
man
y
Ital
y
Japa
n
Net
hs
Spa
in
Sw
eden UK
US
% c
ontr
ibut
ions
to a
vera
ge
outp
ut g
row
th, 1
982-
2005
Higher Medium Low skilled
Source: NiGEM database and EUKLEMS

The relationship between graduates and economic growth across countries
Table 3. Decomposition of average annual growth rates in output, 1982-2005
Australia Austria Belgium Canada Denmark Finland France Germany Italy Japan Neths Spain Sweden UK USGDP (ppp) 1982-1993 2.9 2.7 1.9 2.1 2.0 1.5 2.1 2.4 2.0 3.9 2.3 2.7 1.3 2.9 3.0(% change) 1994-2005 3.8 2.3 2.5 3.4 2.4 3.7 2.2 1.4 1.6 1.1 2.7 3.5 3.2 3.4 3.3
1982-1993 1.4 0.8 -0.6 0.9 0.2 -1.7 -0.7 0.0 0.1 0.3 0.7 -0.2 0.0 0.1 1.31994-2005 1.9 0.6 0.9 1.7 0.7 1.2 0.1 -0.4 0.5 -0.6 1.1 3.4 0.5 0.9 1.2
1982-1993 1.5 1.9 2.5 1.2 1.8 3.2 2.8 2.4 1.9 3.5 1.6 2.8 1.2 2.7 1.71994-2005 1.8 1.8 1.6 1.6 1.7 2.5 2.1 1.7 1.1 1.7 1.6 0.1 2.7 2.5 2.1
of which1982-1993 1.1 0.9 1.5 1.4 1.0 2.2 1.2 1.4 1.2 1.8 1.0 1.8 2.3 1.5 0.81994-2005 1.3 0.8 1.2 0.8 1.0 0.6 1.0 1.5 1.0 1.3 0.8 0.6 1.8 1.4 0.9
1982-1993 0.1 0.6 0.6 -0.3 0.4 0.5 1.1 0.7 0.5 1.5 0.3 0.5 -1.1 0.6 0.61994-2005 0.3 0.7 0.0 0.7 0.4 1.8 0.7 0.2 -0.1 0.1 0.6 -1.0 0.7 0.6 1.0
1982-1993 0.3 0.4 0.3 0.2 0.4 0.4 0.4 0.3 0.2 0.3 0.2 0.5 0.0 0.6 0.31994-2005 0.2 0.3 0.3 0.1 0.2 0.1 0.3 0.0 0.3 0.3 0.2 0.5 0.3 0.4 0.2
of which1982-1993 0.7 0.3 0.4 0.4 0.2 1.0 0.4 0.3 0.2 0.4 0.3 0.6 0.1 0.6 0.51994-2005 0.4 0.4 0.3 0.3 0.3 0.2 0.4 0.1 0.4 0.7 0.4 0.6 0.6 0.6 0.4
1982-1993 -0.2 0.6 0.6 0.0 0.9 0.3 0.7 0.3 0.1 0.6 0.3 0.7 0.0 0.5 0.11994-2005 0.2 0.1 0.7 -0.1 0.3 0.2 0.3 -0.2 0.2 0.1 -0.1 0.6 0.1 0.2 -0.2
1982-1993 -0.2 -0.5 -0.7 -0.3 -0.7 -0.9 -0.7 -0.2 -0.2 -0.8 -0.4 -0.8 -0.1 -0.6 -0.31994-2005 -0.4 -0.2 -0.6 -0.1 -0.3 -0.4 -0.4 0.1 -0.3 -0.4 -0.1 -0.7 -0.4 -0.4 0.0
Percentage point contribution to average annual GDP growth of whichHourly
Capital deepening
(unadjusted)
Percentage point contribution to average annual growth in output per person-hour
Output per person hour
Low skilled
TFP (excluding skills)
Higher
Medium
Skills accumulation
Percentage point contribution to average annual growth in skills accumulation
47

The relationship between graduates and economic growth across countries
4.4 Sensitivity analysis for wage premia
The growth accounting estimates of the contribution of graduate skills accumulation
to GDP growth relies on two sets of information. The first is the change in the share
of the workforce with graduate qualifications over the sample period, and the second
is the average productivity differential between workforce members with graduate
degrees and those with no or lesser qualifications. The first is straightforward. Figure
5 in Section 3.3 illustrates the share of the workforce holding a graduate qualification
over the sample period from 1982-2005. There has been a clear upward trend in the
prevalence of graduate qualifications across all countries in our sample over this
period, although there are significant discrepancies in the shares across countries.
If the average productivity of individuals holding a graduate degree and those with no
educational qualification is the same, then the change in these shares over time
make no net contribution to GDP growth. However, based on the reasonable
assumption that wage differentials at least partly capture productivity differentials
between the skill groups, the average productivity level of the workforce will increase
when the share of higher skilled workers increases. The question is then how to
approximate the productivity differentials across skill groups. Wage premia provide a
useful guide, as discussed above, but it is important to keep in mind that employee
wages may deviate from their marginal products for a number of reasons. Labour
market institutions, such as collective bargaining procedures and minimum wage
legislation may affect wage dispersion, without necessarily bearing a relationship
with productivity differentials. This is particularly important when comparing wage
premia across countries, as these institutions may vary systematically between
countries. There may also be volatility in wage premia over time that reflects shifting
patterns of skill shortages or other factors.
Some genuine shifts in average productivity of a particular skill group may evolve
over time. For example, more widespread access to computers during university
and/or secondary education may well have allowed graduates to enter the workforce
with a higher level of skills than previous cohorts over our sample period.
48

The relationship between graduates and economic growth across countries
Alternatively, as the incidence of HE increases, and is no longer limited to the most
able pupils, the average skill level of graduates may well have declined over time.
The productivity premium of graduates may also differ systematically across
countries. This could reflect the quality of university education across countries, the
subjects studied, or the industrial structure of the economy, which may rely to a
greater or lesser degree on HE skills. Mason et al (2012) argue that it may be more
appropriate to apply common wage premia across countries, as the differences in
labour market institutions are likely to outweigh genuine differences in the
productivity of similar skill groups across countries.
In the central growth accounting work presented above, we abstracted from volatility
in wage premia over time, and applied a constant wage premium within each country
for high and medium skilled workers. We did, however, allow for differences in the
levels of productivity across countries. We now reassess the potential contribution of
graduate skills growth to productivity in the second half of the sample, based on a
series of different assumptions on wage premia, in order to assess the sensitivity of
the results to this assumption. Figure 12 illustrates the differences in the wage
premia applied to higher skills in each of the alternative models, using the UK as an
example.
The base model assumed a constant premium for each country separately
over the full sample period of 1982-2005;
The first alternative (“average 1994-2005, country varying”) splits the sample
period, and applies a constant premium within each country for the sample
period 1994-200510 (in line with the split in Table 3 above).
The next approach (“time and country varying”) allows for time varying premia
within each country.
49
10 The first two columns of Table 4 showing the contribution of graduate skills accumulation to growth based on the base model and the average wage premia for 1994-2005 are almost identical – highlighting that splitting the sample is this way does not influence the results. Given this, taking the average wage premia for the earlier period (1982-1993) produces similar results.

The relationship between graduates and economic growth across countries
The fourth approach (“time varying, country average”) allows the premia to
vary across time, but takes a weighted average across all countries, so a
common trend is applied to each country.
The final approach (“country average, constant”) takes the average wage
premia for all countries for the whole period.
Figure 12. Models for wage premia of higher skills, UK
100
120
140
160
180
200
220
1982
1983
1984
1985
1986
1987
1988
1989
1990
1991
1992
1993
1994
1995
1996
1997
1998
1999
2000
2001
2002
2003
2004
2005
Per
cent
pre
miu
m r
elat
ive
to lo
w s
kille
d
Base modelAverage 1994-2005, country varyingTime and country varyingTime varying, country averageCountry average, constant
Source: Derived from EUKLEMS
Table 4 compares the estimated contribution of higher skills accumulation to average
labour productivity growth based on the different wage/productivity premia
assumptions.
Allowing for time variation in the premia has the most significant impact on the
estimated contribution of graduate skills to productivity growth, especially in
countries such as the US and France where there is a significant trend in the
wage premia over time.
50

The relationship between graduates and economic growth across countries
51
But on the whole the estimated contributions are relatively insensitive to the
assumptions made regarding the magnitude of the premia.
Table 4. Contribution of graduate sk ills accumulation to average productivity growth under different assumptions, 1994-2005
Base model
Average 1994-2005,
country varying
Time and country varying
Time varying, country average
Country average, constant
Australia 0.40 0.40 0.46 0.54 0.45 Austria 0.37 0.36 0.31 0.45 0.39 Belgium 0.31 0.31 0.38 0.42 0.34 Canada 0.28 0.29 0.36 0.43 0.33 Denmark 0.29 0.28 0.29 0.37 0.32 Finland 0.25 0.24 0.43 0.40 0.27 France 0.40 0.40 0.12 0.44 0.38 Germany 0.13 0.13 0.21 0.16 0.12 Italy 0.40 0.39 0.31 0.45 0.38 Japan 0.65 0.65 0.51 0.79 0.68 Netherlands 0.43 0.42 0.51 0.50 0.44 Spain 0.56 0.57 0.67 0.70 0.60 Sweden 0.59 0.59 0.53 0.75 0.67 UK 0.62 0.62 0.48 0.68 0.59 US 0.38 0.39 0.80 0.50 0.38 Note: Percentage point contribution. Source: derived from EUKLEMS
Figure 13 again uses the UK as an example, and illustrates the share of GDP growth
over the period 1994-2005 that can be attributed to graduate skills accumulation.
Based on this set of sensitivity studies, we can attribute somewhere between
14-20 per cent of GDP growth in the UK over this period to the accumulation
of graduate skills.
This is roughly in line with the other countries in the sample.

The relationship between graduates and economic growth across countries
Figure 13. Contribution of graduate skills accumulation to GDP growth in the UK under different assumptions, 1994-2005
0.00
0.05
0.10
0.15
0.20
0.25
Base model Average 1994-2005, country
varying
Time and country varying
Time varying, country average
Country average, constant
Sha
re o
f G
DP
gro
wth
While this analysis provides a useful benchmark for assessing the importance of HE
relative to other productivity enhancing factors over the sample period, the approach
limits the estimated impact to the productivity enhancement directly accrued to the
graduates. Given the dual role of universities, which provide centres of education as
well as research, this may well underestimate the total macro-economic effects of an
expanded HE system. It will also fail to capture other externalities to HE, such as
improved management techniques that raise productivity at all skill levels. In the next
section we address these issues through a series of econometric estimates that
relate the expansion of HE skills to productivity growth.
52

The relationship between graduates and economic growth across countries
5. Regression-based estimates In this section we present the results from our econometric analysis. First we
replicate the Gemmell (1996) model for our 15 countries covering the period from
1982 and 2005. Here we also explore the sensitivity of the results to considering
different time periods, noting that 1982-2005 is the longest period for which data is
available for all 15 countries.
Next we present the results of our error correction models. Again we focus on the
1982-2005 period and again discuss the sensitivity of the results to the time period
considered.
5.1 GDP Growth Models
In replicating the Gemmell (1996) model we follow his specification as closely as
possible estimating models for GDP growth whilst including the log of the initial share
of employment with a tertiary level qualification and the log of the change in the
employment share with a tertiary level qualification as control variables. Our main
estimation period covers 1982 to 2005 (the longest available time period for which
we have full data for all 15 countries), but we also estimate models for different time
periods to assess the robustness of our findings.
It is important to note that the dependent variable is the annual average growth rate
over the whole period under consideration, so for each model there is just a single
observation for each country.
The model we estimate can be written as: jjjjjj LbhbhbLbINVbybby ,19826,19825432198210 lnlnlnlnln (18)
j=1,..15 countries
53
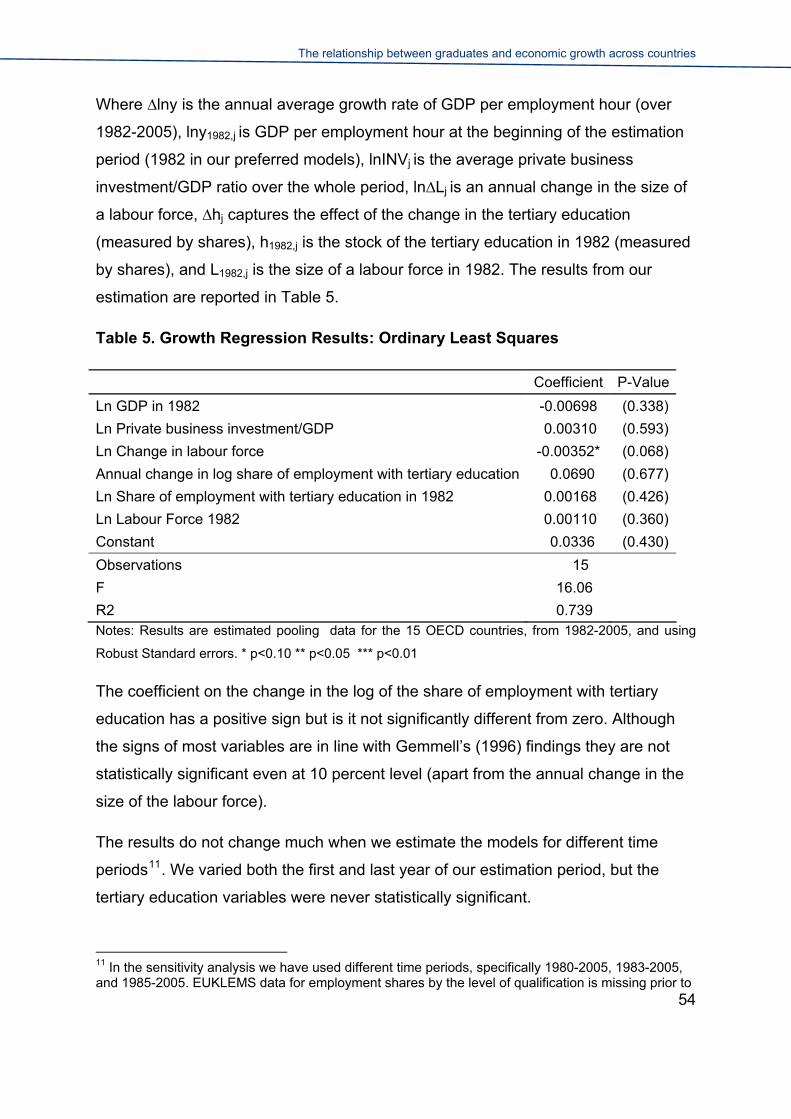
The relationship between graduates and economic growth across countries
Where ∆lny is the annual average growth rate of GDP per employment hour (over
1982-2005), lny1982,j is GDP per employment hour at the beginning of the estimation
period (1982 in our preferred models), lnINVj is the average private business
investment/GDP ratio over the whole period, ln∆Lj is an annual change in the size of
a labour force, ∆hj captures the effect of the change in the tertiary education
(measured by shares), h1982,j is the stock of the tertiary education in 1982 (measured
by shares), and L1982,j is the size of a labour force in 1982. The results from our
estimation are reported in Table 5.
Table 5. Growth Regression Results: Ordinary Least Squares
Coefficient P-Value
Ln GDP in 1982 -0.00698 (0.338)
Ln Private business investment/GDP 0.00310 (0.593)
Ln Change in labour force -0.00352* (0.068)
Annual change in log share of employment with tertiary education 0.0690 (0.677)
Ln Share of employment with tertiary education in 1982 0.00168 (0.426)
Ln Labour Force 1982 0.00110 (0.360)
Constant 0.0336 (0.430)
Observations 15
F 16.06
R2 0.739 Notes: Results are estimated pooling data for the 15 OECD countries, from 1982-2005, and using
Robust Standard errors. * p<0.10 ** p<0.05 *** p<0.01
The coefficient on the change in the log of the share of employment with tertiary
education has a positive sign but is it not significantly different from zero. Although
the signs of most variables are in line with Gemmell’s (1996) findings they are not
statistically significant even at 10 percent level (apart from the annual change in the
size of the labour force).
The results do not change much when we estimate the models for different time
periods11. We varied both the first and last year of our estimation period, but the
tertiary education variables were never statistically significant.
54
11 In the sensitivity analysis we have used different time periods, specifically 1980-2005, 1983-2005, and 1985-2005. EUKLEMS data for employment shares by the level of qualification is missing prior to

The relationship between graduates and economic growth across countries
Overall these results do not suggest a strong relationship between the growth in
GDP per employment hour and the growth in the share of employment with tertiary
level education between the early 1980s and mid 2000s for the 15 countries
considered. In contrast Gemmell (1996) found a positive significant relationship
between tertiary education and growth.
There are some obvious differences between our results and Gemmell’s estimates.
The time period and countries considered are different. Gemmell focussed on 1965-
1985 for 21 countries, while our analysis is based on smaller number of countries
and for a later time period.
The lack of a significant relationship between human capital and growth is not new to
the literature. As discussed in section 2.3.2, studies carried out by Benhabib and
Spiegel (1994) and Pritchett (2001) even if focusing on a similar time period to
Gemmell and for a large number of countries, did not find a statistical significant
relationship between human capital and growth.
Furthermore, cross-country growth regressions of this type are known to suffer from
certain deficiencies (Durlaf, 2009). The approach assumes homogeneous parameter
estimates across countries, which may be a strong assumption even in a sample of
OECD countries at similar stages of development. As the skill-biased technological
change literature indicates, the contributions of graduates to growth may be evolving
over time, and a dynamic panel framework may offer additional insights. This is
supported by the analysis by Holmes (2013), who demonstrates that the results of
cross-country growth regressions of this sort are not robust to changes in the sample
period and country coverage and should always be viewed with caution.
We therefore explore relationships further using dynamic panel models based on the
approach used by Mason et al (2012) and Barrell, Holland and Liadze (2011) in the
next section.
1981 for Sweden and prior to 1982 for Australia. Missing observations are filled in by applying three year moving averages of the rate of change to the last available observation.
55

The relationship between graduates and economic growth across countries
5.2 Error Correction Models
In order to allow for the possibility that the relationship between growth and human
capital is dynamic and that there is a long-run relationship as well, we estimate an
Error Correction Model (ECM) as expressed in equation (10).
We use the Pooled Mean Group estimator (PMG), first introduced by Pesaran, Shin,
and Smith (1997, 1999). This allows us to estimate non-stationary dynamic panels in
which the parameters can be heterogeneous across groups. The approach has the
advantage that the short-run dynamics can be determined for each country, whilst
we can also formally test for whether a pooled long run relationship is valid.
When dealing with long time-series, we need to be concerned about the variables of
interest being non-stationary12 which may lead to spurious regression results if the
model is estimated in levels.
An alternative to the PMG is the mean group estimator (MG) which allows the
intercepts, slope coefficients, and error variances to differ across groups. Here the
long-run coefficients are unrestricted. Here we use a Hausman test to assess
whether the PMG restriction of long-run coefficients being the same for all countries
is valid. The results indicate that imposing the same long-run coefficients across all
countries is valid.
Table 6 reports the PMG estimates for our 15 countries. The error correction
parameter, corresponding to δ2 in equation 10, captures the speed of adjustment. If
δ2=0 then there would be no evidence for a long-run relationship. Under the prior
assumption that the variables show a return to a long-run equilibrium, the error
correction parameter is expected to be significantly negative.
Table 6 indicates the existence of both a short-run dynamic and long-run
relationship. The existence of the short-run dynamic is captured by the statistical
significance of the coefficient of the lag of the dependent variable. The long-run
56
12 In order to investigate non-stationarity of the variables we used the Augmented Dickey-Fuller unit root test and the results indicate acceptance of the null hypothesis of non-stationarity for the overwhelming majority of variables. Additionally, tests on differenced variables were performed with similar results. The Johansen test indicated the existence of a long-run cointegrating relationship between dependent and independent variables.

The relationship between graduates and economic growth across countries
relationship is indicated by the negative and significant coefficient of the error
correction parameter.
The final specification is given in the first column of Table 6. Our indicators for
openness, investment, and research and development13 were also not statistically
significant in our models and are not reported, whilst foreign direct investment as a
share of GDP was significant in all model specifications.
The share of employment with tertiary education variable is positive and
statistically significant with a coefficient of 0.468.
The remaining columns report the same model specifications for different time
periods and here we can see that the coefficient on the tertiary education
variable varies from around 0.2 to 0.5, and it is always statistically significant.
Results were similar for country sensitivity analysis14.
13 In most countries there was a high correlation between the share of employment with tertiary education and Research and Development, so it is not surprising that when we control for the share of employment with tertiary education the Research and Development indicator is not statistically significant in the models. 14 In the country sensitivity analysis we run the models excluding, one at a time, the largest countries with the highest correlation coefficients between high skill employment share and productivity: US, UK, France, and Germany. In addition, we have also tested for exclusion of non EU countries. All models have been tested, and passed, Hausman test for pooling estimation.
57

The relationship between graduates and economic growth across countries
Table 6. Error Correction Regression Results: Pooled Mean Group Estimates
1982-2005 1982-2004 1983-2005 1984-2005
Long-run
Lag ln(Foreign Direct Investment/GDP) 0.0244** (0.017)
0.0514*** (0.000)
0.0630*** (0.000)
0.0180** (0.019)
Lag ln(share of employment with tertiary education)
0.468*** (0.000)
0.215*** (0.000)
0.185*** (0.000)
0.502*** (0.000)
Short-run
Error Correction -0.101** (0.015)
-0.0576* (0.075)
-0.0770* (0.072)
-0.146** (0.016)
Lag difference ln(GDP) 0.158** (0.021)
0.126* (0.081)
0.108 (0.130)
0.159** (0.018)
Constant 0.627** (0.015)
0.343* (0.057)
0.449* (0.060)
0.901** (0.016)
Observations 360 345 345 330 Hausman tests, Prob>chi2 0.786 0.157 0.548 0.679 Note: Dependent variable: Change in Log of GDP; p-values in parenthesis; * - p<0.10, ** - p<0.05, *** - p<0.01
When the dependent and independent variables are log-transformed, a coefficient on
the independent variable is referred to as an ‘elasticity’. This indicates the per cent
change in the dependent variable, when the independent variable increases by one
per cent.
A long-run coefficient of between 0.2 and 0.5 on the tertiary education
employment share means in the long-run a 0.2 to 0.5 per cent increase in
output per employee hour when tertiary education employment share
increases by one percent.
58
The relationship between graduates and economic growth across countries
6. Summary and conclusions The role of Higher Education (HE) in improving economic growth and
competitiveness is widely acknowledged and supported by the literature, although
many of the existing studies are based on outdated datasets and proxy variables for
productivity and workforce skills that are subject to a significant degree of
measurement error. Nonetheless, policy makers face a dilemma over the amount of
public resources that should be devoted to education, especially at present as they
try to regain control over public finances in the wake of the financial crisis.
It is clear that individuals with a university degree tend to have a significantly higher
wage rate than those without. Within our sample, graduates, on average, are paid
70-180 per cent more than workers without formal educational qualifications. Within
the UK, the wage premium for graduates is higher than average, at about 160 per
cent relative to workers without formal educational qualifications. Wage differentials
should be closely correlated with productivity differentials, since firms face a hard
budget constraint and relative wages are determined to a large extent by employer
demand.
Our growth accounting analysis relies on information contained in wage differentials
to approximate productivity differentials, exploiting both the observed variation in
premia across time and across countries. This analysis suggests that the
accumulation of graduate skills contributed on average 0.1-0.7 percentage points per
annum to average labour productivity growth over the period 1994-2005. The lowest
contributions were found in Germany, with relatively high contributions in Japan, the
UK, Sweden and Spain. In the case of the UK this reflects both the strong expansion
of graduate qualifications over the sample period and the relatively high premium
paid to graduates. The UK has a world-class system of higher education, and is
home to 10% of the world’s top 100 universities. While higher education has
expanded significantly between 1982 and 2005 and has continued to expand since
2005, the share of the workforce holding a university degree in the UK remains
59

The relationship between graduates and economic growth across countries
below that in Finland, the US, Japan and Canada in 2005, suggesting that there may
still be room for further expansion.
While the growth accounting analysis provides a useful benchmark for assessing the
importance of HE relative to other productivity enhancing factors over the sample
period, the approach limits the estimated impact to the productivity enhancement
directly accrued to the graduates. Given the dual role of universities, which provide
centres of education as well as research, this may well underestimate the total
macro-economic effects of an expanded HE system. It will also fail to capture other
externalities to HE, such as improved management techniques that raise productivity
at all skill levels. The econometric analysis addresses these issues.
The econometric work starts by replicating a cross-country growth regression, similar
to that Gemmell (1996), Benhabib and Speigel (1994), Pritchett (2001) and others.
Overall these results do not suggest a strong relationship between the growth in
GDP per employment hour and the growth in the share of employment with tertiary
level education between the early 1980s and mid 2000s for the 15 countries
considered. Cross-country growth regressions of this type are known to suffer from
certain deficiencies (Durlaf, 2009). The approach assumes homogeneous parameter
estimates across countries, which may be a strong assumption even in a sample of
OECD countries at similar stages of development. The sample size is also very
small, with only a single observation for each of 15 countries.
Our preferred econometric model is based around a dynamic panel framework,
which allows us to uncover the longer-term relationship between graduate skills and
productivity. This analysis suggests that, for example, a 1 per cent rise in the share
of the workforce with a university education raises the level of productivity by 0.2-0.5
per cent in the long-run. The speed of adjustment towards this long-run is gradual,
with about 5-15 per cent of the correction absorbed per annum.
Over the sample period 1994-2005, the share of the workforce with a university
education in the UK rose from 12-18.9 per cent, or increased by 57 per cent. Our
estimates suggest that this will have raised the level of productivity in the UK by 11-
28 per cent in the long-run. Over the same period, average labour productivity in the
60

The relationship between graduates and economic growth across countries
UK increased by about 34 per cent, suggesting that at least 1/3 of this can be
attributed to the accumulation of graduate skills in the labour force. By contrast, the
growth accounting exercise found that the direct contribution of graduate skills
accounted for closer to 20 per cent of labour productivity growth over the sample
period. This suggests that there are indeed externalities to education that have wider
macroeconomic benefits over and above what can be directly observed through
wage premia. If the HE sector in the UK were to expand towards the size in the US,
this could be expected to raise the level of productivity in the UK by 15-30 per cent in
the long-run.
A single equation study of this sort is not sufficient to estimate the net economic
returns to a marginal increase in spending on HE. This would require in the first
instance an estimate of the cost of increasing the number of university places by 1
per cent. We would also want to consider the general equilibrium effects of
expanding HE. An approach such as that adopted by Barrell and Kirby (2007) to
study the impact of the Lisbon Process within the EU could be employed. This would
involve integrating the estimated econometric relationship into a full macro-economic
model and running a series of model simulations. This would allow us to address
specific issues such as the impact of a rise in government spending on education
policies on the economy in the short, medium and long-term; the net impact on the
government budget in the short, medium and long-term; and the length of time it will
take for the rise in spending to be recovered through higher government revenue if
the productive capacity of the economy is enhanced.
61

The relationship between graduates and economic growth across countries
References 1. Aghion, Philippe, Boustan, Leah, Hoxby, Caroline, and Vandenbussche,
Jerome. 2009. “The causal impact of education on economic growth:
evidence from the United States.” In Brookings Papers on economic activity
(Eds. Romer, David and Wolfers, Justin).
2. Autor, David, Levy, Ftank, and Murnane, Richard. 2003. “The skill content of
recent technological change: an empirical explanation”, Quarterly Journal of
Economics, 118(4): p. 1279-1333.
3. Autor, David., Katz, Lawrence, and Krueger, Alan. 1998. “Computing
inequality: have computers changed the labour market?” Quarterly Journal of
Economics 113: p. 1169-1210.
4. Barbosa, Natalia, and Faria, Ama. 2008. “Technology adoption: does labour
skill matter? Evidence from Portuguese firm-level data”, Empirica, 35: p. 179-
194.
5. Barrel, Ray and Simon, Kirby. 2007. Notes on the Lisbon process: An analysis
of the impacts of reaching the Lisbon targets for skills, R&D and the
administrative burden in the European Union. NIESR, Dp. 312
6. Barrell, Ray, Holland, Dawn, Liadze, Iana. 2010, “Accounting for UK economic
performance 1973-2009”, NIESR Discussion Paper No. 359.
7. Barrell, Ray, Holland, Dawn, Liadze, Iana. 2011. “Accounting for UK economic
performance 1973-2009”, in Giudice, G., Kuenzel, R. and Springbett, T.
(eds), UK Economy: the crisis in perspective, pp.11-38, London: Routledge,
Taylor & Francis Group.
8. Barro, Robert J. and Jong-Wha Lee, 2010. "A New Dataset of Educational
Attainment in the World, 1950-2010", NBER Working Paper No. W15902.
62

The relationship between graduates and economic growth across countries
9. Barro, Robert J., 1991. "Economic Growth in a Cross-Section of Countries",
Quarterly Journal of Economics, 106, No. 2, pp407-443.
10. Barro, Robert. 1997. Determinants of Economic Growth: A Cross-Country
Study, Cambridge, MA, MIT PressBarro, Robert J. and Jong-Wha Lee, 1993.
"International Comaprisons of Educational Attainment", NBER Working Paper
No. W4349.
11. Bayo-Moriones, Alberto, and Lera-López, Fernando. 2007, “A firm-level
analysis of determinants of ICT adoption in Spain”, Technovation, 27: p.352-
366.
12. Benhabib, Jess and Speigel, Mark. 1994. “The role of human capital in
Economic development: evidence from aggregate cross-country data.”
Journal of Monetary Economics, 34:2, 143-147.
13. Bils, Mark, and Peter J. Klenow. 2000. "Does schooling cause growth?"
American Economic Review, 90, no. 5 (December): 1160-1183.
14. Bresnahan, Timoty. F., Brynjolfsson, Erik. and Hitt, Lorun. M. 2002.
“Information Technology, Workplace Organization, and the Demand for
Skilled Labor: Firm-Level Evidence”, Quarterly Journal of Economics, 117(1),
p.339 – 376.
15. Chun, Hyunbae. 2003. “Information technology and the demand for educated
workers: disentangling the impacts of adoption versus use”, The Review of
Economics and Statistics, 85 (1), p.1.
16. Cohen, Daniel, and Marcelo Soto. 2007. "Growth and human capital: good
data, good results." Journal of Economic Growth 12, no. 1 (March): 51–76.
17. Durlauf, Steven. 2009. “The rise and fall of cross-country growth
regressions”, History of Political Economy, 41: p. 315-333.
18. Freeman, Chris and Luc, Soete. 1997, The Economics of Industrial
Innovation.
63
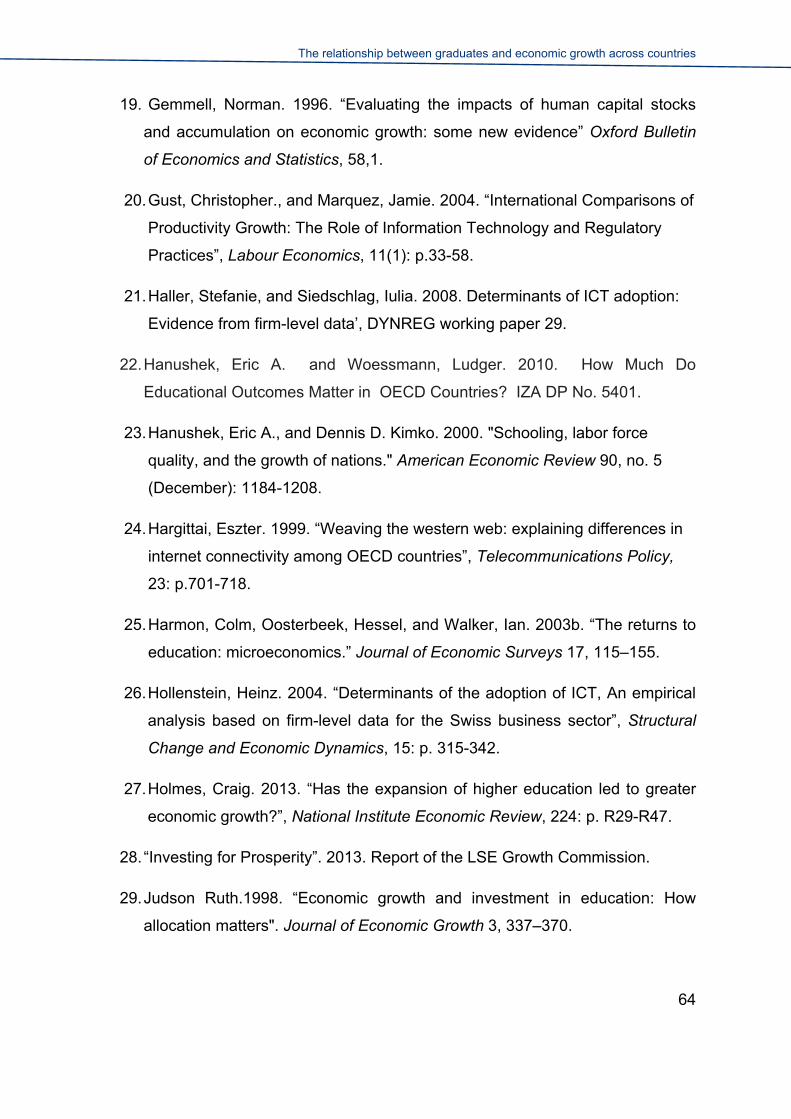
The relationship between graduates and economic growth across countries
19. Gemmell, Norman. 1996. “Evaluating the impacts of human capital stocks
and accumulation on economic growth: some new evidence” Oxford Bulletin
of Economics and Statistics, 58,1.
20. Gust, Christopher., and Marquez, Jamie. 2004. “International Comparisons of
Productivity Growth: The Role of Information Technology and Regulatory
Practices”, Labour Economics, 11(1): p.33-58.
21. Haller, Stefanie, and Siedschlag, Iulia. 2008. Determinants of ICT adoption:
Evidence from firm-level data’, DYNREG working paper 29.
22. Hanushek, Eric A. and Woessmann, Ludger. 2010. How Much Do
Educational Outcomes Matter in OECD Countries? IZA DP No. 5401.
23. Hanushek, Eric A., and Dennis D. Kimko. 2000. "Schooling, labor force
quality, and the growth of nations." American Economic Review 90, no. 5
(December): 1184-1208.
24. Hargittai, Eszter. 1999. “Weaving the western web: explaining differences in
internet connectivity among OECD countries”, Telecommunications Policy,
23: p.701-718.
25. Harmon, Colm, Oosterbeek, Hessel, and Walker, Ian. 2003b. “The returns to
education: microeconomics.” Journal of Economic Surveys 17, 115–155.
26. Hollenstein, Heinz. 2004. “Determinants of the adoption of ICT, An empirical
analysis based on firm-level data for the Swiss business sector”, Structural
Change and Economic Dynamics, 15: p. 315-342.
27. Holmes, Craig. 2013. “Has the expansion of higher education led to greater
economic growth?”, National Institute Economic Review, 224: p. R29-R47.
28. “Investing for Prosperity”. 2013. Report of the LSE Growth Commission.
29. Judson Ruth.1998. “Economic growth and investment in education: How
allocation matters". Journal of Economic Growth 3, 337–370.
64

The relationship between graduates and economic growth across countries
30. Keller, Katarina. 2006. “Investments in primary, secondary, and higher
education and the effects on economic growth”. Contemporary Economic
Policy. Vol 24, No.1, 18-34.
31. Krueger, Alan B., and Mikael Lindahl. 2001. "Education for growth: Why and
for whom?" Journal of Economic Literature 39, no. 4 (December): 1101-1136.
32. Kyriacou Chris.1991. Essential Teaching Skills.
33. Levine Ross and David Renelt. 1992. “A Sensitivity Analysis of Cross-Country
Growth Regressions”, The American Economic Review, Vol. 82, No. 4, pp.
942-963.
34. Machin, Steve and Van Reenen, John. 1998. “Technology and changes in
skill structure: evidence from seven OECD countries”, Quarterly Journal of
Economics, 113: p. 1215-1244.
35. Mankiw, N. Gregory, David Romer, and David Weil. 1992. "A contribution to
the empirics of economic growth." Quarterly Journal of Economics 107, no. 2
(May): 407-437.
36. Martins, Pedro and Pereira, Pedro. 2004. “Does education reduce wage
inequality? Quantile regression evidence from 16 countries”. Labour
Economics, 11. pp. 355-371.
37. Mason Geoff, Dawn Holland, Iana Liadze, Mary O'Mahony, Rebecca Riley,
Ana Rincon-Aznar. 2012. “Macroeconomic Benefits of Vocational Education
and Training”. Report to European Centre for the Development of Vocational
Training (CEDEFOP), London: National Institute of Economic and Social
Research.
38. McNeil, Claire and Silim, Amna. 2012. “Further education? Tertiary education
and growth in the UK’s new economy” UCU report.
39. O’Mahony, Mary, Robinson, Katerina, and Vecchi, Michela. 2008. “The impact
of ICT on the demand for skilled labour: a cross-country comparison”, Labour
Economics, 15: p.1435-1450.
65

The relationship between graduates and economic growth across countries
66
40. Pesaran, Hashem, Yongcheol Shin, and Ron Smith. 1997. “Estimating long-
run relationships in dynamic heterogeneous panels”. DAE Working Papers
Amalgamated Series 9721.
41. Pesaran, Hashem, Yongcheol Shin, and Ron Smith. 1999. “Pooled mean
group estimation of dynamic heterogeneous panels”. Journal of the American
Statistical Association 94: 621-634.
42. Pritchett, Lant. 2001. “Where has all the education gone?” The World
Economic Review, vol. 15, no. 3 367-391.
43. Psacharopoulos, George, and Ana-Maria Arriagada.1986. “The educational
composition of the labour force: an international comparison”, International
labour review, 125(5), 561-74.
44. Ruis-Arranz, Marta. 2004. “Wage Inequality in the US: Capital-Skill
Complementarity vs Skill-biased Technical Change” IMF mimeo, May.
45. Sianesi, Barbara, and John Van Reenen. 2003. "The returns to education:
Macroeconomics." Journal of Economic Surveys 17, no. 2: 157-200.
46. Solow, Robert. 1957.”Technical Change and the Aggregate Production
Function”, Review of Economics and Statistics, 39(3): p. 312-320.
47. Stevens, Philip and Weale, Martin. 2003. “Education and Economic growth”
NIESR dp 221.
48. Temple, Jonathan. 2003. "Growth effects of education and social capital in the
OECD countries." OECD Economic Studies 33: 57-101.
49. Trostel, Philip, Walker, Ian and Woolley, Paul. 2002. “Estimates of the
economic return to schooling for 28 countries”. Labour Economics, 9, pp.1-16.

The relationship between graduates and economic growth across countries
Annex
Table A1. Cross-study comparison
Authors, date of
publication Main
estimates Dependent
variable Data used
Time period
analysed
Countries covered
Variable used to
measure human capital
Main effect
Panel A. Human capital measured as stock
1
Mason et al
(2012)
Positive and
significant
Growth of
output per
worker hour
EUKLEMS 1980-2007 7 EU
countries
Shares in
Education
level
One percentage point rise in the
vocational-skilled share of
employment is associated with a
0.143 percentage point rise in
average labour productivity.
67

The relationship between graduates and economic growth across countries
2
Cohen and Soto
(2007)
Positive and
significant
Annualized
change in
GDP per
worker
OECD
UNESCO
National
Statistics
1960-1990 59
countries
Average years
of schooling
The coefficient ranges between
0.616 and 0.516.
3
Kruger and
Lindahl (2001)
Positive and
significant
Annualized
growth rate
of GDP per
capita
World values
survey
1965-1985
1960-1990
78
countries
110
countries
Average years
of schooling The estimate is 0.614.
4 Pritchett (2001)
Negative and
insignificant
Growth of
GDP per
worker
Barro and lee
(1993) data,
Penn World
tables
1960-1982 91
countries
Wage
premium ratio
The estimate is
-0.049.
5
Benhabib and
Spiegel (1994)
Negative and
Insignificant
Differences
in per capita
income
Based on
Kyriacou data
(1991) and
Summers-
Heston data
(1991)
1960-85 78
countries
Average years
of schooling
The coefficient is negative and
ranges between
-0.043 and -0.080.
6
Barro and Lee
(2010)
Positive and
significant
Income per
worker
UNESCO
Eurostat 1950-2010
157
countries
Average years
of schooling by
primary,
Output for the world economy as a
whole would increase by around
2% for every additional year of
68

The relationship between graduates and economic growth across countries
secondary,
and tertiary.
schooling.
Panel B. Human capital measured as flow
7
Bils and Klenow
(2000)
Positive and
significant
GDP per
capita
Summers-
Heston
(1991) and
UNESCO
1960 -1990 93
countries
Enrolment
rates
An increase in enrolment rates
corresponding to one more year of
attainment is associated with 0.30
percent year faster growth.
8 Gemmel (1996)
Positive and
significant
Growth of
GDP per
capita
UNESCO
ILO 1960-1985
21 OECD
countries
Enrolment
rates at
primary,
secondary and
tertiary levels.
The coefficient of change in tertiary
education is 5.89, while initial stock
equals 1.10.
9
Barro (1991)
Positive and
significant
Annual
average
growth rates
of real per
capita GDP
Summers
and Heston
(1988), UN,
World Bank,
Banks’s
(1989)
1960-1985 98
countries
Enrolment
rates
Coefficient of enrolment rates
ranges around 0.03.
10
Mankiw, Romer
and Weal (1992)
Positive and
significant
Income per
capita
Real national
Accounts
(Summers
and Heston,
1998) and
1960-1985 98
countries
Enrolment
rates of
secondary
school
Coefficient equals to 0.66 for all
countries; while it equals to 0.76 for
22 OECD countries.
69
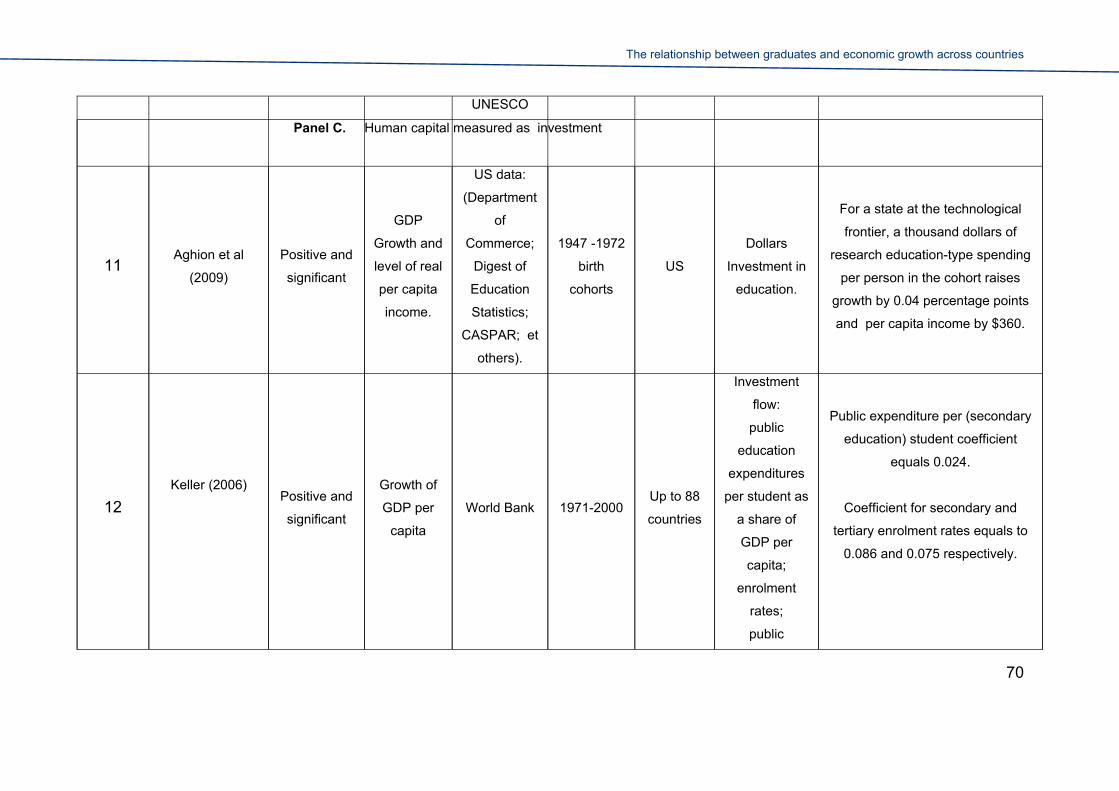
The relationship between graduates and economic growth across countries
UNESCO
Panel C. Human capital measured as investment
11 Aghion et al
(2009)
Positive and
significant
GDP
Growth and
level of real
per capita
income.
US data:
(Department
of
Commerce;
Digest of
Education
Statistics;
CASPAR; et
others).
1947 -1972
birth
cohorts
US
Dollars
Investment in
education.
For a state at the technological
frontier, a thousand dollars of
research education-type spending
per person in the cohort raises
growth by 0.04 percentage points
and per capita income by $360.
12
Keller (2006)
Positive and
significant
Growth of
GDP per
capita
World Bank 1971-2000 Up to 88
countries
Investment
flow:
public
education
expenditures
per student as
a share of
GDP per
capita;
enrolment
rates;
public
Public expenditure per (secondary
education) student coefficient
equals 0.024.
Coefficient for secondary and
tertiary enrolment rates equals to
0.086 and 0.075 respectively.
70

The relationship between graduates and economic growth across countries
71
education
expenditures
as a share of
GDP,-for
primary,
secondary,
and higher
education.
Panel D. Human capital measured as cognitive skills
13
Hanushek and
Woessmann
(2010)
Positive and
significant
Average
annual
growth rate
in real per
capita GDP
Penn World
tables;
PISA,
Barro and
Lee (2010)
1960-2000 24 OECD
Test scores for
primary and
secondary
level of
schooling.
An increase in one standard
deviation in educational
achievement yields an average
annual growth rate over 40 years
that is 1.86 percentage points
higher.
14
Hanushek and
Kimko (2000)
Positive and
significant
Average
annual
growth rate
in real per
capita GDP
TIMSS
NAEP
Barro and
Lee (1993),
UNESCO
1960-1990 31
countries Test scores
An increase of one standard
deviation labour-force quality
enhances the real per capita
growth rate by over 1.4 percentage
points a year.

© Crown copyright 2013
You may re-use this information (not including logos) free of charge in any format or medium, under the terms of the Open Government Licence. Visit www.nationalarchives.gov.uk/doc/open-government-licence, write to the Information Policy Team, The National Archives, Kew, London TW9 4DU, or email: [email protected].
This publication is also available on our website at www.gov.uk/bis
Any enquiries regarding this publication should be sent to:
Department for Business, Innovation and Skills 1 Victoria Street London SW1H 0ET Tel: 020 7215 5000 If you require this publication in an alternative format, email [email protected], or call 020 7215 5000. BIS/13/858


