209 REVIEW PAPER International Journal of Occupational Medicine and Environmental Health 2015;28(2):209 – 241 http://dx.doi.org/10.13075/ijomeh.1896.00343 BISPHENOL A – APPLICATION, SOURCES OF EXPOSURE AND POTENTIAL RISKS IN INFANTS, CHILDREN AND PREGNANT WOMEN KAROLINA MIKOŁAJEWSKA 1 , JOANNA STRAGIEROWICZ 2 , and JOLANTA GROMADZIŃSKA 1 1 Nofer Institute of Occupational Medicine, Łódź, Poland Department of Toxicology and Carcinogenesis, Laboratory of Environmental Biochemistry 2 Medical University, Łódź, Poland Department of Toxicology, Faculty of Pharmacy Abstract Bisphenol A (BPA) is used in the chemical industry as a monomer in the production of plastics. It belongs to a group of compounds that disturb some of the functions of human body, the endocrine system in particular. Extensive use of BPA in manufacturing products that come in contact with food increases the risk of exposure to this compound, mainly through the digestive tract. Literature data indicate that exposure to bisphenol A even at low doses may result in adverse health effects. The greatest exposure to BPA is estimated among infants, children and pregnant women. The aim of this review is to show potential sources of exposure to bisphenol A and the adverse health effects caused by exposure to this compound in the group of particular risk. Key words: Bisphenol A, Exposure, Children, Pregnant women, Dietary exposure, Neurodevelopment Received: May 30, 2014. Accepted: August 18, 2014. Corresponding author: K. Mikołajewska, Nofer Institute of Occupational Medicine, Department of Toxicology and Carcinogenesis, Laboratory of Environmental Biochemistry, św. Teresy 8, 91-348 Łódź, Poland (e-mail: [email protected]). INTRODUCTION Applications of bisphenol A Bisphenol A (BPA) is an organic compound classified to the group of phenols. Its name according to the Interna- tional Union of Pure and Applied Chemistry (IUPAC) is 4,4’-dihydroxy-2,2-diphenylpropane, CAS no. 80-05-7 [1]. It is produced synthetically by the reaction of phenol with acetone in the presence of a strongly acidic ion exchange resin as a catalyst. Bisphenol A is highly soluble in ethanol, acetic acid and diethyl ether, and less soluble in water [2]. Bisphenol A is an important ingredient in the production of polycarbonates, epoxy resins and polyester resins [3] as well as in the production of thermal printer paper [4]. Due to the high strength over a wide range of tempera- tures (–40–145°C) and hardness, resistance to acids, and transparency polycarbonates are extensively used in indus- try [5]. They are used, inter alia, in manufacturing products that come in contact with food (reusable bottles, includ- ing baby bottles, containers for beverages and foods) and toys for babies and children, as well as in the production of medical equipment, lenses for spectacles, packaging media, compact discs and window panels [3,6–8]. Epoxy resins are also used as coating for water pipes in houses and in the production of paints covering internal surfaces Nofer Institute of Occupational Medicine, Łódź, Poland
Transcript
209
R E V I E W P A P E R
International Journal of Occupational Medicine and Environmental Health 2015;28(2):209 – 241http://dx.doi.org/10.13075/ijomeh.1896.00343
BISPHENOL A – APPLICATION, SOURCES OF EXPOSURE AND POTENTIAL RISKS IN INFANTS, CHILDREN AND PREGNANT WOMENKAROLINA MIKOŁAJEWSKA1, JOANNA STRAGIEROWICZ2, and JOLANTA GROMADZIŃSKA1
1 Nofer Institute of Occupational Medicine, Łódź, PolandDepartment of Toxicology and Carcinogenesis, Laboratory of Environmental Biochemistry2 Medical University, Łódź, PolandDepartment of Toxicology, Faculty of Pharmacy
AbstractBisphenol A (BPA) is used in the chemical industry as a monomer in the production of plastics. It belongs to a group of compounds that disturb some of the functions of human body, the endocrine system in particular. Extensive use of BPA in manufacturing products that come in contact with food increases the risk of exposure to this compound, mainly through the digestive tract. Literature data indicate that exposure to bisphenol A even at low doses may result in adverse health effects. The greatest exposure to BPA is estimated among infants, children and pregnant women. The aim of this review is to show potential sources of exposure to bisphenol A and the adverse health effects caused by exposure to this compound in the group of particular risk.
Key words:Bisphenol A, Exposure, Children, Pregnant women, Dietary exposure, Neurodevelopment
Received: May 30, 2014. Accepted: August 18, 2014.Corresponding author: K. Mikołajewska, Nofer Institute of Occupational Medicine, Department of Toxicology and Carcinogenesis, Laboratory of Environmental Biochemistry, św. Teresy 8, 91-348 Łódź, Poland (e-mail: [email protected]).
INTRODUCTIONApplications of bisphenol ABisphenol A (BPA) is an organic compound classified to the group of phenols. Its name according to the Interna-tional Union of Pure and Applied Chemistry (IUPAC) is 4,4’-dihydroxy-2,2-diphenylpropane, CAS no. 80-05-7 [1]. It is produced synthetically by the reaction of phenol with acetone in the presence of a strongly acidic ion exchange resin as a catalyst. Bisphenol A is highly soluble in ethanol, acetic acid and diethyl ether, and less soluble in water [2]. Bisphenol A is an important ingredient in the production of polycarbonates, epoxy resins and polyester resins [3]
as well as in the production of thermal printer paper [4]. Due to the high strength over a wide range of tempera-tures (–40–145°C) and hardness, resistance to acids, and transparency polycarbonates are extensively used in indus-try [5]. They are used, inter alia, in manufacturing products that come in contact with food (reusable bottles, includ-ing baby bottles, containers for beverages and foods) and toys for babies and children, as well as in the production of medical equipment, lenses for spectacles, packaging media, compact discs and window panels [3,6–8]. Epoxy resins are also used as coating for water pipes in houses and in the production of paints covering internal surfaces
Nofer Institute of Occupational Medicine, Łódź, Poland
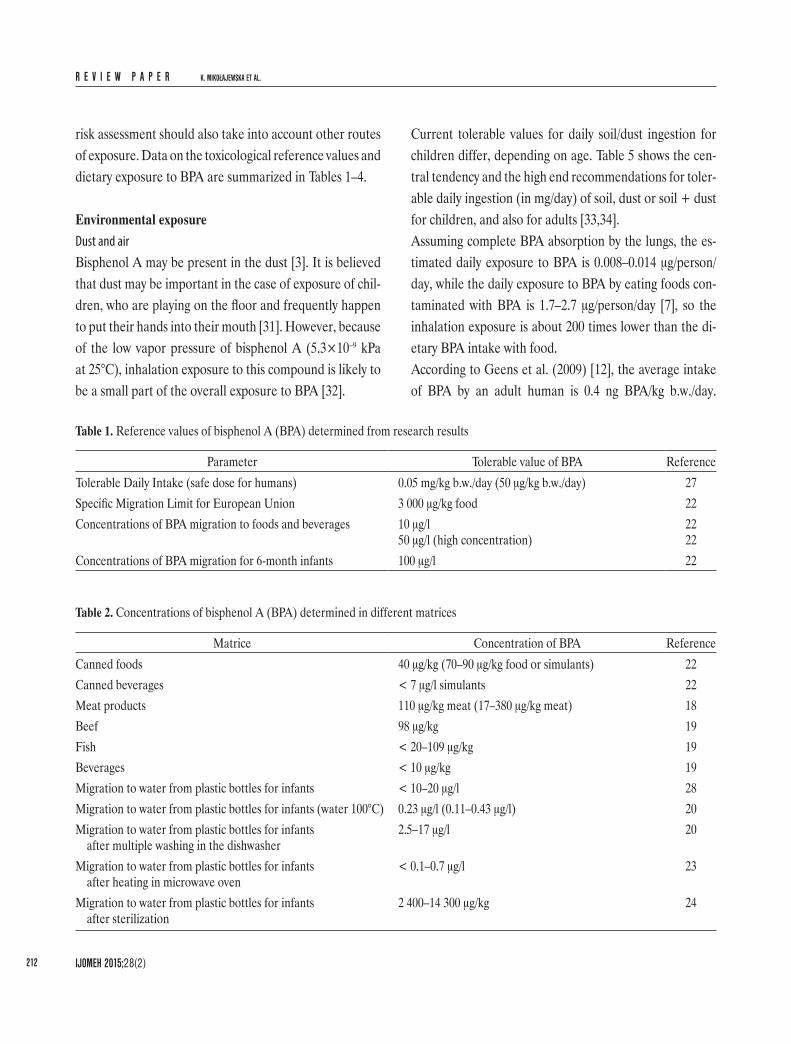
compound, also under extreme use conditions, are acces-sible in the literature [19,20,23–26].Based on the studies conducted at multiple research cen-ters worldwide, the tolerable daily intake per os of this compound has been set at 0.05 mg/kg body weight/day as a safe dose for humans [22,27].In a study on food stored in cans coated with epoxy resin under conditions corresponding to the sterilization pro-cess (canning), significant amounts of BPA, 70–90 μg BPA per 1 kg of the medium were detected in the preserved foods or model (food-simulating) liquids [22].Goodson et al. (2002) found that the average content of BPA in meat products was 110 μg BPA/kg of meat (17–380 μg/kg) [18]. Assuming that the average portion of meat per standard meal is about 170 g, the possible intake of BPA may be as high as 18.7 μg per meal. As to the cur-rently tolerable daily intake of an average adult weighing 75 kg, BPA intake would be equal to 0.25 μg BPA/kg b.w./day, which is over 200 times less than the acceptable value. Thomson and Grounds (2005) [19], who studied foods marketed in New Zealand, found that concentrations of bisphenol A in fish ranged from < 20–109 μg/kg. In in-dividual samples, bisphenol A concentrations reached 109 μg BPA/kg of tuna fish, while for beef meat the cor-responding value was 98 μg BPA/kg of canned beef. In the drinks, BPA concentration was below 10 μg BPA/kg. The values obtained by those authors were below the limit of migration of BPA into food, determined for the European Union (EU) countries Specific Migration Limit (SML) = 3000 μg BPA/kg of food or model (food-simulat-ing) liquid [22]. Based on the data from over 4300 adults in New Zealand, it has been estimated that, assuming the average body weight of ca. 75 kg, the average dietary expo-sure to BPA would be 0.008 μg BPA/kg b.w./day. The most severe exposure determined in the study was 0.29 μg/kg b.w./day [19], which was well below the TDI for BPA.Brede et al. (2003) [20] evaluated BPA migration into model (food-simulant) liquids from the bottles intended
of metal cans for food storage [3,9]. Bisphenol A deriva-tives are also components of dental sealants and compos-ite resins that are increasingly being used in dentistry [10]. Widespread application of bisphenol A in plastic industry causes an increased demand for this chemical substance and, in consequence, may pose a risk to human health.
ROUTES OF EXPOSURE TO BPAAn increased exposure to BPA may be caused inter alia by environmental pollution (dust, air, drinking water, sur-face water, wastewater, leachate from landfills) [3,11–17]. Bisphenol A may enter the human body by ingestion, in-halation or dermal contact. However, it is believed that the main exposure of humans to BPA occurs by ingest-ing foods and drinks contaminated with bisphenol A from polycarbonate bottles and cans coated with epoxy resins [18–21]. Despite that, other sources of exposure to this compound may be equally important even from the standpoint of, for example, biological monitoring. Research on the routes of exposure to that compound has continued for many years now. However, opinions about the risks resulting from exposure to BPA are still being disputed and all sources of exposure to BPA have not been identified yet [21].
Dietary exposureBisphenol A is well absorbed by the oral route. Due to its properties, bisphenol A can be easily released from the polymer product, in which it is present, and migrate into the environment. The ester bond connecting the BPA mol-ecules in polycarbonates or epoxy resins is hydrolyzed dur-ing heating or in acidic or alkaline medium [1]. As a result, free BPA is released and it migrates into the food, bever-ages and into the environment. In addition, migration is enhanced by repeated washing with detergents, rubbing and sterilization [22].Nevertheless, no reports on exceeding the limit of migra-tion (ML) or tolerable daily dietary intake (TDI) for this
EXPOSURE TO BPA IN THE GROUP OF PARTICULAR RISK R E V I E W P A P E R
IJOMEH 2015;28(2) 211
intake [22]. According to data reported by EFSA [22], breast milk fed infants are at the lowest risk of the dietary exposure: 0.2 μg/kg b.w./day. In the 3-month-old infants fed milk from bottles made of polycarbonate plastic, the exposure is 4 μg/kg b.w./day for normal levels of migra-tion, or 11 μg/kg b.w./day for the high levels of migration. Although these values are significantly lower than the cur-rently valid safe dose, research on the safety of exposure to low doses of BPA in children continues. Bisphenol A exposure of 6–12-month-old infants varies depending on the type of food intake, particularly of milk and other bev-erages, including water, fruit juice and other foods stored in plastic containers, with the possible risk of exposure to 8.3 or 13 μg BPA/kg b.w./day, depending on the scenario of migration [22].In addition, taking into account the highest level of BPA in model (food-simulating) liquids (5 μg BPA/kg), ex-posure from this particular source is low, ca. 0.3 μg of BPA/kg b.w./day [28].The highest values of exposure to BPA have been deter-mined among infants and young children due to their fre-quent contact with feeding bottles, toys and other items containing BPA. Under normal conditions, migration of bisphenol A from plastic bottles into the water or milk for infants is estimated to range from below 10 to 20 μg BPA/l of liquid [29].As can be seen from the above data, exposure to this com-pound through a diet gradually declines with age, and in children aged 1.5 years it is 5.3 μg BPA/kg b.w./day [22,30], while in adults it is 1.45 μg BPA/kg b.w./day, after taking into account all the factors that may affect these values (such as body weight, the amount of food eaten and bever-ages drunk and the levels of BPA due to migration of this compound to beverages and foods) [22].Exposure to BPA at all ages, both in children and adults, is well below the value of the maximum safe dose, so basi-cally the intake of BPA from food in such small quanti-ties is not likely to pose a risk to human health. However,
for infant feeding. The authors subjected the bottles to a variety of procedures, including: multiple washing, cook-ing and brush abrasion. After the bottles had been filled with water (100°C) and stored for 1 h, mean BPA concen-tration determined in the new bottles was 0.23 μg BPA/l of the liquid (range: 0.11–0.43–μg/l), while for the bottles sub-jected to 51 washing cycles in the dishwasher, the average concentration was 8.4 μg BPA/l (range: 3.7–17 μg BPA/l), while after 169 washing cycles the corresponding value was 6.7 μg BPA/l (range: 2.5–15 μg BPA/l).The conditions under which the measurements had been taken were far from the true conditions [21], as baby foods should be prepared in water at a much lower temperature, so the estimated value of the BPA migration might be overrated.Ehlert et al. (2008) [23] also did not show any significant migration of BPA to the water from feeding bottles in the triple cycle of microwave heating. The reported concentra-tions ranged from below 0.1 to 0.7 μg/l. Maragou et al. [24] after 12 bottle sterilization cycles noted decreased BPA migration to water (2.4–14.3 mg/kg). Exposure of infants to BPA that migrated from feeding bottles into the water or milk ranged from 0.2–2.2 mg/kg b.w./day.Bisphenol A concentrations in soft drinks and foods stored in cans with epoxy coating also have been analyzed. The determined BPA concentrations did not exceed 7 μg BPA/l of liquid. However, the average concentration of BPA in canned foods was 40 μg BPA/kg. Based on that data, value of the migration level of BPA was estimated to be 10 μg/l and the upper level was estimated at 50 μg BPA/l, thus en-abling assessment of the likely exposure to BPA depending on food intake. Significantly higher BPA levels, 100 μg/l, were determined for infants 0–6 months of age due to predominance of the liquid dairy products fed from plastic bottles capable of releasing significant amounts of bisphenol A [22].There has been much research done on dietary exposure to BPA, depending on the age and the source of food
R E V I E W P A P E R K. MIKOŁAJEWSKA ET AL.
IJOMEH 2015;28(2)212
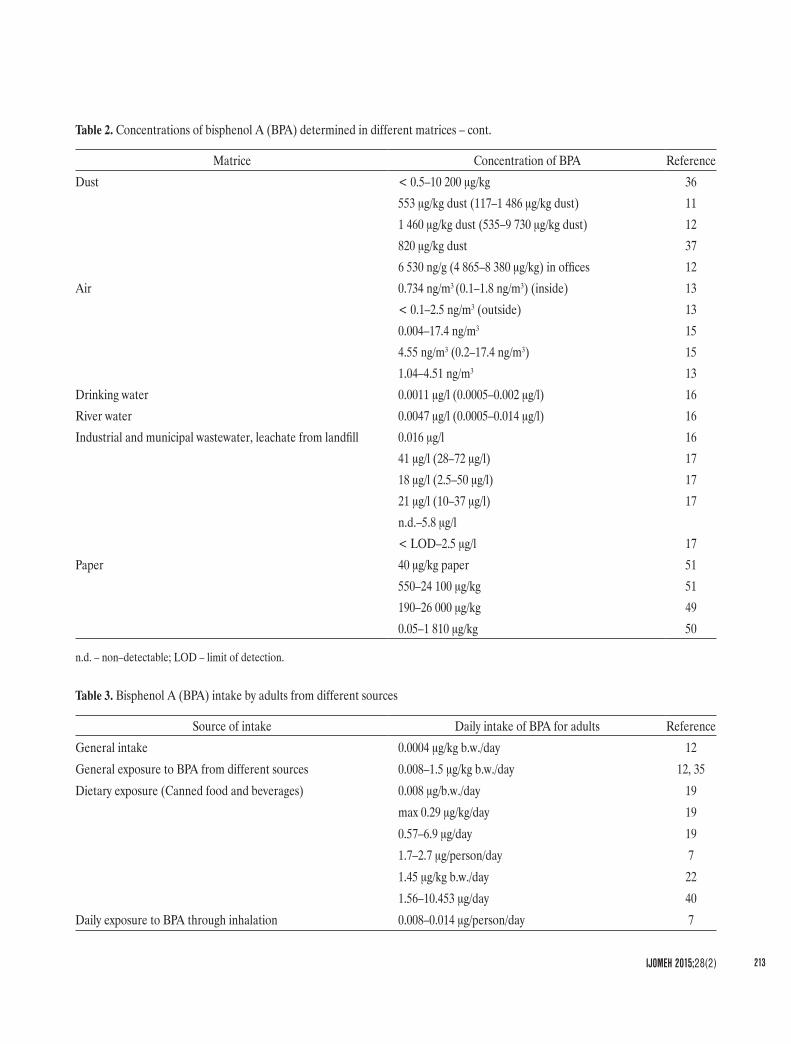
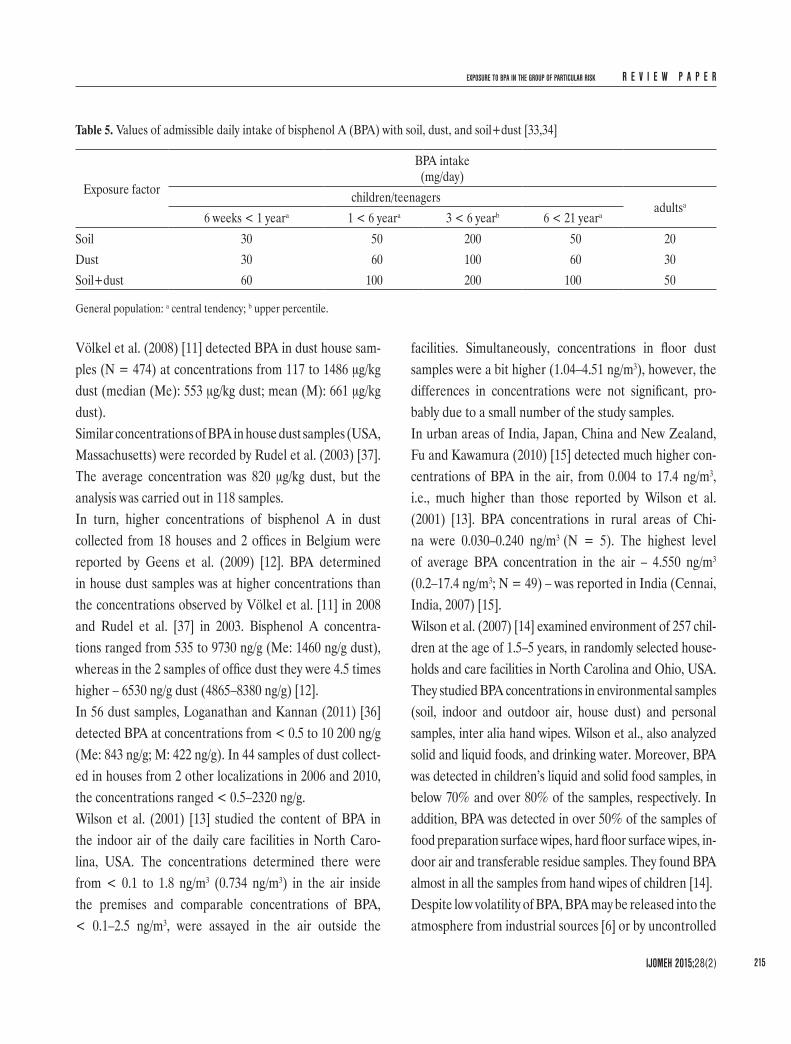
Current tolerable values for daily soil/dust ingestion for children differ, depending on age. Table 5 shows the cen-tral tendency and the high end recommendations for toler-able daily ingestion (in mg/day) of soil, dust or soil + dust for children, and also for adults [33,34].Assuming complete BPA absorption by the lungs, the es-timated daily exposure to BPA is 0.008–0.014 μg/person/day, while the daily exposure to BPA by eating foods con-taminated with BPA is 1.7–2.7 μg/person/day [7], so the inhalation exposure is about 200 times lower than the di-etary BPA intake with food.According to Geens et al. (2009) [12], the average intake of BPA by an adult human is 0.4 ng BPA/kg b.w./day.
risk assessment should also take into account other routes of exposure. Data on the toxicological reference values and dietary exposure to BPA are summarized in Tables 1–4.
Environmental exposureDust and airBisphenol A may be present in the dust [3]. It is believed that dust may be important in the case of exposure of chil-dren, who are playing on the floor and frequently happen to put their hands into their mouth [31]. However, because of the low vapor pressure of bisphenol A (5.3×10⁻⁹ kPa at 25°C), inhalation exposure to this compound is likely to be a small part of the overall exposure to BPA [32].
Table 1. Reference values of bisphenol A (BPA) determined from research results
Parameter Tolerable value of BPA ReferenceTolerable Daily Intake (safe dose for humans) 0.05 mg/kg b.w./day (50 μg/kg b.w./day) 27Specific Migration Limit for European Union 3 000 μg/kg food 22Concentrations of BPA migration to foods and beverages 10 μg/l
50 μg/l (high concentration)2222
Concentrations of BPA migration for 6-month infants 100 μg/l 22
Table 2. Concentrations of bisphenol A (BPA) determined in different matrices
Matrice Concentration of BPA ReferenceCanned foods 40 μg/kg (70–90 μg/kg food or simulants) 22Canned beverages < 7 μg/l simulants 22Meat products 110 μg/kg meat (17–380 μg/kg meat) 18Beef 98 μg/kg 19Fish < 20–109 μg/kg 19Beverages < 10 μg/kg 19Migration to water from plastic bottles for infants < 10–20 μg/l 28Migration to water from plastic bottles for infants (water 100°C) 0.23 μg/l (0.11–0.43 μg/l) 20Migration to water from plastic bottles for infants
after multiple washing in the dishwasher2.5–17 μg/l 20
Migration to water from plastic bottles for infants after heating in microwave oven
< 0.1–0.7 μg/l 23
Migration to water from plastic bottles for infants after sterilization
2 400–14 300 μg/kg 24
EXPOSURE TO BPA IN THE GROUP OF PARTICULAR RISK R E V I E W P A P E R
IJOMEH 2015;28(2) 213
Matrice Concentration of BPA ReferenceDust < 0.5–10 200 μg/kg 36
Drinking water 0.0011 μg/l (0.0005–0.002 μg/l) 16River water 0.0047 μg/l (0.0005–0.014 μg/l) 16Industrial and municipal wastewater, leachate from landfill 0.016 μg/l 16
Paper 40 μg/kg paper 51550–24 100 μg/kg 51190–26 000 μg/kg 490.05–1 810 μg/kg 50
n.d. – non–detectable; LOD – limit of detection.
Table 3. Bisphenol A (BPA) intake by adults from different sources
Source of intake Daily intake of BPA for adults ReferenceGeneral intake 0.0004 μg/kg b.w./day 12General exposure to BPA from different sources 0.008–1.5 μg/kg b.w./day 12, 35Dietary exposure (Canned food and beverages) 0.008 μg/b.w./day 19
Daily exposure to BPA through inhalation 0.008–0.014 μg/person/day 7
Table 2. Concentrations of bisphenol A (BPA) determined in different matrices – cont.
R E V I E W P A P E R K. MIKOŁAJEWSKA ET AL.
IJOMEH 2015;28(2)214
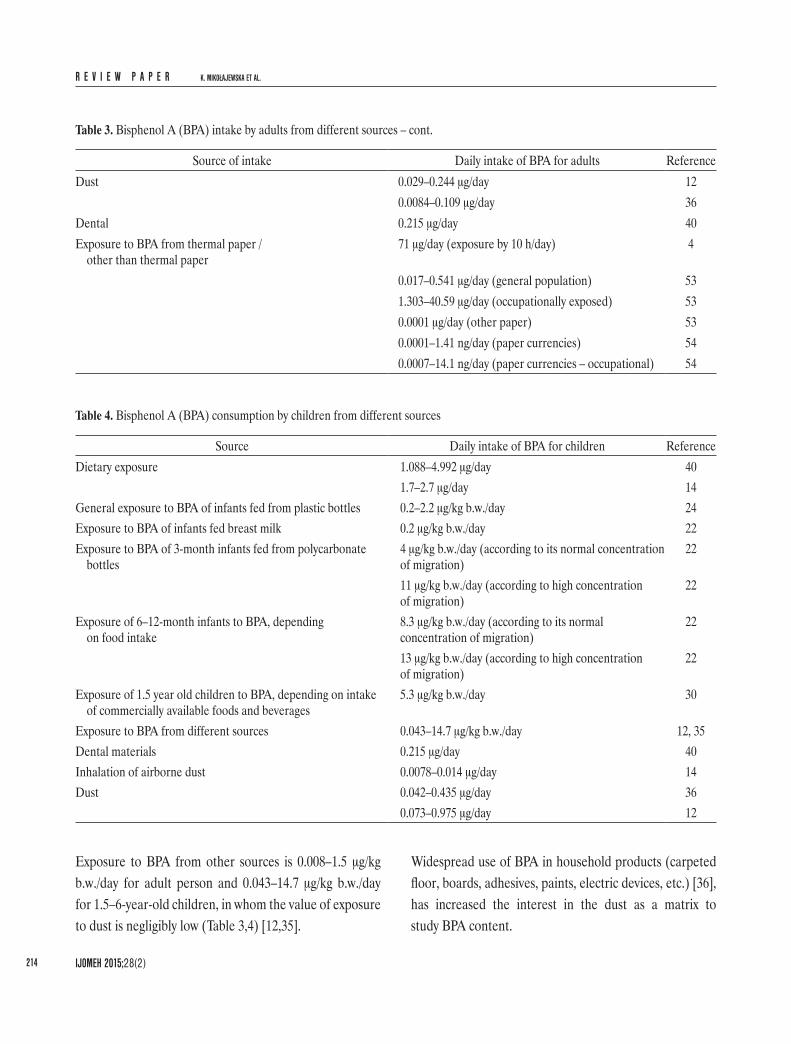
Widespread use of BPA in household products (carpeted floor, boards, adhesives, paints, electric devices, etc.) [36], has increased the interest in the dust as a matrix to study BPA content.
Exposure to BPA from other sources is 0.008–1.5 μg/kg b.w./day for adult person and 0.043–14.7 μg/kg b.w./day for 1.5–6-year-old children, in whom the value of exposure to dust is negligibly low (Table 3,4) [12,35].
Source of intake Daily intake of BPA for adults ReferenceDust 0.029–0.244 μg/day 12
0.0084–0.109 μg/day 36Dental 0.215 μg/day 40Exposure to BPA from thermal paper /
other than thermal paper71 μg/day (exposure by 10 h/day) 4
Table 4. Bisphenol A (BPA) consumption by children from different sources
Source Daily intake of BPA for children ReferenceDietary exposure 1.088–4.992 μg/day 40
1.7–2.7 μg/day 14General exposure to BPA of infants fed from plastic bottles 0.2–2.2 μg/kg b.w./day 24Exposure to BPA of infants fed breast milk 0.2 μg/kg b.w./day 22Exposure to BPA of 3-month infants fed from polycarbonate
bottles4 μg/kg b.w./day (according to its normal concentration of migration)
22
11 μg/kg b.w./day (according to high concentration of migration)
22
Exposure of 6–12-month infants to BPA, depending on food intake
8.3 μg/kg b.w./day (according to its normal concentration of migration)
22
13 μg/kg b.w./day (according to high concentration of migration)
22
Exposure of 1.5 year old children to BPA, depending on intake of commercially available foods and beverages
5.3 μg/kg b.w./day 30
Exposure to BPA from different sources 0.043–14.7 μg/kg b.w./day 12, 35Dental materials 0.215 μg/day 40Inhalation of airborne dust 0.0078–0.014 μg/day 14Dust 0.042–0.435 μg/day 36
0.073–0.975 μg/day 12
Table 3. Bisphenol A (BPA) intake by adults from different sources – cont.
EXPOSURE TO BPA IN THE GROUP OF PARTICULAR RISK R E V I E W P A P E R
IJOMEH 2015;28(2) 215
facilities. Simultaneously, concentrations in floor dust samples were a bit higher (1.04–4.51 ng/m3), however, the differences in concentrations were not significant, pro-bably due to a small number of the study samples.In urban areas of India, Japan, China and New Zealand, Fu and Kawamura (2010) [15] detected much higher con-centrations of BPA in the air, from 0.004 to 17.4 ng/m3, i.e., much higher than those reported by Wilson et al. (2001) [13]. BPA concentrations in rural areas of Chi-na were 0.030–0.240 ng/m3 (N = 5). The highest level of average BPA concentration in the air – 4.550 ng/m3 (0.2–17.4 ng/m3; N = 49) – was reported in India (Cennai, India, 2007) [15].Wilson et al. (2007) [14] examined environment of 257 chil-dren at the age of 1.5–5 years, in randomly selected house-holds and care facilities in North Carolina and Ohio, USA. They studied BPA concentrations in environmental samples (soil, indoor and outdoor air, house dust) and personal samples, inter alia hand wipes. Wilson et al., also analyzed solid and liquid foods, and drinking water. Moreover, BPA was detected in children’s liquid and solid food samples, in below 70% and over 80% of the samples, respectively. In addition, BPA was detected in over 50% of the samples of food preparation surface wipes, hard floor surface wipes, in-door air and transferable residue samples. They found BPA almost in all the samples from hand wipes of children [14].Despite low volatility of BPA, BPA may be released into the atmosphere from industrial sources [6] or by uncontrolled
Völkel et al. (2008) [11] detected BPA in dust house sam-ples (N = 474) at concentrations from 117 to 1486 μg/kg dust (median (Me): 553 μg/kg dust; mean (M): 661 μg/kg dust).Similar concentrations of BPA in house dust samples (USA, Massachusetts) were recorded by Rudel et al. (2003) [37]. The average concentration was 820 μg/kg dust, but the analysis was carried out in 118 samples.In turn, higher concentrations of bisphenol A in dust collected from 18 houses and 2 offices in Belgium were reported by Geens et al. (2009) [12]. BPA determined in house dust samples was at higher concentrations than the concentrations observed by Völkel et al. [11] in 2008 and Rudel et al. [37] in 2003. Bisphenol A concentra-tions ranged from 535 to 9730 ng/g (Me: 1460 ng/g dust), whereas in the 2 samples of office dust they were 4.5 times higher – 6530 ng/g dust (4865–8380 ng/g) [12].In 56 dust samples, Loganathan and Kannan (2011) [36] detected BPA at concentrations from < 0.5 to 10 200 ng/g (Me: 843 ng/g; M: 422 ng/g). In 44 samples of dust collect-ed in houses from 2 other localizations in 2006 and 2010, the concentrations ranged < 0.5–2320 ng/g.Wilson et al. (2001) [13] studied the content of BPA in the indoor air of the daily care facilities in North Caro-lina, USA. The concentrations determined there were from < 0.1 to 1.8 ng/m3 (0.734 ng/m3) in the air inside the premises and comparable concentrations of BPA, < 0.1–2.5 ng/m3, were assayed in the air outside the
Table 5. Values of admissible daily intake of bisphenol A (BPA) with soil, dust, and soil+dust [33,34]
General population: a central tendency; b upper percentile.
R E V I E W P A P E R K. MIKOŁAJEWSKA ET AL.
IJOMEH 2015;28(2)216
In the river water the concentration of BPA was 4.7 ng/l (range: 0.5–14 ng/l), whereas the waste water con-tained 16 ng/l (4.8–47 ng/l) of BPA.The highest concentration of BPA, 28–72 μg/l (M: 41 μg/l, N = 4), was observed by Fürhaker et al. (2000) [17] in the samples of waste collected from a paper manufactur-ing plant. Samples of waste from chemical industry con-tained 18 μg/l (range: 2.5–50 μg/l, N = 4); BPA content of household and municipal influent was 21 μg/l (ran-ge: 10–37 μg/l, N = 7). Bisphenol A concentrations in the wastewater treatment plant effluent ranged from non-detectable (n.d.) to 2.5 μg/l (household, food indus-try, hospital, washing and cleaning up company).Daily intake of bisphenol A with drinking water may be negligibly low compared to the consumption with bever-ages and food products in contact with BPA-containing wrappings [16]. However, a reliable assessment of expo-sure to BPA should also take into account sources other than the dietary intake.
Other sources of exposureDental materialsOther source of BPA, which may influence the risk of ex-posure includes dental materials. It is likely that bisphenol A, as a pollutant formed during the synthesis of dental fillings, can be released to the human saliva through en-zymatic hydrolysis by esterases found in saliva [10,45,46].Fung et al. (2000) [45] observed that BPA is detected in sa-liva 1 h after filling the defect, and becomes non-detectable after 3 h, whereas in serum it is not detectable after 24 h. In saliva, the concentration of BPA ranged from 5.8 to 105.6 ppb. This is 250 times lower than in the studies carried out by Olea et al. (1996) [43], where the concen-trations in saliva ranged from 3.3 to 30.0 ppm [43,45]. These differences could be due to different quantities of dental sealant used to fill the defect (50 mg – Olea et al., and 8 or 32 mg – Fung et al.). Fung et al. [45] showed that max 8 mg sealant can be placed on the occlusal surface
burning of household waste, plastics or electronic prod-ucts [15,38,39]. Those sources do not seem to be of any significant consequence to the environmental exposure of the population [40]. Inhalation of BPA may be significant only in the case of occupational exposure, but the influ-ence of the dietary intake of BPA with dust has not been completely explained yet [12].Conclusions from these studies suggest that the dust and air dust are not the main sources of exposure to BPA, de-spite the fact, that the release of BPA from these sources is quite high. However, these values are not greater than the estimated ones, both for children and adults.
WaterBisphenol A is often found in water at concentrations of the order of a few ppm (1 ppm corresponds to 998.859 μg/l). Analytical procedures for the determination of BPA in wa-ter are rather difficult, therefore, in order to assess the risk of human exposure to BPA from this particular source, the method of determination of BPA in water must be accu-rate and sensitive [41]. Literature data point to high oc-currence of this compound in water and its release to the environment [42]. It is important to know how much BPA is present in the environment in order to be able to assess the risk from it as the endocrine disruptor [43].Bisphenol A is one of the most frequently detected endo-crine disruptors in the environment [44]. Bisphenol A, and also other endocrine disruptors, are not completely elimi-nated from the effluents during their processing in the wastewater treatment plants. Moreover, bisphenol A may be released to the environment from BPA-contaminated waste buried in soil. Bisphenol A may be also released from the soil and contaminate ground water [16].Kuch and Ballschmiter (2001) [16] tested samples collect-ed from wastewater treatment plant, surface waters (riv-er, lake) and drinking water in South Germany. Bisphe-nol A was detected in all the tested samples of drinking water, with the mean value of 1.1 ng/l (range: 0.5–2 ng/l).
EXPOSURE TO BPA IN THE GROUP OF PARTICULAR RISK R E V I E W P A P E R
IJOMEH 2015;28(2) 217
with BPA found on the surface of thermal paper. Receipts, faxes, prints from cash machines are printed this way. People who are particularly exposed include those who have frequent contact with thermal paper, for at least 10 h daily. In such instances, the possible exposure to BPA in cash register attendants may reach the value of 71 μg/day (which is 42 times less than the current tolerable daily in-take (TDI), assuming that body weight is 60 kg). Research has shown that exposure to BPA through contact of the thermal paper with dry skin is about 10 times lower than in the case of wet or greasy hands. That is when the greatest quantity of BPA adheres to the surface of the skin. How-ever, about 90% of BPA can be removed from the skin by washing with water. After 2 h following the transfer of BPA to the skin of the fingers, as much as 73% of the compound can be removed from the surface of the skin. This means that a portion of BPA can penetrate into the deeper layers of the skin, and that portion is difficult to wash off with water [4]. The above data show that preg-nant women working with cash registers may be at risk of exposure to BPA.Ozaki et al. (2004) [49] observed higher concentrations of BPA in the recycled paper (0.034–0.36 mg/kg) than in the virgin materials (0.19–26 mg/kg).Lopez-Espinosa et al. (2007) [50] analyzed paper con-tainers for storing take away foods in terms of content of hormonally active chemicals, e.g., BPA. In the food packaging materials they determined concentrations of BPA from 0.00005 to 1.81 mg/kg paper. Whereas Ving-gaard et al. (2000) [51] determined higher concentrations of BPA than Lopez-Espinosa et al. (2007) [50] in extracts of virgin paper ranging 0.03–0.1 mg/kg and 0.6–24.1 mg/kg in recycled paper (kitchen rolls) [50,51]. Some cigarette filters may contain up to 25% of BPA, and may be an important source of exposure to this compound, especially in pregnant female smokers [52].Exposure to BPA from other sources is significantly lower than its dietary intake, and does not exceed the safe limits.
of a molar tooth without significantly affecting the oc-clusion. Those authors report that BPA may be absorbed orally, but blood BPA levels are below the detection limit. What is more, they did not observe adverse health effects. This data show that BPA is not absorbed chronically into the system, and systemic BPA accumulation is not likely. Still, BPA intake from a dental sealant is much lower than the dose of BPA from the dietary intake.Arenholt-Bindslev et al. (1999) [47] analyzed saliva col-lected at 3 stages: immediately after filling, 1 h and 24 h after placement of a dental sealant. Average fill weight was 38±3 mg. Bisphenol A concentration determined in the test samples immediately after placement of the sealant was 1.43 ppm (0.3–2.8 ppm), whereas after 1 h and after 24 h the concentrations of BPA in saliva were ≤ 0.1 ppm (below the limit of detection). An estrogenic activity was observed in saliva samples only immediately after placement of the dental sealant, and it was signifi-cantly different (p < 0.05) from the concentration in saliva control samples (morning saliva on fasting).Olea-Serrano et al. (1999) [48] observed slightly higher amounts of BPA (90–865 μg) in saliva collected after 1 h from applying the sealant (50 mg). Samples containing the highest amounts of BPA showed estrogenic activity in the proliferation assay.These values provide useful data for the assessment of risk to people, even if there were no adverse health effects re-sulting from exposure to BPA from this source.
PaperAlthough not much has been reported about dermal expo-sure to BPA, the exposure does occur, especially through dermal contact with products containing BPA (e.g., ther-mal printer paper) [4]. However, dermal exposure is con-sidered to be negligible, since the skin penetration of BPA is below 10% [32]. It is relevant only in the context of oc-cupational exposure, e.g., during production, treatment and processing of BPA, and also direct dermal contact
R E V I E W P A P E R K. MIKOŁAJEWSKA ET AL.
IJOMEH 2015;28(2)218
rate, but also a diet appropriate to the age (eating foods contaminated with BPA), or contact with BPA from dust by playing on the floor. Furthermore, children often take different objects into their mouth. The most vulnerable group appears to be the population of neonates and in-fants up to 6 months of age [60], because neonates and infants up to 6 months are characterized by a reduced glucuronidation activity, whereas older children have a mechanism similar to adults [61–63].Pregnant women are not directly at risk of adverse BPA ac-tivity, because their metabolic ability is not impaired [60]. Whereas, it is believed that the fetus is at a real risk of exposure [60,64].Despite this, it is believed that exposure of the fetus depends on the concentration of BPA in the blood of the mother, because the human placenta does not metabolize BPA and consequently fetal should be protected from adverse effect of BPA by maternal metabolism [60]. Nevertheless, there are reports in which children of the mothers exposed to BPA had significantly higher levels of BPA than the chil-dren of mothers who were not exposed, indicating that pregnant women should avoid exposure to this compound. Balakrishnan et al. (2010) [64] observed, that insignificant amount of BPA can cross the placenta even in low concen-trations, especially at a constant exposure to BPA. They also showed, that there is a real risk in the case of free BPA.
BIOMONITORINGThe aim of biomonitoring is to provide reliable results of determinations of exposure to BPA from various sour-ces [65]. To assess the daily dose using the results of mo-nitoring, it is essential to have suitable knowledge about the sources of pollution, possible routes of exposure, as well as knowledge of the toxicokinetics [7,66]. Urine or blood are typically used to assess exposure to BPA [9,67]. However, urine is predominantly used for the analysis of BPA, because urine sampling is non-invasive and sam-ple volumes are often large [57].
Total exposure to BPA may be the sum of exposure from all the sources, and may depend on age, gender as well as other factors. Health effects of the exposure have not been completely explained, therefore, exposure to BPA from the known sources should be limited, especially in infants, children and pregnant women. Determination of exposure from all the sources may be essential, if only to exclude contaminants and facilitate reliable assessment of dietary exposure.
ABSORPTION AND DISTRIBUTION Research published in 2002 shows that when bisphenol A enters the body per os, it is rapidly absorbed in the gas-trointestinal tract and is metabolized in the liver and the intestine [55,56].Most of the ingested BPA is excreted with the urine in a form of inactive metabolites of BPA (bisphenol A gluc-uronide [7] and bisphenol A sulfate [22,56]) within about 6 h (t1/2 = 5.4 h), and BPA is almost completely eliminated within 24 h [7,22,55,56]. Total (free plus conju-gated) BPA concentration is often used to assess exposure level to all the sources of BPA [57].Because BPA is quickly excreted from the body, concen-trations detected in human urine and blood may indicate a greater intake of this compound with drinks and food than it is presumed [58].In adults, based on the study, the estimated daily re-moval of bisphenol A with urine was 1.2 μg/day (0.21–14 μg/day). This corresponds to 0.02 μg BPA/kg/day (< 0.003–0.23 μg BPA/kg/day). Urinary BPA excretion in healthy adults between consecutive days (N = 5) varied from < 0.58 to 13 μg/day (M = 1.3 μg/day) [59].Because BPA is well absorbed into the body by ingestion, pregnant women, infants and young children are particu-larly vulnerable to BPA. The risk of adverse health effects in children may be due to the increased absorption or decreased excretion of BPA from the body [60], and also due to several factors, such as e.g., body weight, metabolic
EXPOSURE TO BPA IN THE GROUP OF PARTICULAR RISK R E V I E W P A P E R
IJOMEH 2015;28(2) 219
Many scientists worldwide continue research on human exposure to BPA [3,11,57,74–76].Data from the accessible literature show that current lev-els of urinary and plasma BPA concentrations are often close to the limit of quantification (LOQ). Most of the an-alyzed samples contained total BPA at levels of < 10 ng/ml [74,75,77]. In maternal blood, concentrations of free BPA were up to 22.3 ng/ml (range: 0.5–22.3 ng/ml) [78] and 0.3–18.9 ng/ml in maternal plasma, and 0.2–9.2 ng/ml in fetal plasma [73], whereas high concentrations of BPA were observed in neonates (geometric mean: 30.3 ng/ml; range 1.6 – 946 ng/ml) [79].Until 2008, BPA in urine was determined in a small number of samples. Concentrations of BPA determined in 11 urine samples by Tsukioka et al. (2004) [81] ranged from 0.01 to 0.27 μg/l. However, Fukata et al. (2006) [80] who analyzed 52 urine samples, detected free BPA at 0.24 μg/l and 0.35 μg/l only in 2 of the samples [80,81].In Europe, Völkel et al. (2008) [11] conducted an analy-sis of 474 urine samples that were collected in 2005–2008. Those included 315 archival samples and a total of 159 samples collected from children aged 5–6 years and 18 samples from 52-year-old co-workers of the authors. Of the 315 archival samples, free BPA was detected only in 22 samples at concentrations below 2.5 μg/l (which is about 800 times less than the TDI). Most of the samples did not contain detectable concentrations of free BPA. Thus, it is reasonable to assume that BPA exposure is not likely to be a potential risk for adults. Similarly, there were no children who exceeded the TDI, even in the worst case scenarios [11]. The study involved 474 participants. Free BPA was detected in 287 of those partici-pants at concentrations ranging from below the detection limit (LOD) of 0.3 ng/ml to 2.5 ng/ml. In order to check po-tential sources of contamination of the samples, household dust was collected from the people who did not provide their urine samples, and the determined average concentra-tion of BPA was 553 μg/kg dust (117–1486 μg/kg dust) [11].
Concentrations of BPA in blood are lower than in urine. Additionally, concentrations of BPA in blood rapidly de-crease after exposure, hence, urine is a better matrix for this purpose [68]. Blood samples are useful for studies of stable compounds but are also important in the analysis of metabolism and elimination of the compounds that are not stable. In turn, for practical reasons, urine samples are collected once a day, and because half-life of BPA is short, the concentrations contained in the urine reflect only the exposure which occurred shortly before urine collection [67].Many potential problems associated with the analysis of BPA in biological samples have been identified. Due to the ubiquity of BPA in the environment, the main dif-ficulty is posed by the complexity of the analytical matrix, which can cause interference with the signal of the ana-lyte, low concentrations of analytes, complicated sample preparation procedures, low stability of the analytes and sample contamination. Biological samples should be frozen as quickly as possible because BPA metabolites in the urine samples at room temperature are spontaneously hydrolyzed to the par-ent BPA, even when the storage or processing time is rela-tively short [69,70]. Moreover, contamination of samples by the bisphenol A from the environment can cause false positive results, especially at low concentrations. Such interferences are a problem in interpreting the results of BPA concentrations in biological matrices. When evaluating results of the monitoring, it is important to exclude contamination from the materials used for col-lection, storage of the samples, as well as from solvents, reagents, and materials used for the preparation and anal-ysis of the samples [11,16,56,71,72]. A number of differ-ent BPA determination methods that prevent contamina-tion of a sample have been developed [73]. Also, specific solvent purification procedures were used and plastic lab-oratory dishes, pipettes, syringes were replaced by those made of glass in most of sample processing steps [71].
R E V I E W P A P E R K. MIKOŁAJEWSKA ET AL.
IJOMEH 2015;28(2)220
the 3rd trimester of pregnancy, in which the BPA con-centration was below the LOD. It has been shown that the creatinine-adjusted concentration of BPA was great-er in the first than in the 3rd trimester (p = 0.02), and that the highest mean concentration of BPA was record-ed in children. In women, the maximum concentration was 122.8 μg/g creatinine, i.e., over 3.5 times higher, com-pared to the highest concentration indicated in children, which was 33.3 μg/g creatinine.Among children and adolescents aged 6–21, Frederiksen et al. (2013) [85] examined 129 participants of the “Copen-hagen puberty study from 2006 to 2008.” The average con-centration of BPA determined in the urine was 1.37 ng/ml. Children aged 6–10 had significantly higher concentra-tions of BPA in the urine (< 3 ng/ml) (p < 0.001). Simi-larly, among younger children, relatively higher daily rates of excretion of BPA (< 70 ng/kg b.w./24 h) were observed than in older children and 17–21-year-old ado-lescents, < 1 ng/ml and < 30 ng/kg b.w./24 h, respectively.Zhang et al. (2013) [86] studied children (1–5-years-old: N = 10) and women (pregnant: N = 30, and non-pregnant: N = 10), and fetuses (N = 30) from whom blood samples were collected. The highest concentration of BPA in blood was determined in children (2.60 ng/ml, M ± standard deviation (SD) = 3.18±1.16 ng/ml, range: 1.20–8.76 ng/ml). Slightly lower concentra-tion was observed in pregnant women (0.60 ng/ml, M±SD = 3.58±4.25 ng/ml, range: < 0.10–29.0 ng/ml), adults (0.11 ng/ml, M±SD = 0.20±0.18 ng/ml, range: < 0.10–2.27 ng/ml), fetal cord blood (0.08 ng/ml, M±SD = 0.13±0.12 ng/ml, range: < 0.10–0.79 ng/ml). The lowest concentration of BPA was observed in fetuses [86].Probably fluids given by a drip may also provide BPA to the blood of pregnant women. It is a matter of concern that the concentrations of BPA in the blood of children were significantly higher than in the adult women. The study includes too few samples, so it can be considered rather as a pilot study in systemic exposure to BPA in children
In Germany, Völkel et al. (2011) [82] analyzed urine samples collected from 47 infants aged 1–5 months. The infants were hospitalized because of low birth weight. To-tal BPA was determined in 38 samples of urine at concen-trations ranging from below the limit of detection (LOD) to 17.85 ng/ml. The mean determined concentration was below the limit of quantification (LOQ) of 0.45 ng/ml. Concentration of BPA 17.85 ng/ml was determined only in 1 urine sample collected from a 4-month-old infant. Free BPA concentrations above the LOQ were deter-mined only in 3 urine samples. Given the tolerable daily intake (TDI) dose of 50 μg/kg, the highest determined concentration was well below the TDI. Babies at an early age are able to convert BPA to the cor-responding metabolites [82,83]. Völkel et al. (2011) [82] reported that the conversion to BPA biologically inert metabolites (glucuronide or sulphate) takes place both in adults and infants, because a higher level of total BPA is observed relative to the free BPA. Data show that higher concentrations of total BPA could be caused by expo-sure to medical materials, since they were not tested for their BPA content [79]. By contrast, it was found that the median urinary concen-trations of BPA among the infants (28.6 μg/l) were about one order of magnitude higher than the median concentra-tion (3.7 μg/l) and almost twice the 95th percentile concen-tration (16 μg/l) among 6–11-year-old children who were examined as part of the NHANES 2003–2004 study [75,79]. These data suggest that exposure to BPA among the infants in this study was much higher than in general population and that > 90% of the BPA excreted with the urine was in its conjugated (e.g., glucuronide, sulfate) form [79].In turn, Casas et al. (2013) [84] analyzed a cohort of preg-nant women (N = 479, samples were collected in the 1st and the 3rd trimesters of pregnancy) and their children (N = 130) from birth to 4 years of age. Bisphenol A was detected in almost all the samples of urine of pregnant women and children, except for 3 samples collected in
EXPOSURE TO BPA IN THE GROUP OF PARTICULAR RISK R E V I E W P A P E R
IJOMEH 2015;28(2) 221
one report of a possible impact of BPA. For this purpose, Padmanabhan et al. (2008) [78] measured the BPA con-centrations in 40 pregnant women. However, no differ-ences were found in the duration of pregnancy and birth weight of children compared to BPA concentration in the mothers.Cantonwine et al. (2010) [89] measured concentrations of BPA in the urine samples collected in the last trimes-ter of pregnancy from a small group of Mexican women. Bisphenol A was detected in 80% of the women at con-centrations from below 0.4 ng/ml to 6.7 ng/ml (geometric mean (GM): 1.52 ng/ml, N = 48). This study showed ini-tially that the women who delivered before the 37th week of gestation had a higher concentration of BPA in the urine (GM: 1.84±1.86 μg/l) than the women who delivered af-ter the 37th week of pregnancy (GM: 0.97±0.92 μg/l) (p = 0.01) [89]. Exposure of pregnant women to BPA can affect the frequency of premature deliveries, but the num-ber of relevant reports is too small to unequivocally vali-date this relationship.Calafat et al. (2009) [79] studied 42 infants from the Neo-natal Intensive Care Units (NICU) of 2 hospitals (institu-tions A and B) in Boston (Massachusetts). The subjects of this study were low-birth weight infants having corrected gestational age (< 44 weeks – gestational age at birth plus age after birth), staying 3 consecutive days under neonatal intensive care unit (NICU) care (indwelling catheteriza-tion, enteral feedings, parenteral nutrition, ventilation) and diagnosed with developmental and metabolic abnor-malities and congenital anomalies. Infants with impaired “hepatic enzyme function or structural integrity (e.g., bili-ary atresia)” were excluded from the study. The BPA urine concentration was determined in all the samples collected from the infants. The average concentration was 30.3 μg/l (range: 1.6–946 μg/l). Baby care products containing di(2-ethylhexyl) phthal-ate (DEHP), could cause increase in the concentration of total BPA. Di(2-ethylhexyl) phthalate is also added
and pregnant women [86]. Furthermore, concentrations in the blood can vary over time, so it can be unreliable [87].
TOXIC EFFECTS OF BPA IN HUMANSHealth effects in pregnant womenMiscarriagesLittle it is known about the effects of high exposure to BPA on recurrent miscarriage and immunoendocrino-logical disorders. Authors of the Nagoya City 2001–2002 study investigated women (N = 45) with a history of mis-carriages from 3 to 11, in the 1st trimester of pregnancy. Serum bisphenol A levels were analyzed, and additional tests were performed, inter alia, tests for hyperprolac-tinemia, hypothyroidism, diabetes, hysterosalpingog-raphy, immunoassays (antinuclear antibodies (ANA), natural killer (NK) cell activity, antiphospholipid antibod-ies (APL), and chromosome analysis for both partners. The mean concentrations of BPA in the blood of the pa-tients were 2.59±5.23 ng/ml, while in the women from the control group (N = 32) the mean concentration of BPA was 0.77±0.38 ng/ml. The ANA-positive patients had significantly higher con-centrations of bisphenol A than the ANA-negative pa-tients (p = 0.025). During the study, in 17 patients who miscarried for the 2nd time, BPA concentrations were 4.39±8.08 ng/ml (M±SD; median (Me): 0.71 ng/ml (range: 0.28–29.43 ng/ml). The trend was higher, but not significant compared to the patients whose pregnancy was successful (M±SD = 1.22±1.07 ng/ml, Me = 0.91 ng/ml, range: 0.22–3.85 ng/ml). High exposure may be associated with recurrent pregnancy loss, particularly in the ANA-positive patients [88]. However, this is the only study that focused on the effect of BPA on human miscarriages. Besides, the number of subjects was small.
Premature deliveriesSimilarly, there are very limited data on the relationship between BPA exposure and premature births. There is
R E V I E W P A P E R K. MIKOŁAJEWSKA ET AL.
IJOMEH 2015;28(2)222
(N = 62/97) born in the group of mothers with high con-centrations of BPA (BPA level: 11.7±6.4 ng/ml) had lower birth weight (3067.9±356.4 g) (p = 0.13) and lower BPA level (0.5±0.6 ng/ml), than the infants (N = 35/97) from the group of mothers with lower levels of BPA (BPA low level: 2.1±1.6 ng/ml) whose children had 1.4±2.9 ng BPA/ml and birth weight – 3212.9±241.2 g (p = 0.13) [91].In turn, Phillippat et al. (2012) [92] observed a rath-er opposite effect, i.e. an increase in the birth weight. In the second BPA concentration tertile (2.2–4.7 μg/l) they observed that the birth weight was increased by 169 g (95% CI: 14–324), whereas in the 3rd tertile (≥ 4.7 μg/l BPA concentration tertile) the increase in the birth weight was 85 g (95% CI: –62–233). A simi-lar relationship was observed in measurements of head circumference.Lee et al. (2013) [93] also showed effect of BPA exposure on fetal development. The authors studied the effects of prenatal exposure to BPA on birth weight, birth length vs. gender and the length of pregnancy, and observed a statistically significant relationship. Bisphenol A was detected in pregnant women’s urine with GM concen-tration equal to 1.29 μg/l (1.87 μg/g creatinine). At the same time, average birth weight was 3287 g. A positive association was found to occur between the urinary ma-ternal BPA levels and birth weight. Compared to the 1st tertile (p = 0.04), in the 2nd tertile of maternal bisphe-nol A level, the birth weight was significantly increased (after taking account of pre-pregnancy body mass index, maternal age, gestational age, infant gender). A signifi-cant relationship between the birth body length and BPA level was found only in male neonates (p = 0.01). How-ever, Padmanabhan et al. (2008) [78] observed no statis-tically significant correlation between the concentration of BPA in the blood (5.9±0.94, range: 0.5–22.3 ng/ml) of mothers (N = 40, Michigan, USA) and birth weight in children (3.3±0.1 kg, range: 1.3–4.2 kg) or gestational length (38.6±0.3, range: 31.0–42.1 weeks).
to poly(vinyl chloride) (PVC) as a plasticizer, for example to medical materials. The infants briefly exposed to this products had concentration of BPA over 8.5 times lower than the infants who were exposed with high intensity to the products containing DEHP (95% CI: 3.36–22.8, p < 0.0001). However, exposure of infants to BPA through baby care products has not been confirmed [79]. Moreover, in assessing the adverse effects of BPA on ges-tation length, also other factors that may affect premature delivery should be taken into account.
Children’s development Birth weightExposure of pregnant women may affect fetal develop-ment. As reported by Miao et al. (2011) [90] birth weight was significantly lower in the children of mothers exposed to BPA than those of the not exposed mothers. The same is true for the children whose fathers were exposed, com-pared to the children of not exposed fathers. However, the difference was not significant. The authors conducted a study on the impact of BPA on the birth weight of children whose parents, during pregnancy, were exposed to BPA in the workplace. It was observed that exposure to BPA in the workplace was associated with a decreased birth weight of neonates. The progeny of fathers exposed to BPA had birth weight which was by 90.75 g lower than the average weight – 3308.60±539.91 g (p = 0.10), and the progeny of mothers exposed during pregnancy had birth weight lower by 168.40 g (M±SD: 3299.40±428 g) (p = 0.02), compared to the not exposed group, in which the average birth weight of the newborns was 3398.74±523.61 g [90].Chou et al. (2011) [91], observed a similar relationship. They examined blood samples from mothers and umbili-cal cord blood. Bisphenol A concentrations determined in the blood of pregnant women were 0.3–29.4 ng/ml (N = 97, M: 5.4±6.3 ng/ml) and in the cord blood the con-centrations were < 1 ng/ml (for N = 97 mean value was (M±SD) 1.1±2.20 ng/ml). It was observed that the infants
EXPOSURE TO BPA IN THE GROUP OF PARTICULAR RISK R E V I E W P A P E R
IJOMEH 2015;28(2) 223
fillings relative to children with amalgam fillings. Changes in body fat percentage or rate of growth in the children were not observed.In 2013, Eng et al. (2013) [97] published a cross-sectional study on the effects of urinary BPA levels in relation to obesity in children (6–18 years). They measured biochemi-cal parameters like insulin, level of glucose, cholesterol. In that study, the authors showed an increase in the odds of obesity (BMI > 95%) with increasing quartiles of BPA (quartiles 2 vs. 1 (odds ratio (OR) = 1.74, 95% CI: 1.17–2.60, p = 0.008), 3 vs. 1 (OR = 1.64, 95% CI: 1.09–2.47, p = 0.02), and 4 vs. 1 (OR = 2.01, 95% CI: 1.36–2.98, p = 0.001) [97]. In another report, Harley et al. (2013) [98] investigated whether concentration of BPA in urine had an impact on prenatal and postnatal waist circumference, percent body fat and obesity in children at the age of 9 years. Higher BPA concentrations determined in mothers during pregnancy were correlated with a decrease in BMI, body fat, overweight/obesity among daughters aged 9 years. In addition, the results of the study did not show a significant correlation between the concentration of BPA in samples from pregnant women, compared to any measure of the size of the body of 9-year-old boys and girls [98]. In the same project (CHAMACOS), Volberg et al. (2013) [99] analyzed whether prenatal or concurrent concentrations of BPA in urine were associated with key metabolism-related hormones, adiponectin and leptin (adipokines) in 9-year-old children. It was observed that the concentration of BPA in the urine samples, in late pregnancy (26.3±2.5 gestation week) was correlated with an increased leptin in plasma in boys (β = 0.06, p = 0.01). Furthermore, it was observed that the concentrations of BPA during early pregnancy (12.6±3.9 gestation week) were mainly correlated with plasma adiponectin levels in girls (β = 3.71, p = 0.03). In 9-year-old children, sta-tistically significant correlations between concentrations of BPA and leptin or adiponectin were not observed.
Since findings from these studies suggest different data, exposure of pregnant women to BPA, especially in the workplace, should be limited.
ObesityCardiovascular disease in adulthood may be caused by obesity in childhood. There are reports in the literature about the problem of obesity in conjunction with BPA exposure in adults, but only few studies are accessible on BPA-related obesity in children [94].Exposure to BPA during pregnancy can have an impact on obesity and the rapid body mass increase in children in the first 6 months of life. This relationship was examined by Valvi et al. (2013) [95]. Samples of urine were collected from pregnant women in the 1st and the 3rd trimesters of pregnancy (N = 402). In children, a sharp increase was observed within 6 months. Overweight was observed in 25% of the children aged 14 months and 21% of the children aged 4 years. The geometric mean concentration of bisphenol A was 2.6 μg/g creatinine in the 1st trimester. Similarly, in the 3rd trimester of pregnancy, BPA concen-tration (GM) was 2 μg/g creatinine (0.2–102.6 μg/g cre-atinine). Bisphenol A concentrations without creatinine correction were at similar levels, 2.1 mg/l (0.1–122.8 mg/l) and 1.8 mg/l (< LOD–103.7 mg/l; LOD = 0.1 mg/l) during the 1st and the 3rd trimesters of pregnancy, respectively [96].However, prenatal exposure was weakly associated with an increase in waist circumference and body mass in-dex (BMI) in children aged 4 years, compared to the ra-pid weight gain and growth in the 1st 6 months of life or waist circumference, or an increase in BMI at the age of 14 months. This dependence was higher among women who smoked cigarettes during pregnancy [95].Maserejian et al. (2012) [96], after 5-year follow-up of chil-dren aged 6–10 (NECAT) who were exposed to BPA re-leased from dental fillings, also reported no BPA concen-tration-related change of BMI in children with composite
R E V I E W P A P E R K. MIKOŁAJEWSKA ET AL.
IJOMEH 2015;28(2)224
been detected in the urine of almost all pregnant wom-en (N = 398) of the cohort (99%). The study suggests a link between the average exposure of mothers to BPA during pregnancy (at 16 weeks) and the increase in re-spiratory disorders (wheeze) in the progeny at the age of 6 months. The test in the respiratory tract of children was repeated every 6 months for a period of 3 years. The results indicate that this correlation decreases along with the age of the child.Donohue et al. (2013) [106] conducted a study on 568 pregnant women and children 3, 5 and 7 years old. They collected urine samples from women during pregnancy and from children, and additionally, a questionnaire sur-vey on the prevalence of wheeze according to age was per-formed. The research shows that prenatal BPA concentra-tion in urine is associated inversely with wheeze in 5-year-old children (p = 0.02). Concentrations of BPA in the urine of 3-year-old children are positively associated with wheeze at the age of 5 (p = 0.02) and 6 years (p = 0.03). Urinary BPA at the age of 7 years correlates with wheeze at the age of 7 years (p = 0.04). Concentration of BPA in urine is also positively associ-ated with asthma at the age of 3, 5 and 7 years (p = 0.005, p = 0.03, p = 0.04), respectively. The average concentra-tion of BPA in the prenatal maternal urine was 1.8 ng/ml, in 3-year-old children it was 3.8 ng/ml, in 5 year olds it was equal to 3.1 ng/ml, and 2.7 ng/ml in 7-year-old children. Concentrations of BPA in the urine of pregnant mothers were not correlated with the concentrations of BPA in the urine of children after birth. In contrast, BPA in the urine of children aged 3 years was poorly correlated with the concentrations of BPA in 7 year olds. The concentrations of BPA in the urine at the age of 3, 5 and 7 years were associated with asthma in children aged 5–12 years. This suggests that environmental exposure to BPA may lead to respiratory complications [106]. These experiments indi-cate that there is a link between prenatal exposure to BPA and an increase in respiratory disorders in the offspring.
The data, however, suggest that prenatal concentration of bisphenol A has small influence on adipokine levels in 9 year olds [99].A statistically significant correlation between concentra-tion of BPA in urine with obesity among children and adolescents was also noted by Trasande et al. (2012) [100]. Among the 2838 participants of the National Health and Nutrition Examination Survey (NHANES), 2003–2008, at the age of 6–19 years, the median concentra-tion of BPA was 2.8 ng/ml (range: 1.5–5.6 ng/ml). When log-transformed BPA concentrations are compared with BMI scores and obesity, the differences are statistically significant [100].Wolff et al. (2007) [101] found in their study that girls aged 6–8 years with a BMI ≥ 85 percentile had signifi-cantly lower concentrations of BPA in the urine (2.2 mg/g creatinine). In turn, in 2008, Wolff et al. [102] reported a positive association between BPA concentrations and BMI in pregnant women, but expressed in terms of mg/l. However, no such correlation was observed when uri-nary concentration was specified in terms of mg BPA/g creatinine.Khalil et al. (2014) [103] found that higher concentrations of BPA in the urine collected from 39 obese and over-weight children (3–8 years, Children’s Medical Center of Dayton, Ohio) were associated with adverse metabolic ef-fects, and also with elevated diastolic blood pressure levels.
Male genital abnormalitiesExposure to BPA during pregnancy has also an impact on male genital development. Miao et al. 2011b showed that exposure during pregnancy results in a shorter AGD in male offspring. This correlation was higher in pregnant mothers exposed to BPA (p < 0.01) [104].
Wheeze and asthma Spanier et al. (2012) [105] evaluated the effects of pre-natal exposure to BPA in children. Bisphenol A has
EXPOSURE TO BPA IN THE GROUP OF PARTICULAR RISK R E V I E W P A P E R
IJOMEH 2015;28(2) 225
Wang et al. (2013) [113] analyzed concentrations of BPA in the urine of an adult Chinese population (N = 3394 adults). The median concentration of BPA in the urine was equal to 0.81 ng/ml (interquartile range (IQR) = 0.47–1.43 ng/ml). Bisphenol A in the urine of the adult men and women was noted to be inversely associated with the occurrence of TSH in serum, and directly associated with free triiodothyronine in serum.A recent study by Gentilcore et al. (2013) [114] shows that BPA, even at low doses, can cause thyroid function abnormalities. The studies in vitro on thyroid specificity of target line FRTL-5 showed that FRTL-5 cells were sensi-tive to low concentrations of BPA. Bisphenol A induces expression of genes related to the synthesis of thyroid hormone (natrium iodide symporter (Nis), Thyroglobu-lin (Tg), Thyroid peroxidase (TPO) in FRTL-5 cells. The mechanism of action of BPA in the cells responsible for the synthesis of thyroid hormones, however, has not been completely explained yet [114].
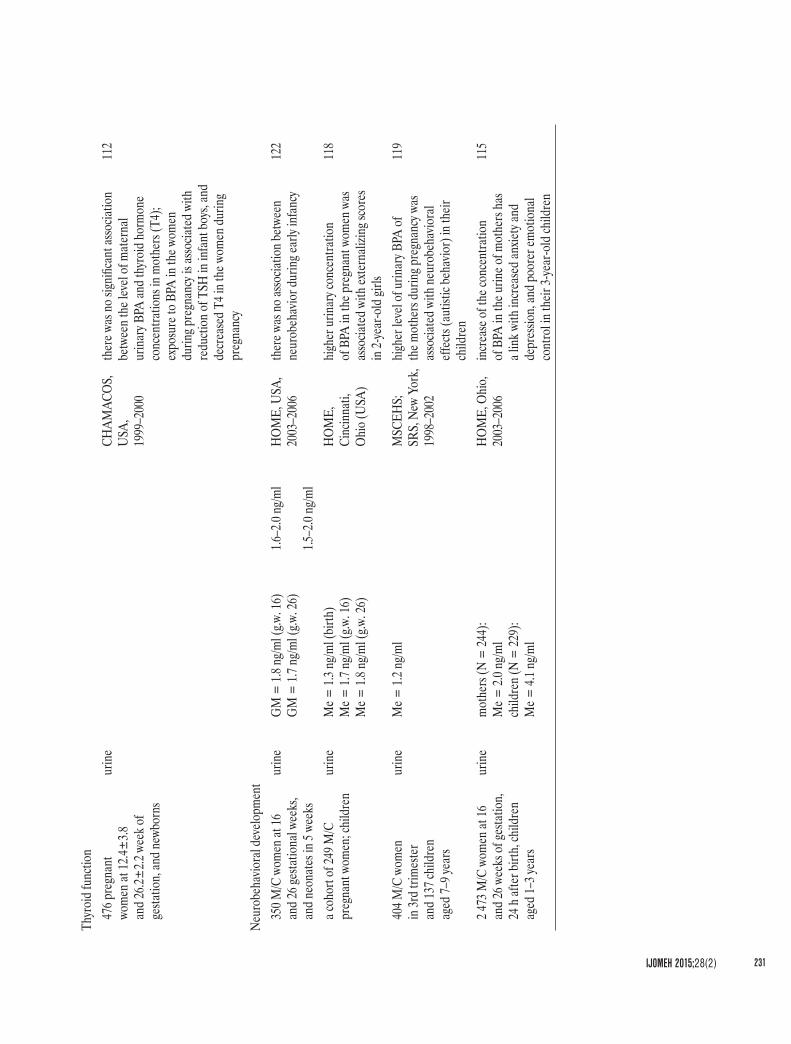
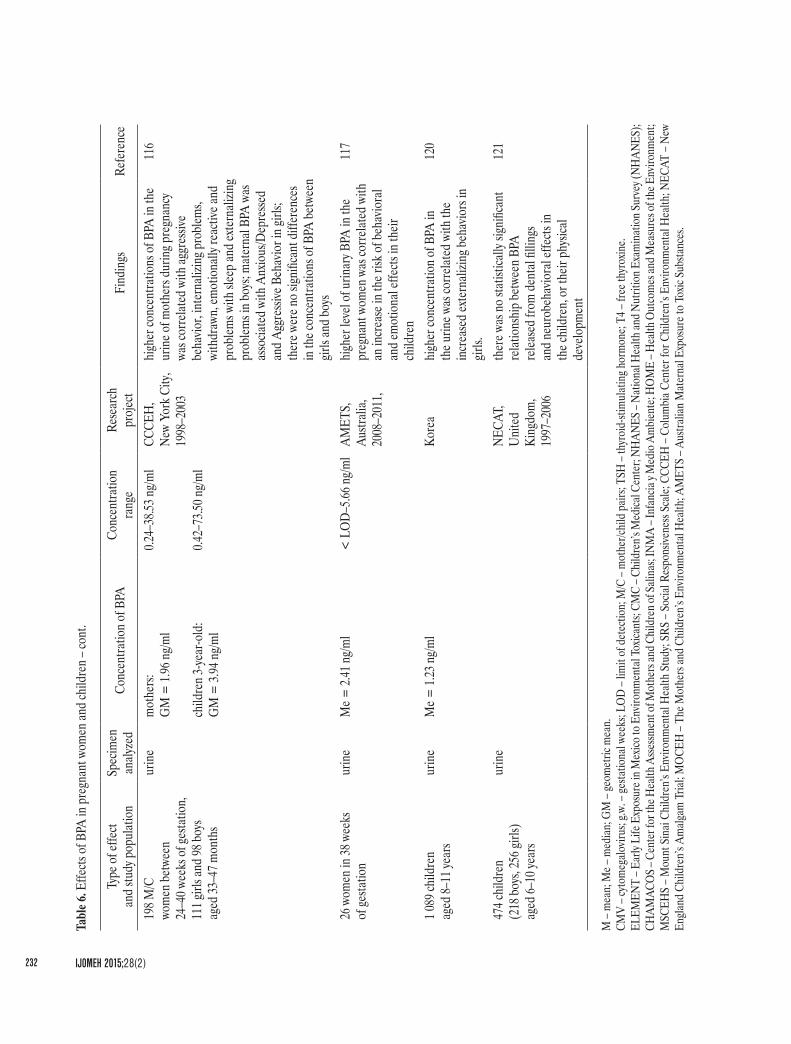
NeurodevelopmentWomen’s exposure to BPA during pregnancy can cause behavioral disorders in the progeny. To verify that hypoth-esis, a study on the effects of prenatal exposure to BPA on children’s behavior was undertaken. Children’s behav-ior was assessed by the Behavior Assessment System for Children 2 (BASC-2) and the Behavior Rating Inventory of Executive Function – Preschool (BRIEF-P). The aver-age concentration of BPA detected in pregnant women was 2 μg/l, while in children it was 4.1 μg/l. The urine samples collected from the women were analyzed twice during pregnancy and after childbirth. It has been shown that an increase of the concentration of BPA in the urine of mothers has a link with the increased anxiety and de-pression, and poorer emotional control in their 3-year-old children [115].A similar relationship was detected by Perera et al. (2012) [116]. Exposure to BPA during the prenatal period
However, there is a need for further additional tests to confirm these relationships.
Immune functionClayton et al. (2011) [107], using NHANES data collected from 2003 to 2006, assessed the impact of BPA on im-mune disorders in children over 6 years old and adults. In children, the relationship was observed between concen-tration of BPA and high titer of CMV (cytomegalovirus) (p < 0.05), but there was no relationship between the con-centration of BPA and allergy in children.
Thyroid functionDue to its endocrine disruptor characteristics, BPA may impair brain development in both humans and experimen-tal animals, because it can bind to the thyroid hormone receptor (TR), and thereby, inhibit TR ability to regulate gene expression [108–110].Exposure to BPA in utero may adversely affect thyroid function, especially in infants and youths. Proper func-tioning of thyroid hormones during this period (in utero and in early childhood) is essential for normal neurologi-cal development, hence the group at the highest risk are pregnant women and infants [111,112].Despite this, no research is accessible that could confirm this relationship [112]. Chevrier et al. (2013) conducted a study on 476 women participating in the CHAMACOS project to see whether exposure to BPA during pregnancy and after birth has an impact on the functioning of the thy-roid gland [112]. Concentrations of TSH (thyroid-stimulat-ing hormone) in newborns and TSH, free thyroxine (T4) and total T4 levels in pregnant women were determined. There was no statistically significant association between the mean values of the concentrations of BPA and thyroid hormone concentrations in mothers. However, exposure to BPA in women during pregnancy is associated with re-duction of TSH in infant boys, and decreased T4 in women during pregnancy [112].
R E V I E W P A P E R K. MIKOŁAJEWSKA ET AL.
IJOMEH 2015;28(2)226
collected from pregnant women (mean urinary concen-tration of BPA = 1.8 ng/ml) with externalizing scores in 2-year-old girls. Pregnant women whose BPA concen-trations had been determined involving early pregnancy (16th week of gestation) were in the phase of fetal neural development. This indicates that externalizing behaviors may be associated with prenatal BPA exposure.Similarly, Miodovnik et al. (2011) [119] analyzing prena-tal exposure to BPA and social behavior in a sample of adolescent inner-city children (Mount Sinai Children’s Environmental Health Study from 1998 to 2002, 404 pairs of mother (3 trimesters of pregnancy) and 7–9-year chil-dren), suggests that environmental exposure to BPA (me-dian concentration of BPA in urine 1.2 μg/l) of mothers during pregnancy may cause neurobehavioral effects in children.Hong et al. (2013) [120] examined the relationship between environmental exposure to BPA and the neurobehavioral development in children 8–11 years of age (N = 1089). Determined concentrations of BPA in the urine “were positively correlated with the CBCL total problems score and negatively correlated with the learning quotient from the Learning Disability Evaluation Scale (LDES).” In turn, during 5 years of follow-up, Maserejian et al. (2012) did not observe statistically significant relation-ship between BPA released from dental fillings and neurobehavioral effects in children or their physical development [96,121].Similarly, Yolton et al. (2009) showed no association be-tween prenatal exposure to BPA and naurobehavior dur-ing early infancy [122].These data indicate that exposure of pregnant women to BPA may either affect the behavior of children, or may be irrelevant. In general, however, the studies clearly sug-gest, that there is a relationship between the level of BPA and neurobehavioral problems in children. The data about toxicological effects of BPA in children and pregnant women have been collected in Table 6.
may affect the behavior of children aged 3–5 years. Chil-dren’s behavior was assessed using the Child Behavior Checklist (CBCL), taking into account confounding factors. Much higher concentrations of BPA were found in the urine of mothers during pregnancy (range: 0.42–73.50 μg/l) than of the children aged 3 years (range: 0.24–38.53 μg/l). There were no significant differences in the concentrations of BPA between girls and boys. However, among girls the effects of exposure to BPA on Internalizing Problems (p < 0.1) and Anxious/Depressed and Aggressive Behavior (p < 0.05) were less evident than in boys. There was a significant correlation (p < 0.05) between the concentrations of BPA in the prenatal period and sex on the Emotionally Reactive, Internalizing Problems and Aggressive Behavior. In boys, an association was noted between maternal exposure to BPA in the 34th week of pregnancy and their aggressive behavior, internalizing problems, withdrawn, emotionally reactive and problems with sleep and externalizing problems. These symptoms were more common in boys who had been exposed to higher levels of BPA in the prenatal period. Among girls at low risk, problems in those areas were observed more frequently than in the girls exposed to high doses of BPA in the prenatal period. Research is continued to assess the exposure in children at older age [116].In 2013, Callan et al. [117] published a study conducted with the participation of pregnant women exposed to BPA as a substitute for the exposure of newborns. Bisphenol A was detected in 85% of the urine samples collected from the women in the 38th week of pregnancy. Because the concentration of BPA in pregnancy is variable [53], it is not possible to conclude about the impact of exposure on effects in children. However, the study showed that preg-nant women in Western Australia were exposed to BPA at concentrations that may increase the risk of behavioral and emotional effects in their descendants [117].Braun et al. (2009) [118] observed an association be-tween urinary concentration of BPA in the samples
EXPOSURE TO BPA IN THE GROUP OF PARTICULAR RISK R E V I E W P A P E R
IJOMEH 2015;28(2) 227
Tabl
e 6. E
ffects
of B
PA in
pre
gnan
t wom
en an
d ch
ildre
n
Type
of e
ffect
an
d stu
dy p
opul
atio
nSp
ecim
en
analy
zed
Conc
entra
tion
of B
PACo
ncen
tratio
n
rang
eRe
sear
ch
proj
ect
Find
ings
Refe
renc
e
Misc
arria
ge77
pat
ients
aged
31
.6±4.4
year
s with
earli
er
misc
arria
ge, t
he sa
me
patie
nts a
fter r
e-m
iscar
riage
seru
mco
ntro
l gro
up (N
= 32
): M
±SD
= 0.
77±
0.38 n
g/ml
case
s (N
= 45
): M
±SD
= 2.
59±
5.23 n
g/ml
0.20–
1.58 n
g/ml
0.22–
29.43
ng/m
l
Nago
ya C
ity
2001
–200
2 in
the w
omen
with
recu
rrent
m
iscar
riage
s con
cent
ratio
n of
BPA
in
seru
m w
as h
igher
than
in th
e wom
en
whos
e pre
gnan
cy w
as su
cces
ful
88
Prem
atur
e deli
very
40 p
regn
ant w
omen
seru
m0.5
–22.3
ng/m
lM
ichiga
n, 20
06th
ere w
as n
o sig
nific
ant c
orre
latio
n be
twee
n du
ratio
n of
pre
gnan
cy an
d th
e lev
el of
seru
m B
PA at
birt
h
78
60 p
regn
ant w
omen
– bi
rth co
hort
(37–
38 w
eek
of ge
statio
n) –
3rd
trim
este
r of
pre
gnan
cy
urin
eG
M =
1.52
ng/m
l (N
= 48
)<
0.4–
6.7 n
g/ml
ELEM
ENT,
Mex
ico C
ity,
Mex
ico
2001
and
2003
asso
ciatio
n be
twee
n ele
vate
d lev
el of
BPA
in th
e urin
e and
pre
mat
ure
deliv
ery w
as si
gnifi
cant
bet
ween
th
e wom
en w
ho d
elive
red
befo
re
the 3
7th
week
of g
esta
tion
and
the w
omen
who
deli
vere
d af
ter
the 3
7th
week
of p
regn
ancy
89
Birth
weig
ht40
4 pre
gnan
t wo
men
– 3r
d tri
mes
ter
urin
e0.3
6 (LO
D) –
35
.2 ng
/ml
Envir
onm
enta
l H
ealth
Stu
dy,
New
York
City
, U
SA, 1
998–
2002
relat
ions
hip
betw
een
birth
weig
ht an
d co
ncen
tratio
n of
BPA
in m
ater
nal
urin
e was
not
sign
ifica
nt
102
40 p
regn
ant m
othe
rsse
rum
0.5–2
2.3 n
g/ml
Mich
igan,
USA
ther
e was
no
signi
fican
t cor
relat
ion
betw
een
the b
irth
weigh
t and
the
level
of se
rum
BPA
at b
irth
78
587 c
hild
ren
(444
child
ren
of n
ot ex
pose
d pa
rent
s, 93
child
ren
of ex
pose
d fa
ther
s, 50
child
ren
of
expo
sed
preg
nant
mot
hers)
Chin
a,
2003
–200
8pa
rent
al ex
posu
re in
the w
orkp
lace
corre
lated
with
a de
crea
se in
th
e birt
h we
ight c
ompa
red
to
the u
nexp
osed
fam
ilies
90
R E V I E W P A P E R K. MIKOŁAJEWSKA ET AL.
IJOMEH 2015;28(2)228
preg
nant
wom
en an
d fe
tal
mat
erna
l bl
ood
mot
her (
N =
97):
GM
= 2.
5 ng/m
l Ta
iwan
, 20
06–2
007
child
ren
of th
e mot
hers
whos
e co
ncen
tratio
ns o
f BPA
in se
rum
we
re h
igher
, had
lowe
r birt
h we
ight,
male
infa
nts h
ad sm
aller
size
for
gesta
tiona
l age
91
umbi
lical
cord
bl
ood
feta
l (N
= 97
):G
M =
0.5 n
g/ml
191 p
regn
ant w
omen
24
–30 g
esta
tion
week
s (1
43 co
ntro
ls, 48
case
s)
urin
e0.4
–10.1
ng/m
lED
EN co
hort
2002
–200
6in
crea
se in
the b
irth
weigh
t and
hea
d cir
cum
fere
nce w
as as
socia
ted
with
hi
gher
conc
entra
tion
of u
rinar
y BPA
92
757 p
regn
ant w
omen
up
to ge
statio
n we
ek 20
urin
eG
M =
1.29
ng/m
l (1
.87 μ
g/g cr
eatin
ine)
MO
CEH
, Ko
rea,
2006
, th
ere w
as si
gnifi
cant
relat
ions
hip
betw
een
pren
atal
expo
sure
to B
PA
and
birth
weig
ht, b
irth
lengt
h,
diffe
rent
vs. g
ende
r and
dur
atio
n of
pre
gnan
cy
93
Child
obe
sity
90 gi
rls ag
ed 6–
8 yea
rsur
ine
Me =
1.8 n
g/ml
GM
= 2.
0 (3.2
) ng/m
l0.3
6–54
.3 ng
/ml
USA
, 20
04–2
005
ther
e wer
e sign
ifica
ntly
lowe
r co
ncen
tratio
ns o
f BPA
in th
e urin
e am
ong g
irls i
n th
e ≥ 85
th p
erce
ntile
fo
r BM
I
101
2 838
child
ren
and
adol
esce
nts a
ged
6–19
year
sur
ine
Me =
2.8 n
g/ml
1.5–5
.6 ng
/ml
NHAN
ES
2003
–200
8ob
esity
amon
g chi
ldre
n an
d ad
oles
cent
s was
sign
ifica
nt as
socia
ted
with
high
er co
ncen
tratio
n of
BPA
in
the u
rine
100
498 p
regn
ant w
omen
an
d 40
2 chi
ldre
n
aged
5 an
d 9 y
ears
urin
epr
egna
nt w
omen
:M
e = 1.
1 ng/m
l ch
ildre
n ag
ed 5
year
s:M
e = 2.
3 ng/m
l ch
ildre
n ag
ed 9
year
s:M
e = 1.
6 ng/m
l
CHAM
ACO
S,
UC
Berk
eley,
1999
-200
0
lowe
r BM
I, bo
dy fa
t and
ove
rweig
ht/
obes
ity am
ong d
augh
ters
aged
9 ye
ars
were
corre
lated
with
high
er
conc
entra
tion
of m
ater
nal B
PA
in th
e urin
e
98
3 370
child
ren
ag
ed 6–
18 ye
ars
urin
eNH
ANES
, 20
03–2
010
high
er co
ncen
tratio
ns o
f BPA
in th
e ur
ine w
ere a
ssocia
ted
with
abdo
min
al ob
esity
, insu
lin re
sista
nce a
nd
incr
ease
d BM
I
97
Tabl
e 6. E
ffects
of B
PA in
pre
gnan
t wom
en an
d ch
ildre
n – c
ont.
Type
of e
ffect
an
d stu
dy p
opul
atio
nSp
ecim
en
analy
zed
Conc
entra
tion
of B
PACo
ncen
tratio
n
rang
eRe
sear
ch
proj
ect
Find
ings
Refe
renc
e
EXPOSURE TO BPA IN THE GROUP OF PARTICULAR RISK R E V I E W P A P E R
IJOMEH 2015;28(2) 229
402 p
regn
ant w
omen
(1
st an
d 3r
d tri
mes
ter)
urin
e1s
t trim
este
r:G
M =
2.6 μ
g/g (2
.1 ng
/ml)
1st t
rimes
ter:
0.2–1
38.0
μg/g
(0.1–
122.8
ng/m
l)
INM
A, S
pain
, 20
04–2
006
high
er u
rinar
y of B
PA w
as as
socia
ted
with
shar
p in
crea
se in
the c
hild
ren
with
in 6
mon
ths;
pren
atal
expo
sure
wa
s wea
kly a
ssocia
ted
with
an
incr
ease
in w
aist c
ircum
fere
nce a
nd
BMI i
n th
e chi
ldre
n ag
ed 4
year
s, co
mpa
red
to th
e rap
id w
eight
gain
an
d gr
owth
in th
e first
6 m
onth
s of
life
or w
aist c
ircum
fere
nce,
or an
incr
ease
in B
MI a
t the
age
of 14
mon
ths
95
3rd
trim
este
r:G
M =
2.0 μ
g/g (1
.8 ng
/ml)
3rd
trim
este
r:0.2
–102
.6 μg
/g (<
0.1–
103.7
ng/m
l)
preg
nant
wom
en an
d ch
ildre
n (9
year
s)ur
ine
early
pre
gnan
cy (N
= 13
1):
GM
= 0.
9 ng/m
llat
e pre
gnan
cy (N
= 17
9):
GM
= 1.
1 ng/m
l9 y
ear c
hild
ren
(N =
172)
:G
M =
1.6 n
g/ml
CHAM
ACO
Sco
ncen
tratio
ns o
f BPA
in th
e urin
e sa
mpl
es, in
late
pre
gnan
cy w
ere
corre
lated
with
incr
ease
d lep
tin
in p
lasm
a in
boys
and
durin
g ear
ly pr
egna
ncy t
he co
ncen
tratio
ns w
ere
corre
lated
with
plas
ma a
dipo
necti
n lev
els in
girls
99
2 200
child
ren
ag
ed 6–
18 ye
ars
urin
e(<
1.5 n
g/ml,
1.5–2
.7 ng
/ml,
2.8–5
.4 ng
/ml,
> 5.
4 ng/m
l (c
ateg
orize
din
to th
e qua
rtile)
NHAN
ES,
2003
–201
0hi
gher
urin
ary B
PA w
as co
rrelat
ed
with
obe
sity,
inde
pend
ently
of a
ge,
sex,
ethn
icity
and
also
seru
m co
tinin
e, an
d ur
inar
y cre
atin
ine
94
39 ch
ildre
n ag
ed 3–
8 yea
rs wi
th o
besit
yur
ine
M±
SD =
1.37
±2.2
ng/m
l (1
.82±
2.6 n
g/g cr
eatin
ine)
CMC,
Ohi
o,
USA
high
er co
ncen
tratio
ns o
f BPA
in th
e ur
ine w
ere a
ssocia
ted
with
adve
rse
met
abol
ic ef
fects
, and
also
with
ele
vate
d di
asto
lic b
lood
pre
ssure
lev
els
103
Male
geni
tal a
bnor
mali
ties
153 s
ons,
inclu
ding
56 so
ns
of p
aren
ts oc
cupa
tiona
lly
expo
sed
to B
PA d
urin
g pr
egna
ncy a
nd 97
non
-ex
pose
d pa
rent
s
expo
sed
mot
hers
(N =
18):
GM
= 16
.0 μg
/g wi
fe o
f exp
osed
fath
ers
(N =
38):
GM
= 2.
2 μg/g
une
xpos
ed
mot
hers
(N =
93):
GM
= 0.
6 μg/g
9.1–2
8.0 μ
g/g
1.5–3
.3 μg
/g
0.7–0
.9 μg
/g
Chin
a,
2004
–200
8ex
posu
re d
urin
g pre
gnan
cy re
sulte
d in
a sh
orte
r AG
D in
male
offs
prin
g10
4
R E V I E W P A P E R K. MIKOŁAJEWSKA ET AL.
IJOMEH 2015;28(2)230
Child
whe
eze
365 w
omen
at 16
wee
ks
of ge
statio
n an
d ch
ildre
n to
3 ye
ars o
ld, e
xam
ined
ev
ery 6
mon
ths
urin
eG
M =
2.4 μ
g/gH
OM
E, U
SA,
2003
–200
6an
incr
ease
in re
spira
tory
diso
rder
s (w
heez
e) in
the c
hild
ren
at th
e age
of
6 m
onth
s was
asso
ciate
d wi
th
high
er le
vel o
f BPA
in th
e mat
erna
l ur
ine,
and
this
corre
latio
n de
crea
ses
with
the a
ge o
f the
child
105
Child
asth
ma
wom
en in
3rd
trim
este
r an
d ch
ildre
n ag
ed
3, 5 a
nd 7
year
s
urin
em
othe
rs (N
= 37
5):
Me =
1.8 n
g/ml
child
ren
aged
3 ye
ars (
N =
408)
:M
e = 3.
8 ng/m
l ch
ildre
n ag
ed 5
year
s (N
= 40
1):
Me =
3.1 n
g/ml
child
ren
aged
7 ye
ars (
N =
318)
:M
e = 2.
7 ng/m
l
1.0–3
.5 ng
/ml
1.8–7
.4 ng
/ml
1.7–6
.4 ng
/ml
1.4–6
.0 ng
/ml
CCCE
H,
New
York
, 19
98–2
006
conc
entra
tions
of B
PA in
the u
rine
of th
e 3 ye
ar-o
ld ch
ildre
n we
re
posit
ively
asso
ciate
d wi
th w
heez
e at
the a
ge o
f 5 an
d 6 y
ears;
urin
ary B
PA
at th
e age
of 7
year
s cor
relat
es
with
whe
eze a
t the
age 7
year
s; th
e con
cent
ratio
ns o
f BPA
in th
e ur
ine a
t the
age o
f 3, 5
and
7 yea
rs we
re as
socia
ted
with
asth
ma i
n th
e chi
ldre
n ag
ed 5
to 12
year
s; co
ncen
tratio
ns o
f BPA
in th
e urin
e of
pre
gnan
t mot
hers
were
not
co
rrelat
ed w
ith th
e con
cent
ratio
ns
of B
PA in
the u
rine o
f chi
ldre
n af
ter
birth
106
Imm
une f
uncti
on2 9
20 ch
ildre
n ur
ine
M =
4.4 n
g/ml
4.07–
4.82 n
g/ml
U.S
. NH
ANES
, 20
03–2
006
high
er u
rinar
y BPA
was
asso
ciate
d wi
th h
igh ti
ter o
f CM
V, b
ut th
ere
was n
o re
latio
nshi
p be
twee
n th
e co
ncen
tratio
n of
BPA
and
aller
gy
in th
e chi
ldre
n
107
Tabl
e 6. E
ffects
of B
PA in
pre
gnan
t wom
en an
d ch
ildre
n – c
ont.
Type
of e
ffect
an
d stu
dy p
opul
atio
nSp
ecim
en
analy
zed
Conc
entra
tion
of B
PACo
ncen
tratio
n
rang
eRe
sear
ch
proj
ect
Find
ings
Refe
renc
e
EXPOSURE TO BPA IN THE GROUP OF PARTICULAR RISK R E V I E W P A P E R
IJOMEH 2015;28(2) 231
Thyr
oid
func
tion
476 p
regn
ant
wom
en at
12.4±
3.8
and
26.2±
2.2 w
eek o
f ge
statio
n, an
d ne
wbor
ns
urin
eCH
AMAC
OS,
U
SA,
1999
–200
0
ther
e was
no
signi
fican
t asso
ciatio
n be
twee
n th
e lev
el of
mat
erna
l ur
inar
y BPA
and
thyr
oid
horm
one
conc
entra
tions
in m
othe
rs (T
4);
expo
sure
to B
PA in
the w
omen
du
ring p
regn
ancy
is as
socia
ted
with
re
ducti
on o
f TSH
in in
fant
boy
s, an
d de
crea
sed
T4 in
the w
omen
dur
ing
preg
nanc
y
112
Neur
obeh
avio
ral d
evelo
pmen
t35
0 M/C
wom
en at
16
and
26 ge
statio
nal w
eeks
, an
d ne
onat
es in
5 we
eks
urin
eG
M =
1.8 n
g/ml (
g.w. 1
6)G
M =
1.7 n
g/ml (
g.w. 2
6)1.6
–2.0
ng/m
l
1.5–2
.0 ng
/ml
HO
ME,
USA
, 20
03–2
006
ther
e was
no
asso
ciatio
n be
twee
n ne
urob
ehav
ior d
urin
g ear
ly in
fanc
y12
2
a coh
ort o
f 249
M/C
pr
egna
nt w
omen
; chi
ldre
nur
ine
Me =
1.3 n
g/ml (
birth
) M
e = 1.
7 ng/m
l (g.w
. 16)
M
e = 1.
8 ng/m
l (g.w
. 26)
HO
ME,
Ci
ncin
nati,
O
hio
(USA
)
high
er u
rinar
y con
cent
ratio
n
of B
PA in
the p
regn
ant w
omen
was
as
socia
ted
with
exte
rnali
zing s
core
s in
2-ye
ar-o
ld gi
rls
118
404 M
/C w
omen
in
3rd
trim
este
r an
d 13
7 chi
ldre
n
aged
7–9 y
ears
urin
eM
e = 1.
2 ng/m
l M
SCEH
S;
SRS,
New
Yor
k, 19
98–2
002
high
er le
vel o
f urin
ary B
PA o
f th
e mot
hers
durin
g pre
gnan
cy w
as
asso
ciate
d wi
th n
euro
beha
viora
l ef
fects
(aut
istic
beha
vior)
in th
eir
child
ren
119
2 473
M/C
wom
en at
16
and
26 w
eeks
of g
esta
tion,
24
h af
ter b
irth,
child
ren
aged
1–3 y
ears
urin
em
othe
rs (N
= 24
4):
Me =
2.0 n
g/ml
child
ren
(N =
229)
:M
e = 4.
1 ng/m
l
HO
ME,
Ohi
o,
2003
–200
6in
crea
se o
f the
conc
entra
tion
of B
PA in
the u
rine o
f mot
hers
has
a lin
k with
incr
ease
d an
xiety
and
depr
essio
n, an
d po
orer
emot
iona
l co
ntro
l in
their
3-ye
ar-o
ld ch
ildre
n
115
R E V I E W P A P E R K. MIKOŁAJEWSKA ET AL.
IJOMEH 2015;28(2)232
198 M
/Cwo
men
bet
ween
24
–40 w
eeks
of g
esta
tion,
11
1 girl
s and
98 b
oys
aged
33–4
7 mon
ths
urin
em
othe
rs:G
M =
1.96
ng/m
l0.2
4–38
.53 n
g/ml
CCCE
H,
New
York
City
, 19
98–2
003
high
er co
ncen
tratio
ns o
f BPA
in th
e ur
ine o
f mot
hers
durin
g pre
gnan
cy
was c
orre
lated
with
aggr
essiv
e be
havio
r, in
tern
alizin
g pro
blem
s, wi
thdr
awn,
emot
iona
lly re
activ
e and
pr
oblem
s with
slee
p an
d ex
tern
alizin
g pr
oblem
s in
boys
; mat
erna
l BPA
was
as
socia
ted
with
Anx
ious
/Dep
resse
d an
d Ag
gres
sive B
ehav
ior i
n gir
ls;
ther
e wer
e no
signi
fican
t diff
eren
ces
in th
e con
cent
ratio
ns o
f BPA
betw
een
girls
and
boys
116
child
ren
3-ye
ar-o
ld:
GM
= 3.
94 n
g/ml
0.42–
73.50
ng/m
l
26 w
omen
in 38
wee
ks
of ge
statio
nur
ine
Me =
2.41
ng/m
l<
LO
D–5
.66 n
g/ml
AMET
S,
Austr
alia,
20
08–2
011,
high
er le
vel o
f urin
ary B
PA in
the
preg
nant
wom
en w
as co
rrelat
ed w
ith
an in
crea
se in
the r
isk o
f beh
avio
ral
and
emot
iona
l effe
cts in
their
ch
ildre
n
117
1 089
child
ren
ag
ed 8–
11 ye
ars
urin
eM
e = 1.
23 n
g/ml
Kore
ahi
gher
conc
entra
tion
of B
PA in
th
e urin
e was
corre
lated
with
the
incr
ease
d ex
tern
alizin
g beh
avio
rs in
gir
ls.
120
474 c
hild
ren
(2
18 b
oys,
256 g
irls)
ag
ed 6–
10 ye
ars
urin
eNE
CAT,
U
nite
d Ki
ngdo
m,
1997
–200
6
ther
e was
no
statis
ticall
y sign
ifica
nt
relat
ions
hip
betw
een
BPA
relea
sed
from
den
tal fi
lling
s an
d ne
urob
ehav
iora
l effe
cts in
th
e chi
ldre
n, o
r the
ir ph
ysica
l de
velo
pmen
t
121
M –
mea
n; M
e – m
edian
; GM
– ge
omet
ric m
ean.
CMV
– cyto
meg
alovir
us; g
.w. –
gesta
tiona
l wee
ks; L
OD
– lim
it of
det
ectio
n; M
/C –
mot
her/c
hild
pair
s; TS
H –
thyr
oid-
stim
ulat
ing h
orm
one;
T4 –
free t
hyro
xine.
ELEM
ENT
– Ear
ly Li
fe E
xpos
ure i
n Mex
ico to
Env
ironm
enta
l Tox
icant
s; CM
C – C
hild
ren’
s Med
ical C
ente
r; NH
ANES
– Na
tiona
l Hea
lth an
d Nut
ritio
n Exa
min
atio
n Sur
vey (
NHAN
ES);
CHAM
ACO
S – C
ente
r for
the H
ealth
Asse
ssmen
t of M
othe
rs an
d Chi
ldre
n of S
alina
s; IN
MA
– Inf
ancia
y M
edio
Am
bien
te; H
OM
E – H
ealth
Out
com
es an
d Mea
sure
s of t
he E
nviro
nmen
t; M
SCEH
S – M
ount
Sin
ai Ch
ildre
n’s E
nviro
nmen
tal H
ealth
Stu
dy; S
RS –
Socia
l Res
pons
ivene
ss Sc
ale; C
CCEH
– Co
lum
bia C
ente
r for
Chi
ldre
n’s E
nviro
nmen
tal H
ealth
; NEC
AT –
New
Engla
nd C
hild
ren’
s Am
algam
Trial
; MO
CEH
– Th
e Mot
hers
and
Child
ren’
s Env
ironm
enta
l Hea
lth; A
MET
S – A
ustra
lian
Mat
erna
l Exp
osur
e to
Toxic
Sub
stanc
es.
Tabl
e 6. E
ffects
of B
PA in
pre
gnan
t wom
en an
d ch
ildre
n – c
ont.
Type
of e
ffect
an
d stu
dy p
opul
atio
nSp
ecim
en
analy
zed
Conc
entra
tion
of B
PACo
ncen
tratio
n
rang
eRe
sear
ch
proj
ect
Find
ings
Refe
renc
e
EXPOSURE TO BPA IN THE GROUP OF PARTICULAR RISK R E V I E W P A P E R
IJOMEH 2015;28(2) 233
In 2013, EFSA in its Draft Scientific Opinion has released data on the estimated exposure to BPA. Based on the new data in children above 6 months of age (1.5 years), the highest estimated average exposure to BPA is 375 ng/kg b.w./day, and the maximum exposure to BPA is 857 ng/kg b.w./day, compared with the data that EFSA reported in 2006, where the estimated exposure based on the es-tablished conservative scenario was 5300 ng/kg b.w./day. Similarly, among children up to 6 months, the estimated exposure was much higher, up to 11 000 ng/kg b.w./day, and according to the latest assessment of exposure, it is 225 ng/kg b.w./day, which is about 50 times less than the value assumed for 2006.Currently, human exposure to BPA is well below TDI, in spite of that, BPA toxicity is still a matter of concern. Often, studies include too few samples and/or unrealistic research conditions. Besides, the results fail to take into account exposures to BPA from other sources. In addition, external factors relating to the preparation and analysis of samples may exert a significant impact on the results due to the ubiquity of BPA in the environment. Considering that studies on the effects of human exposure to BPA at low concentrations still continue, contact of humans, and younger consumers in particular, with BPA-containing products should be limited.
REFERENCES
1. European Commission Joint Research Centre Institute for Health and Consumer Protection. European Union Risk Assessment Report 2008. Human Health Addendum of April 2008. 4,4’-isopropylidenediphenol (Bisphenol A). Part 2 Human Health. Luxembourg: Publications Office of the Eu-ropean Union; 2010.
2. Cao XL. Chemistry and analitycal methods for determina-tion of bisphenol A in food and biological samples. WHO/HSE/FOS/11.1. FAO/WHO Expert Meeting on bisphe-nol A (BPA); 2010 Nov 2–5; Ottawa, Canada. Geneva: WHO Press; 2011.
CONCLUSIONSDue to the high volume of production, wide range of ap-plications of BPA in products of everyday use and, conse-quently, potential adverse health effects, BPA toxicity is a subject of ongoing research. In addition, bisphenol A is included in the group of compounds that can cause en-docrine disruption (ED) in the body [123]. The research has focused on exposure of infants and young children who have the most frequent contact with products con-taining BPA, but also a reduced ability to metabolize and excrete xenobiotics from the body. The mechanism of ac-tion of BPA in the body and its effect on human health are not fully understood, and give rise to many speculations. Despite this, numerous reports indicate that chronic expo-sure to BPA, even at low doses, can lead to many adverse health effects, such as e.g., ischemic heart disease, diabe-tes, obesity, but also reductions in body and organ weight, as well as other disorders and behavioral abnormalities in children.In recent years, actions have been launched to reduce hu-man exposure to bisphenol A. Canada has been the 1st country to include BPA in the list of toxic substances and has developed plans to reduce BPA exposure through intake. Since 2008, the Canadian Ministry of Health has banned the import and marketing of infant feeding bottles made of polycarbonate. In the European Union, since 2010, Denmark and France have banned the sale of bisphenol A-containing products that come in contact with food for children aged 0–3 [124]. In 2012, an action plan was developed for assessing the risks of dietary exposure to BPA, which was intended to evaluate the extent of absorption of BPA in the hu-man body and its toxicity. In 2013, EFSA has issued an opinion on BPA, which recommends to assess the risk of exposure to this compound during pregnancy, mainly because of the risk to the fetus, as well as effects of the exposure during the postnatal and early childhood peri-ods of life [125].
13. Wilson NK, Chuang JC, Lyu C. Levels of persistent organic pollutants in several child day care centers. J Expo Anal En-viron Epidemiol. 2001;11:449–58.
14. Wilson NK, Chuang JC, Morgan MK, Lordo RA, Shel-don LS. An observational study of the potential expo-sures of preschool children to pentachlorophenol, bisphe-nol-A, and nonylphenol at home and daycare. Environ Res. 2007;103(1):9–20, http://dx.doi.org/10.1016/j.envres. 2006.04.006.
15. Fu P, Kawamura K. Ubiquity of bisphenol A in the atmo-sphere. Environ Pollut. 2010;158(10):3138–43, http://dx.doi.org/10.1016/j.envpol.2010.06.040.
16. Kuch HM, Ballschmiter K. Determination of endocrine-disrupting phenolic compounds and estrogens in surface and drinking water by HRGC-(NCI)-MS in the picogram per li-ter range. Environ Sci Technol. 2001;35(15):3201–6, http://dx.doi.org/10.1021/es010034m.
17. Fürhacker M, Scharf S, Weber H. Bisphenol A: Emissions from point sources. Chemosphere. 2000;41(5):751–6, http://dx.doi.org/10.1016/S0045-6535(99)00466-X.
18. Goodson A, Summerfield W, Cooper I. Survey of bi-sphenol A and bisphenol F in canned foods. Food Addit Contam. 2002;19(8):796–802, http://dx.doi.org/10. 1080/02652030210145837.
19. Thomson BM, Grounds PR. Bisphenol A in canned foods in New Zealand: An exposure assessment. Food Addit Contam. 2005;22(1):65–72, http://dx.doi.org/10. 1080/02652030400027920.
20. Brede C, Fjeldal I, Herikstad H. Increasedd migration lev-els of bisphenol A from polycarbonate baby bottles after dishwashing, boiling and brushing. Food Addit Contam. 2003;20(7):684–9, http://dx.doi.org/10.1080/0265203031000119061.
21. Geens T, Goeyens L, Covaci A. Are potential sources for human exposure to bisphenol-A overlooked? Int J Hyg En-viron Health. 2011;214(5):339–47.
3. Vandenberg LN, Hauser R, Marcus M, Olea N, Welshons WV. Human exposure to bisphenol A (BPA). Re-prod Toxicol. 2007;24(2):139–77.
4. Biedermann S, Tschudin P, Grob K. Transfer of bisphe-nol A from thermal printer paper to the skin. Anal Bioanal Chem. 2010;398(1):571–6.
5. Kang JH, Kondo F, Katayama Y. Human exposure to bi-sphenol A. Toxicology. 2006;226(2–3):79–89, http://dx.doi.org/10.1016/j.tox.2006.06.009.
6. Staples CA, Dorn PB, Klecka GM, O’Block ST, Harris LR. A review of the environmental fate, effects, and exposures of bisphenol A. Chemosphere. 1998;36(10):2149–73, http://dx.doi.org/10.1016/S0045-6535(97)10133-3.
7. Dekant W, Völkel W. Human exposure to bisphenol A by biomonitoring: Methods, results and assessment of envi-ronmental exposures. Toxicol Appl Pharmacol. 2008;228(1): 114–34, http://dx.doi.org/10.1016/j.taap.2007.12.008.
8. Huang YQ, Wong CKC, Zheng JS, Bouwman H, Barra R, Wahlström L, et al. Bisphenol A (BPA) in China: A re-view of sources, environmental levels, and potential human health impacts. Environ Int. 2012;42:91–9, http://dx.doi.org/10.1016/j.envint.2011.04.010.
9. Welshons W, Nagel S, vom Saal F. Large effects from small exposures. III. Endrocrine mechanisms mediating effects of bisphenol A at levels of human exposure. Endocrinology. 2006;147 Suppl:S56–69.
10. Fleisch AF, Sheffield PE, Chinn C, Edelstein BL, Land-rigan PJ. Bisphenol A and related compounds in dental ma-terials. Pediatrics. 2010;126(4):760–8, http://dx.doi.org/10. 1542/peds.2009-2693.
11. Völkel W, Kiranoglu M, Fromme H. Determination of free and total bisphenol A in human urine to assess dai-ly uptake as a basis for a valid risk assessment. Toxicol Lett. 2008;179(3):155–62, http://dx.doi.org/10.1016/j.toxlet. 2008.05.002.
12. Geens T, Roosens L, Neels H, Covaci A. Assessment of human exposure to bisphenol-A, triclosan and tet-rabromobisphenol-A through indoor dust intake in
EXPOSURE TO BPA IN THE GROUP OF PARTICULAR RISK R E V I E W P A P E R
IJOMEH 2015;28(2) 235
29. European Commission. Opinion of the Scientific Committee on Food on Bisphenol A (Expressed on 17 April 2002); 2002 May [2014 Mar 12]. Report No.: SCF/CS/PM/3936. Avail-able from: http://ec.europa.eu/food/fs/sc/scf/out128_en.pdf.
30. Commission of the European Communities. Reports of the Scientific Committee for Food. Thirty first series. Nutrient and energy intakes for the European Community. Lux-embourg: Office for Official Publications of the European Communities; 1993.
31. Christensen KLY, Lorber M, Koslitz S, Brüning T, Koch HM. The contribution of diet to total bisphenol A body burden in humans: Results of a 48 hour fasting study. Environ Int. 2012;50:7–14, http://dx.doi.org/10.1016/j.envint.2012.09.002.
32. Institute for Health and Consumer Protection, European Chemicals Bureau, European Commission Joint Research Centre. European Union Risk Assessment Report 2003. 4,4’-isopropylidenediphenol(bisphenol-A). 3rd Priority List. Vol. 37. Luxembourg: Office for Official Publications of the European Communities; 2010.
33. United States Environmental Protection Agency. Child-spe-cific exposure factors handbook. Washington (DC): National Center for Environmental Assessment Office of Research and Development; 2008. EPA/600/R-06/096F.
34. United States Environmental Protection Agency. Exposure factors handbook, 2011 Edition. Washington (DC): National Center for Environmental Assessment Office of Research and Development; 2011. EPA/ 600/R-090/052F.
35. National Toxicology Program. NTP-CERHR Monograph on the Potential Human Reproductive and Developmental Effects of Bisphenol A. NTP CERHR Monogr 2008;(22): i–III1. NIH publication No. 08-5994.
36. Loganathan SN, Kannan K. Occurrence of bisphenol A in indoor dust from two locations in the Eastern United States and implications for human exposures. Arch Environ Con-tam Toxicol. 2011;61(1):68–73, http://dx.doi.org/10.1007/s00244-010-9634-y.
22. EFSA. Opinion of the scientific panel on food additives, flavourings, processing aids and materials in contact with food (AFC) on request from the Commission related to 2,2-bis(hydroxyphenol)propane (bisphenol A). Question number EFSA-Q-2005-100, adopted on 29 November 2006. EFSA J [Internet] 2006[cited 2014 Mar 12];428:1–75. Available from: http://www.efsa.europa.eu/en/efsajournal/doc/428.pdf.
23. Ehlert KA, Beumer CWE, Groot MCE. Migration of bisphenol A into water from polycarbonate baby bottles during microwave heating. Food Addit Contam. 2008;25 (7):904–10, http://dx.doi.org/10.1080/02652030701867867.
24. Maragou NC, Makri A, Lampi EN, Thomaidis NS, Koupparis MA. Migration of bisphenol A from poly-carbonate baby bottles under real use conditions. Food Addit Contam. 2008;25(3):373–83, http://dx.doi.org/10.1080/ 02652030701509998.
25. Le HH, Carlson EM, Chua JP, Belcher SM. Bisphenol A is released from polycarbonate drinking bottles and mimics the neurotoxic actions of estrogen in developing cerebel-lar neurons. Toxicol Lett. 2008;176(2):149–56, http://dx.doi.org/10.1016/j.toxlet.2007.11.001.
26. Kubwabo C, Kosarac I, Stewart B, Gauthier BR, Lalonde K, Lalonde PJ. Migration of bisphenol A from plastic baby bottles, baby bottle liners and reusable polycarbonate drink-ing bottles. Food Addit Contam. 2009;26(6):928–37, http://dx.doi.org/10.1080/02652030802706725.
27. Scientific Committee for Food. Reports of the Scientific Committee for Food – Certain monomers and other starting substances to be used in the manufacture of plastic mate-rials and articles intended to come into contact with food-stuffs. Seventeenth Series. Luxembourg: Office for Official Publications of the European Communities; 1987. Report No. EUR 10778 EN.
28. Kersting M, Alexy U, Sicher-Hellert W, Manz F, Schoch G. Measured consumption of commercial infant food products in German infants: Results from the DONALD study. J Pe-diatr Gastroenterol Nutr. 1998;27(5):547–52, http://dx.doi.org/10.1097/00005176-199811000-00011.
45. Fung EYK, Ewoldsen NO, Germain Jr. HAS, Marx DB, Miaw CL, Siew C, et al. Pharmacokinetics of bisphenol A released from a dental sealant. JADA. 2000;131:51–8, http://dx.doi.org/10.14219/jada.archive.2000.0019.
46. Van Landuyt KL, Nawrot T, Geebelen B, de Munck J, Snau-waert J, Yoshihara K, et al. How much do resin-based den-tal materials release? A meta-analytical approach. Dent Mater. 2011;27(8):723–47, http://dx.doi.org/10.1016/j.den-tal.2011.05.001.
47. Arenholt-Bindslev D, Breinholt V, Preiss A, Schmalz G. Time-related bisphenol-A content and estrogenic activity in saliva samples collected in relation to placement of fissure sealants. Clin Oral Investig. 1999;3(3):120–5, http://dx.doi.org/10.1007/s007840050089.
48. Olea-Serrano F, Lardelli-Claret P, Rivas A, Barba-Navar-ro A, Olea N. Inadvertent exposure to xenoestrogens in chil-dren. Toxicol Ind Health. 1999;15(1–2):152–9, http://dx.doi.org/10.1177/074823379901500112.
49. Ozaki A, Yamaguchi Y, Fujita T, Kuroda K, Endo G. Chemi-cal analysis and genotoxicological safety assessment of pa-per and paperboard used for food packaging. Food Chem Toxicol. 2004;42(8):1323–37, http://dx.doi.org/10.1016/j.fct. 2004.03.010.
50. Lopez-Espinosa MJ, Granada A, Araque P, Molina-Molina JM, Puertollano MC, Rivas A. Oestrogenicity of paper and cardboard extracts used as food containers. Food Addit Contam. 2007;24(1):95–102, http://dx.doi.org/10.1080/02652030600936375.
51. Vinggaard AM, Körner W, Lund KH, Boltz U, Petersen JH. Identification and quantification of estrogenic compounds in recycled and virgin paper for household use as determined by an in vitro yeast estrogen screen and chemical analy-sis. Chem Res Toxicol. 2000;13(12):1214–22, http://dx.doi.org/10.1021/tx000146b.
52. Braun JM, Kalkbrenner AE, Calafat AM, Yolton K, Ye X, Dietrich KN, et al. Impact of early-life bisphenol A exposure on behavior and executive function in children. Pediatrics. 2011;128(5):873–82, http://dx.doi.org/10.1542/peds.2011-1335.
diphenyl ethers, and other endocrine disrupting compounds in indoor air and dust. Environ Sci Technol. 2003;37(20): 4543–53, http://dx.doi.org/10.1021/es0264596.
38. Sidhu S, Gullett B, Striebich R, Klosterman J, Contre-ras J, DeVito M. Endocrine disrupting chemical emissions from combustion sources: Diesel particulate emissions and domestic waste open burn emissions. Atmos Envi-ron. 2005;39(5):801–11, http://dx.doi.org/10.1016/j.atmo senv.2004.10.040.
39. Owens Jr. CV, Lambright C, Bobseine K, Ryan B, Earl Gray Jr. L, Gullett BK, et al. Identification of estrogenic compounds emitted from the combustion of computer print-ed circuit boards in electronic waste. Environ Sci Technol. 2007;41(24):8506–11, http://dx.doi.org/10.1021/es071425p.
40. von Goetz N, Wormuth M, Scheringer M, Hungerbüh-ler K. Bisphenol A: How the most relevant exposure sources contribute to total consumer exposure. Risk Anal. 2010;30(3):473–87, http://dx.doi.org/10.1111/j.1539-6924.2009.01345.x.
41. Kawaguchi M, Inoue K, Yoshimura M, Sakui N, Okanou-chi N, Ito R, et. al. Trace analysis of phenolic xenoestrogens in water samples by stir bar sorptive extraction with in situ derivatization and thermal desorption–gas chromatography–mass spectrometry. J Chromatogr A. 2004;1041(1–2):19–26, http://dx.doi.org/10.1016/j.chroma.2004.04.044.
42. Zafra A, del Olmo M, Suárez B, Hontoria E, Navalón A, Vilchez JL. Gas chromatographic–mass spectrometric meth-od for the determination of bisphenol A and its chlorinated derivatives in urban waste water. Water Res. 2003;37(4): 735–42, http://dx.doi.org/10.1016/S0043-1354(02)00413-X.
43. Olea N, Pulgar R, Pérez P, Olea-Serrano F, Rivas A, No-villo-Fertrell A, et al. Estrogenicity of resin-based compos-ites and sealants used in dentistry. Environ Health Persp. 1996;104(3):298–305.
44. Yang Y, Wang Z, Xie S. Aerobic biodegradation of bisphe-nol A in river sediment and associated bacterial community change. Sci Total Environ. 2014;470–1:1184–8, http://dx.doi.org/10.1016/j.scitotenv.2013.10.102.
EXPOSURE TO BPA IN THE GROUP OF PARTICULAR RISK R E V I E W P A P E R
IJOMEH 2015;28(2) 237
62. Miyagi SJ, Collier AC. Pediatric development of glucuronida-tion: The ontogeny of hepatic UGT1A4. Drug Metab Dispos. 2007;35(9):1587–92, http://dx.doi.org/10.1124/dmd.107.015214.
63. Allegaert K, Vanhole C, Vermeersch S, Rayyan M, Verbes-selt R, de Hoon J. Both postnatal and postmenstrual age contribute to the interindividual variability in tramadol glucuronidation in neonates. Early Hum Dev. 2008;84(5): 325–30, http://dx.doi.org/10.1016/j.earlhumdev.2007.08.005.
64. Balakrishnan B, Henare K, Thorstensen EB, Ponnam-palam AP, Mitchell MD. Transfer of bisphenol A across the human placenta. Am J Obstet Gynecol. 2010;202(4):393.e1–7, http://dx.doi.org/10.1016/j.ajog.2010.01.025.
65. Calafat AM, Ye X, Silva MJ, Kuklenyik Z, Needham LL. Human exposure assessment to environmental chemicals using biomonitoring. Int J Androl. 2006;29(1):166–71, http://dx.doi.org/10.1111/j.1365-2605.2005.00570.x.
66. Calafat AM, Needham LL. Factors affecting the evalua-tion of biomonitoring data for human exposure assessment. Int J Androl. 2007;31(2):139–43, http://dx.doi.org/10.1111/j.1365-2605.2007.00826.x.
67. Koch HM, Calafat AM. Human body burdens of chemicals used in plastic manufacture. Philos Trans R Soc Lond Biol Sci. 2009;364:2063–78, http://dx.doi.org/10.1098/rstb.2008.0208.
68. Needham LL, Sexton K. Introduction and overview: Assess-ing children’s exposure to hazardous environmental chemi-cals: An overview of selected research challenges and com-plexities. J Expo Anal Environ Epidemiol. 2000;10:611–29, http://dx.doi.org/10.1038/sj.jea.7500142.
69. Schöringhumer K, Cichna-Markl M. Sample clean-up with sol–gel enzyme and immunoaffinity columns for the determination of bisphenol A in human urine. J Chro-matogr B. 2007;850(1–2):361–9, http://dx.doi.org/10.1016/ j.jchromb.2006.12.002.
70. Ye X, Bishop AM, Reidy JA, Needham LL, Calafat AM. Temporal stability of the conjugated species of bisphenol A, parabens, and other environmental phenols in human urine. J Expo Sci Environ Epidemiol. 2007;17:567–72, http://dx.doi.org/10.1038/sj.jes.7500566.
53. Liao C, Kannan K. Widespread occurrence of bisphe-nol A in paper and paper products: Implications for human exposure. Environ Sci Technol. 2011;45(21):9372–9, http://dx.doi.org/10.1021/es202507f.
54. Liao C, Kannan K. High levels of bisphenol A in paper cur-rencies from several countries, and implications for dermal exposure. Environ Sci Technol. 2011;45(16):6761–8, http://dx.doi.org/10.1021/es200977t.
55. Kurebayashi H, Harada R, Stewart RK, Numata H, Ohno Y. Disposition of a low dose of bisphenol A in male and female cynomolgus monkeys. Toxicol Sci. 2002;68(1):32–42, http://dx.doi.org/10.1093/toxsci/68.1.32.
56. Völkel W, Colnot T, Csanády GA, Filser JG, Dekant W. Metabolism and kinetics of bisphenol A in humans at low doses following oral administration. Chem Res Toxicol. 2002;15(10):1281–7, http://dx.doi.org/10.1021/tx025548t.
57. Vandenberg LN, Chahoud I, Heindel JJ, Padmanabhan V, Paumgartten FJR, Schoenfelder G. Urinary, circulating, and tissue biomonitoring studies indicate widespread exposure to bisphenol A. Environ Health Persp. 2010;118(8):1055–70, http://dx.doi.org/10.1289/ehp.0901716.
58. Derouiche S, Warnier M, Mariot P, Gosset P, Mauroy B, Bon-nal JL, et al. Bisphenol A stimulates human prostate cancer cell migration via remodeling of calcium signaling. Springer-Plus. 2013;2:54, http://dx.doi.org/10.1186/2193-1801-2-54.
59. Arakawa C, Fujimaki K, Yoshinaga J, Imai H, Serizawa S, Shiraishi H. Daily Urinary excretion of bisphenol A. En-viron Health Prev Med. 2004;9(1):22–6, http://dx.doi.org/ 10.1265/ehpm.9.22.
60. Hengstler JG, Foth H, Gebel T, Kramer PJ, Lilienblum W, Schweinfurth H, et al. Critical evaluation of key evidence on the human health hazards of exposure to bisphenol A. Crit Rev Toxicol. 2011;41(4):263–91, http://dx.doi.org/10.3109/10408444.2011.558487.
61. Edginton AN, Schmitt W, Voith B, Willmann S. A mecha-nistic approach for the scaling of clearance in children. Clin Pharmacokinet. 2006;45(7):683–704, http://dx.doi.org/10.2165/00003088-200645070-00004.
80. Fukata H, Miyagawa H, Yamazaki N, Mori C. Com-parison of ELISA- and LC-MS based methodolo-gies for the exposure assessment of bisphenol A. Toxi-col Mech Method. 2006;16(8):427–30, http://dx.doi.org/10.1080/15376520600697404.
81. Tsukioka T, Terasawa J, Sato S, Hatayama Y, Makino T, Na-kazawa H. Development of analytical method for determin-ing trace amounts of BPA in urine samples and estimation of exposure to BPA. J Environ Chem. 2004;14(1):57–63, http://dx.doi.org/10.5985/jec.14.57.
82. Völkel W, Kiranoglu M, Fromme H. Determination of free and total bisphenol A in urine of infants. Environ Res. 2011;111(1):143–8.
83. Ginsberg G, Rice DC. Does rapid metabolism ensure neg-ligible risk from bisphenol A? Environ Health Perspect. 2009;117(12):1639–43.
84. Casas M, Valvi D, Luque N, Ballesteros-Gomez A, Car-sin AE, Fernandez MF, et al. Dietary and sociodemographic determinants of bisphenol A urine concentrations in preg-nant women and children. Environ Int. 2013;56:10–8, http://dx.doi.org/10.1016/j.envint.2013.02.014.
85. Frederiksen H, Aksglaede L, Sorensen K, Nielsen O, Main KM, Skakkebaek NE, et al. Bisphenol A and other phenols in urine from Danish children and adolescents ana-lyzed by isotope diluted Turbo Flow-LC–MS/MS. Int J Hyg Environ Health. 2013;216(6):710–20.
86. Zhang T, Sun H, Kannan K. Blood and urinary bisphe-nol A concentrations in children, adults, and pregnant women from China: Partitioning between blood and urine and maternal and fetal cord blood. Environ Sci Technol. 2013;47(9):4686−94, http://dx.doi.org/10.1021/es303808b.
87. Teeguarden JG, Calafat AM, Ye X, Doerge DR, Church-well MI, Gunawan R, et al. Twenty-four hour human urine and serum profiles of bisphenol A during high-dietary ex-posure. Toxicol Sci. 2011;123(1):48–57, http://dx.doi.org/10. 1093/toxsci/kfr160.
88. Sugiura-Ogasawara M, Ozaki Y, Sonta SI, Makino T, Suzu-mori K. Exposure to bisphenol A is associated with recurrent
71. Völkel W, Bittner N, Dekant W. Quantification of bisphe-nol A and bisphenol A glucuronide in biological samples by high performance liquid chromatography-tandem mass spectrometry. Drug Metab Dispos. 2005;33(11):1748–57, http://dx.doi.org/10.1124/dmd.105.005454.
72. Sajiki J. Decomposition of bisphenol-A (BPA) by radi-cal oxygen. Environ Int. 2001;27(4):315–20, http://dx.doi.org/10.1016/S0160-4120(01)00062-9.
73. Schönfelder G, Wittfoht W, Hopp H, Talsness CE, Paul M, Chahoud I. Parent bisphenol A accumulation in the human maternal–fetal–placental unit. Environ Health Perspect. 2002;110(11):A703–7.
74. Calafat AM, Kuklenyik Z, Reidy JA, Caudill SP, Ekong J, Needham LL. Urinary concentrations of bisphe-nol A and 4-nonylphenol in a human reference population. Environ Health Perspect. 200;113(4):391–5, http://dx.doi.org/10.1289/ehp.7534.
75. Calafat AM, Ye X, Wong LY, Reidy JA, Needham LL. Ex-posure of the U.S. population to bisphenol A and 4-ter-tiary-octylphenol: 2003–2004. Environ Health Perspect. 2008;116(1):39–44, http://dx.doi.org/10.1289/ehp.10753.
76. Yang YJ, Hong YC, Oh SY, Park MS, Kim H, Leem JH, et al. Bisphenol A exposure is associated with oxidative stress and inflammation in postmenopausal women. En-viron Res. 2009;109(6):797–801, http://dx.doi.org/10.1016/ j.envres.2009.04.014.
77. Lakind JS, Naiman DQ. Bisphenol A (BPA) daily in-takes in the United States: Estimates from the 2003–2004 NHANES urinary BPA data. J Expo Sci Environ Epidemiol. 2008;18:608–15, http://dx.doi.org/10.1038/jes.2008.20.
78. Padmanabhan V, Siefert K, Ransom S, Johnson T, Pinker-ton J, Anderson L, et al. Maternal bisphenol-A levels at delivery: A looming problem? J Perinatol. 2008;28:258–63, http://dx.doi.org/10.1038/sj.jp.7211913.
79. Calafat AM, Weuve J, Ye X, Jia LT, Hu H, Ringer S, et al. Ex-posure to bisphenol A and other phenols in neonatal inten-sive care unit premature infants. Environ Health Perspect. 2009;117(4):639–44, http://dx.doi.org/10.1289/ehp.0800265.
EXPOSURE TO BPA IN THE GROUP OF PARTICULAR RISK R E V I E W P A P E R
IJOMEH 2015;28(2) 239
97. Eng DS, Lee JM, Gebremariam A, Meeker JD, Peterson K, Padmanabhan V. Bisphenol A and chronic disease risk factors in US children. Pediatrics. 2013;132(3):e637–45, http://dx.doi.org/10.1542/peds.2013-0106.
98. Harley KG, Schall RA, Chevrier J, Tyler K, Aguirre H, Bradman A, et al. Prenatal and postnatal bisphenol A ex-posure and body mass index in childhood in the CHAMA-COS Cohort. Environ Health Perspect. 2013;121(4):514–20, http://dx.doi.org/10.1289/ehp.1205548.
99. Volberg V, Harley K, Calafat AM, Davé V, McFadden J, Eskenazi B, et al. Maternal bisphenol A exposure during pregnancy and its association with adipokines in Mexican-American children. Environ Mol Mutagen. 2013;54(8): 621–8, http://dx.doi.org/10.1002/em.21803.
100. Trasande L, Attina TM, Blustein J. Association between urinary bisphenol A concentration and obesity prevalence in children and adolescents. JAMA. 2012;308(11):1113–21, http://dx.doi.org/10.1001/2012.jama.11461.
101. Wolff MS, Teitelbaum SL, Windham G, Pinney SM, Brit-ton JA, Chelimo C, et al. Pilot study of urinary biomarkers of phytoestrogens, phthalates, and phenols in girls. Envi-ron Health Perspect. 2007;115(1):116–21, http://dx.doi.org/10.1289/ehp.9488.
102. Wolff MS, Engel SM, Berkowitz GS, Ye X, Silva MJ, Zhu C, et al. Prenatal phenol and phthalate exposures and birth outcomes. Environ Health Perspect. 2008;116(8): 1092–7, http://dx.doi.org/10.1289/ehp.11007.
103. Khalil N, Ebert JR, Wang L, Belcher S, Lee M, Czerwin-ski SA, et al. Bisphenol A and cardiometabolic risk factors in obese children. Sci Total Environ. 2014;470–1:726–32, http://dx.doi.org/10.1016/j.scitotenv.2013.09.088.
104. Miao M, Yuan W, He Y, Zhou Z, Wang J, Gao E, et al. In utero exposure to bisphenol A and anogenital distance of male offspring. Birth defects Res A Clin Mol Tera-tol. 2011b;91(10):867–72.
105. Spanier AJ, Kahn RS, Kunselman AR, Hornung R, Xu Y, Calafat AM, et al. Prenatal exposure to bisphenol A and child wheeze from birth to 3 years of age. Environ Health
89. Cantonwine D, Meeker JD, Hu H, Sánchez BN, Lamadrid-Figueroa H, Mercado-García A, et al. Bisphenol A expo-sure in Mexico City and risk of prematurity: A pilot nested case control study. Environ Health. 2010;9:62, http://dx.doi.org/10.1186/1476-069X-9-62.
90. Miao M, Yuan W, Zhu G, He X, Li DK. In utero exposure to bisphenol A and its effect on birth weight of offspring. Reprod Toxicol. 2011;32(1):64–8, http://dx.doi.org/10.1016/ j.reprotox.2011.03.002.
91. Chou WC, Chen JL, Lin CF, Chen YC, Shih FC, Chuang CY. Biomonitoring of bisphenol A concentrations in maternal and umbilical cord blood in regard to birth outcomes and adipokine expression: A birth cohort study in Taiwan. Environ Health. 2011;10:94, http://dx.doi.org/10.1186/1476-069X-10-94.
92. Philippat C, Mortamais M, Chevrier C, Petit C, Calafat AM, Ye X, et al. Exposure to phthalates and phenols during preg-nancy and offspring size at birth. Environ Health Perspect. 2012;120:464–70, http://dx.doi.org/10.1289/ehp.1103634.
93. Lee BE, Park H, Hong YC, Had M, Kim Y, Chang N, et al. Prenatal bisphenol A and birth outcomes: MOCEH (Mothers and Children’s Environmental Health) study. Int J Hyg Environ Health. 2014;217(2–3):328–34, http://dx.doi.org/10.1016/j.ijheh.2013.07.005.
94. Bhandari R, Xiao J, Shankar A. Urinary bisphenol A and obesity in US children. Am J Epidemiol. 2013;177(11):1263–70, http://dx.doi.org/10.1093/aje/kws391.
95. Valvi D, Casas M, Mendez MA, Ballesteros-Gómez A, Luque N, Rubio S, et al. Prenatal bisphenol A urine con-centrations and early rapid growth and overweight risk in the offspring. Epidemiology. 2013;24(6):791–9, http://dx.doi.org/10.1097/EDE.0b013e3182a67822.
96. Maserejian NN, Trachtenberg FL, Hauser R, McKinlay S, Shrader P, Bellinger DC. Dental composite restorations and neuropsychological development in children: Treat-ment level analysis from a randomized clinical trial. Neu-rotoxicology. 2012;33:1291–7.
113. Wang T, Lu J, Xu M, Xu Y, Li M, Liu Y, et al. Urinary bisphenol A concentration and thyroid function in Chinese adults. Epidemiology. 2013;24(2):295–302, http://dx.doi.org/10.1097/EDE.0b013e318280e02f.
114. Gentilcore D, Porreca I, Rizzo F, Ganbaatar E, Carchia E, Mallardo M, et al. Bisphenol A interferes with thyroid spe-cific gene expression. Toxicology. 2013;304:21–31, http://dx.doi.org/10.1016/j.tox.2012.12.001.
115. Braun JM, Kalkbrenner AE, Calafat AM, Yolton K, Ye X, Dietrich KN, et al. Impact of early life bisphenol A expo-sure on behavior and executive function in children. Pedi-atrics. 2011;128(5):873–82, http://dx.doi.org/10.1542/peds. 2011-1335.
116. Perera F, Vishnevetsky J, Herbstman JB, Calafat AM, Xiong W, Rauh V, et al. Prenatal bisphenol A and child behavior in an inner-city cohort. Environ Health Perspect. 2012;120:1190–4.
117. Callan AC, Lee Hinwood A, Heffernan A, Eaglesh-am G, Mueller J, Odland JØ. Urinary bisphenol A con-centrations in pregnant women. Int J Hyg Environ Health. 2013;216(6):641–4, http://dx.doi.org/10.1016/j.ijh eh.2012.10.002.
118. Braun JM, Yolton K, Dietrich KN, Hornung R, Ye X, Calafat AM, et al. Prenatal bisphenol A exposure and early childhood behavior. Environ Health Perspect. 2009;117:1945–52, http://dx.doi.org/10.1289/ehp.0900979.
119. Miodovnik A, Engela SM, Zhua C, Ye X, Soorya LV, Sil-va MJ, et al. Endocrine disruptors and childhood social impairment. Neurotoxicology. 2011;32(2):261–7, http://dx. doi.org/10.1016/j.neuro.2010.12.009.
120. Hong SB, Hong YC, Kim JW, Park EJ, Shin MS, Kim BN, et al. Bisphenol A in relation to behavior and learn-ing of school-age children. J Child Psychol Psychiatry. 2013;54(8):890–9, http://dx.doi.org/10.1111/jcpp.12050.
121. Maserejian NN, Hauser R, Tavares M, Trachtenberg FL, Shrader P, McKinlay S. Dental composites and amalgam and physical development in children. J Dent Res. 2012;91 (11):1019–25, http://dx.doi.org/10.1177/0022034512458691.
106. Donohue KM, Miller RL, Perzanowski MS, Just AC, Hoepner LA, Arunajadai S, et al. Prenatal and postnatal bisphenol A exposure and asthma development among inner-city children. J Allergy Clin Immunol. 2013;131(3): 736–42, http://dx.doi.org/10.1016/j.jaci.2012.12.1573.
107. Clayton Rees EM, Todd M, Beam Dowd J, Aiello AE. The impact of bisphenol A and triclosan on immune pa-rameters in the U.S. Population, NHANES 2003–2006. Environ Health Perspect. 2011;119:390–6, http://dx.doi. org/10.1289/ehp.1002883.
108. Zoeller RT. Environmental chemicals as thyroid hormone analogues: New studies indicate that thyroid hormone re-ceptors are targets of industrial chemicals? Mol Cell Endo-crinol. 2005;242(1–2):10–5, http://dx.doi.org/10.1016/j.mce. 2005.07.006.
109. Moriyama K, Tagami T, Akamizu T, Usui T, Saijo M, Kanamoto N, et al. Thyroid hormone action is disrupt-ed by bisphenol A as an antagonist. J Clin Endocrinol Metab. 2002;87(11):5185–90, http://dx.doi.org/10.1210/jc. 2002-020209.
110. Tanida T, Warita K, Ishihara K, Fukui S, Mitsuhashi T, Sugawara T, et al. Fetal and neonatal exposure to three typical environmental chemicals with different mechanisms of action: Mixed exposure to phenol, phthalate, and dioxin cancels the effects of sole exposure on mouse midbrain do-paminergic nuclei. Toxicol Lett. 2009;189(1):40–7, http://dx.doi.org/10.1016/j.toxlet.2009.04.005.
111. Pearce EN, Braverman LE. Environmental pollut-ants and the thyroid. Best Pract Res Clin Endocrinol Metab. 2009;23(6):801–13, http://dx.doi.org/10.1016/j.beem. 2009.06.003.
112. Chevrier J, Gunier RB, Bradman A, Holland NT, Cala-fat AM, Eskenazi B, et al. Maternal urinary Bisphenol A during pregnancy and maternal and neonatal thyroid func-tion in the CHAMACOS study. Environ Health Perspect. 2013;121:138–44, http://dx.doi.org/10.1289/ehp.1205092.
EXPOSURE TO BPA IN THE GROUP OF PARTICULAR RISK R E V I E W P A P E R
IJOMEH 2015;28(2) 241
Official Journal of the European Union L 26, 29 January 2011 [cited 2014 Mar 12], p. 11–14. Available from: http://faolex.fao.org/docs/pdf/eur100741.pdf.
125. French Agency for Food, Environmental and Occupational Health and Safety. Opinion on the assessment of the risks associated with bisphenol A for human health, and on toxicological data and data on the use of bisphenols S, F, M, B, AP, AF and BADGE. PDF ANSES Opinions Re-quest no. 2009-SA-0331 and no. 2010-SA-0197 [cited 2014 Mar 12]. Available from: https://www.anses.fr/en/docu-ments/CHIM2009sa0331Ra-0EN.
122. Yolton K, Xu Y, Strauss D, Altaye M, Calafat AM, Kho-ury J. Prenatal exposure to bisphenol A and phthalates and infant neurobehavior. Neurotoxicol Teratol. 2011;33(5): 558–66, http://dx.doi.org/10.1016/j.ntt.2011.08.003.
123. Ouchi K, Watanabe S. Measurement of bisphenol A in hu-man urine using liquid chromatography with multi-channel coulometric electrochemical detection. J Chromatogr B. 2002;780(2):365–70, http://dx.doi.org/10.1016/S1570-0232 (02)00547-0.
124. Directive 2011/8/EU of the Commission of 28 January 2011 amending Directive 2002/72/EC as regards the restriction of use of Bisphenol A in plastic infant feeding bottles.
This work is available in Open Access model and licensed under a Creative Commons Attribution-NonCommercial 3.0 Poland License – http://creativecommons.org/licenses/by-nc/3.0/pl/deed.en.