© 2009 Forrester Research, Inc. Reproduction Prohibited
Бизнес-технологии в Век Потребителя: за пределы CRM и лояльности...
Сергей Македонский
Forrester Research
Форум SAP, 06 ноября 2014 г.
• Век Потребителя и 4 императива для бизнеса
• Тенденции глобального рынка бизнес-технологий 2010-2015 гг.
• "Цифровое поведение" потребителя
• Customer Experience - ключевой тренд торговли
• Современные инструменты анализа бизнес-технологий
План презентации
Экспертная
поддержка
продукта
Возможности
самообслуживания
Систематический
«канальный»
опыт
Поддержка
по электронным
каналам
Компания
знает мою
«историю»
Проактивная
поддержка и
уведомления
«Увеличенные»
часы
обслуживания
Сегодняшний
потребитель
Ожидания и запросы потребителей постоянно растут…
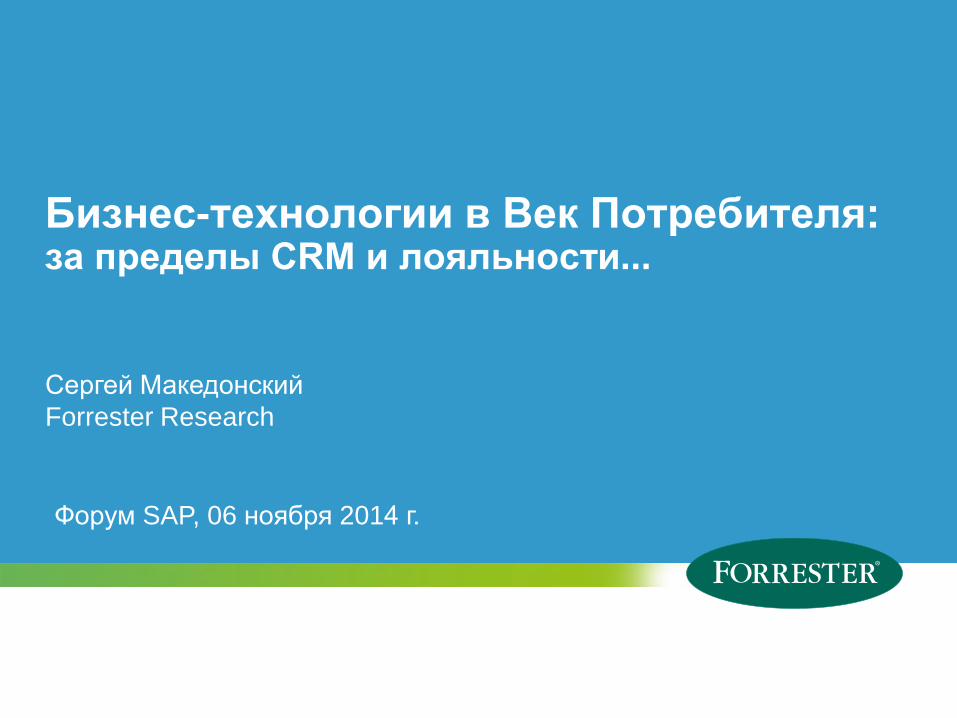
Люди используют разнообразные каналы в рамках одного потребительского действия
Помощь человека
нужна для
взаимодействия. . .
. . . сложного
. . . редкого
. . . с высокой эмоцио-
нальной составляющей
Самообслуживание
предназначено для
взаимодействия. . .
. . . простого
. . . частого
. . . с низкой эмоцио-
нальной составляющей
Начало заполнения
онлайн анкеты
для приобретения
продукта/услуги
1 Звонок в колл-центр
для уточнения
специфических
деталей продукта/услуги 2
3
Завершение заполнения
анкеты и онлайн-
сравнение
с другими предложениями 4
Звонок для уточнения,
«покрывается ли страхов-
кой здание нестандарт-
ной конструкции» Покупка продукта/услуги
онлайн/офлайн
5
Source: GO-Gulf.com (http://www.go-gulf.com)
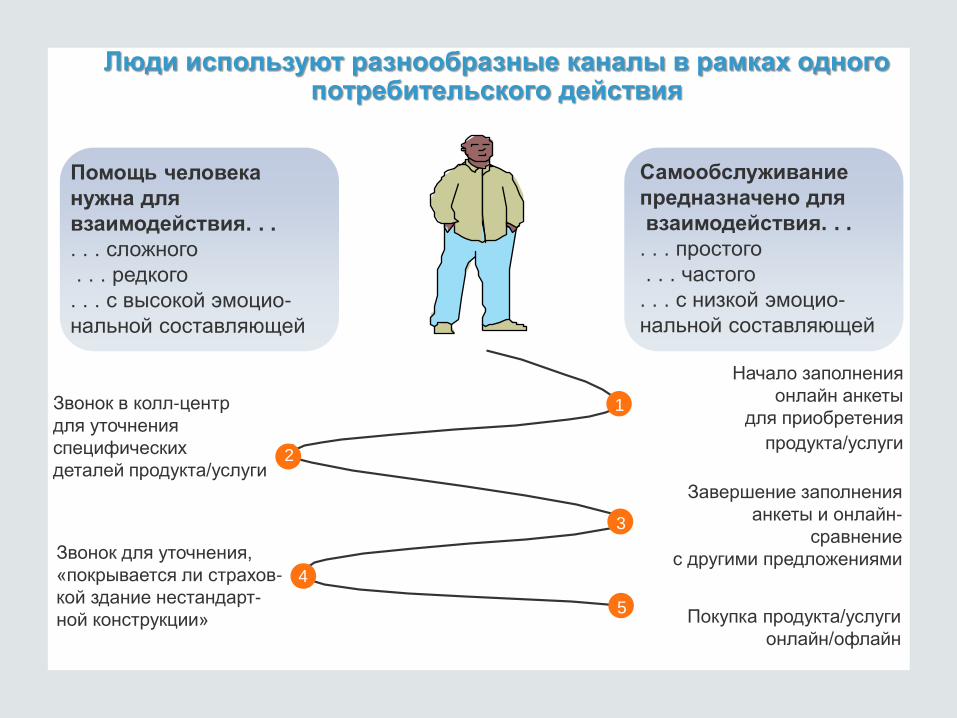
Связь
Созидание Потребление
Контроль
Блоги
IM /
чаты
SMS
Рингтоны Music
Поиск
Новости
Видео ТВ
Web-путешествия
Игры
Карты
Здоровье
Платежи Торговля
Банкинг
Билеты
Парковка
Социальные
сети
Картинки
E-mail / MMS
Organizer Голос
Формируется новая мобильная цифровая экосистема
© 2013 Forrester Research, Inc. Reproduction Prohibited 7
Мобильность - основа «цифрового разрыва»
Russia device landscape - 2017
105M
Unique mobile subscribers 142M
Total Population
55% Of unique mobile subscribers
have smartphones
49M Mobile internet users
Tablet installed base of 26.5M Source: Forrester Research World Mobile Adoption Forecast 2013-2018,
Forrester Research World Smartphone Adoption Forecast 2012-2017,
Forrester Research World Tablet Adoption Forecast 2012-2017
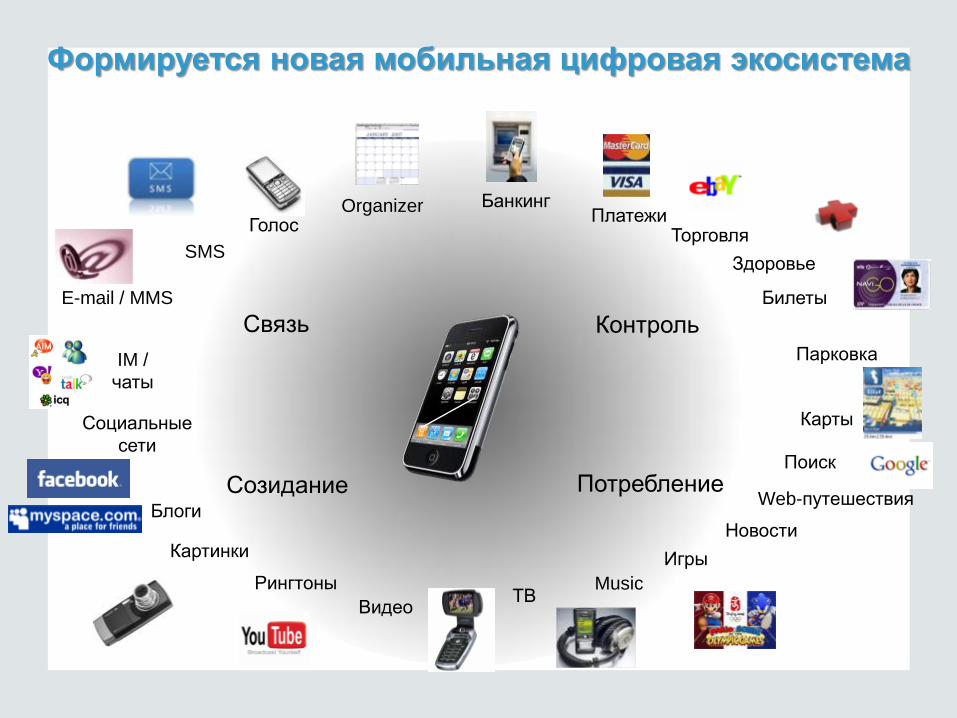
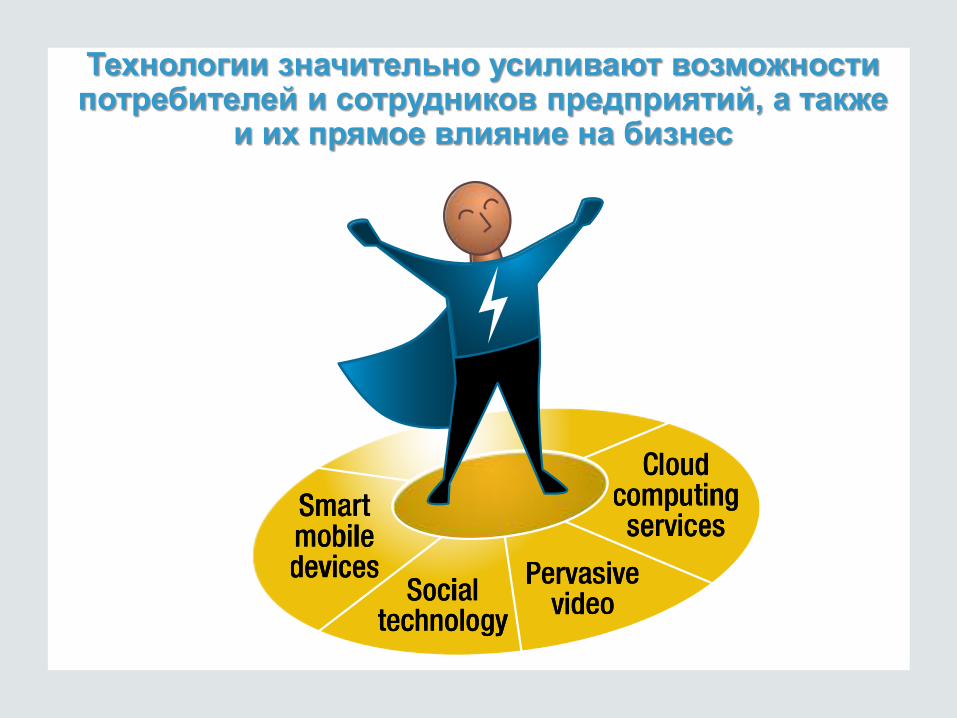
Технологии значительно усиливают возможности потребителей и сотрудников предприятий, а также
и их прямое влияние на бизнес
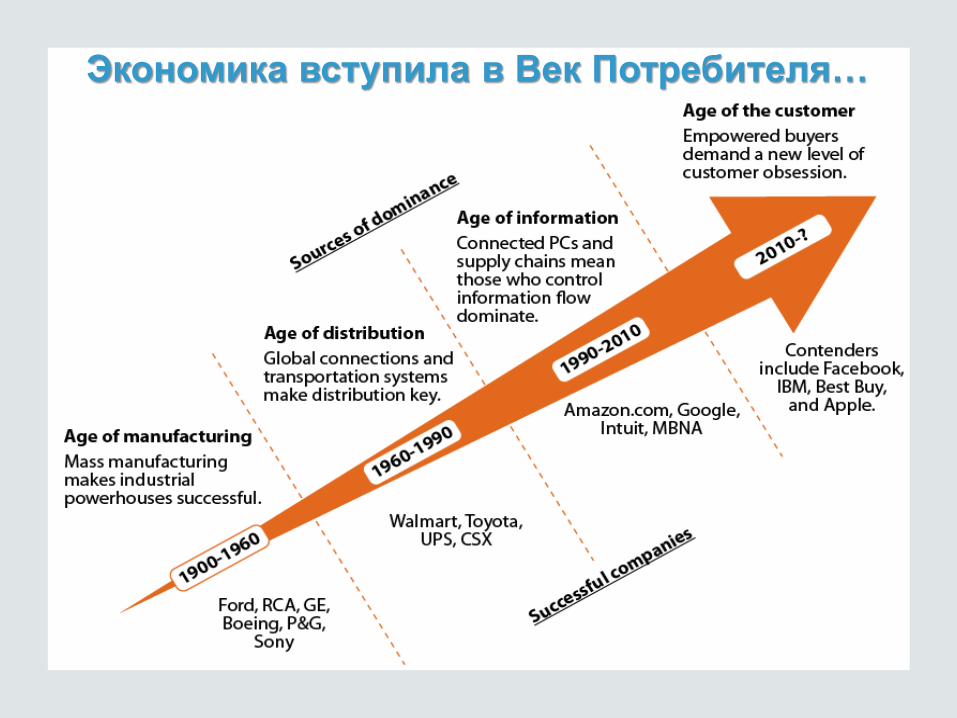
Экономика вступила в Век Потребителя…
© 2014 Forrester Research, Inc. Reproduction Prohibited 10
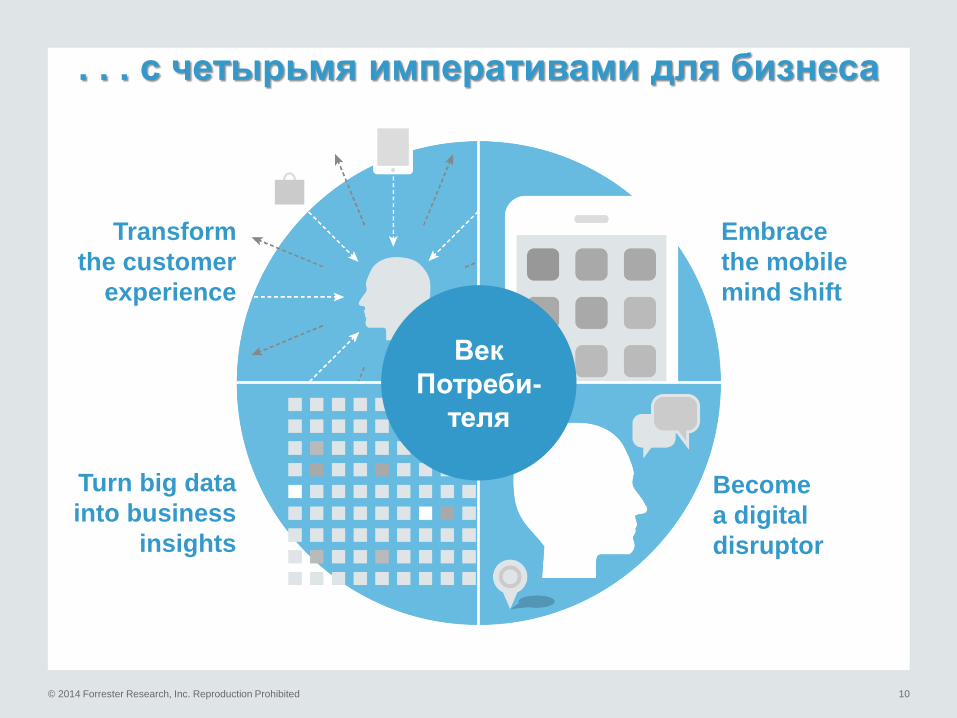
. . . с четырьмя императивами для бизнеса
Transform
the customer
experience
Embrace
the mobile
mind shift
Become
a digital
disruptor
Век
Потреби-
теля
Turn big data
into business
insights
© 2012 Forrester Research, Inc. Reproduction Prohibited
20 крупнейших Tech рынков в 2014 году
© 2012 Forrester Research, Inc. Reproduction Prohibited
20 самых быстрорастущих Tech рынков в 2014 году
The Global Tech Industry Wheel 2014
© 2012 Forrester Research, Inc. Reproduction Prohibited
Global IT Purchases By Product, 2013 To 2015
© 2012 Forrester Research, Inc. Reproduction Prohibited
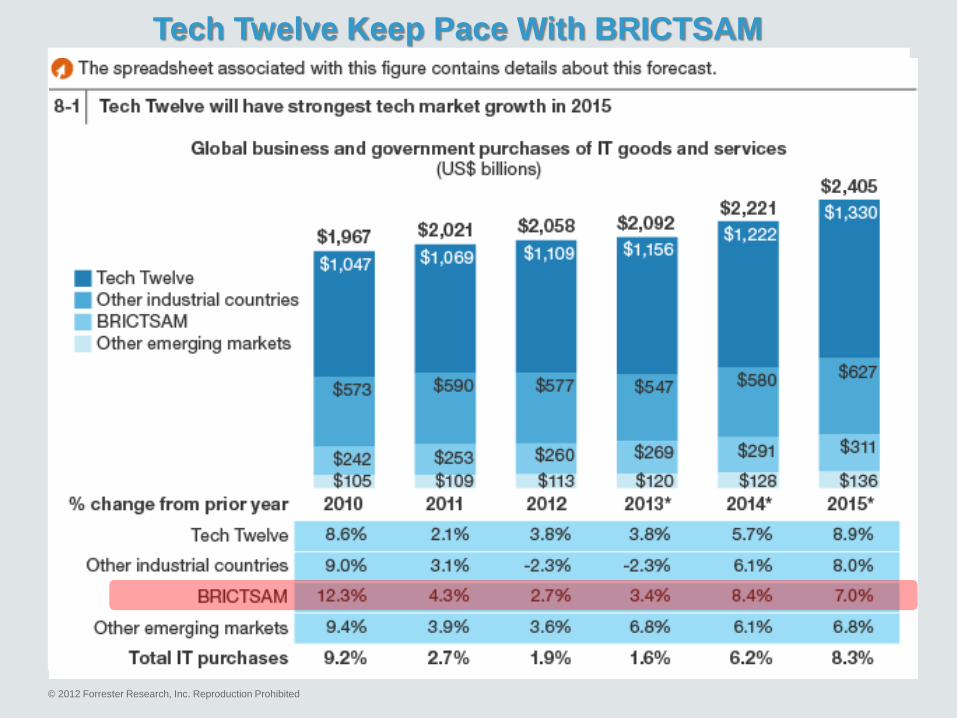
Tech Twelve Keep Pace With BRICTSAM
«Клиентские» технологии Mobile, Cloud, Smart - опережающие темпы роста
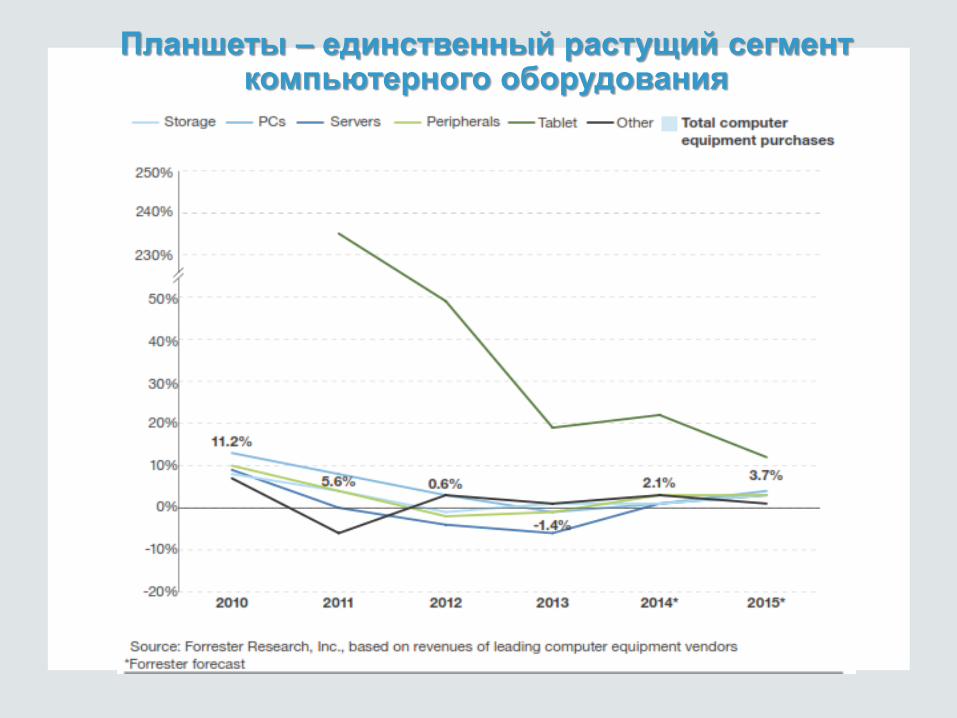
Планшеты – единственный растущий сегмент компьютерного оборудования
© 2012 Forrester Research, Inc. Reproduction Prohibited
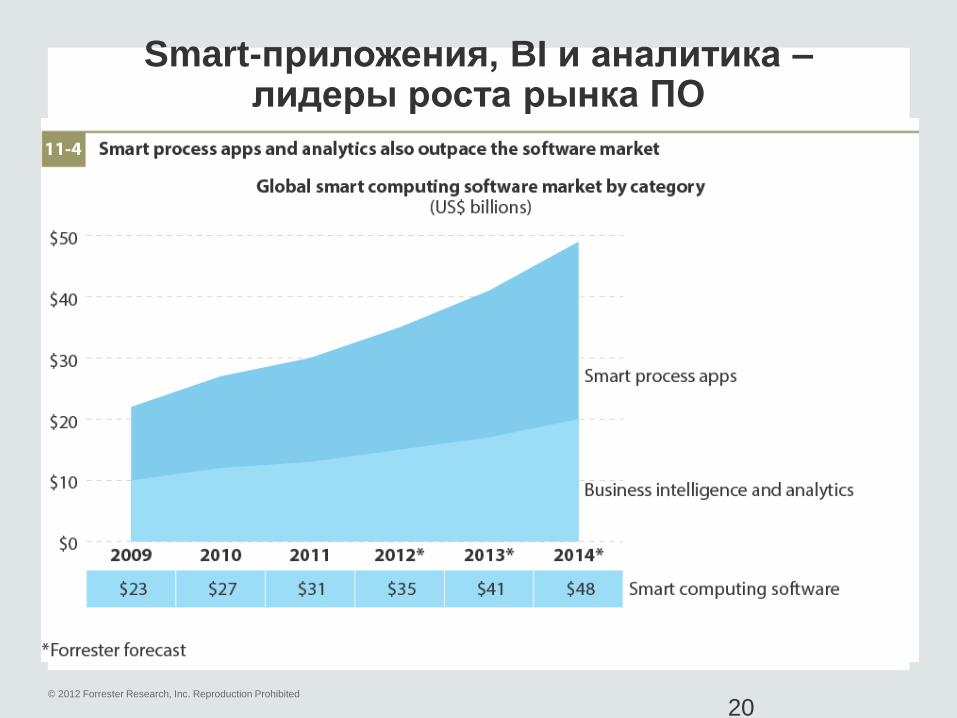
Apps, Analytics, And As-A-Service Are The Drivers Of Software Growth
© 2012 Forrester Research, Inc. Reproduction Prohibited
Apps, Analytics, And As-A-Service Are The Drivers Of Software Growth (Cont.)
© 2012 Forrester Research, Inc. Reproduction Prohibited
Smart-приложения, BI и аналитика – лидеры роста рынка ПО
20
© 2014 Forrester Research, Inc. Reproduction Prohibited
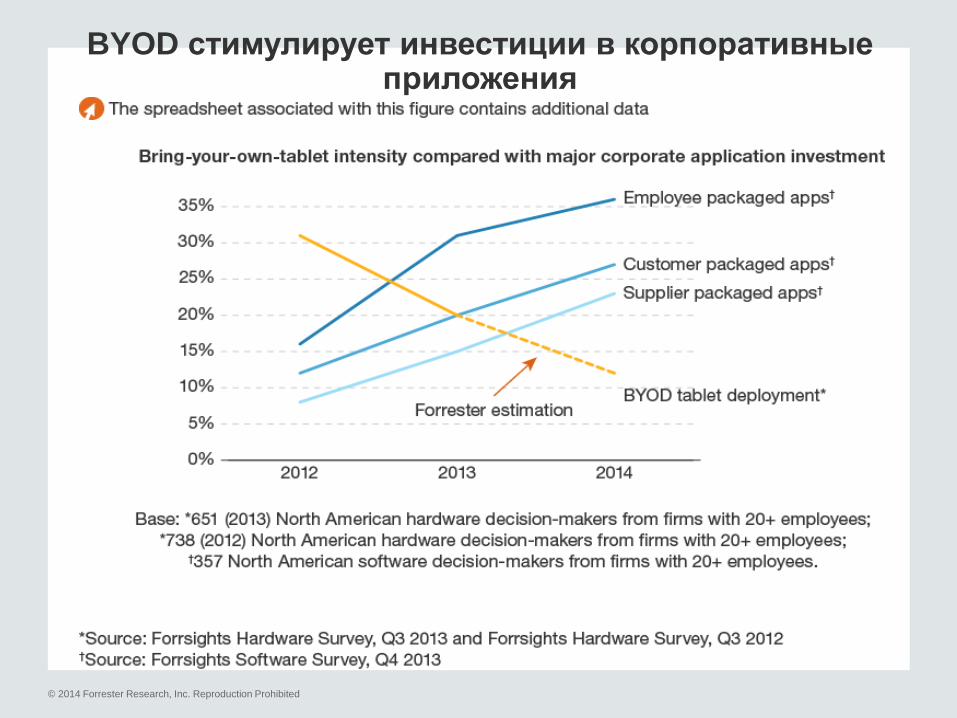
BYOD стимулирует инвестиции в корпоративные приложения
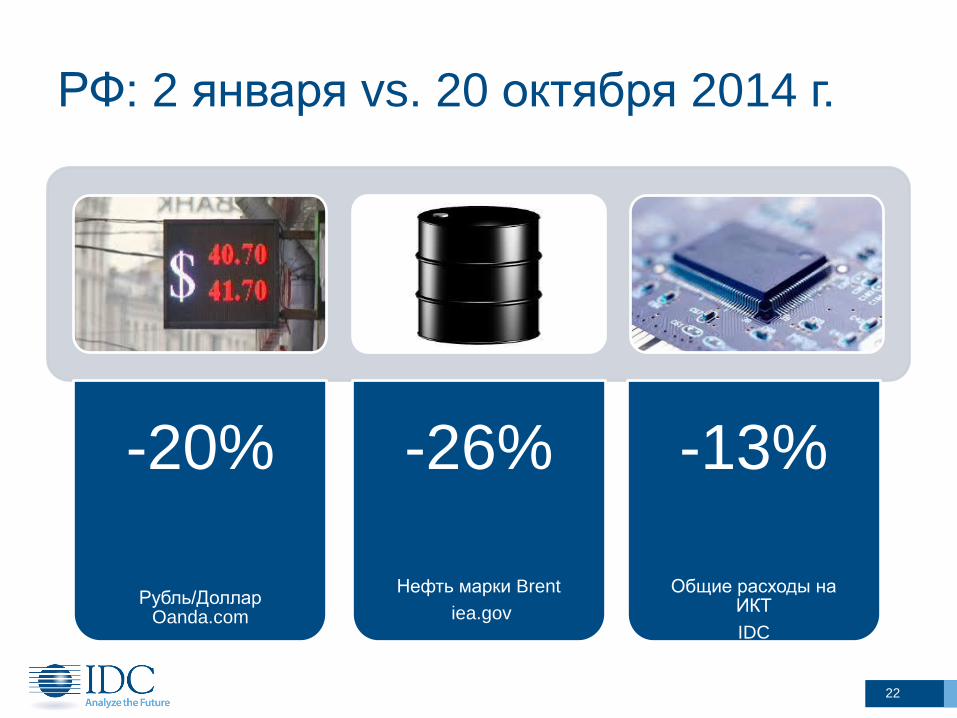
РФ: 2 января vs. 20 октября 2014 г.
-20%
Рубль/Доллар Oanda.com
-26%
Нефть марки Brent
iea.gov
-13%
Общие расходы на ИКТ
IDC
22
К чему это может привести?
Отсутствие роста внутреннего спроса на ИТ-услуги
Отдельные российские заказчики не смогут инвестировать в ИТ из-за неопределенности, связанной с возможными санкциями в будущем
Снижается привлекательность России для инвесторов
Бизнес-климат в России становится значительно менее предсказуемым
Отдельные российские заказчики могут рассматривать местные услуги по разработке ПО как альтернативу западному ПО
Возможно, со временем Россия выстроит более тесные торговые связи с клиентами за пределами ЕС и Северной Америки
Девальвация рубля означает то, что Россия становится более дешевым местом для поиска разработчиков ПО
© IDC Visit us at IDC.com and follow us on Twitter: @IDC 23
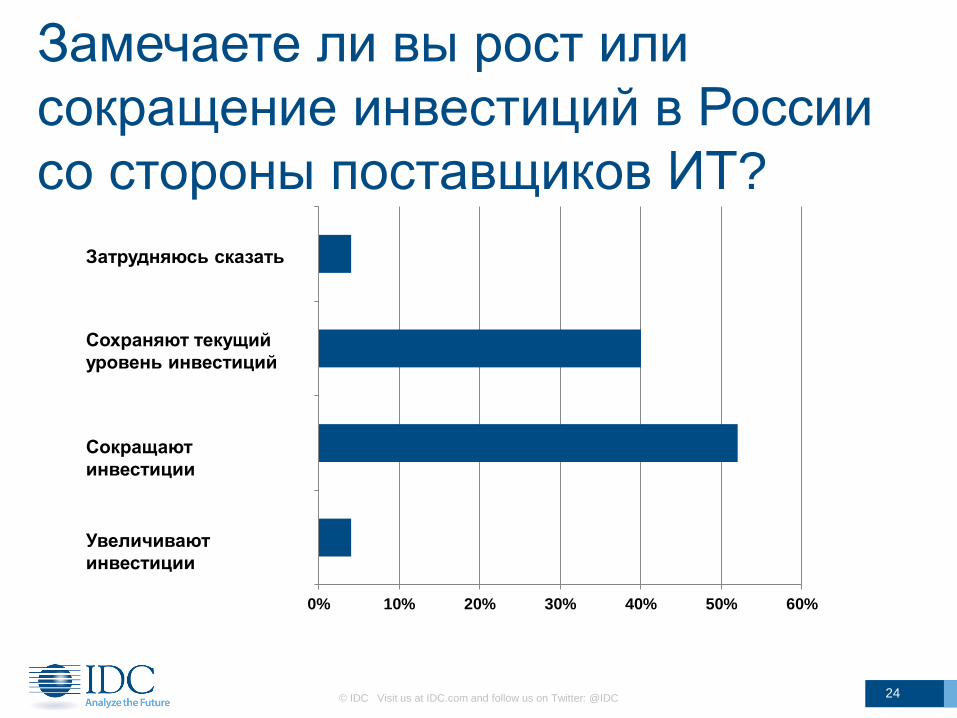
Замечаете ли вы рост или
сокращение инвестиций в России
со стороны поставщиков ИТ?
© IDC Visit us at IDC.com and follow us on Twitter: @IDC 24
0% 10% 20% 30% 40% 50% 60%
Increasing levels of investment
Reducing levels of investment
Maintaining current investment levels
Can't sayЗатрудняюсь сказать
Сохраняют текущий
уровень инвестиций
Сокращают
инвестиции
Увеличивают
инвестиции
© 2013 Forrester Research, Inc. Reproduction Prohibited 25
8%
14%
18%
47%
19%
32%
13%
8%
10%
15%
18%
39%
58%
26%
46%
16%
15%
9%
0% 20% 40% 60% 80%
Transfer money between personal accounts (Wkly‡)
Check financial accounts/statements (Wkly‡)
Mobile banking (P3M†*)
Access Internet in stores (while shopping)†
Purchase physical goods (Monthly+ **)
Research physical goods (Monthly+ **)
Finance/Banking (PM*)
Payment (e.g. PayPal) (PM*)
Shopping (e.g. Amazon) (PM*) Russia
EU7
Ownership is only part of the equation Mobile activities demonstrate levels of sophistication
Reta
il/eC
om
F
inancia
l A
pplic
ations
Source: European Technographics Online Benchmark Survey, 2013, Russian Technographics Online Benchmark Survey, 2013
Base: Various, see Appendix for details
The Mobile Mind Shift Index
• The reason we have developed this
framework is because people are now
becoming more accustomed to
accomplishing tasks and finding
information instantly and now expect
immediate, always available
convenience from every company they
interact with.
• The Mobile Mind Shift Index (MMSI)
determines how far people have
shifted.
• Based on our research we have found
that companies whose customers have
above-average MMSIs and who have
more than 35% Adapters, Immersers,
and Perpetuals must move urgently to
deliver on their customers' mobile
expectations.
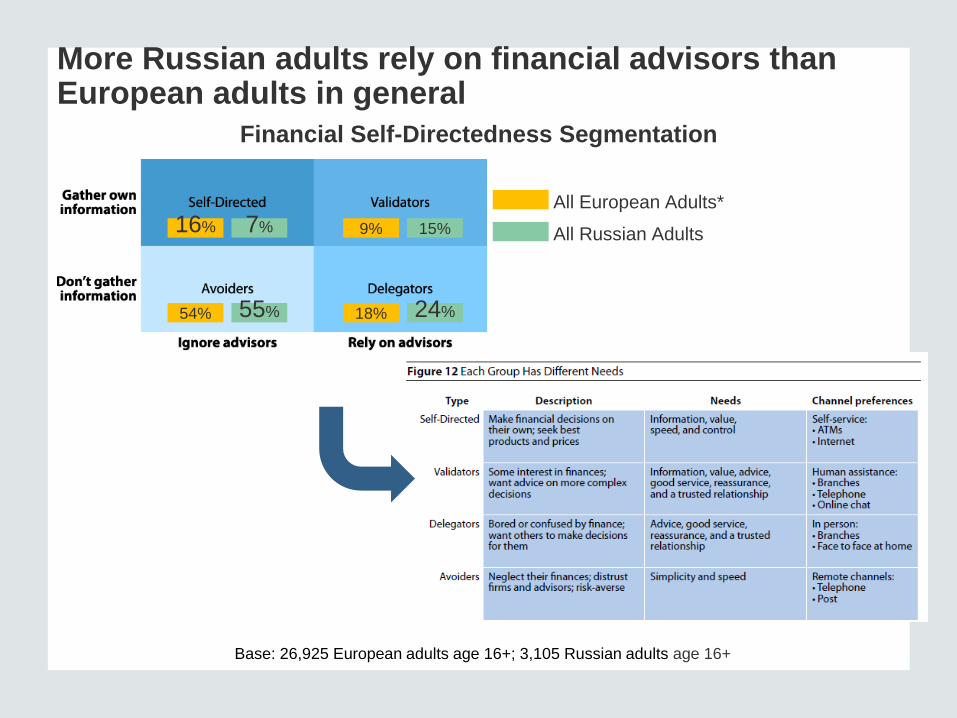
More Russian adults rely on financial advisors than European adults in general
All European Adults*
All Russian Adults 16% 7% 9% 15%
18% 24% 54% 55%
Base: 26,925 European adults age 16+; 3,105 Russian adults age 16+
Financial Self-Directedness Segmentation
© 2013 Forrester Research, Inc. Reproduction Prohibited 28
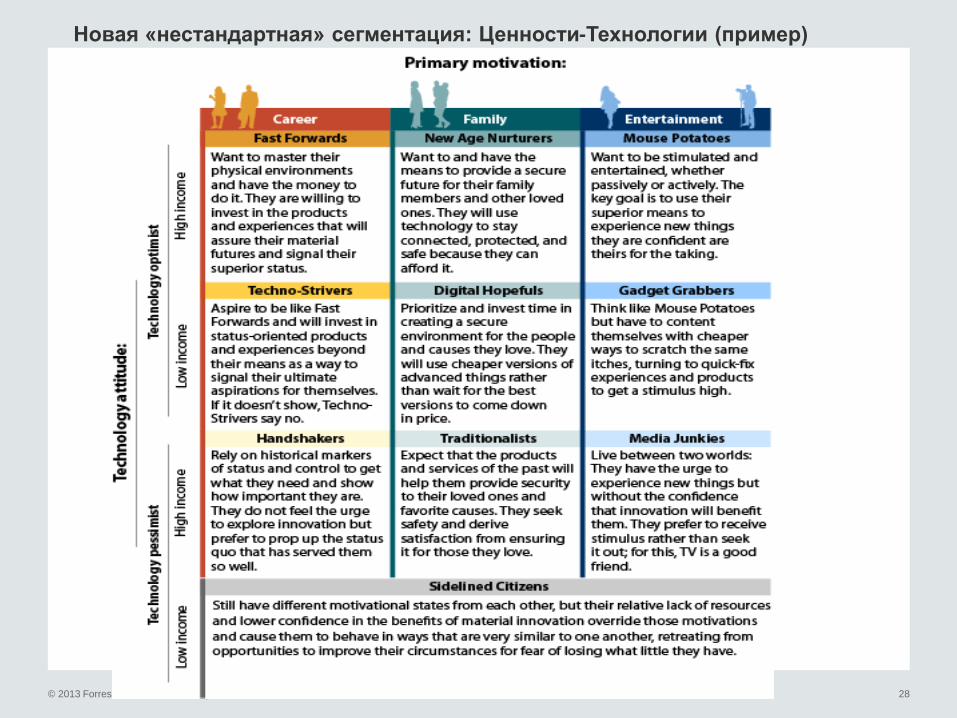
Новая «нестандартная» сегментация: Ценности-Технологии (пример)
© 2013 Forrester Research, Inc. Reproduction Prohibited 29
Consumer Technographics DATA-DRIVEN INSIGHTS ACROSS A RANGE OF CONSUMER BEHAVIOR
Over 400,000 annually completed surveys across 21 countries on how
consumers:
› Shop, consume media, get services, learn, and bank
› Spend time, interact, communicate, and entertain themselves
› Are motivated by technology-driven attitudes and values
› Own and relate to over 1500 consumer brands and media
Device
Ownership
Technology
Behaviors
Technology
Attitudes
Brand
Ownership
Media
Consumption
Consumer Technographics Russia: обзор данных
© 2011 Forrester Research, Inc. Reproduction Prohibited 31
43%
7%
18%
31%
57%
63%
5%
8%
67%
43%
10%
36%
32%
63%
67%
2%
12%
33%
Other source
Radio
Newspapers
Magazines
TV
High street shops
The Internet on a mobile device
Email newsletters
The Internet on a computer
over 30
under 30
Age
31
On
line
So
urc
es
Offlin
e S
ou
rce
s
Please indicate the top 3 media sources you currently depend on the
most for obtaining information on Small domestic appliances
Base: 2283 urban Russian consumers age 16+ who used a media source for small domestic appliances
(consumers that responded none or did not answer the question were removed)
Source: European Technographics Benchmark Survey
The top 3 research sources for small domestic appliances among
urban Russian age under 30 are the internet, shops and TV
© 2011 Forrester Research, Inc. Reproduction Prohibited 32 32
0%
6%
96%
1%
7%
95%
By post/phone/catalog
Via the Internet
In a shop
over 30
under 30
Age
Where did you buy it from in the past 3 months?
16% 18% under 30
over 30
Age
Did you buy small domestic appliances
(e.g. kettle) in the past 3 months?
The majority of urban Russian small domestic appliance buyers
used a store for purchase
Base: 275 urban Russian consumers age 16+ who bought small domestic
appliances in the past 3 months
Base: 2283 urban Russian consumers age 16+
© 2011 Forrester Research, Inc. Reproduction Prohibited 33
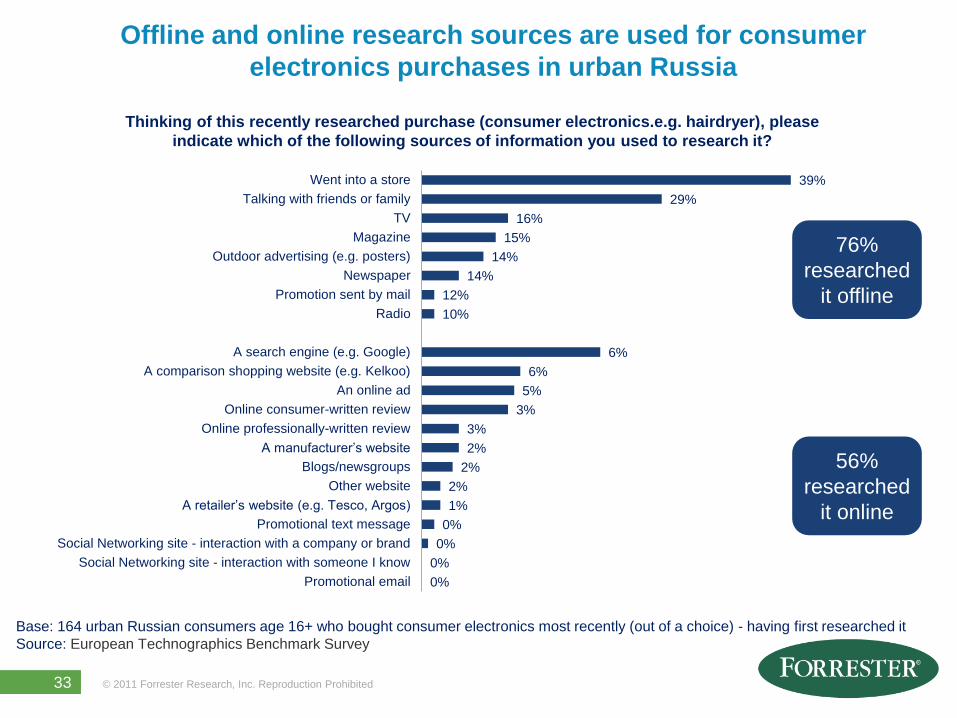
Base: 164 urban Russian consumers age 16+ who bought consumer electronics most recently (out of a choice) - having first researched it
Source: European Technographics Benchmark Survey
Thinking of this recently researched purchase (consumer electronics.e.g. hairdryer), please
indicate which of the following sources of information you used to research it?
0%
0%
0%
0%
1%
2%
2%
2%
3%
3%
5%
6%
6%
10%
12%
14%
14%
15%
16%
29%
39%
Promotional email
Social Networking site - interaction with someone I know
Social Networking site - interaction with a company or brand
Promotional text message
A retailer’s website (e.g. Tesco, Argos)
Other website
Blogs/newsgroups
A manufacturer’s website
Online professionally-written review
Online consumer-written review
An online ad
A comparison shopping website (e.g. Kelkoo)
A search engine (e.g. Google)
Radio
Promotion sent by mail
Newspaper
Outdoor advertising (e.g. posters)
Magazine
TV
Talking with friends or family
Went into a store
76%
researched
it offline
56%
researched
it online
Offline and online research sources are used for consumer
electronics purchases in urban Russia
© 2011 Forrester Research, Inc. Reproduction Prohibited 34
Thinking of this recently researched purchase (consumer electronics e.g. hairdryer), please indicate
which of the following sources of information you used to research it?
Which one of these had the most influence on your final purchase decision?
Outdoor advertising (e.g. posters)
Magazine
TV
Online consumer-written review
An online ad
A comparison shopping website (e.g. Kelkoo)
A search engine (e.g. Google) Talking with friends or
family
Went into a store
0%
10%
20%
30%
40%
50%
60%
70%
0% 10% 20% 30% 40% 50% 60% 70%
Mo
st In
flu
en
ce
Used for research
The store is not only the research source used by most urban Russians
who purchased consumer electronics, but it also had the most influence
Base: 164 urban Russian consumers age 16+ who bought consumer electronics most recently (out of a choice) - having first researched it
Source: European Technographics Benchmark Survey
© 2011 Forrester Research, Inc. Reproduction Prohibited 35
Did you change your mind about what brand to buy as a result of researching this product?
7%
9%
21%
64%
I didn’t have a brand in mind in the first place
Don’t remember
Yes, I did change my mind
No, I didn’t change my mind
64% of urban Russian consumer electronics buyers had a
brand in mind already and didn’t change their mind
Base: 164 urban Russian consumers age 16+ who bought consumer electronics most recently (out of a choice) - having first researched it
Source: European Technographics Benchmark Survey
© 2011 Forrester Research, Inc. Reproduction Prohibited 36
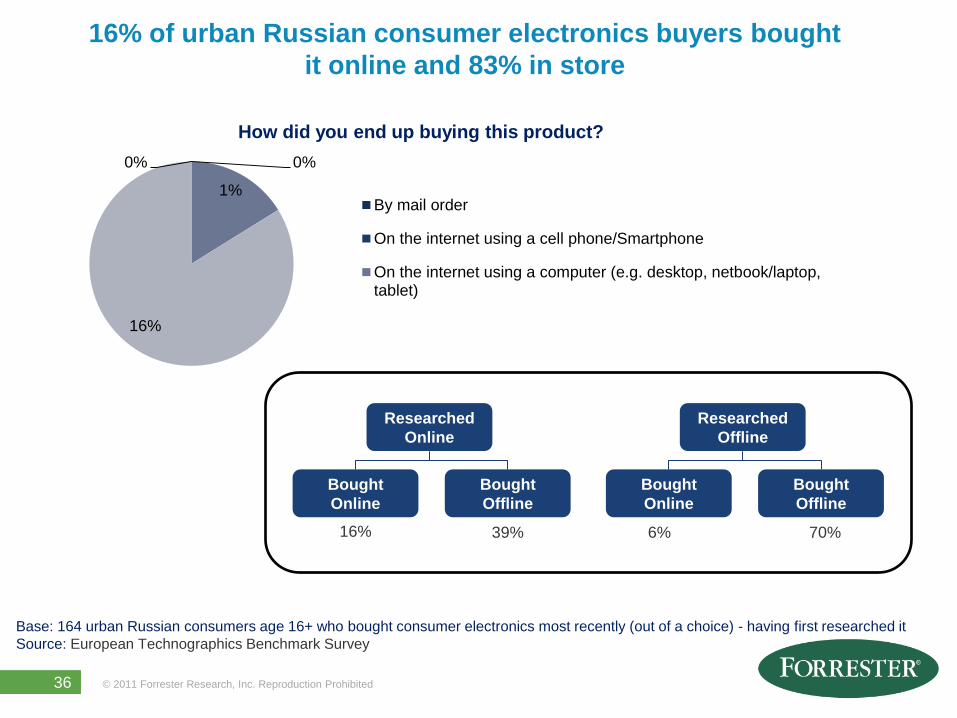
How did you end up buying this product?
0% 0%
1%
16%
By mail order
On the internet using a cell phone/Smartphone
On the internet using a computer (e.g. desktop, netbook/laptop,tablet)
Base: 164 urban Russian consumers age 16+ who bought consumer electronics most recently (out of a choice) - having first researched it
Source: European Technographics Benchmark Survey
16% of urban Russian consumer electronics buyers bought
it online and 83% in store
Researched
Online
Bought
Online
Bought
Offline
Researched
Offline
Bought
Online
Bought
Offline
16% 39% 6% 70%
© 2011 Forrester Research, Inc. Reproduction Prohibited 37 © 2014 Forrester Research, Inc. Reproduction Prohibited 37
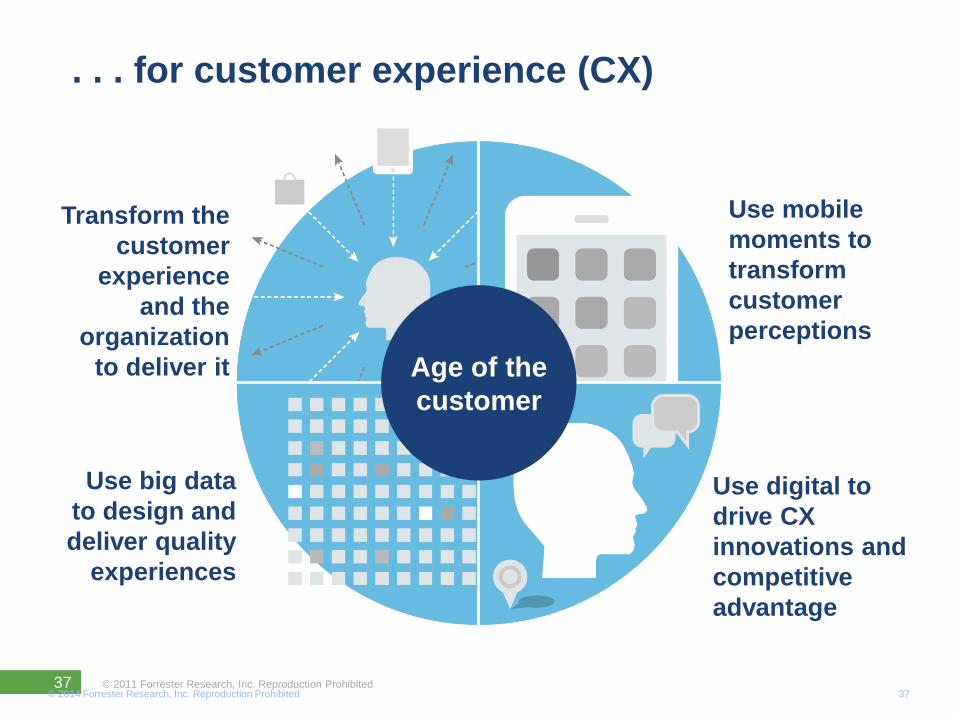
Transform the
customer
experience
and the
organization
to deliver it
Use mobile
moments to
transform
customer
perceptions
Use digital to
drive CX
innovations and
competitive
advantage
Use big data
to design and
deliver quality
experiences
Age of the
customer
. . . for customer experience (CX)
© 2011 Forrester Research, Inc. Reproduction Prohibited 38
© 2011 Forrester Research, Inc. Reproduction Prohibited 39
© 2011 Forrester Research, Inc. Reproduction Prohibited 40
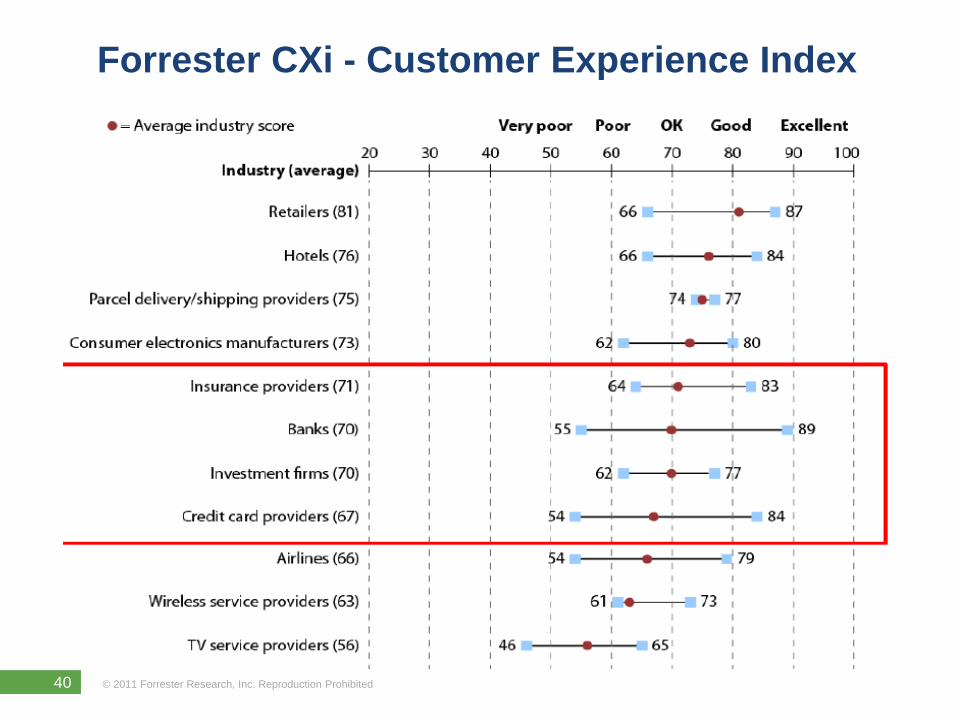
Forrester CXi - Customer Experience Index
© 2011 Forrester Research, Inc. Reproduction Prohibited 41
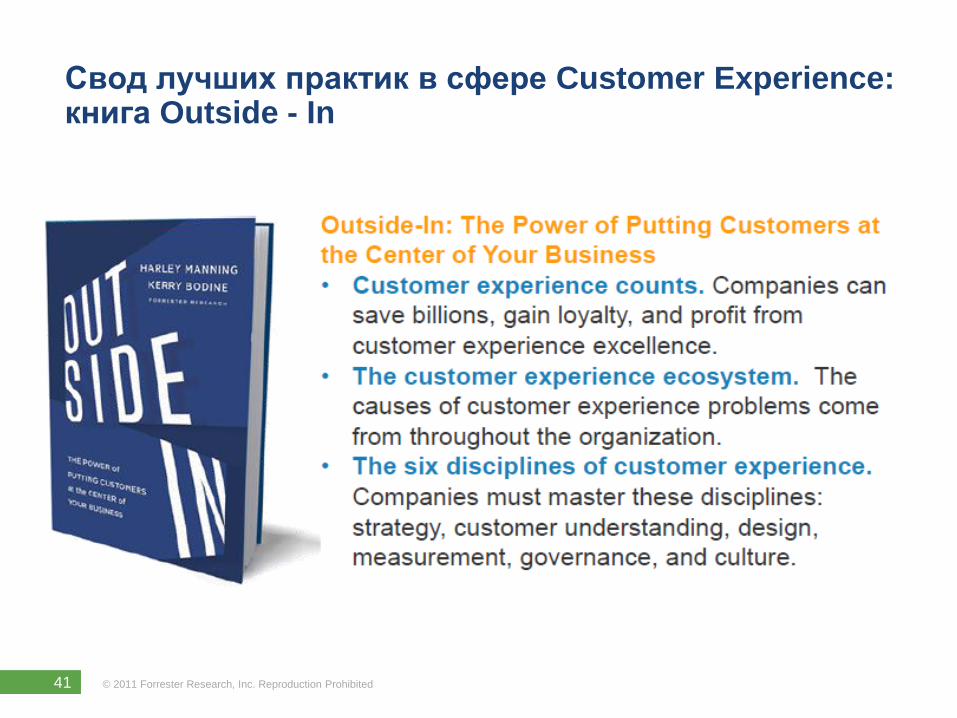
Свод лучших практик в сфере Customer Experience: книга Outside - In
© 2011 Forrester Research, Inc. Reproduction Prohibited 42
DISCOVER PLAN ACT OPTIMIZE
© 2014 Forrester Research, Inc. Reproduction Prohibited 42
Executive Overview
Forrester’s CX Playbook
Benchmarks
Continuous
Improvement
Performance
Management
Processes
Tools And
Technology
Organization
Strategic
Plan
Road Map
Assessment
Landscape
Business
Case
Vision
© 2011 Forrester Research, Inc. Reproduction Prohibited 43 © 2014 Forrester Research, Inc. Reproduction Prohibited 43
Forrester’s Forum for Customer Experience Professionals, EMEA London, November 17, 2014
“WHY GOOD ISN’T GOOD ENOUGH”
› Accelerate your success
› Learn from your peers and other
experts in the field
› Engage with Forrester analysts
› Connect with peers
› Get an exclusive first look at
new research and survey data
© 2009 Forrester Research, Inc. Reproduction Prohibited
Спасибо!
Сергей Македонский
www.forrester.com
[email protected]
© 2013 Forrester Research, Inc. Reproduction Prohibited 45
Countries:
Argentina
Australia
Brazil
Canada
China
France
Germany
India
Indonesia,
coming 2013
Italy
Japan
Mexico
The Netherlands
Poland
Russia
South Korea
Spain
Sweden
Turkey, coming 2013
United Kingdom
US and US Hispanic
Consumer Technographics Global syndicated insights on the intersection of consumers
and technology — attitudes, behaviors, motivations
+ Longest-running digital
consumer study (since
1997)
+ 400,000+ completed
surveys
+ 1,500 brands
+ 300 attitudes captured
+ 7 proprietary profiles
______________________
= Deep, customizable,
trended consumer
insights
Coverage area
© 2013 Forrester Research, Inc. Reproduction Prohibited 46
Digital consumer profiling
Understand new and changing markets.
Customer analysis Analyze your
customers, partners, and competitors.
Consumer segmentation
Target and profile the right customers.
Product and service innovation
Identify the right product features.
Marketing and advertising
Plan effective marketing
campaigns.
Marketers turn to Technographics
© 2013 Forrester Research, Inc. Reproduction Prohibited 47
Business questions answered FORRESTER CONSUMER TECHNOGRAPHICS®
› How will disruptive technologies impact my strategy?
› Does my social media strategy align with my customer’s
expectations?
› What data insight can I use to help guide my mobile strategy?
› What consumers drivers and inhibitors support my multichannel
strategy?
› What are my customer’s touch points in their purchase journey?
› What markets are best to prioritize in my globalization strategy?
› What are my customer segments attitudes towards advertising?
› How are my customers different from my competitors’ customers?
Global Digital
Profile Deck Every digital strategy starts with
the consumer. This customizable
deliverable explores the digital
lifestyle of three profile groups in
order to inform interactive
marketing, eBusiness and
product strategy decisions.
Source: Global Technographics Online Benchmark Surveys
© 2013 Forrester Research, Inc. – reproduction prohibited – for internal distribution only
Russian online adults 18+
Russian online males adults 18+
Russian online female adults 18+
Global data should be analyzed
with caution; factors such as
sample properties and country
culture can impact the results
when comparisons are made
between countries and/or regions.
1,027 923 1,950
34 33 34 45 44 45
Demographics
Source: Global Technographics Online Benchmark Surveys
Base: Online adults (18+): | |
© 2013 Forrester Research, Inc. – reproduction prohibited – for internal distribution only
College degree or higher (%)
Gender (% Male)
Average Annual Household Income (% High)
*Respondents not answering have been omitted
Average Age Married (%)
Parent of a child living in the household (under
18 in NA and APAC, under 16 in EU and LATAM) (%)
39 3245
47 100 0
35 38 32
•
•
•
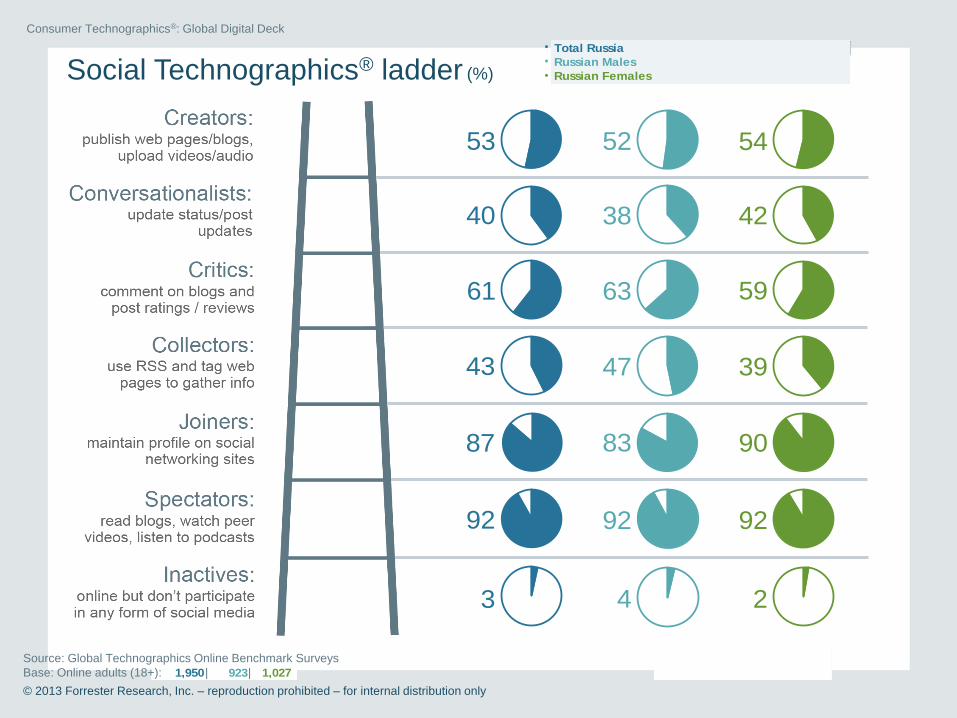
Total Russia
Russian Males
Russian Females
Consumer Technographics®: Global Digital Deck
53 50 56
Please us samples with <100
respondents directionally
1,027 923 1,950
53
40
61
43
87
92
3
Social Technographics® ladder (%)
52 54
38 42
63 59
47 39
83 90
92 92
4 2
•
•
•
Total Russia
Russian Males
Russian Females
Source: Global Technographics Online Benchmark Surveys
Base: Online adults (18+): | |
© 2013 Forrester Research, Inc. – reproduction prohibited – for internal distribution only
Consumer Technographics®: Global Digital Deck
Please us samples with <100
respondents directionally
1,027 923 1,950
58 64 53
64 65 63
38 46 31
11 8 14
5 6 4
1 2 1
Mobile Technographics® ladder (%)
•
•
•
Total Russia
Russian Males
Russian Females
Source: Global Technographics Online Benchmark Surveys
Base: Online adults (18+): | |
© 2013 Forrester Research, Inc. – reproduction prohibited – for internal distribution only
Consumer Technographics®: Global Digital Deck
Please us samples with <100
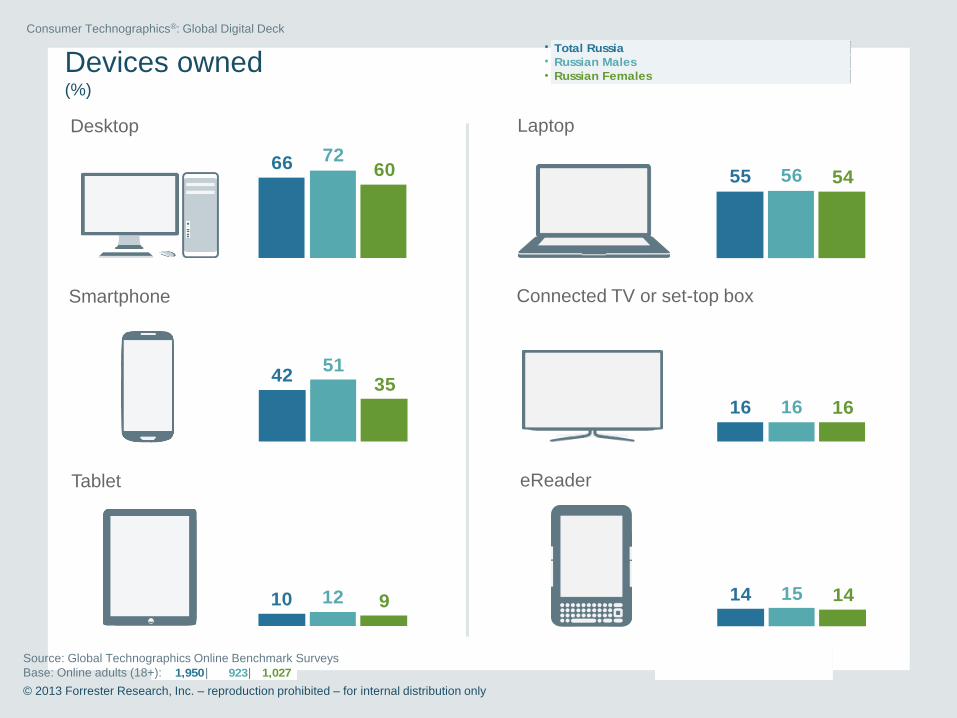
respondents directionally
1,027 923 1,950
Devices owned (%)
Tablet
Smartphone
Desktop
eReader
Connected TV or set-top box
Laptop
10 12 9 14 15 14
4251
35
16 16 16
66 7260 55 56 54
•
•
•
Total Russia
Russian Males
Russian Females
Source: Global Technographics Online Benchmark Surveys
Base: Online adults (18+): | |
© 2013 Forrester Research, Inc. – reproduction prohibited – for internal distribution only
Consumer Technographics®: Global Digital Deck
Please us samples with <100
respondents directionally
1,027 923 1,950
Media consumption
In a typical week, how many hours do you spend:
*Breakdown of traditional media time (hours)
Using the internet
(for work or personal
purposes)
With traditional media*
Watching TV on a TV Listening to the radio Reading print newspapers Reading print magazines
23
13
1
2
24
14
1
2
22
13
1
2
1.4 1.66.9 3.4
1.5 1.66.7 3.7
7.1 3.1 1.4 1.6
•
•
•
Total Russia
Russian Males
Russian Females
Source: Global Technographics Online Benchmark Surveys
Base: Online adults (18+): | |
© 2013 Forrester Research, Inc. – reproduction prohibited – for internal distribution only
Consumer Technographics®: Global Digital Deck
Please us samples with <100
respondents directionally
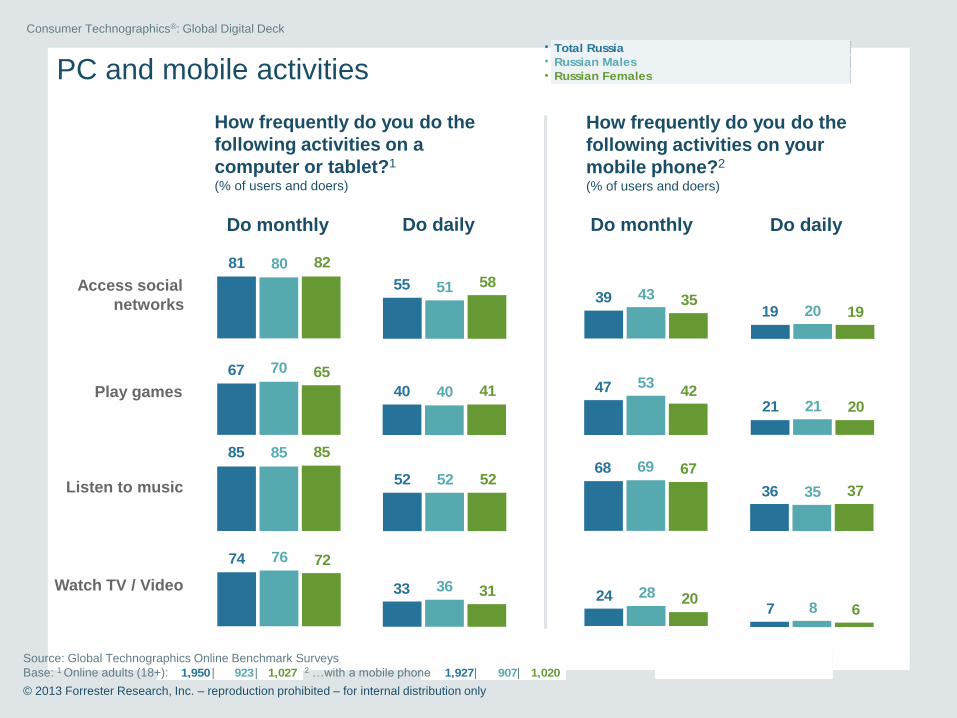
1,020 907 1,927 1,027 923 1,950
PC and mobile activities
How frequently do you do the
following activities on a
computer or tablet?1
(% of users and doers)
Do monthly Do daily
Access social
networks
Play games
Listen to music
Watch TV / Video
Do monthly Do daily
How frequently do you do the
following activities on your
mobile phone?2
(% of users and doers)
81 80 82
67 70 65
85 85 85
74 76 72
55 51 58
40 40 41
52 52 52
33 36 31
39 43 35
47 5342
68 69 67
24 28 20
19 20 19
21 21 20
36 35 37
7 8 6
•
•
•
Total Russia
Russian Males
Russian Females
Source: Global Technographics Online Benchmark Surveys
Base: 1 Online adults (18+): | | 2 …with a mobile phone | |
© 2013 Forrester Research, Inc. – reproduction prohibited – for internal distribution only
Consumer Technographics®: Global Digital Deck
Please us samples with <100
respondents directionally
662 680 1,342 1,020 907 1,927
65
75
70
Mobile apps
Used any mobile apps
in the past month1
(% of those with a mobile phone)
Types of mobile apps used in past month2 (%)
40
46
34
60
63
57
44
45
44
61
59
62
25
30
20
11
15
5
12
16
8
8
8
7
18
21
14
11
16
6
•
•
•
Total Russia
Russian Males
Russian Females
Source: Global Technographics Online Benchmark Surveys,
Base: 1 Online adults (18+) with a mobile phone: | | 2 and who use apps: | |
© 2013 Forrester Research, Inc. – reproduction prohibited – for internal distribution only
Weather
Social networking
News
Finance
TV and video
Games
Music
Sports
Shopping
QR and bar codes
Consumer Technographics®: Global Digital Deck
Please us samples with <100
respondents directionally