31
BKI INVESTMENT COMPANY LIMITED Results for the half year ended 31 December 2019 BKI is managed by Contact Asset Management AFSL 494045 For personal use only

BKI INVESTMENT COMPANY LIMITEDResults for the half year ended 31 December 2019
BKI is managed by Contact Asset ManagementAFSL 494045
For
per
sona
l use
onl
y
Disclaimer
2BKI Investment Company Limited
This material has been prepared by Contact Asset Management on behalf of BKI Investment Company Limited.
The information within this document is not intended to provide advice to investors or take into account an individual’s financialcircumstances or investment objectives. This is general investment advice only and does not constitute advice to any person. The opinionswithin this document are not intended to represent recommendations to investors, they are the view of Contact Asset Management andBKI Investment Company Limited as of this date and are accordingly subject to change.
Information related to any company or security is for information purposes only and should not be interpreted as a solicitation or offer tobuy or sell any security. The information on which this presentation is based has been obtained from sources we believe to be reliable, butwe do not guarantee its accuracy or completeness.
Investors should consult their financial adviser in relation to any material within this document.
For
per
sona
l use
onl
y

HighlightsFor the half year ended 31 December 2019
3BKI Investment Company Limited
Result excluding special investment revenue 1H 2020 1H 2019 Growth
Investment revenue – ordinary $27.0m $26.8m 0.8%
Income from operating activities $27.4m $28.0m (2.1%)
Net operating profit after tax $24.5m $25.5m (3.8%)
Earnings per share 3.35c 3.51c (4.6%)
Dividends per share 3.625c 3.625c 0%
Result including special investment revenue 1H 2020 1H 2019 Growth
Net operating profit after tax $25.5m $47.1m (45.9%)
Earnings per share 3.48c 6.48c (46.3%)
Special dividends per share nil 1.50c (100.0%)
The operating profit after tax, including special investment revenue, was significantly lower than last year due to the large amount of special dividends receivedduring the previous half year, accelerated by many companies within the BKI portfolio reacting to the possible threat of legislation to remove the benefit offranking credits. These special dividends also included; the fully franked special dividend component of the BHP off-market buy-back, and a non-cash unfrankeddividend recognised from the Coles-Wesfarmers demerger. During the first half of FY2020, BKI received a far lesser amount of special investment revenue, $1.0million, from companies including ASX Limited, Brambles Industries, Coles Limited and Telstra Corporation.
For
per
sona
l use
onl
y

BKI’s fully franked dividend yield is currently 4.3%*, while the grossed up yield is 6.2%*
Dividend History
4BKI Investment Company Limited
Note: *Includes FY2019 Final Dividend of 3.70cps and FY2020 Interim Dividend of 3.625cps. Based on share price of $1.70. Grossed up yield includes franking credits and is based on a tax rate of 30%. # Includes FY2020 Interim Dividend of 3.625cps.
BKI has paid out $1.06 per share, or over $700m in dividends and franking credits to shareholders since listing in 2003#
0.00
1.00
2.00
3.00
4.00
5.00
6.00
7.00
8.00
9.00
10.00
2004 2005 2006 2007 2008 2009 2010 2011 2012 2013 2014 2015 2016 2017 2018 2019 2020
Cen
ts p
er s
har
e
Interim Dividend Final Dividend Special DividendsFor
per
sona
l use
onl
y

An investment of $10,000 to purchase BKIshares upon listing in December 2003would now be receiving fully frankeddividends of $1,661pa.
The franking credits enhance the income bya further $712pa, assuming a tax rate of30% (total income of $2,373).
The same investment in a term deposit(based on the cash rate + 0.50%) would beearning $234pa, pre tax and with nofranking credits attached.
Income Generation Long term dividend income
5BKI Investment Company Limited
Source: BKI, Contact Asset Management, Bloomberg.
$234
$2,373
$0
$500
$1,000
$1,500
$2,000
$2,500
Interest Total Dividend Income (including Franking Credits)
Income from BKI Dividends
Income from term deposit
For
per
sona
l use
onl
y

Interim Dividend Dates
BKI’s DRP offers shareholders the opportunity to acquire further ordinary shares in BKI. The DRP will not be offered at a discount.
To obtain access to a DRP form please use the link below: www.bkilimited.com.au/dividend-reinvestment-plan/
Key Dates
Last trading date to be eligible for the dividend Thursday 6 February 2020
Ex-dividend date Friday 7 February 2020
Record date Monday 10 February 2020
DRP nomination Tuesday 11 February 2020
Payment date Thursday 27 February 2020
6BKI Investment Company Limited
Last trading date to be eligible for the BKI FY2020 interim dividend is Thursday 6 February 2020
For
per
sona
l use
onl
y

Performance For the half year ended 31 December 2019
BKI is managed by Contact Asset ManagementAFSL 494045
For
per
sona
l use
onl
y

21.4%
8.7% 8.3%10.1% 10.2%
26.2%
12.2%10.8%
9.6% 9.7%
0%
4%
8%
12%
16%
20%
24%
28%
1 Year 3 Yrs pa 5 Yrs pa 10 Yrs pa 15 Yrs pa
BKI Total Shareholder Returns including Franking Credits S&P/ASX 300 ACC INDEX
8BKI Investment Company Limited
Source: BKI, Contact Asset Management, Bloomberg. Total Shareholder Returns as at 31 December 2019. Including Franking Credits. The S&P/ASX300 Accumulation Index has been franked at 80%.
BKI’s One Year Total Shareholder Return, including franking credits was 21.4%.
BKI’s Net Portfolio Return (after all operating expenses, provision and payment of both income and capital gains tax and thereinvestment of dividends) for the year to 31 December 2019 was 17.3%.
Total Shareholder ReturnsAs at 31 December 2019
For
per
sona
l use
onl
y
1.7%1.2%
0.7%0.5%
0.2%
-0.1%
-0.7%-1.0%
-2.2%-2.4%
-3.6%-4.0%
-3.0%
-2.0%
-1.0%
0.0%
1.0%
2.0%
Fin
anci
als
Uti
litie
s
Ind
ust
rial
s
Co
nsu
mer
Dis
cret
ion
ary
Co
nsu
mer
Stap
les
Co
mm
un
icat
ion
Serv
ices
Info
rmat
ion
Tech
no
logy
Rea
l Est
ate
Hea
lth
Car
e
Ener
gy
Mat
eria
ls
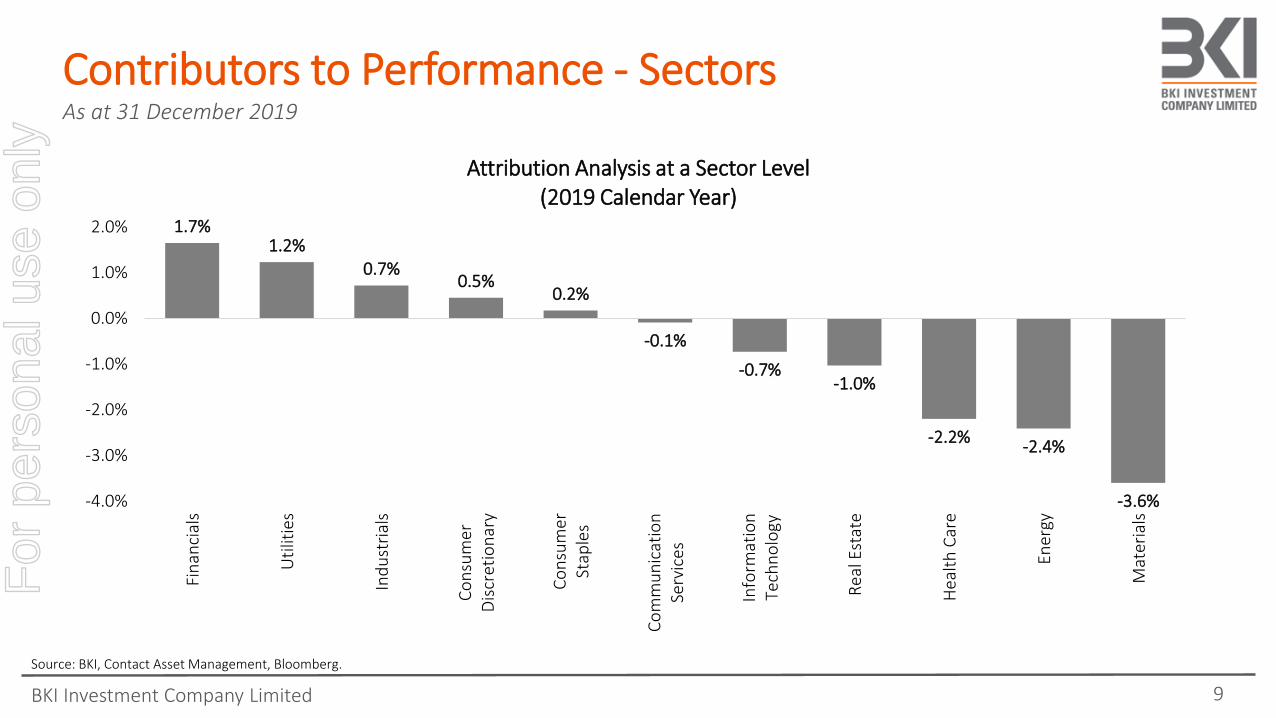
Attribution Analysis at a Sector Level (2019 Calendar Year)
9BKI Investment Company Limited
Source: BKI, Contact Asset Management, Bloomberg.
Contributors to Performance - SectorsAs at 31 December 2019
For
per
sona
l use
onl
y

Top 10 Positive Contributors to Portfolio Performance
Not held in BKI portfolio
BKI holdings
10BKI Investment Company Limited
Top 10 Detractors from Relative Portfolio Performance
Source: BKI, Contact Asset Management, Bloomberg.
Overweight Underweight
Contributors to Performance - StocksAs at 31 December 2019
For
per
sona
l use
onl
y

Positioning BKI for the FutureActively managed portfolio for an attractive fee
BKI is managed by Contact Asset ManagementAFSL 494045
For
per
sona
l use
onl
y

12BKI Investment Company Limited
Principal Activity
Income
Balance Sheet
Management
Valuation
Principal ActivitySustainable business model, competitive advantage, barriers to entry and industry structure.
IncomeDividend yields, franking credits, dividend sustainability and pay out ratios.
Balance SheetDebt levels, gearing ratios, coverage ratios.
Management and BoardAlignment, experience, skill set, creating shareholder wealth.
Earnings and ValuationsEarnings profiles, PE multiples, EV/EBITDA multiples and DCF valuations.
Through a research driven, active management approach BKI invests for thelong term in profitable, well managed companies that offer a compelling yieldand growth opportunities.
We invest using the five fundamentals below as part of the stock selectionprocess:
Investment ProcessResearch driven, active management
For
per
sona
l use
onl
y

13BKI Investment Company Limited
BKI’s exposure to the banking sector has beenreducing over the last few years and is currently15% of the total BKI Portfolio.
Over the last decade the Banking sectorunderperformed modestly with a TSR of 7.4% pa.Dividends were 84% of the TSR for banks over thisperiod.
As we reduced our exposure to the banking sectorover the half we reinvested this capital intoinvestments that are expected to generate agrowing income stream over the long term.
Source: BKI, Contact Asset Management, Bloomberg.*Banking sector includes CBA, WBC, NAB, ANZ, BEN and BOQ.
33%
29%31% 30% 29%
26%
23%
20%
15%
0%
5%
10%
15%
20%
25%
30%
35%
Banks as a % of the BKI Portfolio*
Reducing Exposure to BanksShifting into quality companies with earnings and dividend growth
For
per
sona
l use
onl
y

Investment Increases
14BKI Investment Company Limited
Investments Sold
Source: BKI, Contact Asset Management.
Portfolio Positioning For the half year ended 31 December 2019
Investments Reduced
For
per
sona
l use
onl
y

Company Active Weight
APA Group 4.2%
Macquarie Group 4.0%
Transurban Group 2.9%
Sydney Airport 2.6%
New Hope Corporation 2.4%
TPG Telecom 2.3%
Ramsay Health Care 2.3%
AGL Energy 1.9%
Woolworths Limited 1.8%
ASX Limited 1.8%
Overweight Positions Underweight Positions
15BKI Investment Company Limited
Company Active Weight
CSL Limited (6.2%)
ANZ Banking Group (1.9%)
Rio Tinto (1.7%)
Westpac Banking Group (1.7%)
Fortescue Metals (1.5%)
Newcrest Mining (1.2%)
Aristocrat Leisure (1.1%)
Scentre Group (1.0%)
Santos Limited (0.8%)
QBE Insurance (0.8%)
Major Overweight/Underweight by StockAs at 31 December 2019
Source: Contact Asset Management, Bloomberg.
For
per
sona
l use
onl
y

14 Westpac Bank 2.6%
15 ASX Limited 2.6%
16 New Hope Corporation 2.5%
17 AGL Energy Limited 2.5%
18 Sonic Healthcare 2.3%
19 IAG Limited 2.2%
20 Magellan Financial Group 1.8%
21 Invocare Limited 1.8%
22 ANZ Banking Group 1.6%
23 ARB Corporation 1.5%
24 Coles Group 1.4%
25 Harvey Norman Holdings 1.3%
Cash & Cash Equivalents 7.0%
Total 86.0%
1 Commonwealth Bank 6.7%
2 Macquarie Group 6.4%
3 Transurban Group 4.9%
4 APA Group 4.8%
5 BHP Limited 4.7%
6 National Australia Bank 4.3%
7 Woolworths Limited 4.2%
8 Wesfarmers Limited 3.8%
9 Sydney Airport 3.6%
10 Woodside Petroleum 3.1%
11 Ramsay HealthCare 3.1%
12 Telstra Corporation 2.7%
13 TPG Telecom 2.6%
Stock % of Total Portfolio Stock % of Total Portfolio
16BKI Investment Company Limited
Top 25 InvestmentsAs at 31 December 2019
Source: BKI, Contact Asset Management.
For
per
sona
l use
onl
y
Insights from the Investment ManagerMarkets, themes and looking ahead
BKI is managed by Contact Asset ManagementAFSL 494045
For
per
sona
l use
onl
y

ROIC – Cost of Capital
Earnings Growth
4% 6% 8% 10%
8% 27.2 32.3 36.2 40.0
6% 15.9 17.5 18.9 20.1
4% 12.8 13.5 14.0 15.5
2% 11.4 11.6 11.8 12.0
Falling rates gave +1.4 points to the Australian Equity P/E multiple in FY2019We believe that lower rates have given another +1.2 points to the Australian Equity P/E multiple in FY2020
18BKI Investment Company Limited
Falling Rates Falling RatesFalling Rates
Valuations Have ChangedLower rates driving P/E expansion
Source: Contact Asset Management, Factset.
FY2019FY2018FY2017 FY2020
For
per
sona
l use
onl
y

Source: Contact Asset Management, Factset.
19BKI Investment Company Limited
18.9x
Australian Historical Market Valuations10 year average price to earnings multiple is 15.3x
Average 15.3x
The forecast S&P/ASX300 PE multiple has increased to 18.9x in FY2020.
For
per
sona
l use
onl
y

20
Declining EPS Forecasts – Industrials
Cautious of Forward EPS Forecasts Very rarely does the market get it right!
20Source: Contact Asset Management, Macquarie Research, Bloomberg, Factset
Declining EPS Forecasts – Banks
20BKI Investment Company Limited
For
per
sona
l use
onl
y

21BKI Investment Company Limited
Diversification across geography and activity
Over the last decade Macquarie has undergone the largest andmost successful international expansion by any Australian-domiciled bank significantly transforming the business.
As the world’s largest infrastructure asset manager Macquarieprovides exposure to the increasing demand for infrastructureinvestment with US$45 trillion required globally by 2030.
Global ExposureProviding shareholders with global exposure without the large management fees
66%
34%
International Domestic
Income
Source: Macquarie Group
For
per
sona
l use
onl
y

22BKI Investment Company Limited
Major global private hospital operator across 11 countries
Ramsay Healthcare operates in regions expected see a strongincrease health care spending as a percentage of GDP andhigh growth in the 65+ population.
These tailwinds combined with a management team with aproven track record of investing for future growth will allowthe Company to continue to grow earnings and dividends.
Global ExposureProviding shareholders with global exposure without the large management fees
55%
45%
International Domestic
Income
Source: Ramsay Healthcare
For
per
sona
l use
onl
y

23BKI Investment Company Limited
US market fundamentals to drive future growth
The acquisition of Morsco has provided Reece entry into thefragmented US$32 billion plumbing market with solidconsolidation opportunities. Ageing residential stock andpopulation growth in the Sunbelt region above the nationalaverage will drive demand growth.
These tailwinds combined with a management team that iscustomer focused, experienced and aligned provide us withthe confidence that they can continue to deliver solid returnsfor shareholders over the medium to long term.
Income 48%52%
International Domestic
Source: Reece Group
US Growth OpportunitiesF
or p
erso
nal u
se o
nly

24BKI Investment Company Limited
Attractive market with consolidation opportunities
Since entering the US market in November 2018 through theacquisition of Glen-Gery, Brickworks’ have acquired Sioux CityBricks and Redland Brick establishing a business of significantscale in North America. While the US brick industry isconsolidating it remains over 20 years behind Australia with 37manufacturers compared to five in Australia.
Favourable market conditions including tax cuts, housingrecovery, low interest rates and low labour and energy costswill drive future growth.
17%
83%
International Domestic
Income
US Growth Opportunities
Source: Brickworks Limited
For
per
sona
l use
onl
y

25BKI Investment Company Limited
Teaming up with Ford
ARB’s export segment is a key growth area. In FY2019 the USwas ARB’s second highest growth region benefiting from a shiftin consumer preference to SUVs and 4x4. SUVs as a percentageof vehicle sales in the US are expected to grow from 15% in2013 to 50% in 2020.
ARB recently announced a partnership with Ford to co-developoff-road parts. This highlights the benefits of a culture focusedon continuous product development which has been and willcontinue to be crucial for maintaining the Company’s long termcompetitive advantage.
20%
80%
International Domestic
Income
US Growth Opportunities
Source: ARB Corporation. By 2020, SUVs could make up 50% of US car sales, Quartz.
For
per
sona
l use
onl
y
26BKI Investment Company Limited
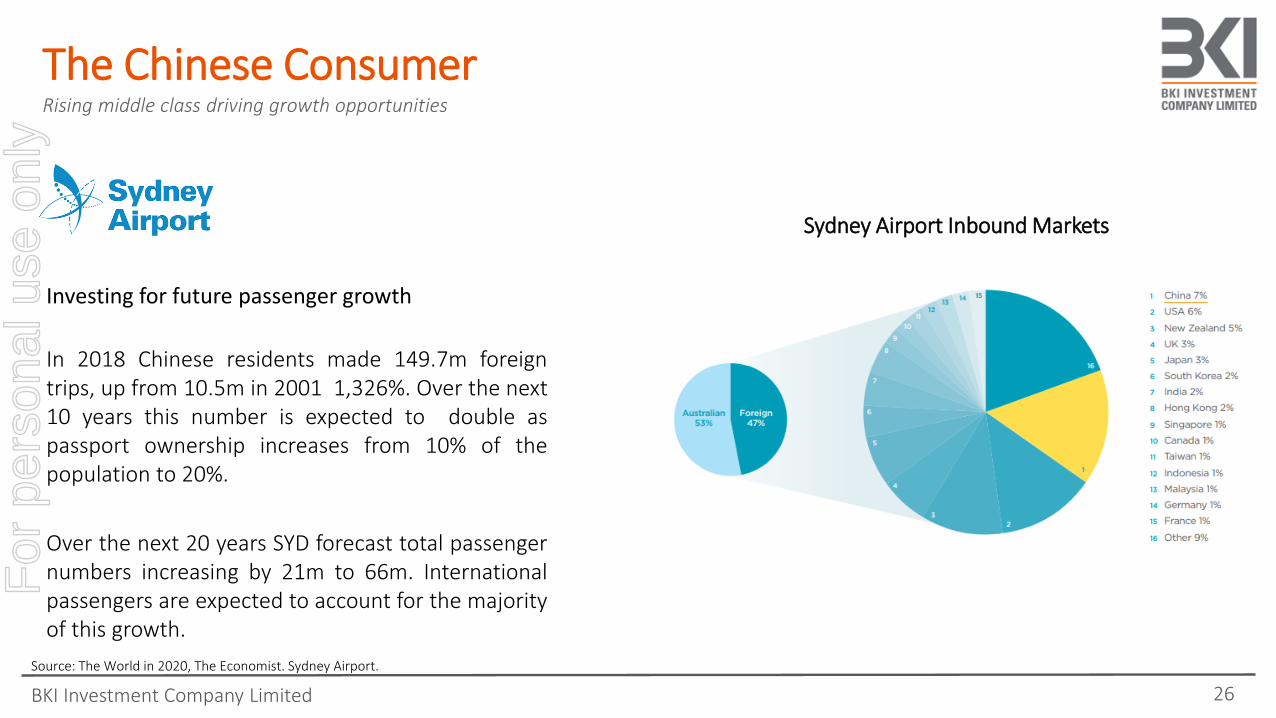
Investing for future passenger growth
In 2018 Chinese residents made 149.7m foreigntrips, up from 10.5m in 2001 1,326%. Over the next10 years this number is expected to double aspassport ownership increases from 10% of thepopulation to 20%.
Over the next 20 years SYD forecast total passengernumbers increasing by 21m to 66m. Internationalpassengers are expected to account for the majorityof this growth.
Source: The World in 2020, The Economist. Sydney Airport.
Sydney Airport Inbound Markets
The Chinese ConsumerRising middle class driving growth opportunities
For
per
sona
l use
onl
y

27BKI Investment Company Limited
Source: The World in 2020, The Economist. Treasury Wines Investor Presentation.
Attractive market for TWE’s strategy and brands
China is experiencing growth in wine consumptionand premiumisation as consumers shift towardsperceiving grape wine as a symbol of social status.
With only 3.4% market share of China’s importedwine these trends provide an opportunity for TWE’spremiumisation strategy to benefit and gain marketshare.
China e-commerce Wine Sales Growth
The Chinese ConsumerRising middle class driving growth opportunities
For
per
sona
l use
onl
y

BKI OverviewBenefits of investing in BKI
BKI is managed by Contact Asset ManagementAFSL 494045
For
per
sona
l use
onl
y
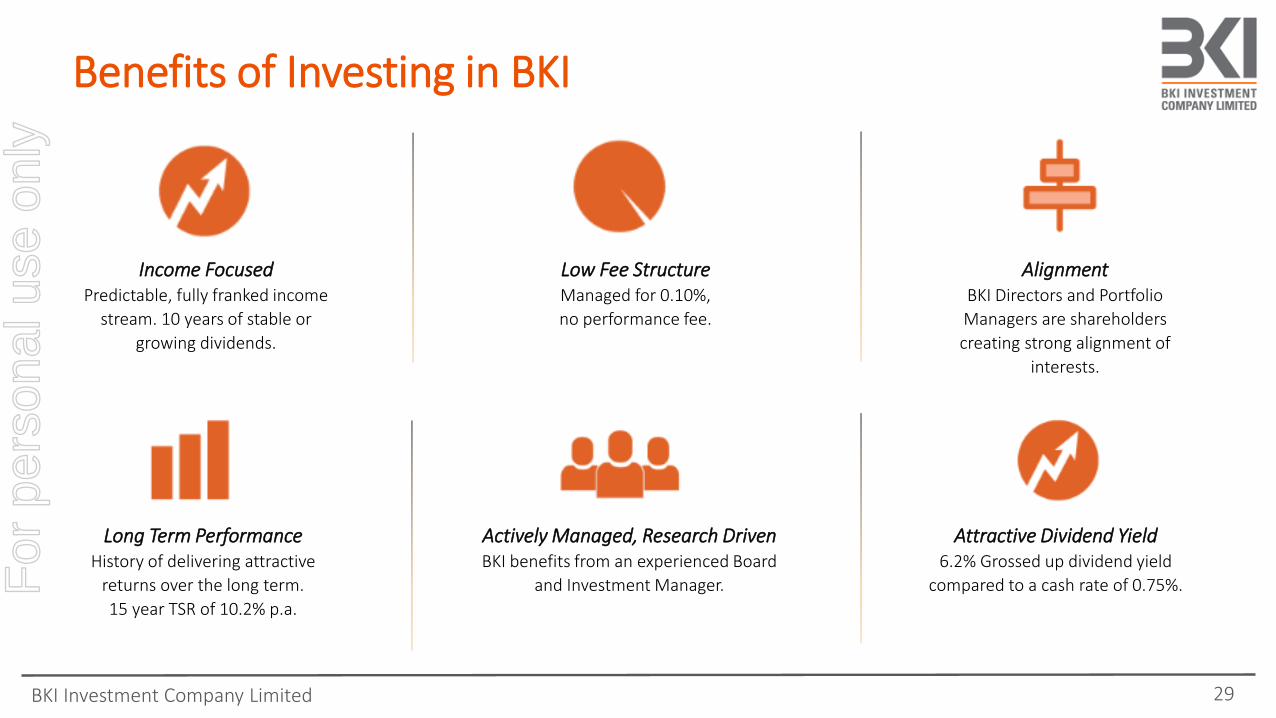
Benefits of Investing in BKI
29BKI Investment Company Limited
Low Fee StructureManaged for 0.10%,
no performance fee.
Income Focused Predictable, fully franked income
stream. 10 years of stable or
growing dividends.
Alignment BKI Directors and Portfolio
Managers are shareholders
creating strong alignment of
interests.
Long Term PerformanceHistory of delivering attractive
returns over the long term.
15 year TSR of 10.2% p.a.
Actively Managed, Research DrivenBKI benefits from an experienced Board
and Investment Manager.
Attractive Dividend Yield6.2% Grossed up dividend yield
compared to a cash rate of 0.75%.For
per
sona
l use
onl
y

30
NotesF
or p
erso
nal u
se o
nly

31
NotesF
or p
erso
nal u
se o
nly


