227
HIDDEN DISADVANTAGE? A Study on the Low Participation in Higher Education by the Non-Manual Group Selina McCoy, Delma Byrne Philip J. O’Connell, Elish Kelly & Cliona Doherty
| Date post: | 07-Apr-2018 |
| Category: |
Documents |
| Upload: | david-long |
| View: | 217 times |
| Download: | 0 times |

8/4/2019 BKMNEXT146
http://slidepdf.com/reader/full/bkmnext146 1/227
HIDDEN DISADVANTAGE?A Study on the Low Participation inHigher Education by the Non-Manual Group
Selina McCoy, Delma Byrne
Philip J. O’Connell, Elish Kelly & Cliona Doherty

8/4/2019 BKMNEXT146
http://slidepdf.com/reader/full/bkmnext146 2/227

8/4/2019 BKMNEXT146
http://slidepdf.com/reader/full/bkmnext146 3/227
i
Selina McCoy, Delma Byrne,
Philip J. O’Connell, Elish Kelly & Cliona Doherty
HIDDEN DISADVANTAGE?
A Study on the Low Participation inHigher Education by the Non-Manual Group

8/4/2019 BKMNEXT146
http://slidepdf.com/reader/full/bkmnext146 4/227
ii
TABLE OF CONTENTS
CONTENTS
Contents iiList o Tables i
List o Figures i
List o Abbreiations iii
Foreword ix
Executie Summary xi
CHAPTER 1: INTRODUCTION 1
1.1 Introduction: Trends in Higher Education Participation 2
1.2 Oeriew o the Research 3
1.3 Policy Focus 4
1.4 International Research on Inequality in Educational Participation 5
1.5 Theoretical Perspecties on Inequality in Higher Education 7
1.6 Research Questions 11
CHAPTER 2: METHODOLOGY 13
2.1 Introduction 14
2.2 Data Sources: Quantitatie Data Sources 14
2.3 Qualitatie Research: Lie Course Interiews 17
2.4 Format o the Report 22
CHAPTER 3: SETTING THE CONTEXT: THE CHARACTERISTICS OF THE NON-MANUAL GROUP 25
3.1 Introduction 26
3.2 Classication o the Non-Manual Socio-Economic Group 26
3.3 Size and Composition o the Non-Manual Group 27
3.4 Income Leels and Grant Eligibility Associated with the Non-Manual Socio-Economic Group 29
3.5 Educational Prole o Non-Manual Group 33
3.6 Educational Experiences o the Non-Manual Group 35
3.7 Summary 41
CHAPTER 4: EQUAL CHANCES OF ENTRY INTO HIGHER EDUCATION?
PATTERNS OF ATTAINMENT AT SECOND-LEvEL AMONG SOCIO-ECONOMIC GROUPS 43
4.1 Introduction 44
4.2 Multiariate Analyses 44
4.3 Second-Leel Retention and Progression 45
4.4 Leaing Certicate Programme Type 50
4.5 Examination Perormance 52
4.6 Summary 56

8/4/2019 BKMNEXT146
http://slidepdf.com/reader/full/bkmnext146 5/227
iii
TABLE OF CONTENTS
CHAPTER 5: SECOND-LEvEL EXPERIENCES OF DIFFERENT GROUPS OF SCHOOL LEAvERS 57
5.1 Introduction 58
5.2 Higher Education Entrants 58
5.3 Entrants to Other Forms o Education and Training 645.4 Labour Market Entrants 71
5.5 Summary 84
CHAPTER 6:
THE HIGHER EDUCATION DECISION: HIGHER EDUCATION ENTRANTS AND NON-ENTRANTS 87
6.1 Introduction 88
6.2 Higher Education Application Patterns 88
6.3 Higher Education Oer and Acceptances 91
6.4 Participation in Higher Education 936.5 Young Peoples’ Experiences o the Transition rom School to Higher Education 107
6.6 Summary 115
CHAPTER 7: ENTRANTS TO FORMS OF EDUCATION OTHER THAN HIGHER EDUCATION 119
7.1 Introduction 120
7.2 Participation in Post-Leaing Certicate Courses 120
7.3 Participation in Apprenticeships 123
7.4 Participation in State Sponsored Training 126
7.5 Young Peoples’ Experiences o the Transition rom School to other orms o Education 128
7.6 Summary 137
CHAPTER 8: LABOUR MARKET EXPERIENCES BY SOCIO-ECONOMIC BACKGROUND 139
8.1 Introduction 140
8.2 Labour Market Participation, Employment and Unemployment Rates 140
8.3 The Labour Market Entrants 146
8.4 Summary 158
CHAPTER 9: MAIN FINDINGS AND DISCUSSION 161
9.1 Introduction 162
9.2 Discussion 162
9.3 Implications or Policy 168
8/4/2019 BKMNEXT146
http://slidepdf.com/reader/full/bkmnext146 6/227
i
TABLE OF CONTENTS
REFERENCES 173
APPENDICES 181
Appendix A: Census 1986 Intermediate Non-Manual and Other Non-Manual Socio-Economic Groups 182Appendix B: Comparing 1986 and 1996 Census Classication o Occupations 184
Appendix C: Descriptie Tables 186
Appendix D: Models rom Multiariate Analyses 199
LIST OF TABLESTable 1.1: Estimated Participation Rates in Higher Education by Fathers’ Socio-Economic Group
(New Classication), 1998 and 2004 3
Table 2.1: Prole o Participants 20
Table 3.1: Summary Measures o the Non-Manual Groups Used in Data Sources 27
Table 3.2: Total Population (Aged 15 years and oer) 1996, 2002 and 2006 Census Results 28
Table 3.3: Total Population (Aged 15 years and oer) 1986, 1996, 2002 and 2006 Census Results 29
Table 3.4: Estimates o the Composition o the Non-Manual Group 1997-2007 29
Table 3.5: Gross Annual Household Income in 2006 o Indiiduals aged 16-20 by European
Socio-economic Classication 31
Table 3.6: Distribution o Gross Household Income (2006) by Grant Eligibility and Median Income by EuropeanSocio-economic Classication 32
Table 4.1: Odds Ratios or Second-Leel Attainment 48
Table 4.2: Distribution o Programme Pursued by Those who Completed Second-Leel Education by
Parental Socio-Economic Background 51
Table 4.3: Distribution o Examination Perormance Oer Time by Gender 53
Table 4.4: Odds Ratios or Attaining At Least 2 Honours in the Leaing Certicate 55
Table 5.1: Demographic Details o the Higher Education Group 58
Table 5.2: Demographic Details o the Other ET Group 64
Table 5.3: Demographic Details o the Labour Market Group 72
Table 6.1: Main Reason or not accepting a Higher Education place by gender 92
Table 6.2: Odds Ratios or Participation in Higher Education 97
Table 6.3: Odds Ratios or Participation at a Uniersity Other Institution (All Higher Education Entrants) 100
Table 6.4: Percentage o School Leaers in Full-Time Higher Education Pursuing an Honours Degree on
Completion o their Course, 2006/07 101
Table 6.5: Odds Ratio or Pursuing an Honours Degree Leel Course 102
Table 6.6: Percentage o Full-Time HE Entrants Receiing a Grant 104
Table 6.7: Odds Ratio or Receiing a Grant 105
Table 6.8: Percentage o HE Students who Dropped Out 106
8/4/2019 BKMNEXT146
http://slidepdf.com/reader/full/bkmnext146 7/227
LIST OF TABLES
Table 6.9: Demographic Details o the Higher Education Group 107
Table 7.1: Odds Ratio or Participation in PLC 122
Table 7.2: Percentage o 2006/07 School Leaers who Completed Senior Cycle who Entered Apprenticeships 123
Table 7.3: Odds Ratios or Participation in Apprenticeships 125Table 7.4: Percentage o 2006/07 School Leaers who Entered State Sponsored Training 126
Table 7.5: Odds Ratio or Participation in State Sponsored Training 127
Table 7.6: Prole o Other ET Participants 129
Table 8.1: Occupational Distribution o all School Leaers in Full-Time Employment by Parental Socio-Economic
Background, 1997/98, 2002/04, 2006/07 Cohorts 143
Table 8.2: Industrial Sector Distribution o all School Leaers in Full-Time Employment by Parental
Socio-Economic Background, 1997/98, 2002/04, 2006/07 Cohorts 145
Table 8.3: Demographic Details o the Labour Market Group 146

8/4/2019 BKMNEXT146
http://slidepdf.com/reader/full/bkmnext146 8/227
i
LIST OF FIGURES
LIST OF FIGURESFigure 3.1: Parental Socio-Economic Group and Parental Education, School Leaers’ Sureys 2006/07 33
Figure 3.2: Parental Socio-Economic Group and Type o School Attended, School Leaers’ Sureys 2006/07 34Figure 3.3: Proportion o School Leaers who Attended a ‘DEIS’ School, School Leaers’ Surey 2006/07 34
Figure 3.4: Age Prole o Higher Education Entrants 2004 by Parental Socio-Economic Group 36
Figure 3.5: Year o Sitting Leaing Cert o Higher Education Entrants by Parental Socio-Economic Group 36
Figure 3.6: Proportion o New Entrants who Attended a ‘DEIS’ School 37
Figure 3.7: Proportion who Attended a ‘DEIS’ School by Parental Socio-Economic Group 38
Figure 3.8: Institution Attended by Parental Socio-Economic Group 39
Figure 3.9: Course Leel by Parental Socio-Economic Group 39
Figure 3.10: Percentage in Receipt o a Grant by Parental Socio-Economic Group 40
Figure 3.11: Percentage in Receipt o a Grant by Whether Attended School Categorised as ‘DEIS’ 40Figure 4.1: Percentage o School Leaers who Completed the Leaing Certicate (or equialent) 45
Figure 4.2: Percentage o School Leaers who Completed the Leaing Certicate by Parental
Socio-Economic Group 46
Figure 4.3: Percentage o School Leaers who Completed the Leaing Certicate by Region 47
Figure 4.4: Odds Ratios or Completion o Second-Leel Education 48
Figure 4.5: Odds Ratio or Making the Transition rom Junior Cycle to Senior Cycle 49
Figure 4.6: Type o Leaing Certicate Programme Taken by School Leaers 50
Figure 4.7: Odds Ratios or Programme Completed at Senior Cycle 52
Figure 4.8: Percentage o School Leaers Who Achieed 2+ Honours in LC by Parental Socio-Economic Group 54
Figure 4.9: Odds Ratio o Attaining at Least 2 Honours in the Leaing Certicate 55
Figure 6.1: Proportion o School Leaers Who Completed LCE and LCvP Who Applied to Enter Higher
Education by Parental Socio-Economic Group 88
Figure 6.2: Reason(s) or Not Applying to Higher Education by Gender 89
Figure 6.3: Reason(s) or Not Appling or Higher Education by Parental Socio-Economic Group 90
Figure 6.4: Proportion o students who accepted a place on a HE course 91
Figure 6.5: Main Reason or Not Accepting Place in HE by Parental Socio-Economic Group 92
Figure 6.6: Participation in Full-Time Higher Education Among School Leaers who Completed Senior Cycle
by Gender 93
Figure 6.7: Participation in Full-Time Higher Education among Senior Cycle Leaers by Parental
Socio-Economic Group 94
Figure 6.8: Higher Education Participation Leels by Parental Socio-Economic Background and
School Type Attended 95
Figure 6.9: HE Participation Rates in DEIS and non-DEIS schools by Parental Socio-Economic Group 96
Figure 6.10: Odds Ratio o Participation in Higher Education 98
Figure 6.10a: Odds Ratio o Participation in Higher Education, Eligible 98
Figure 6.11: Enrolment in Uniersity Courses Among Higher Education Entrants by Parental
Socio-Economic Background 99
8/4/2019 BKMNEXT146
http://slidepdf.com/reader/full/bkmnext146 9/227
ii
LIST OF FIGURES
Figure 6.12: Odds Ratio or Attending a Uniersity Other Higher Education Institution 100
Figure 6.13: Percentage o School Leaers in Full-Time Higher Education who will Receie an Honours Degree
on Completion o their Course by Parental Socio-Economic Background 102
Figure 6.14: Odds Ratios or Pursuing an Honours Degree Leel Course 103Figure 6.15: Percentage o Full-Time Higher Education Participants Receiing a Grant by Parental
Socio-Economic Background 104
Figure 6.16: Odds Ratio or Receiing a Grant 105
Figure 6.17: Percentage o School Leaers who eer Participated in Higher Education and who let within
the First Two Years by Parental Socio-Economic Background 106
Figure 7.1: Participation in Post-Leaing Certicate Programme among those who Completed Senior Cycle 120
Figure 7.2: Participation in Post-Leaing Certicate Programmes by Parental Socio-Economic Background 121
Figure 7.3: Regional Participation in Post-Leaing Certicate Programmes among those who Completed
Senior Cycle 121Figure 7.4: Odds Ratio or Participation in PLC Course 123
Figure 7.5: Socio-Economic variation in Participation Rates in Apprenticeships among those who Completed
Senior Cycle (Males Only) 124
Figure 7.6: Odds Ratio or Participation in Apprenticeships (Males Only) 125
Figure 7.7: Socio-Economic variation in Participation Rates in State Sponsored Training among those who
Completed Senior Cycle 126
Figure 7.8: Odds Ratio or Participation in State Sponsored Training 128
Figure 8.1: Percentage o School Leaers who Completed Second-Leel Education who are in the Labour
Market, One Year ater Leaing School by gender. 140
Figure 8.2: Percentage o School Leaers who Completed Second-Leel and who Entered the Labour Market,
One Year ater Leaing School by Parental Socio-Economic Group 141
Figure 8.3: Percentage o School Leaers in the Labour Market who are Unemployed 142
Figure 8.4: Percentage o School Leaers who Completed Second-Leel and are in the
Labour Market, Unemployed. 142

8/4/2019 BKMNEXT146
http://slidepdf.com/reader/full/bkmnext146 10/227
iii
LIST OF ABBREvIATIONS
LIST OF ABBREvIATIONSHigher Education HE
Higher Education Authority HEARational Action Perspecties RAT
Surey o Income and Liing Conditions SILC
Central Statistics Oce CSO
Higher Education Institution HEI
Economic and Social Research Institute ESRI
Central Admissions Oce CAO
Labour Market LM
Other Education and Training Other ET
Leaing Certicate LCLeaing Certicate Applied LCA
Leaing Certicate vocational LCvP
Post-Leaing Certicate Course PLC
Deliering Equality o Opportunity in Schools DEIS
European Socio-economic Classication ESeC
Intermediate Non-Manual INM
Other Non-Manual ONM
Institute o Technology IOT
United Kingdom UK
Training and Employment Authority: Foras Áiseanna Saothair FÁS
Organisation or Economic Co-Operation and Deelopment OECD
Further Education FE

8/4/2019 BKMNEXT146
http://slidepdf.com/reader/full/bkmnext146 11/227
FOREWORD
ix
Foreword by Michael KellyChair of the HEA
The HEA welcomes the publication o this report Hidden Disadvantage? A Study of the Low Participation in
Higher Education by the Non-Manual Group. The study has been conducted by the Economic and Social Research
Institute (ESRI) on behal o the Higher Education Authority (HEA). It is a valuable addition to the existing body o
research on access to higher education in Ireland.
The report was prompted by research ndings contained in Who Went to College 2004? A National Survey of
Entrants to Higher Education (2006). That study reviewed the patterns o entry to higher education and revealed
that, although participation had increased steadily since the 1960s, the general improvement it reected masked
continuing social inequality in access and entry to higher education among particular socio-economic groups.
In the period between 1998 and 2004, the average entry rate to higher education in Ireland increased substantially
rom 44% to 55%. In this period o sustained improvements in opportunities to access higher education, the non-
manual group stood out as the only socio-economic group to buck the trend. Participation rates among this group
ell rom 29% in 1998 to between 25% and 27% in 2004. Given that 20% o households in the country are classied
in this socio-economic category, urther examination o the reasons behind this decline in participation was
deemed necessary alongside an analysis o the potential barriers to higher education or students rom the group
and o other actors impacting on their post-school choices.
This study combines quantitative analysis o trends with valuable qualitative research exploring the attitudes,
experiences, aspirations and expectations o young people rom the non-manual group. The ndings indicate
that their social and cultural context impacts signicantly on their objective chance o success in accessing and
attaining higher education. It emerged that their perceived low chance o success was exacerbated by the lack o
experience o higher education among their parents and peers. Higher education is viewed as entailing too much
nancial hardship and the perceived nancial barriers have implications or young people’s aspirations. Worryingly,
the evidence suggests that non-participants in higher education rom the non-manual group were disaected rom
an early age. Furthermore, those that did reach third level displayed lower levels o retention in tertiary education
suggesting barriers in integrating upon entry.
The report oers useul insight into the complexity o educational disadvantage and provides a compelling
argument or an accessible and exible higher education system than can cater or all groups. The ndings

8/4/2019 BKMNEXT146
http://slidepdf.com/reader/full/bkmnext146 12/227
FOREWORD
x
emphasise the need to challenge the negative perception o higher education among this group by providing
clear route maps to higher education, and better inormation and advice in relation to graduate employment and
the nancial returns o dierent education and career paths. The picture presented o integration into college
lie suggests a need or urther examination o young people’s experiences upon entry to higher education with
particular reerence to attainment and progression. Although the objectives set out in the document will be
challenging, particularly in the current economic climate, they are in line with the broader strategic aims regarding
up-skilling, lie-long learning, and the pursuit o equality in higher education.
On behal o the Authority, I would like to take this opportunity to thank all those involved in producing this report,
in particular the lead authors Selina McCoy and Delma Byrne and their colleagues Philip O’Connell, Eilish Kelly
and Cliona Doherty rom the ESRI. I also wish to acknowledge the input o the Policy & Planning unit o the HEA
and o the National Ofce o Equity o Access to Higher Education. The report provides an inormed and insightul
basis or urther policy planning in regard to access and equality o opportunity in higher education.
Michael Kelly
Chair o the Higher Education Authority

8/4/2019 BKMNEXT146
http://slidepdf.com/reader/full/bkmnext146 13/227
xi
Executie Summary
Participation in Higher Education (HE) has risen steadily in Ireland since the 1960s, with particularly dramaticincreases apparent in more recent years. While there is eidence o some narrowing o relatie inequalities, clear
socio-economic disparities persist. Trends in the patterns o participation among the non-manual socio-economic
group are particularly distinct, with this group unique in showing a decline in HE entry rates oer time. This study
sets out to explain the processes underlying such low participation leels. It combines the strengths o quantitatie
and qualitatie research methods to allow a much uller understanding o the processes underlying HE entry and
non-entry among this group.
Oerall nearly one-in-e o the adult population are located within the non-manual group. Howeer, the group
is composed o two distinct sub-groups: the intermediate non-manual and other non-manual groups. The ormercomprised o a number o relatiely high status positions such as Garda sergeants and goernment executie
ocials, while the latter group is dominated by lower leel serice workers. In urther examining the prole o
these groups it becomes apparent that, across a range o educational and economic characteristics, occupants o
the other non-manual group share many similarities with lower manual groups, while the intermediate non-manual
group do not.
At second-leel the other non-manual group display patterns largely on a par with those rom (lower) manual
groups – in terms o retention leels, senior cycle programme and examination perormance. This has important
implications or the pool o young people eligible or HE entry. The intermediate non-manual group, in contrast,
are considerably better at second-leel, which leaes this group better placed in terms o accessing HE.
The results clearly show that patterns o participation o the intermediate non-manual group most closely
resemble the employer/manager group, while the pattern or the other non-manual group most closely resemble
the semi-skilled and unskilled manual groups. From the outset, young people rom intermediate non-manual back-
grounds hae higher rates o application than those rom other non-manual backgrounds: across all
socio-economic groups, young people rom the other non-manual background hae the lowest application rates.
Further, among those who succeed in gaining access, similar distinctions emerge between the two non-manual
groups in terms o the type o HE institute attended, the leel o course pursued, receipt o nancial aid (in the
orm o a grant) and drop-out.
Some o the main issues emerging rom the study are:
The results point to the crucial importance o the alue placed on (higher) education or dierent social•
groups. It is clear across social groups, and een between intermediate and other non-manual groups, that
amilies hae dierential access to arious orms o cultural, social and economic capital and resources, which
dierentially rame the educational choices that dierent amilies can or will make.
Dierences in the second-leel experiences o young people rom dierent socio-economic groups were•
noteworthy, leading to large ariations in the proportions reaching eligibility or entry into HE. There was clear
EXECUTIvE SUMMARY

8/4/2019 BKMNEXT146
http://slidepdf.com/reader/full/bkmnext146 14/227
xii
eidence that a number o the non-participants in HE rom the other non-manual group were alienated and
disaected rom school at an early age. These young people rom lower non-manual backgrounds saw HE as
an extension o school, and or this reason it was iewed as something to be aoided.
Many o those rom the other non-manual group who did not progress to HE had negatie constructions o•
the adice receied at school. Guidance was ariously absent, only ocused on certain groups o students
(such as the ‘honours’ class), narrowly ocused, or directed away rom HE. Some elt they would hae liked
more help in actually ealuating the range o post-school options, rather than just supplying inormation.
Furthermore, parents did not hae experience o HE, while siblings and peers were also not necessarily
amiliar with the HE process and choices therein. Hence, they were ar more reliant on the supports and
encouragement aailable rom their school and these supports played a much more signicant role in the
choices made by these young people.
Financial issues emerge in arious orms impacting on the decisions o young people rom the other•
non-manual group to pursue HE. For some, the nancial commitment to study was seen as too great or would
entail too much hardship. Many elt that they would not be eligible or nancial support, or een where they
were eligible they elt it would not hae been sucient. It is also clear that nancial supports and the cost o
HE were insuciently understood among some o these young people. Perceied nancial barriers were also
ound to hae implications or young people’s aspirations. Finally, among young people achieing eligibility
or HE, we see nancial actors playing an important role in the signicant all-o in the pursuit o HE among
young people rom lower non-manual backgrounds.
It was also clear, particularly or males rom lower non-manual backgrounds, that the pull o the labour market•
was an important process underlying their non-participation in HE.
Young people rom lower non-manual backgrounds also displayed lower leels o retention in HE, suggesting•
that these groups ace greater barriers in terms o integrating into Higher Education.
8/4/2019 BKMNEXT146
http://slidepdf.com/reader/full/bkmnext146 15/227
1
CHAPTER 1 Introduction

8/4/2019 BKMNEXT146
http://slidepdf.com/reader/full/bkmnext146 16/227
2
1.1 Introduction: Trends in Higher EducationParticipationParticipation in higher education (HE) has risen steadily in Ireland since the 1960s, with particularly dramaticincreases apparent in more recent years. The most recently published data indicates that participation rates in HEhae now reached 55 per cent1 (O’Connell et al ., 2006a)2 . Furthermore, the progression rate o young people whocompleted the Leaing Certicate in 2005 to HE was 60 per cent (Byrne et al ., 2009). These growing participationrates reect two underlying trends: increasing progression o school leaers into HE, alongside the growing entryo ‘mature’ students into HE. Thereore, the aerage HE student is now older, with the greater entry o maturestudents and the emergence o more dierse and exible entry routes to HE (ibid.).
For the most part, such patterns mask continued social inequality in access and entry to HE. There is eidence osome narrowing o relatie inequalities as those rom less adantaged backgrounds hae increased their leels o
participation. Howeer, clear socio-economic disparities exist and persist, with oer-representation o the childreno proessional and arming groups among entrants to the point that such groups hae now reached ‘saturation’.Dierences between social groups are also eident in entry to uniersities as opposed to institutes o technology,the type o course taken and the duration o courses.
Within this context, trends in the pattern o participation among the non-manual socio-economic group aredistinct, with this specic group showing a decline in HE entry rates oer time, a trend which makes them unique- they are the only socio-economic group to show a decline. This was a key nding rom the ‘Who Went to Collegein 2004?’ (ibid.) report. While the oerall admission rate (to ull-time study) had increased rom 44 per cent to 55per cent between 1998 and 2004, representing improed participation rates or all socio-economic groups, therewas one exception: the non-manual socio-economic group. As shown in Table 1.1 below, the children o those in thenon-manual socio-economic group saw a decline in their estimated participation rate – rom 29 per cent in 1998 to
between 25 and 27 per cent in 2004, a decline which is part o a longer-term trend in the relatie positiono this group.
1 Participation rates are based on a comparison o the distribution o college entrants with the distribution o the national population o collegeentry age in the preious census. In the case o this study this was based on the mean o the numbers in the population aged 15, 16 and 17 in 2002.
2 While new entrants to undergraduate HE are increasing in the uniersity sector, this is not the case or the institute o technology sector (IoTs,
HEA, 2009). New entrants to the uniersity sector increased by 4.8 per cent between 2006/2007 and 2007/2008; compared to a 7.2 per centincrease in the preious year. New entrants to the IoTs continued to decline in 2007/2008: in total there was a 9.7 per cent decrease in the newentrant intake between 2003/2004 and 2007/2008.
CHAPTER 1: INTRODUCTION

8/4/2019 BKMNEXT146
http://slidepdf.com/reader/full/bkmnext146 17/227
3
CHAPTER 1: INTRODUCTION
Table 1.1: Estimated Participation Rates in Higher Education by Father’s Socio-Economic Group
(New Classication), 1998 and 20043
1998 2004Census
Data
2004Adjusted
Census
Data
Employers & Managers 0.65 0.60 0.65
Higher Proessional 1.11 1.25 1.36
Lower Proessional 0.63 0.59 0.65
Non-Manual 0.29 0.25 0.27
Skilled Manual 0.32 0.60 0.50
Semi-and Unskilled 0.23 0.40 0.33
Own Account Workers 0.39 0.60 0.65
Farmers 0.65 0.82 0.89
Total 0.44 0.55 0.55
Source: Surey o New Entrants to Higher Education in 2004 and deried rom Clancy 2001. Published inO’Connell et al ., 2006a.
As a result, the ‘Who Went to College in 2004? ’ report identied the need or urther examination o the issue,in particular addressing the potential barriers to HE or those rom non-manual backgrounds and the processesimpacting on their post-school choices. This report now presents results rom this recommendation.
1.2 Oeriew o the ResearchIn addressing the relatie position o the non-manual group, this research has been conducted in two phases andencompasses the use o mixed methods. The rst phase used existing data sources to examine the experienceso the non-manual group relatie to other socio-economic groups in their second-leel, post-school and HEexperiences and attainments. This phase also considered the income leels o the non-manual group relatie toother socio-economic groups.
The second phase adopted a qualitatie research methodology to address the issue o the post-school choiceprocesses and decision making o school leaers. This approach was used to gie greater insight into the actorsinuencing young people’s post-school decisions than the surey data analysed in phase one, as young people
themseles could identiy and articulate the issues which were inuential in their choices and why some romnon-manual backgrounds take the decision not to pursue HE and why others take this path. This qualitatie samplewas achieed by selecting indiiduals rom the non-manual group who participated in the School Leaers’ Surey2006. In all, three groups o indiiduals rom the other non-manual group were identied: those who enteredthe labour market immediately ater completing second-leel; those who entered Post-Leaing Certicate (PLC)courses; and those who progressed to HE (including both indiiduals who entered directly rom second-leel andthose who entered ater completion o a PLC course). The research ocused, in particular, on the pathways youngpeople took within the schooling system, their attitudes to, and experiences o, second-leel education, their post-school aspirations and expectations, the actors inuencing their post-school choices and their experiences othese post-school pathways.
3 The adjusted gures are based on re-calculating participation rates to include the 17 per cent o cases in the Census 2002 where socio-economicgroup was unknown – see O’Connell et al ., 2006a (Chapter 3) or urther details
3

8/4/2019 BKMNEXT146
http://slidepdf.com/reader/full/bkmnext146 18/227
4
CHAPTER 1: INTRODUCTION
1.3 Policy FocusThe issue o equality in educational participation has been prominent on the national policy agenda in recent years
and is eident in key policy reports published by the Higher Education Authority (HEA). These key policy reportsinclude:
‘Learning or Lie: White Paper on Adult Education’ (DES, 2000).•
‘Access and Equity in Higher Education’ (Skilbeck and Connell, 2000).•
‘Report o the Action Group on Access to Third-Leel Education’ (2001).•
‘Report o the Taskorce on Lielong Learning’ (DETE, 2002).•
A major reiew o Higher Education in Ireland conducted by the OECD (2006).•
‘Action Plan on Achieing Equity o Access to Higher Education in Ireland 2005-2007’ (HEA, 2004).•
‘National Plan or Equity o Access to Higher Education 2008-2013’ (2008).•
The policy ramework adopted by the HEA has set out to‘encourage or require the Irish higher education institutions to adopt a more pro-actie approach than hitherto tothe implementation o equity policies in higher education’ (HEA 2000).
This policy ramework is also adopted through the initiation o legislation such as the Uniersities Act 1997, theQualications (Education and Training) Act 1999, and the Equal Status Bill (1999).In terms o HE, much o the ocus has been on increasing access and participation or under-represented groupsand a partnership approach has been adopted in approaching the equity issue at HE. In act, the most recentreport outlines that the challenges identied in addressing educational disadantage, equity and social exclusion,will require joined-up strategies across education leels and across goernment departments. This resonatesclearly with the results presented in this report .
The current National Access Plan aims to build on the achieements o recent years in relation to increasedparticipation and greater equality in HE access. It is timely then to assess the relatie position o the non-manualgroup, gien the current target o an oerall national participation rate o 72 per cent o the releant age cohortto be achieed by 2020 rom 55 per cent in 2004, and that all socio-economic groups will hae entry rates o atleast 54 per cent by 2020. These challenges and targets are particularly pertinent gien the current economicconditions we nd ourseles in. That is, this study is placed in a context where the achieement o urther growthin HE will require continuing progress in relation to widening access. Furthermore, the achieement o the nationalobjecties in relation to up-skilling the population will require urther success in extending HE opportunities togroups that hae traditionally been under-represented in HE.
1.3.1 Denition o Socio-Economic Disadvantage
The integration o equity with other objecties and roles o institutions o HE raises dicult and complex issues,such as the denition o disadantage (HEA, 2000). Groups targeted as being under-represented include studentswith a disability, lone parents, mature students, those rom socio-economically disadantaged backgrounds,members o the Traelling Community and reugees.
Young people rom ‘socio-economically disadantaged’ or ‘lower socio-economic backgrounds’ hae been oparticular ocus in preious policy. Groups targeted as being rom ‘socio-economically disadantaged backgrounds’typically include groups rom the unskilled-manual, unemployed and agricultural worker categories. One recentpolicy statement, or example, ‘Achieing Equity o Access to HE in Ireland 2005-2007’ (2004) sets a target or thepercentage o new entrants to HE who come rom the unskilled and agricultural worker groups.

8/4/2019 BKMNEXT146
http://slidepdf.com/reader/full/bkmnext146 19/227
5
CHAPTER 1: INTRODUCTION
Within this context it is important to note that those rom socio-economic groups outside o these traditionally‘disadantaged’ groups, including the non-manual group, hae receied relatiely little policy attention despitethe act that the eidence indicates that their leels o participation in HE do not exceed those or the groups
traditionally classied as ‘disadantaged’. That is, despite their poor relatie position in relation to entryto HE since the late 1990s, the non-manual group hae generally ailed to be regarded in policy terms as a‘disadantaged’ group.
Howeer, recent policy documents hae noted a shit in emphasis with the most recent publication (HEA, 2008)setting oerall targets or HE entry, but also targets or sub-groups (including the non-manual group) and aminimum threshold - a 54 per cent entry rate - which all groups must attain by 2020. In terms o the non-manualgroup, targets o 42 per cent entry in 2013 and 54 per cent in 2020, represent substantial projected increases onthe current entry rate o 27 per cent (ibid.) and are likely to pose the greatest challenge to policymakers and theHE sector in general.
1.4 International Research onSocio-Economic Inequality inEducational ParticipationWe now moe rom the polity sphere to the eidence-based sphere in relation to socio-economic inequalityin participation at HE. In doing so, we address the body o international research examining issues o access,dierentiation and stratication in HE and inequality at second leel.
1.4.1 Hidden Disadvantage?It should be stated rom the outset that, in many ways, it is dicult to assess the relatie international position othose classied as ‘non-manual’ in Irish classications, gien the enormous ariability across countries in the codingo occupations and the classications used. While there hae been attempts to deelop international occupationalclassications, much o the ocus tends to be on the dierential experiences o those ariously classied as‘disadantaged’, ‘working class’ or ‘blue collar’ relatie to those rom more ‘adantaged’, ‘proessional’, ‘sericeclass’ or ‘middle class’ backgrounds.
A reiew o the international literature uncoers a small number o exceptions when the lower socio-economicgroups hae been examined in detail. One study, in the UK context (Gallacher, 2006), drawing on the NS-SEC(National Statistics Socio-Economic Classication), examines the proportion o students rom the lowest our
socio-economic classes (small employers; lower superisory and technical occupations, semi-routine occupationsand routine occupations). While the bottom two classes correspond with ‘manual’ workers in many classications,some indiiduals in the other two categories (small employers and lower superisory and technical occupations)would all into ‘non-manual’ groups under the classication used in this report. The study ound that thepercentage o students rom these classes in HE was lower in Scotland than in the other countries o the UK.Howeer, the research did not examine the experiences o the our groups indiidually, but only as a collectiegroup, thus ailing to distinguish distinct patterns within these groups. Another study in the UK context examinesthe lowest groups (including low-skilled non-manual) in their choices close to the time o making an application orentry to HE (Connor, 2001). Howeer, as with other studies the author does not dierentiate the results or thenon-manual group relatie to manual groups, again ailing to distinguish distinct patterns within and between theselower class groups.

8/4/2019 BKMNEXT146
http://slidepdf.com/reader/full/bkmnext146 20/227
6
CHAPTER 1: INTRODUCTION
A major international publication, Shait, Arum and Gamoran (2007), examines how class inequalities in access toHE ary across systems with dierent leels o expansion, institutional dierentiation and unding mechanisms.
Collaborating with research teams in 15 countries (Ireland is not included), the study examines the extent oinequality in eligibility or HE, entry into HE and entry into rst tier HE. As with much o the research in this area,inequality is measured in terms o the dierences between those in proessional/managerial classes and the skilledworking class, thereby oering little insight into the relatie experiences o ‘intermediate’ groups, such as the non-manual category.
1.4.2 Inequality within Higher Education
Shait, Arum and Gamoran (2007) report that oerall, across the 15 countries, expansion in HE has the eecto making education increasingly inclusie, because it extends a alued good to a broader spectrum o thepopulation4 . While the international literature has largely been concerned with socio-economic inequality in entry
and access to HE, more recently the debate has moed away rom concern about equity o access towards issueso dierentiation within HE, a concern that was central to the Shait et al . (2007) study. As Osborne (2003) notes;
‘many more people in Europe benet rom increased and wider participation [in HE]. Howeer, the gainsmay not be as widespread as the champions o access would wish and equity in terms o entry to HE isdierentially spread across Europe within the panoply o institutions oering HE and within discipline areas’(p.18).
Similarly, Clancy and Goastellec (2007) note that new orms o dierentiation emerge een when access is‘massied’, with a:
‘stubborn persistence o social background determining both the extent o access and the types o higher
education to which access is being accorded’ (p.138).
As Osborne notes (2003):
‘while much attention has ocused on “getting in”; ‘“getting on” and “getting beyond” are another matter, andeen i some aspects o access are “soled”, attention now must be turned to questions o retention andprogression i the gains o access are to be consolidated’.
This study, while primarily concerned with access to and participation in HE among those rom non-manualbackgrounds, also considers the nature o their HE experiences, examining issues such as the type o collegeentered, the qualication leel being pursued and socio-economic disparity in drop out5 .
1.4.3 Inequality beore Entry to Higher Education
Alongside a concern with dierentiation at HE, there is growing recognition among researchers that the keyprocesses impacting on HE entry occur much earlier in the educational process. As Adnett (2006) notes:
4 It also nds that in all o the countries studied, men’s relatie adantage has declined; only in 3 countries do men still hold a small adantagerelatie to women in the odds o entering post-secondary education.5 Issues related to inequality within HE are undoubtedly seen as areas o priority or uture research. The analysis o the School Leaers’ Sureydata or 2006 and 2007 allows some consideration o the issue o retention oer the rst two years in HE and the extent to which students romnon-manual backgrounds dier rom other social groups in their retention patterns. This analysis also allows us to consider whether young peoplerom traditionally under-represented groups who succeed in entering HE, ace diculties in maintaining their studies and completingtheir courses.

8/4/2019 BKMNEXT146
http://slidepdf.com/reader/full/bkmnext146 21/227
7
CHAPTER 1: INTRODUCTION
‘increasing higher education participation among non-traditional student groups primarily requiresinterentions into pre-primary, primary and secondary schooling targeted at raising aspirations andattainments in groups with a low probability o attaining higher education entry requirements’.
This has been supported across institutional contexts. In the UK, Rae et al ., (2006) nd that social classdierences in entry to HE can largely be attributed to class dierences in achieing the qualications or entry toHE (p.1). This has also been recognised in the Irish context, with O’Connell et al . (2006b), arguing that inequalitiesdo not simply emerge at the point o entry to HE, rather that the main socio-economic dierentiation continuesto occur during primary and second-leel education iewing social selectiity in access to HE as ‘a cumulatieprocess.
These issues hae guided the analyses presented in this report. In doing so, this study places particular ocus onthe lie-course perspectie, examining the educational experiences and attainments o young people rom thenon-manual group through their second-leel schooling, as well as their experiences on leaing school, drawing
on School Leaers’ Sureys oer the last decade. The qualitatie research has adopted a lie-course perspectie,ocusing on the pathways young people took within the schooling system, their attitudes to, and experiences o,second-leel education, their post-school aspirations and expectations, the actors inuencing their post-schoolchoices and their experiences o these post-school pathways. This approach allows or a more comprehensiepicture o the relatie experiences o those rom non-manual backgrounds, encompassing both the nature o thepost-school pathways taken, their experiences in accessing HE and the sectors and courses in which they areenrolled. The next section discusses theoretical approaches to understanding class inequalities in educationaloutcomes, ollowed by a specication o the research questions which guide this study.
1.5 Theoretical Perspecties on Inequality
in Higher EducationThis section now considers theoretical perspecties which oer an explanation or inequality in HE. Attemptsto explain the existence and persistence o class dierentials in educational attainment hae used a multitudeo contrasting approaches spanning macro- and micro-sociological approaches, as well as theories o the middlerange. These theories, while typically pitched in terms o working-class ersus middle class attainment, doproide aluable insights into the processes potentially underlying participation in HE o those rom non-manualbackgrounds. A central argument o this study posits that while non-manual workers are generally considered(lower) ‘white collar’ workers, in many ways this is a contradictory class position. Many non-manual workers haerelatiely little autonomy and little control oer work processes; job characteristics that generally typiy white-collar jobs. Hence, one could argue that the job characteristics o (lower) non-manual workers could, in some
respects, be considered as being more in line with the characteristics o working class jobs. The ollowing draws ontwo perspecties that are prominent in educational research; cultural theories and rational action perspecties.
8/4/2019 BKMNEXT146
http://slidepdf.com/reader/full/bkmnext146 22/227
8
CHAPTER 1: INTRODUCTION
1.5.1 Cultural Approaches
Cultural approaches, eident in the work o Bernstein (1961), Willis (1977), Lareau (2000), as well as Bourdieu (1973),are at the ore in educational debate. Reerred to as ‘pushed rom behind’ approaches (Gambetta, 1987), they
emphasise mechanisms related to cultural causation; such as norms, belies and sub-cultural alues, as they shapepreerences, expectations and, ultimately, choices. Bourdieu and Passeron (1977) also take a culturalist approach toeducational reproduction in an attempt to explain the act that:
‘… the raction o the school population which eliminates itsel beore entering the secondary stage or duringthat stage is not randomly distributed among dierent social classes’.
Bourdieu and Passeron (1977) consider the educational system directly inoled in the perpetuation o classinequalities through the imposition o the ‘cultural arbitrary’ o the dominant groups in society on other groups.Bourdieu and Passeron proceed to inoke the terms ‘cultural capital’ and ‘habitus’ to explain the processes bywhich this occurs. Each social class has its own indiidual and distinct habitus, ‘a system o schemes o thought,
perception, appreciation and action’. Pedagogic work carried out in educational settings is, Bourdieu asserts,largely undertaken within the habitus o the dominant (proessional) class. Consequently, those outside thedominant class (including those rom non-manual backgrounds) do not hae the habitus to generate the culturalcapital necessary or success in the educational system.
‘By doing away with explicitly giing to eeryone what it implicitly demands o eeryone, the educationalsystem demands o eeryone alike that they hae what it does not gie’ (Bourdieu and Passeron, 1977).
This leads to those outside the dominant class quickly recognising that their objectie chances o success are low.Consequently, they lower their aspirations to coincide with their objectie chances o success, and many eithereliminate themseles rom the educational system or ail to progress to post-secondary educational opportunities.Hence, these aspirations and actions are no more than their objectie chances o success intuitiely perceied and
gradually internalised.
Bourdieu and Passeron hae, howeer, been criticised or being oerly deterministic in their analysis o theimportance o cultural capital in shaping outcomes. Cultural capital:
‘… practically obliterates the person who is actually the main constructor o the home/school relationship.The student is treated mainly as a bearer o cultural capital, a bundle o abilities, knowledge and attitudesurnished by parents’ (Connell et al ., 1982; p.188).
No consideration is gien to the role o the educational system in enabling social mobility or traditionally lesssuccessul groups and the role o schools in creating cultural capital, as well as reproducing it. viewing cultural
capital as a primordial handicap disregards this role o education and oerlooks the substantial body o researchthat demonstrates the inuence that schools and educational institutions, and their organisation, methods andethos, hae on the educational attainments o their students. The t between objectie structures and internalisedstructures, Harker (1990) maintains, is neer absolute, as eidenced, or example, in the educational success oconsiderable and increasing numbers rom disadantaged backgrounds, a trend recently established in the Irishcontext (O’Connell et al ., 2006a). This criticism is aptly captured by Giroux (1982) who holds Bourdieu’s theory to be:
‘… a theory o reproduction that displays no aith in subordinate classes and groups, no hope in their abilityor willingness to reinent and reconstruct the conditions under which they lie, work and learn’.
This study allows us to consider the nature o dierentiation in educational outcomes and to assess whether such

8/4/2019 BKMNEXT146
http://slidepdf.com/reader/full/bkmnext146 23/227
9
CHAPTER 1: INTRODUCTION
cultural approaches help in our understanding o processes o inequality and, in particular, the relatiely low leelso entry into HE among young people whose parents are employed in non-manual occupations. In considering themultitude o cultural perspecties presented in the aboe literature, two hypotheses synthesise the processes
potentially underlying the low leels o educational attainment among young people rom non-manual backgroundsrom this perspectie:
Young people rom non-manual backgrounds do not possess the cultural capital necessary to succeed within•
an educational system geared towards the dominant class.Occupants o the non-manual group do not themseles hae experience o HE, and, in line with lower•
chances o successully accessing HE, hae lower educational aspirations which are shaped by their socialcontext and structural opportunities.
1.5.2 Rational Action Perspectives
Rational Action Perspecties (RAT), another school o thought to explain class dierentials in educationalattainment, by and large, do not inoke ‘cultural’ or ‘normatie’ dierences between social classes to explain theirdiering educational orientations, decisions or outcomes. Rather, such dierences are explained with reerenceto dierences in the resources and constraints aced by occupants o social class positions. Essentially, indiidualsand their amilies are iewed as acting rationally in the context o their circumstances, as choosing among thearying educational choices aailable to them on the grounds o their perceptions and ealuations o their costsand benets and o the perceied probability o their successul achieement.
In constructing a more recent account o RAT, Goldthorpe (1996a) draws on the work o Boudon (1974) and Keller andZaalloni (1964). These, and other writers in this area, argue that ariations in the actions and achieements o socialclass groups arise rom the relatie distances rom social origin that hae to be traelled to achiee a certain leel.In other words, aspirations o indiiduals should be judged not in absolute terms but relatie to their position o
origin. To illustrate, it would entail considerably greater aspirations and a greater cultural shit on the part onon-manual children to pursue uniersity education relatie to their middle-class counterparts. Hence, Goldthorpecontends, it should not be assumed that the tendency o children rom lower social strata to pursue less ambitiouseducational careers than children rom ‘priileged’ amilies deries rom a ‘poerty’ o aspiration. Instead, the patternso aspiration and choice across the social classes could be comparable gien their diering positions o origin.
Goldthorpe argues that there has, by and large, been little conergence in class-specic ealuations in educationaldecision-making, citing two urther arguments to support this. Firstly, the persistence o conditions in whichthe perceied costs and benets o educational options entail children in less adantaged positions requiringgreater certainty o their successul completion than their more adantaged counterparts. Secondly, the changingeducational propensities oer time can be iewed as haing a rational basis, when consideration is gien to the
resources, opportunities and constraints that continue to typiy diering class positions.
Howeer, models o rational action hae been criticised on a number o points. First, these models are inadequatein understanding human behaiour because they do not examine the origin o belies and alues. They are merelytheories about the way in which indiiduals, gien their alues and belies, make choices. No reerence is made tocultural or normatie dierences between social classes to explain their diering educational choices or outcomes.It appears essential to take account o the macro-sociological context and constraints within which peopleoperate, as RAT does so well. Howeer, ailure to take account o the cultural dierences between indiiduals andsocial classes does constitute a weakness. As ndings o Irish studies (Clancy, 2001; O’Connell et al ., 2006a; Clancyet al ., 1995; Clancy 1996; Clancy, 2007) demonstrate, the importance o cultural actors should not be ignored. Forinstance, the high third-leel admission rates rom western counties o Ireland, which are linked to high retention

8/4/2019 BKMNEXT146
http://slidepdf.com/reader/full/bkmnext146 24/227
10
CHAPTER 1: INTRODUCTION
rates at second-leel, reect a cultural orientation in many amilies which, despite modest cash income (althoughcapital resources may be relatiely high), oster and realise high educational aspirations. Furthermore, RAT alsotends to bracket o primary eects (such as ‘ability’ and perormance), ocusing attention predominantly on
secondary eects – the educational choices young people and their parents make. Howeer, recent work (Eriksonet al ., 2005) examining class dierences in progression to HE (in England and Wales) indicates that when primaryand secondary eects are actually decomposed, the ormer are shown to be roughly three times the size o thelatter. It can also be noted that RAT commentators tend to hae little to say about processes shaping educationalachieement, with schooling emerging as a ‘black box’.
Breen and Goldthorpe (1996) hae made some progress towards accounting or cultural dierences between socialclasses. They consider cultural dierences existing between classes as epiphenomenal, that is, as adaptations tothe underlying structural situation. Hence, in the eent o changes in the preerences, constraints or resourcesaced by indiiduals, corresponding adaptations o their cultural attributes will ollow. Drawing on the example othe west o Ireland again, such an argument would account or high leels o attainment in rational choice terms.
In a context o both ew labour market opportunities and poor quality jobs, education proided oten the bestopportunity to secure a good quality o lie. Those rom other regions/urban localities, on the other-hand, were notas dependent on educational qualications as jobs permitting a reasonable standard o liing were readily aailableto poorly educated people. In this illustration, objectie opportunities and constraints aced by indiidualstransormed cultural norms, alues and aspirations regarding educational attainment.
It can also be noted that RAT is useul in the current context as it typically iews educational attainment as asequence o decisions – decisions which must be examined in a step-by-step basis, rather than solely in termso highest educational attainment or entry into HE, or example (as examined by Hillmert and Jacob, 2002).The student and his/her parents must make decisions at each stage in the educational process (transition intosecond-leel, completion o Junior Cycle, persistence beyond the compulsory schooling-age, choice o seniorcycle programme, completion o second-leel, progression to urther study or entry to the labour market). While
RAT perspecties hae typically been adopted to examine decisions within the compulsory school system amongindiiduals rom dierent social backgrounds, this study is concerned with both decisions within the school systemand also decisions on leaing school (principally, the decision to pursue HE). For this reason we are not primarilyconcerned with the decisions o parents and their attempts to ensure the ‘amily’s class position’, but regard theyoung person themseles as being the primary decision-maker. In this context, educational decisions are basedon educational/social background, the alue system o the home enironment, the expectations o success and‘relatie risk aersion’ (attempts to ensure that children hae a position in lie that is not worse than their parents),and also on the indiidual’s own preerences and aspirations.
Drawing on the RAT perspectie, two hypotheses can be identied:
In iewing the aspirations o young people relatie to their position o origin, young people rom non-manual•backgrounds are less likely to enter HE as to do so requires considerably higher aspirations relatie to theirmiddle-class counterparts. Young people rom non-manual backgrounds are less likely to enter HE as a result o the higher relatie costs•
o doing so, the greater opportunity cost and the lower likelihood o success.
8/4/2019 BKMNEXT146
http://slidepdf.com/reader/full/bkmnext146 25/227
11
Cross-cutting these theoretical perspecties, this study also considers the role o the school, both as contextand constraint, with recent work identiying a number o school characteristics that inuence the transition toHE in Ireland (Smyth and Hannan, 2007; Byrne, 2009). Hence educational decisions are examined both within
the second-leel system and on leaing school, where school leaers (who reach this leel) typically ace threealternatie options:
Higher Education.•
Other (shorter) education and training opportunities – which do not necessarily preclude the possibility o HE•
later on.Labour market.•
Our ocus is primarily on the experiences and outcomes o the non-manual group, to assess the decisions o youngpeople rom this group relatie to other social groups. Chapter Two details the mixed-method research approachtaken to addressing these research questions.
1.6 Research QuestionsBased on a reiew o the literature, dominant policy concerns, and guided by the theoretical perspectiespresented, the ollowing research questions hae been deried to guide the analyses o the study:Why is the HE participation rate o the non-manual group so low relatie to other social groups? Are the non-manual group a homogenous group, broadly similar in educational prole? Or can sub-groups withdiering characteristics and outcomes be identied?
How do young people rom non-manual backgrounds are within broader patterns o dierentiation in•
educational outcomes?
Do dierences arise in early educational experiences which hae implications or patterns o access to HE?•
Beyond educational experiences and attainment, what are the main processes explaining the•
under-representation o these groups in HE?Do similar patterns arise in relation to dierentiation within HE and retention?•
CHAPTER 1: INTRODUCTION

8/4/2019 BKMNEXT146
http://slidepdf.com/reader/full/bkmnext146 26/227
12
CHAPTER 1: INTRODUCTION
8/4/2019 BKMNEXT146
http://slidepdf.com/reader/full/bkmnext146 27/227
CHAPTER 3: EXPENDITURE PATTERN OF STUDENTS
13
CHAPTER 2 Methodology

8/4/2019 BKMNEXT146
http://slidepdf.com/reader/full/bkmnext146 28/227
14
CHAPTER 2: METHODOLOGY
2.1: IntroductionThis report is based on a mixed method approach drawing on ndings rom a range o existing quantitatie data
sources, alongside qualitatie interiews with recent school leaers. This mixed method approach is ery much tothe ore o educational research today, as researchers moe beyond the use and integration o mixed methods toarrie at more synergistic understandings (Day et al ., 2008). A sole reliance on either quantitatie or qualitatiemethods has been the subject o some debate, with researchers arguing that research programmes that grow outo one perspectie tend to:‘illuminate some part o the eld … while ignoring the rest … [and hence] the danger or any eld o social scienceor educational research lies in potential corruption by a single paradigmatic iew’ (Shulman, 1986).
Hence mixed method approaches hae gained aour as an alternatie to the exclusie reliance on either apositiist or metaphysical orientation (Day et al ., 2008).Further, the eld o access research6 in particular has been criticised or the dominance o quantitatie methods,
which are judged:‘to be more trustworthy and capable o replication’, leading to a neglect o qualitatie studies which attempt tounpack the black box behind the statistics in policy discourse (Bernard, 2006, p.28).
This research, in adopting such a mixed method approach, combines the strengths o these two methods to allowa much uller understanding o the processes underlying HE entry and non-entry among young people rom lowerwhite collar backgrounds. Furthermore, it has been noted that there is a need in this eld or ‘research whichconsiders not the barriers to entry but, rather, the reasons or the success o those rom lower socio-economicallybackgrounds who did access HE’ (Bernard, 2006). By undertaking in-depth interiews with young people whosucceeded in gaining access to HE as well as those who did not, this research also unpacks the processesunderlying success in entry to HE. The ollowing details the surey data utilised in the analysis, ollowed by detailso the primary qualitatie research undertaken.
2.2 Data Sources:Quantitatie Data SourcesIn terms o quantitatie data the results are based on analysis o the 2004 New Entrants’ Surey, School Leaers’Sureys spanning 1997-2007 and the EU SILC 2006 data. These data sources allow an examination o a range oissues or the non-manual group: their second-leel completion rates and examination perormance leels, thepost-school destinations o these students, their HE participation leels, the characteristics o those rom thenon-manual group who enter college and the income leels associated with indiiduals rom the non-manual group.
The ollowing proides some urther inormation on these three main data sources, data that allow us to examinedierent aspects o HE participation among those rom non-manual backgrounds relatie to othersocio-economic groups.
The rst data source, the New Entrants’ Surey 2004, is based on those who entered HE or the rst time in 2004and looks at a range o actors at that point o entry to college. The occupational classication scheme used inthis data is rom the Census o Population (1996), which is based on the UK Standard Occupational Classication(SOC). The data gies aluable insights into the second-leel and HE characteristics o new entrants rom dierentsocio-economic backgrounds. Among the issues examined are the age prole; year o leaing school; type oschool attended; HE institution attended and receipt o grant or indiiduals rom dierent socio-economic
6 Access research is the term that has been assigned to research examining access to HE.

8/4/2019 BKMNEXT146
http://slidepdf.com/reader/full/bkmnext146 29/227
15
CHAPTER 2: METHODOLOGY
backgrounds. Particular attention is placed on those rom non-manual backgrounds to assess how they compare toother socio-economic groups.
While proiding aluable insights into (and contextual analysis o) the characteristics o those who succeed ingaining entry to HE, this data is o limited alue in considering the actors shaping participation in HE, gien thatthe study gies no consideration to those who, or whateer reason, do not enter HE. Entry to HE in the Irishcontext is largely contingent on completion o second-leel education and at least reasonable perormance in theLeaing Certicate examination. Drawing on pooled results o School Leaers’ Sureys conducted during the 1990sand 2000s, attention switches to explaining key processes underlying HE participation oer time, again ocusingspecically on the experiences o those rom non-manual backgrounds relatie to other social groups.The decision to enter HE is not one made simply at the point o leaing school, but stems rom a sequence odecisions and educational outcomes throughout the ormal schooling years, as well as at the point o leaingschool. The analyses o School Leaers’ Sureys oer time, married with qualitatie interiews with youngpeople, proides comprehensie insights into both the relatie educational success and the pathways chosen by
those rom non-manual backgrounds during the second-leel and post-school period. This allows much greaterunderstanding o the actors shaping HE entry or those rom non-manual backgrounds and an assessment o theirrelatie representation and ‘success’ in a range o post-school pathways, including urther education, training andthe labour market, as well as HE.
Throughout the period, the occupational classication used or the School Leaers’ Surey is based on the Censuso Population 19867 . The analysis draws on two measures o socio-economic background. The rst is based on thetraditional approach whereby socio-economic background is based on ather’s occupation. Howeer, increasinglyin studies o social background and education, a ‘dominance approach’ (Erikson, 1984; Smyth, 1999) is used in thedenition o social background. Under this approach, socio-economic background is based on the mother’s ratherthan the ather’s position i she is in employment and has an occupational position higher than her husband. The‘parental socio-economic status’ ariable will be used as the primary measure o socio-economic background in the
analysis o the School Leaers’ Surey data while tables outlining athers socio-economic status can be ound inAppendix C or each o the dependent ariables used in the study.
Neither the New Entrants 2004 data nor the School Leaers’ Sureys proide inormation on the income leelso those rom dierent socio-economic groups, data which is essential in assessing the extent to which indiidualsrom the non-manual group are eligible or nancial assistance (in the orm o grants) in the eent they gain entryto HE. Chapter 3 draws on the Surey o Income and Liing Conditions (SILC) 2007. This is an annual sureyconducted by the Central Statistics Oce (CSO). This data is central to the study as it allows us to obtaininormation on the income and liing conditions o dierent types o households and the indiiduals liing in themand, in particular, to analyse income leels among dierent socio-economic groups. The occupational classicationused is the ‘European Socio-Economic Classication’ (discussed urther in Chapter 3).
Drawing on inormation rom the School Leaers’ Surey 2007, and the insertion o additional questions in thissurey, the report also examines the extent to which students rom the non-manual group apply to participatein HE; the reasons why some do not apply; whether they were oered a place on a course; the extent to whichstudents rom this group decline such course places and; the reasons why they reject such places.Finally, to note much o the school leaers’ analysis is based on pooled data (1997 and 1998 sureys, 2002 and2004 sureys and 2006 and 2007 sureys), thereby boosting sample numbers and proiding more reliable resultsand better estimates o the relatie position o young people rom non-manual backgrounds and changes in thatposition oer time.
7 A list o the occupations classied as ‘intermediate non-manual’ and ‘other non-manual’ are contained in Appendix A.
8/4/2019 BKMNEXT146
http://slidepdf.com/reader/full/bkmnext146 30/227
16
CHAPTER 2: METHODOLOGY
The ollowing proides urther details on the main data sources.
2.2.1 New Entrants’ Data
The ocus o this data is on new entrants to HE in Ireland in 2004. New entrants to HE are dened as rst-timeundergraduates in the rst year o study in ull-time HE in the Republic o Ireland. The denition o rst-timeundergraduates excludes repeat students, students who preiously enrolled in HE on another programme in thesame college or in another HE college. Thus the number o new entrants is not the same as the number o rst-year students. The denition o HE is dened as courses oered in recognised HE institutions (hence Post-LeaingCerticate courses, which are deliered through second-leel institutions, are excluded) and which normallydemand a minimum entry requirement o a Leaing Certicate with at least grade D in e subjects (almost allcolleges admit some mature students who may not hae reached these required educational credentials). Intotal, 40 HE Institutions (HEIs) are included in this data8. Within this total, we distinguish our groups o HEIs;Uniersities, Institutes o Technology, Colleges o Education and Other Colleges.
With these parameters, the ESRI managed and coordinated a postal surey o a representatie sample o theentire population o 34,700 indiiduals who had entered HE in Ireland through the CAO system in 2004, to collectinormation on parents’ socio-economic characteristics and educational attainment. The CAO undertook theeldwork or the surey, posting the questionnaire to each o the new entrants between Noember 2004 andJanuary 2005. The oerall response rate was 42 per cent. As is standard practice the data were re-weighted usingsampling control parameters.
2.2.2 School Leavers’ Surveys
The ESRI has been undertaking the Annual School Leaers’ Surey since 1980, initially or the Department oEnterprise, Trade and Employment (ormerly the Department o Labour) and more recently or the Department
o Education and Science. School Leaers’ Sureys proide comprehensie and unique insights into the positionand experiences o young people as they leae school – capturing both their school experiences and their post-school pathways. The sureys are based on a stratied random sample o those leaing the ocial second-leelsystem, with respondents being interiewed 18-24 months ater leaing school. The surey records detailedinormation on school leaers’ school experiences (attitudes towards their schooling, decisions taken at school,programmes taken, stage let and examination perormance), their post-school pathways (labour market, urthereducation or training) and crucially their social background characteristics. This allows us to look at the second-leel achieements o young people rom the non-manual group, as well as their post-school destinations andrelatie rates o entry into HE, urther education, training and apprenticeships and the labour market. To look atchanges oer time in the relatie experiences o young people rom non-manual backgrounds, we pool data romthe 1997/98 sureys and make comparisons to more recent sureys undertaken in 2002/04 and 2006/07. This gies
sample numbers o 5,622 in 1997/98, 5,309 in 2002/04 and 4,024 in 2006/07.
8 There are 41 institutions listed with the CAO in 2004. The American College Dublin did not return data or the study, but this does not aect ourresults as the American College Dublin accounts or less than hal o one percent o new entrants to HE in Ireland in 2004. St. Catherine’s Collegeo Education or Home Economics had no intake or 2004.

8/4/2019 BKMNEXT146
http://slidepdf.com/reader/full/bkmnext146 31/227
17
CHAPTER 2: METHODOLOGY
2.3 Qualitatie Research:Lie Course Interiews
2.3.1 IntroductionAs this part o the study seeks to elicit opinions and eelings about educational pathways and post-schooldecisions in some depth, open-ended interiews were conducted with recent school leaers to explore theirdecisions and the processes underlying their school and post-school pathways. These social research methods areuseul or understanding meaning and how indiiduals make sense o their world and their experiences (Creswell,1994). A qualitatie, in-depth approach particularly allows or the ‘primacy o respondent’ treating them as ‘expertswho proide aluable inormation’ (Sarantakos, 1988: 256). Thereore this approach oers an ideal means oexploring the perspecties o participants in this study and the processes inuencing their choices.
The ramework o the interiew schedule was within a lie/oral history context. As Thompson (1988) highlights,
using a lie/oral history ramework coers the underpinnings o ‘the decisions which indiiduals make’ (Thompson,1988: 298). Additionally, an oral history is useul as it allows researchers to collect ‘personal recollections o eents,their causes and their eects’ (Creswell, 1998:49). In particular oral history has the adantage o reealing ‘themeanings o lied experience’ (Yow, 2005: 23). Using this ramework allows the study to ocus on the actors whichinuenced young peoples’ decision-making with regard to their post-school choices. Consequently, the researchcaptures the essence o what shaped their decision to attend HE or to pursue other pathways (or example,ull-time employment).
2.3.2 Themes and Topics
The interiews ollowed a semi-structured ormat, with a list o themes and key questions sering to guide theinteriews. Howeer, gien the wide range o actors and processes inuencing young peoples’ post-school choices,
the interiews were suciently uid to allow or a ull exploration o the experiences o indiidual participants.The ollowing were the main areas o questioning coered, with some interiews deiating quite considerably andexploring a range o issues releant to those indiiduals:
Home lie while in second level
Area (rural/urban), economic prole•
Social lie (clubs/sports etc); part-time employment•
Family unit (current position, post educational pathways, infuence on participant)
Parents’ Careers•
Siblings (educational pathways and aspirations)•
Second-Level School
Type o school•
Opinions on school/teachers/subjects•
Programme choices (including TY, LCA)•
Examination perormance•
Career guidance adice receied•

8/4/2019 BKMNEXT146
http://slidepdf.com/reader/full/bkmnext146 32/227
18
CHAPTER 2: METHODOLOGY
Early Expectations
Expectations and aspirations regarding career and labour market position•
views on HE while at school, awareness, contact with HE institutions•
Plans to pursue HE - applied/oered place•Barriers and supports; nancial circumstances•
Activities since leaving school
Details o main economic actiities•
Details o current position (education or labour market)•
Refection
Would you do anything dierently (regarding post school choices)•
What would hae helped to do things in a dierent way•
Adice to a school leaer today•
Future
Where do they think they will be in e years•
Is urther study part o their uture plan•
2.3.3 Theoretical Sample
We set out to select a total sample o thirty school leaers, who completed their schooling, drawn rom the 2006School Leaers’ Surey. As discussed earlier in the chapter, this surey examines the school and post-schoolexperiences o those who let the ocial second-leel school system during the 2003/04 academic year. We ocuson our main pathways and set out to achiee the ollowing target sample:
Pathways Target SampleSchool leaers who progress to HE immediately ater school 6School leaers who pursue a PLC or Apprenticeship 8School leaers who enter HE ater undertaking a PLC course 4School leaers who enter the labour market ater school 12
Within these groups, we aimed to achiee a mix o students in terms o gender and examination perormance.In addition, we were anxious to ensure a good representation o young people rom both intermediate and othernon-manual backgrounds (based on either their ather’s or highest parents’ occupation).
Eery eort was also made to ensure a good mix o respondents in terms o:
Grant and non-grant holders (HE participants)•HE Sector (uniersity and institute o technology)•
School disadantaged status (DEIS)•
Wide geographical spread•
2.3.4 Achieved Sample and Prole o Respondents
Initially, a sample o approximately ty young people was selected in an attempt to achiee the aboe targetsample. Howeer, small numbers expressed a willingness to participate, despite the oer o a small nancialincentie o €50 to coer their expenses. As a result, the ull cohort o young people rom intermediate and othernon-manual backgrounds that completed their second leel education were ultimately contacted by letter and

8/4/2019 BKMNEXT146
http://slidepdf.com/reader/full/bkmnext146 33/227
19
CHAPTER 2: METHODOLOGY
asked to participate in the study. In total two hundred and ty young people were contacted, with twenty-nineindicating that they were willing to be interiewed.Table 2.1 indicates the prole o participants. In total thirteen young people entered the labour market on leaing
school, seen progressed to HE immediately and the remaining nine entered other orms o education and training(mostly PLC and apprenticeship programmes; two such participants hae since progressed to HE). A total osixteen members o the sample are male and sixteen lied in County Dublin while at school, with the remainderspread across the country.Pathways Achieed SampleSchool leaers who progress to HE immediately ater school 7School leaers who pursue a PLC or Apprenticeship 7School leaers who enter HE ater undertaking a PLC course 2School leaers who enter the labour market ater school 13
For the purposes o this report, respondents are diided into three main groups: those who enter HE on leaing
school; those who enter the labour market ull-time and those who (immediately) pursue other orms o educationand training (most either Post-Leaing-Certicate courses or an apprenticeship programme). The groups arelabelled HE, LM and Other ET respectiely. Inormation rom the School Leaers’ Surey 2006, rom which thesample was drawn, shows some important initial dierences between these three leaer groups, particularly interms o their social background, the senior cycle programme taken while in school and their perormance in theLeaing Certicate examination. In total, thirteen out o the twenty-nine participants came rom other non-manualbackgrounds (where one or both parents were employed in such an occupation). Among those progressing to HE,the ast majority came rom intermediate non-manual backgrounds, while greater numbers o the labour marketand other education/training groups came rom other non-manual backgrounds. It should also be noted, thatwhile the group o twenty-nine young people interiewed all came rom non-manual backgrounds, their economicpositions aried quite dramatically. Some came rom highly economically disadantaged urban areas, while otherscame rom relatiely afuent ‘middle-class’ communities, one o whom attended a ee-paying school.

8/4/2019 BKMNEXT146
http://slidepdf.com/reader/full/bkmnext146 34/227
20
CHAPTER 2: METHODOLOGY
T a b l e 2 . 1 : P r o f l e o P a r t i c i p a n
N a m e
S c h o o l T y p e
L C
P r o g r a m m e
I n t e r m e d i a t e
N o n - m a n u a l ( I N M )
o r O t h e r N o n -
m a n u a l ( O N
M )
F a t h e r ’ s
E d u c a t i o n
M o t h e r ’ s
E d u c a t i o n
L C
P e r o r m a n c e
L a b o u r M a r k e t E n t r a n t
s ( ‘ L M ’ G r o u p )
S a r a h
S e c o n d a r y N o n - D E I S
L C
I N M
J C
L C
P a s s
A i d e e n
C o m p r e h e n s i e N o n - D E I S
L C
O N M
P r i m a r y
P r i m a r y
P a s s
R a c h e l
C o m p r e h e n s i e D E I S
L C
O N M
J C
J C
- - - -
D e c l a n
S e c o n d a r y N o n - D E I S
L C
I N M
D i p l o m a
D i p l o m a
P a s s
v i n c e n t
C o m p r e h e n s i e N o n - D E I S
L C
I N M
J C
J C
L e s s t h a n 5 p a s s g r a d e s
M i c h a e l
S e c o n d a r y N o n - D E I S
L C
I N M
L C
L C
P a s s
M a r k
C o m p r e h e n s i e N o n - D E I S
L C A
I N M
D i p l o m a
D i p l o m a
- - - -
M a i r e a d
C o m p r e h e n s i e D E I S
L C A
O N M
J C
P r i m a r y
- - - -
T o n y
S e c o n d a r y N o n - D E I S
L C A
I N M
L C
L C
- - - -
D e r m o t
v o c a t i o n a l D E I S
L C
I N M
L C
D i p l o m a
1 - 3 H o n o u r s
L y n d a
C o m p r e h e n s i e N o n - D E I S
L C A
O N M
P r i m a r y
J C
- - - -
S a l l y
S e c o n d a r y N o n - D E I S
L C A
O N M
L C
L C
1 - 3 H o n o u r s
N o e l
C o m p r e h e n s i e N o n - D E I S
L C
O N M
J C
J C
P a s s
H i g h e r E d u c a t i o n E n t r a n t s ( ‘ H E ’ G r o u p )
E a m o n
v o c a t i o n a l D E I S
L C
I N M
J C
L C
4 + H o n o u r s
P a t r i c k
S e c o n d a r y N o n - D E I S
L C
I N M
L C
J C
4 + H o n o u r s
J o s e p h i n e
C o m p r e h e n s i e D E I S
L C
I N M
P r i m a r y
L C
- - - -
P h i l i p
S e c o n d a r y N o n - D E I S
L C
O N M
J C
L C
4 + H o n o u r s
G e r a r d
S e c o n d a r y N o n - D E I S
L C
I N M
D e g r e e
D e g r e e
4 + H o n o u r s
P a u l
S e c o n d a r y N o n - D E I S
L C
I N M
D i p l o m a
D i p l o m a
- - - -
D a r a g h
S e c o n d a r y N o n - D E I S
L C
I N M
D i p l o m a
D i p l o m a
- - - -

8/4/2019 BKMNEXT146
http://slidepdf.com/reader/full/bkmnext146 35/227
21
CHAPTER 2: METHODOLOGY
N a m e
S c h o o l T y p e
L C
P r o g r a m m e
I N M o r O N M
F a t h e r ’ s
E d u c a t i o n
M o t h e r ’ s
E d u c a t i o n
L C
P e r o r m a n c e
O t h e r E d u c a t i o n a n d T r a i n i n g ( P L C / A p p r e n t i c e s h i p ‘ O t h e r E T ’ G r o u p )
P L C
F i o n a
S e c o n d a r y N o n - D E I S
L C
O N M
J C
J C
1 - 3 H o n o u r s
T r a c e y
C o m p r e h e n s i e N o n - D E I S
L C A
I N M
D i p l o m a
L C
- - - -
S h a r o n
C o m p r e h e n s i e N o n - D E I S
L C
O N M
J C
P r i m a r y
1 - 3 H o n o u r s
R u t h
C o m p r e h e n s i e D E I S
L C
O N M
L C
J C
- - - -
R o g e r
C o m p r e h e n s i e N o n - D E I S
L C
O N M
P r i m a r y
P r i m a r y
P a s s
E m e r
C o m p r e h e n s i e N o n - D E I S
L C
O N M
J C
J C
P a s s
A p p r e n t i c e s h i p
C h a r l i e
S e c o n d a r y N o n - D E I S
L C
O N M
J C
P r i m a r y
P a s s
C i a n
S e c o n d a r y N o n - D E I S
L C
I N M
L C
L C
4 + H o n o u r s
E m m a
v o c a t i o n a l D E I S
L C A
I N M
J C
P r i m a r y
- - - -

8/4/2019 BKMNEXT146
http://slidepdf.com/reader/full/bkmnext146 36/227
22
CHAPTER 2: METHODOLOGY
Six members o the group had taken the Leaing Certicate Applied programme (LCA) during senior cycle.It is interesting to note that the bulk o these young people entered the labour market on leaing school. For thosewho took the established Leaing Certicate (LCE) (or the Leaing Certicate vocational Programme (LCvP), a
ariation on the established Leaing Certicate), examination perormance appears to dier somewhat betweenthe three groups, with those progressing to HE more likely to perorm well in the examination and achiee 4 ormore C grades (or better) on Higher Leel papers.
These three groups o young people dier considerably in their school and post-school experiences and, orthis reason, are largely discussed separately in three chapters exploring HE entry, other education and trainingparticipation and labour market entry among school leaers. Chapter 5 considers the school experiences andattainments o these three groups o young people and examines the question to what extent do experienceswhile at school impact on the post-school choice young people make and whether they progress to HE? Inaddition, Chapter 10 discusses dierences across the three groups o young people rom these intermediate andother non-manual backgrounds. It assesses whether diering early experiences impacted on the pathways taken
by these young people and identies the processes underlying their choices regarding HE entry.
2.3.5 Analysis
Interiews with the twenty-nine study participants were recorded (with their consent) and transcribed erbatim.The data was then analysed using the QSR N6 package to identiy emerging themes and dierences between thethree main school leaer groups. To presere anonymity, all indiiduals hae been assigned pseudonyms, and anyother identiying inormation is omitted rom the report.
2.4 Format o the ReportThe remainder o the report is set out as ollows. Chapter three explores the size and characteristics o thenon-manual socio-economic group. Drawing on Census data the analysis considers the proportion o thepopulation in non-manual occupations and whether this has changed oer time. The New Entrants’ Surey thenproides useul insights into the demographic and school characteristics o entrants to HE and the types oinstitutions and courses attended. The chapter then considers the aerage income leels o dierentsocio-economic groups, with a iew to assessing their leels o eligibility or state nancial support. Finally, drawingon School Leaers’ Surey data, the chapter examines the types o schools attended by young people o dierentsocial backgrounds, with this analysis giing us the opportunity to look at two main sub-groups within thenon-manual category.
Chapter Four examines patterns o second-leel participation and attainment or young people rom dierent
socio-economic backgrounds, placing particular emphasis on the relatie position o the intermediate and othernon-manual groups. The second-leel experiences o these groups are urther examined in Chapter Fie, wherendings rom the qualitatie research are considered with particular reerence to the second-leel experiences othose who take dierse post-school pathways.
Chapter Six examines patterns o application to HE and entry rates across socio-economic groups, along with theactors inuencing HE entry and dropout. Drawing on interiews with young people rom non-manual backgroundswho successully transerred to HE, the chapter also explores their experiences o the transition and the actorsunderlying that decision. Young people who pursue orms o post-school education other than HE are consideredin Chapter Seen, where entry into PLC, apprenticeship and other state-sponsored training programmes areexamined, again ocusing on the patterns or our two non-manual groups relatie to young people rom other

8/4/2019 BKMNEXT146
http://slidepdf.com/reader/full/bkmnext146 37/227
23
CHAPTER 2: METHODOLOGY
social backgrounds. Finally, young people who enter the labour market ull-time on leaing school are discussed inChapter Eight.
Chapter Nine presents a ull discussion o all results, with particular reerence to the choice processes o youngpeople rom non-manual backgrounds.

8/4/2019 BKMNEXT146
http://slidepdf.com/reader/full/bkmnext146 38/227
24
CHAPTER 2: METHODOLOGY

8/4/2019 BKMNEXT146
http://slidepdf.com/reader/full/bkmnext146 39/227
25
CHAPTER 3: SETTING THE CONTEXT: THE CHARACTERISTICS OF THE NON-MANUAL GROUP
CHAPTER 3 Setting the context: The Characteristicsof the Non-Manual group
8/4/2019 BKMNEXT146
http://slidepdf.com/reader/full/bkmnext146 40/227
26
CHAPTER 3: SETTING THE CONTEXT: THE CHARACTERISTICS OF THE NON-MANUAL GROUP
3.1: IntroductionThis chapter seres two main purposes. Firstly, it proides the context and examines the oerall composition o
the intermediate and other non-manual groups. Secondly, it considers the characteristics o occupants o thenon-manual groups – in terms o occupations they are ound in, income leels with a iew to assessing the leels oeligibility or state nancial support, educational leels, and their educational experiences in terms o the types osecond-leel schools they attended and the types o courses and colleges they hae accessed among thesub-group who were successul in gaining entry to HE. In doing so, a range o data sources are used and theollowing section proides an oeriew o the measurement and classication o socio-economic groups usedacross these data sources.
3.2 Classication o the Non-Manual
Socio-Economic GroupThis chapter draws on a number o data sources in order to consider the characteristics o the non-manualsocio-economic group. In doing so, there is an issue with regard to the classication o socio-economic positionswhich should be addressed at this point . The term ‘socio-economic position’ is used to reect how societies arestratied. Social stratication reers to social inequalities that may be attributed to the way a society is organised,to its socio-economic structure. Socio-economic classications all share in common the idea that in marketeconomies it is market position, and especially position in the occupational diision o labour, which is undamentalto the generation o social inequalities. The lie chances o indiiduals and amilies are largely determined by theirposition in the market and occupation is taken to be its central indicator; that is the occupational structure isiewed as the backbone o the stratication system.
Table 3.1 outlines each o the data-sets used in this chapter and their corresponding measure o the non-manualsocio-economic group. While data rom the Census 1996, 2002, 2006 and New Entrants data record an aggregatemeasure o the non-manual group, the Census 1986, School Leaers’ Surey data record a breakdown o thenon- manual group into the intermediate and other non-manual groups. SILC data deries socio-economicbackground rom the European Socio-economic Classication (ESeC) and two categories are o particularreleance to the CSO ‘Non-Manual Category’ – the Intermediate Occupations and the Lower Serices, Sales andClerical Occupations.

8/4/2019 BKMNEXT146
http://slidepdf.com/reader/full/bkmnext146 41/227
27
CHAPTER 3: SETTING THE CONTEXT: THE CHARACTERISTICS OF THE NON-MANUAL GROUP
Table 3.1 Summary o Measures o Non-Manual Groups Used in Data Sources
Data Source Measure o
Non-Manual Group
SEC Scheme Used
Census 1986 Non-Manual Group can bebroken into IntermediateNon-Manual and Other Non-Manual
Census Class oOccup ‘86
School Leaers Surey (all) Non-Manual Group can bebroken into IntermediateNon-Manual and OtherNon- Manual
Census Class oOccup ‘86
SILC Data (2006) Intermediate Occupationsand Lower Serices andTechnical Occupations
ESeC
Census 1996, 2002, 2006 Non-Manual GroupAggregate Group
Census Class oOccup ‘96
New Entrants Data 2004 Non-Manual GroupAggregate Group
Census Class oOccup ‘96
Using these data sources and corresponding measures o the non-manual socio-economic group, this chapter nowconsiders the size, composition and characteristics o the non-manual group.
3.3 Size and Composition o the
Non-Manual GroupDrawing on Census data since the mid 1990s, Table 3.2 presents the proportion o the adult population (aged 15years and older) in each o the main socio-economic groups. Oerall, nearly one-in-e are located within thenon-manual group, with little change oer time. This highlights the importance o addressing low leels oparticipation in HE among young people rom non-manual backgrounds, gien that the issue relates to a signicantshare o the population.
The socio-economic classication presented in Table 3.1 was introduced in 1996 and aims to bring together personswith similar social and economic statuses on the basis o leel o skill or educational attainment required. Indening socio-economic group, this classication does not attempt to rank groups in order o socio-economic
importance. Furthermore, the socio-economic group is determined by occupation and employment status andresults in one single non-manual group.

8/4/2019 BKMNEXT146
http://slidepdf.com/reader/full/bkmnext146 42/227
28
CHAPTER 3: SETTING THE CONTEXT: THE CHARACTERISTICS OF THE NON-MANUAL GROUP
Table 3.2: Total Population (Aged 15 years and over) 1996, 2002 and 2006 Census Results
Socio-Economic Group 1996 2002 2006
% % %
Employers and Managers 10.8 14.1 15.3
Higher Proessional 4.4 5.1 5.8
Lower Proessional 8.4 9.9 10.7
Non-Manual 18.0 17.6 19.3
Manual Skilled 13.3 10.6 10.1
Semi-Skilled 9.6 8.3 8.4
Unskilled 7.7 5.3 3.8
Own Account workers 5.2 4.5 4.3
Farmers/agricultural workers 10.8 6.8 4.6
Unknown 11.9 17.9 17.8
The broad ‘non-manual’ socio-economic group is howeer comprised o two main sub-groups: intermediate non-manual and other non-manual. As indicated in Section 3.2, the distinction between the intermediate non-manualgroup and the other non-manual group can be deried using the 1986 Census o Population socio-economicclassication, which is the main classication used in the analyses o School Leaers’ Surey data in this report .As shown in Appendix A, these two non-manual groups hae somewhat distinct occupational proles – theormer is comprised o a number o relatiely high status positions such as Garda sergeants and lower ranks andgoernment executie ocials. In contrast, the latter, ‘other non-manual’ group, is dominated by lower leel sericeworkers – including bus driers, barbers/hairdressers, air stewards and waiters/waitresses.
Changes hae occurred in occupational classications between the 1986 Census and 1996 Census and Table 1 inAppendix B then makes an attempt to compare the 1986 Census classication with the 1996 Census classication.9 What is particularly eident is that many o the occupations in the intermediate non-manual group hae beenre-coded to Managerial and Technical and Lower Proessional socio-economic positions. This is particularly thecase or proprietors o serices, and goernment executies. In relation to the other non-manual group, we ndthat many occupations are now classied as ‘Skilled Manual’ occupational groups and this is particularly the casewith occupations such as bus driers, taxi driers. Howeer, what is clear is that a number o occupations in bothgroups hae remained consistent and the distinction between the intermediate non-manual group and the othernon-manual group also remains consistent. The remaining occupations classied as ‘other non-manual’ are likelyto hae experienced a worsening o their position oer time, particularly in the context o expansion and growth
in part-time employment contracts. Some o the remaining occupations in this group indicate less ormal accessroutes and perhaps a lower reliance on ormal education or training requirements or entry (particularly in thecase o street traders, waiters and waitresses). In addition, these occupations may be less reliant on entry-leelqualications, and hae less benecial working conditions and remuneration and so represent economic positionswhich are likely to hae considerable impact on educational attainment and HE access. As a result, we nd thatthese two groups remain occupationally highly distinct. Analysis o SILC data later in the Chapter allows us toexamine the income leels o these groups, while analysis o New Entrants’ and School Leaers’ Surey datagies us the opportunity to gain a much uller picture o the prole o these groups and their position relatie totraditionally disadantaged groups.
9 This comparability exercise has been conducted by the authors o this report. It should be noted that a certain degree o caution should beexercised in relation to making comparisons between the two coding schemes.

8/4/2019 BKMNEXT146
http://slidepdf.com/reader/full/bkmnext146 43/227
29
CHAPTER 3: SETTING THE CONTEXT: THE CHARACTERISTICS OF THE NON-MANUAL GROUP
Composition o the Non-manual Group
Table 3.3 indicates that the actual size o the non-manual group beore and ater the change in Censusclassication o occupations in 1996 has reduced rom 26 per cent in 1986. In 1986 the composition o the
non-manual group was comprised o 57 per cent intermediate non-manual and 43 per cent other non-manual.
Table 3.3: Total Population (Aged 15 years and over) 1986, 1996, 2002 and 2006 Census Results
Socio-Economic Group 1986 1996 2002 2006
% % % %
Non-Manual 26.4 18.0 17.6 19.3
of which
Intermediate Non-manual 57.0 N/A N/A N/A
Other Non-manual 43.0 N/A N/A N/A
More recent estimates o the composition o the non-manual group can be deried rom the School Leaers’Surey and are presented in Table 3.4. We estimate that the size o the intermediate non-manual group hasincreased oer time, while the size o the other non-manual group has decreased oer time to a ratio o 40:60with the intermediate non-manual group.
Table 3.4: Estimates o the Composition o the Non-manual Group 1997-2007
Socio-Economic Group SLS 97+98 SLS 02+04 SLS06+07
% % %
Non-Manual 31.8 34.5 37.4
of which
Intermediate Non-manual 53.7 53.9 59.7
Other Non-manual 46.2 46.0 40.2
3.4 Income Leels and Grant EligibilityAssociated with the Non-ManualSocio-Economic GroupThis section now examines the extent to which resource dierences may account or class inequalities in accessto HE by considering the income leels associated with the non-manual socio-economic group. In doing so, we useSILC data to capture the income leels associated with each o the dierent socio-economic groups as measuredusing the European Socio-Economic Classication (ESeC). Income is an important consideration in any study oparticipation in HE gien that insucient resources may represent a key barrier to participation. In the Irish case,the HE Grant Scheme was established to proide support or students whose amily income would not otherwisebe sucient to support them through HE. While an exploration o the uptake o the HE Grant Scheme by thenon-manual group is delayed until Chapter 6, this chapter considers the income leels o socio-economic groupsand eligibility or the HE Grants scheme.
8/4/2019 BKMNEXT146
http://slidepdf.com/reader/full/bkmnext146 44/227
30
CHAPTER 3: SETTING THE CONTEXT: THE CHARACTERISTICS OF THE NON-MANUAL GROUP
As outlined in Table 3.1, SILC data uses the European Socio-Economic Classication (ESeC)10 and two ESeCcategories are o particular interest and releance to this study in dening the non-manual socio-economic group.These are the Intermediate Occupations and the Lower Serice, Sales and Clerical Occupations.
Intermediate Occupations
These are ‘higher grade white collar workers’. Positions in this class typically exist within bureaucratic structuresand share similar conditions to managers and administrators in terms o salaries, incremental scales and autonomywith regard to time. Typical occupations here include most clerical occupations and administratie assistants,occupations which inole working alongside managers and proessionals in ancillary roles. Oten these positionsinole employees in adhering to and carrying through bureaucratically dened rules with little in the way odiscretion but some emphasis on eciency.
Lower Services, Sales and Clerical Occupations
These are ‘lower grade white collar workers’. It is possible that the expansion and high degree o part-timeemployment in many occupations in this class has led to a worsening oer time o oerall employment contractscompared with Intermediate Occupations where many o these occupations might once hae been placed(e.g. retail assistants). Equally, there may be some positie employment relations’ eects o working in largeorganisations in the public and priate sectors. Typical occupations are shop workers (retail assistants) andcare workers.
Table 3.5 presents annual gross household income in 2006 or each indiidual aged 16-20 by socio-economic group.Gross household income is a useul indicator o class dierences in resources aailable to those indiiduals whoare close to college-going ages. In this analysis we are concerned with the relationship between class o origin andaailability o resources. Accordingly we conne the analysis to households with children, with at least one child
close to college-going age. This excludes households composed o working adults or o students. The ormer areexcluded because we are primarily interested in the resources aailable to young people o college-going age whoare nancially dependent upon their parents. Students recorded by the surey as resident in their own householdshae presumably already made the transition to HE by the time they are sureyed and we cannot relate theirhousehold income to their parental amily income. We use a broad age range in order to boost numberssupporting the analysis. Howeer, employing a narrower age range (e.g. 17-19) yields a ery similarincome distribution.
10 The ESeC is an occupationally based classication and the inormation needed to create ESec is occupation coded at the 3-digit leel o EUariant o the ISCO 1988, details o employment status, number o employees in a workplace and whether a worker is a superisor.

8/4/2019 BKMNEXT146
http://slidepdf.com/reader/full/bkmnext146 45/227
31
CHAPTER 3: SETTING THE CONTEXT: THE CHARACTERISTICS OF THE NON-MANUAL GROUP
Table 3.5: Gross Annual Household Income in 2006 o Individuals aged 16-20 by European Socio-economic
Classication
.
Mean StdDevia-
tion
Median N cases
€ € €
Proessionals, Administrators & Employers 116,768 79,896 99,340 276
Intermediate Employee 64,485 36,801 67,554 63
Small Employer & Sel-Employed 67,610 44,399 54,269 118
Low superisory & Technical / High Grade Blue Collar 85,212 48,659 76,428 52
Lower Serices, Sales and Clerical/ Lower White Collar 63,225 38,613 60,799 118
Low Technical/ Skilled Manual 66,323 38,467 54,837 61
Routine/ Semi & Unskilled Manual 52,733 37,965 49,241 183
TOTAL 78,267 59,835 65,739 871
Source: Special Analysis o 2007 SILC
We nd rom Table 3.5 that mean and median incomes or both Intermediate and Lower Serices, Sales andClerical (Lower White Collar Employees) (shaded rows in Table 3.5) are substantially lower than the nationalaerage and substantially lower than other white collar classes (the salariat, employers and the sel-employed) aswell as higher grade blue collar workers. Mean incomes o Intermediate Employees and o Lower Serices, Salesand Clerical (Lower White Collar Employees) occupy an intermediate position, lying somewhat below those oskilled manual workers but well aboe those o semi- and unskilled manual workers. Howeer, median incomes oboth Intermediate Employees and o Lower Serices, Sales and Clerical (Lower White Collar Employees) classes
exceed those o the manual groups, and indeed those o small employers and the sel employed. The comparisono mean and median incomes between the non-manual and manual groups suggest that a substantial proportion othe non-manual groups – in the lower income groups - had incomes that ell well below those o the manual groups.These data would suggest that young people rom Lower White Collar backgrounds ace similar economic barriersto participation in HE as their counterparts in the skilled manual class, but not as seere as those rom semi- andunskilled manual classes. Howeer, the top hal o the income distribution among Intermediate Employees andLower White Collar Employees lay aboe the median among manual workers, while among the lower incomequantiles, the income o non-manual groups ell well below that o the manual groups.
Income Levels and Higher Education Grants Scheme
How do these income leels relate to the HE Grants Scheme?11
Table 3.6 shows the distribution o income atarious cut-o points by ESeC. The important cut-o points are:Less than €37,365, corresponding to eligibility or a ull grant, including maintenance and registration ees in•
respect o a amily with less than 4 children;Less than €46,700, corresponding to eligibility or partial grant aid;•
More than €46,700 but less than the median income €64,845;•
Incomes below the median - less than 1.5 times and greater than 1.5 times the median.•
11 It should be noted that the incomes reported here do not match income measurement in the HE Grants scheme in two respects: (1) The GrantsScheme is based on parental + candidate income, while household income relates to total income o all household members – urther analysis willbe needed to align the dierent income units (2) Gross income reported here includes a number o income categories that are not included incalculating grant eligibility (e.g. Child Benet, Family Income Supplement, Carers Allowance etc.).

8/4/2019 BKMNEXT146
http://slidepdf.com/reader/full/bkmnext146 46/227
32
CHAPTER 3: SETTING THE CONTEXT: THE CHARACTERISTICS OF THE NON-MANUAL GROUP
Table 3.6: Distribution o Gross Household Income (2006) by Grant Eligibility and Median Income by European
Socio-economic Classication
Full
Grant
<€37,365
Part
Grant
<€46,700
< Median
(€64,845)
Median to
1.5*
Median
>
1.5*
Median
N o
Cases
% % % % % %
Proessionals, Administrators& Employers
9.2 3.6 9.1 26.5 51.6 100.0 276
Intermediate Employee 37.9 1.5 8.2 33.5 18.9 100.0 63
Small Employer & Sel-Employed
20.5 1.9 33.2 26.4 18.0 100.0 118
Low superisory & Tech/
High Grade Blue Collar 11.6 19.3 9.6 31.0 28.5 100.0 52
Lower Serices, Sales andClerical/ Lower White Collar
36.1 8.1 15.0 29.5 11.2 100.0 118
Low Tech/ Skilled Manual 26.2 8.6 26.7 19.7 18.9 100.0 61
Routine/ Semi & Unskilled 38.1 9.8 25.8 16.2 10.1 100.0 183
TOTAL 24.2 6.3 18.9 25.2 25.4 100.0 871
Source: Special Analysis o 2007 SILCNote: Asterisks denotes multiplication
In relation to grant eligibility, Table 3.6 shows:•Atthelowerendoftheincomedistribution,about38percentofchildrenfromIntermediateEmployee
Backgrounds, and about 36 per cent o those rom Lower White Collar Backgrounds would be eligible orull grant aid.
•Thesetwonon-manualgroupsaresimilarinfull-granteligibilitytosemi-andunskilledmanualclasses.
•8percentoftheLowerWhiteCollarclass,butonly1.5percentoftheIntermediateEmployeeclassare
eligible or partial grant aid – compared to 10 per cent o those rom Routine (semi- and unskilled) Manual classbackgrounds.•8percentoftheIntermediateEmployeeclass,and15percentofthosefromLowerWhiteCollarhavehousehold
income in excess o grant eligibility but below the median income o €64,845. This may be a group whose incomes
exceed grant eligibility but whose amily income is nonetheless insucient to support participation in HE. Theproportion o both these non-manual groups in this income band is substantially smaller than the manual classes.•Over30percentoftheIntermediateemployeegroupandtheLowerWhiteCollargroupareintheincome
band between median and 1.5 times the median (€64,845-€97,267). This is higher than the oerall aerage andsubstantially higher than the manual groups, the shares in respect o both o which all below 20 per cent.•Only11percentoftheLowerWhiteCollarGroupand19percentoftheIntermediateEmployeegrouphave
incomes greater than 1.5 times the median (€97,267), a group that should hae sucient resources to nanceparticipation in HE. In this respect the lower white-collar group are ery similar to the semi- and unskilledmanual group.
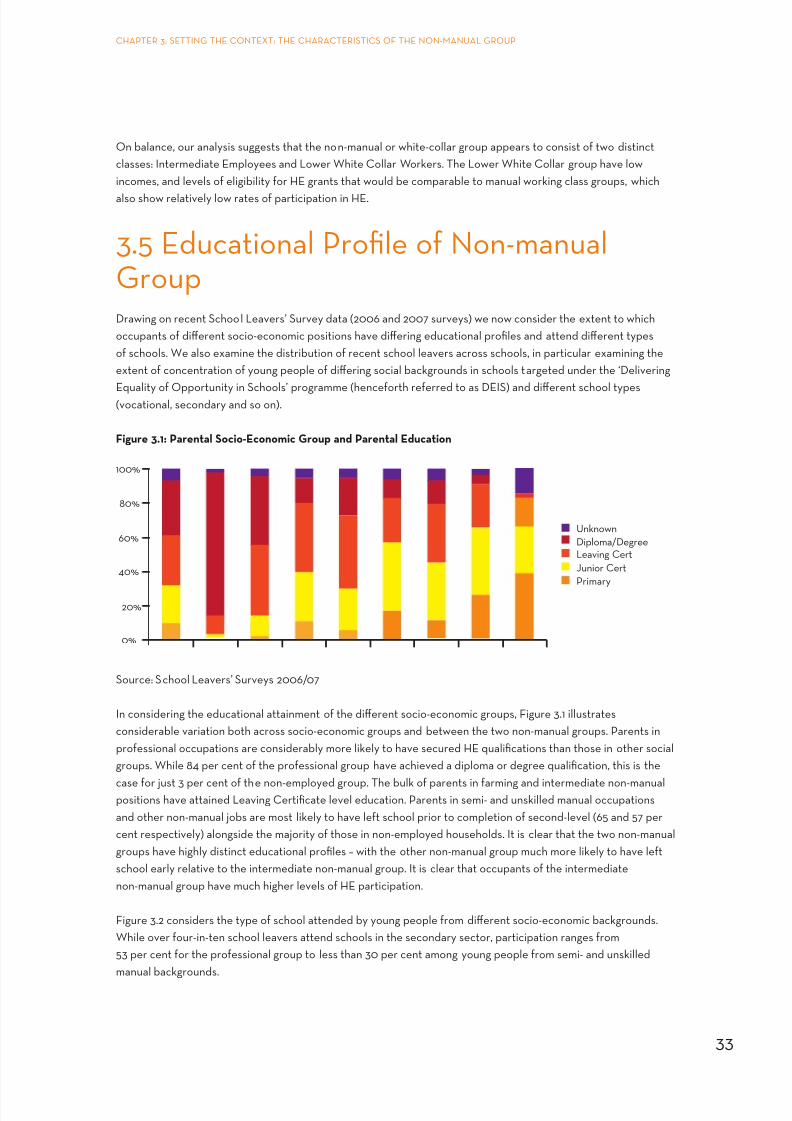
8/4/2019 BKMNEXT146
http://slidepdf.com/reader/full/bkmnext146 47/227
33
CHAPTER 3: SETTING THE CONTEXT: THE CHARACTERISTICS OF THE NON-MANUAL GROUP
On balance, our analysis suggests that the non-manual or white-collar group appears to consist o two distinctclasses: Intermediate Employees and Lower White Collar Workers. The Lower White Collar group hae lowincomes, and leels o eligibility or HE grants that would be comparable to manual working class groups, which
also show relatiely low rates o participation in HE.
3.5 Educational Prole o Non-manualGroupDrawing on recent School Leaers’ Surey data (2006 and 2007 sureys) we now consider the extent to whichoccupants o dierent socio-economic positions hae diering educational proles and attend dierent typeso schools. We also examine the distribution o recent school leaers across schools, in particular examining theextent o concentration o young people o diering social backgrounds in schools targeted under the ‘Deliering
Equality o Opportunity in Schools’ programme (henceorth reerred to as DEIS) and dierent school types(ocational, secondary and so on).
Figure 3.1: Parental Socio-Economic Group and Parental Education
20%
0%
40%
60%
80%
100%
Unknown
Diploma/DegreeLeaving Cert
Junior Cert
Primary
Source: School Leaers’ Sureys 2006/07
In considering the educational attainment o the dierent socio-economic groups, Figure 3.1 illustratesconsiderable ariation both across socio-economic groups and between the two non-manual groups. Parents inproessional occupations are considerably more likely to hae secured HE qualications than those in other socialgroups. While 84 per cent o the proessional group hae achieed a diploma or degree qualication, this is the
case or just 3 per cent o the non-employed group. The bulk o parents in arming and intermediate non-manualpositions hae attained Leaing Certicate leel education. Parents in semi- and unskilled manual occupationsand other non-manual jobs are most likely to hae let school prior to completion o second-leel (65 and 57 percent respectiely) alongside the majority o those in non-employed households. It is clear that the two non-manualgroups hae highly distinct educational proles – with the other non-manual group much more likely to hae letschool early relatie to the intermediate non-manual group. It is clear that occupants o the intermediatenon-manual group hae much higher leels o HE participation.
Figure 3.2 considers the type o school attended by young people rom dierent socio-economic backgrounds.While oer our-in-ten school leaers attend schools in the secondary sector, participation ranges rom53 per cent or the proessional group to less than 30 per cent among young people rom semi- and unskilledmanual backgrounds.
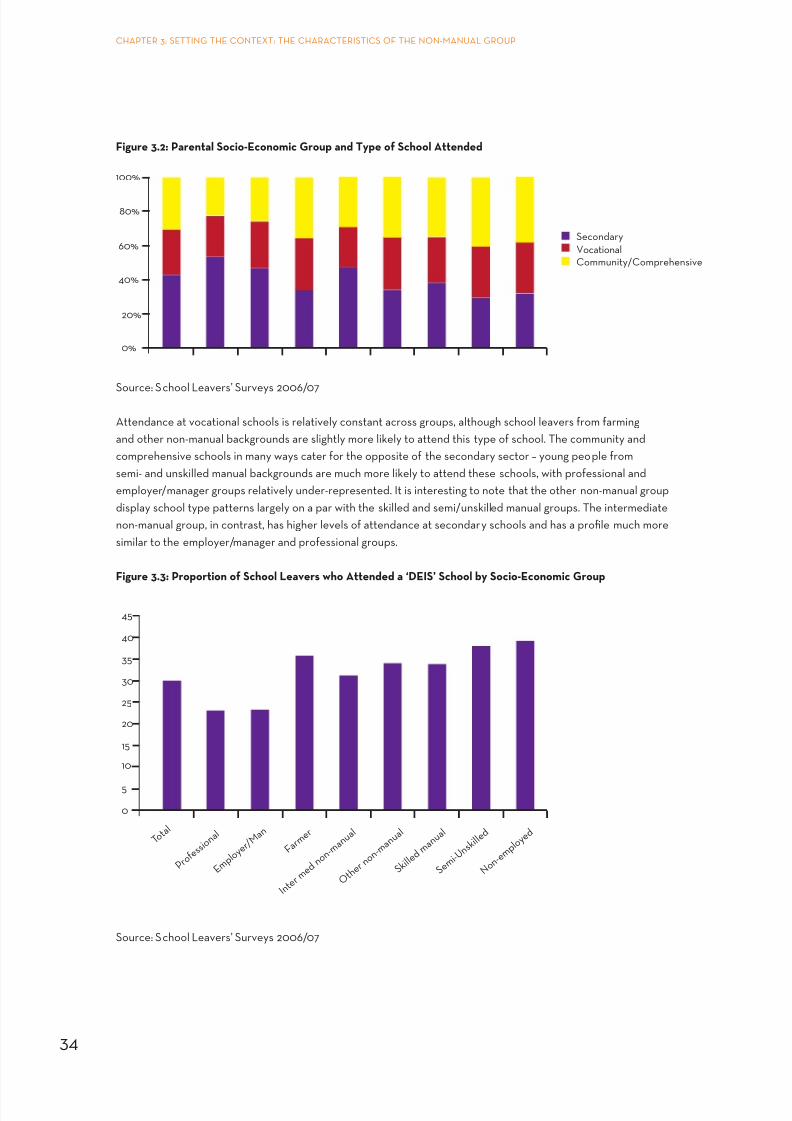
8/4/2019 BKMNEXT146
http://slidepdf.com/reader/full/bkmnext146 48/227
34
CHAPTER 3: SETTING THE CONTEXT: THE CHARACTERISTICS OF THE NON-MANUAL GROUP
Figure 3.2: Parental Socio-Economic Group and Type o School Attended
20%
0%
40%
60%
80%
100%
Secondary
VocationalCommunity/Comprehensive
Source: School Leaers’ Sureys 2006/07
Attendance at ocational schools is relatiely constant across groups, although school leaers rom armingand other non-manual backgrounds are slightly more likely to attend this type o school. The community andcomprehensie schools in many ways cater or the opposite o the secondary sector – young people romsemi- and unskilled manual backgrounds are much more likely to attend these schools, with proessional andemployer/manager groups relatiely under-represented. It is interesting to note that the other non-manual groupdisplay school type patterns largely on a par with the skilled and semi/unskilled manual groups. The intermediatenon-manual group, in contrast, has higher leels o attendance at secondary schools and has a prole much moresimilar to the employer/manager and proessional groups.
Figure 3.3: Proportion o School Leavers who Attended a ‘DEIS’ School by Socio-Economic Group
0
5
10
15
20
25
30
35
40
45
T o t a l
P r o f e s s i o n a l
E m p l o y e r / M a n
F a r m e r
I n t e r m e d n o n - m a n u a l
O t h e r n o n - m a n u a l
S k i l l e d m a n u a l
S e m i - U n s k i l l e d
N o n - e m p l o y e d
Source: School Leaers’ Sureys 2006/07

8/4/2019 BKMNEXT146
http://slidepdf.com/reader/full/bkmnext146 49/227
35
CHAPTER 3: SETTING THE CONTEXT: THE CHARACTERISTICS OF THE NON-MANUAL GROUP
O the total, nationally representatie population o leaers rom second-leel schools (both early school leaersand those who completed second-leel), three-in-ten attended a DEIS school (Figure 3.3). Gien the nature o theDEIS programme, it is not surprising to nd ariation across groups: participation leels range rom 23 per cent
o young people rom proessional backgrounds to nearly 40 per cent o young people where neither parent isin employment. Gien that the DEIS programme is one o the main policy mechanisms addressing educationaldisadantage at second-leel and promoting access at HE, it is o some concern that 60 per cent o young peoplerom non-employed backgrounds do not attend a DEIS school, alongside 62 per cent o young people romsemi- and unskilled manual backgrounds. The intermediate and other non-manual groups do not dierwidely – 31 per cent o school leaers rom the ormer group and 34 per cent o the latter attended DEIS schools.This leaes the majority o young people rom these backgrounds outside o schools currently targeted orparticular attention at both second leel and HE.
3.6 Educational Experiences othe Non-manual GroupThis section now changes direction and directs attention on the sub-group o the population who enter HE andconsiders the nature o socio-economic patterns in access to HE oerall and access to dierent courses (sectorand course leel). In terms o the characteristics o new entrants to HE in 2004, the analysis is predominantlyocused on comparing the position o those rom the aggregate non-manual socio-economic backgrounds withthose rom other social backgrounds12 . This section draws on data rom the New Entrants’ Surey to consider theage and school characteristics o those attending college or the rst time in 2004, as well as the type o institutionattended, the leel o course taken and whether the student is in receipt o a grant.
Second-Level Educational ExperiencesIn terms o the age prole o college entrants, those rom non-manual backgrounds are not particularly distinct(Figure 3.4). Oerall, 87 per cent o new entrants all within the ‘traditional’ 16-19 age bracket, with non-manualentrants not deiating rom the aerage. The only noteworthy dierence is among those rom manual backgrounds,where students are more likely to be older (25 years or more).
12 As discussed in Section 3.2, gien the dierent socio-economic classication used in the New Entrants Surey (2004), it is not possible todierentiate sub-groups within the non-manual category in this analysis.
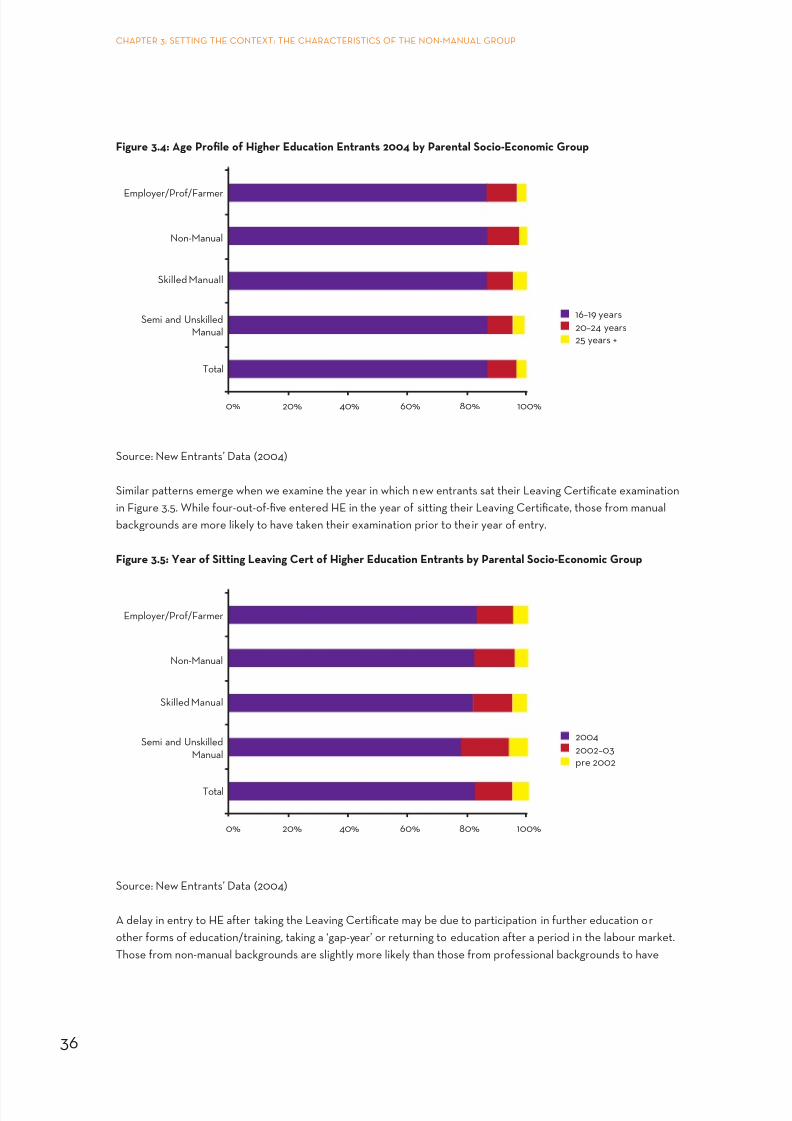
8/4/2019 BKMNEXT146
http://slidepdf.com/reader/full/bkmnext146 50/227
36
CHAPTER 3: SETTING THE CONTEXT: THE CHARACTERISTICS OF THE NON-MANUAL GROUP
Figure 3.4: Age Prole o Higher Education Entrants 2004 by Parental Socio-Economic Group
16–19 years
20–24 years25 years +
Total
Semi and UnskilledManual
Skilled Manuall
Non-Manual
Employer/Prof/Farmer
0% 20% 40% 60% 80% 100%
Source: New Entrants’ Data (2004)
Similar patterns emerge when we examine the year in which new entrants sat their Leaing Certicate examinationin Figure 3.5. While our-out-o-e entered HE in the year o sitting their Leaing Certicate, those rom manualbackgrounds are more likely to hae taken their examination prior to their year o entry.
Figure 3.5: Year o Sitting Leaving Cert o Higher Education Entrants by Parental Socio-Economic Group
2004
2002–03pre 2002
Total
Semi and Unskilled
Manual
Skilled Manual
Non-Manual
Employer/Prof/Farmer
0% 20% 40% 60% 80% 100%
Source: New Entrants’ Data (2004)
A delay in entry to HE ater taking the Leaing Certicate may be due to participation in urther education orother orms o education/training, taking a ‘gap-year’ or returning to education ater a period in the labour market.Those rom non-manual backgrounds are slightly more likely than those rom proessional backgrounds to hae

8/4/2019 BKMNEXT146
http://slidepdf.com/reader/full/bkmnext146 51/227
37
CHAPTER 3: SETTING THE CONTEXT: THE CHARACTERISTICS OF THE NON-MANUAL GROUP
delayed entry to college or a year or two, but the dierence is small. Chapter 7, drawing on School Leaers’ Sureydata, will examine the extent to which this dierence may be explained by dierent rates o participation in urthereducation or those rom non-manual backgrounds.
When we consider the school background o HE entrants, important dierences emerge across socio-economicgroups. First, we examine whether the college entrant attended a school targeted under the DEIS programme.In total, 12 per cent o new entrants came rom such a DEIS school. Clear dierences emerge across age-groups,with younger entrants (16-17 years) and those aged 20-24 years more likely to hae attended schools which now allwithin the DEIS classication (Figure 3.6). It is interesting to note that those aged 18 and 19 years are least likely tohae attended a school now targeted under DEIS, as are those oer the age o 25 years, although this latter resultshould be interpreted with caution gien the small numbers who are aged 25 years or older.
Figure 3.6: Proportion o New Entrants who Attended a ‘DEIS’ School
Designated Disadvantaged
Non Disadvantaged
16–17yrs
18 yrs
19 yrs
20–24 yrs
25+ yrs
0% 20% 40% 60% 80% 100%
Source: New Entrants’ Data (2004)

8/4/2019 BKMNEXT146
http://slidepdf.com/reader/full/bkmnext146 52/227
38
CHAPTER 3: SETTING THE CONTEXT: THE CHARACTERISTICS OF THE NON-MANUAL GROUP
Figure 3.7: Proportion who Attended a ‘DEIS’ School by Parental Socio-Economic Group
Non Disadvantaged
Designated Disadvantaged
0% 20% 40% 60% 80% 100%
Total
Semi and UnskilledManual
Skilled Manual
Non-Manual
Employer/Prof/Farmer
Source: New Entrants’ Data (2004)
Figure 3.7 examines the proportions o new entrants who attended DEIS schools or each socio-economic group.While one-in-our students rom manual backgrounds attended such a school, just 15 per cent o those romnon-manual backgrounds similarly attended a DEIS school. Across all socio-economic groups, male new entrantsare more likely to hae attended a DEIS school than emales.
Higher Education Experiences
When we consider the types o institution attended by new entrants and the leel o course taken, dierencesacross social groups are more marked (Figures 3.8 and 3.9). In terms o college type, the pattern or students onon-manual background largely mirrors the oerall total breakdown o students across dierent types o colleges.Almost hal o new entrants rom non-manual backgrounds attend colleges in the Uniersity sector, with 44 percent attending Institutes o Technology. Just 4 per cent attend Colleges o Education and the remaining 3 per centattending Other Colleges. These patterns can be compared to higher leels o representation in the Uniersitysector among those rom proessional backgrounds and considerably higher leels o participation in Institutes oTechnology among those rom manual backgrounds.
In terms o leel o study, just under two-thirds o students rom non-manual backgrounds are pursuing Leel 8(Honours Degree) courses, with 10 per cent taking Leel 7 (Ordinary Degree) and one-quarter registered or aLeel 6 (Higher Certicate) course o study. Once again, the non-manual group occupies an intermediate positionwith those rom proessional backgrounds considerably more likely to be enrolled on Leel 8 courses (nearlythree-quarters), while those rom manual, particularly semi- and unskilled manual backgrounds, are more likely tobe pursuing Leel 7 and, most notably, Leel 6 courses. Hence, while the prole o new entrants to HE has becomemore dierse oer time, patterns o dierentiation among those who succeed in gaining entry to HE by collegetype and course leel remain prominent.

8/4/2019 BKMNEXT146
http://slidepdf.com/reader/full/bkmnext146 53/227
39
CHAPTER 3: SETTING THE CONTEXT: THE CHARACTERISTICS OF THE NON-MANUAL GROUP
Figure 3.8: Institution Attended by Parental Socio-Economic Group
IOT
College of Ed
Other
University
0% 20% 40% 60% 80% 100%
Total
Semi and UnskilledManual
Skilled Manual
Non-Manual
Employer/Prof/Farmer
Source: New Entrants’ Data (2004)
Figure 3.9: Course Level by Parental Socio-Economic Group
Level 7
Level 8
Level 6
0% 10% 30% 50% 70% 90%20% 40% 60% 80% 100%
Total
Semi and Unskilled
Manual
Skilled Manual
Non-Manual
Employer/Prof/Farmer
Source: New Entrants’ Data (2004)
Finally, the extent to which college entrants were in receipt o nancial support in the orm o a ‘registration grant’(i.e. exempt rom the college registration charge/student serice ee) aries greatly across socio-economic groups,in line with criteria or eligibility or nancial support. As displayed in Figure 3.10, while oerall 27 per cent o 2004new entrants were in receipt o nancial support, indiiduals rom non-manual backgrounds were less likely to bein receipt o support with less than one-quarter receiing such a registration grant. Hal o new entrants romsemi- and unskilled manual backgrounds were receiing nancial support, while those rom skilled manual

8/4/2019 BKMNEXT146
http://slidepdf.com/reader/full/bkmnext146 54/227
40
CHAPTER 3: SETTING THE CONTEXT: THE CHARACTERISTICS OF THE NON-MANUAL GROUP
backgrounds were just below this, with 43 per cent in receipt o support. The next section urther considers theissue o eligibility or state support, examining the aerage income leels o dierent socio-economic groups.
Figure 3.10: Percentage in Receipt o Grant by Parental Socio-Economic Group
0% 10% 30% 50%20% 40% 60%
Total
Semi and Unskilled
Manual
Skilled Manual
Non-Manual
Employer/Prof/Farmer
Source: New Entrants’ Data (2004)
It is interesting to note that receipt o nancial support is also strongly related to whether the student hadattended a school targeted under the DEIS programme, een when we consider the social background o that
indiidual (Figure 3.11).
Figure 3.11: Percentage in Receipt o Grant by Whether Attended School Categorised as ‘DEIS’
0% 10% 30% 50%20% 40% 60% 70%
Total
Semi and Unskilled
Manual
Skilled Manual
Non-Manual
Employer/Prof/Farmer
Non-Deis
DEIS
Source: New Entrants’ Data (2004)

8/4/2019 BKMNEXT146
http://slidepdf.com/reader/full/bkmnext146 55/227
41
CHAPTER 3: SETTING THE CONTEXT: THE CHARACTERISTICS OF THE NON-MANUAL GROUP
Across all social groups, indiiduals who attended DEIS schools were more likely to receie nancial support thanthose who attended schools not targeted under the initiatie. Among students rom non-manual backgrounds, 36per cent o those who attended DEIS schools were in receipt o nancial support relatie to just one-th o those
rom schools not targeted under the DEIS programme.
3.7 SummaryThis chapter has set out to proide a context or the remainder o the report by presenting an oeriew o thenon-manual group in terms o its size and composition, and to consider the characteristics o the non-manualgroup in terms o income and education leels, eligibility or grant receipt and educational experiences atsecond-leel and HE in terms o the types o institutions that they attend.
The chapter began by proiding an oeriew o the complexity o classiying the non-manual group into two
distinct groups (intermediate non-manual and other non-manual) using the aailable data sources. In doing so,it proided an oeriew o the importance o considering socio-economic position when aced with the issue osocial inequalities and the stratication o lie chances.
The non-manual group represents approximately 20 per cent o the population and is clearly comprised o twodistinct sub-groups, intermediate non-manual and other non-manual. The non-manual group are largely comprisedo the intermediate non-manual group, with a ratio o approximately 60:40 between the intermediate andother non-manual groups. Despite being categorised as one non-manual group in more recent socio-economicclassications, we nd that these two non-manual groups hae distinct occupational proles, with the intermediategroup comprising a number o relatiely high status positions while in contrast the other non-manual group isdominated by lower leel serice workers. Despite the changes that hae occurred oer time in socio-economicclassications, these distinctions with the non-manual group clearly persist. In act, we posit that there has
been less occupational mobility oer time or those engaged in other non-manual positions relatie to those inintermediate non-manual positions. It is likely that remaining occupations that hae been classied as othernon-manual hae experienced a worsening o their position oer time, particularly in terms o working conditions.Much o this chapter has been dedicated to proling the non-manual groups, in terms o their income leels(and thus eligibility or nancial aid through the grant system), education leels and educational experiences.It is clear that across a range o educational and economic characteristics, occupants o the other non-manualgroup share many similarities with lower manual groups. Analysis o income data rom the 2007 SILC allowedus to compare the aerage income leels o these groups and we ound that lower white collar groups, whichoerlap considerably with the other non-manual group, display income patterns and grant eligibility leels largelycomparable to semi- and unskilled manual groups. The other non-manual group is also much more similar in proleto the semi- and unskilled manual groups in terms o their educational attainment and representation o HE
graduates among the group. Those representing the intermediate non-manual category are themseles much morelikely to hae attended HE, which one would expect will hae implications or the numbers o children o suchworkers who similarly progress to HE. There are also dierences between these two groups in terms o the typeso schools attended among their children.
Oerall, in proling the non-manual socio-economic group, we hae identied clear disparities betweenthe intermediate and other non-manual groups. It is clear that across a range o educational and economiccharacteristics, occupants o the other non-manual group share many similarities with lower manual groups.The next chapter considers patterns o attainment at second-leel education as a prerequisite or entry into HE.Based on the ndings presented here, one might expect that the other non-manual group will reect patternscomparable with lower manual groups rather than the intermediate non-manual group, although greater policyconcern with the latter manual groups may hae impacted on this.

8/4/2019 BKMNEXT146
http://slidepdf.com/reader/full/bkmnext146 56/227
42
CHAPTER 3: SETTING THE CONTEXT: THE CHARACTERISTICS OF THE NON-MANUAL GROUP

8/4/2019 BKMNEXT146
http://slidepdf.com/reader/full/bkmnext146 57/227
43
CHAPTER4: STATE SUPPORT
CHAPTER 4 Equal Chances of Entry intoHigher Education? Patterns of Attainment at Second-Level among Socio-Economic Groups

8/4/2019 BKMNEXT146
http://slidepdf.com/reader/full/bkmnext146 58/227
44
CHAPTER 4: EQUAL CHANCES OF ENTRY INTO HIGHER EDUCATION?
PATTERNS OF ATTAINMENT AT SECOND-LEvEL AMONG SOCIO-ECONOMIC GROUPS
4.1: IntroductionThis chapter examines the second-leel experiences o school leaers oer the last decade, exploring their
educational attainment, the type o Leaing Cert programme taken and perormance in the Leaing Certicateexamination; perormance which is strongly associated with entry into HE gien the numerus clausus systemoperating. It ocuses particularly on gender and socio-economic background which both hae a strong impact onattainment at second-leel education. The chapter outlines the patterns o educational attainment atsecond-leel among school leaers oer time, and then considers the relatie chances o each socio-economicgroup in terms o second-leel attainment using multiariate analyses. The multiariate analyses are explained inthe ollowing section.
4.2 Multiariate AnalysesMultiariate analyses are employed to generate a statistical model o the obsered actors that inuenceattainment at second-leel education. Specically the actors considered are gender, socio-economic background,the local area that a person lies in and the type o school attended. While the ull statistical models are presentedin Appendix D, tables and gures are presented throughout the chapter which summarise the statistical models.
There is an issue o statistical principle regarding the presentation o the data that ollows. Social disadantageamong young people attending second-leel education can be dened and measured in arious ways. The sureyasked respondents about parental employment situation, parental occupation and parental education leels andthe surey could identiy the type o school that the respondent attended, whether it was a secondary, community,comprehensie or ocational school and i the school has been assigned a DEIS13 status. Each o these actors areknown to exert some degree o adantage/disadantage. In the data, these ariables are all correlated with eachother to some degree. That is, on aerage, respondents whose parents are o higher socio-economic backgrounds
tend to be more highly qualied. When handling data o this type, with signicant correlations between similarariables, there is a danger o presenting spurious ndings. Decisions about which relationships to highlight inthe charts and tables that ollow are inormed by the multiariate analysis. To aoid this problem, the data wereanalysed with appropriate multiariate methods, details o which are proided in Appendix D. For the ast majorityo models presented, the reerence case is a male rom a semi-unskilled manual background, rom Dublin, whoseparents hae primary leel education, who attended a community/comprehensie school with disadantaged(DEIS) status. When changes are made to the reerence case (due to small numbers) this is stated in the text.The regression coecient (β), standard error and odds ratio (exp(β)) are gien, together with an indication ostatistical signicance.
When appropriate, the graphs present parental socio-economic background using the ollowing eight category
classication distinguishing between the intermediate non-manual group and the other non-manual groups, basedon the 1986 Census Classication o Occupations:Farmer/Other Agricultural;•
Proessional Higher and Lower;•
Employer/Manager;•
Intermediate Non-Manual;•
Other Non-Manual;•
Skilled Manual;•
Semi and Unskilled Manual;•
Non-Employed.•
13 A DEIS school is a school deemed to hae a high concentration o students rom disadantaged backgrounds and thereby receies additionalunding under the DEIS programme.

8/4/2019 BKMNEXT146
http://slidepdf.com/reader/full/bkmnext146 59/227
45
CHAPTER 4: EQUAL CHANCES OF ENTRY INTO HIGHER EDUCATION?
PATTERNS OF ATTAINMENT AT SECOND-LEvEL AMONG SOCIO-ECONOMIC GROUPS
4.3 Second-Leel Retention and
Progression 4.3.1 Second Level Retention
Figure 4.1 shows that second-leel retention rates oer the decade between the late 1990s and mid/late 2000sremained relatiely stable between 80 and 82 per cent. Gender dierentials are eident and persistent, withemales being signicantly more likely to remain in school and complete their Leaing Certicate (or equialent)than males. In 2006/07, a total o 80 per cent o males completed their second-leel schooling, relatie to88 per cent o emales14 .
Figure 4.1: Percentage o School Leavers who completed the Leaving Certicate (or equivalent)
0
10
20
30
40
50
60
70
80
90
100
1997
2002/2004
2006/2007
Total Males Females
Second-leel retention patterns are also highly dierentiated according to socio-economic background. Figure4.2 displays such retention leels according to parental socio-economic group, using the ‘parental dominance’measure, which takes highest parental socio-economic group as an indicator o social background. Correspondingtables using ather’s socio-economic group can be ound in Appendix C. In line with earlier studies (see, or
example O’Connell et al ., 2006a), retention rates are signicantly higher among proessional and employer-manager groups.
Gien that our ocus is on those rom non-manual backgrounds, it is interesting to note considerable ariation inretention patterns between those rom ‘intermediate non-manual’ backgrounds and the ‘other non-manual’ group.In this respect, what is particularly eident rom Figure 4.2, is that while oerall national retention leels haeremained largely constant oer this 10-year period, young people rom manual and non-manual backgrounds showsome improement in their second-leel completion rates. We now nd that the retention rates o young peoplerom an intermediate non-manual background remain relatiely persistent at around 85 per cent oer time and aresubstantially higher than or those rom other non-manual backgrounds. Howeer, some improement is eident
14 Each o the graphs presented in this chapter hae an accompanying table in Appendix C.

8/4/2019 BKMNEXT146
http://slidepdf.com/reader/full/bkmnext146 60/227
46
CHAPTER 4: EQUAL CHANCES OF ENTRY INTO HIGHER EDUCATION?
PATTERNS OF ATTAINMENT AT SECOND-LEvEL AMONG SOCIO-ECONOMIC GROUPS
among those rom other non-manual backgrounds when this denition is taken into account (parental socio-economic group) with retention rates increasing rom 73 to 77 per cent oer the period. Furthermore, using bothmeasures o socio-economic background, we nd that young people rom non-employed households hae the
lowest leels o retention (See Table 2 in Appendix C).
Figure 4.2: Percentage o School Leavers who completed the Leaving Certicate by Parental Socio-Economic
Group
0
10
20
30
40
50
60
70
80
90
100
1997/98
2002/20042006/2007Average
Farm/OtherAgricultural
Professional Employer/Manager
IntermediateNon-Manual
OtherNon-Manual
Skilled Manual Semi-andUnskilledManual
Non employed
Figure 4.3 displays regional ariation in retention leels oer the period. What is particularly eident is thatretention has astly improed in some regions (Dublin and the Border counties) while retention has decreasedamong those in other regions (Midlands). Howeer recent data rom the School Leaers’ Sureys 2006 and 2007suggest that current retention leels show much less ariation across regions and range between 80 and86 per cent across regions.
31
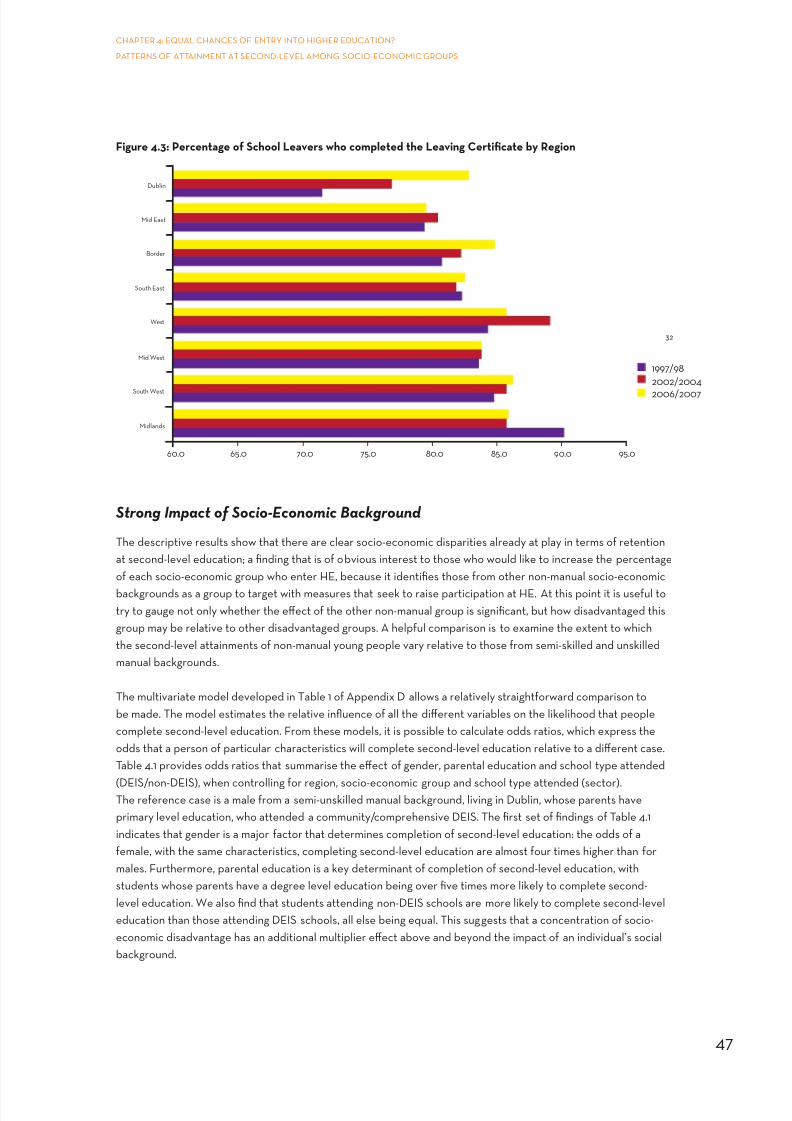
8/4/2019 BKMNEXT146
http://slidepdf.com/reader/full/bkmnext146 61/227
47
CHAPTER 4: EQUAL CHANCES OF ENTRY INTO HIGHER EDUCATION?
PATTERNS OF ATTAINMENT AT SECOND-LEvEL AMONG SOCIO-ECONOMIC GROUPS
Figure 4.3: Percentage o School Leavers who completed the Leaving Certicate by Region
60.0 65.0 70.0 75.0 80.0 85.0 90.0 95.0
1997/98
2002/2004
2006/2007
Midlands
South West
Mid West
South East
Border
Mid East
Dublin
West
Strong Impact o Socio-Economic Background
The descriptie results show that there are clear socio-economic disparities already at play in terms o retentionat second-leel education; a nding that is o obious interest to those who would like to increase the percentageo each socio-economic group who enter HE, because it identies those rom other non-manual socio-economic
backgrounds as a group to target with measures that seek to raise participation at HE. At this point it is useul totry to gauge not only whether the eect o the other non-manual group is signicant, but how disadantaged thisgroup may be relatie to other disadantaged groups. A helpul comparison is to examine the extent to whichthe second-leel attainments o non-manual young people ary relatie to those rom semi-skilled and unskilledmanual backgrounds.
The multiariate model deeloped in Table 1 o Appendix D allows a relatiely straightorward comparison tobe made. The model estimates the relatie inuence o all the dierent ariables on the likelihood that peoplecomplete second-leel education. From these models, it is possible to calculate odds ratios, which express theodds that a person o particular characteristics will complete second-leel education relatie to a dierent case.Table 4.1 proides odds ratios that summarise the eect o gender, parental education and school type attended
(DEIS/non-DEIS), when controlling or region, socio-economic group and school type attended (sector).The reerence case is a male rom a semi-unskilled manual background, liing in Dublin, whose parents haeprimary leel education, who attended a community/comprehensie DEIS. The rst set o ndings o Table 4.1indicates that gender is a major actor that determines completion o second-leel education: the odds o aemale, with the same characteristics, completing second-leel education are almost our times higher than ormales. Furthermore, parental education is a key determinant o completion o second-leel education, withstudents whose parents hae a degree leel education being oer e times more likely to complete second-leel education. We also nd that students attending non-DEIS schools are more likely to complete second-leeleducation than those attending DEIS schools, all else being equal. This suggests that a concentration o socio-economic disadantage has an additional multiplier eect aboe and beyond the impact o an indiidual’s socialbackground.
32

8/4/2019 BKMNEXT146
http://slidepdf.com/reader/full/bkmnext146 62/227
48
CHAPTER 4: EQUAL CHANCES OF ENTRY INTO HIGHER EDUCATION?
PATTERNS OF ATTAINMENT AT SECOND-LEvEL AMONG SOCIO-ECONOMIC GROUPS
Table 4.1: Odds Ratios or Second-Level Attainment
Completing
Second Level
Transition rom
junior cycle tosenior cycle
Male 1.00 1.00
Female 3.70 3.17
Primary or Less 1.00 1.00
Junior Certicate 2.43 2.53
Leaing Certicate or Equialent 4.51 4.65
Diploma 5.27 5.42
Degree 5.33 5.39
Non DEIS school 1.63 1.70
DEIS school 1.00 1.00
The odds ratios presented in Table 4.1 are an indication o the inuence o gender, parental education andschool type on completion o second-leel education. This proides a ready comparison or the impact o socio-economic background, which is illustrated in Figure 4.4. The reerence case is still a male rom a semi-unskilledmanual background, liing in Dublin, whose parents hae primary leel education, who attended a community/comprehensie DEIS school. We now see how students rom higher socio-economic backgrounds hae higherodds o completing second-leel education: nearly two and a hal times or a person rom a proessionalbackground, almost two-old or a person rom a arming or employer/manager background and oer one and a
hal times or a person rom an intermediate non-manual background. The oerall ndings suggest that the chanceso completing second-leel education do not ary signicantly among those rom other non-manual backgrounds,skilled manual backgrounds or semi-skilled manual backgrounds. Furthermore, interaction eects (shown in Table 1in Appendix D) tell us that social class moderates the eect o gender.
Figure 4.4: Odds Ratios or Completion o Second-Level Education
-1.000
-0.500
-0.000
-0.500
1.000
1.500
2.000
3.000
3.500
Professional Employer/Manager Farmer/OtherAgriculture
IntermediateNon Manual
Other Non Manual Skilled Manual Ref: Semi SkilledManual
2.500
Non Employed

8/4/2019 BKMNEXT146
http://slidepdf.com/reader/full/bkmnext146 63/227
49
CHAPTER 4: EQUAL CHANCES OF ENTRY INTO HIGHER EDUCATION?
PATTERNS OF ATTAINMENT AT SECOND-LEvEL AMONG SOCIO-ECONOMIC GROUPS
4.3.2 The Transition rom Junior to Senior Cycle
The multiariate model deeloped in Table 2 o Appendix D estimates the relatie inuence o all the dierentariables on the likelihood that people make the transition rom junior cycle to senior cycle. Again, rom the model
it is possible to calculate odds ratios which express the odds that a person will make the transition rom juniorcycle to senior cycle. The second column o Table 4.1 proides the odds ratios that summarize the eect o gender,parental education and school type when accounting or all ariables and interaction terms in the model. Again,we nd that gender is a major determinant as we see that the odds o a emale making the transition rom juniorcycle to senior cycle are almost our times higher. Furthermore, parental education is a key determinant withpeople whose parents hae degree leel education haing odds o six times higher than a person with the samecharacteristics whose parents hae primary leel education. The type o school is also important, with personswho attend a non-DEIS school haing a greater probability o making the transition rom junior cycle to seniorcycle than those attending a DEIS school. Figure 4.5 illustrates socio-economic dierences in the odds o makingthe transition rom junior cycle to senior cycle, controlling or all ariables in the model.
Figure 4.5: Odds Ratios or Making the Transition rom Junior Cycle to Senior Cycle
0.0
0.5
1.0
1.5
2.0
2.5
Higher LowerProfessional
Employer/Manager Farmer/OtherAgriculture
IntermediateNon Manual
Other Non Manual Skilled Manual Semi UnskilledManual
Non Employed
We see again how students rom higher socio-economic backgrounds hae higher odds o making the transitionrom junior cycle to senior cycle: oer two-old or those rom proessional backgrounds, almost two times ora person rom a arming background and one-and-a-hal times or a person rom an intermediate non-manualbackground. We clearly see that the odds o making the transition rom junior cycle to senior cycle or the othernon-manual group are similar to those rom the skilled/semi-skilled or unskilled manual group15 .
15 The oerall ndings suggest that the chances o making the transition rom junior cycle to senior cycle do not ary signicantly among those romother non-manual backgrounds, skilled manual backgrounds or semi-skilled manual backgrounds (See Table 2a in Appendix D).

8/4/2019 BKMNEXT146
http://slidepdf.com/reader/full/bkmnext146 64/227
50
CHAPTER 4: EQUAL CHANCES OF ENTRY INTO HIGHER EDUCATION?
PATTERNS OF ATTAINMENT AT SECOND-LEvEL AMONG SOCIO-ECONOMIC GROUPS
4.4 Leaing Certicate Programme TypeFigure 4.6 illustrates the type o Leaing Certicate programme pursued by school leaers oer the period
2002/04 – 2006/07. Increased dierentiation at senior cycle has resulted in a decline in the share o school leaerscompleting the established Leaing Certicate programme. While an increase in the share o school leaerscompleting the Leaing Certicate vocational Programme is eident, the proportion completing the LeaingCerticate Applied programme has remained stable.
Figure 4.6: Type o Leaving Certicate Programme Taken by School Leavers
10%
0%
20%
30%
40%
50%
60%
70%
80%
90%
100%
LC Established
LC Vocational ProgrammeLC Applied
All
2002/04
All
2006/07
Male
2006/07
Female
2002/04
Female
2006/07
Male
2002/04
The rst time point indicates that in 2002/04 our out o e (80 per cent) school leaers took the establishedLeaing Certicate programme while the second time point (2006/07) indicates that this had reduced to 75 percent o school leaers. This decline is most eident in an increase o school leaers who complete the LeaingCerticate vocational programme. This has increased rom 14 per cent to 19 per cent oer the period. Just 5 percent had taken the Leaing Cert Applied16 (LCA), with no change oer time in leels o participation. The nextsection considers the prole o students taking the Leaing Certicate Applied and leels o participation amongnon-manual students, as students taking this programme are not eligible or direct entry into HE.
Table 4.2 displays socio-economic ariation in the proportion o school leaers who completed second-leel
education who pursued each o the dierent Leaing Certicate programmes (or the 2002/04 and 2006/07time points).
16 The Leaing Certicate Applied (LCA) was introduced into ty schools on a deelopmental basis in Sept 1995. The LCA was initiated to meetthe needs o students who are not catered or by the two other Leaing Certicate programmes, the established Leaing Certicate and theLeaing Certicate vocational Programme. The curriculum and approach o the LCA ocus on preparing students or the transition rom school toadult and working lie. Its primary policy aim is one o retaining as many students as possible in the second leel education system until the age oeighteen (Report National Ealuation o the Leaing Certicate Applied Programme, Department o Education and Science, 2001).
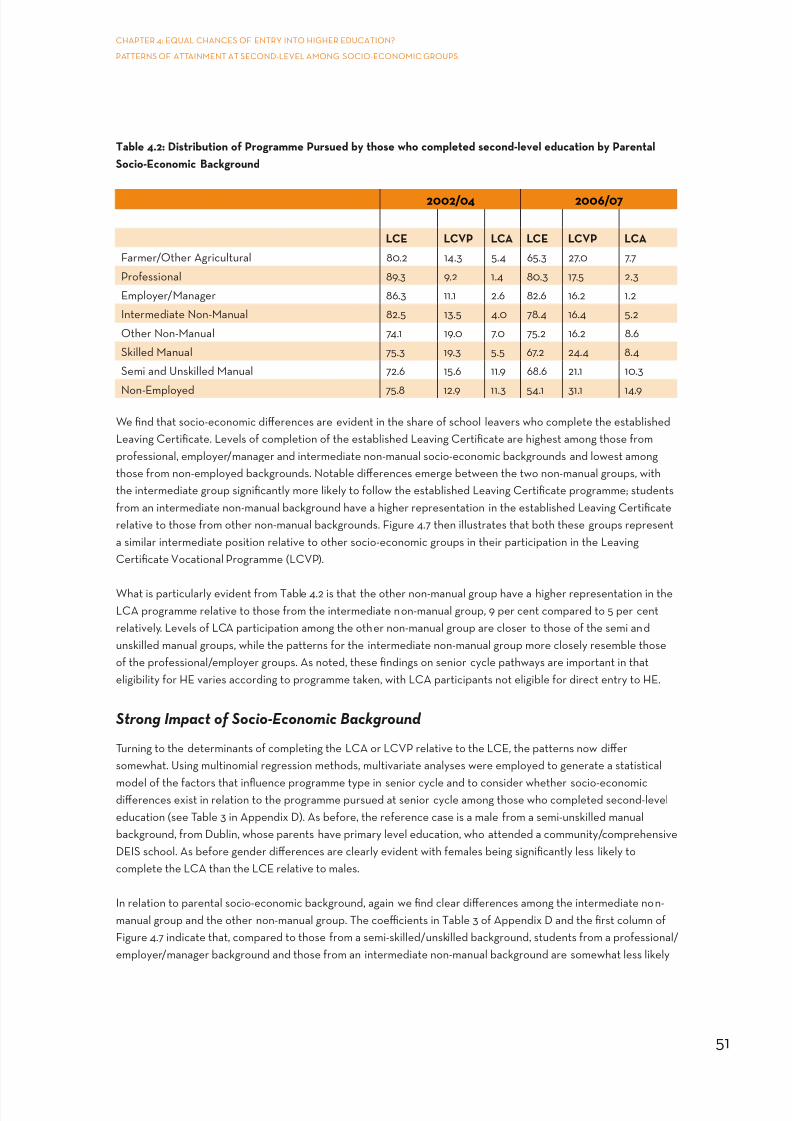
8/4/2019 BKMNEXT146
http://slidepdf.com/reader/full/bkmnext146 65/227
51
CHAPTER 4: EQUAL CHANCES OF ENTRY INTO HIGHER EDUCATION?
PATTERNS OF ATTAINMENT AT SECOND-LEvEL AMONG SOCIO-ECONOMIC GROUPS
Table 4.2: Distribution o Programme Pursued by those who completed second-level education by Parental
Socio-Economic Background
2002/04 2006/07
LCE LCVP LCA LCE LCVP LCA
Farmer/Other Agricultural 80.2 14.3 5.4 65.3 27.0 7.7
Proessional 89.3 9.2 1.4 80.3 17.5 2.3
Employer/Manager 86.3 11.1 2.6 82.6 16.2 1.2
Intermediate Non-Manual 82.5 13.5 4.0 78.4 16.4 5.2
Other Non-Manual 74.1 19.0 7.0 75.2 16.2 8.6
Skilled Manual 75.3 19.3 5.5 67.2 24.4 8.4
Semi and Unskilled Manual 72.6 15.6 11.9 68.6 21.1 10.3
Non-Employed 75.8 12.9 11.3 54.1 31.1 14.9
We nd that socio-economic dierences are eident in the share o school leaers who complete the establishedLeaing Certicate. Leels o completion o the established Leaing Certicate are highest among those romproessional, employer/manager and intermediate non-manual socio-economic backgrounds and lowest amongthose rom non-employed backgrounds. Notable dierences emerge between the two non-manual groups, withthe intermediate group signicantly more likely to ollow the established Leaing Certicate programme; studentsrom an intermediate non-manual background hae a higher representation in the established Leaing Certicaterelatie to those rom other non-manual backgrounds. Figure 4.7 then illustrates that both these groups representa similar intermediate position relatie to other socio-economic groups in their participation in the LeaingCerticate vocational Programme (LCvP).
What is particularly eident rom Table 4.2 is that the other non-manual group hae a higher representation in theLCA programme relatie to those rom the intermediate non-manual group, 9 per cent compared to 5 per centrelatiely. Leels o LCA participation among the other non-manual group are closer to those o the semi andunskilled manual groups, while the patterns or the intermediate non-manual group more closely resemble thoseo the proessional/employer groups. As noted, these ndings on senior cycle pathways are important in thateligibility or HE aries according to programme taken, with LCA participants not eligible or direct entry to HE.
Strong Impact o Socio-Economic Background
Turning to the determinants o completing the LCA or LCvP relatie to the LCE, the patterns now diersomewhat. Using multinomial regression methods, multiariate analyses were employed to generate a statistical
model o the actors that inuence programme type in senior cycle and to consider whether socio-economicdierences exist in relation to the programme pursued at senior cycle among those who completed second-leeleducation (see Table 3 in Appendix D). As beore, the reerence case is a male rom a semi-unskilled manualbackground, rom Dublin, whose parents hae primary leel education, who attended a community/comprehensieDEIS school. As beore gender dierences are clearly eident with emales being signicantly less likely tocomplete the LCA than the LCE relatie to males.
In relation to parental socio-economic background, again we nd clear dierences among the intermediate non-manual group and the other non-manual group. The coecients in Table 3 o Appendix D and the rst column oFigure 4.7 indicate that, compared to those rom a semi-skilled/unskilled background, students rom a proessional/employer/manager background and those rom an intermediate non-manual background are somewhat less likely

8/4/2019 BKMNEXT146
http://slidepdf.com/reader/full/bkmnext146 66/227
52
CHAPTER 4: EQUAL CHANCES OF ENTRY INTO HIGHER EDUCATION?
PATTERNS OF ATTAINMENT AT SECOND-LEvEL AMONG SOCIO-ECONOMIC GROUPS
to complete the LCA rather than the established LC. The other non-manual group, in contrast, does not dier romany o the manual groups in terms o senior cycle programme taken (See Table 3 in Appendix D). This nding againindicates the dierences between the two non-manual groups in terms o the pathways pursued at senior cycle,
which has important implications or the pool o young people rom dierent socio-economic backgrounds eligibleor entry into HE.
Figure 4.7: Odds Ratios or Programme Completed at Senior Cycle
-0.5
0.0
0.5
1.0
1.5
2.0
2.5
Farmer/OtherAgriculture
Other Non Manual Skilled Manual Semi UnskilledManual
Non EmployedHigher LowerProfessional
IntermediateNon Manual
Employer/Manager
LCA
LCVP
4.5 Examination PerormancePerormance in the Leaing Certicate examination is an important predictor o entry to HE, with the ast majorityo places awarded on the basis o ‘points’ achieed in the examination and entry to more ‘prestigious’ coursesdemanding particularly high perormance leels. Table 4.3 presents the aerage perormance leels o male andemale school leaers or the three time-points. Oerall, between 60 and 65 per cent o school leaers (whocompleted the Leaing Certicate) achieed two or more ‘honours’ in this exam oer the last ten years. Acrosseach time-point, there is no isible gender dierence in the proportions attaining two or more ‘honours’. Howeer,
gender dierentials are more apparent when we examine the highest perorming group (e or more honours),where emales considerably out-perorm their male counterparts. In 2006/07, or example, while 35 per cent oemales achieed 5 or more ‘honours’, just one-quarter o males had perormed equally highly.
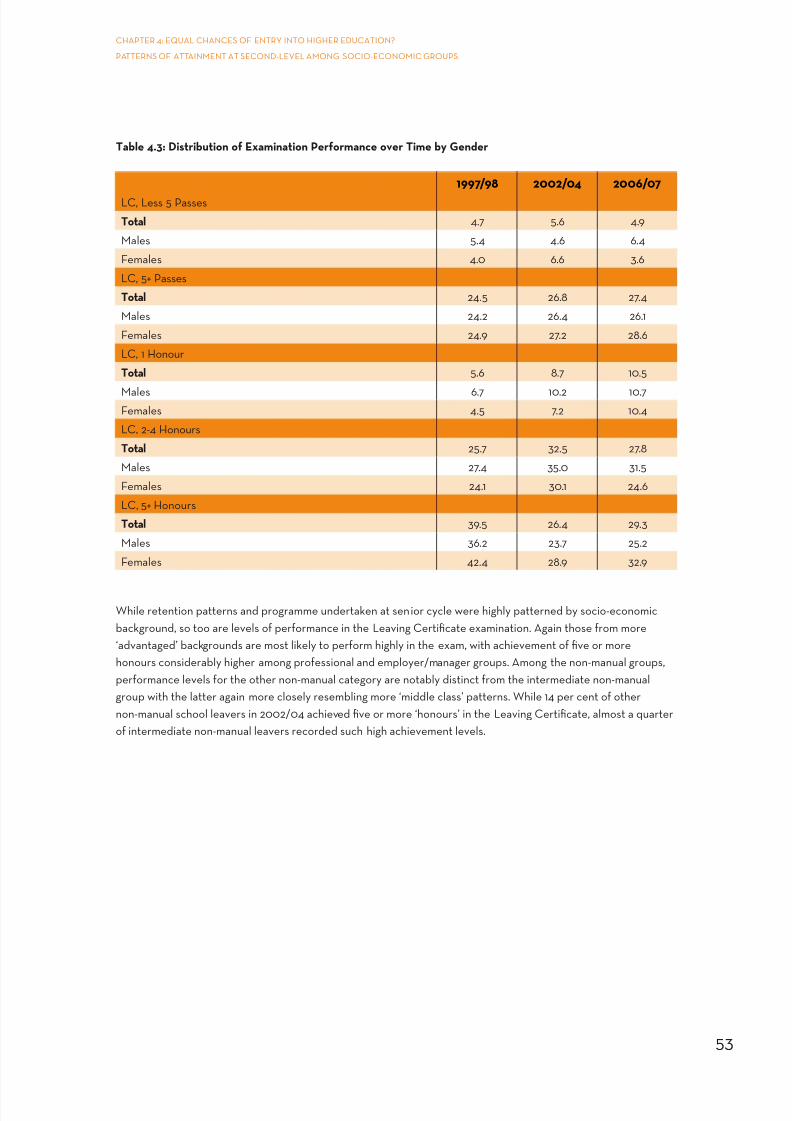
8/4/2019 BKMNEXT146
http://slidepdf.com/reader/full/bkmnext146 67/227
53
CHAPTER 4: EQUAL CHANCES OF ENTRY INTO HIGHER EDUCATION?
PATTERNS OF ATTAINMENT AT SECOND-LEvEL AMONG SOCIO-ECONOMIC GROUPS
Table 4.3: Distribution o Examination Perormance over Time by Gender
1997/98 2002/04 2006/07
LC, Less 5 Passes
Total 4.7 5.6 4.9
Males 5.4 4.6 6.4
Females 4.0 6.6 3.6
LC, 5+ Passes
Total 24.5 26.8 27.4
Males 24.2 26.4 26.1
Females 24.9 27.2 28.6
LC, 1 Honour
Total 5.6 8.7 10.5
Males 6.7 10.2 10.7Females 4.5 7.2 10.4
LC, 2-4 Honours
Total 25.7 32.5 27.8
Males 27.4 35.0 31.5
Females 24.1 30.1 24.6
LC, 5+ Honours
Total 39.5 26.4 29.3
Males 36.2 23.7 25.2
Females 42.4 28.9 32.9
While retention patterns and programme undertaken at senior cycle were highly patterned by socio-economicbackground, so too are leels o perormance in the Leaing Certicate examination. Again those rom more‘adantaged’ backgrounds are most likely to perorm highly in the exam, with achieement o e or morehonours considerably higher among proessional and employer/manager groups. Among the non-manual groups,perormance leels or the other non-manual category are notably distinct rom the intermediate non-manualgroup with the latter again more closely resembling more ‘middle class’ patterns. While 14 per cent o othernon-manual school leaers in 2002/04 achieed e or more ‘honours’ in the Leaing Certicate, almost a quartero intermediate non-manual leaers recorded such high achieement leels.

8/4/2019 BKMNEXT146
http://slidepdf.com/reader/full/bkmnext146 68/227
54
CHAPTER 4: EQUAL CHANCES OF ENTRY INTO HIGHER EDUCATION?
PATTERNS OF ATTAINMENT AT SECOND-LEvEL AMONG SOCIO-ECONOMIC GROUPS
Figure 4.8: Percentage o School Leavers Who Achieved 5+ Honours in LC by Parental Socio-Economic Group
0
10
20
30
40
50
60
70
80
90
100
1997/98
2002/20042006/2007Average
Professional Employer/Manager
Farmer/OtherAgricultural
IntermediateNon-Manual
OtherNon-Manual
Ski lled Manual Semi-andUnskilledManual
N on em ployed Tot al
As with preious sections, multiariate analyses were conducted to determine the probability o achieing at least
two honours in the Leaing Certicate examination among those who completed the LCE and LCvP programmes.The results o the multiariate analyses are summarised in Table 4.4 and Figure 4.9. (The ull model can be iewedin Table 4 o Appendix D).
The gures presented in Table 4.4 are estimates o the relatie odds o achieing this leel o attainment.The odds ratios tell us that persons attending non-DEIS schools are almost twice as likely to achiee at least twohonours in their Leaing Certicate examination, than people who attend a DEIS school. Parental education is alsoconsidered. As beore, we nd that persons whose parents hae a degree-leel education are three times morelikely to attain at least two honours in the Leaing Certicate than those whose parents hae primary education.

8/4/2019 BKMNEXT146
http://slidepdf.com/reader/full/bkmnext146 69/227
55
CHAPTER 4: EQUAL CHANCES OF ENTRY INTO HIGHER EDUCATION?
PATTERNS OF ATTAINMENT AT SECOND-LEvEL AMONG SOCIO-ECONOMIC GROUPS
Table 4.4: Odds Ratios or Attaining At Least 2 Honours in the Leaving Certicate
Attaining At Least 2 Honours in LC
Male 1.00
Female 1.16
Non DEIS school 1.80
DEIS school 1.00
Primary or Less 1.00
Junior Certicate 1.25
Leaing Certicate or Equialent 1.85
Diploma 2.72
Degree 3.07
As beore, this analysis points to signicant dierences between the non-manual socio-economic groups andthe position o these two groups relatie to other groups. Figure 4.9 illustrates that students’ rom proessional,employer/manager socio-economic backgrounds, as well as those rom arming and intermediate non-manualbackgrounds, are more likely to achiee at least two honours in the examination than those rom a skilled, semi-unskilled manual background (See Table 4 in Appendix D). Again, we nd that the other non-manual group, whileshowing a slight relatie adantage, do not dier signicantly rom the semi-skilled/unskilled manual group in theirprobability o perorming highly in the Leaing Certicate examination.
Figure 4.9: Odds Ratio o Attaining at Least 2 Honours in the Leaving Certicate
-0.5
0.0
0.5
1.0
1.5
2.0
2.5
Farmer/OtherAgriculture
Other Non Manual Skilled Manual Semi UnskilledManual
Non EmployedHigher LowerProfessional
IntermediateNon Manual
Employer/Manager

8/4/2019 BKMNEXT146
http://slidepdf.com/reader/full/bkmnext146 70/227
56
CHAPTER 4: EQUAL CHANCES OF ENTRY INTO HIGHER EDUCATION?
PATTERNS OF ATTAINMENT AT SECOND-LEvEL AMONG SOCIO-ECONOMIC GROUPS
4.6 SummaryThis chapter set out to consider the patterns o attainment at second-leel education o the non-manual group
relatie to other socio-economic groups; and to consider dierences in the patterns o attainment within thenon-manual group. In doing so, it considers the route to eligibility or HE.
We hae empirically demonstrated that second-leel retention rates are highly dierentiated according to genderand socio-economic background, with emales being more likely to complete second-leel education than males.While some improement is eident among both non-manual groups in retention rates oer the ten year period,recent estimates based on the parental dominance measure o socio-economic group indicates that retentionrates are considerably higher or the intermediate non-manual group compared to the other non-manual group(85 per cent relatie to 77 per cent). Multiariate analyses conrm these ndings and, all else being equal; theintermediate non-manual group are oer one and a hal times more likely to make the transition rom junior cycleto senior cycle and to complete second-leel education, while the other non-manual group display similar odds to
the semi-skilled and unskilled manual groups.
The international literature has pointed to clear socio-economic disparities in terms o who ollows dierent tracksin the second-leel education system. The Leaing Certicate Applied does not proide direct access to HE.The non-manual group as a whole occupy an intermediate position in rates o LCA take-up. Between 2002 and2007, the share o the intermediate non-manual group taking the LCA increased rom 4 per cent to 5.2 per cent;while the corresponding increase or the other non-manual group was rom 7 per cent to 8.6 per cent. In act,leels o LCA participation among the other non-manual group are closer to those o the semi-skilled and unskilledmanual groups, while the patterns or the intermediate non-manual group more closely resemble those o theproessional and employer/manager groups. Multiariate analyses urther conrm these ndings.
In terms o examination perormance in the Leaing Certicate examination (LCE, LCvP students only), a higher
proportion o the intermediate non-manual group achiee at least two honours in the examination than the othernon-manual group (24 per cent relatie to 15 per cent), suggesting that a higher share o intermediate non-manualstudents are eligible or HE than their other non-manual counterparts. Multiariate analyses conrm these ndingsand, all else being equal; the intermediate non-manual group are almost one and a hal times more likely toattain this leel o examination perormance while the other non-manual group display similar odds to the skilledmanual group.
This chapter has shed considerable light on some important dierences between the two non-manual groupsand the remarkable similarity between the other non-manual group and those groups traditionally identied aseducationally disadantaged and targeted or particular policy attention – i.e. semi-skilled and unskilled manualgroups. In particular, the other non-manual group display second-leel patterns ery similar to those or manual
groups – in terms o retention leels, senior cycle programme and examination perormance. This has importantimplications or the pool o young people eligible or HE entry. The intermediate non-manual group is aringconsiderably better at second-leel, which is likely to leae them better placed in terms o accessing HE.While chapter six explores HE entry patterns across the groups and the impact o social dierentiation inattainment and perormance at second leel on patterns o HE entry, the next chapter considers the educationalexperiences o the non-manual group at second-leel education, drawing on the qualitatie data.
8/4/2019 BKMNEXT146
http://slidepdf.com/reader/full/bkmnext146 71/227
57
CHAPTER 5: OTHER INCOME SOURCES
CHAPTER 5 Second-Level Experiences of DifferentGroups of School Leavers
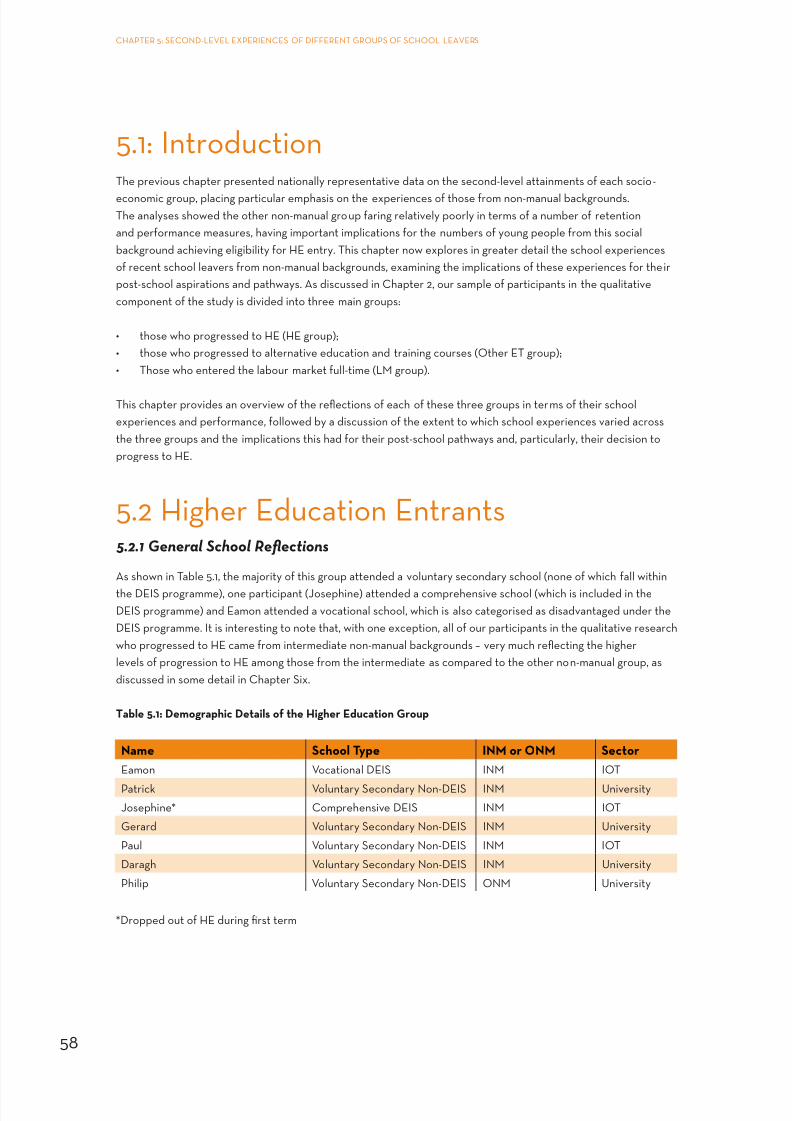
8/4/2019 BKMNEXT146
http://slidepdf.com/reader/full/bkmnext146 72/227
58
CHAPTER 5: SECOND-LEvEL EXPERIENCES OF DIFFERENT GROUPS OF SCHOOL LEAvERS
5.1: IntroductionThe preious chapter presented nationally representatie data on the second-leel attainments o each socio-
economic group, placing particular emphasis on the experiences o those rom non-manual backgrounds.The analyses showed the other non-manual group aring relatiely poorly in terms o a number o retentionand perormance measures, haing important implications or the numbers o young people rom this socialbackground achieing eligibility or HE entry. This chapter now explores in greater detail the school experienceso recent school leaers rom non-manual backgrounds, examining the implications o these experiences or theirpost-school aspirations and pathways. As discussed in Chapter 2, our sample o participants in the qualitatiecomponent o the study is diided into three main groups:
those who progressed to HE (HE group);•
those who progressed to alternatie education and training courses (Other ET group);•
Those who entered the labour market ull-time (LM group).•
This chapter proides an oeriew o the reections o each o these three groups in terms o their schoolexperiences and perormance, ollowed by a discussion o the extent to which school experiences aried acrossthe three groups and the implications this had or their post-school pathways and, particularly, their decision toprogress to HE.
5.2 Higher Education Entrants 5.2.1 General School Reections
As shown in Table 5.1, the majority o this group attended a oluntary secondary school (none o which all within
the DEIS programme), one participant (Josephine) attended a comprehensie school (which is included in theDEIS programme) and Eamon attended a ocational school, which is also categorised as disadantaged under theDEIS programme. It is interesting to note that, with one exception, all o our participants in the qualitatie researchwho progressed to HE came rom intermediate non-manual backgrounds – ery much reecting the higherleels o progression to HE among those rom the intermediate as compared to the other non-manual group, asdiscussed in some detail in Chapter Six.
Table 5.1: Demographic Details o the Higher Education Group
Name School Type INM or ONM Sector
Eamon vocational DEIS INM IOT
Patrick voluntary Secondary Non-DEIS INM UniersityJosephine* Comprehensie DEIS INM IOT
Gerard voluntary Secondary Non-DEIS INM Uniersity
Paul voluntary Secondary Non-DEIS INM IOT
Daragh voluntary Secondary Non-DEIS INM Uniersity
Philip voluntary Secondary Non-DEIS ONM Uniersity
*Dropped out o HE during rst term

8/4/2019 BKMNEXT146
http://slidepdf.com/reader/full/bkmnext146 73/227
59
CHAPTER 5: SECOND-LEvEL EXPERIENCES OF DIFFERENT GROUPS OF SCHOOL LEAvERS
For the most part, participants in this group attended their local primary and secondary schools. One participant(Gerard) attended ee-paying primary and secondary schools. Naturally all members o this group completed theirLeaing Certicate (as did all participants in this study) and none o them took the LCA programme (it was not
on oer in any o the seen schools). In order to get a sense o the school enironment, participants were askedto describe the ethos in their school. The majority o participants elt school personnel encouraged students toattend HE. There appeared to be a strong emphasis on progression to HE in the seen schools, with the generalassumption among respondents being
‘it was only when we had the graduation that it actually kind o dawned on us that we were leaing, leaingthe school now, that we were going to college’.
Eamon belieed that the school he attended had a lot o ‘messers’ and the class ethos mattered more than theschool ethos. When asked to elaborate on this point he explained
‘… it’s the ethos o a particular class and you could be lucky or unlucky and I think our year was luckybecause we had a good cohort o students who, at least by ourth year, had maybe got out o their shell andwere able to tell the people who just wouldn’t shut up talking to actually shut up. But that wouldn’t happenin rst, second or third year, you’re still building your character’.
The ‘messing’ that Eamon reers to included ‘a couple o instances o slapping the teachers on the behind thattype o carry on. But that was only with the new teachers’. This experience was the exception rather than the ruleamongst this group but raises an important point about the need or schools to hae clear policies on disruptiebehaiour.
Oerall the participants in this group elt they had a positie school experience and enjoyed school. When askedwhat they liked about school answers included particular subjects, sports and the social aspect o school.
While students who entered the labour market on leaing school talked about enjoying practical subjects anda desire to see more practical subjects on oer in their schools, the HE group tended to be more academicallyoriented and talked about liking the more academic subjects such as English, Maths, History and Geography.It appears that the HE group seemed to be more satised that the subjects on oer in their schools were thosethey were happy to choose.
5.2.2 Relationship with Teachers
In general participants in this group spoke o haing had positie interaction with their teachers. This wasillustrated in seeral ways. Most participants ound their teachers approachable and elt they gae them help,or example with their CAO applications, i required. Eamon spoke about some teachers who gae extra help to
students in their nal year:
‘… he was another teacher who was willing to stay ater [school] an awul lot and he’d correct your essayseen though he didn’t hae to. I didn’t een hae him but I still gae them to the two teachers and they bothyou know correct them so at least I got eedback that way’.
Other participants spoke about how teachers could make a dierence to how they elt about a particular subject.For instance, Patrick elt that some teachers ‘would hae inspired you to become interested in the subject’.Similarly Josephine (who went on to study accountancy) spoke about her two aourite subjects: ‘I had a brilliantmaths teacher and a brilliant accountancy teacher they were absolutely excellent, you know absolutely brilliant’.Finally, Gerard summed this point up by saying:
‘… that’s one o the reasons I liked history so much, I had this teacher who made it so interesting, it was almost

8/4/2019 BKMNEXT146
http://slidepdf.com/reader/full/bkmnext146 74/227
60
CHAPTER 5: SECOND-LEvEL EXPERIENCES OF DIFFERENT GROUPS OF SCHOOL LEAvERS
as i they loed what they were doing. That really kind o you know encapsulated you because i you are justsitting there and someone is just droning on up on the board about something it’s ery boring’.
Hence participants generally belieed that certain teachers had the ability to capture a person’s interestin a subject.
Philip belieed his school was stricter on younger students and, as students progressed to Leaing Certicate year,students were gien more autonomy and it was up to indiiduals themseles to put in the eort. Thus, teacherstreated students more leniently as the Leaing Certicate year approached. He belieed that, by the timestudents were in their nal year, teachers ‘concentrated more on the people who showed more ambition’.Philip thought this was a ‘air’ strategy and elt:
‘… some people hae dierent ambitions when it comes to the Leaing Cert, they might go into a trade orthey might go into something practical rather than going to college so they push really to get as much points
as they can. Whereas others were trying to get top points so they were the ones under pressure, you know[they] needed some more help than others’.
Daragh also raised this point and elt that as students progressed towards Leaing Certicate year teacherstreated students with more ‘respect’ and they ‘weren’t looked down upon’ by teachers. The eeling amongst thisgroup was the changing relationship between students and teachers, as students progressed to Leaing Certicatewas almost assumed. Paul spoke about this changing relationship ‘you would hae had a better one [relationshipwith teachers] in th and sixth year than throughout the other years just because you always do, don’t you’.
Finally, as Gerard put it about the changing relationship between students and teachers ‘when you rst went in, inrst year you are kind o looking at them and it’s a bit o us and them mentality. But then that sort o amalgamatesas you get older’.
These iews contrast somewhat with the experiences o members o the other leaer groups, some o whom eltthey were treated dierently by teachers as they were not seen as academic and oten gien less attention byteachers. This issue is discussed in section 5.5.
5.2.3 Subjects
Participants in the HE group were happy with the aailability o subjects or their Leaing Certicate. Generally,participants choose the subjects that they were more interested in. Howeer, one participant Patrick based hissubject choices on those he elt would maximise his ‘points’. Patrick explained that this was the way students madechoices in his school:
‘… your careers guy tells you, that ‘I know it mightn’t seem like what you want to do, but it’s probably bestto keep in mind the subjects that you know you’re good at, to get the points. And then you can moe into,in third-leel, you can moe into a subject that you’re actually interested in you know?’ So, I would’e, yeah,I think many people would’e been kind o unhappy with that process, you know they would hae, theywanted to pick subjects that they were interested in, ‘cause at that age as well you know you were, you don’twant to be doing stu you, you know, boring subjects’.
This issue o students choosing subjects in which they were likely to perorm highly was specic to the HE groupand did not emerge in any other groups, which is not surprising gien that most participants in the LM and PLC/Apprenticeship groups were not particularly oriented towards HE while at school.

8/4/2019 BKMNEXT146
http://slidepdf.com/reader/full/bkmnext146 75/227
61
CHAPTER 5: SECOND-LEvEL EXPERIENCES OF DIFFERENT GROUPS OF SCHOOL LEAvERS
Two participants in this group (Philip and Gerard) spoke about receiing extra tuition (grinds) in Leaing Certicateyear, coincidentally or the same subject, Maths. They both belieed receiing extra tuition was helpul or themand a common occurrence in their schools. Analysis o School Leaers’ Surey data or these indiiduals (the rst
point o contact with the respondents, 18 months ater leaing school), showed that participation in grinds wascommon across all leaer groups and hence does not appear to be particular to those who progressed to HE aterleaing school17 .
5.2.4 Transition Year The option to take Transition Year was open to all members o the HE group. Fie participants chose to takeTransition Year and two chose not to take it. When asked why he decided not to take Transition Year, Daraghreplied:
‘I didn’t mind not doing it, when you’re at that age you want to get out o the school as quick as you can Isuppose, eeryone that did it though, they said it was ery good, they enjoyed the year, it was a bit o a doss
year at our school’.
Howeer, Josephine regretted not taking Transition Year. When asked to elaborate on this she replied ‘I justthought it was a waste o a year but I wish I had now, when I’m older’. When asked why she elt that wayshe replied ‘well because I think you’ll be more mature going to college, I was ery immature going to college, I wastoo young’.
The prealence o Transition Year participation among this HE group is also reected in the literature, which hasshown that students who are most academically oriented and those with higher aspirations are more likely to optto take the Transition Year programme (Smyth, Byrne and Hannan, 2004).
The remaining participants in this group spoke ery positiely about their Transition Year experience. When asked
to describe the aspects o Transition Year that they liked, the eedback centred on three main issues. Firstly, roma social point o iew some participants elt it was ‘a nice break’ rom studying (Eamon) and a year that studentsound time to ‘relax’ (Gerard). Participants in this group also elt it was ‘the year when you really got to interactwith others’ (Gerard). As Patrick put it ‘the riends I would hae made in ourth year would probably be my bestriends now today’.
Secondly, rom a more academic perspectie, participants spoke about the opportunity to sample subjectsthey had not chosen or Junior Certicate. Furthermore, a number commented on the alue o the workexperience they had undertaken as part o the programme. For example, Gerard secured a placement with a lawrm commented;
‘I used to be able to go down to the District Court and the High Court and see all these cases andeerything, it was class … denitely work experience is inaluable’.
For Gerard and a number o others such Transition Year work experience played an important role in identiyingpossible elds o study and career paths they might pursue.
Finally, comments also centred on the impact o Transition Year on maturity, as Eamon comments ‘I think all o usthat particular year matured a lot’. In sum participants in this group who chose to take Transition Year elt it was ‘agood year [...] it was just a year out basically’ (Paul) and a worthwhile experience. These iews contrast somewhat
17 In any case, grinds hae been shown to hae no net aect on examination perormance, controlling or the characteristics o grind participants(Smyth, 2009).
8/4/2019 BKMNEXT146
http://slidepdf.com/reader/full/bkmnext146 76/227
62
CHAPTER 5: SECOND-LEvEL EXPERIENCES OF DIFFERENT GROUPS OF SCHOOL LEAvERS
with the experiences o the other school leaer groups, who expressed more mixed iews o the programme.As discussed in sections 5.3 and 5.4, some o those in the LM and PLC/Apprenticeship groups who took theTransition Year programme were critical o their experiences and elt the year had ‘turned them o learning’.
Again this is consistent with the research, which shows that Transition Year does not suit all students (Smyth etal ., 2004). It may also relate to the nature o proision o the programme in schools, as some students who tookTransition Year in the LM and PLC/Apprenticeship groups were more likely not to hae had a choice gien thatparticipation in the programme was compulsory in their schools. As Smyth et al ., (2004) conclude ‘it may be thecase that an obligatory extra year in schools causes some students to become disaected and leae school earlyor under-perorm academically i they do remain in the system’.
5.2.5 Career Guidance
Participants were asked to comment on the career guidance aailable in their school. For those in the HE groupthe majority spoke ery positiely about the career guidance they receied. Howeer one participant, Josephine,
said there was no career guidance proided in her school. Josephine also commented that her younger brother(at the time o her interiew) was attending the same school and the career guidance he was receiing had greatlyimproed. In terms o the CAO application process, Josephine also commented that there was no help or adiceaailable or this and she sought the adice o her parents when she was completing her CAO application orm.This issue is o some importance, as parents are likely to ary in their knowledge o (and experience o) HE,which will hae implications or the leel o expertise they hae on this issue and their capacity to oer their son/daughter guidance through this process. As noted in Chapter 3, parents located in the other non-manual group areunlikely to hae themseles participated in HE, and thereore the extent to which young people rom this groupcan rely solely on their parents or inormation and guidance on issues around HE choices and processes is animportant issue. This issue is discussed in some detail in Chapter 9.
The other member o this group who was critical o the career guidance oered in his school was Gerard who elt
the career guidance in his school was too academically ocused:
‘there was plenty o lads in my year like although their parents were airly well o and that their interest wasin cars and being mechanics. But you are not gien the option o … that’.
Gerard also commented that he did not receie help with his CAO application but this was not an issue or him:
‘I think it’s one o those things that i you get a problem you can just ask one o your riends. There was noneed to tell people about it, you know. Just eeryone knew and i you didn’t you just asked someone’ [inrelation to his CAO application].
The remaining e participants in this group spoke ery highly about the career guidance in their schools and eltthey had ample inormation and adice about their aailable options. They all commented that help was aailablein relation to the CAO orm i required; this included lling out mock CAO orms. Other career guidance includedone-on-one meetings with the career guidance teacher to discuss aailable options, aptitude tests, attending thecareers day in the RDS as well as open days in indiidual colleges and uniersities. In some instances past pupilsreturned to their school to talk about college lie, and guest speakers were inited to the schools to talk aboutparticular career paths. Oerall, most expressed satisaction with the guidance support they receied, as Daraghstates ‘eerything I wanted she [the Guidance Counsellor] got or me, [the same or my] riends as well, anythingthey wanted they were gien inormation about’. Similarly Eamon comments:
‘… there was a great career guidance teacher … he put in the time or you and he wasn’t really releant
8/4/2019 BKMNEXT146
http://slidepdf.com/reader/full/bkmnext146 77/227
63
CHAPTER 5: SECOND-LEvEL EXPERIENCES OF DIFFERENT GROUPS OF SCHOOL LEAvERS
[interested in] how much money he was getting or anything like that; he didn’t want anything rom it.But yet any o the inormation that we wanted was gien to us, [he] told us our options and … he alwaysasked preious students who went to college to come back and talk to the th and sixth years about their
experience in college’.
While much o the ocus in these schools was on HE preparation and the CAO process, other post-schoolpathways were also coered in a number o schools. As Patrick obsered:
‘I think there was about one hundred and ty students in sixth year and I’d say thirty-e, orty at leastwould’e went straight into a trade … the career guidance counsellor … he had as much inormation … onthird-leel as he did on trades or going into the army or police … there would’e been roughly one hundredstudents who would o went on to third-leel, so that was the majority o the attention was put on that, butthe guys who were going or trades, there was something or them as well’.
Finally, Josephine (who dropped out o college) raised an interesting point about one element o career guidanceshe belieed was missing in her school: preparation or college lie. She elt that ‘drop-out was a big issue’ orHE students. One o the main reasons or this was a lack o ‘awareness and knowing’ about college lie; she eltthat students should be more prepared socially and there should be ‘more emphasis on going out when you’rein college and [so that students do] not to let it aect your studies’. Furthermore, she elt that a good GuidanceCounsellor should ensure that ‘students are going to go on to college and make the right choices and go on tocollege and do the right course, not drop out’. In essence, preparation or lie in HE should orm an important parto guidance proision, alongside adice on HE application processes and assisting students in making rigorouscourse and college choices.
In sum, those who progressed to HE were positie about the adice and guidance they receied while at school,although a greater emphasis on the social aspects o HE was sought.
5.2.6 Examination Results and Perormance
As noted in Chapter Two, all members o the HE group perormed highly in the Leaing Certicate examination,with the majority achieing our or more C grades (or higher) on Higher Leel papers. Participants were asked ithey were pleased with these Leaing Certicate results. In this group three participants (Philip, Patrick, Daragh)were satised with their results and got their rst CAO choice. Josephine and Gerard both got their preerredCAO choice but they were disappointed with their results. Eamon got his third choice on his CAO but onreection was happy with the particular course he is doing. Finally, Paul got his last choice on the CAO orm as thepoints or his higher choices increased. As he explained ‘eerything I put down one to ten on the degrees [list]I didn’t get, I got my last choice and this hurts [...] And I only put them down just because my dad made me like,
just to be on the sae side’ (his last choice was with an institute o technology rather than a uniersity). When askedhow he elt about this he said he was glad that he had ‘got into college’ and rather than eeling disappointed he elt‘shocked’ (Paul).
Oerall, the participants in this group spoke positiely about their second-leel school experiences. This includedgood relationships with their teachers, their experiences o Transition Year and their subject choices, as wellas accessible and aluable career adice. Generally participants in this group elt the ethos in their schoolsencouraged students to go on to HE. Howeer it must be noted that not eery student in each o these schoolsattended HE, but or these seen indiiduals, positie school experiences coupled with high expectations at homeled to successul transitions into HE. Further discussion o the experiences and aspirations o the HE group areincluded in Chapter Six, where attention is ocused on the characteristics o those who progress to HE and theprocesses underlying this choice o post-school pathway.

8/4/2019 BKMNEXT146
http://slidepdf.com/reader/full/bkmnext146 78/227
64
CHAPTER 5: SECOND-LEvEL EXPERIENCES OF DIFFERENT GROUPS OF SCHOOL LEAvERS
5.3 Entrants to other orms o educationand training
5.3.1 School EnvironmentNine respondents in the qualitatie phase o the research progressed to some orm o post-school education andtraining (other than HE) on leaing school. In this sample three participants attended an apprenticeship (Charlie,Cian and Emma) and six participants progressed to a PLC course (Fiona, Ruth, Sharon, Roger, Tracey and Emer)directly ater completing their Leaing Certicate. In contrast to the HE group, the majority o this group camerom other non-manual backgrounds, with just three (Cian, Emma and Tracey) rom the intermediate non-manualgroup. Just one member o the group (Emma) had attended a school designated disadantaged and she was alsothe only member to hae attended a ocational school.
Table 5.2: Demographic Details o the Other ET Group
Name School Type INM/
ONM
Location Progression
Charlie Secondary Non-DEIS ONM Dublin Apprenticeship
Cian Secondary Non-DEIS INM Dublin Apprenticeship
Emma vocational DEIS INM Dublin Apprentice-ship*
Fiona Secondary Non-DEIS ONM Dublin PLC
Ruth Comprehensie Non-DEIS
ONM Mayo PLC
Sharon Comprehensie Non-DEIS ONM Dublin PLC
Roger Comprehensie Non-DEIS
ONM Dublin PLC
Tracey Comprehensie Non-DEIS
INM Dublin PLC
Emer Comprehensie Non-DEIS
ONM Co Cork PLC
*Apprenticeship incomplete due to illness
All participants in this group attended their local primary and secondary schools. Most o the participants in this
group pursued the regular Leaing Certicate programme; just two participants (Emma and Tracey) opted or theLeaing Certicate Applied programme.
Respondents in this group had somewhat mixed opinions o their second-leel schooling. To get a sense o howthey elt about school, participants were asked what they thought o school. Two participants commented thatalthough they enjoyed primary school they did not enjoy second-leel (Charlie, Sharon). Charlie elt his teachersdid not hold his interest. He enjoyed ‘learning’, but elt that the teaching standards in his school ‘weren’t upto scratch’. He elt so strongly about this that he let school in the January o his Leaing Certicate year andstudied independently at home. Cian thought school was just ‘okay’, largely because ‘it was too slow’ or him. Ruthcommented that she ‘loed’ school, while Tracey said she ‘liked learning’ and some o her teachers. Emma, Fionaand Emer thought school was ‘okay’ and Roger elt that oerall he did not really enjoy school. In sum participants

8/4/2019 BKMNEXT146
http://slidepdf.com/reader/full/bkmnext146 79/227
65
CHAPTER 5: SECOND-LEvEL EXPERIENCES OF DIFFERENT GROUPS OF SCHOOL LEAvERS
in this group had mixed eelings about their schooling, which contrasts sharply with the generally positie iewsrelayed by the HE group. The majority o participants in this group elt their school had a good reputation andencouraged students to go on to urther education. Howeer, or some participants this was not the case.
This is discussed urther in the next section.
5.3.2 School Ethos
To get a sense o the nature o the enironment and ethos o the schools participants attended, the young peopleinteriewed were asked to describe the ethos o their school and i they elt many students went on to urthereducation. It must be noted here that when young people in this sample reer to college it may imply a PLC or aHE course; unlike or the HE group, the term ‘college’ has somewhat broader connotations or this group.
Two participants in this group elt that teachers treated students dierently and more ‘academic’ studentsreceied more attention. As Sharon explained:
‘they had their aourite kids, i they thought like you were academic like they’d loe you but i they thoughtyou were a bit laid back they’d just leae you’.
Similarly Charlie commented on this issue:
‘I the teachers were into you, you got away with loads, and i you didn’t, you were stung’.
This was also brought up by one person in HE group, who elt that teachers gae more attention to those whowere trying or high points in Leaing Certicate. Similarly Emma elt that:
‘you’d nd that the teachers wouldn’t gie people in the lower class, not that they wouldn’t gie them as
much attention, but they wouldn’t be doing as much work as the rest o the other class … i you’re in a higherclass you benet more, you’d get a lot more back rom the teachers and that i you were in a higher class’.
This issue is discussed urther in section 5.3.3 where the young people’s iews o their teachers are discussed moregenerally.
Fiona spoke about attending study sessions three eenings a week that were organized by the school, which sheelt were a great way to study. Howeer she also belieed that:
‘they let anyone into it, you know, there was some people who went and they were messing and, you know,icking rubbers at people and, you know, you’d this kind o stu that was distracting you’.
When asked i there was superision at these sessions she said:
‘Yeah the kind o like, i they saw them they’d tell them to stop but hal the time they wouldn’t see thembecause they’d always be down the back’.
Roger elt his school was in a ‘rough’ area and had a ery bad reputation. In his opinion about 8-10% o studentsrom his school attended HE. The remaining participants in this group elt their school had a good reputation andsome students at their schools went on to study at HE (Cian, Emma, Ruth, Tracey, Emer).

8/4/2019 BKMNEXT146
http://slidepdf.com/reader/full/bkmnext146 80/227
66
CHAPTER 5: SECOND-LEvEL EXPERIENCES OF DIFFERENT GROUPS OF SCHOOL LEAvERS
In common with a number o members o the LM group, a number o male participants elt they did not work hardwhile at school and had little interest in school generally. As Roger reects:
‘… nothing could hold my attention … just messing all the time, be hiding each others stu and all, lling eachother’s bags with grass … I suppose maybe or the last month I started going to the library … that was about amonth out o 6 years you know’.
Charlie elt that school actiities did not keep his attention and as a result he ‘switched o’ and becamedisengaged rom school:
‘I’m learning something new [in his apprenticeship] … something I haen’t worked on yet, keep[s] meinterested and I think that’s part o the reason why I lost interest in school, you know, because it wasn’t keptinteresting’.
While a number o the girls had more positie iews, as Ruth put it ‘I loed it [school]’, Sharon elt that teachersdidn’t respect students in her school:
‘I didn’t like secondary school because I didn’t think like they kind o gae us the respect. I think they kind otried to speak us down like and wouldn’t let you hae your opinion in the classroom and stu’.
5.3.3 Teachers
Members o this group were somewhat critical o the teachers in their schools or a range o reasons. Charlie eltone o his teachers couldn’t maintain control in the classroom, which had implications or his motiation to learn:She hadn’t got the control o the class at all. I elt sorry or her like, to be honest, because she’d come in and she’d just get abused, like that was the way it was. The boys took nothing rom her at all, and you’re sitting there … and
you’re going ‘what’s the point’ like.
Conersely, Charlie elt that he had a much better learning experience in a class where the teacher was strict:
‘I had another teacher or business, and he gae you no option but to do the work, you know, you were araido this chap, but it was just as well, you know what I mean, and he would just, you done it, that was the end oit … And we done it, I had him or two year, he was a great teacher now’.
A number o participants held that their teachers did not hae high expectations or them. Sharon, or example,obsered ‘I remember my class tutor told me in sixth year that I’d amount to nothing and I’d ail me Leaing Cert’.She went on to explain:
‘… i they thought you were an honours student they’d like do eerything or you but i they thought youweren’t good they’d just kind o leae you there do you know that way, I don’t think they pushed us enough,do you know that kind o way, they just kind o let some o us’.
In common with the other groups, participants in this group also raised criticisms oer the quality o some o theteachers in their schools. Emer, or instance, talked about a Maths teacher who was considered ineectie by thestudent body and had led her to deelop diculties in Maths. Despite an approach to the Principal, who said ‘ohI’ll sort this out’, nothing was eer done about the situation. Emer went on to contend that ‘good’ teachers aremore likely to capture a student’s interest in the subject matter and promote their enthusiasm or the subject:

8/4/2019 BKMNEXT146
http://slidepdf.com/reader/full/bkmnext146 81/227
67
CHAPTER 5: SECOND-LEvEL EXPERIENCES OF DIFFERENT GROUPS OF SCHOOL LEAvERS
‘… i you’e a good teacher I think, it totally reects in your marks and it reects in yoursel as well becauseyou enjoy going to the subjects and you don’t dread going in and not listening because they’re just going tostand there and look at a blackboard anyway and read it out o a book’.
Sharon was also critical o her second-leel teachers, noting:
‘I think they kind o tried to speak us down like and they wouldn’t let you hae your opinion in the classroomand stu. So I think like they could hae tried and helped you out a little bit more and made it moreinteresting’.
She talked about her aourite teachers, who:
‘I think just because they made it interesting and they made you eel kind o, not important but they’d timeor you do you know that way, so they were me two aourite teachers’.
While Tracey obsered ‘then some o the teachers were okay, the rest o them weren’t really nice’. Charlie alsoreers to teachers who, in his iew, were less than eectie:
‘… the rst three years I had a teacher, he was a science teacher, and all we did in the class was laugh and joke with him’.
Similarly, in another class:
‘… they put me into this class, and I’m not joking, eerybody in the class, we used [to] call it cabbage Irish,because we done nothing, nobody knew anything, nobody learned anything, the teacher was diabolical likeunbelieable’.
Howeer, not eeryone was critical o their teachers. Emma, or instance elt that she had some ‘ery goodteachers’ (Emma), adding ‘some o the teachers were riendly ... i you had a problem you could approach them ...some o them were ery approachable’.
Finally, one participant was critical about the pace o instruction ollowed in his classes. As Cian notes ‘it was tooslow or me, I could hae done it in … it just drags on like, when you’re in a class the speed o the class is kind othe speed o the slowest ella there, it is just boring’.
5.3.4 Subjects
Participants in this group were broadly happy with the subjects on oer in their schools. Comments tendedto reer more to subject leels and the restrictions they elt were imposed on them in that regard. Sharon, orexample, was ‘orced’ to take oundation leel maths, which she elt limited her post-school opportunities, inparticular her prospects o progressing to HE:
‘… six o us were kicked out o the class and told you’re not able or ordinary leel maths and they made usdo oundation maths but it was basically because we were messing, it wasn’t because we weren’t able or it.And I kept on saying I’m not going to do oundation, I want to go to a proper college, i I don’t hae maths Ican’t [go to a] proper college … So or my Leaing Cert I was basically made do oundation [leel] but I gotan A in that’.

8/4/2019 BKMNEXT146
http://slidepdf.com/reader/full/bkmnext146 82/227
68
CHAPTER 5: SECOND-LEvEL EXPERIENCES OF DIFFERENT GROUPS OF SCHOOL LEAvERS
She went on to contend that students in the higher leel classes ‘looked down’ on students taking lower leels:
‘… one o the girls dropped down rom honours and went to ordinary leel, she was saying ‘the things they
used to be saying [in the higher leel class]’, I don’t think in that respect that they should hae been kindo making students [in the higher leel class] eel like we’re better than other people just because they didhonour[s]’.
5.3.5 Transition Year
A number o those interiewed had participated in Transition Year. Many o the participants in Transition Year eltthe year had been o benet in helping them to decide what they might do when they leae school.Emer commented on the career guidance ocus in Transition Year in her school: ‘I suppose we got the most careerguidance, we were kind o encouraged then to decide what we wanted to do’. Similarly Emma contended:
‘… it was more o a year where you’e to kind o decide on what you want to do with your uture. They gieyou a lot o dierent options like they gie you work experience and you get to go to try dierent kind o jobs… some lady had actually come in and talked to us about what we wanted to do in the uture, like shegae us like options o all dierent colleges and things like that and all dierent FÁS stu’.
Fiona also ound the year helped her in deciding on what career she might pursue ater school:
‘I wanted to join the guards when I let school and in Transition Year I got the opportunity to go down to thecollege or a week and see what it was like down there and ater being there then I decided no that’s not orme … so in a way I’m glad I did do Transition Year.
Howeer, a number o Transition Year participants elt the year had ‘turned them o’ learning and they ound it
particularly hard to settle into th year. This was comparable to the iews o the LM group who participated inTransition Year who also elt they had become disengaged rom school work ater participating in the programme.As Roger adised:
‘I don’t recommend it at all … I orgot stu I used to know … it was much harder to get back into, like doinghomework and all, getting back into being in school properly …I wasn’t that interested in school anyway butater that, ah it was shocking’.
For those who didn’t take Transition Year, a desire to complete school as quickly as possible oten lay behind theirdecision not to participate in the programme. Charlie and Cian both held such iews, as Cian stated ‘No I wantedto get out o school as soon as possible’. Sharon decided not to take Transition Year as her brother ound it dicult
to re-adjust to the more academically oriented th and sixth years:
‘… [I did not take Transition Year] ‘cause like my brother did it … all the Transition Year you got real lazybecause you know the way there would be some days they’d be o early and so they’d just spend th andsixth year, he wasn’t into school ater it’.
5.3.6 Leaving Certicate Applied Programme
Two o this group, Emma and Tracey, took the LCA programme. In common with the LCA participants rom the LMgroup, both spoke positiely about their experiences o LCA. As Tracey summed up about her experience o LCA:

8/4/2019 BKMNEXT146
http://slidepdf.com/reader/full/bkmnext146 83/227
69
CHAPTER 5: SECOND-LEvEL EXPERIENCES OF DIFFERENT GROUPS OF SCHOOL LEAvERS
‘[The LCA] was great ... we’d go out on dierent trips like and a lot o assignments and all that so it wasgrand; there was a lot o merit and that’.
She also reerred to the distinct nature o assessment in the programme:
‘… hal o your exams is gonna be done during the two years that you’e sat the LCA in and you already haehal your points and then you get your other hal o the points when you sit your exams’.
Howeer, Emma raised some concerns about the programme and, in particular, was somewhat conused about heroptions ater leaing school:
‘… they said well it’ll gie you a Leaing Cert but it’s gonna be easier than the normal Leaing Cert but you’llget into colleges but it won’t be a good rate college but you’ll still urther your education … but a lot o[other] people told me then as well that you wouldn’t get into colleges with this Leaing Cert, it’s just, it’s a
lower Leaing Cert, you know, you wouldn’t qualiy to get into college but you’ll pass’.
Her comments suggest that not all students are ully cognisant o the implications o taking the LCA programmeor their post-school options and particularly their eligibility to progress to HE directly.
5.3.7 Examination Results and Perormance
Regarding their Leaing Certicate perormance, young people in this group perormed somewhat lower than theHE participants, but slightly better than the LM group. All passed their examination, with some achieing a numbero ‘honours’. Cian was distinct in perorming highly in the examination achieing six higher leel A grades.
Participants were asked how they elt about their examination results and whether they achieed the grades they
needed. Charlie, expressed negatie iews about his results and elt that he didn’t perorm particularly well in theexamination, which he attributed to poor teachers and a lack o hard work on his part;
‘I’m not putting all the blame on the teachers, but I got lazy then as well, and I just couldn’t hae been arsedthen’.
Others were broadly happy. Fiona, or instance, indicated that ‘oerall I was happy with the results that I got’. Anumber suggested that they might hae achieed higher grades had they worked harder in school:
‘[I] got e honours and two pass, well I say honours, only a couple o them were honour leel but like I gotBs and Cs like so I didn’t, there was only two I got Ds in … I know mysel i I had o put more work in I would
hae got better results oer the years but it was really like the month or two coming up to it’. (Sharon)
Emer and Ruth had both identied alternatie routes to HE, i they did not gain suciently high points to securea place on their preerred HE course. In Ruth’s case, or example she elt she ‘wasn’t going to do awully well but Iwas really pushing mysel to pass’. She had aimed to get into a HE childcare course, but was happy to enter a PLCcourse i she did not get the results and progress to college later. In the end she wasn’t oered any courses on herCAO application ‘I didn’t get anything’, but did progress to HE ater taking a PLC course.
Finally, Emma contends that some students are simply ‘brainier’ and hence hae the ability to go to college, whileothers are not similarly endowed. Her iews are discussed urther in the next section.
8/4/2019 BKMNEXT146
http://slidepdf.com/reader/full/bkmnext146 84/227
70
CHAPTER 5: SECOND-LEvEL EXPERIENCES OF DIFFERENT GROUPS OF SCHOOL LEAvERS
5.3.8 Career Guidance
Many o the respondents receied career guidance classes while in the latter years o school, alongsideopportunities to hae one-on-one meetings with the Guidance Counsellor to discuss their post-school options.
In reecting on their career guidance, some participants were quite positie about the adice and support theyreceied. As Charlie noted:
‘… the Guidance Counsellor in th year, we did do a, he gae us a list o dierent jobs, and dierent lines owork, it was sort o you mark one oer here, you mark one oer here … and it tells you what you really wantto do’.
Similarly, Ruth was positie about the adice she receied, particularly on her PLC options:
‘I you wanted to do, yeah all dierent courses, engineering, she had loads o leaets rom dierent collegesabout the prospectuses, she had all the prospectuses ... I thought that was really good too. Like in general
that was really good, that serice in the school was really good … the teacher she really knew all abouteerything and really encouraging as well like, she did loads o them kind o personality things like’.
Others were more negatie in their assessments, identiying certain biases in the nature o guidance classes intheir schools. Sharon, or instance, elt that the Guidance Counsellor ocused attention on the more academicstudents:
‘… the Guidance Counsellor was one o the teachers that knew like you weren’t [an] honours student, sothey’d kind o say ah we’ll let you just get a job or do whateer you want, they didn’t kind o say alright whatcan we do to help you, do you want me to just do anything to bring you anywhere to show you things like’.
Conersely, Roger elt that the Guidance Counsellor ocused too much attention on HE and the CAO process,
pressurising students to take this pathway:
‘… go to college, just college, CAO, CAO, that’s all they eer talked about, they’d gie you about ty CAOorms a day, I hae the last one you gae me, I’m not lling it in, I’m not going you know.’ (Roger)
It is interesting to note that others, such as Charlie, would hae liked more encouragement to consider HE:
‘So I settled or the apprenticeship, and like I said, I know that i I had o been pushed to do something, or i Ihad o been kept interested, I most likely would hae gone to college’.
As with the other groups, many o the participants attended open days in arious HE colleges. Respondents had
somewhat mixed iews o these open days. Emer considered them o benet:
‘I went to an open day in the DIT and UCC … they were really good … you got to talk to students that wereon the course and then you got to talk to lecturers and you could ask any kind o questions that you wanted’.
Howeer, Charlie, who also went to a number o open days, didn’t take them seriously and hence receied littlebenet:
‘We had a choice to go to the Open Days alright … to be honest like we started milking that then ... we seenit as an option just not to go to school’.

8/4/2019 BKMNEXT146
http://slidepdf.com/reader/full/bkmnext146 85/227
71
CHAPTER 5: SECOND-LEvEL EXPERIENCES OF DIFFERENT GROUPS OF SCHOOL LEAvERS
Emma noted that only the ‘higher classes’ were gien the opportunity to attend open days, which she elt wasunair to other students who may hae an interest in progressing to HE. This was iewed to send out a message tostudents that certain ‘brainier’ students were destined to go to HE, but this option was not open to all students.
‘No I neer got the opportunity [to go to Open Days] but the higher, now the school did do it but it wasalways the higher classes, I think they always thought maybe the higher classes would go on I think … theywere the brainier ones so they were kind o guaranteed to denitely get into a college, you know that kind oway, so that’s just the way we looked at it, they were brainier than us, they were gonna get into a college’.
5.3.9 Application to college
Fie o the group lled out the CAO application and a number were oered places but decided not to take upthe oers. Ruth applied or a range o courses in a specic eld but did not perorm suciently well in her LeaingCerticate, so then pursued a PLC in that area with the intention o progressing to HE aterwards. In Cian’s case
he was oered a place and was also awarded a scholarship but turned it down:
‘I got a scholarship in [uniersity] or [name o course] … but I didn’t do it, I wasn’t really interested in collegeat that time’.
Similarly, Roger applied only because ‘me ma made me’, but he had no interest in progressing to HE at that time,despite the eorts o his Guidance Counsellor, as well as his parents.
For those who didn’t apply, they generally elt college was not or them and they had their sights set on alternatiepost-school options, as Fiona reects;
‘I didn’t een ll out, you know the CAO, I didn’t een ll that out, I’d no interest in it at all’.
5.4 Labour Market Entrants
5.4.1 General School Experiences
Interiews were undertaken with thirteen school leaers who did not immediately progress to urther studyor training on leaing school - six emales and seen males. The group were airly eenly split in terms o socialbackground with seen haing at least one parent occupying an intermediate non-manual job and the remaining six
with a parent employed in the other non-manual sector. In terms o educational leel o parents, the group ariedsomewhat. Oer hal o the group indicate that one or both o their parents did not complete their second-leeleducation; with our o these parents terminating their education prior to the second-leel stage.Three indiiduals, Mark, Mairead and Lynda, took the LCA programme, with the remainder taking the establishedLeaing Certicate programme or the Leaing Certicate vocational Programme (LCvP). For the indiidualsor whom we hae examination result inormation, the bulk o this group perormed moderately in the LeaingCerticate examination; in contrast to the picture or HE entrants, none o the LM group perormed particularlywell in the examination. In common with the patterns or other groups, the bulk o the LM group had beenengaged in paid employment while at school.

8/4/2019 BKMNEXT146
http://slidepdf.com/reader/full/bkmnext146 86/227
72
CHAPTER 5: SECOND-LEvEL EXPERIENCES OF DIFFERENT GROUPS OF SCHOOL LEAvERS
Table 5.3: Demographic Details o the Labour Market Group
Name School Type INM or ONM Education or Training
Participation
Sarah Secondary Non-DEIS INM PLC
Aideen Comprehensie Non-DEIS ONM PLC
Rachael Comprehensie DEIS ONM -
Declan Secondary Non-DEIS INM Apprenticeship
vincent Comprehensie Non-DEIS INM Apprenticeship
Michael Secondary Non-DEIS INM -
Mark Comprehensie Non-DEIS INM Apprenticeship
Mairead Comprehensie DEIS ONM -
Tony Secondary Non-DEIS INM Apprenticeship
Dermot vocational DEIS INM -Lynda Comprehensie Non-DEIS ONM -
Sally Secondary Non-DEIS ONM PLC and FÁS Course
Noel Comprehensie Non-DEIS ONM -
For the purposes o the analyses presented here, the LM group can be dierentiated into two main groups: rstly,those who enter the labour market on leaing school and remain there or the duration o the period since leaingschool (3-4 years typically) and, secondly, those who enter the labour market and later progress to some orm oeducation or training course – many taking either a PLC course or entering an apprenticeship programme. In total,six members o the LM group remain in the labour market and the balance participated in an education or trainingcourse. Three o the group had attended a DEIS school, all o whom hae remained in the labour market since
leaing school.
Analyses o the School Leaers’ Surey data shows that three members o the LM entrant group – Michael, Markand Sally - indicated that they had engaged in truancy while at school. No members o either the HE or otherET groups had similarly engaged in truancy regularly. In-depth interiews with those who entered the LM throwurther light on their attendance patterns and the reasons underlying the poor attendance o Michael, Mark andSally. It also explores the school experiences o the other members o the LM group, and assesses the role suchexperiences played in their post-school choices.
A number o the LM group reect on their school experiences ery positiely. As Aideen states;‘I had a great time like, most o my class now we all loed it like … it was great’.
Lynda, Tony and Rachael had similarly positie comments to make. Dermot elt he was able to enjoy school as hewasn’t destined or HE and so wasn’t under the pressure to perorm well in his examinations:
‘It was good craic … I wasn’t there or an education reason, I knew I wasn’t going to be going to college …because I was going to join the Gardaí … I enjoyed it and it was good un’.
Mark and Sally, both o whom had poor attendance while at school, elt they enjoyed their school lie but werelargely unmotiated. As Sally comments:
‘I enjoyed school but I wasn’t motiated enough, I didn’t know what I wanted to do … School was ne, I goton with all the teachers, I got on with eerybody, just I didn’t hae a sense o direction’.

8/4/2019 BKMNEXT146
http://slidepdf.com/reader/full/bkmnext146 87/227
73
CHAPTER 5: SECOND-LEvEL EXPERIENCES OF DIFFERENT GROUPS OF SCHOOL LEAvERS
Clearly, not eeryone in the LM group spoke positiely about their school days. Seeral members o the LM group,all males bar one, spoke quite negatiely about their school experiences. For some this stemmed rom a lack ointerest in school actiities:
‘I had no interest in school, I just did not like school at all, the sooner the better I could get out o there …I just I didn’t hae the head or it at the time I don’t think … the ault was with me, I had no interest in it …it was just this be in or nine o’clock and so strict and into your class and no talking and I don’t know I justdidn’t hae the head or it at the time’. (Declan)
Others ound schoolwork a struggle:
‘I wasn’t really an aid outgoing person, I wasn’t really inoled in team sports or anything like that so, I kind o justwent to [school] … I was a slacker, I was always good at turning in English and History but they were just easy, buteerything else was a constant struggle’. (Mark)
While Sarah suggests that diculties with her peers made school lie dicult or her:
‘I didn’t really like it [school] because o the simple reason I had trouble with riends there … you know thatway it’s ery hard to go in to school and ace them eery day’.
For many who ound school dicult or uninteresting, their response ery much reected that they had disengagedrom school lie, as Michael reects:
‘I wasn’t in school that much … it’s long hours and ery boring some o it … I skipped school a lot … I justpreerred chilling around town like, I regret it now obiously. School was mundane … nothing spectacularhappened in school like, it is pretty much what it does on the tin like, just teachers teaching you stu’.
Similarly, vincent elt that he didn’t listen or work hard at school owing to immaturity:
‘I mean you’re going to ollow the trends, i your best riend is smoking a ag, you’re going to start smoking acigarette, you just ollow the trend and eentually you will mature but sometimes it is too late’.
Such disengagement rom school lie also reected a desire to be working and earning, as in Noel’s case:
‘I didn’t want to be there [in school] … I’d rather be out working and that like, earning a bit o money and that.
He elt he had only stayed in school as his parents wanted him to stay. He goes on to contend that most people
don’t like going to school and only go to please their parents:
‘… just stupid school do you know what I mean like, not eeryone likes it … well I can’t see anyone haing aliking to do it anyway, but obiously there must hae been one or two in there that would like it alright’.
And why do you think most people go to school then?
‘I’d say most o them go, obiously to get an education, but I’d say most o them are just made go by theirmother and ather’.
In ealuating their school lie, many o the respondents’ comments centred around our main aspects o school:
Teachers•

8/4/2019 BKMNEXT146
http://slidepdf.com/reader/full/bkmnext146 88/227
74
CHAPTER 5: SECOND-LEvEL EXPERIENCES OF DIFFERENT GROUPS OF SCHOOL LEAvERS
Subject Proision•
Transition Year•
Leaing Certicate Programme•
5.4.2 Views o their Teachers
Teaching Style
A number o members o the LM group were ocal about the quality o their teachers and elt that their learningwas somewhat compromised by the presence o ineectie teachers. As Aideen states about one o her teachers:I’d just like to say she wasn’t ery good at teaching other people stu … she is not good at simpliying stu tostudents … she’d put stu on the board and she’d talk in her own language or like a hal an hour and then eeryonewas just looking at her going what like, we wouldn’t know what she was ater saying.
Similarly, Tony elt that the quality o teachers at his secondary school was poor which led to him moing to apriate grind school or his Leaing Certicate year:
‘[teachers in his school] just wasn’t the best teaching wise, you know that way the teachers weren’t the best… they weren’t the greatest … so [I changed school and] started at [name o priate institution] … it wasparallel to none like, they’re the best like, yeah they’re really, really good’.
Many o these school leaers expressed a desire or aried teaching techniques and not just copying notes romthe board or reading rom a book:
‘… like History class … she’s just be like, start us o there, so we’d read or about two chapters between us,
eerybody would read a paragraph and that’s the class like, that’s not teaching at all, that’s just reading inclass’. (Michael).
‘… orty per cent [o teachers] didn’t gie a damn, they were just standing there holding the book, readingout and you’d just keep writing, writing, writing like’. (vincent).
The respondents spoke about teachers who took dierent approaches that enabled them to learn better in class:
‘… there’s some brilliant teachers … my Geography teacher... we’d be doing erosion and stu like that andthere’s our methods and he’d be like kit-kat boys, kit-kat there’s our pieces o it right and stu like that’.(Michael).
Similarly teachers who were motiated and passionate about their subject were seen to be more eectie incapturing the attention o students:
‘I they’re more exuberant in class … you’d be inclined to listen’. (Michael).
‘Geography, I did it or my junior cert, I had no interest in it whatsoeer but the teacher was brilliant and hewas good un and he’d get you interested in it … I done ery well in Geography in the end’. (Declan).
A number commented that younger teachers were more likely to display such enthusiasm and relate well withstudents:

8/4/2019 BKMNEXT146
http://slidepdf.com/reader/full/bkmnext146 89/227
75
CHAPTER 5: SECOND-LEvEL EXPERIENCES OF DIFFERENT GROUPS OF SCHOOL LEAvERS
‘I loed it [the subject] in school … it was a lot to do with the teacher … she was really nice and kind omotiated us a lot and worked with us, she was young as well’. (Sally).
‘[the good teachers] were younger … they know more about lie or something than the other people like theolder teachers’. (Noel).
Three participants would hae liked to hae seen their teachers being stricter and elt that a more disciplinedenironment would hae kept them ocused and stopped other students disrupting their classes:
‘… i they’re more stricter they’re going to make you, they’re going to get you to do more work like, i they’rekind o laxi-dazy they’re not going to, you’re not going to learn really anything’. (Noel).
‘I just elt that sometimes the teachers could hae been a bit more strict on [students], you know in [termso] classroom behaiour or i they were distracting other people, you know just things like that’. (Rachael).
‘… they just let you away with too much ... you could just walk all oer some o them. … And just some othem are kind o strict and some o them weren’t but the ones that weren’t got took adantage o by people’.(Mairead).
Teacher Expectations and Support
The LM group were eenly split between those who elt their teachers encouraged them to progress to urtherET ater school and those who elt they receied little support or encouragement. In Dermot’s case, or example,he elt that teachers did little to encourage students to think about post-school options, apart rom distributingliterature on courses aailable.
Would you say teachers in your school encouraged you to go on to higher education?‘Not really no, no. Maybe a couple o teachers … no not really … When people came round with the sheets,you know giing out all the stu or colleges, sheets o inormation … none o them really talking to you, they just handed you the sheet, told you to put it away and look at it a dierent time and get on with your work,they don’t really chat about it’. (Dermot).
Conersely, a number o these school leaers were broadly happy with the support they receied and elt theywere encouraged to consider a range o post-school options:
Did you eel there was much o an expectation among teachers that a good ew students would go on to college?‘Yeah that most o us would and I think a lot o us did go, a lot o the class did go on to college [HE OR PLC]’.
(Rachael).
Would you say your teachers encouraged you to go on to do something?‘Yes they did denitely … people with all [the] inormation on all the courses and they’d be telling us how wecould get to where we wanted to go and what course would be best’ . (Lynda).
Furthermore, some participants elt that dierent groups o students had been gien dierent leels o supportand encouragement. Some elt students who participated in the LCA programme were encouraged to enterthe labour market rather than progress to urther study. vincent elt that emale students were gien moreencouragement to progress to college than their male counterparts.
8/4/2019 BKMNEXT146
http://slidepdf.com/reader/full/bkmnext146 90/227
76
CHAPTER 5: SECOND-LEvEL EXPERIENCES OF DIFFERENT GROUPS OF SCHOOL LEAvERS
Were the same expectations there or that [LCA] group?‘No’.
What were the expectations?‘That they’d nd work ater school’.
Did they expect the students to go on to urther study?‘I think they did in girls, like a lot o the time they gae girls a lot more preerence in like oh are you going tocollege? (vincent).
The issue o inormation, adice and expectations regarding HE opportunities is discussed urther in section 5.4.7,where the experiences and iews o the LM leaers on guidance proision in their schools are discussed.
5.4.3 Subject Provision
Each respondent had their aourite and least liked subjects. Howeer, a number o the labour market group weresomewhat dissatised with the subjects on oer to them and would hae liked a wider range o subjects (Michaeland Declan) and more hands-on, practical subjects:
‘… it would hae been better like i there was a wider range o subjects you know rather than the customarysubjects that’s mightn’t apply to the eld that you want to go into’. (Michael).
‘I would hae liked more hands on subjects, I applied or woodwork I didn’t get it, there was only so manyplaces allowed and it was a lottery, so I didn’t get that’. (Declan).
Dermot was unhappy with the way in which subject choice was constrained in his school:
‘the way they were put into groups o subjects and you can only choose one rom each group … I would haepreerred dierent subjects’.
Finally, Mark was critical o the range o subjects on oer and the lack o aailability o more alternatie subjects,which he would hae preerred:
‘… alternatie like subjects are neer really promoted … it is always like you want to go into business, youwant to do, be a solicitor because your dad says you hae to, there is only a certain number o careeroptions and stu like lm maker and all that, that just happens in other schools’. (Mark).
5.4.4 Transition Year
Fie o the group took Transition Year; or some o the others the programme was not oered in their school andor the remainder, they decided not to take it (Declan ‘just wanted to get out o school as quickly as possible’;Dermot ‘just wanted to get out o there’; and Sarah similarly stated ‘I just wanted to get out o school’). For thosewho participated in Transition Year, iews were somewhat arying. For some they ound the year a worthwhileexperience and were glad they took it, while or others they regretted the year. Aideen, vincent and Mark spokemost positiely about their experiences in Transition Year:
‘… oh it was great like, we done loads o stu in Transition Year’. (Aideen).

8/4/2019 BKMNEXT146
http://slidepdf.com/reader/full/bkmnext146 91/227
77
CHAPTER 5: SECOND-LEvEL EXPERIENCES OF DIFFERENT GROUPS OF SCHOOL LEAvERS
‘… Oh brilliant, the best … it kind o matured me because just that year made me kind o go ok well I betterdo well or the Leaing Cert … Just the reedom and you could approach a teacher a lot more easily thanwhat you could in the preious years or the ater years … you get to know eeryone else as well’. (vincent).
Howeer, a number o participants were critical o their experiences in Transition Year, and elt, in particular, thatthey lost ocus and interest in school work ater Transition Year:
‘… he’d just gie you take down this and that would be it, that’s your work done… that’s in ourth year like …you’d just be kind o well i they’re not bothered I’m not going to be bothered about me working, why shouldI? It is just a stupid year… I think it’s just a waste, like the waste o year, because they just ask or money oyou or trips to go there and whereer else, you just get lazy and then people just start messing then andthat’s why you get kicked out in ourth year or th year because they’re just so used to dossing around like…You just can’t get back into motion … like rom not doing anything throughout a year and then all o a suddeninto mad studying and things like that … you just get too lazy’. (Mairead).
5.4.5 Leaving Certicate Applied
Just our o the group took the Leaing Certicate Applied (LCA) programme in senior cycle. For those who didn’ttake the LCA, it was either not aailable in their school or they elt it was not or them: ‘I thought I was smarter, likeI am smarter than that’ (Dermot). Een those who took the LCA elt that other students ‘looked down’ on them:‘smart students thought o it as a complete joke’ (Mark).
For Mark, Mairead and Lynda taking the LCA programme was an intentional choice and one which they wereaware would hae implications or the choices open to them on leaing school. As Mark commented;
‘… I just didn’t really see mysel going to college, didn’t know what I would want to do i I went to college’.
Howeer, they did beliee that taking the LCA would not preclude them rom getting to HE indirectly, through aPLC programme or example:
‘ … I was told basically that yes you can get into college through like all you hae to do is like a PLC courseater this or whateer and yeah this is a great way to go to college as well’.
Howeer, one o the LCA participants, Mark, elt that it was unair that LCA leaers need to ‘go through like anextra ew years … and by the age o 30 you’ll still be in college’. Rather the expectations (within the school) or theLCA class was ‘that they’d nd work ater school’ (Mark).

8/4/2019 BKMNEXT146
http://slidepdf.com/reader/full/bkmnext146 92/227
78
CHAPTER 5: SECOND-LEvEL EXPERIENCES OF DIFFERENT GROUPS OF SCHOOL LEAvERS
Mairead knew little about the restrictions o the LCA in terms o accessing post-school educational opportunities(HE):
‘… all I knew was that the normal Leaing Cert was that you had to do all your subjects … and the LeaingCert Applied … was attendance or the two years and then the tasks that you [had] done, that was it,that was all I knew… [I should] hae paid more attention to eerything really … I should hae asked aboutopportunities when I’m leaing school like, what opportunities I had with like, you see I done the LeaingCert Applied, like what I can do and what I can’t do … what courses are there to do, instead o going orthem and getting turned down’.
Oerall, or each, they were glad that they had taken the LCA and ound the experience a positie one:
‘[The LCA was] Great, yeah I’d recommend it to anybody’. (Lynda).
Lynda particularly liked the project work and continuous assessment, which suited her better than examinationswhere she would ‘just go blank’. Similarly, Mairead elt:
‘I preerred it anyways, because I don’t think I would hae been able or the work, or the normal [LeaingCerticate examination]’.
Furthermore, she too liked the nature o assessment in the LCA:
‘Like the normal Leaing Cert [the examinations are in] just one year, but the LCA was within two years, itwas attendance or the two years and then the tasks that you done’.
Mark also commented on the less academic aspects o LCA:
‘there was a lot o emphasis on, not character building but team building and you know working with otherpeople and that was pretty good or say shy students’.
Howeer, perceptions o the programme by teachers and ellow students were o concern to Mark, who elt thatLCA students were not always suciently challenged and were treated dierently by the teachers:
‘Some o them [the teachers] would treat it like, what would you call it a special Ed class …. Some o theteachers did talk down to some o the [LCA] students a small bit’.
5.4.6 Examination Perormance
While some participants were happy with their perormance in the Leaing Certicate examination, others weredissatised (in one or more subjects) and elt they could hae done better i they had taken their schoolwork moreseriously.
Noel was generally satised and elt he perormed suciently well to secure an apprenticeship place, which washis objectie.
‘… yeah I was [happy with his examination results], to tell you the truth I wasn’t too sure about passing myLeaing Cert, but I did pass … it weren’t great or anything … I think it was 180 points or something like that’.

8/4/2019 BKMNEXT146
http://slidepdf.com/reader/full/bkmnext146 93/227
79
CHAPTER 5: SECOND-LEvEL EXPERIENCES OF DIFFERENT GROUPS OF SCHOOL LEAvERS
Aideen, Rachael and Sally were all disappointed with their perormance in one particular subject – in Aideenand Sally’s cases their disappointment related to Maths, while or Rachael ailing (Higher Leel) Irish was a majordisappointment and had serious repercussions or her HE opportunities:
‘I ailed me maths so that was the only thing I wasn’t happy with, eerything else was grand, I was raging thatI ailed me maths’. (Aideen)
‘I was happy with most o my subjects, the only one I was really unhappy with was Irish because I ailed Irishbut I really needed it or eerything that I picked or my, or college, so it kind o all went down the drain… itgets to me, when I think about it, it really does because I didn’t want to do higher leel and the teacher kindo pushed and pushed and she brought my mother up to the school and I done the higher leel and I ailed itand I knew’. (Rachael)
Rachael did think about repeating Irish but decided against doing so:
‘… but we were the last year o a set course, so next year was completely, so I would hae had to startcompletely rom scratch … I wouldn’t hae been able to do the poems or the literature that we’d done, Iwould hae had to learn completely new ones and that just kind o put me o [repeating]’.
Sarah, who was reasonably happy with her Leaing Certicate perormance, decided to repeat the examinationthe subsequent year (with her riends) with the hope she would get higher points and get a place on her preerredHE course. Howeer, she did not improe on her original perormance and did not secure a place in the HE course.
A number o the male participants elt they perormed poorly in the Leaing Certicate examination solely as aresult o their ailure to work hard. Dermot, Declan, Michael and Tony all accepted that their low perormance inthe examination was o their own making, and they could hae done better had they put in the eort. Tony, or
example, wasn’t particularly happy with his Leaing Certicate results, because he ‘wasn’t bothered’ and didn’twork ery hard. For Declan, who had perormed well in the Junior Certicate examination, lost interest in schoolonce he decided he was going to be an electrician on leaing school and or that reason would not need a strongperormance in the examination:
‘… the interest was gone … about halway though th year I’d say, I just decided I wanted to become anelectrician and that was the end o it [study] ... I wanted to nish up school and go o and do that but myather wanted me to nish up school’.
Michael, who dropped to ordinary leel in most subjects, elt his perormance would hae been better i he hadmade the eort to attend school regularly:
‘[I] was doing honours eerything up until the day o the exams and then I just dropped down to pass likeor pretty much eerything … Well I passed eerything in the Leaing Cert, so i I would hae gone in more Iwould hae done a lot better’.
Finally, vincent also expressed dissatisaction with his examination perormance. Howeer, unlike Dermot, Declan,Michael and Tony he elt he worked hard and had inested in grinds. Howeer, he concludes that these grinds didnot seem to make the dierence he was hoping or:
‘I got maths grinds, I spent a lot o money on maths grinds and I still only ended up with a D in ordinary leel… I denitely thought ater inesting in grinds on a one to one basis I was a lot better, so I thought I would
8/4/2019 BKMNEXT146
http://slidepdf.com/reader/full/bkmnext146 94/227
80
CHAPTER 5: SECOND-LEvEL EXPERIENCES OF DIFFERENT GROUPS OF SCHOOL LEAvERS
hae done better but it just didn’t work out’.
Lynda, Mark and Mairead, who took the LCA programme, were broadly satised with their perormance, although
Mairead, in her assessment o her perormance, elt she could hae achieed higher grades.
‘I was happy with them because I was like well I didn’t ail. That was the only thing that I didn’t ail, so thatwas a good thing, other than that I thought I could hae done better in them’. (Mairead)
5.4.7 Career Guidance
Most receied career guidance in school – usually ocused on aptitude tests and CAO application procedures.Howeer, some ound it dicult to identiy an area they might be interested in pursuing ater leaing school andothers elt they didn’t receie enough support or adice in school.
Many o the LM group were critical o the career guidance they receied while at school. Some had little contactwith the guidance counsellor, like Lynda who had ery little contact with the Guidance Counsellor and as a resultreceied little inormation on her post-school options. Similarly, Sally stated:
‘I didn’t hae a sense o direction, I didn’t know where to go, I had no guidance like, when it came to careersor anything’. (Sally).
For some, limited contact with the Guidance Counsellor, stemmed rom the oluntary nature o that interactionwith the guidance counsellor and them taking the decision to not make contact:
‘… we’d a career guidance teacher but it wasn’t a must that you go and see her, you know that way so youneer really bothered going to see her’. (Tony).
Those who appeared to hae airly regular contact with the guidance counsellor (through a time-tabled guidanceclass) were critical o the nature o the class and, in particular, the extent to which students actually had anopportunity to discuss their post-school options. Rachael, or example, comments:
‘I know taking us to open days I mean we went to quite a ew … but I think then when we came back weshould hae talked about them more, i you ound a course you were interested in you should hae like,she should hae come around and said ‘did you see anything you were interested in?’ and got you moreinormation on it and said well this is what you’ll be doing in one year and two years, this is what job you canget and i you stay to do your our years this is what job, I think it should hae been explained in those kindo terms not just [be] gien the prospectus and read it and decide or yoursel’.
Similarly, Aideen elt the career guidance she receied was limited:
‘… she just went through the CAO orm, she helped us, the whole class kind o not indiidually like, justll it out and she just kind o said i you need me just make an appointment. So there wasn’t really muchlike [discussion], she obiously would hand out leaets but there wasn’t much kind o adice like, that wasbasically it like’.
Some were critical o the capacity o their Guidance Counsellor to inorm them o careers and post-schoolchoices:
‘… well there was a guidance counsellor but he was a bit o a disaster.’

8/4/2019 BKMNEXT146
http://slidepdf.com/reader/full/bkmnext146 95/227
81
CHAPTER 5: SECOND-LEvEL EXPERIENCES OF DIFFERENT GROUPS OF SCHOOL LEAvERS
How come?‘Oh sure I’d say he was at the job too long, now he didn’t hae too much o an interest’. (Declan).
‘We neer really paid attention [to the Guidance Counsellor] because I don’t think she knew what she wason about hersel … she wouldn’t really gie you much inormation like because they would be always busywith something else … Or they’d be like oh meet me ater school and you’d be waiting or them or like halan hour and you’d go home and then you’d say to them then the next morning ‘where were you’ … and they’dbe like ‘oh I orgot all about it’ … so sometimes you just didn’t een bother’. (Mairead).
Rachael elt her guidance counsellor was critical o her suggestions and dismissie o her interest in studying Law:
‘I was thinking I wanted to do law, now I knew I probably wouldn’t get the points but like she didn’t gie meany help to say well you could do this [course] and then go on and do urther [courses] … I just think she
could hae led me … She just kind o shot me down and said ‘no you won’t get the points or that’ and do youknow when you’re coming up to your Leaing Cert that’s not something you want to hear, you want to hearsomeone say yeah i you want to do the law that’s brilliant and these are other options i you don’t get thepoints that you need, that could gie you like a backdoor’.
Others would hae liked their Guidance Counsellor to adopt dierent approaches, to make such classes moreinteresting and useul:
‘… it was kind o another doss class, people probably looked at it as a break rom eerything else… theyshould just show it to people on the Tv instead o reading it out o a book … you’ll just look out o thewindow rather than listen to her reading out o the book … [they should] make a good DvD showing thethird-leel colleges, showing trades, like exactly what is inoled in them’. (vincent).
One participant commented on the nature o adice oered by his guidance counsellor and elt the ocus waspredominantly on traditional careers:
‘Like you become a solicitor, you become an accountant, you become a guard, all ery good paying, wellrespectable jobs’. (Mark).
While Noel was adised to leae school early and enter an apprenticeship:
So what inormation did she [CG] gie you?‘To leae’.
Did she, when?‘Ater third year’.And do an apprenticeship?
‘Do an apprenticeship, she just said you’d be better o ... you’ll be qualied nearly by sixth year’.
vincent was also encouraged to enter an apprenticeship ater school, although such adice seemed to come romoutside school rather than within school:
‘It was like you were kind o orced into a trade at that time ... like not you know pushed in but you werealways, i you’re a ella, you were kind o going oh I’ll go or the trade you know … Just close riends, cousins,dad [would be encouraging me to take a trade] … my dad would be like seeing people around making great

8/4/2019 BKMNEXT146
http://slidepdf.com/reader/full/bkmnext146 96/227
82
CHAPTER 5: SECOND-LEvEL EXPERIENCES OF DIFFERENT GROUPS OF SCHOOL LEAvERS
money doing the trades like, plasterers, electricians, eerything making a ll o money, so een he said likeget a trade like’. (vincent).
A number o members o the LM group were unclear about what they wanted to do when they let school, as Sallycommented:
‘I didn’t hae any notion what to do [ater school] … I don’t think the school could hae done anythingbecause they were ery accommodating’.
Gien that this group did not progress to urther education or training upon leaing school, a number cameto the decision to pursue urther study a year or two years ater leaing school, by which stage they no longerhad the support or adice o school personnel. They relied on their own inestigation o possible courses andopportunities, sometimes with the assistance o peers or amily. Sarah, or example, took the decision to pursue achildcare course a year ater leaing school haing researched the area using Qualiax (which her sister inormed
her about). This raises an important issue oer the need or young people to hae skills to identiy and pursue HEand other ET opportunities ater leaing school; in particular career preparation at school needs to moe beyondthe narrow ocus on the immediate school leaing decision which many o our participants talk o, to encompassbroader lie skills relating to career identication, job search and lie-long learning more generally.
Subject/Level Advice
Rachael ailed higher leel Irish and as a consequence did not get a place in her chosen course. She elt she hadbeen pushed by her teacher to take a higher leel paper against her own wishes and expectations:
‘she kept pushing or the higher leel and I elt that I couldn’t do it but do you know when somebody keepspushing and pushing’.
The remainder o the group were more positie about the adice they receied on subject and leel options.
5.4.8 Post-school advice
Some ound school personnel (GC and teachers) o great help and support in making post-school decisions, asSarah noted ‘they did arrange meetings with the career guidance, they tried to get you to go to college’. Similarly:Would you say your teachers encouraged you to go on and do something?
‘Yes they did denitely … They’d be telling us how we could get to where we wanted to go and what coursewould be best’. (Lynda).
Would you say that students were encouraged to go on to college?‘Yeah absolutely, we were always doing our uniersity like going to open days and stu like that’. (Michael).
Others elt they weren’t interested in progressing to HE and, or that reason, did not aail o any inormation oradice on the matter. As Mairead comments:
‘They’d be like you can do this or so many years or you can do it or so many months and you hae to payso much or this and it doesn’t take as long … but … I wasn’t really paying attention ... I’m just not a collegeperson like I wouldn’t like to go to college’.

8/4/2019 BKMNEXT146
http://slidepdf.com/reader/full/bkmnext146 97/227
83
CHAPTER 5: SECOND-LEvEL EXPERIENCES OF DIFFERENT GROUPS OF SCHOOL LEAvERS
A minority o participants didn’t seem to receie much in the way o post-school adice:
‘I didn’t really talk to anyone about my career though to be honest, I knew I liked nursing but I didn’t know i
it was an option or me so I kind o didn’t hae a notion what to do’. (Sally).
In some o the schools attended by the respondents, dropout was a major challenge aced by the school, with theresult that ew o the cohort actually persisted in school to complete their Leaing Certicate examination:
‘In my class there was about 15 or 16 in me class ... because they were all ater dropping out rom the thirdyear … [they] just couldn’t be bothered to do it like’. (Mairead).
A number o the participants, with the assistance o their guidance counsellors, attended college open days andcareers eents, while some also attended the FÁS Opportunities eent in the RDS. Most school leaers oundthese experiences o use and helpul in making their decisions. Participants were particularly positie in their
assessment o the FÁS Opportunities eent, which is not surprising gien that many o this group did not aspire toHE when they were in school. As Noel and vincent comment about this eent:
‘Yeah I brought a bag ull o leaets so I did about what you can do with you apprenticeship and whatapprenticeships take and what you’ll end up doing … it was worth going or a day’. (Noel).
‘… it’s an enjoyment kind o day and you can actually go in and see you know you hae the air orce there andyou hae the army, you hae the guards, you hae plumbing … I think that it is ery good’. (vincent).
Some o the participants lled out the CAO application orm, although a ew participants did so without any realinterest in attending HE. Michael lled out the CAO orm on two consecutie years; each time he was oereda place on a course but elt he would not like the respectie courses and he turned down the oers. Similarly,
Declan completed the CAO application and was oered a place but declined it as he elt he was too immature atthe time to undertake a HE course:
And were you oered any places?‘Yeah I was oered [name o course], didn’t want to do it … I would go back there now [the college] but notat the time, I wouldn’t hae, I just would not hae done a tap, I know I wouldn’t hae, denitely too immatureat the time, denitely’.
A number o those who applied were not oered a place on their chosen course(s). Rachael, or example, appliedbut did not get a place as she ailed higher leel Irish, and notes ‘the courses that I did pick, they relied on youpassing Irish so that was a big let down’. vincent and Sarah both applied but receied no oers o places; in Sarah’s
case her brother and sister assisted her in lling out the application orm. Aideen, who elt she didn’t know whatshe wanted to do and didn’t hae enough time to decide, didn’t get any o her choices:
‘… we just had to ll it out, so it was kind o just 40 minutes, just quick decide, one, two or three what youwanted … I didn’t know what I wanted to do so it was just a matter o 40 minutes ll it out and that’s it, youdon’t really hae long enough to decide’.
The remaining participants did not apply to the CAO. In Dermot’s case, he had set his sights on entering the Gardaí (like his ather), so elt he would not need to apply elsewhere. In Mairead’s case, she elt she receied insucientadice on her post-school options:
8/4/2019 BKMNEXT146
http://slidepdf.com/reader/full/bkmnext146 98/227
84
CHAPTER 5: SECOND-LEvEL EXPERIENCES OF DIFFERENT GROUPS OF SCHOOL LEAvERS
Did you apply or [HE] courses then?‘No because I didn’t know, I neer got the opportunities o what to een go or, like I was neer saying wellyou can go or this because you’e got so many marks, or you can’t go or that because you can’t do it with
the LCA or things like that I neer got told’. (Mairead).
Most receied adice on how to complete the CAO orm – but many commented that the adice was largelyconned to the mechanics o lling out the orm rather than adice on what options people might choose. AsAideen reects:
‘she [the Guidance Counsellor] just went through the CAO orm, she helped us, the whole class … therewasn’t much kind o adice’.
5.5 SummaryChapter 4 has outlined how the other non-manual group are relatiely poorly in terms o a number o retentionand perormance measures compared to the intermediate non-manual group, and that their patterns more closelyresemble that o the semi-skilled and unskilled manual groups. This chapter has set out to contextualise thesecond-leel school experiences o the non-manual groups, examining the implications o these experiences ortheir post-school aspirations and pathways.
In terms o students’ perceptions o their school experiences, the group o HE entrants were much more positieas a group about their school experiences relatie to entrants to alternatie education/training or labour marketentrants. The HE entrant group comprised mostly students rom an intermediate non-manual background, and itwas clear that the school ethos encouraged progression to HE. This group generally relayed positie experiences
about their schooling, enjoying the academic aspect o school, demonstrating positie relations with teachers,and emphasised the importance o gaining points or HE entry. The entrants to alternatie education and trainingwere comprised mostly rom the other non-manual group and reported mixed eelings about school. They spokeabout their schools haing a good reputation, and being encouraged by school sta to progress to HE. Whatwas particularly eident was that this group were much more critical o their teachers and the teaching they hadreceied. Some o the young people we interiewed elt that teachers made a distinction between those whowould go on to HE and who would not, which then inuenced how they were treated by teachers. What wasparticularly interesting was that many o this group had applied to go to HE, but also had alternatie education ortraining pathways earmarked i they did not gain access or did not obtain their HE preerence. The labour marketentrants were a mix o young people rom intermediate and other non-manual backgrounds. While some o thisgroup were positie about their school experiences, they oten attributed their underperormance to themseles,
rather than to their experiences in school. Howeer, it was clear that this group were critical about their teachersand oten spoke about the poor quality teaching they had receied. They spoke about attending schools wheresome students would be considered or HE while others would not.
A clear distinction was also eident between the HE entrants and the other two groups in terms o how subjectchoice was determined, which may shed some light on dierences between the two non-manual groups. The HEentrant group were happy with the subjects that were on oer, and tended to choose subjects that they were mostlikely to achiee high points in the Leaing Certicate examination. In contrast, the remaining two groups did nottend to adopt this tactic. In act, some o the other non-manual students elt that they had been orced to chooselower subject leels, and were oten dissatised with the subjects on oer.

8/4/2019 BKMNEXT146
http://slidepdf.com/reader/full/bkmnext146 99/227
85
CHAPTER 5: SECOND-LEvEL EXPERIENCES OF DIFFERENT GROUPS OF SCHOOL LEAvERS
It was also clear that members o the intermediate non-manual group who successully progressed to HE weremuch more positie about the career guidance they receied while at school. In contrast, members o the othernon-manual group were oten directed away rom HE, perceied that they were not considered HE ‘material’
by teachers and guidance sta and, where they did get inormation on HE, it was oten about the mechanics oapplying rather than discussing what they might like to do. As a result, a number o (particularly male) members othe other non-manual group let school unsure about what they wanted to do and clearly lacking any real direction.It can also be noted that or the intermediate non-manual group, een where guidance was lacking, they wereable to rely on the assistance o parents who were themseles amiliar with the CAO process and HE in general(haing themseles participated). The other non-manual group, in contrast, are much more reliant on school-basedadice, hence signiying the importance o comprehensie adice at school and a supportie enironment whereexpectations are high.
It was also eident that males rom the other non-manual group were much more likely to all into cycles onegatie interaction, poor behaiour and ailing to take school seriously. This had led to a process o gradual
disengagement rom schoolwork and a desire to ‘get away’ rom education. This raises crucial issues around schoolclimate, and has many parallels to the ndings o a longitudinal study o second-leel students (see Smyth et al .,2006; Byrne and Smyth, orthcoming). It points to the importance o promoting a positie school and classroomclimate, where good relations between students and sta are ostered, positie reinorcement is promoted andstudents are encouraged to become inoled in school both at ormal (student councils or example) and inormal(sports and extracurricular) leels.
Finally, it was clear that the pull o the (then booming) labour market represented an important motiating actoror males, particularly those rom other non-manual backgrounds. It meant that leaing school without urthereducation plans was an easy option and didn’t seem to be challenged by teachers (and was een encouraged insome cases). While some o these young people now reect on these choices with some regret and see themselesas more ulnerable than college-educated peers, it seems that teachers and guidance counsellors should place a
greater emphasis on highlighting the implications o taking arious post-school options in the longer-term.
Chapter 6 now draws on both qualitatie and quantitatie data to consider the HE decisions among theintermediate non-manual and the other non-manual groups.

8/4/2019 BKMNEXT146
http://slidepdf.com/reader/full/bkmnext146 100/227
86
CHAPTER 5: SECOND-LEvEL EXPERIENCES OF DIFFERENT GROUPS OF SCHOOL LEAvERS

8/4/2019 BKMNEXT146
http://slidepdf.com/reader/full/bkmnext146 101/227
87
CHAPTER 8: SUMMARY AND POLICY DISCUSSIONCHAPTER 5: OTHER INCOME SOURCES
CHAPTER 6 The Higher Education Decision:
Higher Education Entrants and Non-Entrants

8/4/2019 BKMNEXT146
http://slidepdf.com/reader/full/bkmnext146 102/227
88
CHAPTER 6: THE HIGHER EDUCATION DECISION: HI GHER EDUCATION ENTRANTS AND NON-ENTRANTS
6.1: IntroductionThis chapter draws on both the qualitatie and quantitatie data to consider HE application and acceptance
patterns, participation leels at HE and the actors associated with participation in HE (typically two yearsater leaing school). As in earlier chapters, the main ocus is on the relatie position o those rom non-manualbackgrounds and the dierential experiences o intermediate and other non-manual groups.
6.2 Higher Education Application PatternsOne approach to understanding the nature o participation is to identiy the social characteristics o those who donot participate and then to explore why they might not be represented in the HE population. The School Leaers’Surey o 2007 included an additional thematic component, asking respondents about whether they appliedor a place in a HE institution; among those not applying their reasons or not applying; whether they accepted
any places oered; and i they declined a place their reasons or doing so. As in earlier analysis, the discussion isparticularly ocused on the patterns or the intermediate and other non-manual groups, relatie to all othersocio-economic groups.
Figure 6.1 illustrates that in total 80 per cent o young people who complete the LCE or LCvP programmesapply or a place in HE in Ireland and/or oerseas, with no signicant ariation by gender. For the ast majorityo young people, the application is completed through the CAO process, with just 5 per cent applying directlyor through access programmes. Leels o application ary considerably across socio-economic groups, withstrong dierentiation between the two non-manual groups once again apparent (Figure 6.1). Young people romintermediate non-manual backgrounds hae high rates o application with 79 per cent submitting an application.Those rom other non-manual backgrounds are the group least likely to apply or a HE place, with just oer two-thirds o young people rom this group applying, a pattern which is somewhat lower than the application rates or
the manual groups and substantially lower than the rate o application or the intermediate non-manual group.Almost 90 per cent o those rom proessional backgrounds apply or a place in HE, alongside 86 per cent o thoserom a arming background. The position o the other non-manual group is alarming: we hae seen large numberso these young people not eligible or HE entry as a result o dropout rom second-leel (Chapter 4), now coupledwith low leels o HE application among those eligible or entry. The next section explores the reasons behind thedecision o school leaers not to apply or a place in HE.
Figure 6.1: Proportion o School Leavers Who Completed LCE and LCVP Who Applied to Enter Higher
Education by Parental Socio-Economic Group (2007)
10%
0%
20%
30%
40%
50%
60%
70%
80%
90%
100%
Secondary
Total Profess ional EmployerManager
Farmer/OtherAgricultural
IntermediateNon Manual
Other NonManual
Skilled Manual Semi UnskilledManual
Non-Employed

8/4/2019 BKMNEXT146
http://slidepdf.com/reader/full/bkmnext146 103/227
89
CHAPTER 6: THE HIGHER EDUCATION DECISION: HI GHER EDUCATION ENTRANTS AND NON-ENTRANTS
6.2.1 Reasons or Not Applying
For those who chose not to pursue HE, respondents were asked to indicate the reason(s) behind that decision.For policy makers interested in raising participation in HE, this is a key consideration. Figure 6.2 illustrates that
the oerwhelming reason underlying the decision not to seek entry into HE is related to the intrinsic alue o HEto these young people – they elt that it was not or them, particularly among males. This echoes the discussionsaround HE decisions in the qualitatie interiews where young people spoke about HE as being ‘not or me’.There was also eidence that working and earning at the earliest opportunity were an important motiationor some young people. In line with research in the UK context (Connor, 2001, or example), clearly nancialissues gure in young people’s choices – a desire to earn money and/or concerns oer being able to aord HEwere indicated by a considerable share o oer one-third o young people who did not apply or HE. There isalso eidence that academic sel-image plays a role or some potential applicants, particularly emales. Almosta quarter o young people not applying to HE cite low perormance expectations as a reason or their decision,with nearly 30 per cent o emales attributing their non-application to low expectations in the Leaing Certicateexamination. Finally, one-in-six indicate that they had identied alternatie (non-HE) education/training aspirations
and or this reason did not pursue the HE pathway. Males are more likely to hae identied non-HE aspirations.
Figure 6.2: Reason(s) or Not Applying to Higher Education by Gender (2007)
0
10
20
30
40
50
60
70
Total
MalesFemales
Not Interested Wouldn’tget grades
Wantedto earn
Couldn’tAfford
Travel/Gap Year
OtherEducation/
Training
Family didn’tEncourage
School/Teachersdidn’t encourage
The extent to which dierent socio-economic groups ary in their motiations or not applying to HE is
presented in Figure 6.3. The intrinsic alue o HE is an important underlying actor or all groups, but mostparticularly or the non-employed group relatie to other groups. Concerns about perormance in the LeaingCerticate examination were strongest among non-applicants rom proessional and other non-manualbackgrounds. Those rom non-employed households are considerably more likely to hae set their sights on non-third-leel educational opportunities – oer one-third o this group indicate this as a reason or not applying to HE.

8/4/2019 BKMNEXT146
http://slidepdf.com/reader/full/bkmnext146 104/227
90
CHAPTER 6: THE HIGHER EDUCATION DECISION: HI GHER EDUCATION ENTRANTS AND NON-ENTRANTS
Figure 6.3: Reason(s) or Not Applying or Higher Education by Parental Socio-Economic Group (2007)
0
10
20
30
40
50
60
70
80
90
100
Not Interested
Wanted to EarnWouldn’t get gradesOther Education/Training
Couldn’t Afford
Total Professional/Employer
F ar mer I nte rm edi ateNon-Manual
OtherNon *-Manual
Manual Non-Employed
* Note: Small numbers in the non-employed category make these results unreliable.
What is particularly eident is that nancial concerns surace or all groups – either in the sense o a priorityto secure earnings or concern oer being able to aord to attend HE 18 . Howeer, young people rom manualbackgrounds are considerably more likely to cite one or both o these actors – while 45 per cent o those rom the
manual group indicate nancial issues behind their decision not to apply; this is the case or just 30 per cent o thearming group. A total o 36 per cent o the other non-manual group indicate one or both o these actors, slightlyhigher than 32 per cent or the intermediate non-manual group.
The School Leaers’ Surey did not ask young people about why they decided to apply to HE. Researchconducted in the UK indicates that the main motiating actor which encourages potential students rom lowersocio-economic backgrounds to apply to HE is a belie that a higher qualication will bring improed job andcareer prospects and also improed earnings and job security (Dewson et al ., 2001). Their research indicated thatstudents rom lower social class backgrounds take account o a wider range o issues than their counterparts inhigher social class groups when taking the decision to enter HE, and they tend to place more emphasis on theexpected benecial outcomes o HE than do students rom higher social class groups.
18 These ndings hae also been replicated in the UK. Dewson et al ., (2001) ound that the primary discouraging actors mentioned by the researchrespondents ocus on employment and nancial issues. The main reasons why people rom lower social class groups interiewed in the researchhad decided against going into HE study, though qualied to get a place, were twoold: they either wanted to start employment, earn money and beindependent at an earlier age (39 per cent) or they were worried about the cost o studying (28 per cent). Many respondents elt that there was aneed or more releant and timely inormation concerning HE, particularly concerning student nances. Howeer, nance was just one o a range oissues o concern expressed by respondents when discussing their decisions to enter HE. Others include being able to cope with academic pres-sures and workload, gaining the entry qualications, the application process itsel, and personal issues such as childcare.
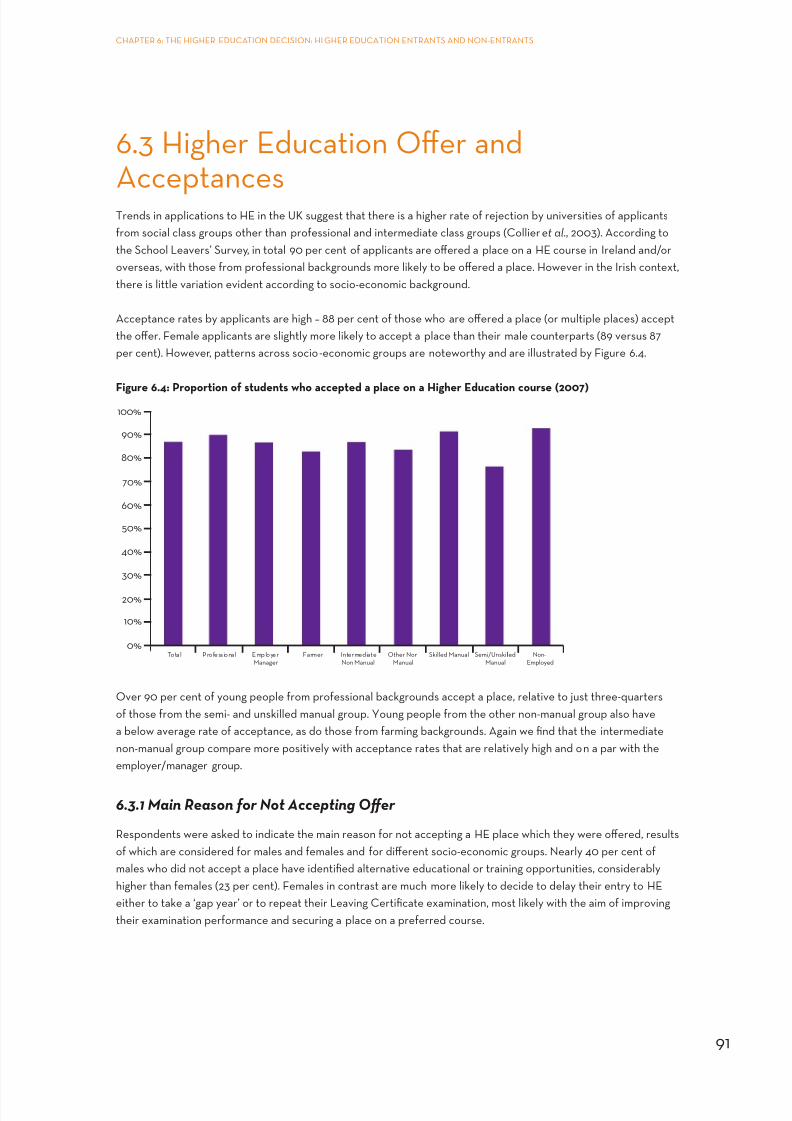
8/4/2019 BKMNEXT146
http://slidepdf.com/reader/full/bkmnext146 105/227
91
CHAPTER 6: THE HIGHER EDUCATION DECISION: HI GHER EDUCATION ENTRANTS AND NON-ENTRANTS
6.3 Higher Education Oer andAcceptancesTrends in applications to HE in the UK suggest that there is a higher rate o rejection by uniersities o applicantsrom social class groups other than proessional and intermediate class groups (Collier et al ., 2003). According tothe School Leaers’ Surey, in total 90 per cent o applicants are oered a place on a HE course in Ireland and/oroerseas, with those rom proessional backgrounds more likely to be oered a place. Howeer in the Irish context,there is little ariation eident according to socio-economic background.
Acceptance rates by applicants are high – 88 per cent o those who are oered a place (or multiple places) acceptthe oer. Female applicants are slightly more likely to accept a place than their male counterparts (89 ersus 87per cent). Howeer, patterns across socio-economic groups are noteworthy and are illustrated by Figure 6.4.
Figure 6.4: Proportion o students who accepted a place on a Higher Education course (2007)
10%
0%
20%
30%
40%
50%
60%
70%
80%
90%
100%
Total Profess ional EmployerManager
Farmer IntermediateNon Manual
Other NonManual
Skilled Manual Semi/UnskilledManual
Non-Employed
Oer 90 per cent o young people rom proessional backgrounds accept a place, relatie to just three-quarterso those rom the semi- and unskilled manual group. Young people rom the other non-manual group also haea below aerage rate o acceptance, as do those rom arming backgrounds. Again we nd that the intermediatenon-manual group compare more positiely with acceptance rates that are relatiely high and on a par with theemployer/manager group.
6.3.1 Main Reason or Not Accepting Ofer
Respondents were asked to indicate the main reason or not accepting a HE place which they were oered, resultso which are considered or males and emales and or dierent socio-economic groups. Nearly 40 per cent omales who did not accept a place hae identied alternatie educational or training opportunities, considerablyhigher than emales (23 per cent). Females in contrast are much more likely to decide to delay their entry to HEeither to take a ‘gap year’ or to repeat their Leaing Certicate examination, most likely with the aim o improingtheir examination perormance and securing a place on a preerred course.

8/4/2019 BKMNEXT146
http://slidepdf.com/reader/full/bkmnext146 106/227
92
CHAPTER 6: THE HIGHER EDUCATION DECISION: HI GHER EDUCATION ENTRANTS AND NON-ENTRANTS
Table 6.1: Main Reason or not accepting a Higher Education place by Gender (2007)
Total Male Female
Other Education/Training 30.5 38.5 22.7
Not interested 17.6 20.0 15.2
Wanted to earn/couldn’t aord 17.6 20.0 15.2
Time out/ repeat LC 16.0 4.6 27.3
Didn’t get preerred course/ location 13.7 13.8 13.6
Other 4.6 3.1 6.1
Across socio-economic groups, reasons or not accepting a Higher Education place are quite ariable (Figure 6.5).
Figure 6.5: Main Reason or Not Accepting Place in Higher Education by Parental Socio-Economic Group
(2007)
Other Education/Training
Not Interested
Wanted to earn/couldn’t afford
Time out/repeat LC
Didn’t get preferred course/location
Other
Total
Professional/
Employer/Manager
Farmer
Intermediate
Non-Manual
Other Non-Manual
Skilled/Semi Unskilled Manual
0% 10% 20% 30% 40% 50%
For the intermediate non-manual group nancial concerns gure strongly – perhaps suggesting that this group aremore likely to seriously consider HE but all at the nal hurdle owing to nancial pressures or perhaps ineligibilityor state nancial support. In common with the arming group, those rom intermediate non-manual backgroundsare much more likely to cite taking time out o education or repeating their Leaing Certicate, i.e. delaying entry
to HE, as a reason or their non-acceptance o a place. In some respects the other non-manual group display apattern similar to that or the manual group – 60 per cent cite either a lack o interest or alternatie educationpursuits as the main reason. Howeer, nancial concerns gure much more prominently or the manual group(25 per cent) than the other non-manual group (12 per cent). What is particularly interesting is that school leaersrom the other non-manual group are more likely to indicate that not being oered a place on their preerredcourse or in their preerred college was the reason or their non-entry to HE (24 per cent or other non-manualcompared to 6 per cent or manual group).

8/4/2019 BKMNEXT146
http://slidepdf.com/reader/full/bkmnext146 107/227
93
CHAPTER 6: THE HIGHER EDUCATION DECISION: HI GHER EDUCATION ENTRANTS AND NON-ENTRANTS
6.4 Participation in Higher Education
6.4.1 Overall Participation
The preceding discussion points to marked ariations in HE application between dierent socio-economic groupsand by gender. This section examines patterns o participation in ull-time HE oer the 10-year period 1997 –2007. The analyses presented throughout this section are conned to participation in HE o school leaers wheninteriewed at the time o the surey (18-24 months ater leaing school).
Figure 6.6: Participation in Full-Time Higher Education Among school leavers who completed senior cycle by
Gender
0
10
20
30
40
50
60
70
80
90
100
Total
Males
Females
Total Males Females
Figure 6.6 displays oerall HE participation rates among those who completed their second-leel education(including LCA students19 ). O those completing the Leaing Certicate (or equialent), 48 and 53 per cent omales and emales respectiely are participating in HE at the time o the 2002/04 sureys, with 44 and 47 per centat the time o the 2006/07 surey.
Figure 6.7 displays leels o participation by parental socio-economic group across the three time-points.
What is particularly eident is that participation in HE at the time o the surey has remained relatiely stableacross each o the socio-economic groups oer time. The aerage participation rate across time indicatesthat strong disparities are eident across socio-economic groups, whether measured in terms o ather’soccupational attainment or highest parental occupation (or patterns by ather’s socio-economic group see Table8 in Appendix C)20 .
19 LCA students are included because, at this stage, LCA students may hae completed a one year PLC course and then progressed to HE.20 Dierences may be eident in participation rate estimates using the New Entrants’ Data and the School Leaers’ Surey data as the ormerrecords the participation rate o socio-economic groups enrolled at a HE institution relatie to the size o the population in each socio-economicgroup while the School Leaers’ Surey data records the participation rate o those who completed second-leel education and subsequently madethe transition into HE.

8/4/2019 BKMNEXT146
http://slidepdf.com/reader/full/bkmnext146 108/227
94
CHAPTER 6: THE HIGHER EDUCATION DECISION: HI GHER EDUCATION ENTRANTS AND NON-ENTRANTS
Figure 6.7: Participation in Full-Time Higher Education among Senior Cycle Leavers by Parental Socio-
Economic Group
0
10
20
30
40
50
60
70
80
90
100
1997/1998
2002/20042006/2007Average
Farmer/OtherAgricultural
Professional Employer/Manager IntermediateNon-Manual
OtherNon-Manual
Skilled Manual Semi and UnskilledManual
Unemployed
While patterns o participation or school leaers rom other non-manual backgrounds are remarkably similar tothose rom semi-skilled and unskilled manual backgrounds, patterns o participation o the intermediate
non-manual group closely resemble those o the employer/manager group. From the most recent data, we ndthat leels o participation among those rom other non-manual backgrounds are among the lowest, with just 28per cent in HE at the time o the surey. The intermediate non-manual group hae signicantly higher leels o HEparticipation at 45 per cent o the cohort; 20 percentage points higher than the other non-manual group using themost recent data.
As well as social characteristics, research suggests that school characteristics can inuence indiidual educationalattainment and entry into HE (Smyth, Hannan, 2007). Figure 6.8 illustrates leels o ull-time HE participationamong school leaers o dierent social backgrounds according to the sector o second-leel education theyattended. Among those who completed second-leel education, young people who attended schools in theoluntary secondary sector typically hae highest leels o HE participation, and this pattern is eident across all
socio-economic groups.
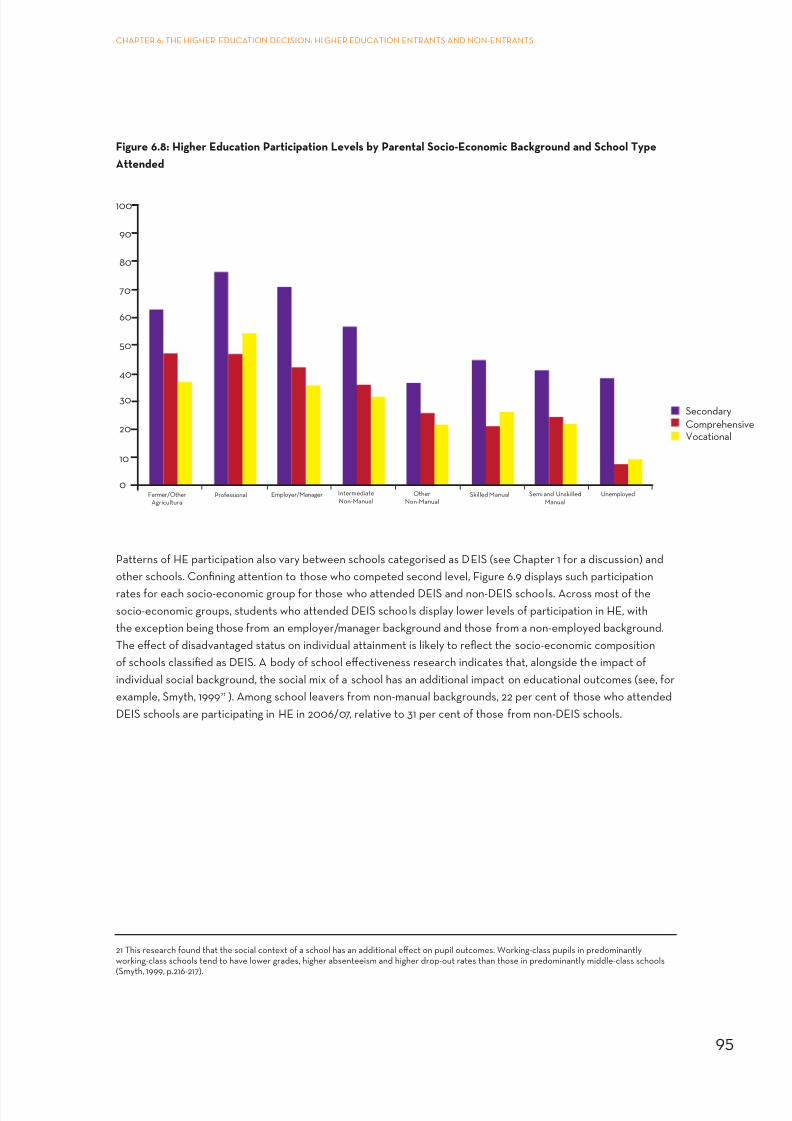
8/4/2019 BKMNEXT146
http://slidepdf.com/reader/full/bkmnext146 109/227
95
CHAPTER 6: THE HIGHER EDUCATION DECISION: HI GHER EDUCATION ENTRANTS AND NON-ENTRANTS
Figure 6.8: Higher Education Participation Levels by Parental Socio-Economic Background and School Type
Attended
0
10
20
30
40
50
60
70
80
90
100
Secondary
ComprehensiveVocational
Farmer/OtherAgricultural
Professional Employer/Manager IntermediateNon-Manual
OtherNon-Manual
Skilled Manual Semi and UnskilledManual
Unemployed
Patterns o HE participation also ary between schools categorised as DEIS (see Chapter 1 or a discussion) andother schools. Conning attention to those who competed second leel, Figure 6.9 displays such participation
rates or each socio-economic group or those who attended DEIS and non-DEIS schools. Across most o thesocio-economic groups, students who attended DEIS schools display lower leels o participation in HE, withthe exception being those rom an employer/manager background and those rom a non-employed background.The eect o disadantaged status on indiidual attainment is likely to reect the socio-economic compositiono schools classied as DEIS. A body o school eectieness research indicates that, alongside the impact oindiidual social background, the social mix o a school has an additional impact on educational outcomes (see, orexample, Smyth, 199921 ). Among school leaers rom non-manual backgrounds, 22 per cent o those who attendedDEIS schools are participating in HE in 2006/07, relatie to 31 per cent o those rom non-DEIS schools.
21 This research ound that the social context o a school has an additional eect on pupil outcomes. Working-class pupils in predominantlyworking-class schools tend to hae lower grades, higher absenteeism and higher drop-out rates than those in predominantly middle-class schools(Smyth, 1999, p.216-217).
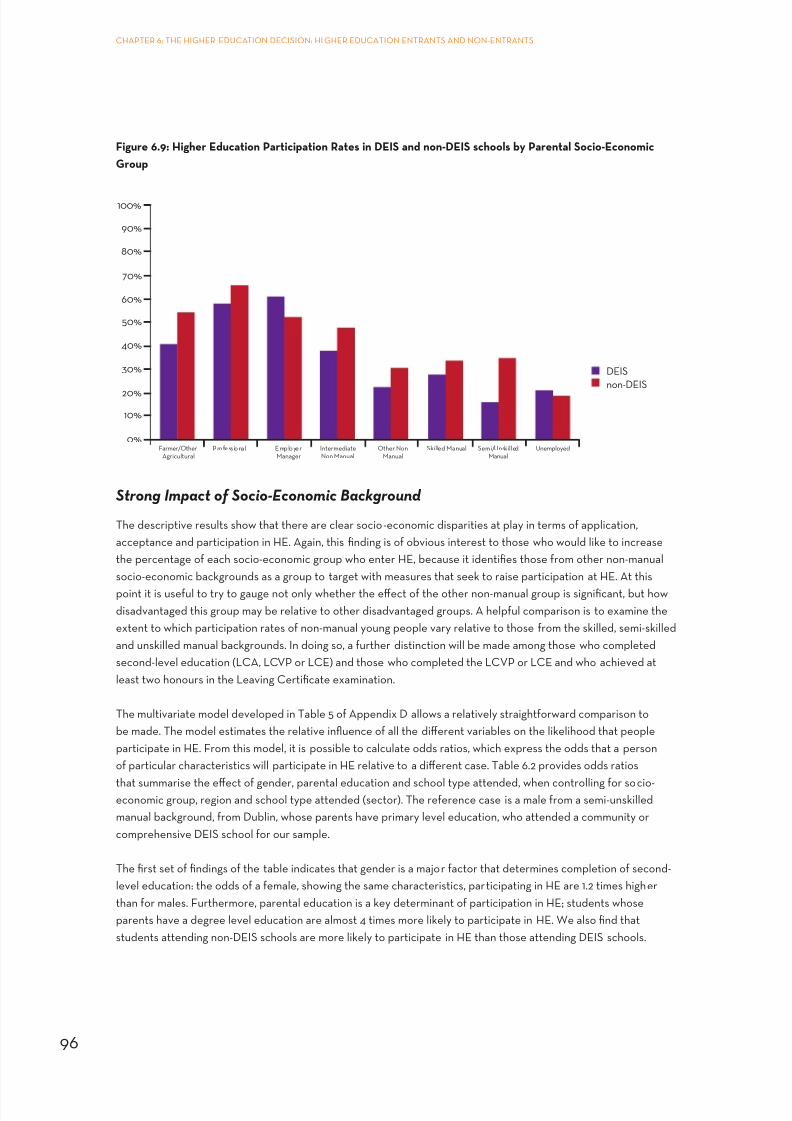
8/4/2019 BKMNEXT146
http://slidepdf.com/reader/full/bkmnext146 110/227
96
CHAPTER 6: THE HIGHER EDUCATION DECISION: HI GHER EDUCATION ENTRANTS AND NON-ENTRANTS
Figure 6.9: Higher Education Participation Rates in DEIS and non-DEIS schools by Parental Socio-Economic
Group
10%
0%
20%
30%
40%
50%
60%
70%
80%
90%
100%
Profess ional EmployerManager
Farmer/OtherAgricultural
IntermediateNon Manual
Other NonManual
Skilled Manual Semi/UnskilledManual
Unemployed
DEIS
non-DEIS
Strong Impact o Socio-Economic Background
The descriptie results show that there are clear socio-economic disparities at play in terms o application,acceptance and participation in HE. Again, this nding is o obious interest to those who would like to increasethe percentage o each socio-economic group who enter HE, because it identies those rom other non-manualsocio-economic backgrounds as a group to target with measures that seek to raise participation at HE. At this
point it is useul to try to gauge not only whether the eect o the other non-manual group is signicant, but howdisadantaged this group may be relatie to other disadantaged groups. A helpul comparison is to examine theextent to which participation rates o non-manual young people ary relatie to those rom the skilled, semi-skilledand unskilled manual backgrounds. In doing so, a urther distinction will be made among those who completedsecond-leel education (LCA, LCvP or LCE) and those who completed the LCvP or LCE and who achieed atleast two honours in the Leaing Certicate examination.
The multiariate model deeloped in Table 5 o Appendix D allows a relatiely straightorward comparison tobe made. The model estimates the relatie inuence o all the dierent ariables on the likelihood that peopleparticipate in HE. From this model, it is possible to calculate odds ratios, which express the odds that a persono particular characteristics will participate in HE relatie to a dierent case. Table 6.2 proides odds ratios
that summarise the eect o gender, parental education and school type attended, when controlling or socio-economic group, region and school type attended (sector). The reerence case is a male rom a semi-unskilledmanual background, rom Dublin, whose parents hae primary leel education, who attended a community orcomprehensie DEIS school or our sample.
The rst set o ndings o the table indicates that gender is a major actor that determines completion o second-leel education: the odds o a emale, showing the same characteristics, participating in HE are 1.2 times higherthan or males. Furthermore, parental education is a key determinant o participation in HE; students whoseparents hae a degree leel education are almost 4 times more likely to participate in HE. We also nd thatstudents attending non-DEIS schools are more likely to participate in HE than those attending DEIS schools.

8/4/2019 BKMNEXT146
http://slidepdf.com/reader/full/bkmnext146 111/227
97
CHAPTER 6: THE HIGHER EDUCATION DECISION: HI GHER EDUCATION ENTRANTS AND NON-ENTRANTS
Table 6.2: Odds Ratios or Participation in Higher Education
All Who Completed
Senior Cycle
All who completed
senior cycle andobtained 2+ Honours
Male 1.00 1.00
Female 1.25 1.16
Primary or Less 1.00 1.00
Junior Certicate 1.47 .946
Leaing Certicate or Equialent 2.30 1.03
Diploma 2.42 .945
Degree 3.90 1.64
Non DEIS school 1.38 1.12
DEIS school 1.00 1.00
The odds ratios presented in Table 6.2 are an indication o the inuence o gender, parental education andschool type on participation in HE among those who completed second-leel education. This proides a readycomparison or the impact o socio-economic background, which is illustrated by Figure 6.10. The reerence caseis still a male rom a semi-unskilled manual background, rom Dublin, whose parents hae primary leel education,who attended a community/comprehensie DEIS school. We now see how students rom higher socio-economicbackgrounds hae higher odds o participating in HE: oer two-old or a person rom a proessional background,employer/manager background and arming background, and almost one and a hal times or a person rom an
intermediate non-manual background22 . While those rom the proessional/employer/manager, arming andintermediate non-manual backgrounds are more likely to be in HE, the same cannot be said or those rom theother non-manual backgrounds. Indeed, their probability is een lower than the skilled, semi-skilled and unskilledmanual group.
22 Interaction eects were tested between gender and socio-economic background, but no eident interaction was ound.
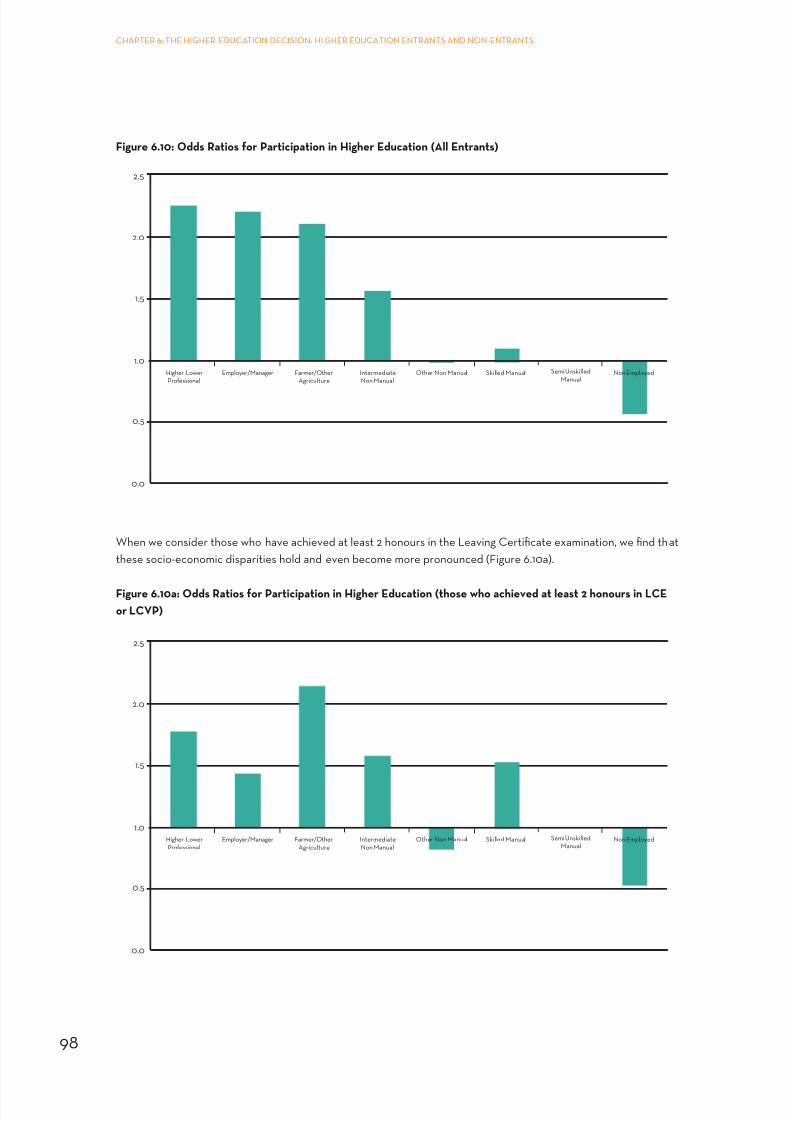
8/4/2019 BKMNEXT146
http://slidepdf.com/reader/full/bkmnext146 112/227
98
CHAPTER 6: THE HIGHER EDUCATION DECISION: HI GHER EDUCATION ENTRANTS AND NON-ENTRANTS
Figure 6.10: Odds Ratios or Participation in Higher Education (All Entrants)
0.0
0.5
1.0
1.5
2.0
2.5
Farmer/OtherAgriculture
Other Non Manual Skilled Manual Semi UnskilledManual
Non EmployedHigher LowerProfessional
IntermediateNon Manual
Employer/Manager
When we consider those who hae achieed at least 2 honours in the Leaing Certicate examination, we nd thatthese socio-economic disparities hold and een become more pronounced (Figure 6.10a).
Figure 6.10a: Odds Ratios or Participation in Higher Education (those who achieved at least 2 honours in LCE
or LCVP)
0.0
0.5
1.0
1.5
2.0
2.5
Farmer/OtherAgriculture
Other Non Manual Skilled Manual Semi UnskilledManual
Non EmployedHigher LowerProfessional
IntermediateNon Manual
Employer/Manager

8/4/2019 BKMNEXT146
http://slidepdf.com/reader/full/bkmnext146 113/227
99
CHAPTER 6: THE HIGHER EDUCATION DECISION: HI GHER EDUCATION ENTRANTS AND NON-ENTRANTS
6.4.2 Higher Education Sector
Dierentiation in the sector o HE that young people enter into is prominent, with school leaers rom moreadantaged backgrounds much more likely to enrol in uniersity courses than any other institute (Institutes o
Technology, Colleges o Education or Others). As shown in Figure 6.11, while almost two-thirds o HE participantsrom proessional backgrounds enter uniersity courses, less than one-third o those rom the other non-manualbackgrounds similarly enter courses in this sector.
Figure 6.11: Enrolment in University courses among Higher Education entrants by Parental Socio-Economic
Background
0
10
20
30
40
50
60
70
80
90
100
1997/1998
2002/20042006/2007Average
Farmer/OtherAgricultural
Professional Employer/Manager IntermediateNon-Manual
OtherNon-Manual
Skilled Manual Semi and UnskilledManual
Unemployed
The type o institution entered by other non-manual school leaers is similar to the pattern or semi- and unskilledmanual youth: while 35 per cent o other non-manual HE participants enter uniersity courses, 33 per cent o thesemi- and unskilled manual group similarly enrol on uniersity courses. Young people rom intermediate non-manual backgrounds, as well as being more likely (than the other non-manual group) to succeed at school andprogress to HE, are also more likely to enter courses in the uniersity sector.
Strong impact o Socio-Economic Background
In order to consider whether socio-economic disparity exists in terms o the type o HE sector that young peopleenter, we consider the sector o HE that non-manual young people enter relatie to those rom the semi-skilledand unskilled manual backgrounds through the use o odds ratios as beore. The multiariate model deelopedin Table 6 o Appendix D allows a relatiely straightorward comparison to be made. The model estimates therelatie inuence o all the dierent ariables on the likelihood that young people enter a uniersity ersus anyother type o HE institution. As beore, rom these models, it is possible to calculate odds ratios, which express theodds that a person o particular characteristics will attend HE at a uniersity relatie to a dierent case. Table 6.3proides odds ratios that summarise the eect o signicant ariables, when controlling or gender, socio-economicbackground, parental education, region, socio-economic group and school type attended (DEIS, sector).

8/4/2019 BKMNEXT146
http://slidepdf.com/reader/full/bkmnext146 114/227
100
CHAPTER 6: THE HIGHER EDUCATION DECISION: HI GHER EDUCATION ENTRANTS AND NON-ENTRANTS
The reerence case is a male rom a semi-unskilled manual background, liing in Dublin, whose parents haeprimary leel education, who attended a community/comprehensie, DEIS school or our sample.
Table 6.3: Odds Ratios or Participation at a University v Other Institution (All Higher Education Entrants)
All HE
Entrants
Eligible
Entrants
Parental Education
Degree 3.15 2.34
Primary or Less 1.00 1.00
We nd that apart rom socio-economic background, parental education is also a determinant o attending HE ata uniersity: students who hae a least one parent with a degree leel education are oer three times more likely
to attend a uniersity. Figure 6.12 then illustrates the impact o socio-economic background among all entrants.The blue bars indicate how students rom proessional, arming and skilled manual socio-economic backgroundsare oer one-and-a-hal times more likely to attend a uniersity than any other type o HE institution than thoserom a semi-unskilled or non-employed background. Those rom an intermediate non-manual backgroundshow considerably higher odds o attending a uniersity institution relatie to those rom an other non-manualbackground, the ormer displaying odds lower than those rom the semi-unskilled manual and non-employedbackgrounds. Interestingly, those rom employer/manager backgrounds also show similar odds o attending auniersity as the reerence group . The red bars then conne the analyses to only those who hae achieed atleast two honours in the Leaing Certicate (and so LCE and LCvP students). Again, we nd that the patternso odds o attending a uniersity relatie to any other HE type are structured in dierent directions or both theintermediate non-manual group and the other non-manual group.
Figure 6.12: Odds Ratios or Attending a University versus any other HE Type
0.0
0.5
1.0
1.5
2.0
2.5
EmployerManager
Professional Farmer/Other Manual
IntermediateNon Manual
OtherNon Manual
Skilled Manual Ref: Semi-UnskilledManual/Non
Employed
AI Entrants
Elegible Entrants

8/4/2019 BKMNEXT146
http://slidepdf.com/reader/full/bkmnext146 115/227
101
CHAPTER 6: THE HIGHER EDUCATION DECISION: HI GHER EDUCATION ENTRANTS AND NON-ENTRANTS
As noted in an earlier ootnote, a certain degree o caution should be exercised when interpreting these resultsdue to the smaller number o obserations in the sample as groups are disaggregated based on their trajectories.Howeer, a model with gender and socio-economic background tells us that the other non-manual group are
signicantly less likely to enter a uniersity relatie to the skilled, semi-skilled and unskilled manual groups.In this rened model when the disaggregated socio-economic categories are included in the model, we nd thatthe other non-manual hae a similar probability to each o the manual groups in terms o entry to uniersities (notshown here).
6.4.3 Course Level
Table 6.4 considers the proportion o HE participants (conning the analyses to data rom SLS 2002/04 and2006/07) who pursue an honours degree course. Among the 2002/04 entrants nearly seen-out-o-ten schoolleaers are taking honours degree courses, while among the 2006/07 entrants this has risen to eight out o ten.A higher proportion o emales than males opt or honours degree-leel courses and this is particularly eident
among the 2006/07 school leaers.
Table 6.4: Percentage o School Leavers in Full-Time Higher Education pursuing an Honours Degree on
Completion o their Course, 2006/07
2002/04 2006/07
All 69.7 84.2
Males 69.5 81.4
Females 69.8 86.6
Figure 6.13 then considers dierentiation across socio-economic groups. Once again dierentiation across socio-economic groups is noteworthy with a higher proportion o those rom proessional backgrounds enrolled onhonours degree courses relatie to those rom working class backgrounds. For example, 92 per cent o those roma proessional background opt or an honours degree course while this is the case or just 76 per cent o the othernon-manual group. In total 85 per cent o those rom the intermediate non-manual backgrounds pursue honoursdegree courses. Young people rom other non-manual and semi- and unskilled manual backgrounds are least likelyto enter higher status honours degree courses.

8/4/2019 BKMNEXT146
http://slidepdf.com/reader/full/bkmnext146 116/227
102
CHAPTER 6: THE HIGHER EDUCATION DECISION: HI GHER EDUCATION ENTRANTS AND NON-ENTRANTS
Figure 6.13: Percentage o School Leavers in Full-Time Higher Education who will Receive an Honours Degree
on Completion o their Course by Parental Socio-Economic Background
Strong Impact o Socio-Economic Background
Figure 6.13 illustrates that there are clear socio-economic disparities eident in terms o who pursues an honoursdegree leel course while at HE. Again, this nding is o obious interest in those who would like to reduce socio-economic inequalities in entry to HE. At this point we now gauge the extent o socio-economic disparity eident atthis stage, paying particular attention to the non-manual groups relatie to other socio-economic groups.
The multiariate model deeloped in Table 7 o Appendix D allows an unambiguous comparison to be made.The model estimates the relatie inuence o all the dierent ariables on the likelihood that people pursuehonours degree leel courses at HE. From this model it is possible to calculate odds ratios as beore, whichexpress the odds that a person o particular characteristics will pursue an honours degree leel course upon entryto HE relatie to a dierent case. Table 6.5 proides odds ratios that summarise the eect o gender, parentaleducation and school type attended, when controlling or other ariables in the model23 .
Table 6.5: Odds Ratios or Pursuing an Honours Degree Level Course
Odds Ratio
Males 1.00
Females 1.44
Parental Education
Degree 2.40
Primary or Less 1.00
vocational School .548
Secondary School 1.00
Community/Comprehensie 1.00
23 The reerence case is a male rom a semi-unskilled manual or non-employed background, rom Dublin, whose parents hae primary leeleducation and who attended a community/comprehensie DEIS school.
0
10
20
30
40
50
60
70
80
90
2002/2004
2006/2007
Average
Farmer/OtherAgricultural
Professional Employer/Manager IntermediateNon-Manual
OtherNon-Manual
Skilled Manual Semi and Unskilled
Manual
Unemployed

8/4/2019 BKMNEXT146
http://slidepdf.com/reader/full/bkmnext146 117/227
103
CHAPTER 6: THE HIGHER EDUCATION DECISION: HI GHER EDUCATION ENTRANTS AND NON-ENTRANTS
Again, we nd signicant gender dierences in terms o the leel o HE pursued, with emales being 1.4 times morelikely to pursue an honours degree than males, all else being equal (that is, showing the same characteristics).Furthermore, parental education leels also approach signicance, with students whose parents hae a degree
leel education being almost two and hal times more likely to pursue an honours degree than students whoshare the same characteristics but whose parents hae a primary leel education. We also nd that students whoattended ocational schools are less likely to pursue an honours degree at HE.
These odds ratios suggest considerable ariation with regard to the characteristics o young people who pursuehonours degree leel courses at HE. In terms o socio-economic disparities, Figure 6.14 shows how students romproessional, arming and intermediate non-manual socio-economic groups are more likely to pursue an honoursdegree leel course at HE. That is, these students hae higher odds o pursuing an honours degree leel courserelatie to students rom manual socio-economic groups. While the other non-manual group are somewhat morelikely to display higher odds o pursuing an honours degree leel course, the probability o this is not statisticallysignicant (see Table 7 in Appendix D)24 .
Figure 6.14: Odds Ratios or Pursuing an Honours Degree Level Course (All Entrants)
0.0
0.5
1.0
1.5
2.0
2.5
3.0
3.5
Farmer/OtherAgriculture
Other Non Manual Skilled Manual Semi UnskilledManual/ Non Employed
Professional IntermediateNon Manual
Employer/Manager
6.4.4 Receipt o Grant
Oerall, the proportions o HE participants in receipt o State Financial Support (in the orm o a grant), elloer the ten year period (Table 6.6) rom 47 per cent in 1997/98 to 35 per cent in 2006/07. In all years, emale HEparticipants are more likely to be in receipt o a grant than their male counterparts.
24 In order to test i these ndings are applicable relatie to all manual groups, Table 7a and Table 7b in Appendix D consider this model includingonly gender and socio-economic background. When using the disaggregated measure o socio-economic group, we nd that the other non-manualgroup are no more likely than each o the manual groups to pursue an honours degree leel course at HE.

8/4/2019 BKMNEXT146
http://slidepdf.com/reader/full/bkmnext146 118/227
104
CHAPTER 6: THE HIGHER EDUCATION DECISION: HI GHER EDUCATION ENTRANTS AND NON-ENTRANTS
Table 6.6: Percentage o Full-Time Higher Education Entrants receiving a Grant
1997/98 2002/04 2006/07
All 46.9 37.3 34.4
Males 43.7 35.5 32.3
Females 49.6 38.8 36.2
Figure 6.15 then illustrates grant receipt or each socio-economic group and we see a decline in grant receipt bymany socio-economic groups oer this time period. Gien that eligibility or nancial support is, in most cases,based on parental income, it is not surprising to nd that those rom more adantaged proessional and employersocio-economic backgrounds are least likely to be in receipt o a grant, while those rom semi- and unskilledmanual and unemployed backgrounds are most likely to receie a grant (Figure 6.15). The proportion o HE
students rom the other non-manual group in receipt o a grant are largely similar to proportions or the skilledmanual group, while grant receipt is somewhat lower among the intermediate non-manual group, particularlyin more recent years, suggesting that this group has been impacted greatest by changes in income eligibilitythresholds oer time. Further discussion o this issue is detailed in a recent study on the costs o participating inHE (McCoy et al ., orthcoming). We also nd that grant receipt has increased somewhat among entrants rom thenon-manual group. It is interesting to obsere high leels o grant take-up among those rom a arming background.
Figure 6.15: Percentage o Full-Time Higher Education Participants Receiving Grant by Parental
Socio-Economic Background
0
10
20
30
40
50
60
70
80
90
100
1997/1998
2002/20042006/2007Average
Farmer/OtherAgricultural
Professional Employer/Manager IntermediateNon-Manual
OtherNon-Manual
Skilled Manual Semi and Unskilled
Manual
Unemployed
Impact o Socio-Economic Group on Grant ReceiptTo consider socio-economic ariation in grant receipt, we consider the extent to which young people rom non-manual backgrounds receie grants once entry into HE has been naigated relatie to those rom the semi-skilled/unskilled manual/non-employed groups. The multiariate model deeloped in Table 8 o Appendix D estimates therelatie inuence o all the dierent ariables on the likelihood o gaining a grant once people enter HE.

8/4/2019 BKMNEXT146
http://slidepdf.com/reader/full/bkmnext146 119/227
105
CHAPTER 6: THE HIGHER EDUCATION DECISION: HI GHER EDUCATION ENTRANTS AND NON-ENTRANTS
As beore, rom this model it is possible to calculate odds ratios which express the odds that a person (oparticular characteristics) will receie a grant. Table 6.7 displays the odds ratios that summarise the eect oparental education, when controlling or all ariables in the model. We nd that the higher the leel o education
that a young person’s parents hold, the lower the odds o receiing a grant.
Table 6.7: Odds Ratios or Receiving a Grant
Odds o Receiving
a Grant
Parental Education
Primary or Less 1.00
Junior Certicate .345
Leaing Certicate .272
Diploma .230
Degree .110
Figure 6.16 illustrates the impact o socio-economic group on grant receipt. We now see how students romproessional, employer/manager, arming and intermediate non-manual groups hae similar odds o not receiing agrant while students rom other non-manual and skilled manual groups hae similar odds o receiing a grant.
Figure 6.16: Odds Ratio o Receiving a Grant (All Entrants)
0.0
0.5
1.0
1.5
2.0
2.5
3.0
.
Farmer/OtherAgriculture
Other Non Manual Skilled Manual Semi UnskilledManual/ Non Employed
Professional IntermediateNon Manual
Employer/Manager
6.4.5 Dropout rom Higher Education in 2006/07
The most recent cohorts o the School Leaers’ Surey data allow us to consider the prealence o dropout amongHE participants. Dropouts rom HE are dened as those who indicate that they enrolled in HE at some point aterleaing school but who are no longer enrolled at the time o the surey (2 years ater leaing school). Table 6.8suggests an oerall dropout rate o approximately 12 per cent, with males displaying higher dropout leels thanemales: 15 per cent relatie to 10 per cent.
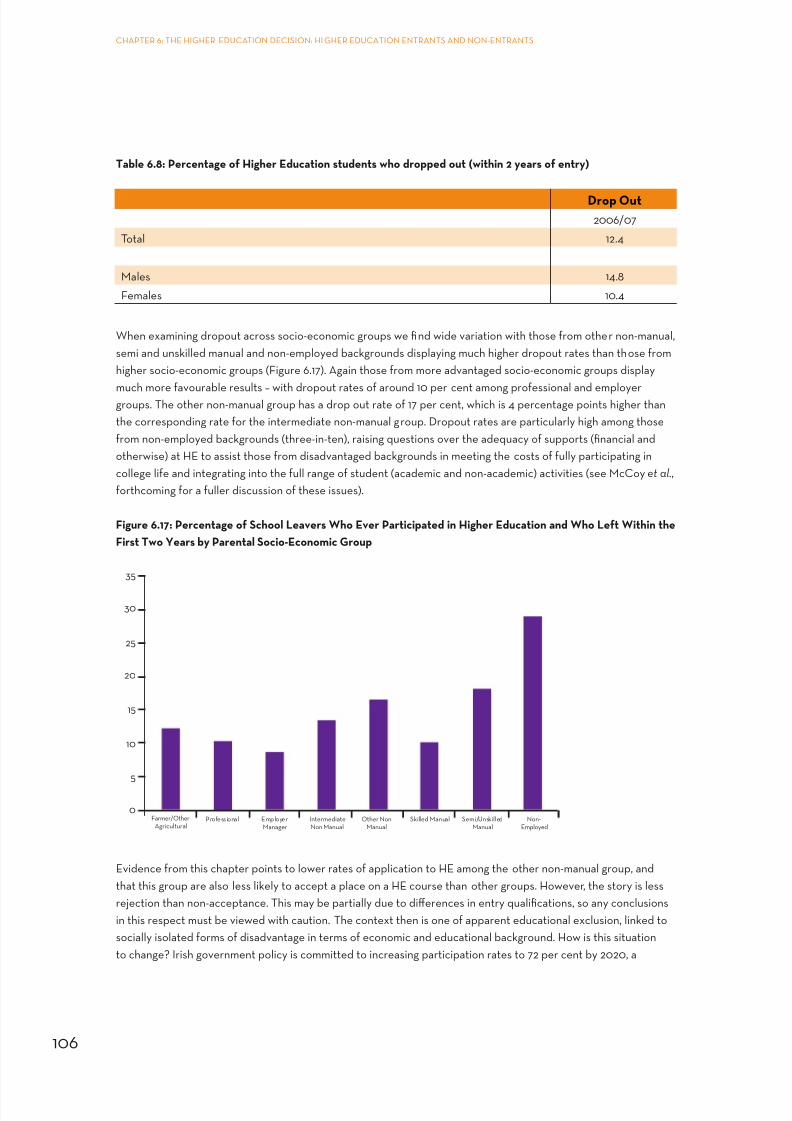
8/4/2019 BKMNEXT146
http://slidepdf.com/reader/full/bkmnext146 120/227
106
CHAPTER 6: THE HIGHER EDUCATION DECISION: HI GHER EDUCATION ENTRANTS AND NON-ENTRANTS
Table 6.8: Percentage o Higher Education students who dropped out (within 2 years o entry)
Drop Out
2006/07
Total 12.4
Males 14.8
Females 10.4
When examining dropout across socio-economic groups we nd wide ariation with those rom other non-manual,semi and unskilled manual and non-employed backgrounds displaying much higher dropout rates than those romhigher socio-economic groups (Figure 6.17). Again those rom more adantaged socio-economic groups display
much more aourable results – with dropout rates o around 10 per cent among proessional and employergroups. The other non-manual group has a drop out rate o 17 per cent, which is 4 percentage points higher thanthe corresponding rate or the intermediate non-manual group. Dropout rates are particularly high among thoserom non-employed backgrounds (three-in-ten), raising questions oer the adequacy o supports (nancial andotherwise) at HE to assist those rom disadantaged backgrounds in meeting the costs o ully participating incollege lie and integrating into the ull range o student (academic and non-academic) actiities (see McCoy et al .,orthcoming or a uller discussion o these issues).
Figure 6.17: Percentage o School Leavers Who Ever Participated in Higher Education and Who Let Within the
First Two Years by Parental Socio-Economic Group
5
10
15
20
25
30
35
0Farmer/Other
AgriculturalProfessional Employer
ManagerIntermediateNon Manual
Other NonManual
Skilled Manual Semi/UnskilledManual
Non-Employed
Eidence rom this chapter points to lower rates o application to HE among the other non-manual group, andthat this group are also less likely to accept a place on a HE course than other groups. Howeer, the story is lessrejection than non-acceptance. This may be partially due to dierences in entry qualications, so any conclusionsin this respect must be iewed with caution. The context then is one o apparent educational exclusion, linked tosocially isolated orms o disadantage in terms o economic and educational background. How is this situationto change? Irish goernment policy is committed to increasing participation rates to 72 per cent by 2020, a
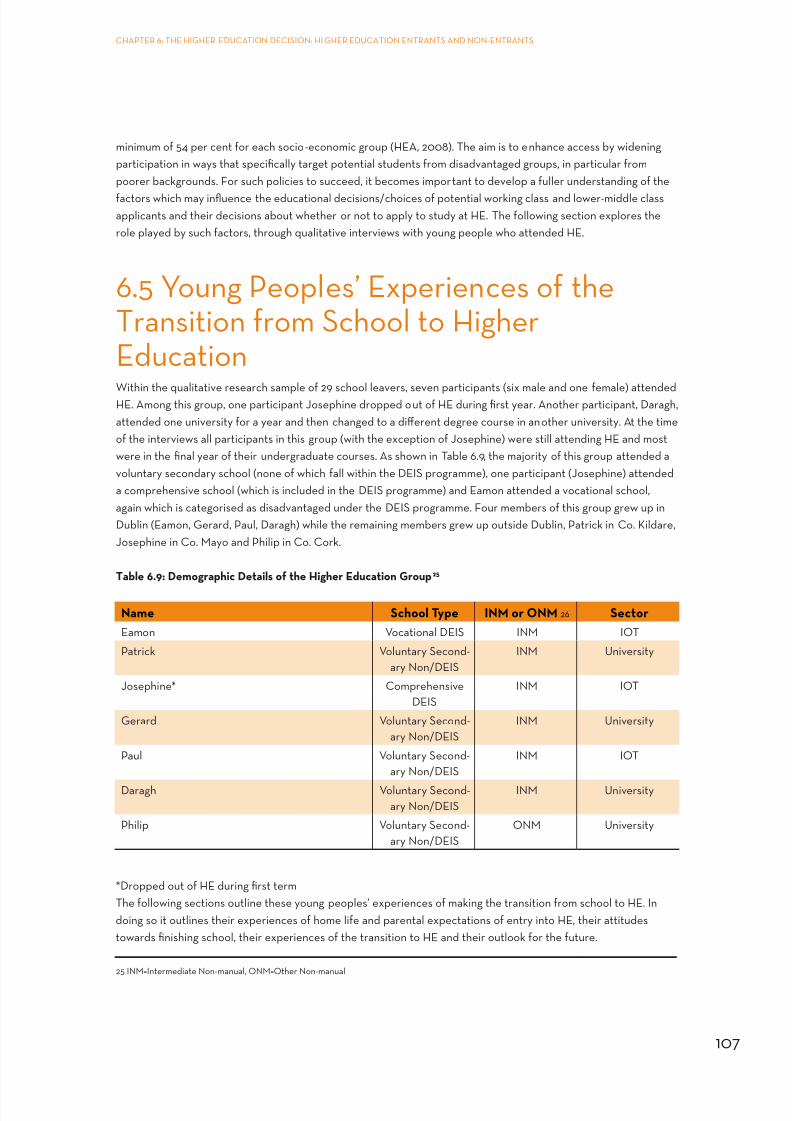
8/4/2019 BKMNEXT146
http://slidepdf.com/reader/full/bkmnext146 121/227
107
CHAPTER 6: THE HIGHER EDUCATION DECISION: HI GHER EDUCATION ENTRANTS AND NON-ENTRANTS
minimum o 54 per cent or each socio-economic group (HEA, 2008). The aim is to enhance access by wideningparticipation in ways that specically target potential students rom disadantaged groups, in particular rompoorer backgrounds. For such policies to succeed, it becomes important to deelop a uller understanding o the
actors which may inuence the educational decisions/choices o potential working class and lower-middle classapplicants and their decisions about whether or not to apply to study at HE. The ollowing section explores therole played by such actors, through qualitatie interiews with young people who attended HE.
6.5 Young Peoples’ Experiences o theTransition rom School to HigherEducationWithin the qualitatie research sample o 29 school leaers, seen participants (six male and one emale) attendedHE. Among this group, one participant Josephine dropped out o HE during rst year. Another participant, Daragh,attended one uniersity or a year and then changed to a dierent degree course in another uniersity. At the timeo the interiews all participants in this group (with the exception o Josephine) were still attending HE and mostwere in the nal year o their undergraduate courses. As shown in Table 6.9, the majority o this group attended aoluntary secondary school (none o which all within the DEIS programme), one participant (Josephine) attendeda comprehensie school (which is included in the DEIS programme) and Eamon attended a ocational school,again which is categorised as disadantaged under the DEIS programme. Four members o this group grew up inDublin (Eamon, Gerard, Paul, Daragh) while the remaining members grew up outside Dublin, Patrick in Co. Kildare,Josephine in Co. Mayo and Philip in Co. Cork.
Table 6.9: Demographic Details o the Higher Education Group25
Name School Type INM or ONM 26 Sector
Eamon vocational DEIS INM IOT
Patrick voluntary Second-ary Non/DEIS
INM Uniersity
Josephine* ComprehensieDEIS
INM IOT
Gerard voluntary Second-ary Non/DEIS
INM Uniersity
Paul voluntary Second-ary Non/DEIS
INM IOT
Daragh voluntary Second-ary Non/DEIS
INM Uniersity
Philip voluntary Second-ary Non/DEIS
ONM Uniersity
*Dropped out o HE during rst termThe ollowing sections outline these young peoples’ experiences o making the transition rom school to HE. Indoing so it outlines their experiences o home lie and parental expectations o entry into HE, their attitudestowards nishing school, their experiences o the transition to HE and their outlook or the uture.
25 INM=Intermediate Non-manual, ONM=Other Non-manual
8/4/2019 BKMNEXT146
http://slidepdf.com/reader/full/bkmnext146 122/227
108
CHAPTER 6: THE HIGHER EDUCATION DECISION: HI GHER EDUCATION ENTRANTS AND NON-ENTRANTS
6.5.1 Home Lie and Parental Expectations
Regarding the socio-economic background o this group, the parents (one or both) o six participants are employedin intermediate non-manual jobs and the ather o the remaining participant, Philip, is rom an other non-manualsocio-economic background26 . Just one participant has parents who attended HE and one participant has a parentwho is currently pursuing an Arts degree as a mature student. Gerard was somewhat distinct out o the group,in that his ather ‘was the only one out o his whole amily who went to college like, so he sort o puts a hugeemphasis on education’.
When participants spoke about their siblings it transpired that the majority o this group hae a sibling who hadattended or was currently attending HE. Only one participant (Josephine) did not hae a sibling who attended HEbut has a younger sibling in Leaing Certicate year who she beliees will ‘denitely’ progress to HE. The inuenceo parental and sibling expectations and choice in relation to HE were powerul or these indiiduals. In comparing
the inuence o peers relatie to siblings, or instance, Philip responds:
Do you think it might hae discouraged you i none o your riends were going to college?‘Not really, I suppose it is more the amily really, my brothers and sisters went to college’.
A number o them talked about the impact o haing an older sibling in HE; Patrick, or example, spoke o theimpact o his older brother:
‘I would hae been going into junior cert, third year. He went, he started college, so I kind o got a taste owhat college was like you know, through him, and as ar as I can remember he was set to go to college … hewas brilliant… he got 600 points in his Leaing like, so he was always geared towards going towards college’.
In relation to their own post-school pathways, the general eeling in the group was that HE was a naturalprogression or them. As Eamon stated about his lie stages:
‘you go to pre-school, primary school, secondary school, college and then to work’.
Participants were questioned about when the decision to attend HE was reached. The general consensus amongthis group was that progression to HE was simply ‘assumed’ (Gerard). When asked to elaborate on when and howthe expectation to attend HE deeloped, Gerard relayed that it was
‘just sort o like unspoken, I wouldn’t een hae talked about it’.
Similarly as Paul put it, rather than discussing i he was going to attend HE:
‘the rst question would hae been what college are you going to’.
Philip made a similar comment:
‘Yeah I was denitely going to go to college it was just a matter o how many points I got and what courses Igot accepted into’.
26 This contrasts with members o both the labour market entrant and PLC/Apprenticeship groups in the ollowing chapters o this report, hal owhom came rom other non-manual backgrounds.
8/4/2019 BKMNEXT146
http://slidepdf.com/reader/full/bkmnext146 123/227
109
CHAPTER 6: THE HIGHER EDUCATION DECISION: HI GHER EDUCATION ENTRANTS AND NON-ENTRANTS
Likewise, Daragh simply states ‘I always thought I was going to get to college’. When asked i there was a time whenhe made that decision, he reects it was:
‘just always there, there was neer a time where I decided yeah I’ll go to college’.
Additionally participants spoke about growing up in an enironment where HE was alued and there was always astrong likelihood that they would attend. Josephine summed up this point when reerring to her mother’s positieopinion o HE:
‘well I suppose because she recognises that i you hae a degree or you hae a proession, you’re going toget on better in the world than i you don’t and it’s the truth’.
Oerall the participants in this group elt they were encouraged rather than as Paul elt ‘pushed’ by their parentsto attend HE. This is important to note as it may indicate that other actors may hae a role to play in young
peoples’ decisions to attend HE, such as peer or school inuences. On the other hand, it could suggest thatparticipants in this group were always likely to attend and deeloped such aspirations early on, so their parents (orother signicant others) neer needed to ‘push’ them.
This contrasts with the experiences which other young people may ace, as Eamon contends the inuence o thelocal enironment and HE participation in a local area can be important:
‘… where do they lie? What’s their social standard? You know does eeryone in there [that area] go tocollege [or] there’s no-one in your area go to college, I mean that’s a big thing … you got your good areas andyou hae bad areas and statistically you know good areas go to college and bad areas don’t go to college ormoe in to the lower end jobs’. (Eamon)
6.5.2 Attitudes towards nishing school
In order to gauge how happy participants in this group were with their options they were asked to describe howthey elt when leaing school. All participants in the HE group described being optimistic about their uture.Naturally some members o this group relayed eelings o sentiment at the prospect o leaing their school riends,thus eeling a mixture o emotions. As Eamon put it:
‘in a way getting out o sixth year it’s time to moe on to the next stage. But you know at times it’s sad youknow who your riends are and eeryone is going separate directions. [I was] generally positie about gettinginto college and starting’.
The general eeling amongst the participants in this group was that they were looking orward to starting collegeand lie ater school. As Paul said:
‘I remember there was a real buzz around who was going to where and you ound out riends that you werein class with going to the same college. Yeah, I remember that, that was really good’.
6.5.3 Experiences in Higher EducationIn general this group spoke positiely about their experiences in HE. There was ariation in the type o institutionattended by participants in this group i.e. three attended institutes o technology and our enrolled in uniersitycourses. Amongst this group, our indiiduals did not receie grants (Eamon, Gerard, Paul, Daragh), whilst the re-

8/4/2019 BKMNEXT146
http://slidepdf.com/reader/full/bkmnext146 124/227
110
CHAPTER 6: THE HIGHER EDUCATION DECISION: HI GHER EDUCATION ENTRANTS AND NON-ENTRANTS
maining three were eligible or a grant. It is interesting to note that no member o this group raised lack o nanceduring their college years as an issue o major concern to them. On the other hand the majority o the group liedin their amily home while attending (with the exception o Josephine). On the issue o nances some members othis group raised the point that while they attended HE they orwent earnings compared to peers who entered thework orce or began an apprenticeship directly ater nishing second leel. Howeer, or the most part those whoraised this point elt that their earning potential would increase due to their academic qualications and thereorerealised the opportunity cost o HE.
A number o respondents raised the issue o parents nancially supporting them while they attended college andthe important role this plays or other HE students. As Eamon notes, or many students:
‘there’s no need or them to go to work now because the chances are their parents are gonna pay or themthrough college and you just hae to look around this college, I mean most o the students they aren’tworking or anything they’re just, how they’re able to get the money to lie their lie and it’s probably coming
rom the parents because the economy is doing so well’.
Howeer, Eamon’s experiences were by no means common to all participants; Eamon, and Philip, were in theminority in not haing a regular part-time job while attending HE, in Philip’s case saings rom summer-timeemployment alongside money rom his parents proided him with sucient unds to support him during theacademic year. Howeer, Daragh, Gerard, Josephine and Paul all rely heaily on the income they receie rom theirpart-time employment. For some, much o their earnings were to maintain a car and or socialising:
‘all the money I hae now is just or pleasure more so than anything else’.
Others used the unds or basics such as ood, college materials and trael. Howeer, as noted earlier almost allmembers o this group o HE entrants lied at home with their parents and hence did not hae the additional
expenses o maintaining an independent household.
Participants identied a range o actors that inuenced their college choice processes. Patrick spoke again o theimpact o the college his brother attended:
‘I had kind o decided I would go to [name o uniersity] cause my brother went there and he was, he wasery pleased with it, seemed to be getting on well and I would’e isited him in college a ew times, beore Iactually went into college and I liked the look o the place’.
Almost all participants spoke o attending college open days and careers eents (such as the annual eent hostedby the RDS):
‘Well I went to the open day there [name o college] and it just seemed like a good college and socially itseemed to be a good place as well’ (Philip).
Participants were also quite instrumental in their course choices, while career goals played a somewhat lessprominent role. Most elt that there would be plenty o opportunity during the course o their degree to ne-tunetheir specic career path:
‘I suppose it was always in the back o your mind, what you’re going to end up working as. But there was no,no real concerns, just like oh you know maybe in ten years time what are you going to be? … there was neerany serious thought put into it, it was more so, you go to college and then you worry about it [your career]aterwards’. (Patrick)
8/4/2019 BKMNEXT146
http://slidepdf.com/reader/full/bkmnext146 125/227
111
CHAPTER 6: THE HIGHER EDUCATION DECISION: HI GHER EDUCATION ENTRANTS AND NON-ENTRANTS
Most o the participants chose ‘broad’ courses which would allow them to make more specic career planslater.
‘Well at the time I wasn’t interested in anything too specic like, so it seemed like a broad enough course’(Philip),
Howeer, there were exceptions, and a minority o respondents were quite ocused on their career prospects inchoosing a course:
‘I wouldn’t hae any particular passion or it really but I think you’d get a good job rom it … haing goodcareer prospects would be the most important thing in my opinion’ (Philip).
Some ound that work experience they had undertaken while at school helped to identiy areas o interest ornot o interest. Paul ound that a period o Transition Year work experience in manual employment reinorced his
interest in progressing to HE and urthering his education:
‘I did my work experience with the lads, I worked oer in [name] hospital and I knew the maintenance guysand I did my work experience … they sent me to all departments, the carpentry, the electricians and theplumber … I really didn’t like it’.
As mentioned earlier, only one participant (Josephine) in this group is currently not attending a third-leelinstitution. Josephine beliees one o the main reasons why she dropped out was because, at 17 years o age, shewas ‘immature’ when she entered HE. She elt delaying entry to college by one year would mean young people are‘more mature’ when they go. Josephine realised that the ‘reedom’ she encountered in HE was an important parto college lie or her. In her own admission, when asked what she liked about college, she replied:
‘the reedom’ and when asked i she disliked anything about college, she also replied ‘the reedom’.
It is interesting to note that only one member o this group mentioned immaturity as an impediment to HE,whereas it is raised by a higher number o participants in the other two groups. In particular, a number o memberso the LM group express the iew that they were immature during the latter stages o their schooling and onleaing school, which led to poor behaiour and poor choices, which they now regret.
One criticism about lie in HE raised by seeral members o this group related to the scale and size o theinstitutions. Daragh started a degree course in uniersity, which he let shortly ater the Christmas o his rstyear, or two main reasons. First he elt the subjects in this course did not suit him and he belieed his guidancecounsellor should hae gien him more ‘clear, concise inormation about the course’. Secondly, he criticised the
scale and size o the uniersity he attended and elt ‘there’s no real atmosphere’ in a bigger uniersity. By the timeDaragh had made a decision to leae that uniersity he had already decided to start a dierent course in anothercollege. He ound the new college more suited to his needs as:
‘the college is completely dierent as well as college lie, it’s a more homely atmosphere, it’s small and smallclasses so you get to know your lecturer and you can interact with the lecturer better’ (Daragh).
Two other members o this group raised this point. Gerard described the uniersity he attended as:
‘just like an institution, you know. It’s like a sheep actory or something you just go in there maybe meet acouple o people and just out the other door’.

8/4/2019 BKMNEXT146
http://slidepdf.com/reader/full/bkmnext146 126/227
112
CHAPTER 6: THE HIGHER EDUCATION DECISION: HI GHER EDUCATION ENTRANTS AND NON-ENTRANTS
Whereas he elt a smaller college may allow students to ‘get to know the lecturers on a one-to-one basis’. Gerardelaborated on this point:
‘… i you were speaking to a person you’d meet them the rst week, you might see them the next weekand go oh right you know how’s such and such getting on. You’d remember speaking to them aboutsomething. Like in [name o uniersity] by and large ... you are talking to you know a girl or ellow beside youand you are not going to see them again. … you are making small talk conersation with eeryone you meet.And you’e a lot o these kind o, you know acquaintances more so, like you’d see them but you wouldn’thae any dealings with them. So that’s why like the likes o [institute o technology] and that all their classes,you see their classes and they are all mates, they’e only known each other or like, it’s pretty much like wewere in school. You know when a new lad came into school you made riends with them. I nd the [name oinstitute o technology] lads are a lot closer than [name o uniersity] lads’.
Paul, who is attending an institute o technology, also raised this issue: when asked what he liked about the college
he replied:
‘It’s small and you know eeryone and lecturers, it’s real personable. And [name o uniersity] is great, Iwould hae loed to go there but eeryone I’e spoken to they loed it or a year and then it’s just so big, likethey just get tired o it. It’s tiresome’.
Oerall, participants in this group were happy with their decision to attend HE. It would appear respondents placea alue on this education and eel attending HE is not only an important part o lie but also allows a good qualityliestyle. Daragh illustrated this point when he spoke about haing an opportunity to join the Gardaí when henished secondary school. In the end he decided to attend HE rather than join the Gardaí, and when asked why,he replied:
‘I knew it was better to get a degree rst’.
He then went on to explain that
‘I was too young, [reerring to joining the Gardaí], thought I’d hae no lie you know, where I could gotraelling during the summers or I could go o to Australia or a year’ (Daragh).
Howeer, one respondent, Eamon, elt that those who had entered the labour market on leaing school hadsecured a (short-term) earnings adantage, which was illustrated by their ability to get on to the property ladder:
‘Those guys who didn’t do their Leaing Cert or who did crap in the Leaing Cert, didn’t go to college, one
o them is a reenue manager o a hotel … another guy he went in to do plastering … he just bought a house.Another guy went and worked or the rail serice again has just bought a house … it’s pretty impressie reallyand we’re all in college you know liing o daddy’s back pretty much. … So I’m our years behind now when Igo into employment … will I earn enough money to make that back? You can debate it’.
When asked what they liked about HE answers ranged rom an educational perspectie , such as learning tobe being critical (Patrick), to a more social point o iew – or example, enjoying the student bar (Gerard). Twoparticipants mentioned that the industry in which a person would like to work should dictate i a person attendsHE, rather than eeling it is a necessity. They elt that doing a trade and gaining an apprenticeship could be just asaluable as a degree (Philip, Eamon). Eamon went on to suggest that some indiiduals rom certain backgroundsmight naturally ollow in their parents’ ootsteps and enter a trade or example.

8/4/2019 BKMNEXT146
http://slidepdf.com/reader/full/bkmnext146 127/227
113
CHAPTER 6: THE HIGHER EDUCATION DECISION: HI GHER EDUCATION ENTRANTS AND NON-ENTRANTS
Patrick captures the essence o HE education or him when he states:
‘I denitely would not regret going to college, I think I’e learned more in college than I hae anywhere else
… in the social or political realm, college was … you nd you’re able to get a proper kind o understanding, asopposed to repeating what people say. You get into it yoursel … it encourages you to be kind o critical oyou know things, that’s probably the essence o college degrees anyway, it’s to encourage you to be kind oanalytical and critical o things … I think college has been hugely benecial in that respect’.
This point was also illustrated when participants were asked how to motiate someone to go to college. In generalthe responses were o three categories. One, to explain the social side o college, which young people in thissample elt would tempt anyone to college (Patrick, Paul). Second, that unless a person showed a desire to attendthey should not be orced as they should ‘hae an interest in it’ (Gerard). Others reerred to the career prospectsand personal ullment o achieing HE qualications, as Josephine relayed:
‘I’d just say well what do they want or their lie, do they want to be in dead end jobs or the rest o their lieor do they want to you know hae a proession or you know be happy’.
6.5.4 Reection on Post-School Pathway
Participants were asked to reect on their post school pathway and consider i they were currently doing whatthey elt they would be doing when they were in their nal year o school. One participant could not reallycomment on this as he elt he neer thought too much about his uture when he attended second-leel school(Paul). Josephine elt at this stage she would be completing her nal year in college. The remaining participants inthis sample elt that, while they may not be doing the exact course they enisaged, they were at the stage o theireducation they elt they would be at. It is important to note that no participant spoke about expecting to do anapprenticeship or entering the workorce directly. Again this reiterates the point made earlier that participants
in this group generally elt (rom a relatiely early stage) that they would attend HE. To probe this issue urtherparticipants were asked i they could describe what they elt inuenced them most in choosing HE as their postschool pathway. Participants ound this dicult to pinpoint. Only one respondent could identiy a main inuenceon their decision to attend HE. This was Daragh who elt his elder sister was his main inuence. She was alwaysunhappy in her job and she encouraged him to attend so he would hae more career options. As most peoplein this group could not pinpoint any specic inuencing actor on their decision to attend this could signiy how‘innate’ attending HE is or this group.
Participants were asked i they were happy with their post school choices. Also i they would preer to do things adierent way, they were asked what would help them. The majority o this group were happy with their post schoolpathways. Howeer, one participant (Eamon) elt i he was to change anything he might do a degree by night and
work during the day. This was due to nancial reasons.
Respondents were also asked their iews on their peers who did not progress to HE. A number o respondentsaccepted that HE was not necessarily or eeryone. As Philip comments on his peers who did not go to HE, theirdecision may hae stemmed rom a less academic orientation or a dierent emphasis in their (home) enironment:
‘I mean maybe they just weren’t you know academically that well or anything or they preerred to dosomething more practical in their lie like art … [or] a trade or something like that. I wouldn’t say they werediscouraged rom it like, but maybe they weren’t pushed into an academic kind o liestyle’.
Participants were asked to gie three pieces o adice to someone currently doing their Leaing Certicate. For
8/4/2019 BKMNEXT146
http://slidepdf.com/reader/full/bkmnext146 128/227
114
CHAPTER 6: THE HIGHER EDUCATION DECISION: HI GHER EDUCATION ENTRANTS AND NON-ENTRANTS
the most part the adice suggested by participants reected their indiidual experiences. For example, Eamonsuggested studying harder to get more points, as not eeryone (including himsel) will get their number one option.
In general the adice centred on two main issues. First, respondents emphasised studying harder in school toensure maximum points in the Leaing Certicate, which would improe the chances o securing their highestCAO preerence. Most young people in this group elt that higher Leaing Certicate examination results will leadto more options in the long term. Second, participants adised students to thoroughly research college courses toensure that subjects taken on dierent modules would be o interest. This would allow young people to make an‘inormed decision’ (Gerard) on their CAO preerences. It is important to note that the adice gien by this groupocuses heaily on HE issues, again illustrating the importance they attach to HE.
6.5.5 Future Thoughts
Finally, participants in this group were predominantly positie about their uture plans. Josephine elt she would
continue with her QFA accountancy modules and remain in employment simultaneously. The most commonthought amongst participants in this group was to trael abroad when they nish their degrees (Philip, Eamon,Patrick, Gerard). They elt they would delay looking or a ‘proper job’ until ater they had traelled abroad (Philip).The remaining participants elt they would do a postgraduate course. As Paul explained:
‘Well I think eeryone’s going to college these days so like I don’t know, I think a Masters now is the, it’s whatcollege was teen years ago a Masters is now’.
One participant (Philip) ruled out urther education as an option or his immediate plans.
It is important to note that most participants in this group elt that they needed more time to decide on the areain which they would seek employment. Daragh elt his best option was to take a year out ater college and decide
during that year the area where he would like to work. As he explained:
‘It’s just yoursel, it’s up to you to decide, as you get older and more mature, you’re going to be able to makeyour decisions. I suppose experience as well, i I get the experience o teaching and I don’t like it, I’ll knowthen it’s not or me’.
At no point did any participant in this group relay negatie eelings about their capacity to gain employment whenthey nished their course.
6.5.6 Summary o the experience o higher education entrants
Considering the amily expectations that they spoke about coupled with their positie school experiences it isunsurprising that these indiiduals always belieed HE was on their agenda. It is interesting to note that only onemember o this group could pinpoint what inuenced him to attend, this being a amily member. Thus it could beargued that or some young people attending HE is somewhat internalized in their psyche.
As discussed in Chapter Fie, in relation to second-leel, one participant in this group mentioned disruptiebehaiour in class and another brought up poor quality teaching. Howeer, in general the participants in thisgroup spoke positiely about their school days and by their own admission elt encouraged by their schoolenironment to attend. They indicated this when they spoke about the changing relationship they elt they hadwith their teachers as the Leaing Certicate examination approached. This positie experience o second leelhas continued on to HE and een as ar as the optimistic outlook they eel or their uture careers. The only main

8/4/2019 BKMNEXT146
http://slidepdf.com/reader/full/bkmnext146 129/227
115
CHAPTER 6: THE HIGHER EDUCATION DECISION: HI GHER EDUCATION ENTRANTS AND NON-ENTRANTS
criticism o their experiences to emerge was the issue o adjusting to the scale and size o some HE institutions.
It is important to note that the majority o young people in this group realised the opportunity cost o a third-leel
education, when they compared their career prospects to those o their peers who did not attend. Howeer, it isalso important to note that young people in this group also acknowledged that HE was not the only acceptablepost school route. The group acknowledged that HE is challenging in itsel and should only be attempted i aperson has a genuine interest in a subject. Thus career ambitions and interests should dictate entry. Some o thisgroup iewed an apprenticeship/trade as an equally alid option. As Philip summed up when talking about how tomotiate someone to attend:
‘Well I’d say they should really nd an interest in something, whether it is a trade or college, especially i theywant to go straight into work then they’re not going to hae any qualications or anything, unless they go intowork as a tradesperson or as an apprenticeship, you know something that they can take away, experienceand a trade as well, so I’d denitely try and inuence that person to you know get an interest in doing
something’.
Oerall, this group did not relay any regrets about attending and they seem to place great alue on their HEexperiences. This is summed up nicely by the only member o this group with children. When asked i she wouldlike her own children to attend HE she replied:
‘Well i I hae to sit beside them in college they’ll go to college’ (Josephine).
6.6 SummaryThe approach taken in this chapter to understand the nature o the HE decision was to use a mixed-methodsapproach utilising the quantitatie data to examine HE application patterns, (including reasons or not applying),HE oer and acceptance patterns (including reasons or not accepting a CAO oer) and to examine thecharacteristics o HE entrants relatie to nonentrants; and to use the qualitatie data to urther explain why thedecision to enter HE diers within the non-manual group.
This summary begins by reporting on empirical ndings rom this chapter which are at the heart o this report.Among those who hae completed second-leel education the intermediate non-manual group hae a higheraerage participation rate in ull-time HE oer time than the other non-manual group (51 per cent relatie to 36per cent). The analyses in this chapter empirically show that the pattern o participation o the intermediatenon-manual group most closely resembles the employer/manager group, while the pattern or the other non-
manual group most closely resembles the semi-skilled and unskilled manual groups. These patterns identied bydescriptie analyses were reinorced in the multiariate analyses which indicated that, all else being equal, theintermediate non-manual group are oer one and a hal times more likely to participate in ull-time HE than thoserom a semi-unskilled manual group, while the other non-manual group hae similar odds o participation relatieto those rom semi-skilled manual groups.
In order to explain why participation rates dier within the non-manual group, we consider application, oerand acceptance patterns. The chapter began by empirically demonstrating that HE application patterns indicatesubstantial dierentiation between the two non-manual groups, and we see rom the oset that young peoplerom intermediate non-manual backgrounds hae higher rates o application than those rom non-manualbackgrounds (79 per cent relatie to 69 per cent). In act, across all socio-economic groups, young people rom

8/4/2019 BKMNEXT146
http://slidepdf.com/reader/full/bkmnext146 130/227
116
CHAPTER 6: THE HIGHER EDUCATION DECISION: HI GHER EDUCATION ENTRANTS AND NON-ENTRANTS
the other non-manual background hae the lowest application rates. Using School Leaers’ Surey data thechapter then considered why it is that some young people do not apply or HE in the rst instance. This nationallyrepresentatie data indicates that most young people do not apply because they are ‘not interested’ in attending
HE. Indicating a ‘non interest’ in HE is particularly eident or males and this pattern may be linked to aourablelabour market opportunities and/or attractie education/training alternaties (see Byrne, McCoy and Watson2009, 2009). Howeer, nancial considerations (wanting to earn money/inability to aord to go to HE) was also arequently occurring reason or not applying to HE, but it is highly likely that these two reasons are intertwined.For example, it is likely that i a young person knows that their amily does not hae the nancial resources to payor the costs o education, they may well adjust their expectations and indicate a ‘non-interest’ in applying to HE.The complexity behind such decision-making is an important consideration gien that the other non-manual groupwere somewhat more likely to indicate that they were not interested in going to HE or that they wouldn’t get thegrades necessary or HE than the intermediate non-manual group. The endogeneity o the decision to apply orHE is tied up with indiidual and structural theories o educational decisions which consider whether the decisionwas ‘intentional’ or ‘un-intentional’. For example, arious ersions o rational action theory (Boudon 1974; Keller and
Zaalloni 1964; Erikson and Jonsson 1996; Becker 2003; Breen and Yaish 2006) argue that i indiiduals can obtaintheir social status position through alternatie education/training opportunities, then this proides a less risky andmore cost ecient strategy or the indiidual and their amily. Alternatiely, dierences within the non-manualgroups in terms o application to HE could be explained by structural theories emphasising the role o the schooland the role o the amily. The qualitatie interiews with HE participants in this chapter support this culturalargument in that we saw examples o how parents o HE entrants set a high alue on education and were betterequipped to encourage and promote educational success on the part o their children, as well as proide thenancial resources needed to achiee this leel o education. Furthermore, all o the HE entrants in this chapterhad positie experiences o second-leel education in schools where there was a culture o progression to HE,thus school did not constitute a barrier to HE.
Unlike in the UK, there is no clear eidence o socio-economic disparity in relation to HE oers. Howeer, there
are clear dierences in acceptance rates both across socio-economic groups and within the non-manual group:the nationally representatie data indicates that the intermediate non-manual group has a higher acceptancerate than the other non-manual group (87 per cent compared to 84 per cent). Chapter 5 indicated that somelabour market entrants and entrants to other orms o education and training had been oered places through theCAO process but did not accept these oers. Reasons or not accepting these oers generally ranged rom notobtaining their preerred course (Ruth, Michael), expressing a preerence or the apprenticeship route (Cian), ordelaying entry to HE because o age (Declan). Nationally representatie data rom the School Leaers’ Surey alsoindicates that while the intermediate non-manual group are more likely to cite nancial or gap year (delayed entry)considerations in their reason or not accepting a CAO oer, the other non-manual group are more likely to citenot getting their preerred course or demonstrating a preerence or alternatie education/training courses. Again,while the non-manual group do not articulate nancial considerations as a reason or not accepting a CAO oer as
clearly as the intermediate non-manual group, it does not suggest that nancial costs are irreleant.The language o preerences is important in this respect as preerence is tied to the notion o the likelihood osuccess. The inestment risk, as articulated by Erikson and Jonsson 1996 in the rational action ramework, is acombination o the expected costs and the expected success o accessing or attending HE. Thus, i the likelihoodo success seems too low, or the inestment risk seems too high, young people may indeed reject a CAO oer oran education/training or labour market alternatie, or indeed express a ‘preerence’ or an alternatie route.
The chapter then went on to consider the quality or type o HE that young people rom dierent socio-economicgroups experience once access has been negotiated, in terms o the type o HE institute attended, the leel ocourse pursued, receipt o nancial aid (grant) and drop out. Figure 6.12 illustrated that oer time, the intermediatenon-manual group hae been more likely than the other non-manual group to secure a HE place in a uniersity
8/4/2019 BKMNEXT146
http://slidepdf.com/reader/full/bkmnext146 131/227
117
CHAPTER 6: THE HIGHER EDUCATION DECISION: HI GHER EDUCATION ENTRANTS AND NON-ENTRANTS
than any other type o HE (47 per cent relatie to 30 per cent), and this nding was reinorced in the multiariateanalyses. It was interesting to nd in the qualitatie interiews with young people who attended HE that the scaleand size o the institution was a consideration in their decision, with some indicating a preerence or smaller
institutions (and thus types o HE other than uniersities which tend to be large). Furthermore, the intermediatenon-manual group hae been more likely than the other non-manual group to secure an honours degree coursethan an ordinary degree or higher certicate (77 per cent relatie to 69 per cent), and the multiariate analysesindicated that the intermediate non-manual group hae a higher odds o pursing an honours degree course relatieto those rom the other non-manual group (2.3 ersus 1.6) 27. In terms o nancial aid through grant receipt, we ndthat a higher proportion o the other non-manual group receie a grant than the intermediate non-manual group(55 per cent relatie to 41 per cent). In act, patterns o grant receipt or the intermediate non-manual group aremore similar to those o higher proessional, employer/manager and armer groups while the other non-manualgroup are similar to the skilled manual group. Finally, in terms o drop-out, we nd that the other non-manual grouphas a higher drop out rate than the intermediate non-manual group (17 per cent relatie to 13 per cent).
An established body o research now exists in the sociology o education which debates why working-classchildren are dierted rom uniersity or perceied-to-be-prestigious orms o education (see Becker and Hecken2008; Byrne 2009). Some o these debates argue that working class amilies decide in aour o a short and lessambitious education because o earlier decisions that are made in the educational trajectory o young personwhich hamper or obstruct access to more ‘prestigious’ orms o later education. This could include educationalunderperormance or the inuence o tracking mechanisms at second-leel. Alternatiely, aourable economicconditions can proide attractie education/training alternaties (such as apprenticeships) which might diertworking-class children rom the attainment o a HE education. In reality, it is likely that a combination o theseexplanations can be used to explain dierences in the type o HE pursued by the intermediate non-manual groupand the other non-manual group.
27 While the other non-manual group are doing better than the reerence group in this regard, it should be noted that the reerence group hasexpanded to include the non-employed group.

8/4/2019 BKMNEXT146
http://slidepdf.com/reader/full/bkmnext146 132/227
118
CHAPTER 6: THE HIGHER EDUCATION DECISION: HI GHER EDUCATION ENTRANTS AND NON-ENTRANTS

8/4/2019 BKMNEXT146
http://slidepdf.com/reader/full/bkmnext146 133/227
CHAPTER 3: EXPENDITURE PATTERN OF STUDENTS
119
CHAPTER 6 Entrants to Forms of Education other than Higher Education
CHAPTER 7

8/4/2019 BKMNEXT146
http://slidepdf.com/reader/full/bkmnext146 134/227
120
CHAPTER 7: ENTRANTS TO FORMS OF EDUCATION OTHER THAN HIGHER EDUCATION
7.1: Introduction
This chapter considers the pathways into other orms o education other than HE made by young people. In doingso, it considers the characteristics o those who pursue Post-Leaing Certicate (PLC) courses, Apprenticeshipsand other State Sponsored Training Programmes.
7.2 Participation in Post-Leaing CerticateCoursesOerall leels o participation in PLC courses among school leaers declined oer the 1997/98 – 2002/04 period
but increased again between 2006/0728
. Gender disparities are particularly eident as emale school-leaerscontinue to dominate entry to this sector (Figure 7.1).
Figure 7.1: Participation in Post-Leaving Certicate Programme among those who Completed Senior Cycle
0
10
20
30
40
50
60
Total
Males
Females
1997/98 2002/04 2006/07
Figure 7.2 illustrates that patterns o participation by parental socio-economic group show relatiely high leels oentry into this orm o post-school education among young people rom other non-manual backgrounds and skilledmanual backgrounds, with young people rom proessional and arming backgrounds less likely to pursue thiseducational path.
28 Oerall participation in PLC courses has, howeer, risen oer the period, reecting increasing take-up o such courses among ‘older’ peoplerather than the traditional school leaing population (see Watson et al ., 2006).
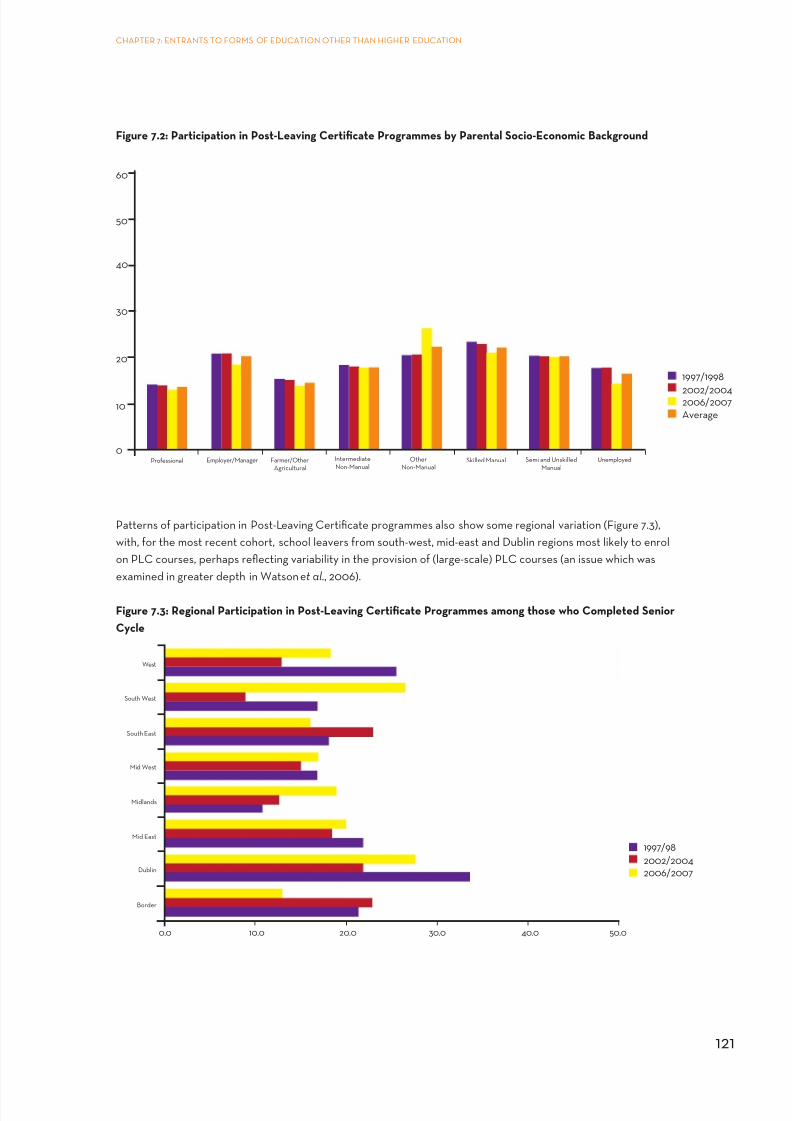
8/4/2019 BKMNEXT146
http://slidepdf.com/reader/full/bkmnext146 135/227
121
CHAPTER 7: ENTRANTS TO FORMS OF EDUCATION OTHER THAN HIGHER EDUCATION
Figure 7.2: Participation in Post-Leaving Certicate Programmes by Parental Socio-Economic Background
0
10
20
30
40
50
60
1997/1998
2002/20042006/2007Average
Farmer/OtherAgricultural
Professional Employer/Manager IntermediateNon-Manual
OtherNon-Manual
Skilled Manual Semi and UnskilledManual
Unemployed
Patterns o participation in Post-Leaing Certicate programmes also show some regional ariation (Figure 7.3),with, or the most recent cohort, school leaers rom south-west, mid-east and Dublin regions most likely to enrolon PLC courses, perhaps reecting ariability in the proision o (large-scale) PLC courses (an issue which wasexamined in greater depth in Watson et al ., 2006).
Figure 7.3: Regional Participation in Post-Leaving Certicate Programmes among those who Completed Senior
Cycle
0.0 10.0 20.0 30.0 40.0 50.0
1997/98
2002/2004
2006/2007
Border
Dublin
Mid East
Midlands
Mid West
South East
South West
West

8/4/2019 BKMNEXT146
http://slidepdf.com/reader/full/bkmnext146 136/227
122
CHAPTER 7: ENTRANTS TO FORMS OF EDUCATION OTHER THAN HIGHER EDUCATION
Strong Impact o Socio-Economic Background
Figure 7.2 illustrates that there are clear socio-economic disparities at play in terms o participation in Post-LeaingCerticate courses. It is useul at this point to examine not just leels o participation in PLC courses among the
non-manual groups; as beore, comparison with young people rom the skilled, semi-skilled and unskilled manualbackgrounds is also important.
The multiariate model deeloped in Table 9 o Appendix D allows a relatiely straightorward comparison tobe made. The model estimates the relatie inuence o all the dierent ariables on the likelihood that peopleparticipate in a Post-Leaing Certicate course. The aim o the analysis is to examine the extent to whichparticipation in the PLC sector is more likely among the other non-manual group relatie to other groups.From this model, it is possible to calculate odds ratios which express the odds that a person o particularcharacteristics will participate in a PLC relatie to a dierent case. Table 7.1 proides odds ratios that summarisethe eect o gender and type o school that young people attended while at school, when controlling or socio-economic background, region, parental education leels, region and DEIS status o the school and attainment
in the Leaing Certicate examination. The reerence case is as beore, a male rom a skilled/unskilled manualbackground, liing in Dublin, whose parents hae primary leel education and who attended a community orcomprehensie DEIS school or our sample.
Table 7.1: Odds Ratios or Participation in PLC
Model 1 Model 2
Male 1.00 1.00
Female 3.37 4.21
Secondary School 0.03 0.04
vocational School 2.63 2.90
Community/Comprehensie 1.00 1.00
LC less 5 passes 1.00
LC 5+ passes 0.69
LC 1 Honour 0.94
LC 2-4 Honours 0.36
LC 5+ Honours 0.04
The rst set o ndings indicate that gender is a major actor that determines participation in a PLC course: theodds o a emale showing the same characteristics o participating in a PLC course are 3.4 times higher than or
males. Furthermore, school type attended is a key determinant o participation; students who attend a ocationalschool are just oer two and a hal times more likely to participate in a PLC course. These odds ratios now proidea ready comparison or the impact o socio-economic background, which is illustrated in Figure 7.4.
The odds ratios in Figure 7.4 indicate how students rom proessional and arming backgrounds hae lower oddso participating in Post-Leaing Certicate courses: these groups are just about hal as likely to participate relatieto students rom a manual background, while students rom the other non-manual group hae similar or somewhathigher odds o participating in a Post-Leaing Certicate course, particularly when controlling or preiousattainment in the Leaing Certicate examination relatie to students rom a manual background.

8/4/2019 BKMNEXT146
http://slidepdf.com/reader/full/bkmnext146 137/227
123
CHAPTER 7: ENTRANTS TO FORMS OF EDUCATION OTHER THAN HIGHER EDUCATION
Figure 7.4: Odds Ratios or Participation in PLC Courses
0.0
0.5
1.0
1.5
2.0
2.5
3.0
Farmer IntermediateNon manual
Other Non Manual
Skilled, unskilledmanual
Non EmployedProfessional
Model 1
Model 2 (+ Attainment)
Odds Ratio
Socio-Economic Background
7.3 Participation in ApprenticeshipsApprenticeships represent a urther orm o alternatie education and training to HE participation. It is dicultto get an estimate o the percentage o school leaers who hae traditionally opted or the apprenticeship routehoweer it is likely that this has grown until recent times. Among the 2006/07 cohorts, leels o participationare at 7 per cent, and this orm o urther education is dominated by males, o whom 13 per cent opt or anapprenticeship upon leaing school.
Table 7.2: Percentage o 2006/07 School Leavers who completed Senior Cycle who Entered Apprenticeships
2006/07
Total 6.6
Male 13.1Female 0.8

8/4/2019 BKMNEXT146
http://slidepdf.com/reader/full/bkmnext146 138/227
124
CHAPTER 7: ENTRANTS TO FORMS OF EDUCATION OTHER THAN HIGHER EDUCATION
Figure 7.5 illustrates ariation in uptake o apprenticeships by males who hae completed senior cycle education byparental socio-economic background. What is particularly eident is that leels o participation are highest amongthose rom the other non-manual socio-economic group and the skilled, semi-skilled and unskilled manual socio-
economic groups, which is perhaps not surprising gien that many o the school leaers in this latter group haeparents employed in sectors dominated by apprenticeship entry routes, such as jobs in the construction sector.
Figure 7.5: Parental Socio-Economic Variation in Participation Rates in Apprenticeships among those who Com-
pleted Senior Cycle (Males only)
10
20
30
40
50
60
0Professional Employer
ManagerFarmer
Agri WorkersIntermediateNon Manual
Other NonManual
Skilled Manual Semi/UnskilledManual
Non-Employed
Strong Impact o Socio-Economic Background
Figure 7.5 illustrates that there are clear socio-economic disparities at play in terms o participation inapprenticeships upon leaing school. It is useul at this point to gauge not only whether the eect o the othernon-manual group is signicant in participation in apprenticeships among males. As beore, a helpul comparison isto examine the extent to which participation rates o non-manual young people ary relatie to those rom skilled,semi-skilled and unskilled manual backgrounds.
The multiariate model deeloped in Table 10 o Appendix D allows a relatiely straightorward comparison to bemade. The model estimates the relatie inuence o all the dierent ariables on the likelihood that male schoolleaers who hae completed the LCE or LCvP participate in an apprenticeship. From this model, it is possible
to calculate odds ratios which express the odds that a person o particular characteristics will participate in anapprenticeship relatie to a dierent case. Table 7.3 proides odds ratios that summarise the eect o parentaleducation and preious attainment in the Leaing Certicate, when controlling or socio-economic background,region, parental education leels, region and DEIS status o the school. The reerence case is as beore, a malerom a skilled/unskilled manual background, liing in Dublin, whose parents hae primary leel education and whoattended a community or comprehensie DEIS school or our sample.
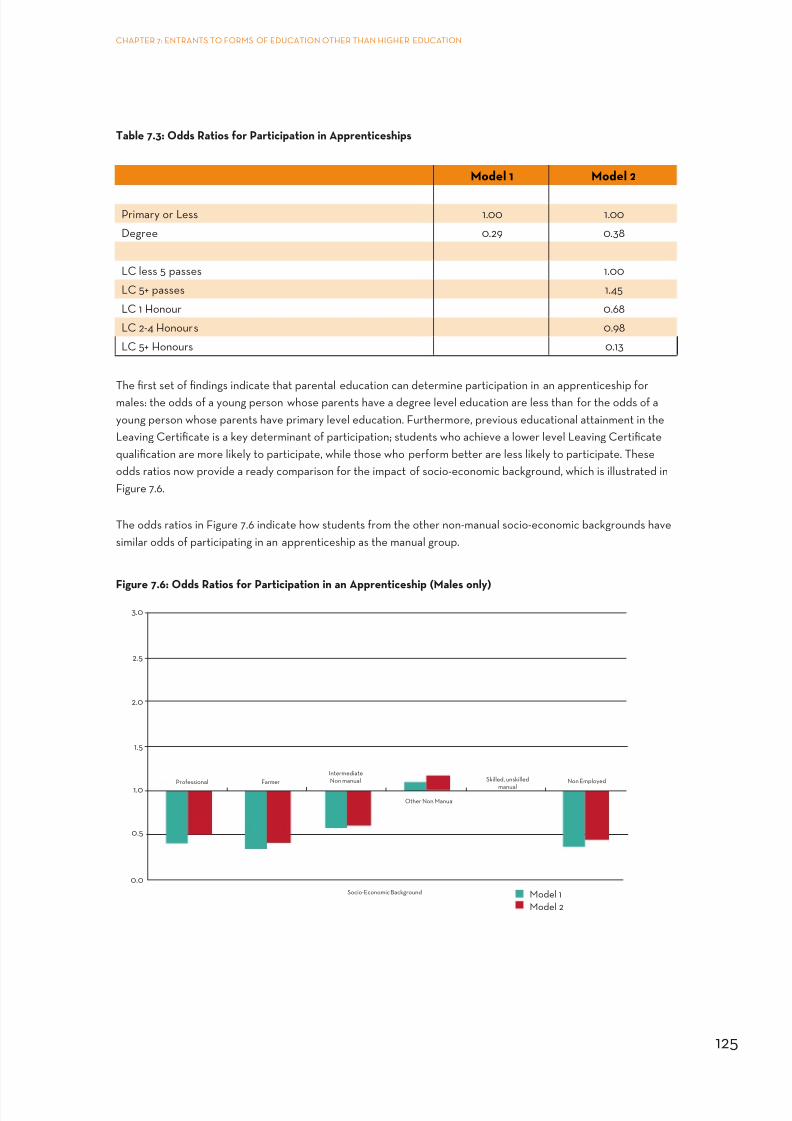
8/4/2019 BKMNEXT146
http://slidepdf.com/reader/full/bkmnext146 139/227
125
CHAPTER 7: ENTRANTS TO FORMS OF EDUCATION OTHER THAN HIGHER EDUCATION
Table 7.3: Odds Ratios or Participation in Apprenticeships
Model 1 Model 2
Primary or Less 1.00 1.00
Degree 0.29 0.38
LC less 5 passes 1.00
LC 5+ passes 1.45
LC 1 Honour 0.68
LC 2-4 Honours 0.98
LC 5+ Honours 0.13
The rst set o ndings indicate that parental education can determine participation in an apprenticeship ormales: the odds o a young person whose parents hae a degree leel education are less than or the odds o ayoung person whose parents hae primary leel education. Furthermore, preious educational attainment in theLeaing Certicate is a key determinant o participation; students who achiee a lower leel Leaing Certicatequalication are more likely to participate, while those who perorm better are less likely to participate. Theseodds ratios now proide a ready comparison or the impact o socio-economic background, which is illustrated inFigure 7.6.
The odds ratios in Figure 7.6 indicate how students rom the other non-manual socio-economic backgrounds haesimilar odds o participating in an apprenticeship as the manual group.
Figure 7.6: Odds Ratios or Participation in an Apprenticeship (Males only)
0.0
0.5
1.0
1.5
2.0
2.5
3.0
Farmer
IntermediateNon manual
Other Non Manual
Skilled, unskilled
manualNon EmployedProfessional
Model 1
Model 2
Socio-Economic Background

8/4/2019 BKMNEXT146
http://slidepdf.com/reader/full/bkmnext146 140/227
126
CHAPTER 7: ENTRANTS TO FORMS OF EDUCATION OTHER THAN HIGHER EDUCATION
7.4 Participation in State SponsoredTrainingState-sponsored training includes FÁS Training schemes, programmes with Failte Ireland, Bord Iascaigh Mhara,Teagasc and Youthreach, but not apprenticeships. Among the 2006/07 cohorts, leels o participation in StateSponsored Training are at 5 per cent, and this orm o urther education is undertaken by both males and emales,with 6 per cent o males and 4 per cent o emales opting or this orm o urther education (see Table 7.4). It isimportant to note the dierse nature o participants in the ‘state-sponsored training’ category – some are accessingspecic training courses to secure higher qualications while others are pursuing second-chance education/training which coners second-leel qualications.
Table 7.4: Percentage o 2006/07 School Leavers who Entered State Sponsored Training
2006/07Total 5.0
Male 5.9
Female 4.2
Figure 7.7 illustrates ariation in uptake o state-sponsored training by males and emales who hae completedsenior cycle education by parental socio-economic background. What is particularly eident is that leels oparticipation are highest among those rom non-employed households. In addition, Figure 7.7 illustrates relatielyhigh leels o participation among young people rom arming backgrounds, most likely reecting entry intoTeagasc-run courses.
Figure 7.7: Parental Socio-Economic Variation in Participation Rates in State Sponsored Training among those
who Completed Senior Cycle
10
20
30
40
50
60
0Professional Employer
ManagerFarmer
AgriculturalIntermediateNon Manual
Other NonManual
Skilled Manual Semi/UnskilledManual
Non-Employed
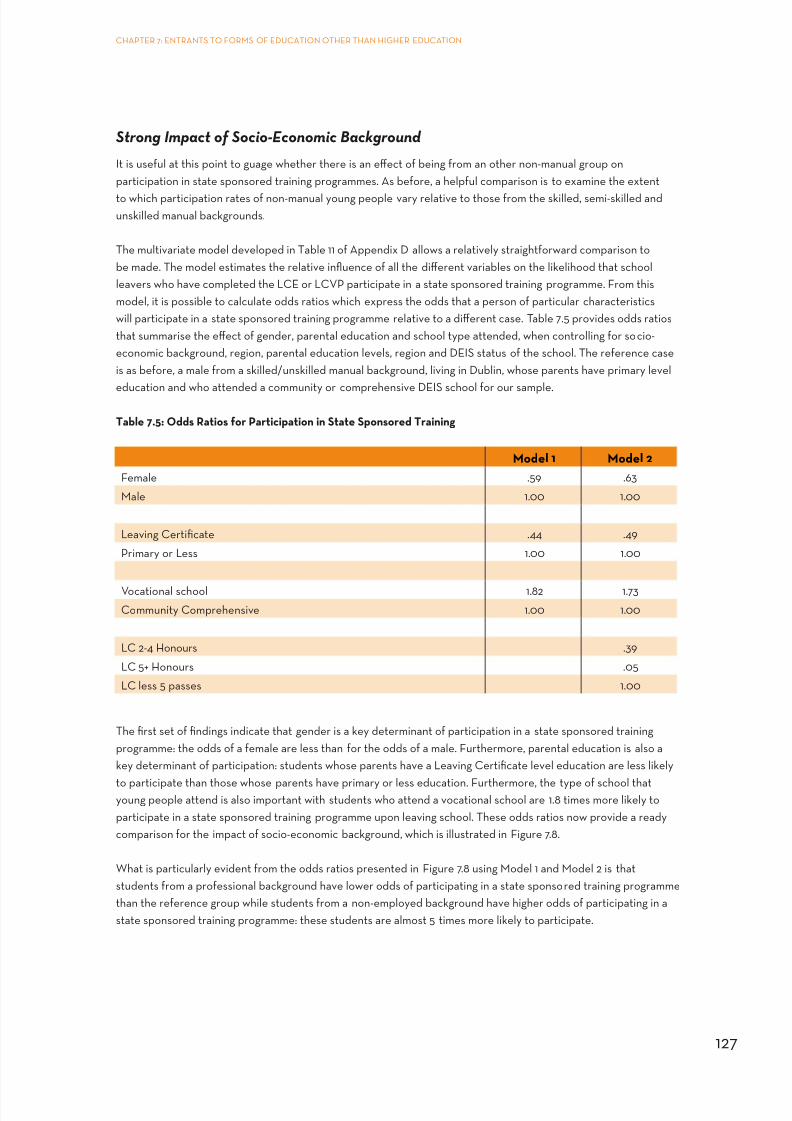
8/4/2019 BKMNEXT146
http://slidepdf.com/reader/full/bkmnext146 141/227
127
CHAPTER 7: ENTRANTS TO FORMS OF EDUCATION OTHER THAN HIGHER EDUCATION
Strong Impact o Socio-Economic Background
It is useul at this point to guage whether there is an eect o being rom an other non-manual group onparticipation in state sponsored training programmes. As beore, a helpul comparison is to examine the extent
to which participation rates o non-manual young people ary relatie to those rom the skilled, semi-skilled andunskilled manual backgrounds.
The multiariate model deeloped in Table 11 o Appendix D allows a relatiely straightorward comparison tobe made. The model estimates the relatie inuence o all the dierent ariables on the likelihood that schoolleaers who hae completed the LCE or LCvP participate in a state sponsored training programme. From thismodel, it is possible to calculate odds ratios which express the odds that a person o particular characteristicswill participate in a state sponsored training programme relatie to a dierent case. Table 7.5 proides odds ratiosthat summarise the eect o gender, parental education and school type attended, when controlling or socio-economic background, region, parental education leels, region and DEIS status o the school. The reerence caseis as beore, a male rom a skilled/unskilled manual background, liing in Dublin, whose parents hae primary leel
education and who attended a community or comprehensie DEIS school or our sample.
Table 7.5: Odds Ratios or Participation in State Sponsored Training
Model 1 Model 2
Female .59 .63
Male 1.00 1.00
Leaing Certicate .44 .49
Primary or Less 1.00 1.00
vocational school 1.82 1.73Community Comprehensie 1.00 1.00
LC 2-4 Honours .39
LC 5+ Honours .05
LC less 5 passes 1.00
The rst set o ndings indicate that gender is a key determinant o participation in a state sponsored trainingprogramme: the odds o a emale are less than or the odds o a male. Furthermore, parental education is also akey determinant o participation: students whose parents hae a Leaing Certicate leel education are less likely
to participate than those whose parents hae primary or less education. Furthermore, the type o school thatyoung people attend is also important with students who attend a ocational school are 1.8 times more likely toparticipate in a state sponsored training programme upon leaing school. These odds ratios now proide a readycomparison or the impact o socio-economic background, which is illustrated in Figure 7.8. What is particularly eident rom the odds ratios presented in Figure 7.8 using Model 1 and Model 2 is thatstudents rom a proessional background hae lower odds o participating in a state sponsored training programmethan the reerence group while students rom a non-employed background hae higher odds o participating in astate sponsored training programme: these students are almost 5 times more likely to participate.

8/4/2019 BKMNEXT146
http://slidepdf.com/reader/full/bkmnext146 142/227
128
CHAPTER 7: ENTRANTS TO FORMS OF EDUCATION OTHER THAN HIGHER EDUCATION
Figure 7.8: Odds Ratios or Participation in State-Sponsored Training
0.0
0.5
1.0
1.5
2.0
2.5
3.0
3.5
Farmer
Intermediate
Non manual
Farmer Other Non Manual Skilled, unskilled
manual
Non Employed
Professional
Model 1
Model 2
Socio-Economic Background
7.5 Young Peoples’ Experiences o theTransition rom School to other ormso Education
7.5.1 Introduction
In this sample three participants attended an apprenticeship (Charlie, Cian and Emma) and six participantsattended a PLC (Fiona, Ruth, Sharon, Roger, Tracey and Emer) directly ater completing their Leaing Certicate.At the time o the interiews Charlie and Cian were in the nal year o their apprenticeships. Howeer, Emma
had let her apprenticeship in the third year due to illness and was working in a dierent area at the time o herinteriew. For those who attended a PLC course immediately ater second leel, their career paths ater theirPLCs were notably aried. Ruth entered the labour market ater her PLC. At the time o her interiew she hadreturned to education to do a degree course. Likewise Emma went on to do a degree course straight ater herPLC. Roger went on to do a degree course in the USA but dropped out ater 2 years. He has subsequently securedemployment in an area unrelated to his PLC or college course. Ater some time in the workorce, Sharon wascompleting a FÁS training course at the time o her interiew. Fiona secured employment but not in the area o herPLC. Tracey was unemployed at the time o her interiew.

8/4/2019 BKMNEXT146
http://slidepdf.com/reader/full/bkmnext146 143/227
129
CHAPTER 7: ENTRANTS TO FORMS OF EDUCATION OTHER THAN HIGHER EDUCATION
Table 7.6: Prole o Other ET Participants
Name School Type INM/ONM Location Progression
Charlie Secondary Non/DEIS
ONM Dublin Apprenticeship
Cian Secondary Non/DEIS
INM Dublin Apprenticeship
Emma vocational DEIS INM Dublin Apprenticeship*
Fiona Secondary Non/DEIS
ONM Dublin PLC
Ruth ComprehensieNon/DEIS
ONM Mayo PLC
Sharon ComprehensieNon/DEIS
ONM Dublin PLC
Roger ComprehensieNon/DEIS
ONM Dublin PLC
Tracey ComprehensieNon/DEIS
INM Dublin PLC
Emer ComprehensieNon/DEIS
ONM Co Cork PLC
*Apprenticeship incomplete due to illness
As can be seen in Table 7.6 the majority o this group grew up in Dublin (Charlie, Cian, Emma, Fiona, Sharon, Rogerand Tracey) and the remaining two participants were rom outside Dublin, Ruth was rom Co. Mayo and Emer romCo. Cork.
7.5.2 Home Lie and Parental Expectations
Regarding the socio-economic background o this group the parents o six participants are classied as othernon-manual and the remaining three participants are classied as intermediate non-manual. This inormation isillustrated in Table 7.6.
When participants in this group spoke about their siblings it transpired that some o them had a sibling whoattended HE (Charlie, Cian, Roger) while others did not (Emma, Ruth-only child, Sharon and Emer). Fiona andTracey each had a sister who also did a PLC course. One o the participants (Emer) has a sibling who let schoolearly (‘he just wasn’t getting on with the school’) and now works as a labourer, while Sharon has a number o
siblings who let school early, but later returned to education and training courses:
‘at the start it was just you’d go to work but then you’d kind o realise you wanted to go back to college andstu like that [speaking in relation to her siblings and hersel]’.
Most participants elt encouraged by their amily to attend HE and belieed there were other actors inoledin their decision not to attend. Charlie elt that i he had been ‘pushed’ by teachers he may hae attended HEhoweer he also commented:‘

8/4/2019 BKMNEXT146
http://slidepdf.com/reader/full/bkmnext146 144/227
130
CHAPTER 7: ENTRANTS TO FORMS OF EDUCATION OTHER THAN HIGHER EDUCATION
it is partly my own ault, I’m not putting all the blame on the teachers, but I got lazy then as well, and I justcouldn’t hae been arsed then’ (Charlie).
Cian (who scored a ery high Leaing Certicate) elt he was ‘not academic at all, I didn’t like school at all’so he decided to pursue an apprenticeship, which was his preerred option or two reasons. First, he elt he ‘alwaysliked work’ so he ‘just wanted to go out and work’. Second, as his Leaing Certicate approached he did notknow which subject he wanted to study in uniersity and elt it was not the right time or him to attend HE. As heexplained:
‘You only get one ree degree, so i you hae to go work or a ew years and then go back and do it; actuallyknow what you want to do, that might be a better idea, than going straight into college. I I had o gonestraight into college ater school like, I would hae wasted a degree and then i I changed my mind, I hae topay the ull ees and I mightn’t hae the money to do it . Whereas i you go working or a ew years, till youget your head sorted, because at 17 you’re not going to know what you want to do really’.
Ruth had applied or a range o HE courses but did not perorm suciently well in the Leaing Certicateexamination: ‘I think my amily was a bit disappointed that I hadn’t got on as well, maybe the older members o theamily probably were a little bit more annoyed at me’. Howeer, later she contends that her amily did not haehigh expectations or her anyway:
‘My amily was … worried that I was going to go downhill and that I wasn’t going to do that great … but I don’tthink my amily had … [they did] not [hae] great aith in me’.
In terms o the educational attainment o the parents o the Other ET group, a number had not completed theirsecond-leel education (as shown in Table 2.1). As Sharon noted ‘they were back in the day when you’d leae[school] at 14 and go working’. This had implications or the expectations parents had or their children. As Charlie
notes his mother:
‘just wanted me to do the Leaing Cert, and I could see why she wanted me to do the Leaing Cert inairness, she always, growing up, said you hae to hae your schooling sort o thing’.
A majority o the parents had not participated in HE, but there were a couple o exceptions. Cian’s ather enrolledin Arts:
‘but dropped out ater a couple o months because he said it was a load o crap, he wasn’t interested’.Tracey’s ather took an eening course to qualiy him to be a juenile liaison ocer.
As noted earlier our participants progressed to HE courses, although not immediately ater leaing school. Emer,Roger and Ruth decided to enrol on a PLC course in order to secure a place on a HE course. Ruth and Emer areboth currently enrolled on HE courses. Roger went on to college in the USA but let ater two years. In orderto establish i HE was eer an option or them, the remaining participants in this group were asked i they eerconsidered attending HE. The responses to this question were aried.
Tracey and Fiona neer elt HE was an option or them or dierent reasons. As Fiona explained:
‘I had no intentions o going to college to do more kind o studying as such, I’d had enough in school (laughs)... I didn’t een ll out, you know the CAO, I didn’t een ll that out, I’d no interest in it at all’.

8/4/2019 BKMNEXT146
http://slidepdf.com/reader/full/bkmnext146 145/227
131
CHAPTER 7: ENTRANTS TO FORMS OF EDUCATION OTHER THAN HIGHER EDUCATION
When asked i there was any reason in particular that she elt like this Fiona replied:
‘You didn’t really hae a choice going to school like but college was your kind o choice, you know, like I
mean you hae to go to school, that’s the end o it like. I elt no, it’s my choice I’m not going to college, I don’twanna go back into that kind o enironment again’.
When asked i she eer thought about going on to do another course ater her PLC Tracey replied:
‘No, because soon ater I let college [PLC course] I got pregnant so I couldn’t do much’.
Emma spoke negatiely about the idea o attending HE, as nancially it was neer an option or her. While inschool she recalled receiing a lot o inormation about dierent college courses. Howeer she elt:
‘it’s ery hard i you don’t hae any money to think you’re gonna go on to college or that. One o the reasons
why I don’t think I actually went ahead with anything was the prices, they were all pretty expensie like, orall the courses and that’.
Similarly, ater her PLC Sharon worked in a ariety o positions beore returning to do a FÁS course. When asked ishe eer considered returning to do a college course she replied:
‘i I had o gone to a college course that I had to pay or and not getting home money eery week, I wouldn’thae been able to go back’.
Hence, like Fiona she also elt nances were a barrier to HE.
The majority o participants in this group elt their parents were happy with their post school pathways. Howeer,
Cian spoke o his mothers opinion o his decision not to attend HE (despite achieing almost maximum points inthe Leaing Certicate):
‘She would hae preerred me to go to college, een though like she sees it as a sort o an achieement,whereas I see it as a waste o our years. She would hae, she places more alue in a third-leel educationthan I would, I place ery little alue in it in itsel’.
7.5.3 Attitudes towards Finishing School
A number o those who entered PLC/Apprenticeship programmes on leaing school indicated that they wereencouraged by their schools to consider HE. Howeer Roger elt that students were being orced to progress
rather than being made aware o the range o post-school options:
‘… they [Guidance Counsellors in his school] had the idea that eerybody should go to college and somepeople just aren’t going to … they don’t want to, they can’t aord to, there’s loads o reasons why people just aren’t going to go. But like other than, all they kept trying to say to us was go to college, go to collegeand people just wouldn’t listen because they wouldn’t listen to anything else, they wouldn’t listen to peoplesaying they wanted to do other things’.

8/4/2019 BKMNEXT146
http://slidepdf.com/reader/full/bkmnext146 146/227
132
CHAPTER 7: ENTRANTS TO FORMS OF EDUCATION OTHER THAN HIGHER EDUCATION
For those who didn’t seriously consider HE, it oten stemmed rom being disengaged and disinterested in school,as Charlie asserts:
‘i they [teachers] had o kept me interested, now I’m not saying it’s their ault like, but i I had o stayedinterested in school, I would hae went to college’.
Many o these young people spoke about peers who progressed to HE, so HE was not an alien concept or one owhich they were not aware. As Charlie simply states:
‘there was a good ew like, they did go to college’.
While Cian estimates:
‘I think UCD was our main school, I think we sent … there’s about one hundred and twenty in a year, I think
one thirty, we sent about thirty to UCD and about thirty to DCU’. ‘All o my personal riends [in school] wentto college’.
Similarly Emer and Ruth maintained that many o their peers progressed to HE:
O your year group, did many students go on to third-leel, on to uniersity?‘Yeah I would say, god nearly, oer three-quarters anyway’. (Emer)
‘… more people denitely did go to college than didn’t go’. (Ruth)
Howeer, this was not the case or all and or some being asked about numbers progressing to ‘college’ meantentering either a PLC course, or HE, despite attempts to clariy the term ‘college’. As Tracey stated:
‘well me and my twin sister were in the same class and we went on to college [PLC] and our riends did’
Fiona, Emma and Sharon all obsered that only a ew progressed to HE in their schools. Emma notes that in herschool many o her peers simply didn’t know what they wanted to do when they let school:
‘… a ew out o my class [progressed to HE and] … are still in college at the moment, yeah but they kind oalways knew what they wanted to do, [but] there was a lot o people in my school that didn’t know what theywanted ... they were kind o they wanted to do this and they wanted to do that but didn’t think they weregood enough as well so neer went ahead with it’.
In Sharon’s school, large numbers progressed to PLC courses, many doing so because they elt they wouldn’t get
sucient ‘points’ or HE:
‘… a lot o them went on to do PLC courses ... a lot o them were worried about the points or the, you knowthe way you hae the big points [or HE courses] … I think they all kind o put their name down or the PLCbecause they knew they’d kind o more or less get that … So that was kind o the preerred choice’.
7.5.4 Financial Barriers/Support to go to higher education
Some talked about the nancial costs o attending HE and based their decision not to attend on such costs. AsEmma notes:
‘… it was all money-wise and it’s ery hard i you don’t hae any money to think you’re gonna go on to college

8/4/2019 BKMNEXT146
http://slidepdf.com/reader/full/bkmnext146 147/227
133
CHAPTER 7: ENTRANTS TO FORMS OF EDUCATION OTHER THAN HIGHER EDUCATION
or that. One o the reasons why I don’t think I actually went ahead with anything was the prices, they wereall pretty expensie like, or all the courses and that’.
She elaborates:
‘[in talking about another amilies’ expenditure on books or their daughter attending HE] me Mam usedto say straightaway God I don’t know how their amily’s aording it, straightaway it was a big no kind o justrom the books and that so I thought there was no way like I’m een gonna ask her like, it was a denite nostraightaway’.
Howeer, she contends that the situation has improed since she was leaing school and her younger sister hashad a better experience:
‘… there’s an awul lot o grants that people are gien these days … there was a lot more options or me sister
these years than when I was in school’.
For those who progressed to PLC courses, and or a number subsequently to HE courses, they spoke about theimportance o state nancial support. Emer progressed to HE in the UK, ater taking a PLC course in Ireland. Shedid not hae to pay ees as these were unded by the UK goernment, and she has also been receiing a countycouncil maintenance grant since starting her second year (her application orm in rst year was lost and as a resultshe did not receie a grant that year).
Howeer, others taking PLC courses did not receie grants (Ruth, Tracey and Fiona); they unded their studythrough part-time employment, and some receied support rom their parents as well. As Tracey comments:
‘Me Mam and Da [supported me nancially], and actually I worked part-time as well like, while I was in
college I worked in the supermarket so that helped as well like’.
Fiona also took out a credit union loan to support hersel.
7.5.5 Experience Since Leaving School Experience o PLC Course
It is interesting to note that six participants, who entered PLC courses on leaing school, assessed theirexperiences by comparing them to their school experiences. To illustrate, Ruth really enjoyed her PLC course asshe elt it was quite dierent to being at school, as she explains:
‘I think [it is] absolutely ridiculous in the Leaing Certicate, to build it all up to that nal week or whateer
… [assessment in the PLC] is so much less pressure, it is much easier, I learned so much more … than what Ieer learnt in all the years I went to secondary school’.
In sharp contrast, Tracey didn’t particularly enjoy her PLC course as she elt it was like being back at school:
‘I didn’t like the [PLC] college actually, it was too much like being back at secondary school, like i we weresick or anything or we didn’t come in we’d hae to write our own note … and they’d gie you a roll call andI didn’t like it … It was the whole time as well, like you had to be in at nine and you’re gone at three, that’ssecondary school hours … break times were the same and the lunchtime and it was the same amount o timeor your lunch and your break’.

8/4/2019 BKMNEXT146
http://slidepdf.com/reader/full/bkmnext146 148/227
134
CHAPTER 7: ENTRANTS TO FORMS OF EDUCATION OTHER THAN HIGHER EDUCATION
Emer, Ruth and Cian progressed to HE ater completing their PLC and apprenticeship programmes. Emer hadinitially been oered a place in HE in her Leaing Certicate year, but turned it down in aour o the PLC course.As she explains:
‘I actually went to my career guidance [teacher] ater lling in my CAO just beore my exams and told her … Idon’t want to do this and basically told her what I wanted to do and she told me about this PLC course … it’san Access course to UCC, so I done that’.
Hence, Emer took the PLC course expecting to be able to transer to a HE programme in an Irish uniersity oncompletion, which didn’t materialise as she expected:
‘… the pre-nursing course that I done, on the prospectus they had down on it, there would be, i you got somany distinctions then there would be access to go to UCC ... a degree course in nursing but we didn’t ndout till hal way through the year but there was actually only e places [resered or PLC holders]’.
As a result Emer progressed to a HE course in the UK, which had links with the PLC college she attended.Howeer, she elt that:
‘… there could hae been more options or us [PLC participants] really, I don’t, I think they could haelinked up with more uniersities, more colleges maybe in Ireland … I don’t think they [PLC qualications] arerecognised enough really ... they let people go through these years, two year courses and then they don’treally recognise them at the end, I think they should do really’.
Ruth also entered a PLC course with the intention o progressing to HE, which she has since achieed. She arguesthat doing the PLC course rst has gien her an adantage oer those who enter HE directly rom school:
‘I hae to say like it is [PLC course] absolutely great preparation, I think anyone who is going into [name ocourse] should do like a PLC course … I think about ty per cent o the people in my class hae done a PLCcourse and it has stood to them in some way or another, either work experience … plus like een theorywise’.
Experience o Apprenticeship Programme
The general picture emerging rom the three young people who progressed to apprenticeship programmes wasthat they were happy with that decision and enjoy their work. As Cian states so positiely:
‘There is no course or career apart rom winning the lotto that I could hae done that would hae gien me
the same payback as an apprenticeship … the way I hae it at the moment is perect’.
Furthermore, participants in apprenticeship programmes elt they had a better sense o the ‘real world’ than otheryoung people, as Cian explains:
‘Fellas I met through the apprenticeship, they’d hae a lot more, they’d be a lot more knowledgeable abouthow [the] real world works … whereas all me riends [who went to college] they hae sort o an idealised sorto iew o the world that is totally incompatible with the reality … they’d be more immature. I’m denitelymore mature than I was when I started [apprenticeship], I think i I went to college I’d still be an airhead’.
Two o those who took apprenticeships were happy to recommend that pathway to others.
8/4/2019 BKMNEXT146
http://slidepdf.com/reader/full/bkmnext146 149/227
135
CHAPTER 7: ENTRANTS TO FORMS OF EDUCATION OTHER THAN HIGHER EDUCATION
Howeer, Charlie does raise some concerns oer earnings leels and suggests that he might hae taken a dierentpath i he had known:
‘we weren’t told the wages were so bad … I I had o known that, I wouldn’t hae went into mechanics’. Aswith members o the LM group, a number commented on the economic slowdown and were worried as theysaw ‘lads are getting laid o in construction at the moment’.
7.5.6 Views o higher education
A number o these young people were reluctant to progress to HE on leaing school, simply because they saw HEas an extension o school (at least at that time). Charlie, Roger, Fiona and Cian all expressed such iews:
‘But in school, no, not really, and eery day I went in, I disliked it more, you know what I mean, I wanted to getout, and ater that was, what I said to mysel was, basically I couldn’t do this or another couple o years like’.
(Charlie)
‘… like college wasn’t an option, I wouldn’t just go to college just to be there. I don’t like school … like becauseI wasn’t that good in school rst o all and I just wasn’t interested you know’. (Roger)
‘I’d no kind o intentions o going to college to do more kind o studying as such, I’d had enough in school, Itold mesel I wasn’t going …You didn’t really hae a choice going to school like but college was your kind ochoice, you know like I mean you hae to go to school, that’s the end o it like. I elt no, it’s my choice I’m notgoing to college, I don’t wanna go back into that kind o enironment again’. (Fiona)
‘… the opinion I had o college was it was, I wanted to go out straight into work, I didn’t want to be still inschool do you know what I mean. As I say I just don’t like sitting at a desk, I hate it, I can’t stand it’. (Cian)
7.5.7 Attitudes towards education (in the uture)
Ruth is currently in HE and appears satised ‘I’m just really enjoying college lie’, as are Emer and Cian. Cian was,at the time o interiew, lling out the CAO orm, with a iew to commencing Medicine in September. He has saedsome money to support himsel and has also been oered a lecturing job, teaching a night course in DIT. He seesthis as a backup plan, gien diculties emerging in the construction sector:
‘We’re noticing lads are getting laid o in construction at the moment … I hae a couple o certs but I’e noreal, I’e no real insurance policy i something happens in the construction market here I’d hae to go abroadand I don’t want to do that’.
As noted earlier, Emer is currently studying or a diploma in the UK and plans to progress to the degree leel nextyear, which would entail an additional 18 months at college.
Three respondents express a reluctance to consider HE, at least in the near uture, owing to a reliance on theirincome rom their ull-time employment. Emma, or instance, is reluctant to pursue any urther education in theshort-term, largely due to her dependence on the income rom her employment. She cites ‘haing to gie up work’as the main reason or not considering other education options. Roger also indicates that he wouldn’t considergoing back to college, at least on a ull-time basis, or nancial reasons:
‘I wouldn’t be able to go back to college ull-time … I’m too used to haing money now’.

8/4/2019 BKMNEXT146
http://slidepdf.com/reader/full/bkmnext146 150/227
136
CHAPTER 7: ENTRANTS TO FORMS OF EDUCATION OTHER THAN HIGHER EDUCATION
7.5.8 Reection on Post-School Pathway
Respondents were asked to reect on their post-school pathway and assess whether they are happy with the
choices they hae made. Like or young people who entered the labour market on leaing school, a number othese young people express a certain regret about their choices so ar. As Roger reects:
‘Just I’m more mature now, I know better like, I realise I would hae been much better o i I had hae justnot messed and not done all the stupid things that just, so pointless like you know, it can leae you with bigregrets that you’ll neer get rid o, will be there or the rest o your lie’.
In addition, Roger regrets dropping out o his degree programme in US ater two years and states:
‘i I had the chance now I would hae stayed, i I could make the decision again, there’s no way I’d stay athome like you know. I was already hal-way there, I could hae just nished that and had a much better job’.
In a similar ein, when asked what they would say to Leaing Certicate students today, most participants in thisgroup would adise them to study hard: ‘i you want to get good grades and you want to go on and get a good job,i you want to go to college … study as best you can’ (Fiona). Similarly Roger comments:
‘… just pay attention, it’s not worth all the messing and joking, like at the end o the day you might think it’sunny or a ew minutes but to see your uture … So like it’s not worth it and to just work hard, put the hoursin because at the end o the day … it’s going to make a huge dierence’.
7.5.9 Summary o the experiences o entrants to other orms o educationand training
Young people who pursue non-HE post-school ET options represent the most dierse o our school leaing groups.They also hae the highest representation o young people rom other non-manual backgrounds (six out o thenine participants). Their parents hae leels o education which appear somewhat below the leels o the HEgroup, but slightly higher than those o the LM group. In many ways, the experiences and iews expressed by thisgroup hae some resonance with both the LM and HE groups.
In the rst instance, a number o Other ET participants display a disengagement and disillusionment withormal education, which represented a major inuence on their post-school pathways. While some accept suchdisengagement was o their own doing and they were lazy, others were critical o their school experiencesand spoke somewhat negatiely about the expectations teachers held or them and the leels o adice andencouragement they receied. One participant was so discontent with his school that he studied independently
at home rom January o his Leaing Certicate year. viewing HE as an extension o second-leel schooling theseyoung people exercised the choice not to progress, thereby leaing a system they were less than happy with (I ‘hadenough in school’, ‘I don’t like sitting at a desk, I hate it, I can’t stand it’).
Howeer, there was a second, more optimistic and sel-directed group within the Other ET category. These youngpeople pursued a range o post-school aenues, some with the explicit intention o progressing to HE indirectly(mostly through a PLC programme). These young people were more satised with their school days and moreinsightul in their goals or the uture. A number hae succeeded in accessing HE and hae clear plans or theiruture careers. It is interesting to obsere that some o those who initially displayed many o the characteristicso the ormer ‘disillusioned’ group, hae since somewhat altered their outlook. In common with some members othe LM group, they reect on their school days with some regret – wishing they had taken school more seriously

8/4/2019 BKMNEXT146
http://slidepdf.com/reader/full/bkmnext146 151/227
137
CHAPTER 7: ENTRANTS TO FORMS OF EDUCATION OTHER THAN HIGHER EDUCATION
and worked harder. They now see themseles as more mature and in a better position to make choices about theiruture careers. They are more likely to recognise the alue o education and the opportunities it can create and nolonger see HE as an extension o school.
Howeer, a number continue to see HE as not or them, and again, some o those who are accustomed to earninga ull-time salary are reluctant to pursue urther study simply because they are reliant on their earnings – as oneparticipant commented ‘I’m too used to haing money now’. In essence, as young people reect on their schoolleaing decisions our years on, some are more open to educational opportunities now, while others are morereluctant to consider them owing (partly) to dependence on their ull-time income.
7.6 SummaryThe approach taken in this chapter is to use mixed methods in order to understand why it is that some youngpeople rom the non-manual group do not progress to HE and choose alternatie orms o education andtraining. In doing so, it utilises the quantitatie data to consider the characteristics o those who pursue PLC,Apprenticeship or State Sponsored Training Programmes and the qualitatie data in order to consider how theyarried at the decision to pursue these alternatie options.
The chapter began by documenting patterns o participation in Post-Leaing Certicate Courses among youngpeople who hae completed second-leel education. Figure 7.1 illustrated that oerall leels o participation in PLCcourses among school leaers has declined oer the 1997/98 – 2002/04 period (22 per cent o the cohort relatieto 17 per cent) but increased again between 2006/07 (21 per cent). Replicating ndings rom preious studies,emales continue to dominate entry to PLCs (Watson et al ., 2006) and this was also reected in the qualitatie
interiews. Clear socio-economic disparities exist with high leels o entry into this orm o post-school educationeident among young people rom other non-manual backgrounds and skilled manual backgrounds, with youngpeople rom proessional and arming backgrounds less likely to pursue this educational path. Clear disparities arealso eident within the non-manual group as the share o intermediate non-manual students entering Post-LeaingCerticate courses is considerably lower than the share o other non-manual students (18 ersus 23 per cent).In act, as with other educational outcomes preiously discussed in this report, the patterns o the intermediatenon-manual group more closely resemble those o young people rom proessional, employer/manager and armingsocio-economic backgrounds. Multiariate analyses conrm these ndings, all else being equal.
Apprenticeships hae become much more prealent as a post-school pathway in recent years due to theaourable economic conditions or construction, and among the 2006/07 cohorts who completed second-leel
education, leels o participation were at 7 per cent. Apprenticeships are dominated by males, o whom 13 percent opt or an apprenticeship upon leaing school (this was also reected in the qualitatie interiews). Clearsocio-economic disparities are eident and leels o participation are highest among those rom the other non-manual and the skilled, semi-skilled and unskilled manual socio-economic groups, which is perhaps not surprisinggien that many o the school leaers in this latter group hae parents employed in sectors dominated by theconstruction sector. Multiariate analyses conrmed that the other non-manual group displays patterns that aresimilar to manual groups.
We also considered entry into State Sponsored Training among young people who completed second-leeleducation as an alternatie education/training pathway. Among the 2006/07 cohorts, leels o participation inState Sponsored Training are at 5 per cent, and this orm o urther education is undertaken by both males and

8/4/2019 BKMNEXT146
http://slidepdf.com/reader/full/bkmnext146 152/227
138
CHAPTER 7: ENTRANTS TO FORMS OF EDUCATION OTHER THAN HIGHER EDUCATION
emales (6 per cent and 4 per cent respectiely). While leels o participation are highest among those rom non-employed households, the other non-manual group displays patterns that are more similar to the skilled manualgroup and armers/other agricultural workers.
A urther aim o this chapter was to consider how young people rom the non-manual groups arried at thedecision to pursue these alternatie options. For some the decision was ramed as an intentional decision.Two o the young people we interiewed had explicitly incorporated an alternatie education/training courseas part o their pathway to HE. This was the case or Emer and Roger. Howeer, Ruth had also been diertedto a PLC course because she initially didn’t get the points or HE. Ruth elt that participation in a PLC coursegae her an adantage oer those who directly entered HE rom second-leel education, both academically andpsychologically being prepared or HE. Howeer, issues oer the opportunities to progress rom the PLC sectorinto HE did emerge.
For others, HE was not an option because o perceied nancial constraints (Emma, Sharon). There was an
impression rom the interiews that some o the non-manual group or their parents did not hae adequate (oreen correct) knowledge o the grant system and their eligibility. Some een elt that they didn’t want to ace intoan extended period o time in which they would be ‘broke’.
For others, HE was not an option because o the importance o earning money as soon as possible (Emma, Roger)or because o their negatie experiences at school (Charlie, Fiona, Cian). The role o the school was dominantin the discourse around the decision to pursue an alternatie education/training pathway. Some argued that theschool should hae pushed them and challenged them more while others argued that the school did not recognisethe alue o alternatie education/training options. Furthermore, many o this group knew people in their yeargroup who had made the progression to HE; howeer, this seemed to be more prominent among the intermediatenon-manual group than those rom the other non-manual group.
It was also clear rom the interiews that these alternatie routes were oten the pathways pursued by therespondents’ siblings; only a ew o the young people we interiewed in this group had siblings who had enteredHE. Howeer, despite an un-established route to HE within their amilies, most o our respondents had beenencouraged by their amilies to attend some orm o post-school education or training. There was an impressionthat education was alued in the home, irrespectie o leel o parental education. The qualitatie analyses alsoindicated how this group rely heaily on their amily background or adice regarding post school choices in theabsence o eectie careers guidance at second-leel.
8/4/2019 BKMNEXT146
http://slidepdf.com/reader/full/bkmnext146 153/227
139
CHAPTER 7: ENTRANTS TO FORMS OF EDUCATION OTHER THAN HIGHER EDUCATION
Labour Market Experiences bySocio-Economic Background
CHAPTER 8
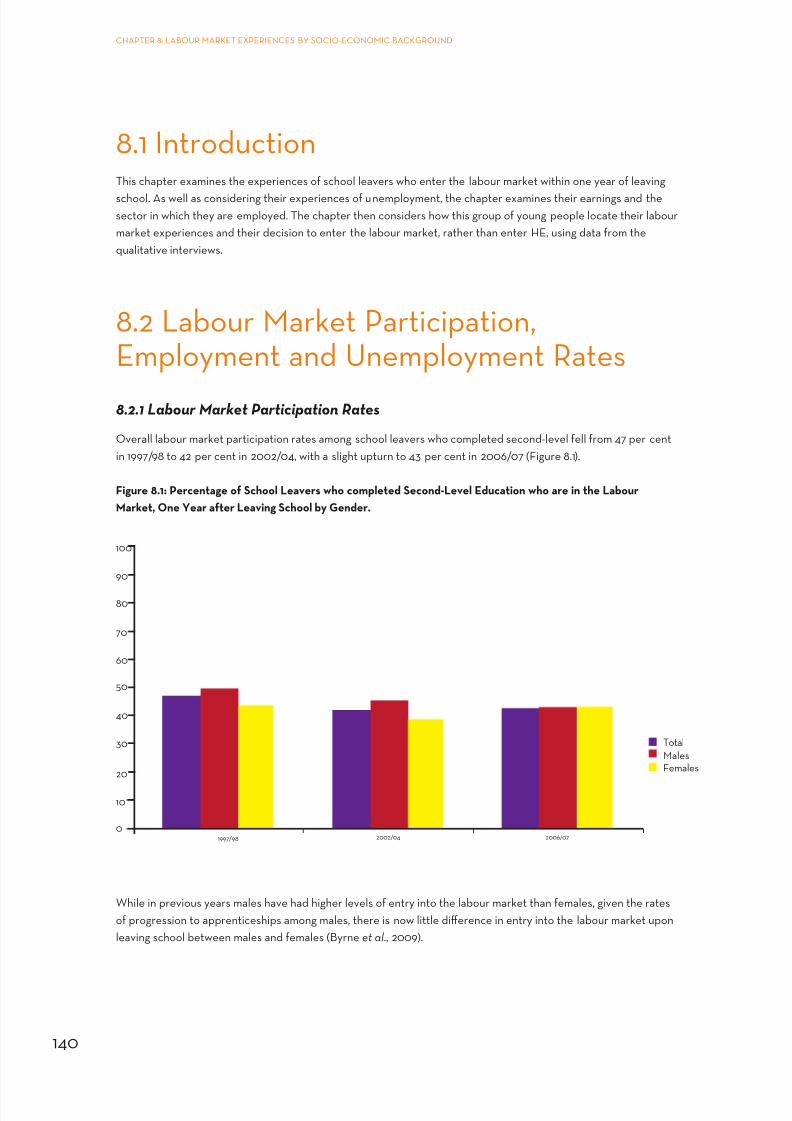
8/4/2019 BKMNEXT146
http://slidepdf.com/reader/full/bkmnext146 154/227
140
CHAPTER 8: LABOUR MARKET EXPERIENCES BY SOCIO-ECONOMIC BACKGROUND
8.1 IntroductionThis chapter examines the experiences o school leaers who enter the labour market within one year o leaing
school. As well as considering their experiences o unemployment, the chapter examines their earnings and thesector in which they are employed. The chapter then considers how this group o young people locate their labourmarket experiences and their decision to enter the labour market, rather than enter HE, using data rom thequalitatie interiews.
8.2 Labour Market Participation,Employment and Unemployment Rates
8.2.1 Labour Market Participation Rates
Oerall labour market participation rates among school leaers who completed second-leel ell rom 47 per centin 1997/98 to 42 per cent in 2002/04, with a slight upturn to 43 per cent in 2006/07 (Figure 8.1).
Figure 8.1: Percentage o School Leavers who completed Second-Level Education who are in the Labour
Market, One Year ater Leaving School by Gender.
0
10
20
30
40
50
60
70
80
90
100
Total
Males
Females
1997/98 2002/04 2006/07
While in preious years males hae had higher leels o entry into the labour market than emales, gien the rateso progression to apprenticeships among males, there is now little dierence in entry into the labour market uponleaing school between males and emales (Byrne et al ., 2009).

8/4/2019 BKMNEXT146
http://slidepdf.com/reader/full/bkmnext146 155/227
141
CHAPTER 8: LABOUR MARKET EXPERIENCES BY SOCIO-ECONOMIC BACKGROUND
Figure 8.2: Percentage o School Leavers Who Completed Second-Level and Who Entered the Labour Market,
One Year Ater Leaving School by Parental Socio-Economic Group
0
10
20
30
40
50
60
70
80
90
100
1997/1998
2002/20042006/2007Average
Employer/Manager
Farmer/OtherAgriculture
Professional IntermediateNon-Manual
OtherNon-Manual
Skilled Manual Semi and UnskilledManual
Non Employed
School leaers rom other non-manual, manual and unemployed backgrounds are more likely to enter the labourmarket (Figures 8.2 and 8.3). Young people rom intermediate non-manual backgrounds show relatiely lowleels o entry into the labour market at this stage, reecting their relatiely high rates o entry into post-school
education and training opportunities.
8.2.2 Unemployment Rates
In line with oerall economic trends, unemployment rates ell oer the period, with 11 per cent o 1997/98 schoolleaers in the labour market unemployed one year ater leaing school, alling to 8 per cent in 2002/04 and 9 percent in 2006/07 (Figure 8.3). Oer this time, the gender gap in unemployment rates has disappeared.

8/4/2019 BKMNEXT146
http://slidepdf.com/reader/full/bkmnext146 156/227
142
CHAPTER 8: LABOUR MARKET EXPERIENCES BY SOCIO-ECONOMIC BACKGROUND
Figure 8.3: Percentage o School Leavers in the Labour Market who are Unemployed
Figure 8.4: Percentage o School Leavers who Completed Second-Level and are in the Labour Market,
Unemployed
0
10
20
30
40
50
60
1997/1998
2002/2004
2006/2007Average
Employer/Manager
Farmer/OtherAgricultural
Professional IntermediateNon-Manual
OtherNon-Manual
Skilled Manual Semi and UnskilledManual
Non Employed
Unemployment rates do not ary signicantly across socio-economic groups, howeer, those rom unemployedbackgrounds experience particular diculty in accessing employment. As shown in Figure 8.4, school leaers romother non-manual backgrounds hae unemployment rates largely in line with the manual group (11 per cent and 12per cent respectie), while the intermediate non-manual group ares slightly better (8 per cent).
0
10
20
30
40
50
60
Total
Males
Females
1997/98 2002/04 2006/07

8/4/2019 BKMNEXT146
http://slidepdf.com/reader/full/bkmnext146 157/227
143
CHAPTER 8: LABOUR MARKET EXPERIENCES BY SOCIO-ECONOMIC BACKGROUND
8.2.3 Occupational Sector
Among school leaers in the labour market, those rom other non-manual and intermediate non-manualbackgrounds dier in the types o jobs in which they engage. While other non-manual youth are more likely to
enter manual employment, those rom intermediate non-manual backgrounds enter serice sector jobs in greaternumbers. Oerall employment in managerial/proessional jobs among school leaers has declined oer the period,while employment in serices and clerical sectors has risen (Table 8.1 )29.
Table 8.1: Occupational Distribution o all School Leavers in Full-time Employment by Parental Socio-Economic
Background, 1997/98, 2002/04, 2006/07 Cohorts
1997/98
Managerial/
Proessional
Clerical Service Agricul-
ture &
Fishery
Skilled
& Semi-
Skilled
Manual
Other
Manual
Proessional/Employer/Manager 11.4 20.6 26.7 2.2 33.8 5.2
Farmer 5.6 9.8 22.2 17.9 39.2 5.3
Intermediate Non-Manual 5.0 12.8 33.3 2.3 41.6 5.0
Other Non-Manual 5.0 17.1 30.6 2.3 36.4 8.6
Skilled/Semi-Skilled/Unskilled 3.3 14.2 34.6 1.5 39.1 7.2
Non-employed 4.8 14.0 28.6 1.9 45.4 5.3
2002/04
Managerial/
Proessional
Clerical Service Agricul-
ture &
Fishery
Skilled
& Semi-
Skilled
Manual
Other
Manual
Proessional/Employer/Manager 5.7 14.3 43.1 1.7 32.5 2.8
Farmer 7.3 13.1 34.6 8.2 34.4 2.4
Intermediate Non-Manual 7.3 16.6 43.8 1.5 28.1 2.8
Other Non-Manual 4.5 14.6 41.4 0.7 35.3 3.5
Skilled/Semi-Skilled/Unskilled 3.4 12.6 38.0 1.7 37.6 6.7
Non-employed 2.7 6.3 46.8 0.8 33.4 10.1
2006/07
Managerial/
Proessional
Clerical Service Agricul-
ture &
Fishery
Skilled
& Semi-
SkilledManual
Other
Manual
Proessional/Employer/Manager 17.8 18.9 24.8 2.8 35.5 0.2
Farmer 6.8 7.7 30.3 6.3 48.9 0
Intermediate Non-Manual 6.9 16.4 32.4 1.5 40.2 2.8
Other Non-Manual 11.8 19.1 30.5 2.0 36.0 0.5
Skilled/Semi-Skilled/Unskilled 4.5 9.5 30.7 2.5 49.8 2.8
Non-employed 9.0 11.9 44.2 3.5 29.7 1.7
29 The ollowing Table presents the shorter ersion o parental socio-economic group because o small numbers.

8/4/2019 BKMNEXT146
http://slidepdf.com/reader/full/bkmnext146 158/227
144
CHAPTER 8: LABOUR MARKET EXPERIENCES BY SOCIO-ECONOMIC BACKGROUND
8.2.4 Industrial Sector Table 8.2 displays the distribution o school leaers in employment by industrial sector or the three cohorts.Oerall patterns o employment remain largely unchanged oer the period. In ocusing on the non-manual groups,
the intermediate non-manual group are slightly more likely to enter proessional serices jobs, while the other non-manual group enter personal serices jobs in greater numbers. Howeer, the main point o distinction betweenthese two groups relates to employment in Industry and Distribution – a larger share o the intermediate non-manual group take up jobs in the latter industrial sector, while greater numbers o other non-manual leaers enter jobs in Industry (with the exception o the most recent cohort).
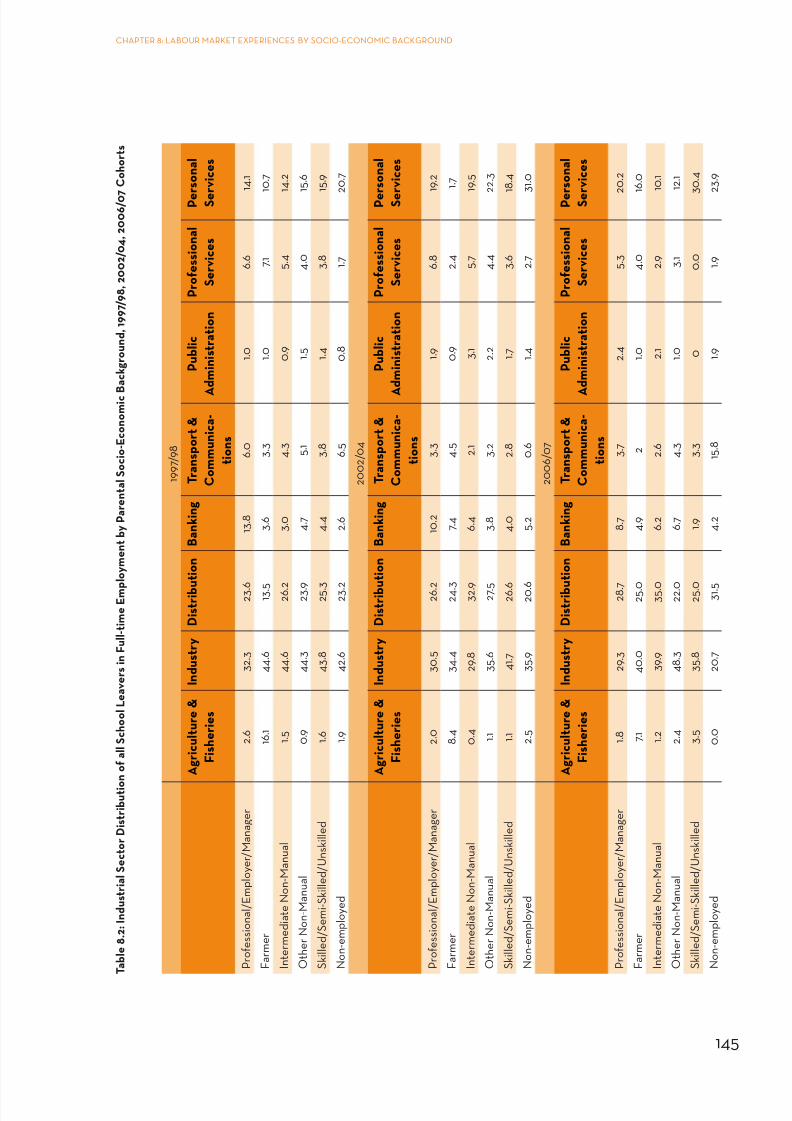
8/4/2019 BKMNEXT146
http://slidepdf.com/reader/full/bkmnext146 159/227
145
CHAPTER 8: LABOUR MARKET EXPERIENCES BY SOCIO-ECONOMIC BACKGROUND
T a b l e 8 . 2 : I n d u s t r i a l S e c t o r D i s t r i b u t i o
n o a l l S c h o o l L e a v e r s i n F u l l - t i m e E m p l o y m e n t b y P a r e n t a l S o c i o - E c o n o m i c B
a c k g r o u n d , 1 9 9 7 / 9 8 , 2 0 0 2 / 0 4 , 2 0 0 6 / 0 7 C o h o r t s
1 9 9 7 / 9 8
A g r i c u l t u r e &
F i s h e r i e s
I n d u s t r y
D i s t r i b u t i o n
B a n k i n g
T r a n s p o r t &
C o m m u n i c a -
t i o n s
P u b l i c
A
d m i n i s t r a t i o n
P r o e s s i o n a l
S e r v i c e s
P e
r s o n a l
S e
r v i c e s
P r o f e s s i o n a l / E m p l o y e r / M a n a g e r
2 . 6
3 2 . 3
2 3 . 6
1 3 . 8
6 . 0
1 . 0
6 . 6
1 4 . 1
F a r m e r
1 6 . 1
4 4 . 6
1 3 . 5
3 . 6
3 . 3
1 . 0
7 . 1
1 0 . 7
I n t e r m e d i a t e N o n - M a n u a l
1 . 5
4 4 . 6
2 6 . 2
3 . 0
4 . 3
0 . 9
5 . 4
1 4 . 2
O t h e r N o n - M a n u a l
0 . 9
4 4 . 3
2 3 . 9
4 . 7
5 . 1
1 . 5
4 . 0
1 5 . 6
S k i l l e d / S e m i - S k i l l e d / U n s k i l l e d
1 . 6
4 3 . 8
2 5 . 3
4 . 4
3 . 8
1 . 4
3 . 8
1 5 . 9
N o n - e m p l o y e d
1 . 9
4 2 . 6
2 3 . 2
2 . 6
6 . 5
0 . 8
1 . 7
2 0 . 7
2 0 0 2 / 0 4
A g r i c u l t u r e &
F i s h e r i e s
I n d u s t r y
D i s t r i b u t i o n
B a n k i n g
T r a n s p o r t &
C o m m u n i c a -
t i o n s
P u b l i c
A
d m i n i s t r a t i o n
P r o e s s i o n a l
S e r v i c e s
P e
r s o n a l
S e
r v i c e s
P r o f e s s i o n a l / E m p l o y e r / M a n a g e r
2 . 0
3 0 . 5
2 6 . 2
1 0 . 2
3 . 3
1 . 9
6 . 8
1 9 . 2
F a r m e r
8 . 4
3 4 . 4
2 4 . 3
7 . 4
4 . 5
0 . 9
2 . 4
1 . 7
I n t e r m e d i a t e N o n - M a n u a l
0 . 4
2 9 . 8
3 2 . 9
6 . 4
2 . 1
3 . 1
5 . 7
1 9 . 5
O t h e r N o n - M a n u a l
1 . 1
3 5 . 6
2 7 . 5
3 . 8
3 . 2
2 . 2
4 . 4
2 2 . 3
S k i l l e d / S e m i - S k i l l e d / U n s k i l l e d
1 . 1
4 1 . 7
2 6 . 6
4 . 0
2 . 8
1 . 7
3 . 6
1 8 . 4
N o n - e m p l o y e d
2 . 5
3 5 . 9
2 0 . 6
5 . 2
0 . 6
1 . 4
2 . 7
3 1 . 0
2 0 0 6 / 0 7
A g r i c u l t u r e &
F i s h e r i e s
I n d u s t r y
D i s t r i b u t i o n
B a n k i n g
T r a n s p o r t &
C o m m u n i c a -
t i o n s
P u b l i c
A
d m i n i s t r a t i o n
P r o e s s i o n a l
S e r v i c e s
P e
r s o n a l
S e
r v i c e s
P r o f e s s i o n a l / E m p l o y e r / M a n a g e r
1 . 8
2 9 . 3
2 8 . 7
8 . 7
3 . 7
2 . 4
5 . 3
2 0 . 2
F a r m e r
7 . 1
4 0 . 0
2 5 . 0
4 . 9
2
1 . 0
4 . 0
1 6 . 0
I n t e r m e d i a t e N o n - M a n u a l
1 . 2
3 9 . 9
3 5 . 0
6 . 2
2 . 6
2 . 1
2 . 9
1 0 . 1
O t h e r N o n - M a n u a l
2 . 4
4 8 . 3
2 2 . 0
6 . 7
4 . 3
1 . 0
3 . 1
1 2 . 1
S k i l l e d / S e m i - S k i l l e d / U n s k i l l e d
3 . 5
3 5 . 8
2 5 . 0
1 . 9
3 . 3
0
0 . 0
3 0 . 4
N o n - e m p l o y e d
0 . 0
2 0 . 7
3 1 . 5
4 . 2
1 5 . 8
1 . 9
1 . 9
2 3 . 9

8/4/2019 BKMNEXT146
http://slidepdf.com/reader/full/bkmnext146 160/227
146
CHAPTER 8: LABOUR MARKET EXPERIENCES BY SOCIO-ECONOMIC BACKGROUND
8.3 The Labour Market Entrants8.3.1 Overview
This section explores the experiences of young people who enter the labour market upon completion of theirsecond-level education and, in particular, identifies the factors underlying their decision not to pursue HE or othereducation and training options (immediately after leaving school). Among the issues considered are the familybackground of these young people, their early expectations and labour market goals, the factors influencing theirpost-school choices, their experiences since leaving school and their reflections on their lives so far.
Interviews were undertaken with thirteen school leavers who did not immediately progress to further studyor training on leaving school - six females and seven males. The group were fairly evenly split in terms of socialbackground with seven having at least one parent occupying an intermediate non-manual job and the remaining sixwith a parent employed in the other non-manual sector. In terms of educational level of parents, the group variedsomewhat. Over half of the group indicate that one or both of their parents did not complete their second-level
education; with four of these parents terminating their education prior to the second-level stage.Three individuals, Mark, Mairead and Lynda, took the LCA programme, with the remainder taking the establishedLeaving Certificate programme or the Leaving Certificate Vocational Programme (LCVP). For the individualsfor whom we have examination result information, the bulk of this group performed moderately in the LeavingCertificate examination; in contrast to the picture for HE entrants, none of the LM group performed particularlywell in the examination. For the LCA leavers, participation in the programme was not viewed as having an impacton their post-school choices, as all three talk about not having an interest in HE. This issue is discussed in detaillater in the chapter. In common with the patterns for other groups, the bulk of the LM group had been engaged inpaid employment while at school.
For the purposes of the analysis, the LM group can be differentiated into two main groups: firstly, those who enterthe labour market on leaving school and remain there for the duration of the period since leaving school (3-4 years
typically) and, secondly, those who enter the labour market and later progress to some form of educationor training course – many taking either a PLC course or entering an apprenticeship programme. In total, sixmembers of the LM group remain in the labour market and the balance participated in an education or trainingcourse. Three of the group had attended a DEIS school, all of whom have remained in the labour market sinceleaving school.
Table 8.3: Demographic Details of the Labour Market Group
Name School Type INM or ONM Education or Training
Participation
Sarah Secondary Non-DEIS INM PLC
Aideen Comprehensive Non-DEIS ONM PLCRachael Comprehensive DEIS ONM -
Declan Secondary Non-DEIS INM Apprenticeship
Vincent Comprehensive Non-DEIS INM Apprenticeship
Michael Secondary Non-DEIS INM -
Mark Comprehensive Non-DEIS INM Apprenticeship
Mairead Comprehensive DEIS ONM -
Tony Secondary Non-DEIS INM Apprenticeship
Dermot Vocational DEIS INM -
Lynda Comprehensive Non-DEIS ONM -
Sally Secondary Non-DEIS ONM PLC and FÁS CourseNoel Comprehensive Non-DEIS ONM

8/4/2019 BKMNEXT146
http://slidepdf.com/reader/full/bkmnext146 161/227
147
CHAPTER 8: LABOUR MARKET EXPERIENCES BY SOCIO-ECONOMIC BACKGROUND
8.3.2 Home Life and Parental ExpectationsMembers of the LM group grew up in a variety of urban and rural settings, spread geographically across thecountry. The majority of the group spoke positively about where they grew up, although two participants
commented that they grew up in more disadvantaged environments, one where there were ‘loads of scumbags’and the other noting that ‘it is not a very nice area to grow up in’. As noted earlier, about half of the group hadat least one parent in an intermediate non-manual job. It is interesting to note that all of those who progressedto an apprenticeship programme since leaving school come from an intermediate non-manual background,while the majority of those who remained in the labour market come from the other non-manual group. It is alsointeresting to observe that, bar one, all of the parents of those who progressed to apprenticeship programmeshad themselves completed second-level education and many had completed post-secondary education. A numberof those who remained in the labour market or entered a PLC course had parents who had either not completedtheir second-level education or not progressed beyond primary school. These initial results suggest that the profileof students progressing to apprenticeship programmes is distinct to other members of the LM group.
In terms of parents’ views of the choices made by these young people, most indicated that their parents werebroadly happy, particularly the parents of those who subsequently progressed to a PLC or apprenticeshipprogramme. As Aideen commented:
‘they were delighted I actually went and done it’,
while Declan observes
‘they’re happy with it [doing an apprenticeship], once I’m happy like, they are’.
In a similar vein Rachael felt:
‘they were happy once I was happy ... they didn’t push college on me either’, ‘they never put pressure on meto do well at school, they always said do your best … they’re just happy I’m doing what I enjoy’.
However, a number of participants felt pressure ‘from family, friends, school everyone’ (Declan) to take a certainpathway. For some this was pressure to pursue HE; ‘yeah they always tried to get me to go to college’ (Lynda). In anumber of cases this stemmed from an older sibling taking this route (Michael). Michael went on to note the prideshown by his parents when his siblings had progressed to college, which may have placed a certain covert pressureon him to do the same:
‘I think it is just because they never went to college themselves, so they’re proud of like any kids who go tocollege … they were well proud of my brother and sister when they graduated’.
One individual was encouraged, from an early age, to follow in his father’s footsteps and join the guards (as Dermotnoted ‘he keeps pestering me so he does, he keeps going on to me [to join the Gardaí]’). Conversely, a lack ofinterest in parental career choices left one respondent unsure of what options he could pursue:
‘… a lot of other people you know, you see one guard in the family, obviously enough if he has a son he hasto be a guard, but no I wasn’t going to be a guard and both their parents were farmers, [I] didn’t want to be afarmer, so since I had no interest in sport or academia really, there didn’t seem to be a whole pile available’.(Mark)
Others were encouraged by their parents to take advantage of the booming economy and enter the labour marketas soon as possible (Noel). Similarly, Vincent was encouraged to pursue an apprenticeship:

8/4/2019 BKMNEXT146
http://slidepdf.com/reader/full/bkmnext146 162/227
148
CHAPTER 8: LABOUR MARKET EXPERIENCES BY SOCIO-ECONOMIC BACKGROUND
‘[My parents were] mostly saying go for a trade because at the time there was a big boom and everybodywas talking about trades …. [Dad] said get a trade like, four years get a trade, you can travel with it, look atAustralia now crying out for people as well, Canada, America, once you’ve a trade like and once you’re good
at it, you’ll get far’.
In Tony’s case, his parents were initially disappointed that he did not go on to HE, but later accepted his decisionto pursue an apprenticeship:
‘Well they were a bit pissed off at the start to be honest, because they’d spent a lot of money on myeducation … and I just went straight into a trade … but after a while … they just copped on and they were just like yeah it is probably better like that I didn’t go to college, because I’m not the person to sit down andstudy … They were against it but they came around in the end’.
Overall, participants felt their parents were largely happy with their choices on leaving school, with those who
progressed to education and training opportunities later most likely to indicate that their parents were proud oftheir efforts. The extent to which these young people considered HE as a possibility for them is discussed later inthe chapter, alongside a discussion of the factors underlying their non-progression to HE.
8.3.3 Attitudes towards finishing school
The LM group, like the other groups, were asked to reflect on their thoughts and feelings as they were leavingschool. The responses reflected a range of emotions including a desire to be out of school and education moregenerally, uncertainty, nervousness and looking forward to a break from the routine of school. A number feltcontent to be leaving an environment in which they were not happy, as Declan comments:
How did you feel about leaving school?
‘I was delighted, I really, I didn’t like it at all…. I was just sick of it’. (Declan)
Others were more reminiscent and noted that they missed school, at least initially, as Dermot observed ‘youmissed [school] at the start … you miss the craic’. Likewise Vincent felt that ‘I suppose you’re going to miss a lot offriends, like a lot of people that I was very close to in sixth year now I wouldn’t be close to now at all’.While Mairead observed:
‘I didn’t want to finish school’.Did you not?
‘No, just because it was just 9 to 4 like everyday, I just didn’t want to leave because I got on with the teachers
like … some of them were like friends, you’d get a laugh off some of them, that’s why I didn’t want to leave’.
Some associated leaving school with a certain amount of uncertainty about what they might do next and about thefuture more generally. As Mark states ‘I didn’t have a clue what I wanted to do’. In a similar vein, Aideen comments:
‘… everyone just kept saying I just can’t wait to get out of this school like for some reason, I don’t knowlike and then we left and like oh god like what will I do because when you’re in school you have a weeklytimetable like you’re always busy like and then you’re saying how will I, what will my time keeping be like now,what will I do with me time like’.

8/4/2019 BKMNEXT146
http://slidepdf.com/reader/full/bkmnext146 163/227
149
CHAPTER 8: LABOUR MARKET EXPERIENCES BY SOCIO-ECONOMIC BACKGROUND
Lynda and Mark refer to a certain nervousness and anxiety at that time, which reflected the loss of the support ofschool personnel and again uncertainty over the future:
How did you feel when you were finishing school?‘Nervous’.
And why were you nervous?‘Because just you’re on your own now type of thing’. (Lynda)
‘[I was] Anxious [with regard to leaving school] … I didn’t quite know what I was going to do’. (Mark)
Some appeared more content and looked forward to taking a break and then entering the labour force.As Michael reflects:
And were you thinking I’d like to study or I’d like to work? What were your first plans?
‘Nothing really I just wanted to chill out for a couple of months’.To do nothing for a while?‘Yeah’.
And what choices did you feel you had at that point?‘Choices, not a whole lot, just get a job pretty much’.
8.3.4 College Thoughts
As noted earlier, a small minority of the LM participants did have HE expectations and plans while at school, andreflected those intentions in completing the CAO application form. However, their lack of progression reflecteda range of factors. As noted earlier in Rachael’s case, failing higher level Irish left her without any HE offers, whichshe was bitterly disappointed about. However, she is optimistic about her future and does plan to progress her
qualifications in the future:
‘I’m the only one that can change that now, if I really want to do something I have to go for it … I think there’sa lot of options out there, I mean distance learning and flexi-learning’. (Rachael)
However, the majority of this group did not have specific plans to progress to HE while in school. Their reasonsreflected a range of factors. Dermot, Mairead and Mark did not have any great interest in HE at the time, inMairead’s case she felt she would find it too difficult:
‘I don’t know I just don’t see myself as a college person like, I don’t know I just don’t see myself going tocollege … I was thinking people are complaining about ‘oh the work is too hard’ and I’m not good under
stress, I’d go mad like … if I wasn’t able to do something and I’d think then I’d be in big trouble if I couldn’t getit done … So I just knew it wasn’t for me like, I didn’t even think of going’. (Mairead)
‘I didn’t kind of believe in the whole going straight into college after school thing, but that is because I wasn’treally so keen on going’. (Mark)
Unhappy experiences in school led to a situation where a number of the LM group were ‘turned off’ the idea oflearning or studying further at least in the short-term. For Declan, for example, initial disinterest in pursuing furtherstudy altered a number of years later. He progressed to an apprenticeship programme and greatly enjoyed thecollege placement component of his programme and observed that he had no difficulty in engaging in study andattending classes now:

8/4/2019 BKMNEXT146
http://slidepdf.com/reader/full/bkmnext146 164/227
150
CHAPTER 8: LABOUR MARKET EXPERIENCES BY SOCIO-ECONOMIC BACKGROUND
‘When I left school [I was turned off learning] but now it is not too bad, like seeing inside here like [anInstitute of Technology study release component of the apprenticeship] it is no bother to study every hourof the day like it is grand. It is not so much of a chore; once you find something you’re interested in. Like I
had no interest in French or English or Irish or any of that’.
For Sally, a lack of direction and clear focus left her unsure about what she might do after leaving school: ‘I justdidn’t know what I wanted to do so I had no sense of what to work towards ... it was just I had no sense of directionthat’s what I think now’. The situation for Tony was similar, as he notes ‘Well I didn’t want to go to college, becausethere was nothing that interested me in college’. However, he since regrets his choices and performance at school:
‘I kind of regret it now as well though, I wouldn’t have minded going to college, being where I’m at now like ...there is a lot of things that my friends are doing that I would have been interested in as well … when I finishmy trade, I might decide to go back to college and do something’.
A number of LM participants do now accept that HE can confer certain advantages in life and improve yourstandard of living. Michael, who didn’t have much interest in HE when leaving school, talks about the social andfinancial benefits of attending HE:
‘It keeps your brain sharp and it gives you qualifications so you’ll be getting paid more than minimum wage,you know like if you’re going into a specialised sector, you’ll make a decent living for yourself’.
So would you say the benefits are really in terms of the job you get?‘Well pretty much like, you’ll make friends that you’ll keep for life in college and stuff as well’.
While Vincent alludes to the differences between the work he is currently doing as an apprentice in theconstruction sector and the jobs HE graduates might pursue:
‘… [college] leads into a lot of better jobs I think and you’re not up to muck and dirt everyday of the weekand the cold weather like today out working on building sites.
Finally, Sarah reflects on the importance of furthering ones qualifications:
‘… in my head I was like ‘right that’s it you have to go to college’ because all my friends are finishing and I’monly starting so I was like ‘ok you have to go because you know you have to eventually go to college like youknow you are not gonna get that far without like [qualifications]’.
For some, they had firm plans to pursue others forms of education or training or other career options that did not
require HE qualifications. As Lynda indicated ‘I just always wanted an office job’, and felt she would not need a HEqualification to achieve that. Dermot’s ambition to enter the Gardaí meant he did not seriously consider any otheroptions, which he now regrets:
‘If the teachers would have sat down and told you like, it mightn’t happen the way you think it is going tohappen and just better keep your options open and sit down and walk you through it instead’.
8.3.5 Importance of having an Income
For nearly half of the LM group, a keen interest in securing an (full-time) income as soon as possible was the mainfactor underlying their lack of interest in HE or other post-school ET options:

8/4/2019 BKMNEXT146
http://slidepdf.com/reader/full/bkmnext146 165/227
151
CHAPTER 8: LABOUR MARKET EXPERIENCES BY SOCIO-ECONOMIC BACKGROUND
And was it important that you got a job and had an income?‘Oh yeah very important yeah’.
And what would you say was the most important thing to you?‘Get an income, obviously I suppose get your keep and that like’.
So that was kind of a big priority for you?‘Yeah well it would be like because do you know around the time of the social welfare, you can’t really bekind of handing out money because you get very little money on social welfare’. (Noel)
Such income orientation was also uppermost in the minds of Dermot and Vincent. For Rachael, HE participationwould require financial assistance from her parents which she felt was not reasonable given that she had beensupporting herself during her latter years at school:
‘It is just the money, [I was] used to the money so much, the thought of going to college and having no moneyand not being able to go out … you always hear of student life, they’ve no money and all, I just couldn’t’.(Dermot)
So what was the first thing you wanted to do when you left school?‘I don’t know make money … yeah get a car I suppose that would have been another thing’. (Vincent)
‘… like I was working from the time I was sixteen and even when I thought of going to college full-time, I waslike how, like I wouldn’t have, I couldn’t have, I just wouldn’t have asked my mum and dad for money … I wasafter being earning since I was sixteen, I hadn’t asked them for money since then and to suddenly at the ageof eighteen to say ok I’m giving up working can I have the money to go to college, I think they would havebeen shocked themselves’. (Rachael)
8.3.6 Financial Barriers/Support to go to HE
Participants were asked to consider how they would have financially supported themselves had they progressed toHE. Declan was the only respondent who felt that he would have no major financial difficulties as his parents wouldhave supported him. A number of members of the LM group indicated that they would have been eligible for stategrant support had they progressed, however this was not considered sufficient to entice them to go to college:
‘[I] would not have been eligible for a full grant but would have received a half grant’.Would that not help?
‘No ... that is not that much like ... when you’re down in college you’d have, like if I went to college anyway,
I’d want to live near the college, I wouldn’t want to live at home … you’d have to pay for accommodation andfood and all’.If you were to be given a much bigger grant would you go [to HE]?
‘Oh aye definitely, if there was money, definitely’. (Dermot)
One participant is currently in receipt of the Back to Education Allowance, which helps greatly but only just allowshim to make ends meet.
However, the bulk of participants who were aware of their grant eligibility status felt they would not have receivedfinancial support had they progressed to HE. As Aideen noted ‘[I] wasn’t entitled to anything’, as her father’searnings were outside the threshold for grant support. Similarly, Rachael indicated:
8/4/2019 BKMNEXT146
http://slidepdf.com/reader/full/bkmnext146 166/227
152
CHAPTER 8: LABOUR MARKET EXPERIENCES BY SOCIO-ECONOMIC BACKGROUND
‘No I don’t think so, I don’t remember whether, I don’t know if it was something to do with me dad’s job but Idon’t think we were [eligible for a grant]’. (Rachael)
A number of individuals felt that the individual assessment of ‘mature’ students after the age of 23 years was unfairon those who were a year or two younger than the cut-off. As Sarah notes, her ‘dad’s earnings are too much’ to beeligible for a grant and is annoyed that at 22 years of age she receives no support but in a years time she wouldreceive state support as a mature student. However, Sally, who is currently in receipt of a ‘small grant, it’s like 140 amonth’ (to support her PLC studies), plans to enrol in HE when she is twenty-three, as a mature student, with threeplaces on the course she is aiming for reserved for mature students.
8.3.7 Friends in HE
Most of the LM respondents had close friends who had progressed to HE. As Aideen observed, her friend hasrecently completed her HE course; however, she has yet to secure employment in that field:
‘… me best friend [name] went to, she went to DIT she done what do you call that course, Human Resources,HR like and she cannot find a job anywhere, she done four years and she graduated last month’.
When asked to consider their position relative to their friends who have attended HE, Rachael and Sally felt thattheir friends in HE were likely to have a better financial position than them:
‘Oh I’d say they’ll definitely have different earnings ... you’re kind of left behind because you didn’t go tocollege’. (Rachael)
‘I suppose they’re more financially stable than me’. (Sally)
However, a number of respondents felt that those who have spent the last 3 or 4 years in college are likely to lacklife skills:
‘I think they’re gonna get a shock when they go in to actually work full-time … they used to go out everyWednesday, Thursday, Friday, which is fair enough for them ... when they used to ask us we’d be like ‘no wecan’t go out tomorrow’, we couldn’t face work with a hangover, I think they’re gonna get that, I think they’re just gonna think ‘god they weren’t actually lying when they said it [work] was stressful’. (Sarah)
Tony and Vincent actually feel that they may have certain advantages over their college-educated peers.In particular, they contend that they have gained important human capital skills, which gives them higher earnings(at least initially) than their HE peers:
‘I see a lot of differences … by the time they’re finished college, they’ll be going to get a job … and they’llbe starting from scratch, where I have got the work already started, I’ve been working and I’ll have myapprenticeship ... I’ll hopefully be making a lot more money than some of them’. (Tony)
‘I probably have a better opportunity ... if you impress at an interview whether you have qualifications or notyou might get the job ... it’s all about the interview, it is all about your personality and how hard you’re goingto work at the end of the day. And if they hear that I’ve been working on a building site for four years, they’regoing to say oh Jesus this lad is a tough worker’. (Vincent)

8/4/2019 BKMNEXT146
http://slidepdf.com/reader/full/bkmnext146 167/227
153
CHAPTER 8: LABOUR MARKET EXPERIENCES BY SOCIO-ECONOMIC BACKGROUND
8.3.8 Education and Training Experiences Since Leaving School
As noted earlier, over half of those who entered the LM on leaving school did actually pursue some form ofeducation or training subsequently. As with apprenticeship participants discussed in Chapter 7, a number of the
male leavers commented on the ‘pull of apprenticeships’ in a climate where construction sector jobs were plentifuland many of their peers had pursued this pathway.
For many of the participants in the LM group, PLC courses are providing valuable training opportunities.However, Lynda, Mark and Sally all left their respective courses after just a couple of months citing a lack ofinterest in the course content. However, Aideen has recently completed her PLC course, Sarah is due to completeher course in the coming months, Sally has since taken another PLC course and hopes to progress to HE uponcompletion and Michael is due to complete his two-year PLC course shortly and also plans to progress touniversity on completion.
8.3.9 Attitudes towards education (in the future)
Despite somewhat negative reflections on their school days, many of the respondents in the LM group have, if notdefinite plans, then at least intentions to take further courses in the future. They appear to be more cognisant ofthe potential value of securing additional training or qualifications now, four years after leaving school (for mostof them). Aideen intends on going back to repeat Maths (taking it as an evening course), while Lynda would like totake an accountancy course, which will help her to progress in her job (once her baby is a little older) - probably anight course while remaining in her current job.
Mark may, in the coming years, take a PLC course which would allow him to enter HE, but has no definite plans.Similarly, Michael may take a course in film and tv, possibly a PLC, but has no definite plans. Noel would like topursue an apprenticeship but fears he may be getting too old:
‘an apprenticeship that’s the only college I’ll do now .. [but worries that] I’m getting a bit old now like, well I’mnot an old lad or anything I’m only 21 but do you know what I mean’.
Mairead would like to do a private pharmacy technicians course, which she and her boyfriend will pay for (at a costof several thousand euro).
Declan (who is currently completing his apprenticeship) feels:
‘there is no real job security or anything like that so I reckon I’m going to go to college when I finish up andhopefully take over my father’s business’.
As a result he hopes to take a business course when he completes his apprenticeship. He intends on applyingthrough the CAO and expects to be offered the business course he was offered first time round. If he doesn’t geta place he will
‘wait ‘til I’m, is it 24 you can apply as a mature student?’.
He feels he has a different outlook now and is more open to HE now than when he was leaving school:
‘I couldn’t have faced into that when I finished school no way, another four years of it, or something similaranyway, but no I’d be looking forward to doing it now … when I was 17 if I would have passed at all, I wouldhave scraped though it … when I do it now, I’ll do very well in it now I’d say’. (Declan)

8/4/2019 BKMNEXT146
http://slidepdf.com/reader/full/bkmnext146 168/227
154
CHAPTER 8: LABOUR MARKET EXPERIENCES BY SOCIO-ECONOMIC BACKGROUND
Rachael is keen to take a special needs assistant course (PLC) starting in the next academic year and progressfrom that to psychology in university:
‘I suppose I still have the same goals as in I want to make more of myself and I want to have a degree or adiploma behind me and I want to have a job that I’m skilled at, instead of just something that I’ve kind ofpicked up along the way’ … but she sees herself in a different field ‘but as regards the choices that I’ve madeon my CAO [when in school] when I look back I don’t see myself working as any of those jobs now’.
Sally is currently completing her PLC course and
‘then after that hopefully I’ll get into college, I have put [name of college] down as my first choice and thenI’m going to apply [names of other HE courses] … so keep my options open’.
Sarah and Tony plan on completing their current courses and have no plans to pursue anything else at the present.
‘I keep thinking I’m 22 starting and what will I be 23, 24 leaving and then I go on and do another two years fora four year degree course it’s just, the way I look at it and go, I’m not interested’. (Sarah)
‘… finishing off the trade, that’s my main priority at the moment you know, get that out of the way … maybe goback to college, I don’t know yet like you know that way’. (Tony)
Dermot and Vincent do not see themselves pursuing any HE or other educational courses owing to a reliance on afull-time income:
‘It is just the money, used to the money so much, the thought of going to college and having no money andnot being able to go out or any, I don’t know it is not that good’. (Dermot)
Similarly, Vincent does not see himself engaging in further study in the future:
‘I couldn’t see myself studying, possibly something like maybe go and be a prison officer, I know that involvesstudying but not day to day studying, not for me no … the money as well like, you’re not going to be getting awage packet every week ... when you’ve a car loan and you know bits and pieces’.
Even if he was offered a grant, he doesn’t see HE as an option for him:
‘No .. because I don’t think it is enough what they give you a lot of the time, well from what I’ve heardanyway’. (Vincent)
8.3.10 Reflection on Post-School Pathway
Respondents were asked to reflect on the choices they made on leaving school and whether they were happywith the choices they made or would have made different choices. Both Mark and Rachael regret not going to HEimmediately after leaving school, believing that it is more difficult to do so later in life:
‘It is because a lot more of it [financial support] is provided for you … grants and stuff that look morefavourably on young people’. (Mark)
Rachael also feels it is harder to go back later ‘if you get used to having money in your pocket’.

8/4/2019 BKMNEXT146
http://slidepdf.com/reader/full/bkmnext146 169/227
155
CHAPTER 8: LABOUR MARKET EXPERIENCES BY SOCIO-ECONOMIC BACKGROUND
However, others felt it might be better to enter HE when one is older and more likely to make more informedchoices and to be genuinely interested in the subject matter:
‘… a lot off them [her classmates] are gone back now, because you can do mature student and all that so youcan actually go back. And I think when you go back now you kind of are more into it, you know you’d studymore than what you’d do when you’re younger because you’re mad about going out and all you know for thesocial life that you’re better when you’re a little older’. (Aideen)
So do you think lots of people at 17 or 18 make poor choices or poorly informed choices?‘I’d say they make poorly informed choices, I think they go with what they feel they want to do, but maybe ifthey had more information their choices would be different … I’m in a better position [to make choices now]… [when you are filling] out the CAO [first time round] the obvious thing is you’re just going to pick the firstthing that you take an interest in … whereas now if somebody said to me, ‘ok here’s a CAO form, fill it outwith what you want to do’, I think I’d spend much more time on it. I’d realise the importance of what I was
actually filling out’. (Rachael)
Furthermore, Declan felt he wasn’t in the right frame of mind to go on to college after school:
‘I just didn’t have the head on me for that … I was too immature at the time’, and lots of his friends went tocollege for the sake of it, for the social element.
Similarly, Mark comments that:
‘most people they go and they take arts or something just to get into college and they feel around and seewhat they want to do but technically that is just wasting a year or two years of everyone’s time and money’.
Declan goes on to contend that for many young people
‘There’s pressure to be able to get into college straight after school as well of course’. Sally also alludes tosuch pressure and observes ‘because I’ve chosen to go back … I think a lot of the younger ones their parentsput a little bit of pressure to do something, go to college or do a PLC so I think a lot of it is forced’.
In reflecting on their school and post-school choices, a common theme for the LM group was a certain level ofregret at the level of interest they took in school and the extent to which they worked to their abilities. Sarah, forexample, wishes that she had studied ‘properly’ when she was in school:
‘… that’s the one thing if I could go back and do it [again] I would properly study, not saying that I did not
study but like I wasn’t interested … I was more concerned about going, maybe going out at the weekendsseeing my boyfriend kind of that kind of thing … if I had only known’.
Vincent similarly states ‘[I would have] worked harder, listened more, especially in the last, well in the last coupleof years I did do better but you just missed so much from the years previous [it was difficult to catch up]’. But heaccepts responsibility for his behaviour:
‘… it was down to me, you can’t really put the blame on other people, if you’re not willing to give it a onehundred per cent then you’re not going to succeed so, if you only give it fifty, that’s all you’ll get out of it,that’s the way I look at it , it is kind of like what you deserve at the end of the day’.

8/4/2019 BKMNEXT146
http://slidepdf.com/reader/full/bkmnext146 170/227
156
CHAPTER 8: LABOUR MARKET EXPERIENCES BY SOCIO-ECONOMIC BACKGROUND
These respondents are generally cognisant of the consequences of their poor behaviour and consequent poorexamination performance for their post-school options. As Sally reflects:
Looking back would you do anything differently?‘I suppose I would have listened more in school, achieved the points and put my head down because Iknow I am capable of it, I didn’t think so at the time but … I would have attended school more often and justprobably started education, third-level education, straight after [the] Leaving Cert’.
While for Vincent his decision to take an apprenticeship was partly a result of not working hard while at schooland therefore not achieving high grades in the Leaving Certificate. Vincent and his friends agree:
‘...they’re going ah Jesus if we’d done better in school, you know if we had put our heads down and listenedto the teachers’.
And what do you think stopped you listening and working harder?‘Immaturity at the time’.
In a similar vein, Michael comments
‘I was too young at that stage like, I didn’t really see the consequences of not going into school’.
However, as noted earlier many of these young people have gone on to secure some form of post-schooleducation or training and Sally, for example, suggests that making that choice to complete non-compulsory post-school education has provided personal empowerment and motivation:
‘I just loved being back in education again, back in kind of school, even though I hated it at the same time
when I was in school but making the choice to go and do something, kind of motivated me and [I] got highmarks in all the exams that I done and that kind of motivated me, make me think well I’m not as stupid aswhat I thought so maybe I can do it’. (Sally)
In asking the school leavers to offer advice to those facing the Leaving Certificate this year, most advised them towork hard. As Declan states:
‘Get the head down and do a bit of study and get whatever course you’ve applied for and then you candecide whether you want to do it or you want to take time off or you want to do something else, you canalways come back and do it then later’.
Lynda, Mairead, Mark, Michael and Vincent expressed similar comments. Dermot also advises to have a number ofoptions rather than relying on one. These views contrast somewhat with the advice of those who progressed to HE– many of whom referred to college choice processes in their advice to school leavers (See Chapter 3).
8.3.11 Future Thoughts
Many of the participants talk about the importance of work in their future, for some this reflects a high prioritybeing placed on income (Dermot). For those who took the apprenticeship path, the physically demanding nature oftheir work is an issue they raise and one which concerns them for the future. Furthermore, economic uncertainty isan issue that has created some unease for them lately:

8/4/2019 BKMNEXT146
http://slidepdf.com/reader/full/bkmnext146 171/227
157
CHAPTER 8: LABOUR MARKET EXPERIENCES BY SOCIO-ECONOMIC BACKGROUND
‘… it is terrible hard to get a job now like and even if you do like it is hard to keep a job then … you’re gettinglet off all the time now over houses not getting sold and your boss losing contracts’. (Noel)
Tony had difficulty maintaining his apprenticeship as a result of the economic climate:
‘I’d be well into my apprenticeship at this stage like but due to like the whole work scenario like there is not alot of work going for apprentices’.
A number of others see a change in career path (Declan, for example, plans to take over his father’s business).Furthermore, a number of those who entered apprenticeships do not see that work as long-term: Vincent plans togo into Sales after a few years.
The females in this group seem more optimistic about the future. They also appear to have more definite plans andbe more goal oriented. As Sarah states:
‘I still have the same goals as in I want to make more of myself and I want to have a degree or a diplomabehind me and I want to have a job that I’m skilled at’. Sally is also optimistic: ‘[in 5 years] hopefully [I will be] just finishing my degree, I’ll be working a year … and then maybe go back and specialise in an area’.
In contrast the male respondents appear somewhat more fatalistic about their futures and less goal-oriented:
‘I actually don’t think I had absolutely any expectations, I figured I’d just make it up as I went along andpossibly fall into something … I was very listless and lackadaisical. (Mark)
Finally, the majority of participants expressed a desire to ‘go travelling’, usually to Australia for up to a year- Aideen, Declan, Mark and Tony all expressed such intentions. For some, particularly those who had takenapprenticeships in the construction sector, their plans to travel also reflected a downturn in the economy:
‘… because everyone is getting laid off … a couple of my mates are going to Australia in August … I might headover to them … one of the boys was laid off, he asked like nineteen different boys [construction companies]for work and couldn’t get any’. (Dermot)
‘I’ve seen it [Australia] is the best place now because all I’m into is building and there is not really muchbuilding here like, it is either Australia or England because England are crying out for it all, like builders andall that like, it would be easy enough to get a job’ (Noel)
8.3.12 Summary of the experiences of labour market entrants
In total 13 young people out of our sample of 29 entered the labour market full-time on leaving school.Their decision to terminate their education (at least in the short-term) reflected a range of factors and underlying processes. However, as discussed in Chapter Five, central to their experiences was a somewhat negative reflection on their school days and consequently a desire, for some, to get away from formal education. Their negativity tended to surround the teaching methods adopted by their teachers, their classroom environments, the expectations teachers had for them and the advice they received on their post-school options. A number of this group indicated that they were unmotivated about the academic aspects of school, were largely disinterested and lacked any real direction or focus. In reflecting on their school days, a number of the male respondents also felt they were too immature and, hence did not take their school work seriously.
‘… it is terrible hard to get a job now like and even if you do like it is hard to keep a job then … you’re gettinglet off all the time now over houses not getting sold and your boss losing contracts’. (Noel)
Tony had difficulty maintaining his apprenticeship as a result of the economic climate:
‘I’d be well into my apprenticeship at this stage like but due to like the whole work scenario like there is not alot of work going for apprentices’.
A number of others see a change in career path (Declan, for example, plans to take over his father’s business).Furthermore, a number of those who entered apprenticeships do not see that work as long-term: Vincent plans togo into Sales after a few years.
The females in this group seem more optimistic about the future. They also appear to have more definite plans andbe more goal oriented. As Sarah states:
‘I still have the same goals as in I want to make more of myself and I want to have a degree or a diplomabehind me and I want to have a job that I’m skilled at’. Sally is also optimistic: ‘[in 5 years] hopefully [I will be] just finishing my degree, I’ll be working a year … and then maybe go back and specialise in an area’.
In contrast the male respondents appear somewhat more fatalistic about their futures and less goal-oriented:
‘I actually don’t think I had absolutely any expectations, I figured I’d just make it up as I went along andpossibly fall into something … I was very listless and lackadaisical’. (Mark)
Finally, the majority of participants expressed a desire to ‘go travelling’, usually to Australia for up to a year- Aideen, Declan, Mark and Tony all expressed such intentions. For some, particularly those who had taken
apprenticeships in the construction sector, their plans to travel also reflected a downturn in the economy:
‘… because everyone is getting laid off … a couple of my mates are going to Australia in August … I might headover to them … one of the boys was laid off, he asked like nineteen different boys [construction companies]for work and couldn’t get any’. (Dermot)
‘I’ve seen it [Australia] is the best place now because all I’m into is building and there is not really muchbuilding here like, it is either Australia or England because England are crying out for it all, like builders andall that like, it would be easy enough to get a job’. (Noel)
8.3.12 Summary of the experiences of labour market entrants
In total 13 young people out of our sample of 29 entered the labour market full-time on leaving school.Their decision to terminate their education (at least in the short-term) reflected a range of factors and underlyingprocesses. However, as discussed in Chapter Five, central to their experiences was a somewhat negativereflection on their school days and consequently a desire, for some, to get away from formal education. Theirnegativity tended to surround the teaching methods adopted by their teachers, their classroom environments, theexpectations teachers had for them and the advice they received on their post-school options. A number of thisgroup indicated that they were unmotivated about the academic aspects of school, were largely disinterested andlacked any real direction or focus. In reflecting on their school days, a number of the male respondents also feltthey were too immature and, hence did not take their school work seriously.

8/4/2019 BKMNEXT146
http://slidepdf.com/reader/full/bkmnext146 172/227
158
CHAPTER 8: LABOUR MARKET EXPERIENCES BY SOCIO-ECONOMIC BACKGROUND
The picture is not wholly negative, however. A number of participants did aspire to HE and went through theCAO application process. Their lack of progression to HE, at that time, reflected either their Leaving Certificateperformance (either insufficient points or failing a required subject) or uncertainty over what they should study
and whether they were capable of succeeding at HE. In one case, a participant felt he ‘did not have the head for it’at the time.
The key processes underlying the choices of these young people also reflected a number of pull factors; namelythe pull of full-time employment and income and the ready availability of (construction sector) apprenticeships.Being ‘used to have money in your pocket’ became an important factor in the decision of a number of these youngpeople to remain in the labour market and not further their education.
However, half of this group of young people have succeeded in progressing to some form of education or trainingand a number aspire to enter HE in the coming years. It is clear that many of these young people have a differentoutlook now, four years after leaving school. Some have clear HE aspirations (a number through completing a PLC
course and others as mature students) and certainly they seem to have a greater openness to education now thanwhen they were leaving school. They also feel they would make better, more inform ed (course) choices now andwould have a greater level of maturity that would enable them to succeed at HE. A number are cognisant of theconsequences of their ‘poor’ behaviour and lack of motivation and interest while at school and actually reflect onthat with regret. However, the key issue of engagement in education is central and a number of these young peoplehave succeeded in re-engaging in education. As Declan put it, ‘it is no bother to study every hour of the day’ (in hisIoT component of his apprenticeship programme), as he is interested and engaged in what he is doing now.
8.4 SummaryThis chapter focuses on young people who made the transition from second-level education into the labourmarket, without any experience of HE. In line with the previous chapters in this report, this chapter has used thequantitative data to consider the labour market situation of school leavers, paying particular attention to the twoNon-Manual groups. Specifically the labour market outcomes considered have been labour market participation,labour market situation (occupation and industry) and unemployment. The qualitative data is then used to identifythe factors underlying their decision not to pursue HE or other education and training options (immediatelyafter leaving school). Among the issues considered are the family background of these young people, their earlyexpectations and labour market goals, the factors influencing their post-school choices, their experiences sinceleaving school and their reflections on their lives so far.
Overall labour market participation rates among school leavers who completed second-level fell from 47 per
cent in 1997/98 to 42 per cent in 2002/04, with a slight upturn to 43 per cent in 2006/07. While in previous yearsmales have had higher levels of entry into the labour market than females, given the rates of progression toapprenticeships among males, there is now little difference in entry into the labour market upon leaving schoolbetween males and females (Byrne et al ., 2009). Clear socio-economic disparities are evident in labour marketentry rates as school leavers from other Non-Manual, manual and unemployed backgrounds are more likely toenter the labour market. Young people from intermediate Non-Manual backgrounds show relatively low levels ofentry into the labour market at this stage, reflecting their relatively high rates of entry into post-school educationand training opportunities.
Among school leavers in the labour market, those from other Non-Manual and intermediate Non-Manualbackgrounds differ in the types of occupations entered into. While other Non-Manual youth are more likely

8/4/2019 BKMNEXT146
http://slidepdf.com/reader/full/bkmnext146 173/227
159
CHAPTER 8: LABOUR MARKET EXPERIENCES BY SOCIO-ECONOMIC BACKGROUND
to enter manual employment, those from intermediate Non-Manual backgrounds enter service sector jobs ingreater numbers. In terms of industrial sector the intermediate Non-Manual group are slightly more likely toenter professional services jobs, while the other Non-Manual group enter personal services jobs in greater
numbers. However, the main point of distinction between these two groups relates to employment in Industryand Distribution – a larger share of the intermediate Non-Manual group take up jobs in the latter industrial sector,while greater numbers of other Non-Manual leavers enter jobs in Industry (with the exception of the most recentcohort).In line with overall economic trends, unemployment rates fell over the ten year period (11 per cent of 1997/98school leavers were in the labour market unemployed one year after leaving school to 9 per cent in 2006/07).Over this time, the gender gap in unemployment rates has disappeared. Unemployment rates do not varysignificantly across socio-economic groups, however, those from unemployed backgrounds experience particulardifficulty in accessing employment. Furthermore, school leavers from other Non-Manual backgrounds haveunemployment rates largely in line with the manual group (11 per cent and 12 per cent respective), while theintermediate Non-Manual group fares slightly better (8 per cent).
The qualitative data then sought to identify the factors underlying their decision not to pursue HE or othereducation and training options for these Non-Manual groups. It was clear that this group did not have the sameencouragement to progress to HE either at home or in school. However, some of the respondents did express aninterest in pursuing HE while at second-level and had filled in their CAO forms but were unsuccessful in gainingthe points for the courses they selected. Many of the young people we spoke to had almost eliminated themselvesout of the HE route because of their own academic self-image or unhappy experiences at school. Others felt thatthey had not received sufficient career guidance needed to pursue to HE. However, some of this group were morecomfortable with the idea of accessing alternative education or training opportunities, such as PLC courses orapprenticeships, rather than HE.
Among the other Non-Manual members of the LM group it is clear that school experience and advice did not
leave them either well directed or clear in their post-school plans. While one respondent ‘just wanted to get outof school’, others left school with no focus or direction. There was a short-term orientation among the group (totake advantage of the booming construction sector or secure a straightforward office job, for example), and thereseemed to be little consideration of the longer-term picture. Finally, for one respondent, who had intentions ofgoing to HE, failing honours Irish had serious implications for her chances of realising these ambitions.

8/4/2019 BKMNEXT146
http://slidepdf.com/reader/full/bkmnext146 174/227
160
CHAPTER 8: LABOUR MARKET EXPERIENCES BY SOCIO-ECONOMIC BACKGROUND

8/4/2019 BKMNEXT146
http://slidepdf.com/reader/full/bkmnext146 175/227
CHAPTER 3: EXPENDITURE PATTERN OF STUDENTS
161
Main Findings and Discussion
CHAPTER 9
8/4/2019 BKMNEXT146
http://slidepdf.com/reader/full/bkmnext146 176/227
162
9.1 IntroductionExamination of class inequality in educational participation and attainment is particularly warranted in the Irish
context. Numerous studies have demonstrated that rapidly rising participation and retention in education hasbeen accompanied by remarkable stability in class inequalities in educational attainment (Smyth, 1999; Whelan andHannan, 1999). These findings are in line with many other European countries (Shavit and Müller, 1998). In addition,however, some commentators maintain that the costs of educational failure are particularly high in Ireland, makingthe Irish case particularly worthy of study. As Clancy notes (in Clancy et al., 1995)
‘comparative data from twenty OECD countries reveal that education is a more crucial determinantof employability in Ireland than in other countries … unemployment in Ireland is disproportionatelyconcentrated among those with the lowest levels of educational attainment’.
The fact that certain groups of young people fare relatively poorly in their levels of participation in (higher)
education, has crucial implications for the life chances of these young people and for society more generally – interms of increased welfare costs, poorer health and higher crime levels (Smyth and McCoy, 2009).Within this context, this study has set out to examine the experiences of young people from non-manualbackgrounds given that established research has identified this group as having low levels of participation in HErelative to young people from other socio-economic groups, and are in fact the only group to see a decline in therates of participation over time. In particular, the study objectively set out to examine the potential barriers to HEfor those from non-manual backgrounds and the processes impacting on their (post-) school choices. The researchhas highlighted the fact that the non-manual group is not homogenous but must instead be viewed as being madeup of two distinct groups – those from an intermediate non-manual background and those from other non-manualbackgrounds. It is clear from analysis presented in Chapter 3 that across a range of educational and economiccharacteristics, occupants of the other non-manual group share many similarities with lower manual groups, whilethe intermediate non-manual group shares few of the characteristics of these groups.
The following presents a discussion of the overall results and identification of the processes underlying lowlevels of entry to HE among young people from such non-manual socio-economic backgrounds. The main policyimplications of the research are discussed in Section 9.3.
9.2 Discussion
9.2.1 Introduction
This report is based on the findings of a large scale mixed-method study examining the processes underlyingrelatively low levels of entry into HE among young people from non-manual socio-economic backgrounds.The methodological framework overcomes many of the criticisms levelled at transitions and access researchin the Irish context and internationally. In taking a mixed method approach, what is now regarded as the goldstandard in educational research, the research overcomes the traditional sole reliance on quantitative methodsin this field. In addition, giving consideration to those who succeed in gaining entry against the odds (rather than just focusing on the barriers to entry) the research unpacks the processes underlying success as well as failure.Finally, the research assesses the validity of traditional social class and socio-economic approaches to examiningHE entry, in particular, considering the extent of within class variation in HE access and the extent to which theseclassifications can be considered to be hierarchically structured.The HEA has explicitly stated its aims of increasing participation in HE overall and particularly to widen access to
CHAPTER 9: MAIN FINDINGS AND DISCUSSION

8/4/2019 BKMNEXT146
http://slidepdf.com/reader/full/bkmnext146 177/227
163
HE for young people from ‘non-traditional’ backgrounds. This under-represented group has been typically definedas young people from working-class and non-employed backgrounds. This study has fundamentally questionedthis traditional definition of under-represented groups in HE. It has found young people from lower white collar
backgrounds (the bulk of whom work in lower service sector positions - drivers of buses, waiters/waitresses,hairdressers/barbers, chefs) to have low levels of participation and retention in HE; levels which are certainlyno higher than those from lower-blue collar backgrounds. This finding represents an important development ineducational research in the Irish context and identifies crucial processes underlying the relatively low levels ofeducational attainment of a significant sub-section of the population.
Furthermore, the findings throw doubt on the extent to which constructs of socio-economic and social class canbe considered strictly hierarchical. This issue has been raised elsewhere. Research in the UK context (Reay 2001)examines the experiences of non-traditional students, which she does not confine to the lower blue collar group,but also to those who have parents employed in the service sector:
‘they [service sector], rather than the outmoded traditional image of the male industrial labourer, representthe contemporary working classes – lone mothers, benefit recipients and low paid, casualised serviceworkers’ (Reid, 1998, quoted in Reay, 2001).
Not only does this research highlight important new findings on the structure and nature of inequality ineducational outcomes in the Irish context, it also highlights the limitations of a categorical approach to lookingat educational outcomes such as HE entry. As also highlighted by Bernard (2006), HE access policy has beentraditionally based on categorical measures of social class/socio-economic group. However, the qualitativeinterviews with twenty-nine young people from one socio-economic group (‘non-manual’), illustrates wide diversitywithin this group. It is clear that research can no longer continue to focus solely on categorical measures ofbackground, but take account also of variations within as well as across the populations; as Archer et al. comment(2003, quoted in Bernard, 2006)
‘an approach is required which enables researchers to grapple with the grey borders of modern classidentities and inequalities, while not losing sight of the broad patterns of class disadvantage in relation to HEparticipation’.
9.2.2 Value of Higher Education
The results point to the crucial importance of the value placed on HE for different social groups. It is clear acrosssocial groups and even between intermediate and other non-manual groups that families have differential accessto various forms of cultural, social and economic capital and resources, which differentially frames the educationalchoices that different families can or will make. As Archer (2003) writes, middle class parents can pass on cultural
and material advantages that privilege or enable their children to succeed within the education system. Workingclass families experience more economic and physical constraints and lack the same knowledge of the system andsocial networks that encourage the reproduction of privilege (Archer, 2003; Reay, 2001).
As a result different groups place different ‘value’ on HE – whether it is ‘worth it’. They make such assessmentsweighing up the potential benefits of HE study, as compared to the increased risks and costs of participation forlower income groups, such as those from other non-manual backgrounds. Financial issues and the pull of readyemployment (at that time) played a central role for many of these young people – an issue we return to later.
What clearly emerges is the power of educational beliefs and views to impact on the motivations of potentialapplicants to HE. Many of those who enter HE report positive orientations towards, and experiences of, education
CHAPTER 9: MAIN FINDINGS AND DISCUSSION

8/4/2019 BKMNEXT146
http://slidepdf.com/reader/full/bkmnext146 178/227
164
CHAPTER 9: MAIN FINDINGS AND DISCUSSION
and learning. They place a value on pursuing further education over earning money and view HE as an opportunityfor personal fulfillment and betterment. Among those who don’t take the HE path, issues around self-belief andaspirations are clearly apparent, suggesting the potential role of early encouragement about and exposure to the
HE process for these young people. Views like HE ‘is not for me’ or ‘I place very little value in it [HE] in itself’ wereprominent. However, it is vital that these values are not taken as a deficit in aspiration among certain individualsand their families, but rather as reflecting broader processes of societal inequality. As Leathwood and O’Connell(2003) argue, there is a danger in locating lack of aspiration and self-esteem as individual problems or personalitydeficits, rather than as constructed through poverty, social inequalities and discrimination and the culture andpractices of schools and universities themselves.
Indeed, beyond the individual level, the institutional context also plays a role. Young people from lower serviceand lower manual backgrounds displayed lower levels of retention in HE, suggesting that these groups face greaterbarriers in terms of integrating into HE. As Reay (2001) has argued, non-traditional students may be disadvantagedby institutional cultures that position them as ‘others’ in contrast to dominant assumption of student learners as
young and middle class.
Finally, there was evidence that these young people felt their parents supported them in whatever they wanted todo and did not push them in a particular direction. This has been referred to as a working class discourse of ‘childas expert’ in the UK context (Reay and Ball, 1998). As these young people observed in relation to their parents:‘they never put pressure on me’, ‘once I’m happy like, they are’. These factors operated alongside early educationalexperiences to leave the lower non-manual group poorly placed in terms of gaining access to HE.
9.2.3 Early Educational Experiences
The discussion must be set in the context of young people’s experiences within the educational system froma relatively early age. Analysis presented in this report shows fundamental differences in the second-level
experiences of young people from different socio-economic groups, leading to large variations in the proportionsreaching eligibility for entry into HE. There was clear evidence that a number of the non-participants in HE fromthe other non-manual group were alienated and disaffected from school at an early age. Skipping school, poorbehaviour and a lack of motivation fed into a negative cycle of interaction with teachers and school. They feltteachers held low expectations for them (being told ‘I’d amount to nothing’) and were seen as unfair. It shouldalso be highlighted that attending a school with a concentration of disadvantage (DEIS school) was found to havea multiplier effect – with such school leavers doubly impacted in terms of their second-level attainments andprogression to HE.
These young people from lower non-manual backgrounds saw HE as an extension of school, and for this reasonit was viewed as something to be avoided: ‘I’d had enough in school’. Further, they viewed post-school decision-
making as an opportunity to take a stand, make a statement, assert the primacy of their own role in deciding ontheir lives: ‘you really don’t have a choice going to school but college was your kind of choice’.
However, it would be misleading to argue that difficulties with school emerge at second-level. Research also clearlydemonstrates that social differentiation in educational outcomes is evident at a much earlier stage – early inprimary level education for example (see Smyth and McCoy, 2009).
As a consequence, many of these young people with negative school experiences now reflect with some regret, fornot taking school seriously. They feel they have missed out on opportunities:
‘if I had just not messed and not done all the stupid things … so pointless … it can leave you with big regretsthat you’ll never get rid of’.

8/4/2019 BKMNEXT146
http://slidepdf.com/reader/full/bkmnext146 179/227
165
CHAPTER 9: MAIN FINDINGS AND DISCUSSION
9.2.4 Information, Awareness and Support
Information was also key, with entrants to HE (from the intermediate non-manual group) much more positive aboutthe early information, and support, they received from school personnel, particularly the guidance counsellor.
This is also a prominent issue in the international literature:
‘certain groups in society lack information about the opportunities that are available’ (Thomas, 2001, p.135).
While for many of those who successfully progressed to HE (mostly from intermediate non-manual backgrounds)there was no ‘moment of decision’ at which point they made that choice. Rather it was ‘always there’, taken forgranted, assumed. The crucial question was where they would go and what they would study. Information wasnot a crucial factor to that process; indeed for many of these young people parents, siblings, peers and othersin their community provided the necessary information and guidance, alongside school supports. That said, allwere positive about the guidance they received. However, this was not the case for those from other non-manualbackgrounds who did not progress to HE – many of whom had negative constructions of the advice received.
Guidance was variously absent, only focused on certain groups of students (such as the ‘honours’ class), narrowlyfocused, or directive away from HE. Some felt they would have liked more help in actually evaluating the rangeof post-school options, rather than just supplying information. There was also evidence that our respondents fromthe lower service class were much more reliant on what has been termed ‘hot’ knowledge, accessed throughthe grapevine, while their more advantaged counterparts relied upon ‘cold’ knowledge from official sources(Hutchings, 2003).
However, for those from lower non-manual backgrounds, parental experience of HE was not there, while siblingsand peers were also not necessarily familiar with the HE process and choices therein. Despite displaying aparental value for education, one could argue that these groups are in need of more information and advice fromschool personnel to promote entry into HE. Indeed, MacAllum et al. (2007) have argued that while much of theinformation students seek is readily available via the Internet and other published sources, the research suggests
it is less accessible and less comprehensible for ‘underserved’ than for middle income students. They concludethat students and their families would benefit from additional information and resources and from assistance ininterpreting and using information.
The other non-manual group, in particular, were far more reliant on the supports and encouragement availablefrom their school and these supports played a much more significant role in the choices made by these youngpeople. Indeed it is argued elsewhere that the information that is needed by lower social classes is in itself morecomplex than that needed by their middle class counterparts (Hutchings, 2003). This relates to the greaterdiversity of pathways into HE for young people from under-represented groups – making the system more complexfor those faced with a greater range of choices and possibilities than for their middle class counterparts enteringHE through more traditional, well-established and direct entry routes. However, there was clear evidence that
young people, particularly those from the lower non-manual backgrounds, felt they had insufficient informationabout HE. This may seem surprising in a context where the majority of young people progress to HE. Indeed, someindicated that there had been no mention of ‘college’ or ‘third-level’ while they were at school, which suggests thatthis option is not seen as relevant to young people in some school contexts and guidance supports in such schoolsare focused on areas other than HE. Further, there was clearly confusion over terminology with some youngpeople from the lower service group seeing any form of post-school education as going to ‘college’.The issue of the extent to which students in certain schools are well-informed about HE is an important one andraises questions over the adequacy and comprehensiveness of HEA initiatives targeting DEIS schools – since manyof the young people with limited knowledge of HE had attended a DEIS school. But perhaps more importantly,the lack of information on and attention given to HE in these schools raises issues over the expectations that staffhave of these pupils.
8/4/2019 BKMNEXT146
http://slidepdf.com/reader/full/bkmnext146 180/227
166
CHAPTER 9: MAIN FINDINGS AND DISCUSSION
Where teachers were perceived to be dismissive and non-supportive, these young people in some cases adoptedthese perspectives, a self-fulfilling prophecy of sorts. These young people also spoke of teachers not identifying
them as the group likely to progress to further study and hence excluded them from information sessions.They also spoke of mis-information and misdirection, which for some removed their chances of directlyprogressing to HE.
9.2.5 Financial Issues
Financial issues emerge in various forms impacting on the decisions of young people from the other non-manualgroup to pursue HE. For some, the financial commitment to study was seen as too great or would entail too muchhardship. Many felt that they would not be eligible for financial support (which is supported by grant receipt levelsin the School Leavers’ Survey analysis), or even where they were eligible they felt it would not have been sufficient.In fact, some were waiting to attend HE as a mature student, when they would become eligible for such support.
It is also clear that financial supports and the cost of HE were insufficiently understood among some of theseyoung people. It is interesting to note that research in the UK context has also shown that financial concerns playa major role in the decision-making process of whether or not to enter HE and the ‘over-riding negative perceptionof going to university, for potential entrants, was its cost’ (Connor et al., 2001). Further, money matters have beenfound to variously affect access, participation, persistence and attainment (Callender and Jackson 2005).
In Chapter 6 we note that perceived financial barriers have implications for young people’s aspirations.The complexity behind the decision making process warrants more attention, given that the other non-manualgroup were somewhat more likely to indicate that they were not interested in going to HE or that they wouldn’tget the grades necessary for HE than the intermediate non-manual group. The adjustment of behaviour basedon financial position is likely to have an influence on how young people view their decision-making process andultimately on their participation rates at HE. Financial barriers also impact on the transition process. Even among
young people achieving eligibility for HE notable differences emerge across groups in their patterns of post-schoolchoices and progression to HE. At this point, in particular, we see a significant fall-off in the pursuit of HE amongyoung people from lower service backgrounds. It appears financial factors play an important role, alongside thoserelating to interest, with young people seriously considering HE but falling at the final hurdle perhaps due toineligibility for a grant.
It was also clear, particularly for males from lower non-manual backgrounds, that the pull of the labour marketwas an important process underlying their non-participation in HE. Across both the quantitative and qualitativeanalyses, the labour market and apprenticeship route emerged as strong attractions for these young people.While some continued in part-time jobs they had secured while in school, others spoke of the boomingconstruction sector: ‘there was a big boom and everybody was talking about trades’. In any case, many
became used to earning, having money in their pocket and the sense of independence that accompanied it.This represented an especially powerful incentive to forego college for some.
Research in the international context further highlights the potential role of the labour market as a barrier towidening participation in HE. Adnett and Slack (2007) progress the issue to explore whether the labour marketfails to provide sufficient incentives for potential entrants from less advantaged backgrounds to enter HE. Theyfind evidence that some marginal entrants to HE may face rates of return insufficient to provide financial incentivesfor HE participation. Lower rates of return may be due to higher rates of withdrawal, lower degree classifications,greater likelihood of being overqualified and lower earnings. In relation to the latter, they found that for men thereturns to HE are substantially higher for the disadvantaged groups than for advantaged groups. In contrast tomen, women were found to have very similar returns to HE across ability, income and social class groups.

8/4/2019 BKMNEXT146
http://slidepdf.com/reader/full/bkmnext146 181/227
167
CHAPTER 9: MAIN FINDINGS AND DISCUSSION
9.2.6 Beyond Access
The research has also shown that access is only part of the story – the issue of retention is now widely recognisedas a central component within the widening participation agenda. Non-traditional students and those from
traditionally under-represented groups (including the other non-manual group), must receive adequate supportsthroughout HE, rather than simply at the point of entry. There needs to be consistent and thorough data onretention levels, across all institutes of HE, based on clear definitions of retention and a range of outcomes suchas examination performance. Thomas (2002) argues that the institutional habitus of a university is key to theretention and success of non-traditional students, as is the importance of universities valuing diversity.
Further the research highlights important inequalities in the nature of access and in the levels of entry to universityand honours degree level courses. Lucas (2001) coined the term ‘effectively maintained inequality’ to describethe qualitative distinctions (course level, sector and field of study) preserving inequalities even as quantitativedifferences fade. He argues:
‘as long as a particular level of schooling is not universal, the socio-economically advantaged use theiradvantages to secure that level of schooling. Once that level of schooling becomes nearly universal,however, the socio-economically advantaged seek out whatever qualitative differences there are at that leveland use their advantages to secure quantitatively similar but qualitatively better education’ (p.1652).
This also relates to the development of curricular alternatives within second-level education and, in particular, theLCA option (for research on LCA see Banks et al., forthcoming). This research has shown young people from othernon-manual and manual backgrounds to have relatively high levels of participation in the LCA programme. Thishas important implications for the proportions eligible for HE entry, given that LCA completers are not eligiblefor direct entry. While the LCA programme has to be assessed in terms of the positive role it is seen to play inpromoting retention for certain groups, this must be counterbalanced against the diversionary role it may also beplaying among groups with traditionally low levels of entry into HE. As Lucas (2001) argues:
‘students’ location in the stratified curriculum has implications for their likelihood of making additionaltransition, and thus their location in the stratified curriculum is an integral part of the process of educationalattainment’ (p.1678).
Ultimately, through these processes of ‘effectively maintained inequality’, ‘social background advantages seem towork to effectively and continuously secure for the children of advantage advantaged locations of their own’.
9.2.7 Concluding Remarks: Processes Underlying Their (Non-) Participation in HE
It is clear that the intermediate and other non-manual groups occupy distinct positions, and in some
respects polar opposite positions, in terms of educational attainment and access to HE. What has emergedis a previously unknown sub-group, representing nearly 10 per cent of the population, for whom a complexinterplay of social, cultural and economic processes have led to low levels of participation in HE. The picture isclearly one of hidden disadvantage, as the merging of intermediate and other non-manual groups in most previousempirical work has concealed a dramatic picture of educational disadvantage among young people from othernon-manual backgrounds.
The report commenced with a discussion of two main theoretical perspectives which might allow us to understandand explain processes of educational inequality and disadvantage among non-manual groups. First, culturalapproaches emphasise mechanisms related to cultural causation: such as norms, beliefs and sub-cultural values,as they shape preferences, expectations and choices. The findings of this study, in drawing on both quantitative

8/4/2019 BKMNEXT146
http://slidepdf.com/reader/full/bkmnext146 182/227
168
CHAPTER 9: MAIN FINDINGS AND DISCUSSION
and qualitative methodologies, clearly point to the enormous value of such ‘cultural’ explanations in understandingprocesses of educational disadvantage among the other non-manual group. For many of these young people,negative school experiences and disengagement from the dominant class school culture, interlinked with lower
aspirations, led to second-level pathways and transition decisions which were uncertain and constrained.Many failed to achieve eligibility for HE and among those who were eligible the discourse of HE was, for some,alien and foreign and one which had not necessarily been promoted at school. Where they did succeed inprogressing to HE, aspirations were lower and higher status courses and colleges were not seen as a realisticoption for them.
The second theoretical approach, the rational action perspective, places greater emphasis on the resourcesand constraints faced by occupants of different social class positions. Distance from social origin and the desireto avoid social demotion mean that patterns of educational attainment across different social groups could becomparable given their differing positions of origin. Again the results of the study lend support to this perspective:young people from other non-manual backgrounds typically come from non-HE origins and the social distance of
going to HE (and particularly to a university) is considerably greater than for a young person from a professionalbackground (and also an intermediate non-manual background). For many of these young people, the pull of thebooming labour market offered an acceptable post-school pathway. The pressure to pursue HE as a means ofavoiding social demotion was less than for other social groups and they also framed the costs and benefits ofeducation differently. Finally, in line with greater distance from social origin and the lower likelihood of success(evident in higher dropout rates for example), this group could be seen as acting rationally in not pursuing theHE option.
Both cultural and rational action perspectives offer valuable insights into the processes explaining both socio-economic patterns in educational attainment and within-class differences. The complex interplay of economicconstraints, cultural context and knowledge of the system and early educational experiences, clearly differentiallyframes the educational choices that different families can and will make. The challenge for policy is to effectively
address the diverse and inter-related factors impinging on the educational attainments of this group, which isdiscussed in the next section.
9.3 Implications for policyThe research highlights important issues for the educational attainment of the non-manual group, representing20 per cent of the population, and for their access to different forms of HE and their retention and achievementtherein. The HE Authority (2008) has set a target of at least 54 per cent entry into HE for all groups by 2020, aconsiderable jump from the 27 per cent entry rate for the non-manual group in 2004. The research has shown
important differences between the intermediate and other non-manual groups, differences which make the othernon-manual group in need of considerably greater policy attention than heretofore.
The research points to a number of main areas for policy focus:
1. Measurement and identification of groups with low participation
It is clear that the traditional focus on HE access among traditionally disadvantaged groups such as semi- andunskilled manual and non-employed groups has failed to take account of important differences across the socialspectrum and within groups. As Gayle, et al. (2002) note;

8/4/2019 BKMNEXT146
http://slidepdf.com/reader/full/bkmnext146 183/227
169
CHAPTER 9: MAIN FINDINGS AND DISCUSSION
‘policy initiatives aimed at combating the differential levels of entry into HE will have to embrace a morecomprehensive conception of differences than is afforded by more restrictive occupational social classanalysis’ (p.16).
More complex interpretations of class and, importantly, within class, patterns of HE participation are required inboth policy fora and future research. The classification used by the Census aims to bring together persons withsimilar social and economic statuses in terms of their level of skill or educational attainment. However, we haveidentified that this is blurring important distinction within groups, i.e., by aggregating the whole non-manual group.
2. Data Collection
To guide future data collection exercises and research in this area, a Working Group should be established toexplore the measurement of socio-economic position/social background, with a view to identifying a consistentmeasure across studies. It would be important that this work would also assess the comparability of measures
in an international context as with the use of ESeC but without losing direct comparability with Irish measuresthat are currently being used. The revised system of classification of occupations from Census 1996 onwards isbased on the UK Standard Occupational Classification and is meant to adhere to the international occupationalclassification ISCO Com (88). However, this means that information is lost on variation within socio-economicgroups, i.e. the non-manual group.
This research would not have been possible without the invaluable contribution of School Leavers’ Survey dataover the last decade. The research has illustrated the value of this SLS method in assessing HE access within andacross different groups, primarily because second-level school experiences and attainments can be consideredalongside transition choices and post-school pathways. The research points to the importance of the continuationof this survey and the need to develop greater linkage between the Irish survey and comparable surveys which arenow being undertaken in a large number of European countries.
3. Early Education Experiences and Early Broadening of Horizons
Policy efforts to address the under-representation of young people from lower white collar backgrounds mustbegin within compulsory education and early in the second-level process, if not before – where young people fromlower white collar backgrounds have already fallen behind. Recent research (Smyth and McCoy, 2009) shows widesocial differentiation in reading scores among first and fifth class students in primary schools. While this researchdid not specifically address the relative position of the other non-manual group, it does highlight the importanceof early childhood education and primary education in addressing the under-performance of certain groups insociety. Previous research has indicated the significant impact of school organisation and process on retentionand performance within the second-level system (see Smyth, 1999; Smyth et al., 2006). Thus, schools should be
encouraged to use mixed ability grouping, to facilitate access to higher level subjects, and to provide engagingapproaches to teaching and learning in the classroom. Furthermore, a positive school climate, with good relationsbetween teachers and students, is key to facilitating young people in reaching their potential.Funding for programmes targeted at those most at risk at both pre-school and school level must be prioritised.However, it is clear that a majority of young people from other non-manual backgrounds (and even non-employedhouseholds) attend schools outside the DEIS programme, raising crucial issues over the extent to which thecurrent second-level and HE policy focus on DEIS schools is adequate to address the under-representationof this group in HE. These issues are particularly important in the current climate which is likely to impactdisproportionately on the other non-manual group who are positioned within particularly vulnerable sectorsof the economy.
8/4/2019 BKMNEXT146
http://slidepdf.com/reader/full/bkmnext146 184/227
170
CHAPTER 9: MAIN FINDINGS AND DISCUSSION
4. Discontinuity between second-level and HE policy
It is clear that policy efforts to raise the achievement of under-performing groups require a coherent andco-ordinated approach at primary, second-level and HE. Furthermore, there is a need for more joined-up provision
between education, health and welfare services and other relevant agencies, to ensure a holistic provision andsupport for young people, particularly from lower white collar backgrounds, at risk of under-achievement.
5. Importance of Information and Awareness early in second-level
There is clearly a need for better information to guide young people in their decisions, clearer route maps andbetter signposting. These young people also need better information and advice about graduate employment andthe kinds of financial returns that can be expected from different education and career routes (Connor, 2001); aswell as targeted information to inform the decisions of particular groups of students. This has to take place earlyin junior cycle – as the DES Guidance Review (2009) and McCoy et al., (2006) note – there is need for increasedprovision for junior cycle students; to encourage students’ earlier consideration of possible career options, it is
recommended that some inputs on career topics be provided for second-year and third-year classes.
6. HE selection procedures and Access Programmes
Students and their families within the lower non-manual category would benefit from additional information,assistance with interpreting this information and other supports in negotiating the HE transition process.While alternative pathways (through Access programmes) are welcome, it is important that these routes areknown, understood and easily negotiated by the target groups. Personnel working in Access Programmes, inparticular, need to ensure that information reaches and is understood by these groups well in advance of thepoint of decision-making about HE.
The research has also identified significant issues around entry routes into HE and, in particular, the extent
to which PLC participants can realistically expect to progress to HE. Given high levels of participation in PLCprogrammes among young people from other non-manual backgrounds, it is important that PLC providers andthe VECs be targeted directly by HE institutions in promoting their participation and that the interface betweenFurther Education and HE should be highlighted and developed.
7. Financial Supports
Other research has identified changes over time in the relative value of grant support, the proportions eligibleand the relative living standards of young people reliant on state grants (McCoy et al., forthcoming). These andother financial issues are of particular importance for many young people from non-manual backgrounds, who donot come from high income families and who are particularly vulnerable to the pull of labour market opportunities
(although perhaps not in the current climate). Further, any current policy changes regarding the re-introduction offees or other charges, need to take account of any possible disincentives to participation in HE this is likely to havefor young people from lower service backgrounds. Careful monitoring of the impact of any changes in this regardwill be important; particularly any impact on the participation rates for the lower non-manual group.
8. Integration into college life
Central to the success of young people from under-represented groups in HE is their integration into collegelife – policy at both national and institutional level should ensure this issue receives particular focus. Policy effortsneed to focus not just on the point of access into HE, but also on integration into college life and ongoing support.Access Officers within HE institutions need to pay particular attention to ensure such full participation among
8/4/2019 BKMNEXT146
http://slidepdf.com/reader/full/bkmnext146 185/227
171
CHAPTER 9: MAIN FINDINGS AND DISCUSSION
lower non-manual groups. There is also a need for further research on young people’s experiences of HE, theirprogression within HE and attainment, with particular focus on non-traditional groups. Data on progression fromsecond-level to HE is essential (along the lines of the School Leavers’ Survey) in order to monitor change over time
in the position of lower non-manual and other groups, particularly in the current downturn.
9. Broader Societal Inequality
Education does not operate in a vacuum since the costs and benefits attached to attending HE are shaped bythe overall social and economic structure. Any interventions within the educational system should therefore beunderpinned by tax and social welfare measures designed to bring about greater equity in life-chances.
‘The solution to class inequalities does not lie in making the working class more middle class, but in workingat dismantling and sharing out the economic, social and cultural capital which goes with middle-class status’(Reay, 1997, p.23).

8/4/2019 BKMNEXT146
http://slidepdf.com/reader/full/bkmnext146 186/227
172
CHAPTER 9: MAIN FINDINGS AND DISCUSSION

8/4/2019 BKMNEXT146
http://slidepdf.com/reader/full/bkmnext146 187/227
CHAPTER 3: EXPENDITURE PATTERN OF STUDENTS
173
References
8/4/2019 BKMNEXT146
http://slidepdf.com/reader/full/bkmnext146 188/227
174
REFERENCES
Adnett, N., 2006. ‘Student Finance and Widening Participation in the British Isles: Common Problems, DifferentSolutions’, Higher Education Quarterly, 60, 4: 296-311.
Adnett, N. and K. Slack, 2007. ‘Are There Economic Incentives for Non-Traditional Students to Enter HE? TheLabour Market as a Barrier to Widening Participation’, Higher Educational Quarterly, 61, 1: 23-36.
Andrews, L., 1999. ‘Does HECS Deter? Factors affecting university participation by low SES groups’, OccasionalPaper Series, Department of Education, Training and Youth Affairs, Australia.
Archer, L., 2003. ‘Social class and higher education’ in Archer, L., M. Hutchings and A. Ross, Higher Education and
Social Class: Issues of exclusion and inclusion, London: Routledge Falmer.
Archer, L., M. Hutchings and A. Ross, 2003. Higher Education and Social Class: Issues of exclusion and inclusion,London: Routledge Falmer.
Banks, J., D. Byrne, S. McCoy and E. Smyth, forthcoming. The Leaving Cert Applied Programme: An Evaluation.Dublin: ESRI.
Becker, R., 2003. ‘Educational Expansion and Persistent Inequalities of Education in Germany’, EuropeanSociological Review 19, 1:1–24.
Becker, R. and A.E. Hecken, 2008. ‘Why are Working-class Children Diverted from Universities? An EmpiricalAssessment of the Diversion Thesis’, European Sociological Review , 25, 2: 233-250, Advance Access July 2008.
Bernard, J., 2006. ‘Promoting access to higher education and identifying access students: how useful is researchon participation by socio-economic group?’, International Studies in Sociology of Education, 16, 1: 19-35.
Bernstein, B., 1961. ‘Social Class and Linguistic Development’ in A.H. Halsey, J. Floud and C. Arnold Anderson (eds),Education, Economy and Society. New York: Free Press.
Bloom, J., 2007. ‘(Mis)reading Social Class in the Journey Towards College’, Teachers College Record , 109, 2: 343-368.
Boudon, R., 1974. Education, Opportunity and Social Inequality, New York: Wiley.
Bourdieu, P., 1973. ‘Cultural Reproduction and Social Reproduction’ in R.K. Brown (ed.), Knowledge, Education andCultural Change. London: Tavistock.
Bourdieu, P. and J. Passeron, 1977. Reproduction in Education, Society and Culture, London: Sage Publications.
Breen, R. and J.H. Goldthorpe, 1996. ‘Class (and Gender) Differentials in Educational Attainment: Towards a FormalTheory’, Unpublished Research Paper.
Breen, R. and J.H. Goldthorpe, 1997. ‘Explaining Educational Differentials: Towards a Formal Rational ActionTheory’, Rationality and Society, 9, 3: 275-305.

8/4/2019 BKMNEXT146
http://slidepdf.com/reader/full/bkmnext146 189/227
175
REFERENCES
Breen, R. and M. Yaish. 2006. ‘Testing the Breen-Goldthorpe Model of Educational Decision-Making’ in S. Morgan,D.B. Grusky, and G.S. Fields (eds) Mobility and Inequality: Frontiers of Research from Sociology and Economics,Stanford: Stanford University Press.
Bridget T.L., 2007. ‘The Contributions of Economics to the Study of College Access and Success’, Teachers College
Record , 109 (10): 2367-2443.
Byrne, D., 2009. ‘Inclusion or Diversion in Higher Education in the Republic of Ireland?’. Dublin ESRI WorkingPaper No. 304.
Byrne, D. and E. Smyth, forthcoming. Parental Involvement in Second-Level Education. Dublin: ESRI/Liffey Press
Byrne, D., S. McCoy, D. Watson, 2009. School Leavers’ Survey Report 2007 , Dublin: ESRI.
Byrne, D., and S. McCoy. 2009. School Leavers: How Are They Faring? ESRI Research Bulletin 2009/1/2.
Callender, C. and J. Jackson, 2005. ‘Does the Fear of Debt Deter Students from Higher Education?’. Journal ofSocial Policy, 34, 4: 509–540.
Chapman, D.W., 1981. ‘A Model of Student College Choice’, The Journal of Higher Education, 52, 5: 490-505.
Clancy, P. and G. Goastellc, 2007. ‘Exploring Access and Equity in Higher Education: Policy and Performance in aComparative Perspective’, Higher Education Quarterly, 61, 2: 136-154.
Clancy, P., 1996. ‘Pathways to Mass Higher Education in the Republic of Ireland’, European Journal of Education,Vol. 31, No. 3, pp.355-371.
Clancy, P., 2007. ‘Exploring Access and Equity in Higher Education: Policy and Performance in a ComparativePerspective’, Higher Education Quarterly, 61, 2: 136-154.
Clancy, P., S. Drudy, K. Lynch and L. O’Dowd (eds), 1995. Irish Society: Sociological Perspectives, Dublin: Institute ofPublic Administration.
Clancy, R., 2001. College Entry in Focus: A Fourth National Survey of Access to Higher Education, Dublin: HEA.
Collier, T., R. Gilchrist, D. Philip, 2003. ‘Who plans to Go to University? Statistical Modelling of Potential Working-Class Participants’, Educational Research and Evaluation, 9, 3: 239-263.
Connell, R.W., D.J. Ashenden, S. Kessler and G.W. Dowsett, 1982. ‘Making the Difference: Schools, Families andSocial Division’, Australian Journal of Education, 26, 3: 330-332.
Connor, H., S. Dawson, C. Tyers, J. Eccles, J. Regan, J. Aston, 2001. Social class and higher education: issues
affecting decisions on participation by lower social class groups, Research Report RR 267, Department forEducation and Employment, London.
Connor, H., 2001. ‘Deciding For or Against Participation in Higher Education: the Views of Young People fromLower Social Class Backgrounds’. Higher Education Quarterly, 55, 2: 204–224.
8/4/2019 BKMNEXT146
http://slidepdf.com/reader/full/bkmnext146 190/227
176
REFERENCES
Creswell, J., 1994. Research Design: Qualitative and Quantitative Approaches, California: Sage.
Creswell, J., 1998. Qualitative Inquiry and Research Design: Choosing among five traditions, California: Sage.
Day, C., P. Sammons, Q. Gu, 2008. ‘Combining Qualitative and Quantitative Methodologies in Research onTeachers’ Lives, Work, and Effectiveness: From Integration to Synergy’. Educational Researcher , 37(6): 330-342.
Department of Education and Science, 2000. Learning for Life: White Paper on Adult Education, Dublin: TheStationery Office.
Department of Education and Science, 2001. National Evaluation of the Leaving Certificate Applied Programme.Dublin: Stationery Office
Department of Education and Science, 2005. DEIS: Delivering Equality of Opportunity in Schools: an Action Plan
for Educational Inclusion, Dublin: The Stationery Office.
Department of Education and Science, 2008. Retention rates of Pupils in Second Level Schools, Dublin: TheStationery Office.
Department of Education and Science, 2009. Review of Guidance, Dublin: The Stationery Office.
Department of Enterprise, Trade and Employment, 2002. Report of the Task Force on Lifelong Learning , Dublin:The Stationery Office.
Dewson, C.H., C. Tyers, J. Eccles, J. Regan and J. Aston, 2001. Social Class and Higher Education: issues affectingdecisions on participation by lower social class groups. Research Report RR267, London: Department for Education
and Employment.
Erikson, R., 1984. ‘Social Class of Men, Women and Families’, Sociology, 18, 4: 500-514.
Erikson, R., and J.O. Jonsson. (eds). 1996. Can Education be Equalised? The Swedish Case in Comparative
Perspective, Boulder: Westview.
Erikson, R., J.H. Goldthorpe, M. Jackson, M. Yaish and D.R. Cox, 2005. On class differentials in educationalattainment. Proceedings of the National Academy of Sciences of the United States of America, 102, 27.
Erikson, R. and J.O. Jonsson, 1996. Can Education Be Equalised? The Swedish Case in Comparative Perspective.
Westview Press.
Galindo-Rueda, F., O. Marcenaro-Gutierrez and A. Vignoles, 2004. The Widening Socio-economic Gap in UK
Higher Education, London: Centre for the Economics of Education, London School of Economics.
Gallacher, J., 2006. ‘Widening Access or Differentiation and Stratification in Higher Education in Scotland’, Higher
Education Quarterly, 60, 2: 349-369.
Gambetta, D., 1987. Were They Pushed or Did They Jump? , Cambridge: Cambridge University Press.

8/4/2019 BKMNEXT146
http://slidepdf.com/reader/full/bkmnext146 191/227
177
REFERENCES
Gamoran, A., 2007. ‘Persisting Social Class Inequality in U.S. Education’, in Weis, L. (Ed.) The Way Class Works:
Readings on School, Family and the Economy. New York: Routledge.
Gayle, V., D. Berridge and R. Davies, 2002. ‘Young People’s Entry into Higher Education: quantifying influentialfactors’, Oxford Review of Education, 28, 1: 5-16.
Giroux, H.A., 1982. ‘Ideology, Culture and the Process of Schooling’, Journal of Education, 164, 1: 109-113.
Goldthorpe, J.H., 1996(a). ‘Class Analysis and the Reorientation of Class Theory: The Case of PersistingDifferentials in Educational Attainment’, British Journal of Sociology, 47, 3: 481-505.
Goldthorpe, J.H., 1996(b). ‘Problems of “Meritocracy”’, in Erikson, R. and J.O. Jonsson (eds), Can Education Be
Equalized? The Swedish Case in Comparative Perspective, Oxford: Westview Press.
Goldthorpe, J.H., 1998. ‘Rational Action Theory for Sociology’, British Journal of Sociology, 49, 2: 167-192.
Gorby, S., S. McCoy and D. Watson, 2005. 2004 Annual School Leavers’ Survey of 2002/03 Leavers, Dublin: ESRIand Department of Education and Science.
Grodsky, E., 2007. ‘Sponsored mobility in higher education’, American Journal of Sociology, 112: 1662-1712.
Harker, R., 1990. ‘Bourdieu - Education and Reproduction’, in Harker, R., C. Mahar and C. Wilkes (eds),An Introduction to the Work of Pierre Bourdieu, London: MacMillan.
Higher Education Authority, 2001. Report of the Action Group on Access to Third-level Education. Dublin:Stationery Office
Higher Education Authority, 2004. Achieving Equity of Access to Higher Education: Action Plan 2005-2007 ,Dublin: HEA.
Higher Education Authority, 2005. Progressing the Action Plan: Funding to Achieve Equity of Access to Higher
Education, Dublin: HEA.
Higher Education Authority, 2006. Towards the Best Education for All – An Evaluation of Access Programmes in
Higher Education, Dublin: HEA.
Higher Education Authority, 2008. National Plan for Equity of Access to Higher Education 2008-2013 , Dublin: HEA.
Higher Education Authority, 2008. Strategic Plan 2008-2010, Dublin: HEA.
Higher Education Authority, 2009. Higher Education: Key Facts and Figures 07/08. Dublin: HEA.
Higher Education Authority, 2009. National Plan for Equity of Access to Higher Education 2008-2013. Dublin: HEA
Hillmert, S. and M. Jacob, 2002. ‘Social Inequality in Higher Education: Is Vocational Training a Pathway Leading toor Away from University?’, European Sociological Review , 19, 3: 319-334.
8/4/2019 BKMNEXT146
http://slidepdf.com/reader/full/bkmnext146 192/227
178
REFERENCES
Hutchings, M., 2003. ‘Information, advice and cultural discourses’, in Archer, L., M. Hutchings and A. Ross, Higher
Education and Social Class: Issues of exclusion and inclusion, London: Routledge Falmer.
James, R., 2002. Socioeconomic Background and Higher Education Participation: An analysis of school students’
aspirations and expectations, Centre for the Study of Higher Education, University of Melbourne.
Keller, S. and M. Zavalloni, 1964. ‘Ambition and Social Class: A Respecification’, Social Forces, 43, 1: 58-70.
Lareau, A., 2000. Home Advantage: Social Class and Parental Intervention in Elementary Education (2nd Edition).Oxford: Rowman and Littlefield Publishers
Leathwood, C. and P. O’Connell, 2003. ‘”It’s a struggle”: the construction of the “new student” in higher education’,Journal of Educational Policy, 18(6): 597-615.
Lindholm, J., 2008. ‘Deciding to Forego College: Non-college Attendees Reflection on Family, School and Self,Teachers College Record , 108, 4: 577-603.
Lucas, S.R., 2001. ‘Effectively maintained inequality: Education, transitions, track mobility and social backgroundeffects’, American Journal of Sociology, 106, 6: 1642-1690.
MacAllum, K., D.M. Glover, B. Queen and A. Riggs, 2007. Deciding on Postsecondary Education: Final Report,Washington DC: NPEC (National Postsecondary Education Cooperative.
McCoy, S., E. Calvert, E. Smyth and M. Darmody, forthcoming. The Costs of Participating in Higher Education for
Students from Diverse Backgrounds, Dublin: HEA.
McCoy, S., E. Kelly and D. Watson, 2007. School Leavers’ Survey Report 2006, Dublin: ESRI and Department ofEducation and Science.
McCoy, S., Smyth, E., Darmody, M., Dunne, A., 2006. Guidance for All? Guidance Provision in Second-Level Schools,Dublin: Liffey Press/ESRI
McCoy, S. and Smyth, E., 2003. ‘Educational expenditure: implications for equality’, in T. Callan, A. Doris and D.McCoy (eds.), Budget Perspectives 2004, Dublin: ESRI/FFS.
O’Connell, P.J., D. Clancy and S. McCoy, 2006(a). Who Went to College in 2004? A National Survey of New
Entrants to Higher Education, Dublin: HEA.
O’Connell, P.J., S. McCoy and D. Clancy, 2006(b). “Who Went to College? Socio-Economic Inequality in Entry toHigher Education in the Republic of Ireland in 2004’, Higher Education Quarterly, 60, 4: 312-332.
OECD, 2006. Higher Education in Ireland , Paris: OECD.
OECD, 2008. Higher Education to 2030, Volume 1: Demography, Paris: OECD.
Osborne, M., 2003. ‘Increasing or Widening Participation in Higher Education? – a European Overview’, European
Journal of Education, 38, 1: 5-24.

8/4/2019 BKMNEXT146
http://slidepdf.com/reader/full/bkmnext146 193/227
179
REFERENCES
Osborne, R.D., 2006. ‘Access to and Participation in Higher Education in Northern Ireland’, Higher Education
Quarterly, 60, 4: 333-348.
Raffe, D., L. Croxford, C. Iannelli, M. Shapira and C. Howieson, 2006. ‘Social-Class Inequalities in Education inEngland and Scotland’, Edinburgh, CES Briefing No. 40.
Reay, Diane and S.J. Ball, 1998. ‘”Making their minds up”: family dynamics of school choice’, British Educational
Research Journal , 24 (4): 431-448.
Reay, D., 1997. ‘The double-bind of the “working-class” feminist academic: the success of failure or the failure ofsuccess?’, in P. Mahony and C. Zmroczek (eds) Class Matters: ‘working-class’ women’s perspectives on social class ,London: Taylor and Francis.
Reay, D., 2001. ‘Finding or losing yourself: working-class relationships to education?’, Journal of Education Policy, 16,
4: 333-346.
Sarantakos, S. 1988. Social Research (2nd Edition), New York:Palgrave.
Schulman, L.S., 1986. ‘Those Who UInderstand: Knowledge Growth in teaching’, Educational Researcher, 15, 2: 4-14
Shavit, Y., and W. Muller. 1998. From School to Work, Oxford University Press, Oxford.
Shavit, Y., R. Arum and A. Gamoran (eds), 2007. Stratification in Higher Education: A Comparative Study, StanfordUniversity Press.
Smyth, E., 1999. Do Schools Differ? Academic and Personal Development among Pupils in the Second-Level Sector ,
Dublin: Oak Tree Press/ESRI.
Smyth, E., A. Dunne, S. McCoy and M. Darmody, 2006. Pathways through the junior cycle: The experiences of
second year students, Dublin: ESRI and The Liffey Press.
Smyth, E. and C. Hannan, 2007. ‘School processes and the transition to higher education’, Oxford Review of
Education, 33, 2: 175-194.
Smyth, E. and S. McCoy, 2009. Investing in Education: Combating Educational Disadvantage, Dublin: ESRI andBarnardos.
Smyth, E., D. Byrne and C. Hannan, 2004. The Transition Year Programme: An Assessment, Dublin: ESRI and TheLiffey Press.
Smyth, E., 2009. ‘Buying your way into college? Private tuition and the transition to higher education in Ireland’,Oxford Review of Education, 35, 1:1-22.
Smyth, E., 1999. ‘Educational Inequalities among School Leavers in Ireland 1979-1994’, Economic and Social Review ,30, 3: 267-284.
Thomas, E., 2001. Widening Participation in Post-Compulsory Education, London: Continuum.
8/4/2019 BKMNEXT146
http://slidepdf.com/reader/full/bkmnext146 194/227
180
REFERENCES
Thomas, L., 2002. ‘Collaboration with and between HEIs in England: a review of policy and practice’, in L. Thomas,M. Cooper and J. Quinn (Eds) Collaboration to Widen Participation in Higher Education. Stroke-on-Trent:Trentham Books
Thompson, A. 1988. The Oral History Reader London, Routledge.
Watson, D., S. McCoy and S. Gorby, 2006. The Post-Leaving Certificate Sector in Ireland: A Multivariate Analysis of
Educational and Employment Outcomes, Dublin: ESRI and Department of Education and Science.
Whelan, C.T., and D. F. Hannan. 1999. ‘Class Inequalities in Educational Attainment among the Adult Population inthe Republic of Ireland’, The Economic and Social Review 30(3): 285-307.
Willis, P., 1977. Learning to Labour. Farnborough: Saxton House.
Yow, V.R., 2005. Recording Oral History: A Guide for the Humanities and Social Sciences, California: Alta MiraPress.
8/4/2019 BKMNEXT146
http://slidepdf.com/reader/full/bkmnext146 195/227
CHAPTER 3: EXPENDITURE PATTERN OF STUDENTS
181
Appendices

8/4/2019 BKMNEXT146
http://slidepdf.com/reader/full/bkmnext146 196/227
182
APPENDICES
Appendix A:
Census 1986 Intermediate Non-manualand Other Non-manual Socio-EconomicGroups
Intermediate Non-Manual
Typists and Key-Punch Operators
Book Keepers, Cashiers and Related Workers
Computing Machine Operators
Clerical Workers (n.e.s.)
Clerical Supervisors
Proprietors of Filling Stations or Garages
Publicans, Wine Merchants, Off-Licence Proprietors, etc.
Other Proprietors in Wholesale or Retail Trade
Shop Assistants and Related Workers
Bar Attendants
Working Proprietors in Catering/Lodging Services (n.e.s.)
Garda Sergeants and Lower Ranks
Government Executive Officials
Draughtsmen
Other Ranks
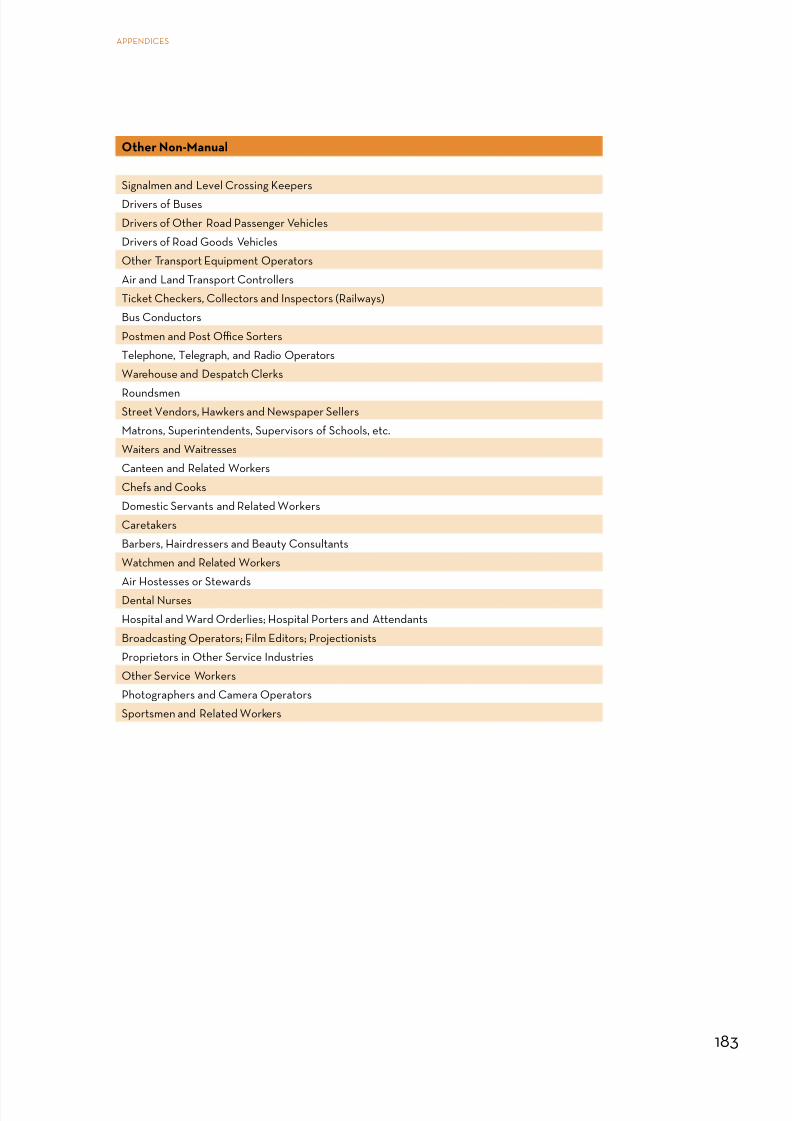
8/4/2019 BKMNEXT146
http://slidepdf.com/reader/full/bkmnext146 197/227
183
APPENDICES
Other Non-Manual
Signalmen and Level Crossing Keepers
Drivers of Buses
Drivers of Other Road Passenger Vehicles
Drivers of Road Goods Vehicles
Other Transport Equipment Operators
Air and Land Transport Controllers
Ticket Checkers, Collectors and Inspectors (Railways)
Bus Conductors
Postmen and Post Office Sorters
Telephone, Telegraph, and Radio Operators
Warehouse and Despatch Clerks
RoundsmenStreet Vendors, Hawkers and Newspaper Sellers
Matrons, Superintendents, Supervisors of Schools, etc.
Waiters and Waitresses
Canteen and Related Workers
Chefs and Cooks
Domestic Servants and Related Workers
Caretakers
Barbers, Hairdressers and Beauty Consultants
Watchmen and Related Workers
Air Hostesses or Stewards
Dental Nurses
Hospital and Ward Orderlies; Hospital Porters and Attendants
Broadcasting Operators; Film Editors; Projectionists
Proprietors in Other Service Industries
Other Service Workers
Photographers and Camera Operators
Sportsmen and Related Workers

8/4/2019 BKMNEXT146
http://slidepdf.com/reader/full/bkmnext146 198/227
184
APPENDICES
Appendix B: Comparing 1986 and 1996Census Classification of Occupations
Code Intermediate Non-manual 1986 Code 1996 Non-manual Group (Aggregate)
316 Typists and Key-Punch Operators 459 Secretaries, medical, legal: personal assistants,typists and word processor operators
317 Book Keepers, Cashiers and RelatedWorkers
410 Accounts and wages clerks, book-keepers andother financial clerks
318 Computing Machine Operators 490 Computer operators, data processingoperators and other office machine operators
327 Clerical Workers (n.e.s.) 401 Local government clerical officers and as-sistants
328 Clerical Supervisors 400 Civil Service administrative officers and as-sistants
332 Proprietors of Filling Stations orGarages
171 Garage managers and proprietors (Managerialand Technical)
333 Publicans, Wine Merchants, Off-LicenceProprietors, etc.
175 Publicans, innkeepers and club managers:Managerial and Technical
334 Other Proprietors in Wholesale orRetail Trade
179 Managers and proprietors of shops (Manage-rial and Technical)
336 Shop Assistants and Related Workers 720 Sales assistants, check-out operators and
petrol pump attendants337 Bar Attendants 622 Bar Staff (Semi-skilled/non-manual )
346 Working Proprietors in Catering/Lodging Services (n.e.s.)
Managerial and Technical
357 Garda Sergeants and Lower Ranks 610 Police officers (sergeant and below)
367 Government Executive Officials 132 Civil Service Executive Officers (Lower Profes-sional)
376 Draughtsmen 310 Draughtspersons
420 Other Ranks 600 Soldiers (sergeant and below)
Other Non-manual 1986 1996 Non-manual Group (Aggregate)
309 Signalmen and Level Crossing Keepers 881 Railway station workers, supervisors andguards (Manual Skilled/Non-manual)
312 Drivers of Buses 873 Bus Conductors and Coach Drivers (Employ-ers and Managers/Manual Skilled/Own Account Workers)
313 Drivers of Other Road PassengerVehicles
874 Taxi/Cab Drivers, Chauffers and Couriers(Skilled Manual)
314 Drivers of Road Goods Vehicles 872 Drivers of Road Goods Vehicles (SkilledManual)
315 Other Transport Equipment Operators 889 Other Transport Equipment Operators(Skilled Manual)

8/4/2019 BKMNEXT146
http://slidepdf.com/reader/full/bkmnext146 199/227
185
APPENDICES
319 Air and Land Transport Controllers 331 Aircraft officers, traffic planners and con-trollers (Lower Professional/Own AccountWorkers)
321 Ticket Checkers, Collectors andInspectors (Railways) 871 Bus and road transport depot inspectors(Skilled Manual)
322 Bus Conductors 873 Bus conductors and coach drivers (SkilledManual/Own Account Workers)
323 Postmen and Post Office Sorters 940 Postal workers and mail sorters (Semi-skilledManual)
325 Telephone, Telegraph, and RadioOperators
462 Telephone operators, telegraph operators andother office communication system operators
326 Warehouse and Despatch Clerks 441 Storekeepers, warehousemen/women,despatch and production control clerks(Semi-Skilled/Employer Managers)
342 Roundsmen 731 Roundsmen/women and van salespersons
(Employers and Managers)343 Street Vendors, Hawkers and
Newspaper Sellers732 Market/street traders and scrap dealers
347 Matrons, Superintendents, Supervisorsof Schools, etc.
371 Matrons, houseparents, welfare, communityand youth workers: Employers and Managers/Non-manual
348 Waiters and Waitresses 621 Waiters and Waitresses
349 Canteen and Related Workers
350 Chefs and Cooks 620 Chefs and Cooks (Non-manual/Employersand Managers)
351 Domestic Servants and Related Workers 958, 670 Cleaners and Domestics (Unskilled/Own
Account Workers), Housekeepers (SkilledManual)
353 Caretakers 672, 644 Caretakers, Care Assistants, Attendants(Semi Skilled)
355 Barbers, Hairdressers and BeautyConsultants
660 Hairdressers, barbers and beauticians
358 Watchmen and Related Workers 615, 619 Security guards and related occupations(Non-manual, Semi-skilled)
359 Air Hostesses or Stewards 630 Travel and flight attendants
360 Dental Nurses 346 Medical technicians, dental auxiliaries anddental nurses (Managerial and Technical)
361 Hospital and Ward Orderlies; HospitalPorters and Attendants 951 Hotel porters and kitchen porters (Semi-Skilled)
362 Broadcasting Operators; Film Editors;Projectionists
N/A
363 Proprietors in Other Service Industries Mangerial and Technical
364 Other Service Workers Non-manual
401 Photographers and Camera Operators 386 Photographers, camera, sound and videoequipment operators
405 Sportsmen and Related Workers 176, 387 Entertainment and Sports Managers,Professional Athletes and sport officials(Own Account Workers/Non-manual)

8/4/2019 BKMNEXT146
http://slidepdf.com/reader/full/bkmnext146 200/227
186
APPENDICES
Appendix C
Descriptive TablesTable 1: Percentage of School Leavers who completed the Leaving Certificate (or equivalent)
1997/98 2002/04 2006/07
Total 80.4 82.3 83.9
Males 75.3 78.5 79.7
Females 85.8 86.0 88.0
Table 2: Percentage of School Leavers who completed the Leaving Certificate by Parental Socio-Economic
Background
Parental Socio-Economic Group 1997/98 2002/04 2006/07
Farmer/Other Agricultural 85.8 87.3 88.6
Professional 92.3 91.5 93.0
Employer/Manager 89.1 88.7 88.9
Intermediate Non-Manual 84.1 85.7 85.1
Other Non-Manual 72.1 75.2 76.6
Skilled Manual 74.9 78.3 82.1
Semi- and Unskilled Manual 62.1 68.8 74.3Non-employed 65.3 48.8 57.1
Table 3: Percentage of School Leavers who completed the Leaving Certificate by Fathers’ Socio-Economic
Group
Father’s Socio-Economic Group 1997/98 2002/04 2006/07
Farmer/Other Agricultural 87.8 88.7 89.5
Professional 92.4 92.2 92.3
Employer/Manager 90.5 90.1 91.0
Intermediate Non-Manual 85.2 88.6 88.9Other Non-Manual 76.9 79.5 81.1
Skilled Manual 81.5 82.9 85.0
Semi- and Unskilled Manual 72.8 78.7 80.2
Unemployed 60.8 61.1 61.0

8/4/2019 BKMNEXT146
http://slidepdf.com/reader/full/bkmnext146 201/227
187
APPENDICES
Table 4: Percentage of School Leavers who completed the Leaving Certificate by Region
1997/98 2002/04 2006/07
Midlands 90.2 85.7 85.8
South West 84.7 85.7 86.2
Mid West 83.6 83.8 83.8
West 84.3 89.1 85.7
South East 82.2 81.8 82.5
Border 80.8 82.2 84.9
Mid East 79.4 80.4 79.5
Dublin 71.5 76.9 82.8
Table 5: Leaving Certificate Programme completed by Gender
All Male Female
2002/04 2006/07 2002/04 2006/07 2002/04 2006/07
LC Established 81.4 75.5 81 76.4 81.7 74.9
LC Vocational Programme 13.9 18.9 13.8 17.5 14 20.1
LC Applied 4.7 5.6 5.1 6.4 4.3 5.0
Table 6: Distribution of Programme Pursued by those who completed second-level education by Fathers’
Socio-Economic Group
2002/04 2006/07
LCE LCVP LCA LCE LCVP LCA
Farmer/Other Agricultural 81.6 13.7 4.6 64.5 28.8 6.7
Professional 91.9 7.3 0.8 82.0 16.7 1.4
Employer/Manager 87.2 10.6 2.2 83.2 15.9 0.9
Intermediate Non-Manual 84.0 13.5 2.5 81.8 14.9 3.3
Other Non-Manual 77.0 17.3 5.8 73.1 17.6 9.2
Skilled Manual 79.2 16.3 4.4 74.4 18.5 7.1
Semi and Unskilled Manual 75.2 15.7 9.0 71.6 20.1 8.3
Non-Employed 72.5 19.0 8.5 72.8 18.4 8.8
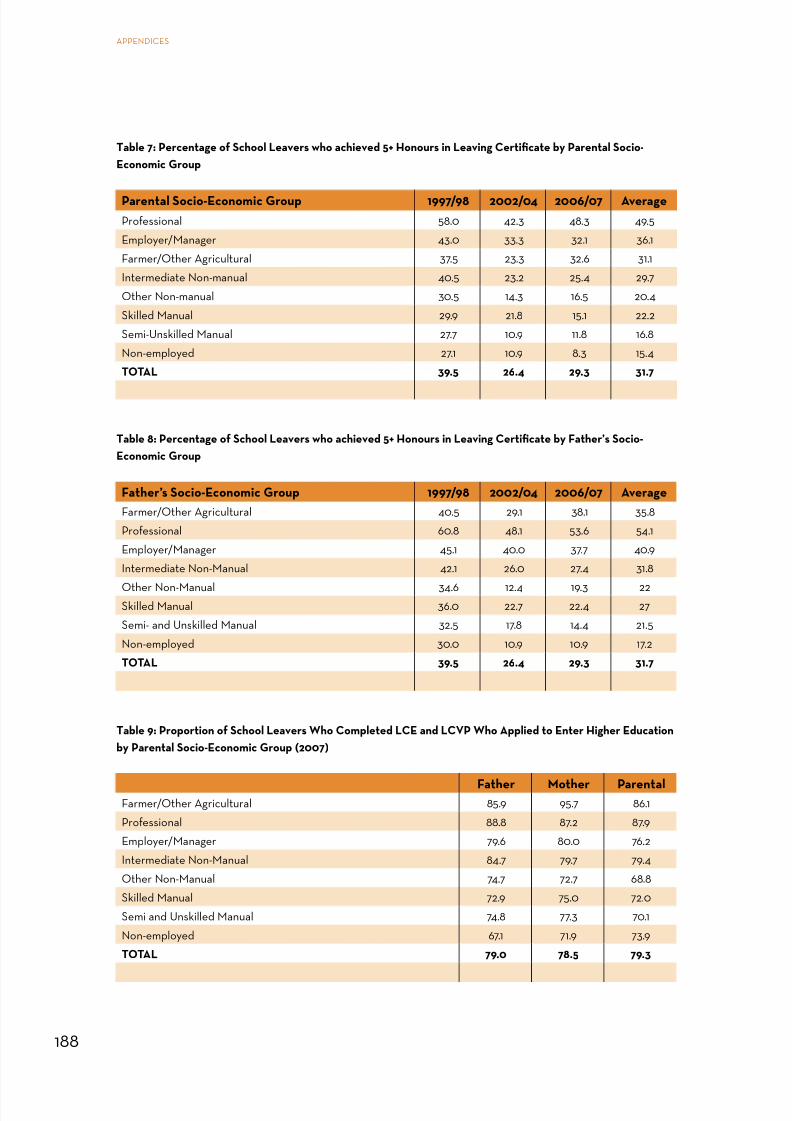
8/4/2019 BKMNEXT146
http://slidepdf.com/reader/full/bkmnext146 202/227
188
APPENDICES
Table 7: Percentage of School Leavers who achieved 5+ Honours in Leaving Certificate by Parental Socio-
Economic Group
Parental Socio-Economic Group 1997/98 2002/04 2006/07 Average
Professional 58.0 42.3 48.3 49.5
Employer/Manager 43.0 33.3 32.1 36.1
Farmer/Other Agricultural 37.5 23.3 32.6 31.1
Intermediate Non-manual 40.5 23.2 25.4 29.7
Other Non-manual 30.5 14.3 16.5 20.4
Skilled Manual 29.9 21.8 15.1 22.2
Semi-Unskilled Manual 27.7 10.9 11.8 16.8
Non-employed 27.1 10.9 8.3 15.4
TOTAL 39.5 26.4 29.3 31.7
Table 8: Percentage of School Leavers who achieved 5+ Honours in Leaving Certificate by Father’s Socio-
Economic Group
Father’s Socio-Economic Group 1997/98 2002/04 2006/07 Average
Farmer/Other Agricultural 40.5 29.1 38.1 35.8
Professional 60.8 48.1 53.6 54.1
Employer/Manager 45.1 40.0 37.7 40.9
Intermediate Non-Manual 42.1 26.0 27.4 31.8
Other Non-Manual 34.6 12.4 19.3 22Skilled Manual 36.0 22.7 22.4 27
Semi- and Unskilled Manual 32.5 17.8 14.4 21.5
Non-employed 30.0 10.9 10.9 17.2
TOTAL 39.5 26.4 29.3 31.7
Table 9: Proportion of School Leavers Who Completed LCE and LCVP Who Applied to Enter Higher Education
by Parental Socio-Economic Group (2007)
Father Mother ParentalFarmer/Other Agricultural 85.9 95.7 86.1
Professional 88.8 87.2 87.9
Employer/Manager 79.6 80.0 76.2
Intermediate Non-Manual 84.7 79.7 79.4
Other Non-Manual 74.7 72.7 68.8
Skilled Manual 72.9 75.0 72.0
Semi and Unskilled Manual 74.8 77.3 70.1
Non-employed 67.1 71.9 73.9
TOTAL 79.0 78.5 79.3

8/4/2019 BKMNEXT146
http://slidepdf.com/reader/full/bkmnext146 203/227
189
APPENDICES
Table 10: Reason(s) for Not Applying to Higher Education by Gender (2007)
Total Males Females
Not Interested 57.6 64.9 49
Wouldn’t get grades 23.5 19.5 28.4
Wanted to earn 26.6 27.7 25.5
Couldn’t afford 15.2 8.7 22.5
Travel/Gap Year 7.2 4.3 10.5
Other Education/Training 15.1 18.9 12.6
Family didn’t encourage 1.1 1.1 1
School/teachers didn’t encourage 4.9 3.7 6.1
TOTAL 57.6 64.9 49
Table 11: Reasons for Not Applying to Higher Education by Parental Socio-Economic Background (2007)
Parental Socio-Economic Group Not
Interested
Wanted
to Earn
Wouldn’t
get
Grades
Other
Educ/
Train
Couldn’t
Afford
Farmer/Other Agricultural 59.9 15.5 12.3 15.5 18.5
Professional/Empl/Manager 56.8 30.1 30.3 18.7 10.6
Intermediate Non-Manual 52.0 18.9 21.8 16.5 25.6
Other Non-Manual 57.6 27.2 28.8 14.7 13.9
Skilled, Semi-Unskilled Manual 64.1 36.5 19.4 13.2 12.3Non-employed 82.6 25.4 8.0 34.1 8.0
TOTAL 57.6 26.6 23.5 15.1 15.2
Table 12: Proportion of students who accepted a place on a Higher Education course by Parental Socio-
Economic Background (2007)
Parental Socio-Economic Group
Farmer/Other Agricultural 83.1
Professional 90.5Employer/Manager 87.4
Intermediate Non-Manual 87.3
Other Non-Manual 84.0
Skilled Manual 91.7
Semi and Unskilled Manual 76.7
Non-employed 92.9
TOTAL 87.7

8/4/2019 BKMNEXT146
http://slidepdf.com/reader/full/bkmnext146 204/227
190
APPENDICES
Table 13: Main Reason for Not Accepting Place in Higher Education by Parental Socio-Economic Group (2007)
Other
Educ/
Train
Not
Inter-
ested
Wanted
to Earn/
Couldn’t
Afford
Time
Out/
Repeat
LC
Didn’t get
Preferred
Course/
Location
Other
Farmer/Other Agricultural 35.7 14.3 0.0 42.9 7.1 0.0
Professional/Emp/Manager 33.3 17.6 17.6 11.8 15.7 4.0
Intermediate Non-Manual 16.0 16.0 32.0 28.0 4.0 4.0
Other Non-Manual 29.4 29.4 11.8 0.0 23.5 5.9
Skilled/Semi-unskill Manual 37.5 18.8 25.0 6.3 6.3 6.1
TOTAL 29.8 18.5 18.5 16.7 12.9 3.6
Table 14: Participation in Full-Time Higher Education Among school leavers who completed senior cycle byGender
1997/98 2002/04 2006/07
Total 45.9 51.0 45.5
Male 43.3 48.3 44.1
Female 48.3 53.4 46.8
Table 15: Participation in Full-Time Higher Education among Senior Cycle Leavers by Parental Socio-Economic
Group
Parental Socio-Economic Group 1997/98 2002/04 2006/07 Average
Farmer/Other Agricultural 47.0 46.5 44.0 45.8
Professional 64.7 62.6 63.4 63.6
Employer/Manager 57.5 53.0 52.7 54.4
Intermediate Non-Manual 46.2 47.9 57.6 50.5
Other Non-Manual 41.7 34.8 31.3 35.9
Skilled Manual 36.2 42.3 48.6 42.4
Semi- and Unskilled Manual 38.2 32.9 37.9 36.4
Non-employed 31.7 28.6 38.1 32.8
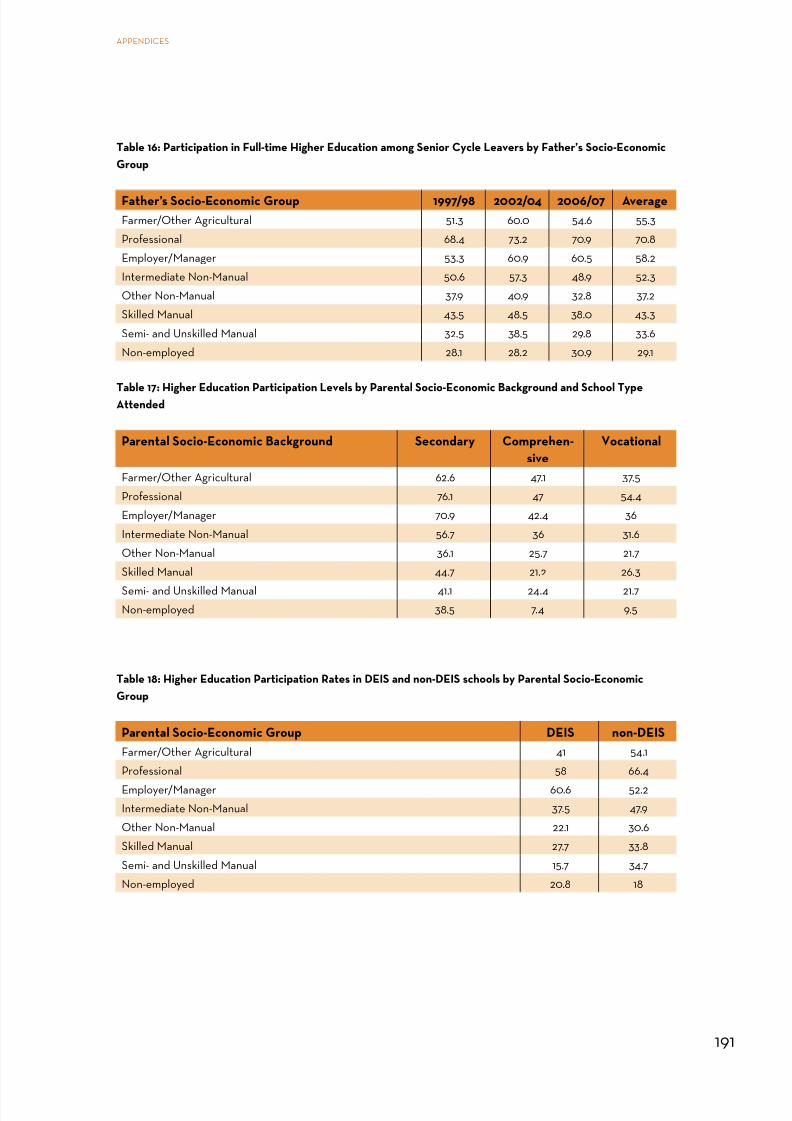
8/4/2019 BKMNEXT146
http://slidepdf.com/reader/full/bkmnext146 205/227
191
APPENDICES
Table 16: Participation in Full-time Higher Education among Senior Cycle Leavers by Father’s Socio-Economic
Group
Father’s Socio-Economic Group 1997/98 2002/04 2006/07 Average
Farmer/Other Agricultural 51.3 60.0 54.6 55.3
Professional 68.4 73.2 70.9 70.8
Employer/Manager 53.3 60.9 60.5 58.2
Intermediate Non-Manual 50.6 57.3 48.9 52.3
Other Non-Manual 37.9 40.9 32.8 37.2
Skilled Manual 43.5 48.5 38.0 43.3
Semi- and Unskilled Manual 32.5 38.5 29.8 33.6
Non-employed 28.1 28.2 30.9 29.1
Table 17: Higher Education Participation Levels by Parental Socio-Economic Background and School TypeAttended
Parental Socio-Economic Background Secondary Comprehen-
sive
Vocational
Farmer/Other Agricultural 62.6 47.1 37.5
Professional 76.1 47 54.4
Employer/Manager 70.9 42.4 36
Intermediate Non-Manual 56.7 36 31.6
Other Non-Manual 36.1 25.7 21.7
Skilled Manual 44.7 21.2 26.3
Semi- and Unskilled Manual 41.1 24.4 21.7Non-employed 38.5 7.4 9.5
Table 18: Higher Education Participation Rates in DEIS and non-DEIS schools by Parental Socio-Economic
Group
Parental Socio-Economic Group DEIS non-DEIS
Farmer/Other Agricultural 41 54.1
Professional 58 66.4
Employer/Manager 60.6 52.2Intermediate Non-Manual 37.5 47.9
Other Non-Manual 22.1 30.6
Skilled Manual 27.7 33.8
Semi- and Unskilled Manual 15.7 34.7
Non-employed 20.8 18

8/4/2019 BKMNEXT146
http://slidepdf.com/reader/full/bkmnext146 206/227
192
APPENDICES
Table 19: Enrolment in University courses among Higher Education entrants by Parental Socio-Economic
Background
Parental Socio-Economic Background 1997/98 2002/04 2006/07 Average
Farmer/Other Agricultural 44.4 44.6 38.5 42.5
Professional 60.4 60.5 57.2 59.3
Employer/Manager 55.2 48.9 51.6 51.9
Intermediate Non-Manual 39.4 41.5 55.8 45.5
Other Non-Manual 35.2 32.1 23.1 30.1
Skilled Manual 33.5 40.6 38.5 37.5
Semi- and Unskilled Manual 37.2 25.3 44.1 35.5
Non-employed 29.8 27.8 0.0 19.2
Table 20: Enrolment in University courses among Higher Education entrants by Father’s Socio-Economic Group
Father’s Socio-Economic Group 1997/98 2002/04 2006/07 Average
Farmer/Other Agricultural 47.0 46.5 44.0 45.8
Professional 64.7 62.6 63.4 63.6
Employer/Manager 57.5 53.0 52.7 54.4
Intermediate Non-Manual 46.2 47.9 57.6 50.5
Other Non-Manual 41.7 34.8 31.3 35.9
Skilled Manual 36.2 42.3 48.6 42.4
Semi- and Unskilled Manual 38.2 32.9 37.9 36.4
Non-employed 31.7 28.6 38.1 32.8 Table 21: Percentage of School Leavers in Full-Time Higher Education who will Receive an Honours Degree on
Completion of their Course by Parental Socio-Economic Background
Parental Socio-Economic Background 2002/04 2006/07 Average
Farmer/Other Agricultural 62.8 83.1 72.9
Professional 80.6 92.1 86.3
Employer/Manager 72.3 80.1 76.2
Intermediate Non-Manual 67.7 85.5 76.6
Other Non-Manual 62.3 76.3 69.3
Skilled Manual 73.6 66.3 69.9
Semi- and Unskilled Manual 48.9 62.3 55.6
Non-employed 30.0 64.3 47.1

8/4/2019 BKMNEXT146
http://slidepdf.com/reader/full/bkmnext146 207/227
193
APPENDICES
Table 22: Percentage of School Leavers in Full-Time Higher Education who will Receive an Honours Degree on
Completion of their Course by Father’s Socio-Economic Background
Father’s Socio-Economic Background 2002/04 2006/07 Average
Farmer/Other Agricultural 64.4 87.8 76.1
Professional 83.5 90.7 87.1
Employer/Manager 74.9 95.9 85.4
Intermediate Non-Manual 71.1 90.9 81.0
Other Non-Manual 59.5 89.7 74.6
Skilled Manual 72.0 85.2 78.6
Semi- and Unskilled Manual 56.3 82.5 69.4
Non-employed 61.4 80.0 70.7
Table 23: Percentage of Full-Time Higher Education Participants Receiving Grant by Parental Socio-Economic
Background
Parental Socio-Economic Background 1997/98 2002/04 2006/07 Average
Farmer/Other Agricultural 66.2 61.1 54.0 60.4
Professional 24.0 19.9 19.0 21.0
Employer/Manager 33.3 21.6 20.5 25.1
Intermediate Non-Manual 54.6 33.0 34.8 40.8
Other Non-Manual 52.8 54.7 57.3 54.9
Skilled Manual 61.3 53.2 54.9 56.5
Semi- and Unskilled Manual 73.6 67.0 64.2 68.3Non-employed 73.7 73.7 85.7 77.7
Table 24: Percentage of Full-Time Higher Education Participants Receiving Grant by Father’s Socio-Economic
Background
Father’s Socio-Economic Background 1997/98 2002/04 2006/07 Average
Farmer/Other Agricultural 56.4 53.6 53.1 54.3
Professional 17.8 14.7 22.8 18.4
Employer/Manager 31.9 17.1 25.7 24.9
Intermediate Non-Manual 45.2 36.6 31.9 37.9
Other Non-Manual 55.0 45.5 41.3 47.2
Skilled Manual 83.7 76.4 80.0 80.0
Semi- and Unskilled Manual 67.7 63.2 50.0 60.3
Non-employed 56.4 53.6 53.1 54.3

8/4/2019 BKMNEXT146
http://slidepdf.com/reader/full/bkmnext146 208/227
194
APPENDICES
Table 25: Percentage of School Leavers Who Ever Participated in Higher Education and Who Left Within the
First Two Years by Parental Socio-Economic Group
Parental Socio-Economic Background 2006/07
Farmer/Other Agricultural 12.2
Professional 10.4
Employer/Manager 8.7
Intermediate Non-Manual 13.4
Other Non-Manual 16.7
Skilled Manual 10.1
Semi- and Unskilled Manual 18.3
Non-employed 29.0
Table 26: Participation in Post-Leaving Certificate Programme among those who Completed Senior Cycle
1997/98 2002/04 2006/07
Total 22.1 17.0 20.6
Male 15.9 10.7 12.8
Female 27.8 22.7 27.6
Table 27: Participation in Post-Leaving Certificate Programmes by Parental Socio-Economic Background
Parental Socio-Economic Background 1997/98 2002/04 2006/07 Average
Farmer/Other Agricultural 13.9 13.9 12.9 13.6
Professional 20.9 20.9 18.8 20.2
Employer/Manager 15.1 15.1 13.9 14.7
Intermediate Non-Manual 18.2 18.2 17.8 18.1
Other Non-Manual 20.5 20.5 26.4 22.5
Skilled Manual 22.9 22.9 21.0 22.3
Semi- and Unskilled Manual 20.3 20.3 19.9 20.2
Non-employed 17.8 17.8 14.0 16.5
Table 28: Participation in Post-Leaving Certificate Programmes by Father’s Socio-Economic Background
Father’s Socio-Economic Background 1997/98 2002/04 2006/07 Average
Farmer/Other Agricultural 15.0 12.3 13.8 13.7
Professional 13.2 8.0 12.4 11.2
Employer/Manager 22.8 13.7 18.3 18.2
Intermediate Non-Manual 26.9 14.8 16.6 19.4
Other Non-Manual 24.1 17.3 28.4 23.3
Skilled Manual 23.6 18.3 20.0 20.6
Semi- and Unskilled Manual 29.8 28.0 26.0 27.9
Non-employed 24.0 22.4 30.1 25.5

8/4/2019 BKMNEXT146
http://slidepdf.com/reader/full/bkmnext146 209/227
195
APPENDICES
Table 29: Regional Participation in Post-Leaving Certificate Programmes among those who Completed Senior
Cycle
Region 1997/98 2002/04 2006/07
Border 21.4 22.8 12.9
Dublin 33.5 21.7 27.6
Mid East 21.8 18.3 19.9
Midlands 10.9 12.6 19.0
Mid West 16.9 15.0 16.8
South East 18.0 23.0 16.1
South West 16.7 8.9 26.6
West 25.5 12.8 18.3
Table 30: Parental Socio-Economic Variation in Participation Rates in Apprenticeships among those who
Completed Senior Cycle (Males only)
Parental Socio-Economic Background 2006/07
Farmer/Other Agricultural 12.8
Professional 6.8
Employer/Manager 9.4
Intermediate Non-Manual 14.6
Other Non-Manual 21.2
Skilled Manual 22.9
Semi- and Unskilled Manual 21.8Non-employed 13
Table 31: Parental Socio-Economic Variation in Participation Rates in State Sponsored Training among those
who Completed Senior Cycle
Parental Socio-Economic Background 2006/07
Farmer/Other Agricultural 7.0
Professional 1.6
Employer/Manager 3.4
Intermediate Non-Manual 5.5
Other Non-Manual 7.1
Skilled Manual 7.6
Semi- and Unskilled Manual 4.6
Non-employed 16.2

8/4/2019 BKMNEXT146
http://slidepdf.com/reader/full/bkmnext146 210/227
196
APPENDICES
Table 32: Percentage of School Leavers who completed Second-Level Education who are in the Labour Market,
One Year after Leaving School
1997/98 2002/04 2006/07
Total 47.0 42.1 42.5
Males 49.9 45.8 42.5
Females 44.3 38.8 42.9
Table 33: Percentage of School Leavers who completed Second-Level Education who are in the Labour Market,
One Year after Leaving School by Parental Socio-Economic Background
Parental Socio-Economic Group 1997/98 2002/04 2006/07 Average
Farmer/Other Agricultural 41.7 35.4 43.9 40.3
Professional 27.8 26.3 28.3 27.5Employer/Manager 40.7 33.5 39.1 37.8
Intermediate Non-Manual 46.8 43.6 42.7 44.4
Other Non-Manual 62.5 57.6 55.7 58.6
Skilled Manual 58.8 51.0 54.0 54.6
Semi- and Unskilled Manual 65.0 58.9 59.6 61.2
Non-employed 50.4 65.1 44.6 53.4
Table 34: Percentage of School Leavers who completed Second-Level Education who are in the Labour Market,
One Year after Leaving School by Father’s Socio-Economic Background
Father’s Socio-Economic Group 1997/98 2002/04 2006/07 Average
Farmer/Other Agricultural 38.3 33.2 39.3 36.9
Professional 23.8 22.2 23.9 23.3
Employer/Manager 40.4 28.4 36.4 35.0
Intermediate Non-Manual 42.7 34.0 40.2 38.9
Other Non-Manual 53.2 51.5 54.5 53.0
Skilled Manual 51.5 49.5 47.6 49.5
Semi- and Unskilled Manual 60.3 56.9 54.6 57.2
Non-employed 67.6 55.6 50.0 57.7
Table 35: Percentage of School Leavers in the Labour Market who are Unemployed
1997/98 2002/04 2006/07
All 11.5 12.5 9.1
Males 8.6 11.6 9.2
Females 14.5 13.5 9.0

8/4/2019 BKMNEXT146
http://slidepdf.com/reader/full/bkmnext146 211/227
197
APPENDICES
Table 36: Percentage of School Leavers who Completed Second-Level and are in the Labour Market,
Unemployed, by Parental Socio-Economic Group
Parental Socio-Economic Group 1997/98 2002/04 2006/07 Average
Farmer/Other Agricultural 11.5 4.9 9.6 8.7
Professional 5.6 7.2 6.8 6.5
Employer/Manager 6.2 4.9 3.2 4.8
Intermediate Non-Manual 10.4 7.5 6.1 8.0
Other Non-Manual 11.7 8.9 12.0 10.9
Skilled Manual 15.7 10.2 9.7 11.9
Semi- and Unskilled Manual 15.7 13.0 10.4 13.0
Non-employed 17.4 7.3 36.4 20.4
Table 37: Percentage of School Leavers who Completed Second-Level and are in the Labour Market,
Unemployed, by Father’s Socio-Economic Group
Father’s Socio-Economic Group 1997/98 2002/04 2006/07 Average
Farmer/Other Agricultural 8.9 6.8 7.4 7.7
Professional 6.5 10.6 5.7 7.6
Employer/Manager 5.8 11.1 4.2 7.0
Intermediate Non-Manual 12.2 6.3 6.2 8.2
Other Non-Manual 7.8 15.0 11.6 11.5
Skilled Manual 8.9 8.6 7.5 8.3
Semi- and Unskilled Manual 13.3 13.4 6.9 11.2Unemployed 27.5 27.5 29.4 28.1
Table 38: Occupational Distribution of School Leavers in Full-Time Employment by Father’s Socio-Economic
Group, 1997/98 Cohort
Father’s Socio-Economic Group Mana-
gerial/
Profes-
sional
Clerical Service Agricul-
ture &
Fishery
Skilled &
Semi-
Skilled
Manual
Other
Manual
Farmer/Other Agricultural 6.6 10.6 21.4 18.6 37.7 5.1Higher/Lower Professional 14.9 19.0 32.2 2.5 22.3 9.1
Employer/Manager 9.0 23.0 34.0 0.8 28.9 4.3
Intermediate Non-Manual 10.7 14.9 41.1 2.4 28.6 2.4
Other Non-Manual 6.7 16.3 31.4 2.3 35.8 7.6
Skilled Manual 6.3 15.1 30.8 1.4 40.4 6.0
Semi/Unskilled Manual 2.1 10.0 37.5 1.4 40.4 8.6
Non-employed 3.2 13.3 34.2 2.9 39.9 6.5
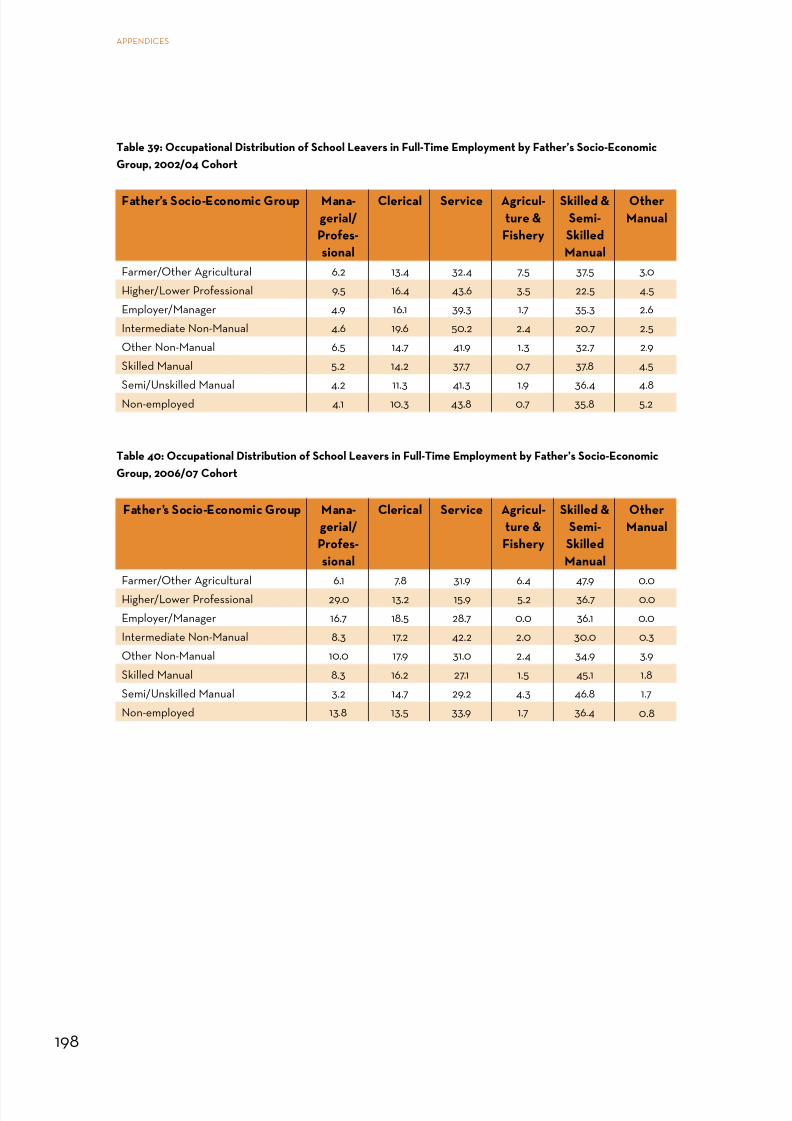
8/4/2019 BKMNEXT146
http://slidepdf.com/reader/full/bkmnext146 212/227
198
APPENDICES
Table 39: Occupational Distribution of School Leavers in Full-Time Employment by Father’s Socio-Economic
Group, 2002/04 Cohort
Father’s Socio-Economic Group Mana-
gerial/
Profes-
sional
Clerical Service Agricul-
ture &
Fishery
Skilled &
Semi-
Skilled
Manual
Other
Manual
Farmer/Other Agricultural 6.2 13.4 32.4 7.5 37.5 3.0
Higher/Lower Professional 9.5 16.4 43.6 3.5 22.5 4.5
Employer/Manager 4.9 16.1 39.3 1.7 35.3 2.6
Intermediate Non-Manual 4.6 19.6 50.2 2.4 20.7 2.5
Other Non-Manual 6.5 14.7 41.9 1.3 32.7 2.9
Skilled Manual 5.2 14.2 37.7 0.7 37.8 4.5
Semi/Unskilled Manual 4.2 11.3 41.3 1.9 36.4 4.8
Non-employed 4.1 10.3 43.8 0.7 35.8 5.2
Table 40: Occupational Distribution of School Leavers in Full-Time Employment by Father’s Socio-Economic
Group, 2006/07 Cohort
Father’s Socio-Economic Group Mana-
gerial/
Profes-
sional
Clerical Service Agricul-
ture &
Fishery
Skilled &
Semi-
Skilled
Manual
Other
Manual
Farmer/Other Agricultural 6.1 7.8 31.9 6.4 47.9 0.0
Higher/Lower Professional 29.0 13.2 15.9 5.2 36.7 0.0
Employer/Manager 16.7 18.5 28.7 0.0 36.1 0.0
Intermediate Non-Manual 8.3 17.2 42.2 2.0 30.0 0.3
Other Non-Manual 10.0 17.9 31.0 2.4 34.9 3.9
Skilled Manual 8.3 16.2 27.1 1.5 45.1 1.8
Semi/Unskilled Manual 3.2 14.7 29.2 4.3 46.8 1.7
Non-employed 13.8 13.5 33.9 1.7 36.4 0.8

8/4/2019 BKMNEXT146
http://slidepdf.com/reader/full/bkmnext146 213/227
199
APPENDICES
Appendix D
Models from Multivariate Analyses
A1. Introduction
This appendix gives more information on the data and variables used in the report and presents full multivariatemodels, which provide the basis for selecting and quantifying the results presented in the main report.
The multivariate analyses considered the following:
A2. Multivariate Tables for Second Level Attainment
1. the factors influencing completion of second-level education2. the factors influencing the transition from junior cycle to senior cycle3. the factors influencing completion of the LCA or LCVP relative to the LCE (conditional on entry into and
completion of senior cycle)4. the factors influencing attaining at least 2 honours in the Leaving Certificate examination (conditional on entry
into and completion of the LCE or LCVP
A3. Multivariate Tables for Participation in Higher Education
5. the factors influencing entry into higher education6. the factors influencing attendance at a university relative to other institutes of higher education7. the factors influencing pursuit of an honours degree8. the factors influencing receipt of a grant
A4.Multivariate Tables for Participation in Other forms of Education and Training
9. the factors influencing entry into higher education10. the factors influencing attendance at a university relative to other institutes of higher education11. the factors influencing pursuit of an honours degree12. the factors influencing receipt of a grant
The multivariate analyses of factors relating the educational attainment employed two types of regression models:logistic regression and multinomial regression. This modelling strategy follows from univariate analysis of youngpeoples’ educational attainment, which confirms clear socio-economic disparities at all levels of education.Each of the analyses present robust standard errors to take into account the clustering of the data: that is, pupilswithin schools.
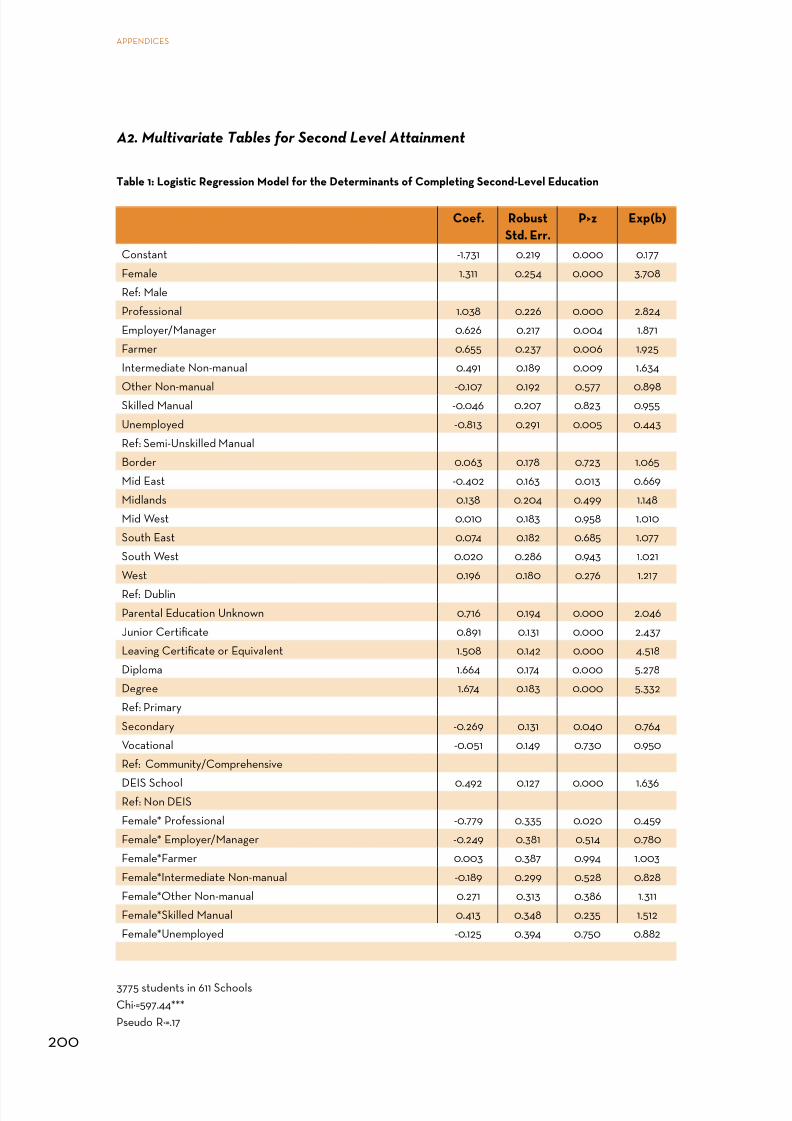
8/4/2019 BKMNEXT146
http://slidepdf.com/reader/full/bkmnext146 214/227
200
APPENDICES
A2. Multivariate Tables for Second Level Attainment
Table 1: Logistic Regression Model for the Determinants of Completing Second-Level Education
Coef. Robust
Std. Err.
P>z Exp(b)
Constant -1.731 0.219 0.000 0.177
Female 1.311 0.254 0.000 3.708
Ref: Male
Professional 1.038 0.226 0.000 2.824
Employer/Manager 0.626 0.217 0.004 1.871
Farmer 0.655 0.237 0.006 1.925
Intermediate Non-manual 0.491 0.189 0.009 1.634
Other Non-manual -0.107 0.192 0.577 0.898Skilled Manual -0.046 0.207 0.823 0.955
Unemployed -0.813 0.291 0.005 0.443
Ref: Semi-Unskilled Manual
Border 0.063 0.178 0.723 1.065
Mid East -0.402 0.163 0.013 0.669
Midlands 0.138 0.204 0.499 1.148
Mid West 0.010 0.183 0.958 1.010
South East 0.074 0.182 0.685 1.077
South West 0.020 0.286 0.943 1.021
West 0.196 0.180 0.276 1.217
Ref: DublinParental Education Unknown 0.716 0.194 0.000 2.046
Junior Certificate 0.891 0.131 0.000 2.437
Leaving Certificate or Equivalent 1.508 0.142 0.000 4.518
Diploma 1.664 0.174 0.000 5.278
Degree 1.674 0.183 0.000 5.332
Ref: Primary
Secondary -0.269 0.131 0.040 0.764
Vocational -0.051 0.149 0.730 0.950
Ref: Community/Comprehensive
DEIS School 0.492 0.127 0.000 1.636Ref: Non DEIS
Female* Professional -0.779 0.335 0.020 0.459
Female* Employer/Manager -0.249 0.381 0.514 0.780
Female*Farmer 0.003 0.387 0.994 1.003
Female*Intermediate Non-manual -0.189 0.299 0.528 0.828
Female*Other Non-manual 0.271 0.313 0.386 1.311
Female*Skilled Manual 0.413 0.348 0.235 1.512
Female*Unemployed -0.125 0.394 0.750 0.882
3775 students in 611 SchoolsChi²=597.44***Pseudo R²=.17

8/4/2019 BKMNEXT146
http://slidepdf.com/reader/full/bkmnext146 215/227
201
APPENDICES
Table 2: Logistic Regression Model for the Determinants of Making the Transition from Junior Cycle to Senior
Cycle
Coef. Robust
Std. Err.
P>z Exp(b)
Constant -1.492 0.193 0.000 0.225
Female 1.154 0.101 0.000 3.170
Ref: Male
Higher Lower Professional 0.834 0.200 0.000 2.301
Employer Manager 0.610 0.190 0.001 1.841
Farmer 0.666 0.196 0.001 1.947
Intermediate Non-manual 0.480 0.144 0.001 1.616
Other Non-manual 0.136 0.140 0.333 1.145
Skilled Manual 0.189 0.161 0.241 1.208Non-employed -0.828 0.181 0.000 0.437
Ref: Semi-Unskilled Manual
Border 0.270 0.189 0.153 1.310
Mid East -0.228 0.167 0.174 0.796
Midlands 0.106 0.222 0.633 1.112
Mid West 0.271 0.183 0.139 1.312
South East 0.205 0.171 0.233 1.227
South West 0.146 0.250 0.559 1.157
West 0.228 0.192 0.235 1.257
Ref: Dublin 0.826 0.180 0.000 2.284
Parental Education Unknown
Junior Certificate 0.929 0.122 0.000 2.532
Leaving Certificate 1.537 0.135 0.000 4.651
Diploma 1.691 0.172 0.000 5.422
Degree 1.684 0.201 0.000 5.390
Ref: Primary or Less
Secondary School -0.189 0.134 0.159 0.828
Vocational School 0.051 0.144 0.723 1.052
Ref: Community/Comprehensive School
Non DEIS school 0.532 0.120 0.000 1.702
Ref: DEIS school3775 pupils in 611 schoolsChi²=510.01***Pseudo R²=.1676

8/4/2019 BKMNEXT146
http://slidepdf.com/reader/full/bkmnext146 216/227
202
APPENDICES
Table 3: Logistic Regression of the Determinants of Completing LCA or LCVP relative to LCE (Conditional on
entry into senior cycle)
LCA LCVP
Coef. Robust
Std,
Err.
P>z Exp(b) Coef. Robust
Std.
Err.
P>z Exp(b)
Constant -0.193 0.359 0.589 0.824 -1.949 0.384 0.000 0.142
Female -0.642 0.153 0.000 0.526 0.030 0.148 0.838 1.031
Ref: Male
Higher Lower Professional -0.826 0.415 0.047 0.438 0.223 0.323 0.489 1.250
Employer Manager -1.847 0.580 0.001 0.158 0.080 0.335 0.810 1.084
Farmer 0.322 0.320 0.314 1.380 0.503 0.313 0.108 1.654
Intermediate Non-manual -0.287 0.308 0.351 0.751 0.125 0.282 0.657 1.133Other Non-manual 0.025 0.299 0.933 1.025 -0.049 0.304 0.873 0.953
Skilled Manual 0.310 0.335 0.354 1.363 0.383 0.341 0.262 1.467
Non-employed 0.837 0.401 0.037 2.309 0.734 0.441 0.096 2.083
Ref: Semi-Unskilled Manual
Border -0.359 0.312 0.249 0.698 0.953 0.272 0.000 2.593
Mid East -0.442 0.293 0.132 0.642 0.928 0.292 0.002 2.528
Midlands -0.595 0.377 0.115 0.552 1.324 0.334 0.000 3.760
Mid West 0.128 0.293 0.662 1.137 1.098 0.293 0.000 2.999
South East -0.516 0.388 0.184 0.597 1.284 0.319 0.000 3.611
South West -0.712 0.319 0.026 0.490 0.766 0.358 0.032 2.150
West -0.270 0.317 0.395 0.764 1.481 0.286 0.000 4.396Ref: Dublin
Parental Education Un-known
-0.299 0.351 0.393 0.741 -0.280 0.363 0.440 0.755
Junior Certificate -0.416 0.232 0.073 0.660 -0.505 0.240 0.035 0.603
Leaving Certificate -1.095 0.278 0.000 0.335 -0.566 0.253 0.025 0.568
Diploma -1.091 0.350 0.002 0.336 -0.521 0.287 0.070 0.594
Degree -1.721 0.445 0.000 0.179 -0.630 0.314 0.045 0.533
Ref: Primary or Less
Secondary School -0.523 0.214 0.014 0.593 -0.245 0.213 0.248 0.782
Vocational School -0.218 0.207 0.291 0.804 0.037 0.212 0.860 1.038Ref: Community/Comprehensive School
Non DEIS school -0.032 0.203 0.876 0.969 -0.142 0.182 0.435 0.868
Ref: DEIS school
2256 pupils in 483 schoolsChi²=219.01***Pseudo R²=.075
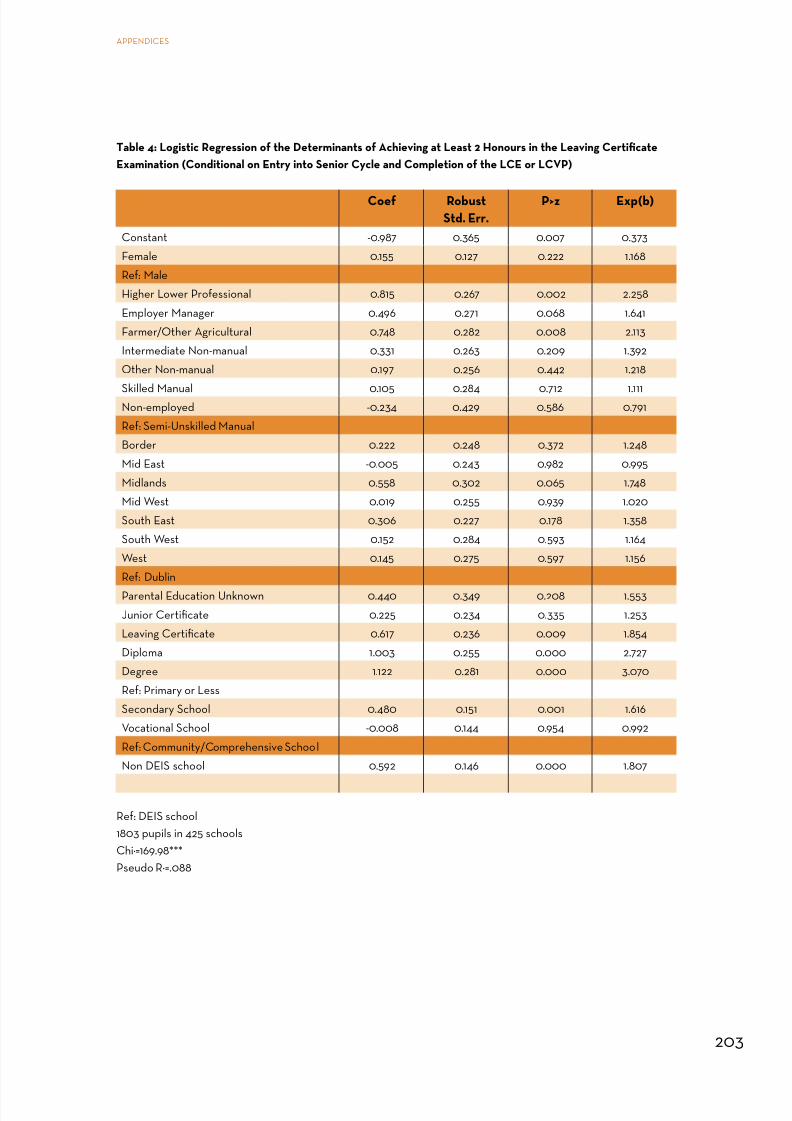
8/4/2019 BKMNEXT146
http://slidepdf.com/reader/full/bkmnext146 217/227
203
APPENDICES
Table 4: Logistic Regression of the Determinants of Achieving at Least 2 Honours in the Leaving Certificate
Examination (Conditional on Entry into Senior Cycle and Completion of the LCE or LCVP)
Coef Robust
Std. Err.
P>z Exp(b)
Constant -0.987 0.365 0.007 0.373
Female 0.155 0.127 0.222 1.168
Ref: Male
Higher Lower Professional 0.815 0.267 0.002 2.258
Employer Manager 0.496 0.271 0.068 1.641
Farmer/Other Agricultural 0.748 0.282 0.008 2.113
Intermediate Non-manual 0.331 0.263 0.209 1.392
Other Non-manual 0.197 0.256 0.442 1.218
Skilled Manual 0.105 0.284 0.712 1.111Non-employed -0.234 0.429 0.586 0.791
Ref: Semi-Unskilled Manual
Border 0.222 0.248 0.372 1.248
Mid East -0.005 0.243 0.982 0.995
Midlands 0.558 0.302 0.065 1.748
Mid West 0.019 0.255 0.939 1.020
South East 0.306 0.227 0.178 1.358
South West 0.152 0.284 0.593 1.164
West 0.145 0.275 0.597 1.156
Ref: Dublin
Parental Education Unknown 0.440 0.349 0.208 1.553
Junior Certificate 0.225 0.234 0.335 1.253
Leaving Certificate 0.617 0.236 0.009 1.854
Diploma 1.003 0.255 0.000 2.727
Degree 1.122 0.281 0.000 3.070
Ref: Primary or Less
Secondary School 0.480 0.151 0.001 1.616
Vocational School -0.008 0.144 0.954 0.992
Ref: Community/Comprehensive School
Non DEIS school 0.592 0.146 0.000 1.807
Ref: DEIS school1803 pupils in 425 schoolsChi²=169.98***Pseudo R²=.088

8/4/2019 BKMNEXT146
http://slidepdf.com/reader/full/bkmnext146 218/227
204
APPENDICES
A3. Multivariate Tables for Participation in Higher Education
Table 5: Logistic Regression of the factors associated with being in Higher Education at the time of the survey
Model 1: All who Completed
Senior Cycle
Model 2: All who Completed
Senior Cycle & Obtained
2+ Honours
Coef. Robust
Std.
Err.
P>z Exp(b) Coef. Std.
Err.
P>z Exp(b)
Constant -2.700 0.398 0.000 0.067 -0.771 0.581 0.185 0.463
Female 0.227 0.130 0.081 1.255 0.155 0.162 0.336 1.168
Ref: Male
Higher Lower Professional 0.811 0.287 0.005 2.250 0.579 0.393 0.140 1.785
Employer Manager 0.793 0.297 0.008 2.210 0.361 0.394 0.360 1.435Farmer 0.741 0.330 0.025 2.099 0.764 0.444 0.085 2.147
Intermediate Non-manual 0.454 0.320 0.156 1.574 0.453 0.398 0.255 1.572
Other Non-manual -0.021 0.288 0.943 0.980 -0.193 0.414 0.642 0.825
Skilled Manual 0.093 0.352 0.791 1.098 0.427 0.508 0.401 1.532
Non-employed -0.557 0.383 0.146 0.573 -0.617 0.567 0.276 0.539
Ref: Semi-Unskilled Manual
Border 0.654 0.182 0.000 1.924 0.448 0.234 0.055 1.565
Mid East 0.366 0.207 0.077 1.441 0.188 0.294 0.522 1.207
Midlands 0.672 0.237 0.005 1.958 0.385 0.301 0.201 1.469
Mid West 0.530 0.205 0.010 1.699 0.765 0.260 0.003 2.150South East 0.612 0.210 0.004 1.844 0.819 0.340 0.016 2.268
South West 0.574 0.247 0.020 1.775 0.505 0.236 0.033 1.657
West 0.426 0.193 0.027 1.531 0.255 0.253 0.315 1.290
Ref: Dublin
Parental Education Unknown 0.372 0.364 0.307 1.450 0.265 0.530 0.617 1.303
Junior Certificate 0.385 0.241 0.110 1.470 -0.056 0.410 0.891 0.946
Leaving Certificate 0.833 0.217 0.000 2.300 0.030 0.365 0.934 1.031
Diploma 0.885 0.242 0.000 2.423 -0.056 0.395 0.887 0.945
Degree 1.363 0.247 0.000 3.907 0.498 0.402 0.216 1.645
Ref: Primary or Less
Secondary School 0.931 0.129 0.000 2.538 0.834 0.172 0.000 2.302
Vocational School -0.143 0.136 0.292 0.866 0.107 0.177 0.543 1.113
Ref: Community/Comprehensive School
Non DEIS school 0.325 0.123 0.008 1.383 0.121 0.167 0.469 1.129
Ref: DEIS school
2267 pupils in 485 schoolsChi²=278.38***Pseudo R²=.1317
1117 pupils in 336 schoolsChi²=75.51***Pseudo R²=.0696

8/4/2019 BKMNEXT146
http://slidepdf.com/reader/full/bkmnext146 219/227
205
APPENDICES
Table 6: Logistic Regression Model of the factors associated with attending a University versus other Higher
Education Institution (Conditional on Entry into Higher Education)
Model 1: All who Completed
Senior Cycle
Model 2: All who Completed
Senior Cycle & Obtained
2+ Honours
Coef. Robust
Std.
Err.
P>z Exp(b) Coef. Robust
Std.
Err.
P>z Exp(b)
Constant -1.298 0.571 0.023 0.273 -0.642 0.639 0.315 0.526
Female 0.128 0.141 0.366 1.136 0.094 0.164 0.568 1.098
Ref: Male
Professional 0.426 0.362 0.239 1.532 0.286 0.450 0.526 1.331
Employer/Manager 0.109 0.375 0.772 1.115 0.150 0.457 0.744 1.161
Farmer/Other Agricultural 0.434 0.369 0.239 1.544 0.191 0.453 0.674 1.210
Intermediate Non-manual 0.362 0.365 0.322 1.436 0.260 0.445 0.559 1.297
Other Non-manual -0.487 0.399 0.222 0.614 -0.440 0.475 0.355 0.644
Skilled Manual 0.402 0.428 0.348 1.495 0.693 0.536 0.196 1.999
Ref: Semi-Unskilled Manual/Non-employed
Border -1.130 0.252 0.000 0.323 -1.454 0.313 0.000 0.234
Mid East -0.207 0.240 0.389 0.813 -0.051 0.289 0.861 0.951
Midlands 0.216 0.285 0.450 1.241 0.283 0.345 0.411 1.328
Mid West -0.041 0.272 0.879 0.960 -0.091 0.293 0.756 0.913
South East -0.553 0.333 0.097 0.575 -0.542 0.357 0.129 0.581South West 0.212 0.218 0.331 1.236 0.241 0.249 0.332 1.272
West -0.369 0.262 0.159 0.691 -0.369 0.312 0.236 0.691
Ref: Dublin
Parental Education Unknown -0.396 0.568 0.485 0.673 -0.647 0.609 0.288 0.524
Junior Certificate 0.088 0.438 0.842 1.092 -0.191 0.473 0.687 0.826
Leaving Certificate 0.596 0.429 0.165 1.815 0.291 0.456 0.523 1.338
Diploma 0.581 0.438 0.185 1.788 0.202 0.474 0.670 1.223
Degree 1.148 0.453 0.011 3.153 0.851 0.496 0.086 2.343
Ref: Primary or Less sec
Secondary 0.319 0.165 0.052 1.376 0.343 0.209 0.101 1.409
Vocational -0.178 0.187 0.341 0.837 -0.230 0.238 0.333 0.794
Ref: Community/Comprehensive
Non DEIS school 0.333 0.181 0.066 1.395 0.272 0.209 0.193 1.313
Ref: DEIS School
1030 pupils in 336 schoolsChi²=130.85***Pseudo R²=.1006
798 pupils in 278 schoolsChi²=107.68***Pseudo R²=.1041
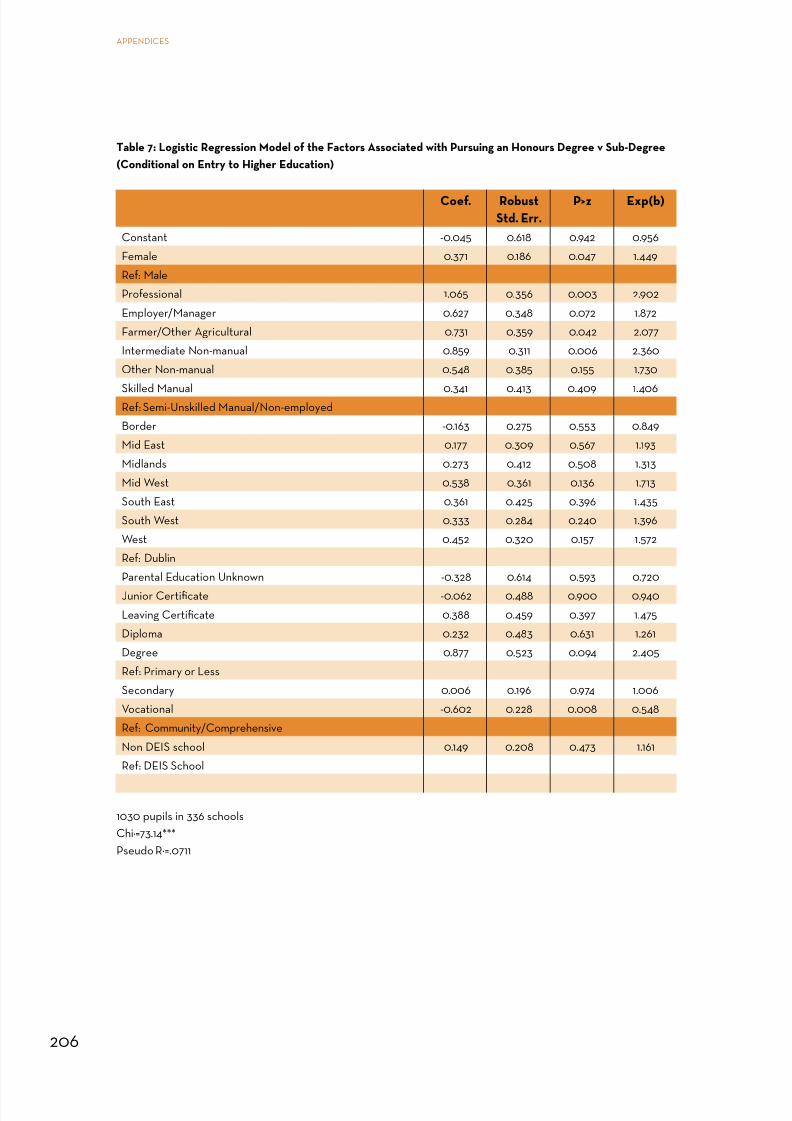
8/4/2019 BKMNEXT146
http://slidepdf.com/reader/full/bkmnext146 220/227
206
APPENDICES
Table 7: Logistic Regression Model of the Factors Associated with Pursuing an Honours Degree v Sub-Degree
(Conditional on Entry to Higher Education)
Coef. Robust
Std. Err.
P>z Exp(b)
Constant -0.045 0.618 0.942 0.956
Female 0.371 0.186 0.047 1.449
Ref: Male
Professional 1.065 0.356 0.003 2.902
Employer/Manager 0.627 0.348 0.072 1.872
Farmer/Other Agricultural 0.731 0.359 0.042 2.077
Intermediate Non-manual 0.859 0.311 0.006 2.360
Other Non-manual 0.548 0.385 0.155 1.730
Skilled Manual 0.341 0.413 0.409 1.406Ref: Semi-Unskilled Manual/Non-employed
Border -0.163 0.275 0.553 0.849
Mid East 0.177 0.309 0.567 1.193
Midlands 0.273 0.412 0.508 1.313
Mid West 0.538 0.361 0.136 1.713
South East 0.361 0.425 0.396 1.435
South West 0.333 0.284 0.240 1.396
West 0.452 0.320 0.157 1.572
Ref: Dublin
Parental Education Unknown -0.328 0.614 0.593 0.720
Junior Certificate -0.062 0.488 0.900 0.940
Leaving Certificate 0.388 0.459 0.397 1.475
Diploma 0.232 0.483 0.631 1.261
Degree 0.877 0.523 0.094 2.405
Ref: Primary or Less
Secondary 0.006 0.196 0.974 1.006
Vocational -0.602 0.228 0.008 0.548
Ref: Community/Comprehensive
Non DEIS school 0.149 0.208 0.473 1.161
Ref: DEIS School
1030 pupils in 336 schoolsChi²=73.14***Pseudo R²=.0711

8/4/2019 BKMNEXT146
http://slidepdf.com/reader/full/bkmnext146 221/227
207
APPENDICES
Table 7a: Logistic Regression Model of the factors associated with Pursuing an Honours Degree v Sub-Degree
(Conditional on Entry into Higher Education)
Coef. Robust
Std. Err.
P>z Exp(b)
Constant 0.257 0.340 0.449 1.294
Female 0.406 0.193 0.036 1.500
Ref: Male
Higher Lower Professional 1.656 0.362 0.000 5.236
Employer/Manager 1.106 0.393 0.005 3.023
Farmer/Other Agri 0.940 0.409 0.021 2.561
Intermediate Non-manual 1.212 0.380 0.001 3.360
Other Non-manual 0.506 0.394 0.200 1.658
Skilled Manual 0.376 0.446 0.399 1.456Non-employed 0.312 0.687 0.649 1.367
Ref: Semi-Unskilled Manual
Table 7b: Logistic Regression Model of the factors associated with Pursuing an Honours Degree v Sub-Degree
(Conditional on Entry into Higher Education)
Coef. Robust
Std. Err.
P>z Exp(b)
Constant 0.482 0.252 0.056 1.619
Female 0.425 0.190 0.025 1.530
Ref: Male
Professional/Employer/Manager 1.261 0.265 0.000 3.528
Farmer 0.708 0.318 0.026 2.029
Intermediate Non-manual 0.977 0.280 0.000 2.658
Other Non-manual 0.269 0.298 0.367 1.309
Non-employed 0.075 0.636 0.906 1.078
Ref: Skilled, Semi-Unskilled Manual

8/4/2019 BKMNEXT146
http://slidepdf.com/reader/full/bkmnext146 222/227
208
APPENDICES
Table 8: Logistic Regression Model of the Factors Associated with Receiving a Grant (Conditional on Entry into
Higher Education)
Coef. Robust
Std. Err.
P>z Exp(b)
Constant 1.566 0.588 0.008 4.789
Female -0.020 0.148 0.890 0.980
Ref: Male
Professional -1.402 0.381 0.000 0.246
Employer/Manager -1.435 0.402 0.000 0.238
Farmer/Other Agricultural -0.684 0.382 0.073 0.505
Intermediate Non-manual -0.946 0.340 0.005 0.388
Other Non-manual -0.253 0.336 0.451 0.776
Skilled Manual -0.168 0.433 0.697 0.845Ref: Semi-Unskilled Manual/Non-employed
Border 0.720 0.264 0.006 2.054
Mid East -0.352 0.335 0.293 0.703
Midlands 0.675 0.346 0.051 1.965
Mid West 0.560 0.298 0.060 1.750
South East 0.626 0.291 0.032 1.869
South West 0.776 0.273 0.005 2.173
West 1.305 0.279 0.000 3.688
Ref: Dublin
Parental Education Unknown -1.515 0.560 0.007 0.220
Junior Certificate -1.063 0.462 0.021 0.345
Leaving Certificate -1.301 0.468 0.005 0.272
Diploma -1.468 0.482 0.002 0.230
Degree -2.207 0.507 0.000 0.110
Ref: Primary or Less
Secondary -0.335 0.182 0.065 0.715
Vocational -0.021 0.222 0.925 0.979
Ref: Community/Comprehensive
Non DEIS school -0.223 0.185 0.228 0.800
Ref: DEIS School
1030 pupils in 336 schoolsChi²=179.38***Pseudo R²=.1583

8/4/2019 BKMNEXT146
http://slidepdf.com/reader/full/bkmnext146 223/227
209
APPENDICES
Table 9: Logistic Regression Model of the probability of participating in a PLC course versus not (all those who
completed LCE and LCVP)
Model 1: Model 2:
Coef. Robust
Std.
Err.
P>z Exp(b) Coef. Robust
Std.
Err.
P>z Exp(b)
Constant -0.731 0.363 0.044 0.481 -0.791 0.387 0.041 0.453
Female 1.216 0.16 0 3.373 1.438 0.156 0 4.213
Ref: Male
Professional/Employer/Manager
-0.426 0.222 0.055 0.653 -0.206 0.249 0.408 0.814
Farmer -0.745 0.24 0.002 0.475 -0.488 0.269 0.069 0.614
Intermediate Non-manual -0.217 0.197 0.269 0.805 -0.117 0.218 0.593 0.89
Other Non-manual 0.201 0.222 0.366 1.222 0.341 0.254 0.179 1.407
Non-employed -0.212 0.425 0.618 0.809 -0.38 0.431 0.378 0.684
Ref: Skilled, Semi-UnskilledManual
Border -1.136 0.437 0.009 0.321 -1.132 0.414 0.006 0.323
Mid East -0.683 0.385 0.076 0.505 -0.659 0.38 0.083 0.518
Midlands -0.433 0.551 0.432 0.649 -0.022 0.516 0.967 0.979
Mid West -0.538 0.462 0.244 0.584 -0.312 0.445 0.484 0.732
South East -0.751 0.453 0.097 0.472 -0.687 0.444 0.122 0.503
South West -0.136 0.52 0.794 0.873 0.047 0.471 0.92 1.048
West -0.302 0.555 0.586 0.739 -0.114 0.521 0.827 0.892Ref: Dublin
Parental EducationUnknown
-0.175 0.369 0.635 0.839 0.08 0.376 0.831 1.083
Junior Certificate -0.042 0.246 0.864 0.959 0.115 0.27 0.67 1.122
Leaving Certificate -0.025 0.244 0.918 0.975 0.299 0.274 0.277 1.348
Diploma 0.045 0.314 0.887 1.046 0.536 0.35 0.126 1.709
Degree -0.355 0.31 0.252 0.701 0.386 0.35 0.269 1.472
Ref: Primary or Less
Secondary -3.372 0.376 0 0.034 -3.192 0.364 0 0.041
Vocational 0.969 0.272 0 2.634 1.065 0.27 0 2.902
Ref: Community/Comprehensive
Non DEIS school 0.108 0.285 0.703 1.115 0.276 0.284 0.33 1.318
Ref: DEIS School
LC 5+ passes -0.368 0.193 0.057 0.692
LC 1 Honour -0.056 0.252 0.823 0.945
LC 2-5 Honours -1.008 0.197 0 0.365
LC 5+ Honours -3.216 0.332 0 0.04
2047 pupils in 459 schoolsChi²=293.57***
Pseudo R²=.3390
2047 pupils in 459 schoolsChi²=365.17***
Pseudo R²=.4254

8/4/2019 BKMNEXT146
http://slidepdf.com/reader/full/bkmnext146 224/227
210
APPENDICES
Table 10: Logistic Regression Model of the factors associated with participating in an Apprenticeship
Model 1 Model 2
Coef. Robust
Std.
Err.
P>z exp(b) Coef. Robust
Std.
Err.
P>z exp(b)
Constant -1.848 0.542 0.001 0.157 -2.073 0.669 0.002 0.126
Professional/Employer/Manager -0.884 0.422 0.036 0.413 -0.656 0.441 0.136 0.519
Farmer -1.047 0.573 0.068 0.351 -0.862 0.595 0.147 0.422
Intermediate Non-manual -0.526 0.379 0.165 0.591 -0.475 0.404 0.240 0.622
Other Non-manual 0.086 0.362 0.811 1.090 0.161 0.391 0.680 1.175
Non-employed -0.971 1.058 0.358 0.379 -0.774 0.998 0.438 0.461
Ref: Skilled, Semi-Unskilled Manual
Border 0.142 0.501 0.777 1.152 0.085 0.507 0.867 1.088
Mid East -0.257 0.558 0.645 0.773 -0.245 0.579 0.672 0.783
Mid Lands 1.641 0.474 0.001 5.158 1.847 0.488 0.000 6.339
Mid West 1.097 0.500 0.028 2.995 1.200 0.485 0.013 3.321
South East -0.039 0.544 0.943 0.962 -0.017 0.540 0.975 0.983
South West 0.465 0.451 0.303 1.592 0.580 0.459 0.207 1.786
West 0.061 0.500 0.904 1.062 0.024 0.504 0.961 1.025
Ref: Dublin
Parental Education Unknown -0.758 0.771 0.326 0.469 -0.704 0.794 0.375 0.495
Junior Certificate 0.245 0.500 0.625 1.277 0.272 0.520 0.600 1.313
Leaving Certificate 0.107 0.527 0.840 1.112 0.221 0.543 0.684 1.248
Diploma 0.023 0.535 0.965 1.024 0.136 0.557 0.806 1.146Degree -1.221 0.644 0.058 0.295 -0.951 0.674 0.158 0.386
Ref: Primary or Less
Secondary -0.227 0.310 0.463 0.797 -0.071 0.307 0.816 0.931
Vocational 0.195 0.296 0.511 1.215 0.183 0.297 0.538 1.201
Ref: Community/Comprehensive
Non DEIS 0.070 0.276 0.800 1.073 0.181 0.289 0.530 1.199
Ref: DEIS
LC 5+ passes 0.376 0.342 0.272 1.456
LC 1 Honour -0.374 0.496 0.451 0.688
LC 2-5 Honours -0.013 0.330 0.968 0.987LC 5+ Honours -2.072 0.585 0.000 0.126
Ref: LC less 5 passes
901 pupils in 299 schoolsChi²=63.06***Pseudo R²=.1046
901 pupils in 299 schoolsChi²=107.78***Pseudo R²=.1534

8/4/2019 BKMNEXT146
http://slidepdf.com/reader/full/bkmnext146 225/227
211
APPENDICES
Table 11: Logistic Regression Model of the factors associated with participating in a State Sponsored Training
Programme
Model 1 Model 2
Coef. Robust
Std.
Err.
P>z Exp(b) Coef. Robust
z
P>z Exp(b)
Constant -1.585 0.458 0.001 0.205 -1.354 0.452 0.003 0.258
Female -0.514 0.229 0.025 0.598 -0.449 0.239 0.060 0.639
Ref: Male
Professional/Employer/Manager -0.938 0.436 0.031 0.391 -0.794 0.441 0.072 0.452
Farmer 0.279 0.422 0.509 1.322 0.479 0.428 0.263 1.615
Intermediate Non-manual -0.034 0.380 0.928 0.966 0.025 0.376 0.947 1.025
Other Non-manual -0.108 0.373 0.772 0.898 -0.096 0.376 0.799 0.909
Non-employed 1.085 0.538 0.044 2.960 1.088 0.527 0.039 2.960
Ref: Skilled, Semi-Unskilled Manual
Border -0.280 0.362 0.439 0.756 -0.167 0.361 0.644 0.846
Mid East -0.747 0.466 0.109 0.474 -0.664 0.460 0.148 0.515
Mid Lands -0.778 0.628 0.215 0.459 -0.575 0.670 0.390 0.563
Mid West -0.271 0.373 0.468 0.763 -0.157 0.378 0.677 0.854
South East -0.391 0.410 0.341 0.677 -0.310 0.420 0.460 0.733
South West -1.029 0.326 0.002 0.358 -0.970 0.312 0.002 0.379
West -0.264 0.397 0.506 0.768 -0.174 0.363 0.632 0.840
Ref: DublinParental Education Unknown -0.894 0.660 0.175 0.409 -0.873 0.664 0.189 0.418
Junior Certificate -0.321 0.411 0.435 0.726 -0.299 0.420 0.476 0.741
Leaving Certificate -0.815 0.372 0.028 0.443 -0.706 0.375 0.060 0.494
Diploma -0.391 0.438 0.373 0.677 -0.153 0.429 0.722 0.858
Degree -0.682 0.541 0.207 0.506 -0.244 0.545 0.654 0.783
Ref: Primary or Less
Secondary -0.298 0.295 0.314 0.743 -0.086 0.308 0.780 0.918
Vocational 0.601 0.251 0.017 1.824 0.550 0.260 0.035 1.732
Ref: Community/Comprehensive
Non DEIS -0.340 0.235 0.148 0.712 -0.197 0.243 0.417 0.821
Ref: DEIS
LC 5+ passes -0.385 0.315 0.222 0.681
LC 1 Honour -0.463 0.398 0.244 0.629
LC 2-5 Honours -0.935 0.329 0.004 0.392
LC 5+ Honours -2.933 0.764 0.000 0.053
Ref: LC less 5 passes
2048 pupils in 458 schoolsChi²=81.48***Pseudo R²=.0791
2048 pupils in 458 schoolsChi²=91.95***Pseudo R²=.1245

8/4/2019 BKMNEXT146
http://slidepdf.com/reader/full/bkmnext146 226/227

8/4/2019 BKMNEXT146
http://slidepdf.com/reader/full/bkmnext146 227/227