Black Carbon 101 for Air Quality Managers Webinar June 21, 2012 Presenters: Benjamin DeAngelo, Office of Atmospheric Programs Neil Frank, Office of Air Quality Planning & Standards Michael Geller, Office of Transportation and Air Quality Erika Sasser, Office of Air Quality Planning & Standards Joseph Somers, Office of Transportation and Air Quality
Transcript
Black Carbon 101 for Air Quality
Managers
Webinar June 21, 2012
Presenters: Benjamin DeAngelo, Office of Atmospheric ProgramsNeil Frank, Office of Air Quality Planning & StandardsMichael Geller, Office of Transportation and Air QualityErika Sasser, Office of Air Quality Planning & StandardsJoseph Somers, Office of Transportation and Air Quality
2
• In October 2009, Congress requested that EPA conduct a comprehensive study on black carbon to evaluate domestic and international sources, and climate/health impacts.
• EPA completed this report on March 30, 2012.
• Available online at: www.epa.gov/blackcarbon.
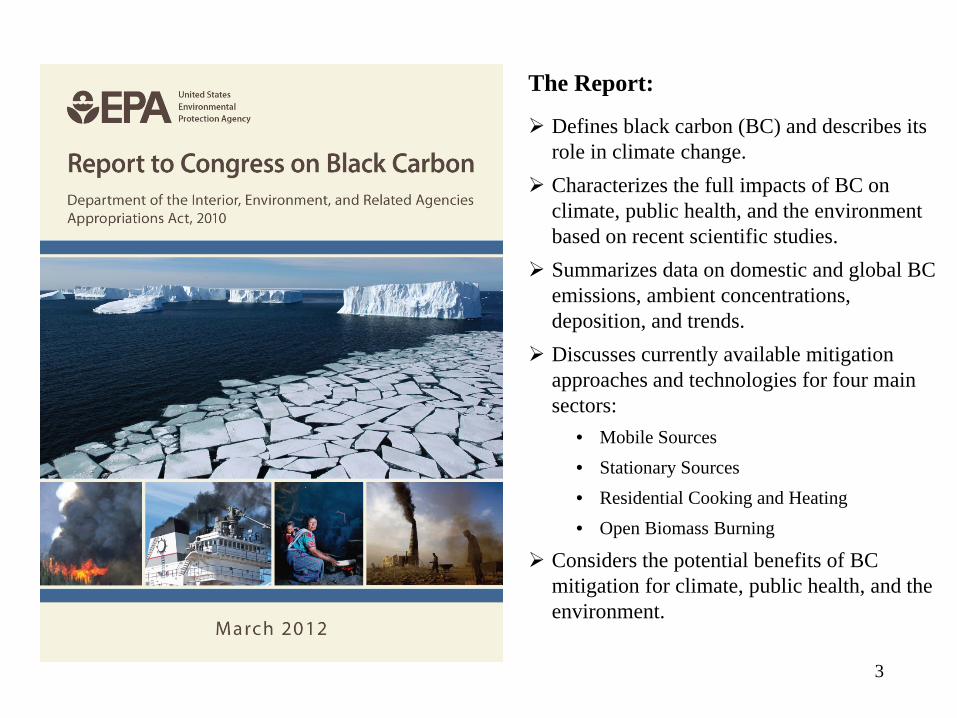
Background: EPA’s Report to Congress on Black Carbon
Defines black carbon (BC) and describes its role in climate change.Characterizes the full impacts of BC on climate, public health, and the environment based on recent scientific studies.Summarizes data on domestic and global BC emissions, ambient concentrations, deposition, and trends.Discusses currently available mitigation approaches and technologies for four main sectors:
• Mobile Sources• Stationary Sources• Residential Cooking and Heating• Open Biomass Burning
Considers the potential benefits of BC mitigation for climate, public health, and the environment.
3
Today’s Webinar:
• Focus will be on black carbon in the U.S. air quality management framework.
• Key Topics:– Climate impacts of black carbon
– Emissions and ambient measurements of black carbon in the U.S. (including trends)
– Black carbon mitigation options and public health co-benefits
– Special emphasis on U.S. mobile source programs: new engine standards and retrofits
Summary of Key Messages from Today’s Presentation
Black carbon emissions affect the Earth in a number of significant ways.
Targeted reductions in black carbon (BC) emissions can provide significant near-term climate benefits, and the health and environmental co-benefits are very large.
Effective control technologies and approaches are available to reduce BC emissions from a number of key source categories.
5
Source: Reuters
U.S. BC emissions have been declining, and additional reductions are expected by 2030 due to controls on mobile diesel engines.
Measurements indicate that ambient BC has declined and PM2.5 air quality has improved due to these emissions reductions.
Controlling direct PM2.5 emissions from sources can be a highly effective air quality management strategy, with major public health benefits.
What is Black Carbon?• Black Carbon (BC) is a solid form of mostly pure
carbon absorbs solar radiation (light) at all wavelengths. It is formed by incomplete combustion of fossil fuels, biofuels, or biomass.
• BC is one of the types of particles which constitute particulate matter (PM), and is one of the key components of soot.
7
• BC is co-emitted with other particles and gases with diverse climate impacts.
• BC has several effects on the climate, including:– Directly absorbing light (contributing to warming)– Changing the brightness of snow and ice
(contributing to warming)– Affecting cloud formation and lifetime (with both
a cooling and warming effect)– Contributing to surface dimming and changes in
precipitation patterns
Ambient Atmospheric BC• Ambient BC is the most strongly light-
absorbing component of PM.
• Quantities of BC have a significant effect on local RF.
• Unlike long-lived greenhouse gases, BC has a limited atmospheric lifetime (on the order of days).
• BC does not become well mixed, and its effects are not easy to aggregate to the global scale.
• BC in the atmosphere can also contribute to surface dimming in the form of Atmospheric Brown Clouds.
8
Black Carbon Deposition Affects Surface Albedo
9
• BC deposition on snow and ice darkens the surface, and increases absorption of solar energy.
• Snow and ice in sensitive regions like the arctic and the Himalayas are especially at risk from BC deposition.
• BC in snow and ice may be more effective than well-mixed GHGs in warming the atmosphere:‐ Energy absorbed by BC in snow and ice goes directly into melting rather than dissipating
throughout the atmosphere‐ BC may persist at the surface, contributing to longer-term warming, or‐ Snow and ice may melt, leaving behind a darker surface (such as rock or ocean)
Sour
ce: A
MA
P, 2
011
Indirect and Semi-Direct Effects on Clouds:Black Carbon’s effects on clouds are many, but understanding is low
• BC particles can lead to the formation of more, smaller water droplets in clouds.– Smaller droplets make clouds more reflective, producing a cooling effect.– Smaller droplets can also delay precipitation, increasing cloud lifetime, and extending
the cooling effect.
• Smaller droplets in mixed-phase (clouds with liquid and ice droplets) can delay freezing, with uncertain implications for warming.
• BC in clouds can also contribute to cloud instability by absorbing solar radiation, and warming the cloud. This is called the “semi-direct” effect, and has uncertainimplications for warming.
• BC in super-cooled liquid clouds can accelerate precipitation by acting as a nucleus for crystal formation, thereby shortening the lifespan of a cloud, and contributing to warming.
10
Atmospheric Brown Clouds and Precipitation
• In high concentrations, and when combined with other pollutants, BC can form Atmospheric Brown Clouds (ABCs).
• BC in ABCs can contribute to surface dimming by absorbing and scattering incoming radiation.
• ABCs have been linked to a decrease in vertical mixing, which exacerbates air pollution episodes.
• ABCs may contribute to changes in precipitation patterns, including a slowing of the monsoon circulation over the Indian Ocean.
11
Net Radiative Forcing for BC is Still Highly Uncertain
• IPCC (2007) used an estimate of 0.34 Wm-2 for direct BC RF, and estimated an additional 0.1 Wm-2 RF for snow and ice deposition.
• The IPCC estimate does not account for indirect and semi-direct cloud forcing.
• Recent studies have suggested greater possible warming for the direct effect.
• Several recent studies have suggested a lower RF for snow and ice effects.
• Total BC RF is still dominated by uncertainty about potentially significant indirect effects on clouds.
12
Part 2:Understanding BC Emissions,
Measurements and Observational Data
Neil Frank, OAQPS
13
14
~ 8.4 Million Tons
In the US, there is estimated, in 2005, to be about 0.64 tons of BC emitted by all sources.
Globally, about 8.4 million tons of BC is emitted.Distribution of sources in US is different than globally for BC.In the US, BC emissions, generally, are derived from PM2.5 emission
inventories, via use of speciation factors.
Black Carbon Emissions - Global versus U.S.
15
OC always co-emitted with BC, must be considered in any control and/or mitigation scenarios.
Most of OC comes from burning, and is considered to be reflective (cooling).How much of OC is light-absorbing (warming BrC)?
Organic Carbon Emissions - Global versus U.S.
16
Mobile sources are the only category for which there is more BC than OC estimated to be emitted. This is largely due to the composition of diesel emissions. The OC:BC ratio is one of the indicators for climate mitigation purposes.
Open biomass burning has significant BC emissions, but a lot more OC emissions. Nationally, in the US, about 12% of PM2.5 emissions is estimated to be BC.
About 30% is co-emitted OC.
Ratio of OC to BC Varies by Emission Source Category
17
Mobile source BC dominated by diesels (~ 90% of total contribution).
As diesels become more controlled, % of other sources will grow in future.
Biomass burning BC dominated by prescribed and wild fires.
AK wildfires particularly important in “bad” years, and even more important considering proximity to arctic areas.
RWC and other sources small contributors.
Light Absorbing Carbon(LAC)
British Smoke(BS)
Black Carbon & its Confusing Terminology
TOTTOR
18
19
Light Absorbing Carbon
Black Carbon
Elemental Carbon
(Black Smoke Shade)
Brown Carbon
Light Absorbing Aerosols
Organic Carbon
British Smoke
Crustal ElementsFe
OpticalMethods
ThermalAnalysis(ThermalOpticalAnalysis)
XRF
SootBlack CarbonGeneric Terms
Measurement Method Terms
Dust (Soil), incl. Fe
THE NAME GAME
20
From the Report to Congress…
• BC is a component of PM2.5and the most efficient absorber per unit mass.
• BrC is part of OC.
• Soot component of PM2.5 is mostly BC and OC.
The Terms “BC” and “EC”Relate to the Common Indicator Measurements of Black Carbon
Note: “Bca”, “Eca” and “Oca” denote their “apparent” values derived thru the measurements 21
Recent Studies show that BC and EC are highly correlated & the ratio of BC to EC typically range from 0.7 – 1.3
70% of Studies
22
The Global Observational Data Base
23
Black Carbon Observational Data in the USare mostly from CSN and IMPROVE(ECa)
and Aethalometer (BCa)
24
BC Concentrations are:• Similar in the US and Europe• Much higher in China
Urban BC concentrations are generally higher than concentrations in surrounding rural areas
Spatial Distribution of Global BC (2005-07)
25
With dense urban monitoring, New sources of BC can be identified
26
BC is a small component of PM2.56-11% of mass in 15 selected urban areas, 2008-10
27Note: Similar figure (Figure 5-6) in Report to Congress represented data from 2005-2007
Assumptions: “Soot OM” = ~1.4 * BCTotal POC would be > BC from RWC and Biomass Combustion, e.g in the NW
Directly Emitted Soot in PM2.5 (an initial estimate)~ 14-28% of PM2.5 mass, 2008-10
SOOT 28
DRAFT – This has not been peer reviewed
Assumptions: “Soot OM” = ~1.4 * BCTotal POC would be > BC from RWC and Biomass Combustion, e.g in the NW
Directly Emitted BC vs. “Soot” in Ambient PM2.5
BC / SOOT 29
DRAFT – This has not been peer reviewed
“SOOT”~ 14-28% of PM2.5 mass
BC6-11% of PM2.5 mass
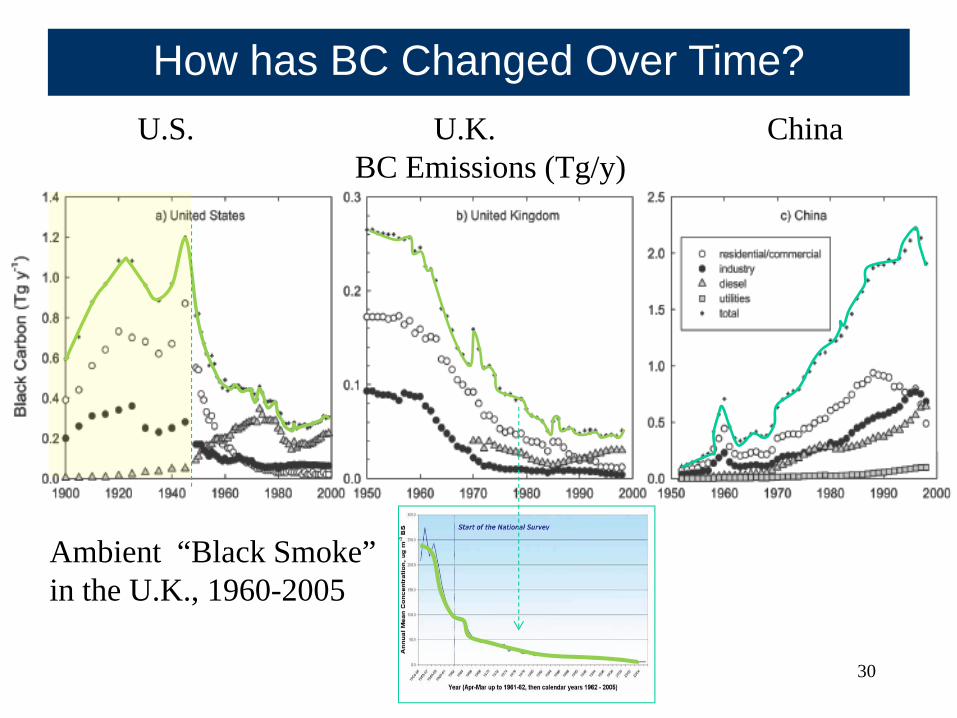
Ambient “Black Smoke”in the U.K., 1960-2005
U.S. U.K. ChinaBC Emissions (Tg/y)
How has BC Changed Over Time?
30
What was the U.S. Trend in Ambient BC?
Washington DC (1989-1999)
Boston (MA), 2000-2010Bay Area (CA)1967–2003
Rural Areas (IMPROVE, 1990-2004)
31
Potential Issues with existing Aethalometer BC(a filter-based optical measurement)
• Known artifacts due to “optical saturation effect”.
• EPA has funded a study to examine existing Aethalometer data in the US (Jay Turner, George Allen and STI).
• Preliminary results show that adjustments may be needed to best describe ambient concentrations.
• Magnitude of the “spot loading correction” depends on operational parameters.
• The adjustments (e.g. increase winter-time levels) can alter seasonality and potentially change the trend.
• A report will be forthcoming.32
A Fresh filter tape produces higher BC
Note: the newest generation Aethalometer may not have this issue
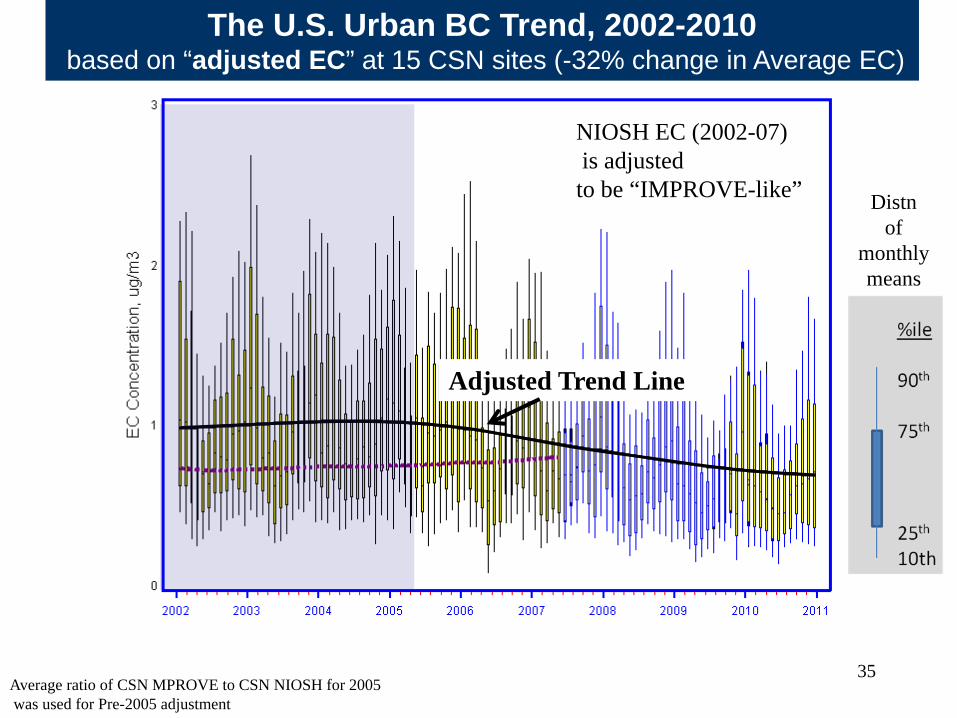
Urban Black Carbon, based on EC measurementsfrom CSN data as reported to EPA (15 sites)
EC as measured(NIOSH-type protocol)
33
EC as measured(IMPROVE protocol) Distn
of monthly means
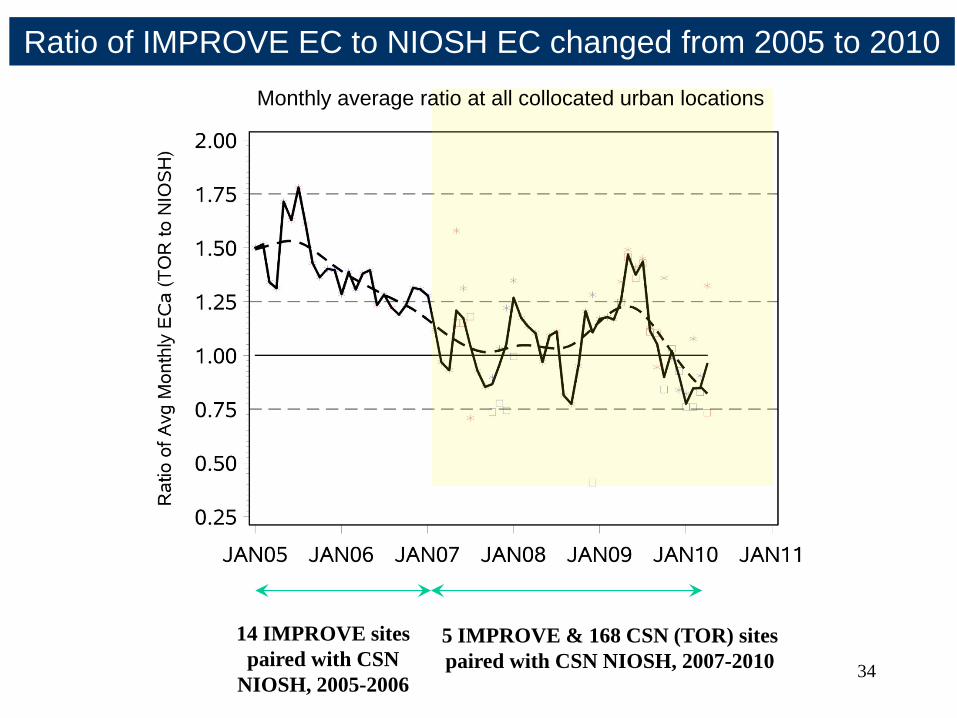
CSN’s Carbon measurement protocol changed after 2007(new IMPROVE like samplers and IMPROVE analytical protocol)
Ratio of IMPROVE EC to NIOSH EC changed from 2005 to 2010
34
Monthly average ratio at all collocated urban locations
NIOSH EC (2002-07)is adjusted to be “IMPROVE-like”
The U.S. Urban BC Trend, 2002-2010based on “adjusted EC” at 15 CSN sites (-32% change in Average EC)
Average ratio of CSN MPROVE to CSN NIOSH for 2005was used for Pre-2005 adjustment
35
Distnof
monthly means
Adjusted Trend Line
Lessons Learned
• “Optical BC” and “Thermal EC” measurements can both describe ambient Black Carbon (and Soot)– Data harmonization and or adjustments can be helpful
• While BC, as measured, is a small component of PM2.5, directly emitted soot may be ~2.5x larger
• More measurements both in the US and globally would be helpful to better characterize the spatial distribution of BC and its emission sources, particularly within urban areas
• Ambient BC has declined and PM2.5 air quality has improved as result of soot emission reductions; more to come.
36
Part 3:Black Carbon Mitigation
Erika Sasser, OAQPS
Benefits of BC Mitigation
Targeted strategies to reduce BC emissions can be expected to provide climate benefits within the next several decades, and may be particularly important for sensitive regions such as the Arctic.
Reductions in BC and GHGs are complementary strategies for mitigating climate change.
BC is reduced via controls on direct PM2.5 emissions, and the health and environmental co-benefits of these reductions are substantial.
38
Health Benefits of Reducing BC
Health effects associated with BC are consistent with those associated with PM2.5.
Includes respiratory and cardiovascular effects and premature death.
Emissions and ambient concentrations of directly emitted PM2.5 are often highest in urban areas, where large numbers of people live.
Average public health benefits of reducing directly emitted PM2.5 in the U.S. are estimated to range from $290,000 to $1.2 million per ton PM2.5in 2030.
Globally, BC mitigation measures could potentially lead to hundreds of thousands of avoided premature deaths each year. 39
Mitigating BC: Key Considerations
Available control technologies can reduce BC, generally by improving combustion and/or controlling direct PM2.5 emissions from sources. Historically, fuel switching has also been critical.
For both climate and health, it is important to consider the location and timing of emissions and to account for co-emissions.
Some state and local areas in the U.S. have already identified direct PM2.5 controls as particularly effective strategies for meeting air quality goals (e.g., California).
Though costs vary, many reductions can be achieved at reasonable costs.
Controls applied to reduce BC will help reduce total PM2.5 and other co-pollutants.
• U.S. BC emissions have declined more than 70% since the early 1900s (due to controls on industrial and mobile sources, improvements in technology and broader deployment of cleaner fuels such as natural gas).
• The U.S. will achieve substantial additional BC emissions reductions by 2030, largely due to controls on new mobile diesel engines (see Part 4 of this presentation).
• Other U.S. source categories have more limited mitigation potential due to smaller remaining emissions in these categories, or limits on the availability of effective BC control strategies.
42
Stationary Sources
Regulations limit direct PM emissions (including BC) from more than 40 categories of industrial sources in the U.S., including coke ovens, cement plants, industrial boilers, and stationary diesel engines.
Available control technologies and strategies include:
• Use of cleaner fuels.
• Direct PM2.5 reduction technologies (e.g. fabric filters (baghouses), electrostatic precipitators (ESPs), and diesel particulate filters (DPFs)).
• The control technologies range in cost-effectiveness from $48/ton PM2.5to $685/ton PM2.5 (2010$) or more, depending on the source category. However, they also may involve tens of millions in initial capital costs.
43
Residential Heating and Cooking
Emissions from residential wood combustion are currently being evaluated as part of EPA’s ongoing review of emissions standards (NSPS) for residential wood heaters, including hydronic heaters, woodstoves, and furnaces.
Mitigation options include replacing or retrofitting existing units, or switching to alternative fuels such as natural gas.
• New EPA-certified wood stoves have a cost-effectiveness of about $3,600/ton PM2.5 reduced, while gas fireplace inserts average $1,800/ton PM2.5reduced (2010$).
44
Open Biomass Burning
Open biomass burning is the largest source of BC emissions globally, although large percentage is due to wildfire (e.g., U.S. Alaskan fires).
PM2.5 emissions reductions techniques (e.g., smoke management programs) may help reduce BC emissions.
Appropriate mitigation measures depend on the timing and location of burning, resource management objectives, vegetation type, and available resources.
Expanded wildfire prevention efforts may help to reduce BC emissions worldwide.
45
Part 4:Mobile Sources:
Impact of New Engine Standards on Mobile Source BC Emissions
Joe Somers, OTAQ
47
Mobile Sources
• U.S. mobile source BC comes mainly from diesels
• Gasoline exhaust is a smaller source of BC
U.S. Black Carbon Emissions from all Mobile Source Categories, 2005(total 333,400 tons)
Reducing BC from Mobile Sources
BC emissions from U.S. mobile diesel engines controlled via: • Emissions standards for new engines, including requirements resulting in
use of diesel particulate filters (DPFs) in conjunction with ultra low sulfur diesel fuel.
• Standards are for PM and are “technology forcing.”
• Reductions estimated from emissions models used in regulatory packages• On road BC, OC, PM inventory from MOVES• Nonroad BC inventory from PM for NONROAD model• Locomotive, commercial marine, and aircraft emissions estimated separately from
models
• Retrofit programs for in-use mobile diesel engines, such as EPA’s National Clean Diesel Campaign and the SmartWay Transport Partnership Program.
EPA presently has minimal standards for gasoline PM; however, EPA VOC/other standards do reduce gasoline PM
48
• On road diesel PM standards – 2007 model year– 99% reduction in diesel PM for 2012 diesel track compared to a 1970 pre-control
diesel truck– On road diesel PM and BC reduced by 91% and 95% respectively from 2005-2030– Diesel particulate filters preferentially reduce BC– Earlier diesel PM standards also reduced BC– Fleet turnover needed to achieve full PM/BC reductions
• Similar standards for nonroad diesels starting in 2012• Similar standards for locomotives and commercial marine (categories 1 and 2
but not ocean going)• EPA has estimated the cost of controlling PM2.5 from new diesel engines at ~
$14,000/ton (2010$).• Similar diesel controls being phased in internationally• Gasoline PM is also reduced in future years
49
U.S. EPA Diesel Standards
Projected Decline in BC Emissions from Mobile Sources
Total U.S. mobile source BC emissions are projected to decline by 86% by 2030 due to regulations already promulgated.
Emissions from U.S. Mobile Sources 50
51
Mobile Source Emissions Reductions 1990-2030
Part 5:Reducing BC Emissions from
In-Use Mobile Sources
Mike Geller, OTAQ
In-Use Diesel Programs
• The tightest standards on new diesel engines can not clean up the existing fleet
• Goal: reduce emissions from the legacy fleet of 11 million diesel engines
• National Clean Diesel Campaign components:
– Diesel Emissions Reduction Program (DERA): Install exhaust control devices
– SmartWay Transport Program: Promote fuel saving technologies; less fuel = emissions reductions
53
54
Technology Verification
• Cost-effective verified and certified clean diesel strategies – Maximize public health benefits
– Provide immediate, quantifiable emissions reductions
• Must be very carefully matched to the vehicle and engine by vendor
• Require monitoring of temperature and backpressure
• Engine and vehicle maintenance critical
• Require occasional cleaning for ash
55
56
Engine Upgrades
• Diesel engines designed for multiple rebuilds• Older engines can be fitted with newer components • Fuel economy can be improved• NOx and PM lowered• Verified kits in US reduce PM and NOx 25% or
more for specific engines• Could enable exhaust technologies.
• Under the Energy Policy Act (EPAct 2005) the Diesel Emission Reduction Program was appropriated funds from 2008-2012
• DERA was reauthorized in January, 2011 for FY 2012 – FY 2016
• Accomplishments to date– National
• EPA has awarded over 500 grants across the U.S. totaling over $500 Million
– State• DERA funds have provided States with $165 Million for clean diesel projects in All 50 States,
plus D.C. and the 5 island territories
• 2012 Funding– State Allocation Program
• $9 Million available for new State grants• Changes under the reauthorization now allow States to fund local and state mandated projects
– National Competition-$20 Million (closed June 4)• 93 applications were received requesting $7 for every $1 available
Diesel Emission Reduction Act Highlights
57
DERA Benefits• Emissions Reduced
– EPA estimated these projects have reduced well over 7,000 tons of PM, 150,000 tons of NOx and 1,465,000 tons of CO2
• Health benefits– Annual public health benefits of up to $4 Billion
– For every dollar invested in reducing diesel exhaust, a community may achieve an estimated 13 dollars in public health benefits
• Job Creation– DERA ARRA funded projects are estimated to have created or
retained more than 3,000 clean diesel related jobs, as reported by the grant recipients.
58
Thank You!
59
This concludes today’s presentation.
Questions? Please type them into the question box on your screen.
For additional information, please contact today’s presenters:Ben DeAngelo ([email protected])