20
Black Lake Black Lake Sub Sub - - basin Assessment and TMDL basin Assessment and TMDL Watershed Advisory Group Watershed Advisory Group Meeting Meeting August 27, 2009 August 27, 2009

Black Lake Black Lake SubSub--basin Assessment and TMDLbasin Assessment and TMDL
Watershed Advisory Group Watershed Advisory Group MeetingMeeting
August 27, 2009August 27, 2009

SubSub--Basin AssessmentBasin Assessment
•• Determine the degree of designated beneficial Determine the degree of designated beneficial use support of the water body (assess use support of the water body (assess attainment of water quality standards).attainment of water quality standards).
•• Determine the degree of achievement of Determine the degree of achievement of biological integrity.biological integrity.
•• Compile descriptive information about the water Compile descriptive information about the water body, particularly the identity and location of body, particularly the identity and location of pollutant sources.pollutant sources.
•• Determine the causes and extent of the Determine the causes and extent of the impairment when water bodies are not attaining impairment when water bodies are not attaining water quality standards.water quality standards.

MorphometryMorphometry of Black Lakeof Black LakeCharacteristicCharacteristic ValueValue
MorphometryMorphometry
ElevationElevation 647.1m647.1m
Area of Watershed or Area of Watershed or DrainageDrainage
16.06 miles16.06 miles22 (10,282 acres)(10,282 acres)
Surface AreaSurface Area 0.54 miles0.54 miles22 (347 acres)(347 acres)
Average DepthAverage Depth 4.3 m (14.1 feet)4.3 m (14.1 feet)
Greatest DepthGreatest Depth 7.3 m (23.95 feet)7.3 m (23.95 feet)
Flushing RateFlushing Rate 1.4 years1.4 years
Lake VolumeLake Volume 5,280 acre feet5,280 acre feet
Hydraulic Residence TimeHydraulic Residence Time 0.55 year0.55 year
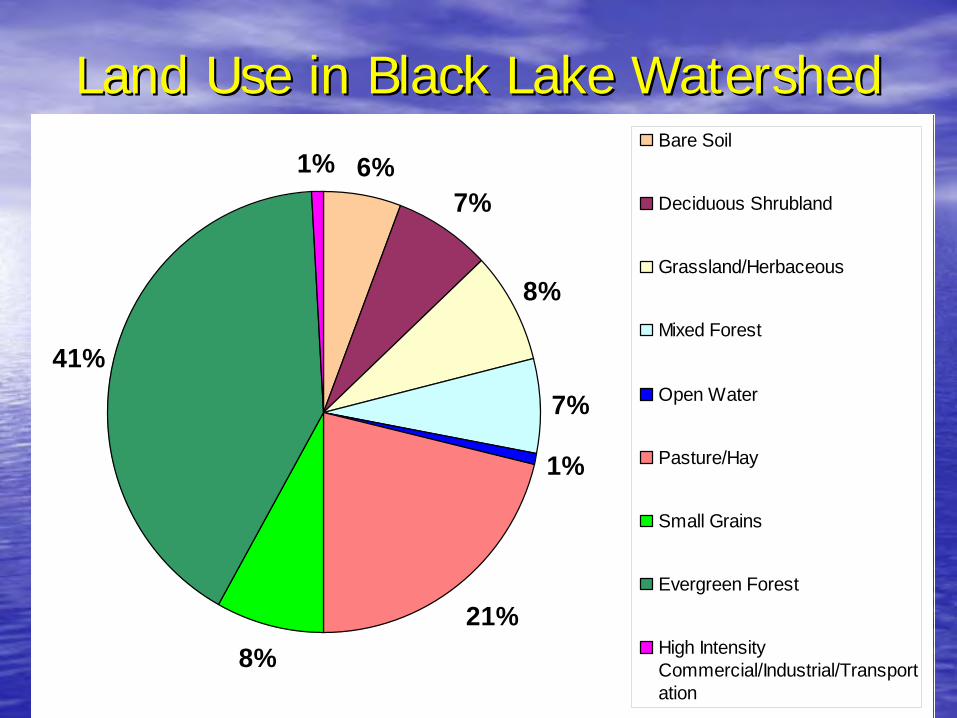
6%7%
8%
7%
1%
21%8%
41%
1%Bare Soil
Deciduous Shrubland
Grassland/Herbaceous
Mixed Forest
Open Water
Pasture/Hay
Small Grains
Evergreen Forest
High IntensityCommercial/Industrial/Transportation
Land Use in Black Lake WatershedLand Use in Black Lake Watershed

Land CoverLand Cover
Note: Coeur d’
Alene Reservation Boundary is too far south on the map

SubwatershedsSubwatersheds Table 4 in TMDLTable 4 in TMDL
West Irrigation District
1,538 acres
Lamb Creek3,499 (34%)
Black Creek4,702 acres
(46%)
Porter Creek2,053 acres
(20 %)East Irrigation
District1,353 Acres
Note: Coeur d’
Alene Reservation Boundary is too far south on the map

Water Quality DataWater Quality Data
•• Black Lake has weak periods of stratification from June Black Lake has weak periods of stratification from June through August, when water below 5m depth often through August, when water below 5m depth often becomes anaerobic (becomes anaerobic (KannKann and Falter 1987).and Falter 1987).
•• Some mixing of the deeper water occurs periodically Some mixing of the deeper water occurs periodically during strong wind events during the summer.during strong wind events during the summer.
•• The flushing rate and hydraulic residence time of the The flushing rate and hydraulic residence time of the lake are high (1.4 yrlake are high (1.4 yr--11 and 0.55 yrs).and 0.55 yrs).
•• The percentage of TP contributed by internal loading is The percentage of TP contributed by internal loading is relatively small at 9.3% (relatively small at 9.3% (KannKann and Falter).and Falter).

Water Quality DataWater Quality Data
WaterbodyWaterbody Number of Number of SamplesSamples
Period of Period of RecordRecord
TP Average TP Average ((µµg/L)g/L) Data SourceData Source
Coeur dCoeur d’’Alene RiverAlene River 1515 10/0310/03--8/058/05 21.421.4 USGSUSGS
Blake LakeBlake Lake 1515 8/028/02--8/068/0632.5 upper32.5 upper52.1 lower52.1 lower
CDA TribeCDA Tribe
Black CreekBlack Creek 1010 12/0412/04--9/069/06 73.973.9CDA TribeCDA TribeKannKann and and
Falter (1985)Falter (1985)
Lamb CreekLamb Creek 1010 12/0412/04--9/069/06 114.9114.9CDA TribeCDA TribeKannKann and and
Falter (1985)Falter (1985)
Porter CreekPorter Creek 77 6/056/05--4/064/06 104.7104.7 CDA TribeCDA Tribe
West Discharge PipeWest Discharge Pipe 33 5/055/05--8/058/05 4848 KannKann and and Falter (1985)Falter (1985)
Biological DataBiological Data
•• Specific fishery population information and other Specific fishery population information and other relevant biological data are not available for Black Lake relevant biological data are not available for Black Lake and its tributaries.and its tributaries.
•• 2005 Paleolimnology analysis of Black Lake using a 2005 Paleolimnology analysis of Black Lake using a sediment core from the center of the lake (sediment core from the center of the lake (BosBos and and StocknerStockner 2005).2005).–– Results verify Black Lake has been mesotrophic throughout its Results verify Black Lake has been mesotrophic throughout its
history; however eutrophic conditions have prevailed since 20history; however eutrophic conditions have prevailed since 20thth
century.century.–– BlueBlue--green algae has recently dramatically increased to well green algae has recently dramatically increased to well
above historical levels.above historical levels.–– Change in nutrient composition due to erosion from various Change in nutrient composition due to erosion from various
disturbances within the watershed.disturbances within the watershed.

SBA ConclusionsSBA Conclusions•• Water Quality Data indicates lake is not supporting cold Water Quality Data indicates lake is not supporting cold
water aquatic life use as a result of excessive nutrient water aquatic life use as a result of excessive nutrient loading.loading.
•• TP concentrations indicative of eutrophic conditions.TP concentrations indicative of eutrophic conditions.•• Paleolimnology data verified that Black Lake has always Paleolimnology data verified that Black Lake has always
been productive and productive and probably been productive and productive and probably mesotrophic until recent years, when human activity has mesotrophic until recent years, when human activity has accelerated eutrophication.accelerated eutrophication.–– Productivity has decreased during the past decade, Productivity has decreased during the past decade,
but it is 300% higher than prior to humanbut it is 300% higher than prior to human--induced induced disturbancedisturbance
•• The percentage of TP contributed by internal loading is The percentage of TP contributed by internal loading is relatively small at 9.3% (relatively small at 9.3% (KannKann and Falter).and Falter).
•• Major sources of TP to Black Lake are the result of Major sources of TP to Black Lake are the result of external loading, which warrants the need for a loading external loading, which warrants the need for a loading analysis, TMDL allocation, and implementation plananalysis, TMDL allocation, and implementation plan

TMDLTMDL
•• A TMDL is an estimation of the maximum pollutant A TMDL is an estimation of the maximum pollutant amount that can be present in a water body and still amount that can be present in a water body and still allow that water body to meet water quality standards.allow that water body to meet water quality standards.–– TMDL is water body, and pollutant specificTMDL is water body, and pollutant specific–– It allocates allowable discharges of individual pollutants amongIt allocates allowable discharges of individual pollutants among
the various sources.the various sources.• Coeur d’Alene Tribe and DEQ collaborate on Black Lake
to ensure consistency in water quality management programs. This includes collaboration on the Black Lake Watershed Assessment and TMDL, which is a joint effort between the Coeur d’Alene Tribe and Idaho DEQ.

Pollutant SourcesPollutant SourcesNutrient sources within the Black Lake watershed include:
Residential Residential DevelopmentDevelopment
Delivery of Organic Matter from Delivery of Organic Matter from Nearshore AreasNearshore Areas
WildlifeWildlife
Agricultural Practices Agricultural Practices and Livestockand Livestock
Septic TanksSeptic Tanks
Atmospheric DepositionAtmospheric DepositionLake Bottom SedimentsLake Bottom Sediments
Note: Coeur d’
Alene Reservation Boundary is too far south on the map

Septic System InventorySeptic System Inventory CDA TribeCDA Tribe
Note: Coeur d’
Alene Reservation Boundary is too far south on the map

Septic Systems by Subwatershed Septic Systems by Subwatershed Near Black Lake ShorelineNear Black Lake Shoreline
WaterbodyWaterbodyNumber of Number of
Septic Septic TanksTanks
Estimated Estimated Population Population
ServedServedaa
Effluent Effluent Flow Flow
(L/(L/day)day)bb
Estimated Estimated Phosphorous Phosphorous
Load Load (mg/(mg/day)day)cc
Blake LakeBlake Lake 9292 368368 55,20055,200 828,000828,000
Lamb CreekLamb Creek 5959 236236 35,40035,400 531,000531,000
Porter CreekPorter Creek 1919 7676 11,40011,400 171,000171,000
Black Lake Black Lake Nearshore within Nearshore within 100 meters100 meters
3434 136136 20,40020,400 306,000306,000
a Assumed 4 people/homeb Assumed system effluent flow 150 L/person/day (Woods 1991)c Assumed Total Phosphorous concentration in effluent 15 mg/L (Woods 1991)

Data GapsData Gaps
Stage volume calculations of Black Lake to provide more robust evaluation of
Lake dynamics.
No long-term water quality data to
estimate phosphorus loading from the Coeur
d’Alene River.
347 acre lake; Elevation: 2,123’; Avg. Depth: 14’
Monthly flow data from three Black Lake tributaries, East and West Irrigation Districts and stage data for the Coeur d’Alene River.
Insufficient data to quantify nutrient concentrations or loads from East and West
Irrigation Districts.
Note: Coeur d’
Alene Reservation Boundary is too far south on the map

Goal SettingGoal Setting
OligotrophicOligotrophic MesotrophicMesotrophic Eutrophic Eutrophic
22--10 10 µµg/Lg/L 1010--28 28 µµg/Lg/L >28 >28 µµg/Lg/L
•• Setting a numeric goal for a narrative based impairmentSetting a numeric goal for a narrative based impairment•• Used paleolimnology, USEPA ecoregion criteria, and Used paleolimnology, USEPA ecoregion criteria, and
IDEQ lake studies to select 20 IDEQ lake studies to select 20 µµg/L as the water quality g/L as the water quality goalgoal..–– It is assumed that reduction s in TP to meet this water quality It is assumed that reduction s in TP to meet this water quality
target will reverse the trend of eutrophication and diminish thetarget will reverse the trend of eutrophication and diminish the conditions that cause algal blooms in Black Lake.conditions that cause algal blooms in Black Lake.
•• Ultimate goal is to support beneficial uses.Ultimate goal is to support beneficial uses.
•• Tribal goal Tribal goal -- OligotrophicOligotrophic•• State goal State goal -- MesotrophicMesotrophic

Pollutant Load AllocationsPollutant Load Allocations
•• Lamb Creek Lamb Creek -- GWLFGWLF•• Black Creek Black Creek -- GWLFGWLF•• Porter Creek Porter Creek -- GWLFGWLF•• West Irrigation District West Irrigation District -- GWLFGWLF•• East Irrigation District East Irrigation District -- GWLFGWLF•• Coeur dCoeur d’’Alene River Alene River –– Direct inputDirect input•• Septic Systems around Black Lake Septic Systems around Black Lake –– Direct inputsDirect inputs•• Atmospheric Deposition Atmospheric Deposition –– Default ValueDefault Value
Inputs for Steady-state BATHTUB model:

SourceSource
Avg Avg Annual Annual Flow Flow
(million (million mm33/yr)/yr)
Existing ConditionExisting Condition Option 1 BATHTUB: Average Annual AllocationOption 1 BATHTUB: Average Annual AllocationOption 2: Average Annual AllocationOption 2: Average Annual Allocation
Concentration Concentration (ug/L)(ug/L)
Load Load (kg/yr)(kg/yr)
Allocated Allocated Concentration Concentration
(ug/L)(ug/L)
Allocated Load Allocated Load (kg/yr)(kg/yr)
% Load % Load ReductionReduction
Allocated Allocated Concentration Concentration
(ug/L)(ug/L)
Allocated Allocated Load Load
(kg/yr)(kg/yr)
% Load % Load ReductionReduction
Lamb CreekLamb Creek 1.411.41 105.4105.4 149149 19.019.0 2727 82%82% 21.121.1 3030 80%80%
Black CreekBlack Creek 2.142.14 93.393.3 199199 19.019.0 4141 80%80% 19.019.0 4141 80%80%
Porter CreekPorter Creek 0.600.60 125.5125.5 7676 19.019.0 1111 85%85% 24.924.9 1515 80%80%
West West Irrigation Irrigation DistrictDistrict
0.350.35 45.145.1 1616 20.020.0 77 56%56% 9.09.0 33 80%80%
East East Irrigation Irrigation DistrictDistrict
0.390.39 51.351.3 2020 20.020.0 88 61%61% 10.210.2 44 80%80%
Coeur Coeur d'Alene Riverd'Alene River 3.923.92 21.021.0 8282 21.021.0 8282 0%0% 21.021.0 8282 0%0%
Septic Septic SystemsSystems 0.0030.003 1170011700 3939 11700**11700** 66 85%85% 2480.42480.4 88 79%79%
Atmospheric Atmospheric DepositionDeposition -- 39.5*39.5* 3737 39.539.5 3737 0%0% 3737 0%0%
Existing Existing LoadLoad 617617 Load CapacityLoad Capacity 219219 Load CapacityLoad Capacity 220220
Overall Reduction NeededOverall Reduction Needed 64%64%
TMDL AllocationsTMDL Allocations
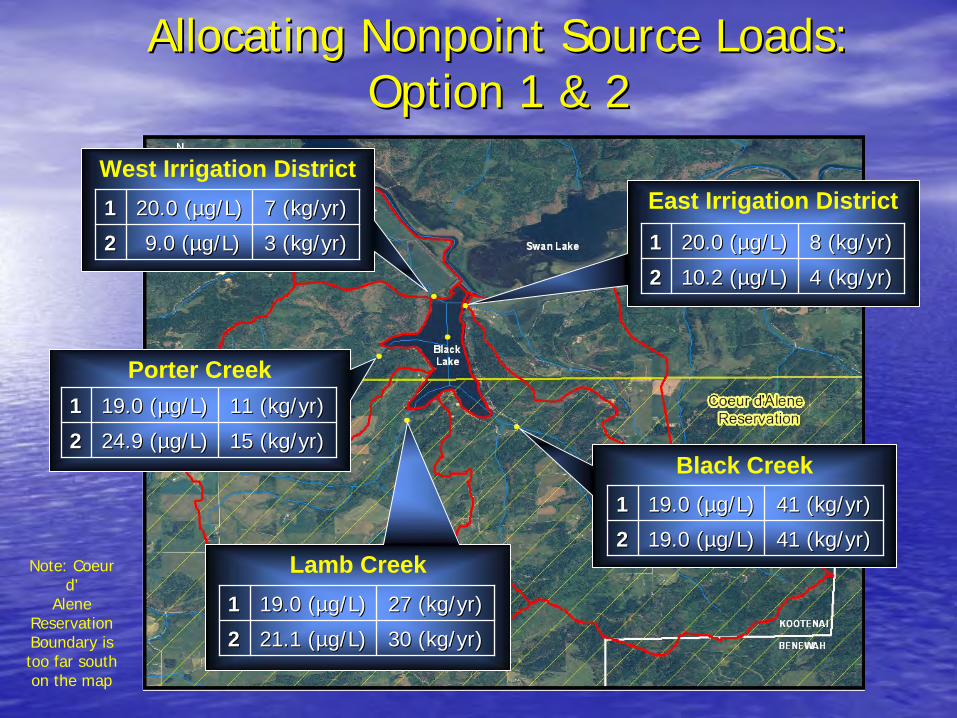
Allocating Nonpoint Source Loads: Allocating Nonpoint Source Loads: Option 1 & 2Option 1 & 2
Lamb Creek
Black Creek
Porter Creek
East Irrigation DistrictWest Irrigation District11 20.0 (20.0 (µµg/L)g/L) 7 (kg/yr)7 (kg/yr)
22 9.0 (9.0 (µµg/L)g/L) 3 (kg/yr)3 (kg/yr) 11 20.0 (20.0 (µµg/L)g/L) 8 (kg/yr)8 (kg/yr)
22 10.2 (10.2 (µµg/L)g/L) 4 (kg/yr)4 (kg/yr)
11 19.0 (19.0 (µµg/L)g/L) 11 (kg/yr)11 (kg/yr)
22 24.9 (24.9 (µµg/L)g/L) 15 (kg/yr)15 (kg/yr)
11 19.0 (19.0 (µµg/L)g/L) 27 (kg/yr)27 (kg/yr)
22 21.1 (21.1 (µµg/L)g/L) 30 (kg/yr)30 (kg/yr)
11 19.0 (19.0 (µµg/L)g/L) 41 (kg/yr)41 (kg/yr)
22 19.0 (19.0 (µµg/L)g/L) 41 (kg/yr)41 (kg/yr)Note: Coeur
d’ Alene
Reservation Boundary is too far south on the map

Uncertainty: TMDL vs. Implementation Uncertainty: TMDL vs. Implementation MonitoringMonitoring
Stage volume calculations of
Black Lake
Phosphorus loading from the Coeur d’Alene River.
Monthly flow data from Black Lake tributaries, East and West Irrigation Districts Coeur d’Alene River.
Nutrient concentrations or loads from East and West Irrigation Districts.
Other:Septics, Aerial
Deposition, Agriculture, Wildlife.
Note: Coeur d’
Alene Reservation Boundary is too far south on the map


