65
Blackjack Tracking System Wesley Cooper 99654075 B.A. (Mod.) Computer Science Final Year Project April 2004 Supervisor: Dr. Kenneth Dawson-Howe

Blackjack Tracking System
Wesley Cooper 99654075 B.A. (Mod.) Computer Science Final Year Project April 2004
Supervisor: Dr. Kenneth Dawson-Howe

1
I. Abstract
This project is a demonstration of how Machine Vision Techniques can be successfully
applied to the monitoring of game security on a gambling table. Taking simulated Casino
security footage the software is able to process visual images identifying cards and
compiling win/loss ratios for all participants in a simple game of Blackjack. When run on
2.4GHz machines (and above) it is able to do this in real-time.

2
II. Acknowledgements
I would like to thank my supervisor Dr. Kenneth Dawson-Howe. Not only did he provide
advice, guidance and camera equipment, but also the hint of reality so often need in such
a project.

3
III. Report Structure
The structure of this report is that of the Coverdale Systematic Approach (CSA)
[COV04]. This is a tried and tested method of logical steps to complete, or describe fully,
a complicated task.
CSA - (steps are highlighted in colour)
1. Purpose - Why the project is being undertaken.
2. Aims - Goals and Measures of Success
3. Information - Existing research, existing structure.
4. Plan - How aims are to be achieved.
5. Action - Implementation.
6. Review - What went well? What could be improved and how?
Report Structure (Indicating the manner in which the CSA has been applied).
Introduction
1. Purpose, Aims, Justification and Motivation
2. Initial Goals and measures of success.
Background
3. Existing Structure and Existing Research
Overview of problem situation
This section explains the division of the problem situation into five parts. Steps 4
and 5 of the CSA are then applied to each part separately.
Plan, design and Implementation of solution
Table Normalisation/Perspective Repair
4. Plan and Design
5. Implementation

4
Table Feature Extraction
4. Plan and Design
5. Implementation
Card Extraction
4. Plan and Design
5. Implementation
Card Identification
4. Plan and Design
5. Implementation
Data processing
4. Plan and Design
5. Implementation
Further Notes on Implementation
In this section recombination of the problem situation is described.
Review
6. Summary, example results, difficulties and future Work.
Referencing Structure
The report is split into sections and subsections. These are referenced by numbers. E.g.
2.3 refers to the third subsection of the second section of the report.
Illustrations are similarly indexed. The numbers in an illustration’s reference denote the
section and subsection of the report in which it lies. Letters attributed in alphabetical
order further differentiate multiple illustrations which reside in the same subsection. E.g.
Fig 2.3.a refers to the first illustration present in section two, subsection three.
5
Table of Contents:
I. Abstract.......................................................................................................................1 II. Acknowledgements ...................................................................................................2 III. Report Structure .......................................................................................................3 1.0 Introduction..............................................................................................................7
1.1 Purpose/Aims ..............................................................................................7 1.2 Justification .................................................................................................7 1.3 Initial Goals .................................................................................................8
2.0 Background............................................................................................................10
2.1 Existing Structure ......................................................................................10 2.2 Existing Research ......................................................................................10
3.0 Overview of Problem Situation .............................................................................14
3.1 The Table...................................................................................................14 3.2 The Cards ..................................................................................................16 3.3 Data Processing .........................................................................................16
4.0 Plan, Design and Implementation of Solution .......................................................17
4.1.0 Table Normalisation/Perspective Repair ................................................18
4.1.1 Plan and Design .........................................................................18 4.1.2 Implementation ..........................................................................22
4.2.0 Table Feature Extraction ........................................................................26
4.2.1 Design ........................................................................................26 4.2.2 Implementation ..........................................................................27
4.3.0 Card Extraction.......................................................................................31
4.3.1 Design ........................................................................................32 4.3.2 Implementation ..........................................................................32
4.4.0 Card identification ..................................................................................37
4.4.1 Design ........................................................................................37 4.4.2 Implementation ..........................................................................37
4.5.0 Data Processing ......................................................................................42
4.5.1 Design ........................................................................................42 4.5.2 Implementation ..........................................................................42
5.0 Further Notes on Implementation ..........................................................................44
5.1 Automation of Manually Set Parameters ..................................................44 5.2 Single Pass Iterative Connected Components Filter .................................44 5.3 Difference between a Player’s and the Croupier's hands ..........................45

6
5.4 Adaptive Background................................................................................46 5.5 Degradation of System ..............................................................................46
6.0 Review ...................................................................................................................48
6.1 Summary ...................................................................................................48 6.2 Example Results ........................................................................................48
Table Normalisation and Feature Extraction ......................................49 Card Extraction, Card Recognition and Data Processing ...................50
6.3 Future Work...............................................................................................54 6.4 Conclusion.................................................................................................54
7.0 Bibliography ..........................................................................................................55 Appendix A..................................................................................................................58
DIY: How to build a Blackjack Table.............................................................58 How to Play Blackjack ....................................................................................61 Nuances of Dealing Blackjack which are pertinent to this project .................62
Appendix B ..................................................................................................................63
Single Pass Iterative Connected Components .................................................63 Convex Hull ....................................................................................................64
7
1.0 Introduction
Machine (or Computer) Vision is the field of computing which pursues the development
of a visual sensory system for Computers. This is particularly challenging task; we do not
fully comprehend how humans process visual data, so the creation of a mechanical
counterpart is extremely difficult. There is a long way to go until Machine Vision is
capable of endowing computers with anything on a par with our own visual system.
1.1 Purpose/Aims
While a general solution to the problem of Machine Vision is the stuff of science fiction,
specific applications are slowly becoming scientific fact. Machine Vision has been
successfully employed in many limited situations. In industrial applications (e.g. quality
assurance) Machine Vision has proved to be an improvement over former techniques.
Medical imaging, remote sensing and automatic surveillance are other areas waiting to
benefit from Machine Vision. Indeed the diversity of situations to which Machine Vision
could be applied is constantly growing. The lack of a general solution means that the
development of specific applications is a slow and arduous task. Each Machine vision
system has to be uniquely tailored to the environment in which it is being used.
This project is a first step; proof that Machine Vision Techniques can be successfully
applied to the monitoring of game security on a gambling table. This is accomplished by
tailoring Machine Vision Techniques to a typical Casino "gaming-pit" environment and
demonstrating them operating successfully.
1.2 Justification
In a Casino fortunes can be won and lost in an instant. The modern Casino is a business
which likes to look after its interests. Today many of the games played in a Casino are
computerised (e.g. One-Armed-Bandits/Slot Machines, Video Poker etc.). Exceptions to
this are the table games played in the "Gaming-pits", notably those of Blackjack, Craps,
Roulette and Poker. The importance of these games cannot be measured. Apart from
providing prestige, they also attract the "Big-Fish" or the more profitable gamblers.
However gaming-pits are also the major security concern for any Casino. Traditional in

8
nature, the games dealt in a gaming-pit are operated the same way they have been for over
two hundred years; manually. This leaves the Casino vulnerable to fraudulent activity and
monetarily responsible for any mistakes made by its employees when operating these
games. Any tampering with, or change to the process (to increase security), and the
Casino would suffer a loss of reputation such that habitual gamblers would go elsewhere,
perhaps never to return.
Casino security in this area has been limited to the use of overhead camera surveillance
with human operatives scrutinising gameplay on monitors. The drawbacks of this system
are numerous. Long hours watching screens cause operators to often miss, or wrongly
interpret, important violations. Many monitors mean many operators have to be employed
and they cannot be relied upon to catch every digression. This concept has hardly altered
for the last 50 years; even though the technology has changed the premise has not.
This problem situation naturally lends itself to Machine Vision. Not only is there an
extremely high density of visual equipment (e.g. cameras) but also the world that they
observe has been (and can be) uniquely tailored to specific security needs. The
surveillance department of any Casino is a high cost and substantial part of its workforce.
Machine Vision has the potential to substantially lower costs and improve this system. A
Machine Vision Surveillance system can tirelessly look for even the smallest suspicion of
a violation. It could also provide the Casino with important statistical details on its
players and employees hitherto unavailable under existing techniques. This project forms
the first stage of a full investigation into the ways in which a Machine Vision augmented
surveillance unit could increase Security on Casino gaming tables.
1.3 Initial Goals
As Blackjack is the most widely played Casino table game (as well as one of the
simplest), it is logical to use this game as the primary model. It will be used to
demonstrate how Machine Vision can be applied to a gaming environment. The main
objective of the project will be to track the progress of a game of Blackjack (using the
Trinity Image Processing System developed by Dr. K. Dawson-Howe) [TIP04] and
provide useful surveillance information to a human observer.
Primary objectives:
I. Identify and Extract the Blackjack Table (gaming surface).

9
II. Identify the important markings on a Blackjack Table.
III. Recognise the values of the cards being dealt and to keep track of
each player’s score during the game.
Secondary objectives:
I. Recognise if a player disturbs their wager at an inappropriate stage of a game.
II. Analyse the game to see if it is dealt properly, notably:
That the cards have been placed in the correct manner.
III. Process extracted data and compile useful statistics (e.g. Players’ win/loss
ratios, current value of cards on table).

10
2.0 Background 2.1 Existing Structure
Gaming environments, by their very nature, have favourable conditions in which Machine
Vision can flourish. Rules of conduct in the Casino pit are dictated by particular security
needs. One of the most important aspects of Casino security is the tailoring of the
environment to suit observation by individuals in a surveillance room. They must be able
see, with the least obstruction possible, all activity on any given gaming area at all times.
Lighting conditions are kept constant on and around the gaming surface to facilitate
observation. Indeed even the manner in which Croupiers are taught to deal Blackjack
makes the game very regular and simple to survey from overhead cameras. Thus we are
provided with a very regular stationary camera position, constant lighting effects and an
excellent view of the table and gameplay at all times. Some of the nuances of Casino
Blackjack play (how the cards are dealt by the Croupier and the rules for players), which
ease the Machine Vision problem, are elaborated on as needed in the description part of
this report and also in the Appendices [Appendix A].
2.2 Existing Research
Research in this area has concentrated on the main problem faced in the development of
an automated Casino Game Security system; Card Recognition. Throughout the Machine
Vision community the general consensus is that pattern recognition and template
matching are the only viable methods with which to recognise cards. The game most
concentrated on has been Poker.
A research team from Rice University, Houston, Texas has published what seems to be
one of the few available papers on gaming card recognition [EGVW00]. Using high
definition video footage, they utilised various Template Matching techniques to identify
the values of the gaming cards. The core of their application is the aligning of symbols in
the top left (and bottom right) of each card (which denotes its suit and value) to pre-
designated templates. Their results were not very encouraging. While able to identify a
single card in isolation, their application exhibited high error rates of 12% and 45% for

11
multiple cards in isolation and overlapping cards respectively. It should also be noted
that the team excluded picture cards from their investigation in order to simplify the
problem, and the overlapping of cards was in a manner consistent only with the game of
Poker.
This particular attempt indicates that pure Machine Vision techniques could be
successfully applied to practical gaming situations in the future. However, the project’s
dependence on Template Matching leads to a rigid solution which is both inefficient and
impractical with processing of an individual card taking, in some cases, up to a minute
(depending on resolution).
It should be noted that, while former attempts have proven successful in a limited manner,
the reason they have not lead to a successful system is a high level of naivety in the
understanding of the problem situation.
Despite its enduring appeal Poker is not a house game (e.g. there is no "bet against the
house"; the Casino does not wager any money in Poker), rather it is left to individual
players to wager against one another and the Casino takes a percentage of the pot for
hosting the game. There is no risk to the Casino in Poker, and accordingly surveillance of
Poker is a very minor concern. The manner in which Poker cards are overlapped makes it
hard to extract meaningful information without very high-resolution images which makes
processing slow. Couple this with the fact that Template Matching and Pattern
Recognition require a large computing overhead, and the result is a commercially
unattractive system decades away from a real time implementation.
Any industry insider will inform you that the major security concern of any Casino is
Blackjack. In Blackjack all bets are against the house. The Casino has a vested interest in
the outcome of every game. The odds in Blackjack are so finely poised that a good card
counter can gamble with favourable odds (up to a 55% chance of winning) costing the
Casino thousands. In order to make it more secure Blackjack has more player rules and
Croupier regulations than any other card game. In an average Casino three quarters of its
gaming tables will be Blackjack tables.
The advantages to a machine Vision system which Blackjack provides are its simplicity,
popularity, and the high level of concern that Casinos place in its security. This leads to
better surveillance, tougher regulations and increased commercial potential. These
12
advantages mean that Blackjack is much more likely to prove a successful testbench for
the application of Machine Vision Techniques to a gambling environment than any other
card game.
Internally the gambling industry has recognised this fact and moved to ensure Blackjack
security by using Electronic Branding of cards. The commercial application currently
available, which uses this technique, is called MindPlay MP21 [MP03]. It is designed to
track the play and betting patterns of a player at a Blackjack table. The playing cards are
branded electronically and are recognised in real-time using a system of 14 digital
cameras and a number of sensors which are placed strategically around the table. This is
then processed into a 3 dimensional model of the table which includes all objects on the
table. Obviously this requires a fully customised Blackjack environment. The table, Chip
Tray, Shoe, Discard Rack and cards must be manufactured to meet strict criteria and are
only available from the application producer. This is not only costly but also detrimental
to the gambling environment. The gaming table itself is littered with different sensors and
the cameras are noticeable. Regular players are very much against this new technology
claiming that such augmentations to the gambling equipment alters the odds of the game,
while making them wonder whether or not they should have stayed at home to play it on
their computers. The Casinos, which have embraced this technology, defend themselves
by claiming that it simply gives them a better means through which to ensure the game is
fair and to track regular players. Either way, most Casinos are wary of expending a vast
amount of capital on an upgrade which could ultimately alienate their best customers.
There is also the continued risk that card counters/cheats might develop their own means
by which to read the electronic markings on the cards causing the odds to favour them
considerably. This system may prove a bigger risk than that which it is trying to
eliminate.
The fact that the gaming industry is even toying with such technology shows that it does
not believe that the technology exists to solve their security concerns without drastic
alteration to the gaming environment.
This project is a radically new approach to the problem. A deep understanding and
constant consideration of the problem situation has resulted in a departure from previous
research in this area. Indeed research carried out in other domains has proven more
beneficial to the project’s development. These domains are notably that of traffic sign

13
recognition and character recognition and they are referenced wherever appropriate to the
design description.
14
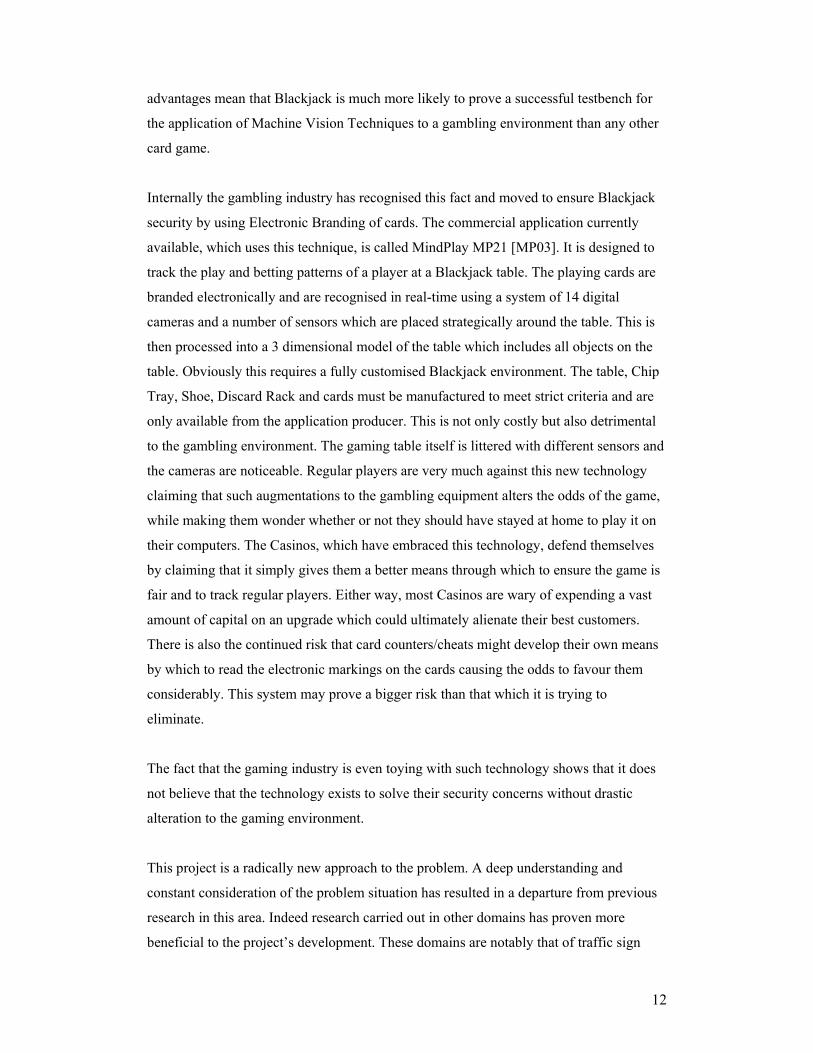
3.0 Overview of Problem Situation
The problem situation posed by a Blackjack Tracking System can be broken down into
three distinct, and more manageable, problem situations.
1. Identifying the table, extracting the important markings, and creating a normalised
output.
2. Identifying when a card is placed in a players "action area". Recognising the value of
the card.
3. Processing of the Extracted Data. This is where meaningful statistics are garnered from
the Machine Vision analysis.
Fig. 3.0.a
Figure 3.0.a shows a typical Blackjack gaming environment [CNN04]
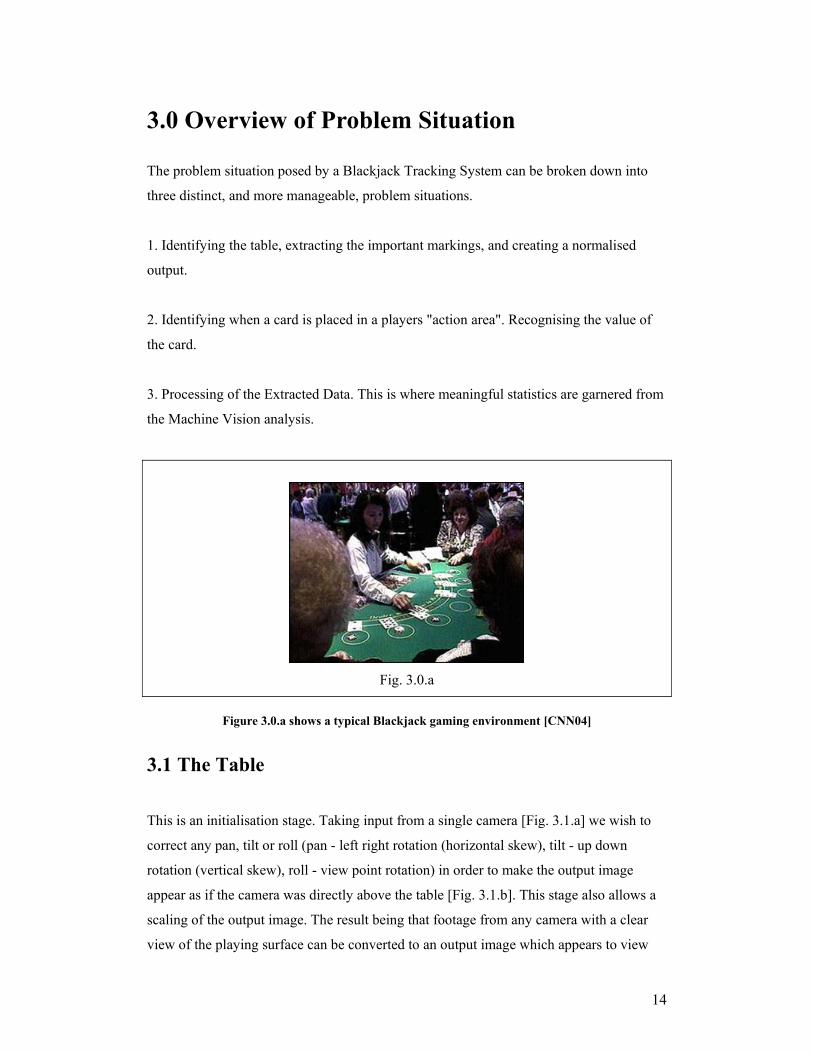
3.1 The Table
This is an initialisation stage. Taking input from a single camera [Fig. 3.1.a] we wish to
correct any pan, tilt or roll (pan - left right rotation (horizontal skew), tilt - up down
rotation (vertical skew), roll - view point rotation) in order to make the output image
appear as if the camera was directly above the table [Fig. 3.1.b]. This stage also allows a
scaling of the output image. The result being that footage from any camera with a clear
view of the playing surface can be converted to an output image which appears to view
15
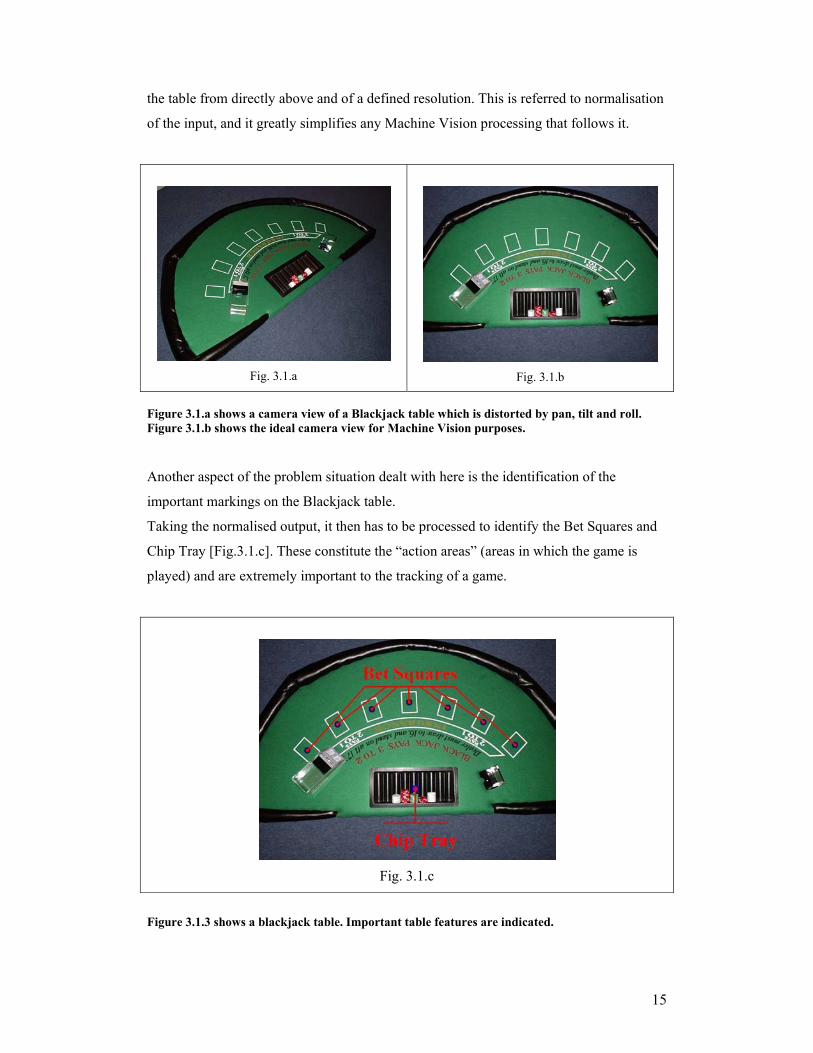
the table from directly above and of a defined resolution. This is referred to normalisation
of the input, and it greatly simplifies any Machine Vision processing that follows it.
Fig. 3.1.a
Fig. 3.1.b
Figure 3.1.a shows a camera view of a Blackjack table which is distorted by pan, tilt and roll. Figure 3.1.b shows the ideal camera view for Machine Vision purposes. Another aspect of the problem situation dealt with here is the identification of the
important markings on the Blackjack table.
Taking the normalised output, it then has to be processed to identify the Bet Squares and
Chip Tray [Fig.3.1.c]. These constitute the “action areas” (areas in which the game is
played) and are extremely important to the tracking of a game.
Fig. 3.1.c
Figure 3.1.3 shows a blackjack table. Important table features are indicated.

16
3.2 The Cards
Once the Bet Squares and Chip Tray are identified it is known where the player’s and
Croupier’s "action areas" (or region in which cards will be placed) exist. These are
monitored until the arrival of a card is detected. Once something is placed in the action
area it must be identified as a card before recognition can occur. Once a card has been
detected only its value has to be recognised. One of the major advantages of Blackjack
over other card games is the fact that recognition of the suit or picture of a card is not
required (e.g. a King and Queen have the same value, and suits are irrelevant). This
means that the value of the card is all that needs to be extracted. The simplification of this
aspect of the problem situation allows us to use lower resolution images and faster
algorithms [Fig. 3.2.a, Fig. 3.2.b].
Fig. 3.2.a
Fig. 3.2.b
The Blackjack hands shown in Figure 3.2.a and Figure 3.2.b both have the value 16. This illustrates how suit and picture are not relevant to Blackjack.
3.3 Data Processing
Once a card's value has been identified and attributed to a player, processing occurs. This
simply updates any statistics that the computer is storing on the game such as the current
state of play and the player's win/loss ratio.

17
4.0 Plan, Design and Implementation of Solution
The plan and design of the solution was treated as five separate problem situations.
Developed independently they were later integrated to obtain the final solution.
Throughout their development the integration process was always a consideration. For the
final solution only some minor adjustments to the processing stage were necessary for
each of the parts to work successfully together.
Project problem situations:
Table Normalisation.
Table Feature Extraction.
Card Extraction.
Card Recognition.
Data Processing.
The first two problem situations form an initialisation phase for the overall system. They
need only be executed once per running of the system. Table Normalisation and Table
Feature Extraction perform tasks designed to greatly reduce the processing overhead
required for the part of the system which actually "tracks the game". Game monitoring is
achieved through Card Extraction, Card Recognition and Data Processing. These are
executed on each frame of the video input and their efficient design is critical to the
running speed of the system. All the problem situations are encapsulated in a wrapper
class which resides in the Trinity Image Processing System [TIP04]. This class handles
the passing of images between methods and the storage of statistics.

18
4.1.0 Table Normalisation/Perspective Repair
4.1.1 Plan and Design - Calibration and Normalisation
For any Machine Vision system working in a real-world environment, camera calibration
is an important step. Before interpretation of images/video can occur an understanding of
the camera's orientation, internal characteristics and relationship to the scene are
necessary.
Ignoring lens effects, the basic camera model which Machine vision uses to show how a
3-D world is modelled in a two-dimensional image, is that of the pinhole camera [Fig.
4.1.a].
Fig. 4.1.1.a
Figure 4.1.1.a [SONKA99] depicts the basic premise of a pinhole camera representation (in 2-D) of a 3-D scene.
Each real-world (3-D) point maps to an image point which is in 2-D. This mapping is
described by the following equation where U is an image point, X is a real-world co-
ordinate and M is the Projective Matrix.
U = MX

19
More precisely:
Where U and V are the x and y co-ordinates of the point in the image coordinate space.
a is a scaling vector. m11 - m34 represents the Projective Matrix and x, y, z represent 3-D
description of point in real-world co-ordinate space. [An extra dimension exists in the real
world description and can be normalised back to 1 to get homogeneous co-ordinates. It
too is a scaling vector.]
The Projective Matrix works on the principle that, apart from lines on the image plane,
lines that are parallel in 3-D are not parallel in a 2-D representation of that scene. A real
world example of this is the manner in which railway tracks go towards a vanishing point,
similarly a view of a long corridor suffers the same effect [Fig. 4.1.1.b].
Fig. 4.1.1.b
Figure 4.1.1.b [SONKA99] shows the representation of parallel lines in 3-D on the image plane and the manner in which they appear to converge at a vanishing point.

20
To properly estimate the Projective Matrix you need six known points in the real world
which are also known image points. From this you can solve the parametric equations for
m11 - m34 and thus determine the Projective Matrix1.
These six points represent three parallel lines in the real-world. To obtain a Projective
Matrix estimate it is necessary that at least one of these lines be disjoint (or not co-planer)
to the other two. Once the Projective Matrix is known, the camera's intrinsic (internal
properties of camera) and extrinsic (camera's orientation in real world) parameters can be
determined and camera calibration is complete. This gives a total real world to image
mapping for every point and vice versa [SONKA99].
However, the gaming surface of a Blackjack table is flat; all points on it are co-planer. As
the Blackjack table is the only object that is guaranteed to exist in the surveillance footage
at all times, and the object to which the camera will be calibrated, it cannot provide the
disjoint property required. Therefore it is impossible to successfully calculate the
Projective Matrix and from this determine the camera’s intrinsic and extrinsic parameters.
To correct pan, tilt and roll in order to gain a normalised image without the ability to
properly calibrate the camera is a difficult task. However it is possible to extract a single
plane from the real world and project it to the image plain. This technique causes
distortion of objects that have a measure of length perpendicular to the extracted plane.
To successfully extract a single plane in this manner four co-planer points are required
[Fig. 4.1.1.c]. As all the points in this method can be co-planer it can successfully correct
pan, tilt and roll for a single planed object such as a Blackjack gaming surface. It is this
technique which is implemented. The four points are indicated on a calibration board
which is placed on top of the playing surface [Fig 4.1.2.b].
1 The Projective Matrix determination method is only an estimate because of image pixel representation. E.g. to represent a point in a pixel co-ordinate system rounding occurs. A point which should be displayed at pixel x.a will only be displayed at x [where [x,a] are elements of Natural Numbers].

21
Fig. 4.1.1.c
Figure 4.1.1.c ([SONKA99] – Edited) illustrates the solution. The plane is extracted using four reference points.
The next problem is the extraction of the added points. By filtering all colour not similar
to the background of the board, it is possible to isolate it. The markings on the board
appear as holes within the filtered through surface [Fig 4.1.2.c]. An Inverse Connected
Component2 method isolates the markings on the board [Fig 4.1.2.e].
These can be statistically analysed to determine which markings are the required dots.
Thus we have identified four points on the planer surface.
Once four points have been extracted they are compared to where they would exist in an
ideal model. The deviations formed by this comparison can then be used as co-efficients
to perform a Geometric Transform (Perspective Warp3 operation) on the distorted image
[Fig. 4.1.2.f] to generate the new corrected image [Fig. 4.1.2.g].
2 Connected Components - This is the grouping together of similar pixels, which are "touching" one another, into regions. A Binary (black and white) image will, assuming that black represents the background, group all the white pixels into regions where by there is a "path" of white pixels from one point to another. Inverse Connected Components refers to the identification of background regions encapsulated within a foreground region. [See Appendix B for more detail]. 3 Perspective Warp - This is a Geometric Transformation which maps pixels in a distorted image to their ideal positions using the co-efficients derived from four reference points. This works for a 2-D surface only and the operation to do this is supplied by Intel Image Processing Libraries [TIP04]. The Interpolation (inference of missing pixels within image as it is stretched) method used was that of nearest neighbour.

22
4.1.2 Implementation - Calibration and Normalisation
Initial attempts to extract four co-planer points from the Blackjack table proved
unsuccessful. Not only do the points have to be accurately recognised, but they also have
to be uniform between all Blackjack tables that the system is applied to.
All Blackjack tables are of similar shape and size. Detection of four stable points on the
edge of the Blackjack table itself using semi-circle recognition by Convex Hull analysis
[Appendix B] proved very difficult. This was prevalent when the semi-circle was
subjected to pan and tilt which greatly increased the complexity of the task (especially
when two of the points would have been on the curved edge of the semi-circle and
unstable by nature). This approach was abandoned. Four other features that could supply
stable points are the corners of the Chip Tray. This technique proved much more
successful, but the close proximity of the corners meant that any errors were greatly
multiplied when applied to the overall image. The solution is to place a board, which has
four distinct markings on it, on the playing surface [Fig. 4.1.2b]. Thus four stable points
are added to the plane which is to be extracted.
Fig. 4.1.2.a
Fig. 4.1.2.b
Figure 4.1.2.a shows the camera image to be corrected. Figure 4.1.2.b demonstrates the Blackjack table with calibration board laid down on the playing surface.
Extraction of these four points is automated. Assuming the camera is centred on the
Blackjack table, and the board is placed in the centre of the table, colour statistics are
compiled for a given area around the centre of the camera's vision; capturing statistics for

23
the background colour of the board. The Colourspace4 used for this is HLS, where the H
channel stands for hue (or colour), the L channel stands for luminance (or brightness) and
the S channel stands for saturation (or colour density). Using the statistics gained, the
picture is filtered. Only colours within a certain standard deviation of the extracted
statistics are let through [Fig. 4.1.2.c]. The three channels (H, L, and S) are subjected to
different filtering criteria; the Hue channel having a very low tolerance, and the others
having a more liberal filtering mechanism. This is because luminance and saturation
naturally fluctuate across a surface where as hue is much more likely to have a constant
value.
Once all colour significantly different from the board's background colour has been
filtered out. There is a single Erode5 step to remove any noise6 and to increase the size of
any holes (or markings) on the surface of the board. The image is then thresholded7 over
the luminance channel to further isolate the board which is of a significantly brighter
colour than its surroundings [Fig. 4.1.2.d].
Fig. 4.1.2.c
Fig. 4.1.2.d
Figure 4.1.1.c illustrates the extraction of the board from the image using colour analysis. Figure 4.1.1.d is the same image after an Erosion and threshold have been applied. 4 Colourspace - The manner in which colour information is expressed in terms of computing. Examples of Colourspace include RGB (where colours are expressed in terms of their Red, Green and Blue components) and HLS. 5 Erosion is the removal of border pixels from within a binary (black and white) image. In effect any foreground pixels next to a pixel, which is determined to be in the background, will be removed. 6 Noise - Random degradation present in images of real-world scenes. 7 Threshold - Filtering of an image. Only allow through pixels that have a value over/under a certain (threshold) value.

24
When complete, an Inverse Connected Components and statistical analysis is performed on the result [Fig. 4.1.2.e].
Fig. 4.1.2.e
Figure 4.1.2.e demonstrates the result of an Inverse Connected Components analysis. This highlights the markings (or “holes” in the previous image) which exist on the calibration board. The existence of false positives shows the importance of the statistical analysis step. Each marking or dot is a separate region.
This isolates all the holes into separate regions and calculates statistics on them. There are
17 statistics compiled in all:
Label - Unique identifier of Region. Min_row_X - the X co-ordinate of the region's minimum Y value. Min_row_Y - the Y co-ordinate of the region's minimum Y value. Min_column_X - the X co-ordinate of the region's minimum X value. Min_column_Y - the Y co-ordinate of the region's minimum X value. Max_row_X - the X co-ordinate of the region's maximum Y value. Max_row_Y - the Y co-ordinate of the region's maximum Y value. Max_column_X - the X co-ordinate of the region's maximum X value. Max_column_Y - the Y co-ordinate of the region's maximum X value. Angle - Orientation of the longest side of the region's bounding box8. Area - Total number of pixels in region. Width - width of bounding box. Height - Height of bounding box. Center_X - Moments of Inertia - X Central Gravitational Axis of region. Center_Y - Moments of Inertia - Y Central Gravitational Axis of region. Rectangularity - Ratio of area to bounding box area. Elongatedness - Ratio of Height to width.
The particular criteria used to select the desired holes (dots) are those of Elongatedness,
Area and Colour (Hue - obtained from original input image). If four regions exhibit
values for these statistics consistent with what is expected of the calibration dots then
their co-ordinates are saved to file. These co-ordinates can then be used to derive the co-
8 A region’s bounding box is the smallest possible rectangle that if drawn around the region encompasses all the points in the region.

25
efficients required to Geometrically Transform (using Perspective Warp) any input image
[Fig. 4.1.2.f] of the gaming surface from the stationary camera (used for the calibration
image) into a normalised view [Fig 4.1.2.g].
Fig. 4.1.2.f
Fig. 4.1.2.g
Figure 4.1.2.f shows an input image distorted by pan, tilt and roll. Figure 4.1.2.g shows a normalised image. The camera position in Figure 4.1.2.f would never be used in surveillance because its view of the gaming area is of too poor a quality. However it is used to demonstrate the ability of the algorithm to remove the majority of distortion effects from a 2-D surface. The areas of black in Figure 4.1.2.g are added to the image as there are no corresponding pixels to map them from in the input image when the Geometric Transform is applied.
26
4.2.0 Table Feature Extraction
Once a Normalised (corrected and of a defined resolution) image of the scene has been
obtained, the next problem is the identification of the important markings on a Blackjack
table. These are the Chip-tray and Bet Squares and form important reference points for
any Blackjack tracking system [Fig.3.1.c].
4.2.1 Design
Having previously obtained the correction co-efficients from the Table Normalisation
problem, a normalised image/video is created by applying a Geometric Transformation to
the input image/video [Fig. 4.2.2.a]. The predominant cloth colour of the gaming surface
is then extracted [Fig. 4.2.2.b]. This enables the isolation of the cloth from the rest of the
image and leaves holes (visually displayed as areas of black) where the markings on the
cloth and the Chip Tray are.
Using Inverse Connected Components [Appendix B] the regions are statistically analysed
and the most likely positioning of the Chip Tray [Fig. 4.2.2.d], its height and orientation
are saved to file.
An Inverse Connected Component analysis is again applied to this image. The regions
remaining after this second iteration are then statistically analysed [Fig. 4.2.2.d]. Due to
the fact that Bet Squares vary in design and shape from one Casino to another there can
be no defined statistical blueprint. However, of all table markings, Bet Squares are the
only ones repeated more than once with there being at least five of them. Therefore the
regions are grouped by similarity in a round-robin fashion. The most similar regions are
then selected and identified as Bet Squares; their position and orientation are saved to file.

27
4.2.2 Implementation
Taking the co-efficients saved to file from the solution to the Table Normalisation
problem, the input image is normalised. This is done by applying the Perspective Warp
(the pre-specified Geometric Transform) to correct distortion caused by pan, tilt and roll
effects. Once we have a normalised image the markings on the gaming surface have to be
extracted. Sampling the centre of the image (after normalisation it can be assumed the
predominant colour in the centre of the image will be that of the gaming cloth), we obtain
colour statistics for the gaming surface. Filtering, using the same methods as described
for the calibration board [c.f. 4.1.2], allows the extraction of the cloth colour from
Blackjack table. All markings on the table will appear as holes [Fig. 4.2.2.b].
Fig. 4.2.2.a
Fig. 4.2.2.b
Figure 4.2.2.a shows a normalised view of a blackjack-table. Figure 4.2.2.b illustrates the extraction of the cloth colour from the scene.
An Erosion is then applied. This erodes multiple pixels in from the edges of non-
background pixels. It is used to enlarge any table markings, which can be very narrow, to
make them easier to analyse. It also ensures a continuous boarder around Bet Squares and
causes smaller markings, such as writing or printed text, to disappear completely. A
Dilate9 step is then completed to repair some of the scaling issues caused by an erosive
step [Fig. 4.2.2.c].
9 Dilation - the addition of a border wherever a non-background pixel touches a background pixel.

28
Once the holes, which represent the table markings, have been enhanced an Inverse
Connected Components filter is then applied. The resultant image, which has all the holes
representing table markings indicated as regions, is statistically analysed [Fig. 4.2.2.d].
Fig. 4.2.2.c
Fig. 4.2.2.d
Figure 4.2.2.c demonstrates the cloth image after it has been subjected to multiple Erode and Dilation operations. Both the Chip Tray and Bet Squares are more defined. Figure 4.2.2.d shows the result of the application of Iterative Connected Components to create a “hole image”.
The region with the greatest rectangularity, and having an area greater than a predefined
threshold value, is identified as the Chip Tray [Fig. 4.2.2.d]. Its position, orientation and
height are saved to file.
Fig. 4.2.2.d
Fig. 4.2.2.e
Figure 4.2.2.d indicates (by red and blue marking) the identification of the Chip Tray as a result of statistical analysis. Figure 4.2.2.e shows this data applied to the normalised image.

29
The next problem is to identify the Bet Squares. Using the image from which Chip Tray
Identification is made, an extra Inverse Connect Components filter is applied [Fig.
4.2.2.f]. This in effect extracts, as regions, all the areas of cloth colour which are
completely encircled within markings on the tables.
Again statistical analysis of the regions is performed. As there is no regular size and
shape for Bet Square representation, isolation of the Bet Squares is performed using a
similarity measure. This is given by the formula: 1/5*(percentage difference in Area between region A and region B) + 1/5*(percentage difference in Width between region A and region B) + 1/5*(percentage difference in Height between region A and region B) + 1/5*(percentage difference in Rectangularity between region A and region B) + 1/5*(percentage difference in Elongatedness between region A and region B)
This forms a comparison between each region and all the others in the image. Bet Squares
are the only markings on a Blackjack table which are repeated across its surface. Any
region deemed similar to four or more others is declared a Bet Square [Fig. 4.2.2.g] and
its co-ordinates and orientation are saved to file.
Fig. 4.2.2.f
Fig. 4.2.2.g
Figure 4.2.2.f shows the result of Iterative Connected Components performed on Fig. 4.2.2.d. Figure 4.2.2.g indicates (by red and white markings) the identification of the Bet Squares as a result of statistical analysis. Thus all necessary information regarding the positioning and orientation of critical
gaming areas has been extracted and saved to file. This completes the initialisation
30
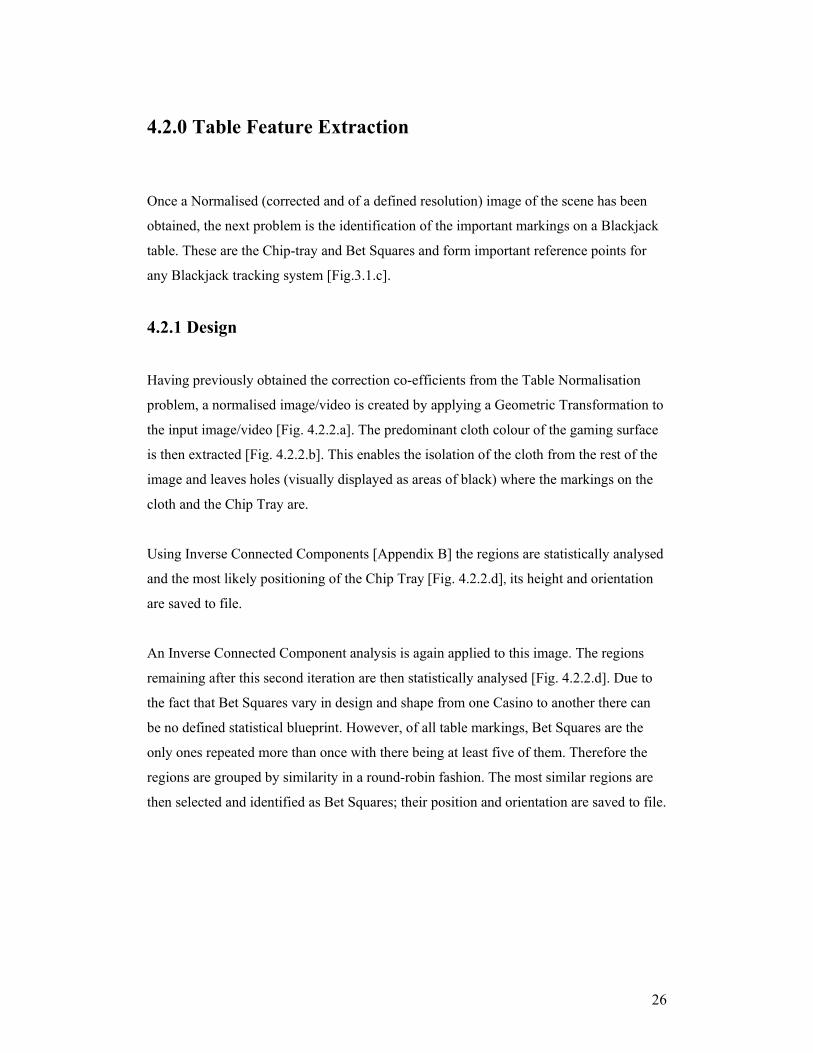
process of the system. The system displays the results of initialisation for a human
operative to confirm before execution on the video input commences [Fig. 4.2.2.h].
Fig. 4.2.2.h
Figure 4.2.2.h shows the final output from the initialisation phase of the system. The image is normalised and the relevant Table Features are indicated (by red, white and blue markings).

31
4.3.0 Card Extraction
Once the initialisation steps are complete the parent (or wrapper) class which resides in
the Trinity Image Processing System [TIPS04] is able to execute the game-tracking
elements of the system. Through the parent class all input images are normalised using
the co-efficients stored in a file from the solution to the Table Normalisation problem. In
addition this class sets up "action areas" (areas of the gaming table in which play takes
place) [Fig. 4.3.0.a]. These are derived from table feature co-ordinates, orientations and
dimensions extracted from the second part of the initialisation process. Each action area is
normalised (automatically rotated) by the orientation attribute previously obtained from
analysis of the table feature on which it is based. When a card is placed in one of these
action areas it is first extracted and then its value is identified.
Fig. 4.3.0.a
Figure 4.3.0.a shows the action areas attributed to each player (numbered). They share their orientation values with the Bet Square contained within (and in the case of the Croupier; the Chip Tray). There is overlap. This has to be dealt with to ensure cards get attributed to the correct player [cf. 4.3.2]. The Card Extraction and Recognition solution is applied to each of these action areas on a
frame-by-frame basis.

32
4.3.1 Design
The extraction of a playing card from a scene is most accurately done when the card is
stationary. The current action area frame is compared to the previous action area frame. If
there is a significant difference between these two frames then we can assume a card is in
the process of being placed down or taken up. A moving card is difficult to extract, it has
not been placed yet and it could get attributed to a player to whom it does not belong.
When there is very little difference (allowing for random noise), between concurrent
frames (this indicates that the card has been placed/taken up; the scene is stable),
processing can occur. The first step is to isolate anything which has been placed on the
table. This is done by subtracting a background image of the action area from the current
action area frame [Fig. 4.3.2.c].
The result is an image containing only that which has been added onto the gaming surface
within the action area. Connected Components is applied and the image is scanned to see
if any of the regions (added to the action area) exhibit the properties of a card or a set of
cards. If a positive match is found an edge image is generated. This is done using
Robert’s Cross edge detection10. Next all points on the edge are stored in the order they
would be traversed by a Boundary Chain Code11.
Analysing this "chain" the local maximums and minimums are determined. These
represent the edges of cards or the points at which cards collide. The extraction of the last
card placed in the set is then possible.
4.3.2 Implementation
By subtracting the previous action area frame from the current action area frame it is
possible to determine when the scene is stable, that is, there is very little difference
10 Robert’s cross - Taking a binary image a 2x2 convolution filter of two masks [1,0,0,-1] and [0,1,-1,0] is applied. A Convolution filter determines the value at a pixel by summing the results of the applied masks to an area surrounding the pixel. The design of the masks creates an edge image; the sum value will only be greater than 0 when area under mask is a mix of both binary image values. 11 Boundary Chain code - A method used to describe an edge. E.g. the binary chain code 1,1,2,1,3,1 could represent an edge that goes from a starting pixel Up, Up, Right, Up, Left, Up. Where Up, Right and Left denote a one pixel movement in that direction.

33
between the frames. Once the scene is deemed to be stable the background is subtracted
from the action area image [Fig. 4.3.2.c]. One problem with using subtraction is that
when a card is placed in an action area, if it is laid on top of a table marking, the white of
the table marking is subtracted from the card literally splitting the subtraction image of
the card in two [Fig. 4.3.2.c]. A thresholding step, over the luminance channel, is
performed to remove the majority of noise.
Fig. 4.3.2.a
Fig. 4.3.2.b
Fig. 4.3.2.c
Fig. 4.3.2.d
Figure 4.3.2a is a typical input frame of an action area. Figure 4.3.2b is its background image. Subtraction of these gives us Figure 4.3.2.c; note the subtraction problem caused by the table markings and the noise effects. Figure 4.3.2.d shows noise reduction following the threshold step.
To overcome the subtraction problem a Dilation step (two iterations), followed by an
Erosion step (three iterations), followed by a further (two iteration) Dilation step is
applied. This has the effect of repairing any splitting due to a collision between a card and
white table markings. This is termed closing as it has the effect of closing small holes in
the non-background of images. It also removes most detail [Fig. 4.3.2.e].
A Connected Component, coupled with statistical, analysis is used to determine likely
cards/cardsets [Fig. 4.3.2.f]. If none exist there is a check to see whether there are chips
present. As tracking of chips is beyond this first step implementation of the system, it is
important to remove them from the image being processed. If no cards but some chips are

34
recognised then the background is updated. The background now includes the gaming
action area and any chips placed in this action area [Fig. 4.3.2.b].
Fig. 4.3.2.e
Fig. 4.3.2.f
Figure 4.3.2.e shows the result of the Erosion and Dilation steps. Figure 4.3.2.f shows the division into regions of the image after Connected Components analysis.
If a card/cardset is present there are further Erosion/Dilation steps. An Erosion followed
by multiple Dilations followed by an Erosion. This has the effect of "cleaning" the edges
of non-background components of the image which are particularly subject to noise
during the subtraction process. It also ensures that any dots or pictures present on the
cards, if not removed previously, are now "filled in". At this stage card recognition is not
as important as the extraction of “clean” edge segments; being able to clearly obtain the
edges of the final card is prime objective [Fig. 4.3.2.g].
Next the Robert’s cross edge detector is applied. Robert’s cross is preferred to other edge
detectors as the edge image it creates is only one pixel wide at any point. This is very
important when a Boundary Chain Code has to be generated (a multi-pixel wide edge
image would add greater complexity to the algorithm). The drawback to using Robert’s
cross is that it causes a half pixel shift. This is because it uses a 2x2 mask which has no
defined central pixel. Selecting one arbitrarily causes a half pixel shift (both vertically and
horizontally). This means that there is a need for greater flexibility in the recognition
stage of the system as the image will be slightly shifted out of phase with the edge image
which determines the position of the last card [Fig. 4.3.2.h]. Once the edge image has
been obtained there is a Connected Components step. This is to determine how many
possible card sets are in the action area (which can often overlap an adjoining action
area). The most suitable cardset edge image is identified by proximity [Fig. 4.3.2.i].

35
Fig. 4.3.2.g
Fig. 4.3.2.h
Fig.4.3.2.i
Figure 4.3.2.g shows the result of the second round of Erode and Dilate steps. Figure 4.3.2.h shows the result of applying Robert’s Cross Edge Detector. Figure 4.3.2.j shows the isolation of the most likely cardset from the image.
Each point on the edge is then stored in an order as if it were being traversed. This is very
similar to a Boundary Chain Code. Once the "Boundary Chain Code" has been
determined it is analysed for local maximums and minimums that are calculated from
each point’s distance to a central axis line. The fact that playing cards have a right angled
shape means that outside edges and internal crossing points show up as maximums and
minimums respectively. The central axis line is an imaginary line between the top left-
most corner of the first card in a set and the bottom right-most corner of the last card in a
set. These points are easy to find because they are those points on the edge image which
are furthest apart [Fig. 4.3.2.j, Fig. 4.3.2.k]. They are always guaranteed to be the points
which are furthest apart because of the manner in which Blackjack is dealt [Appendix A].
Fig. 4.3.2.j
Fig. 4.3.2.k
Figure 4.3.2.j demonstrates the method of edge analysis used on a card set. Figure 4.3.2.k illustrates the corners detected. White denotes furthest apart points, red denotes local maximums and blue denotes local minimums.

36
Once all corners are marked on the cardset then the co-ordinates of the final card can be
calculated from them. Notice that for multiple cards the top-left corner of the final card
cannot be clearly found due to overlapping. The positioning of this corner is inferred from
the distances between the other three corners and the angles between them. Once the co-
ordinates of the last card in the set are found, recognition of the card can commence.
It should be noted that this proved to be one of the most problematic aspects of the
problem situation. Initially the Card Extraction routine was implemented using Convex
Hull analysis [Appendix B]. This failed because when the cards were not placed correctly
the methods used to extract the corners would not work properly. This led to the
abandonment of this particular approach.

37
4.4.0 Card identification
Once the corners of the card to be extracted are known, they are used to generate the co-
efficient values needed to Geometrically Transform (Perspective Warp) the card to a
normalised image [Fig. 4.4.0.a, Fig. 4.4.0.b].
Fig. 4.4.0.a
Fig. 4.4.0.b
Figure 4.4.0.a shows the extraction of a card from the image; creating Figure 4.4.0.b. Figure 4.4.0.b illustrates the low-resolution that Card Recognition has to occur under.
4.4.1 Design
Using a Waterfill Thresholding12 [Fig. 4.4.2.a] technique the optimal threshold level for
the card is determined. This is the best threshold value through which the card being
analysed is filtered [Fig. 4.4.2.b]. It is selected so that all critical features present on the
cards surface are retained and non-critical features are repressed. In other words a
threshold is found that best demonstrates the features on the card. The pattern of the card
features is then analysed to determine the card’s value.
4.4.2 Implementation
The Normalised image of the extracted card is subjected to a Waterfill Threshold. This
means that images are created at various threshold levels [Fig. 4.4.2.a]. The image which
best displays the features on the card is selected. To determine this best threshold level 12 Waterfill Threshold – The creation of images of various threshold values. The image which satisfies criteria best is then selected.

38
connected component analysis is applied to each threshold level image. The image that
has the most number of possible “dot” regions is selected as the best level [Fig. 4.4.2.b].
This is the most efficient manner of implementing this system; by obtaining an image
with the most possible dots, the likelihood of overlooking a “true” dot is greatly reduced
while various methods are used to get rid of any false positives.
Fig. 4.4.2.a
Fig. 4.3.2.b
Figure 4.4.2.a depicts the result of a Waterfill Threshold on a Card Image. The differing colours represent the different threshold levels. The optimal threshold, selected from the Waterfill technique is shown in Figure 4.4.2.b.
Once the optimally thresholded image is obtained the other threshold images are
examined to see whether there are any that contain a region (or possible dot) which is
very large in size (over 1/3 the total area of the card). If this type of dot exists then this
card does not have regular pattern of dots, but instead contains a picture [Fig. 4.4.2.c,
Fig.4.4.2.d]. Identified as a picture card its value is recognised as ten. If no picture is
found using this method further processing is required to determine the card's value.
Fig. 4.4.2.c
Fig. 4.4.2.d
Figure 4.4.2.c shows the Queen of Clubs. Figure 4.4.2.d demonstrates a threshold level which allows the card to be recognised as one containing a picture on area analysis alone.

39
If the image does not contain a picture, the value of the card must be derived from the
dots on its surface. Due to low resolution and inaccuracies in the co-ordinates derived
from the Robert’s Cross edge image, the exact orientation of the card is somewhat
uncertain. A flexible solution is required.
If no dot exists, the card’s value cannot be determined and an undefined result is returned.
If dots are present, the angular relationship between each dot and all the other dots is
determined. If two dots are related by an angle correlating to that of the longest side of the
card then this result is noted. This is an important property; all number cards (excluding
aces) have dots which fulfil this criterion. If three or four dots are found to align together
this result is noted too. The number of sets of dots, which are aligned this way, possessed
by a card is a method of classifying the different types of number cards. Those with
multiple sets of dots parallel to the longest side of the card (value 4 - 10 inclusive) [Fig.
4.4.2.e (iii)], those with one set (2 - 3 inclusive) [Fig. 4.4.2.e (ii)] and those with no sets
(1 or undetermined) [Fig. 4.4.2.e (i)]. The fact that some of these sets may be of differing
sizes (due to the wrongful inclusion of a dot in the set) is not a problem; there are
correction steps to remove any false positives which might cause this to occur.
Fig. 4.4.2.e
Figure 4.4.2.e depicts the classification of cards under the parallel set property. Red circles indicate dots and a red outline box represents a set of dots parallel to the longest edge of the card. (i) has no parallel set of dots, (ii) has one, and (iii) has multiple.
There is correlation between the number of sets (of parallel dots) that a card possesses and
the value of the card. If no sets are found but there is a single dot, which is located in the
centre of the card, the card is recognised as an ace [Fig. 4.4.2.f (i)]; otherwise an
undefined result is returned. If no set exists but there are multiple (four or more) dots, the
lack of structure of the dots implies the card is a picture card and it has a value of ten
40
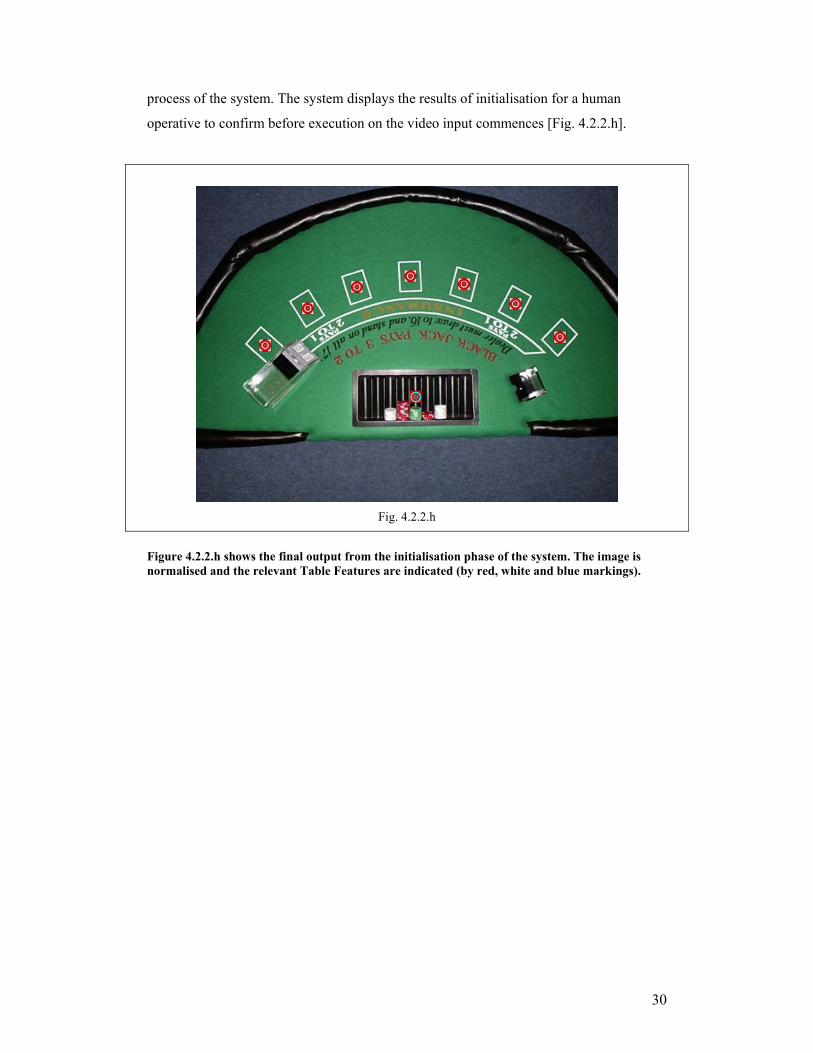
[Fig. 4.4.2.f (ii)]. If one set of dots exists [Fig. 4.4.2.f (iii)], the dots are evaluated to see if
they are positioned in a manner consistent with a card of value two or three; vertically,
centrally positioned over, under and possibly on a dividing horizontal axis line. If this
analysis confirms that the card is a two or three, that value is returned; otherwise it is
undefined.
Fig. 4.4.2.f
Figure 4.4.2.f depicts various cards under analysis. Red circles indicate dots and a red outline box represents a set of dots parallel to the longest edge of the card.
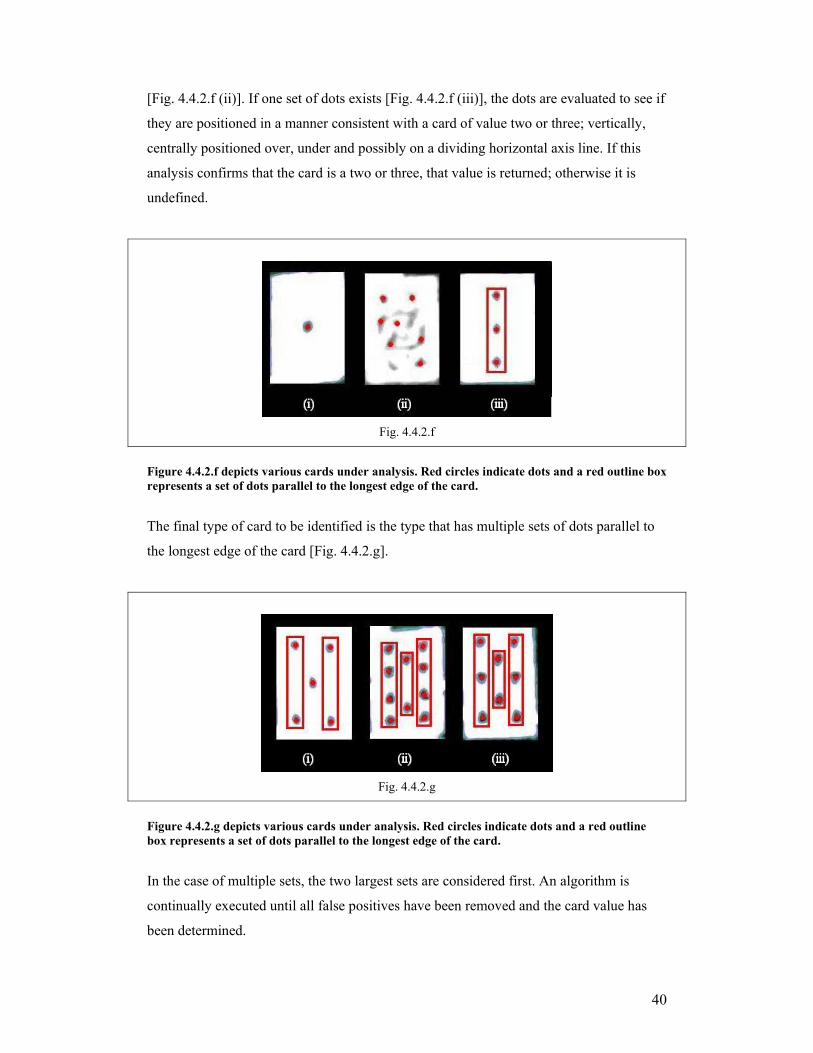
The final type of card to be identified is the type that has multiple sets of dots parallel to
the longest edge of the card [Fig. 4.4.2.g].
Fig. 4.4.2.g
Figure 4.4.2.g depicts various cards under analysis. Red circles indicate dots and a red outline box represents a set of dots parallel to the longest edge of the card.
In the case of multiple sets, the two largest sets are considered first. An algorithm is
continually executed until all false positives have been removed and the card value has
been determined.
41
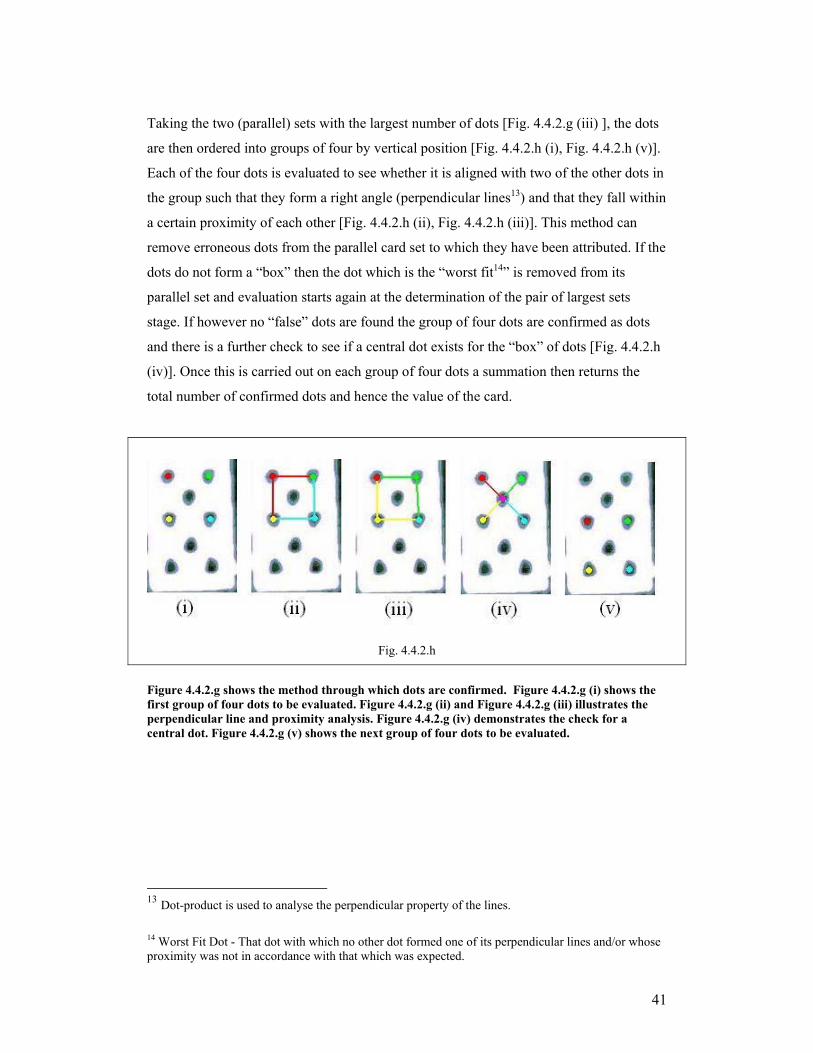
Taking the two (parallel) sets with the largest number of dots [Fig. 4.4.2.g (iii) ], the dots
are then ordered into groups of four by vertical position [Fig. 4.4.2.h (i), Fig. 4.4.2.h (v)].
Each of the four dots is evaluated to see whether it is aligned with two of the other dots in
the group such that they form a right angle (perpendicular lines13) and that they fall within
a certain proximity of each other [Fig. 4.4.2.h (ii), Fig. 4.4.2.h (iii)]. This method can
remove erroneous dots from the parallel card set to which they have been attributed. If the
dots do not form a “box” then the dot which is the “worst fit14” is removed from its
parallel set and evaluation starts again at the determination of the pair of largest sets
stage. If however no “false” dots are found the group of four dots are confirmed as dots
and there is a further check to see if a central dot exists for the “box” of dots [Fig. 4.4.2.h
(iv)]. Once this is carried out on each group of four dots a summation then returns the
total number of confirmed dots and hence the value of the card.
Fig. 4.4.2.h
Figure 4.4.2.g shows the method through which dots are confirmed. Figure 4.4.2.g (i) shows the first group of four dots to be evaluated. Figure 4.4.2.g (ii) and Figure 4.4.2.g (iii) illustrates the perpendicular line and proximity analysis. Figure 4.4.2.g (iv) demonstrates the check for a central dot. Figure 4.4.2.g (v) shows the next group of four dots to be evaluated.
13 Dot-product is used to analyse the perpendicular property of the lines. 14 Worst Fit Dot - That dot with which no other dot formed one of its perpendicular lines and/or whose proximity was not in accordance with that which was expected.

42
4.5.0 Data Processing
This is the only part of the system which is not Machine Vision in nature. The parent
class (residing in the Trinity Image Processing System [TIP04]) that contains the system
also performs all Data Processing tasks. This means that all data extracted by Machine
Vision analysis, is presented in a meaningful way through its interpretation by the Data
Processing part of the system. The system displays in textual form all cards on the table at
any given point of the game and the win/loss ratios for the players and croupier.
4.5.1 Design
When the parent class is notified that a new card has been placed in a player’s action area,
confirmation of the card's value is gained from ensuring that the value is consistent over
preceding frames. Once the value has been confirmed it is added to a record of all cards
that that player currently holds. When a player’s hand is cleared, the last known value of
the card set attributed to that player is compared to that of the Croupier’s to determine a
winner. The result is then stored and the data relating to that hand is cleared in
preparation for the next hand to be played.
4.5.2 Implementation
The Machine Vision element of the system returns a large amount of data to be
interpreted. From this data it can be determined when the table is clear and when it is not,
what cards are on the table and how many. The data processing element of this system is
set up as a very simple finite state machine consisting of three states. These are:
Waiting for a New Card State: In this state the Data Processing element is awaiting notification from a Machine Vision source that a new card has been placed in the action area. If one is placed the state changes to the Confirmation of Card State. Confirmation of Card State: In this state the Data Processing element is ensuring that a card has been recognised as having the same value over multiple frames before it confirms the card’s value. Once it is satisfied with a particular card’s value, statistics dealing with the current state of play are updated and the state returns to the Waiting for a New Card State. Action Area Clear State: If at any point during the game an action area is deemed to be clear (empty) when evaluation of previous frames confirmed cards had been present in the action area, then this state is entered. The total of the previous cardset is compared to that of the opposing player(s) in the game (for the players this is the Croupier and vice versa). The win/loss ratios are then updated and Data Processing is returned to the Waiting for a New Card State.

43
Fig. 4.5.2.a
Figure 4.5.2.a illustrates the transition diagram for the Data Processing Finite State Machine.
The Data Processing element uses application windows to display statistics. This ensures
that extracted data from the scene is always presentable in a manner that can be easily
interpreted by a human observer.

44
5.0 Further Notes on Implementation - Specific problems encountered and how they were overcome.
The final design takes in three inputs:
A video input/feed of the Blackjack game to be monitored.
A background image of the Blackjack table when empty.
An image of the Blackjack table with the calibration board centred on it.
It is important that all these images are obtained using the same static camera. The Table
Normalisation and Feature Extraction solutions form a separately executed system which
saves important parameters to file. Inputs to this part are still images; the background
image of the table and the image of the table including the calibration board. Once the
parameters have been stored the second part of the solution can be executed. The inputs to
this part are the background image and the video feed.
5.1 Automation of Manually Set Parameters
Within the program itself there are many variable parameters which need to be set
manually. Automation of these is possible. Proof of this is the successful implementation
of the Waterfill Threshold technique [c.f. 4.4.2] [SONKA]. By implementing further
techniques like this, especially in the initialisation stage, the system could automatically
determine how to set parameters. Indeed values for parameters obtained during
initialisation in this manner could be used in later stages so that no extra overhead will be
incurred in any processing critical stages (Card Extraction, Card Recognition and Data
Processing).
5.2 Single Pass Iterative Connected Components Filter
Considering a practical implementation of the project, it was important to keep processing
efficiency in mind during development. One of the most commonly executed Machine
Vision Methods in this system is that of Connected Components. The development of a
Single-Pass Iterative Connected Components filter, rather than the use of an existing Dual

45
Pass Filter, was particularly important to the systems operating speed and implementation
gave the system a marked improvement in performance [See Appendix B for more
detail].
5.3 Difference between a Player’s and the Croupier's hands
There are some fundamentally different aspects in the manner in which the Croupier’s
hand and the player’s hand are dealt with by the system. The Croupier’s action area is
always in a state of flux; the Croupier’s hands are constantly moving across it distributing
cards and chips alike. Therefore it is necessary for the Croupier’s action area to be
processed at times of movement. Cards partially occluded by the Croupier’s hands are
omitted from the analysis (occlusion is detected by the fact that the region composed of
the occluded card will infringe on the area containing the Chip Tray as the Croupier leans
over it). Each card belonging to the Croupier is treated as a separate card set. The
Croupier's total is recalculated in each frame. This allows the Croupier a greater ability to
move their cards around (during a game) without the system losing track of them.
Another issue is the manner in which Croupier’s cards are placed [Fig. 5.3.a]. To ensure
that the Dilation steps [cf. 4.3.2] do not cause a joining of the cards they are omitted from
the analysis of the Croupier's action area [Fig. 5.3.b]. Instead Inverse Connected
Components is used to generate a "hole image" of the action area. Adding this to the
image and using a one pixel closing step removes most of the markings on the interior of
the card and provides a smooth enough image from which to create the edge image
needed for further analysis.
Fig. 5.3.a
Fig. 5.3.b
Figure 5.3.a demonstrates how the relative placement of the Croupier’s cards would leave them vulnerable to “joining” after a Dilation step as shown in Figure 5.3.b.
46
5.4 Adaptive Background
One of the major problems found with the simulation footage used for the development of
this system, was that the footage was obtained using a camera which was not entirely
stationary. This caused a problem element which would not normally be encountered in a
real-world implementation; the background and input image were constantly out of phase
due to camera movement. An adaptive background was introduced on a per action area
basis to remedy this. This means that the background was updated each time an action
area was deemed clear of cards and chips. While the main body of the program was
robust enough to work successfully with this problem some peripheral features suffered a
complete collapse. A routine for the detection of illegal movement of chips by a player
would give a false positive result every time a slight shift in the camera occurred. This
happened because the routine was based on the detection of movement of chips during a
game, movement of the camera fulfilled the criteria and a false positive was returned. The
other part to suffer was the detection of whether or not the cards dealt by the Croupier
were placed properly on the table. This failed due to the fact that drifting subtraction
effects (due to the subtraction problem [c.f. 4.2.2]) caused the registering of a misdealt
hand. Neither of these problems were overcome satisfactorily due to timing constraints.
They are relatively minor problems and would require only a small amount of
modification in order to function correctly.
5.5 Degradation of System The two main factors, which determine when the system fails to work properly, are
the resolution and frame rate of the input. As both frame rate and resolution are
proportional to processing required it is important to minimise both, particularly if the
system under development is expected to work in real-time.
It was found that the system worked better (but slower) under higher frame rates. A
frame rate of four frames per second would cause miss rates (failure to recognise a
card) of up to 35%15, doubling of the frame rate to eight frames a second causes the
15 of test footage used. Approximate values only.

47
miss rate to drop significantly to about 3%15. There were similar results in relation to
resolution. At a resolution of 320 x 250 (encapsulating an image of the entire
Blackjack table) an error rate of 45-50%15 was determined. However a resolution of
360 x 290 has an error rate of roughly 4%15. The part of the system that is most
sensitive to resolution is the Table Feature Extraction. Low resolution causes severe
inaccuracies in the extraction of values for the orientation of Bet Squares. Raising the
resolution further would cause error rates to fall but would also require more
processing. To achieve a real-time system (on a 2.4 GHz processor) a frame rate of
8.3 frames per second and a resolution of 360 x 290 are suggested.

48
6.0 Review
6.1 Summary
The system was able to efficiently track a simple game of Blackjack. This involves the
successful identification of cards placed on the table and identification of the current state
of play during a game. The system compiles statistics not generally available to Casino’s
today. The system (if executed on a modern processor) works in real-time.
Accompanying this report is a Compact Disc containing the test sequences used in the
development of this system. The following figures [c.f. 6.2] show a typical run of the
system.
The system (when run on 2.4GHZ processors and above) executes in real-time on video
footage provided at a rate of 25 frames per 3 seconds. This is despite a substantial
processing overhead due to its implementation within the Trinity Image Processing
System [TIP04] which was not developed as a time-critical application.
6.2 Example Results
This is a demonstration of the system in operation. Each of the following figures [Fig.
6.2.a to Fig. 6.2.g] is a screen shot taken of the system while it was functioning.
It is very difficult to provide a comprehensive overview of the system running as it is
designed to accumulate data over thousands of frames. It is because of this reason that
this section includes a description of how to execute a live demonstration of the system
using the Trinity Image Processing System environment [TIP04]. For a more complete
demonstration it is advised that one of the test situations (provided on the compact disc
which accompanies this report) is run.

49
Table Normalisation and Feature Extraction Figure 6.2.a illustrates a typical instance of the Table Normalisation and Feature
Extraction elements of the system being carried out.
Fig. 6.2.a
Figure 6.2.a shows the execution of the initialisation stage of the system. As can be seen
from the screen shot the system is encapsulated within the TIPS [TIP04] environment.
Using menu items the required input images are loaded into TIPS. Input A is the input
image of the empty Blackjack Table. Input B is an image from the same camera except
the calibration board has been placed on the gaming surface. By evoking the menu
operation User Defined Operation 9 from the TIPS menu (as indicated) the initialisation
process is executed. The Result is the Normalised output of this process. On the resultant
image Table features are indicated; Bet Squares by blue dots and Chip Tray by red. An
important output, which is not displayed, is that of the file containing all the data
extracted from the initialisation stage.
50
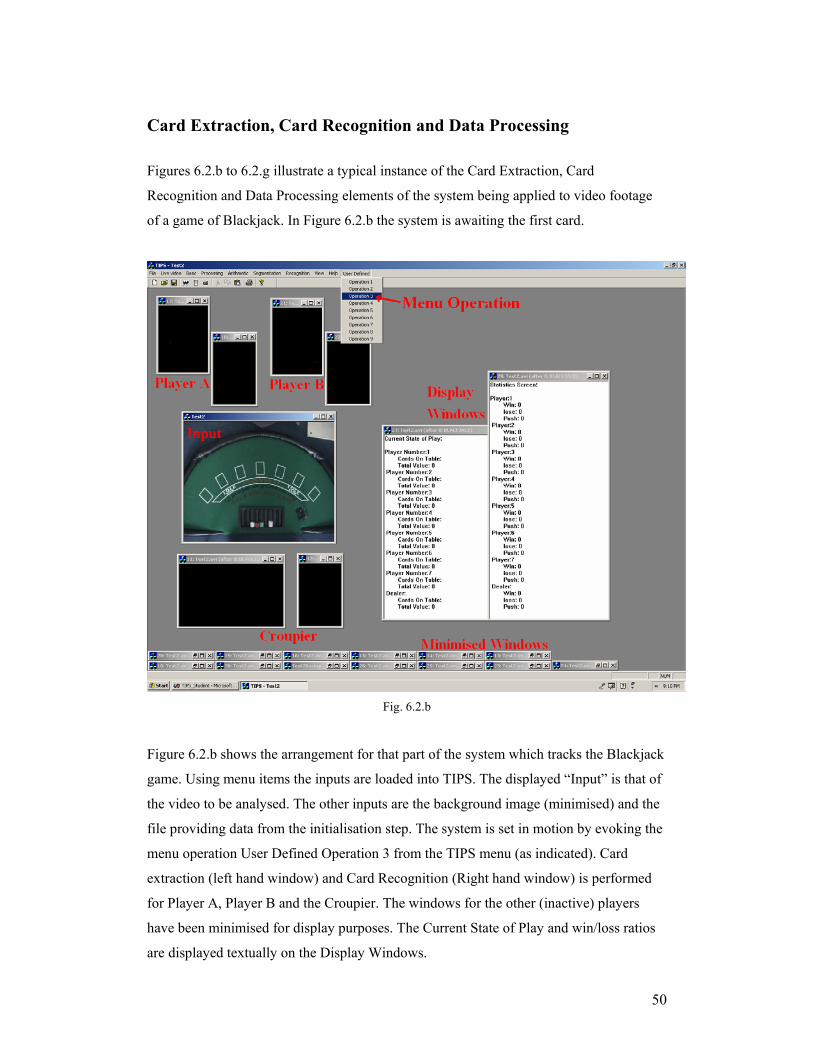
Card Extraction, Card Recognition and Data Processing Figures 6.2.b to 6.2.g illustrate a typical instance of the Card Extraction, Card
Recognition and Data Processing elements of the system being applied to video footage
of a game of Blackjack. In Figure 6.2.b the system is awaiting the first card.
Fig. 6.2.b
Figure 6.2.b shows the arrangement for that part of the system which tracks the Blackjack
game. Using menu items the inputs are loaded into TIPS. The displayed “Input” is that of
the video to be analysed. The other inputs are the background image (minimised) and the
file providing data from the initialisation step. The system is set in motion by evoking the
menu operation User Defined Operation 3 from the TIPS menu (as indicated). Card
extraction (left hand window) and Card Recognition (Right hand window) is performed
for Player A, Player B and the Croupier. The windows for the other (inactive) players
have been minimised for display purposes. The Current State of Play and win/loss ratios
are displayed textually on the Display Windows.
51
Fig.6.2.c In Figure 6.2.c the state of play is that of a clear table (i.e. the game is between hands). Current State of Play statistics reflect this, as do the action area displays; they are empty. The Players’ win/loss ratios show that three hands have already been evaluated by the system. The cards shown are the last cards evaluated from the previous hand. The card displays will not be updated until a new card is placed in the action area to which they are linked.
Fig. 6.2.d
Figure 6.2.d shows the game that was dealt following Figure 6.2.c. So far six cards have been laid on the table. Five of these have been recognised this is reflected by the Current State of Play statistics. The seven of clubs dealt to player A, although recognised in the card display (red pixels are added to dots when the card is recognised [c.f. 4.4.2]), it has not been confirmed in enough consecutive frames to be confirmed by the Data Processing element. Figure 6.2.d also displays the action area edge images from which Card Extraction takes place.

52
Fig. 6.2.e Figure 6.2.e is a continuation of the same game as depicted in Figures 6.2.c and 6.2.d. The game is now complete. The next step for the dealer is to clear the cards and collect or pay out chips accordingly. The Current State of Play has recognised all cards except for the Croupier’s ace (as it has not yet been confirmed by the Data Processing element). Despite the ace being the last card placed, the Croupier’s card display shows an eight. There are three cards in the Croupier’s hand, and recognition is performed on each card every frame. The Croupier’s card display is updated three times a frame. At the exact time of the screenshot the eight of clubs was the card being evaluated [c.f. 5.3].
Fig. 6.2.f
Figure 6.2.f shows the game after the Croupier has cleared Player B’s cards. Notice that the win/loss ratios for Player B and the Croupier have been updated. Player B’s action area display is now empty as his/her hand is finished until the next game is dealt.
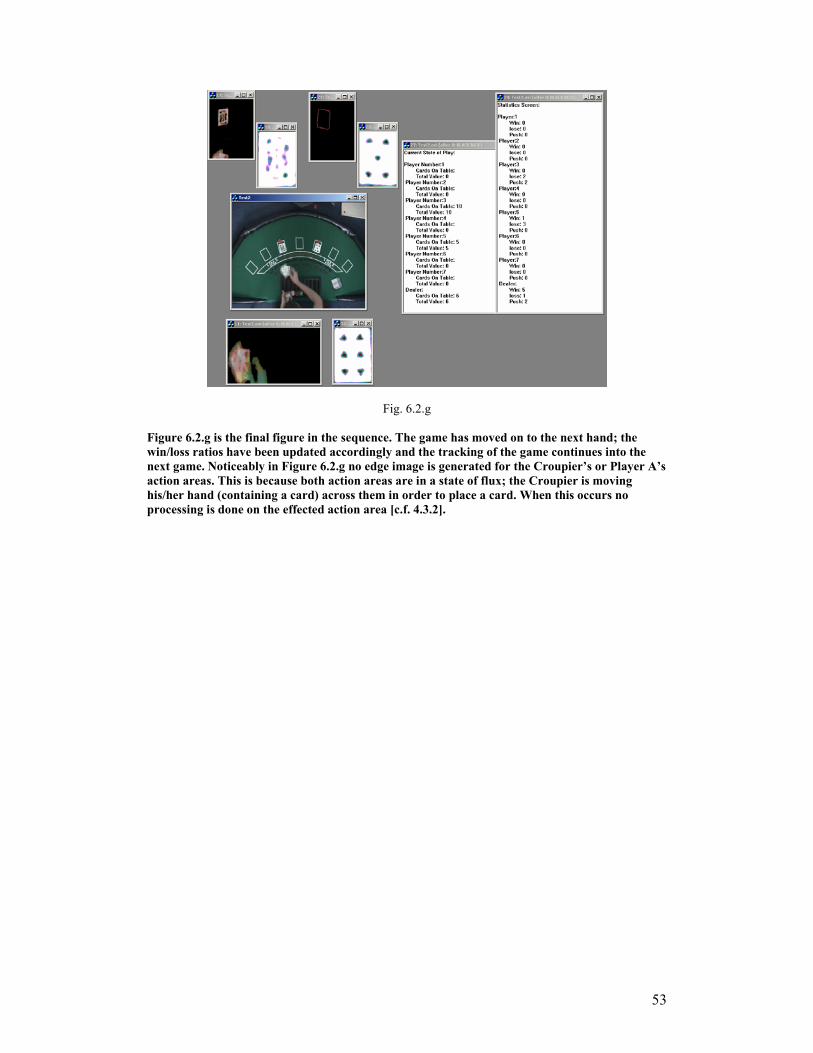
53
Fig. 6.2.g
Figure 6.2.g is the final figure in the sequence. The game has moved on to the next hand; the win/loss ratios have been updated accordingly and the tracking of the game continues into the next game. Noticeably in Figure 6.2.g no edge image is generated for the Croupier’s or Player A’s action areas. This is because both action areas are in a state of flux; the Croupier is moving his/her hand (containing a card) across them in order to place a card. When this occurs no processing is done on the effected action area [c.f. 4.3.2].

54
6.3 Future Work
This project shows that Machine Vision can provide a real-time solution to surveillance
objectives in a Casino Gaming environment. Further development involves refinement of
the existing system and its extraction from Tips (which should provide enough processing
space to use a higher resolution image and so increase accuracy without losing real-time
processing). To create a full gaming surveillance system it is important to include all
aspects of the game (Blackjack). Doubling down, splitting pairs and insurance all have
yet to be implemented [Appendix A]. Chips and their values have to be monitored also.
Complete automation of parameters also has to be obtained. Recognition of players would
also be an import feature for a Casino to have so that player’s statistics can be tracked
over multiple games, at different tables and over numerous visits to the Casino. Most
importantly it has to be applied to an actual gaming situation to test the system under real-
world conditions.
6.4 Conclusion
Real-time processing and extraction of data from any environment, in which human
interaction is a factor, is a very difficult problem. This project shows that, in the particular
instance of a Casino gaming environment, a solution is possible. Real-time card
recognition is one of the most difficult areas with which to contend in the development of
an automated Casino surveillance system. The complexity of the problem and its solution
were far greater then I imagined when I first proposed the project. The enjoyment gained
and lessons learnt will stay with me throughout my professional life and have encouraged
me to consider a career in research.

55
7.0 Bibliography
[SONKA99] M.Sonka, V. Hlavac, R. Boyle
“Image Processing, Analysis, and Machine vision” PWS publishing, Second Edition, 1999
[EGVW00] Seth Eatinger, Ben Graf, Micheal Victory, Ray Wagner
"Playing Card Recognition Project"
www.owlnet.rice.edu/~rwagner/play.html
2000
[MP03] Unaccredited
"Mind Play 21 - product brochure"
www.mindplay.biz
2003
[MP01] Mario Palofax
"The Stateline Casino Pit Manual"
Unavailable
2001
[RLP99] Volker Rehrmann, Raimund Lakmann, Lutz Priese
"A parallel system for real-time traffic sign recognition"
Image Recognition Laboratory
University of Koblenz-Landau
1999
[BDH96] C. Bradford Barber, David P.Dobkin, Hannu Hudanpaa
"The Quickhull Algorithm for convex hulls"
Princeton University, NJ, University of Minnesota,
and Configured Energy Systems Inc
1996

56
[RSK00] Uwe Rösler, William Stiger, Davd Kravitz “A New Ultimate Convex Hull Algoritm in R2” C-A-Universität zu Kiel, Rutgers University, University of Delaware 2000 [CH97] Yuntao Cui and Qian Huang
“Automatic Licence Extraction from Moving Vehicles”
Siemens Corporate Research Inc.
Princeton NJ
1997
[SKI97] Steven S. Skiena
"The Algorithm Design manual"
Telos Paperback, US, first edition
1997
[Gav98] D.M. Garvrila
"Multi-feature Hierarchical Template Matching Using Distance
Transforms"
Daimler-Benz AG Research and Technology, Germany
1998
[PRSL94] Lutz Priese, Volker Rehrmann, Rainer Schian, Raimund Lakmann
"Traffic Sign Recognition Based on Color Image Evaluation"
Image Recognition Laboratory, Universität Koblenz-Landau
1994
[BM94] Margrit Betke, Nicholas C. Makris
“Fast Object Recognition in Noisy images Using Simulated Annealing”
Laboratory for Computer Science
Massachusetts Institute of Technology
Cambridge, MA
1994

57
[LOW99] David G. Lowe
Object Recognition from Local Scale-Invariant Features
Computer Science Department
University of British Columbia, Vancouver, B.C
1999
Web Resources:
[COV04] Coverdale Management Consultancy
http://www.coverdale.co.uk/
[CNN04] CNN News Group
Article (Image Source)
www-cgi.cnn.com/US/ 9601/gambling/
[CV04] CVonline - Compendium of Computer Vision
Editor: Robert B. Fisher
School of Informatics
University of Edinburgh
http://homepages.inf.ed.ac.uk/rbf/CVonline/
Machine Vision Software Resources:
[TIP04] Trinity Image Processing System
Dr. Kenneth Dawson-Howe

58
Appendix A DIY: How to build a Blackjack Table What you need: MDF Wood measuring 3ft by 6ft. Foam 3ft by 6ft. Wadding. Leatherette. 5ft by 3ft Available from a casino supplier: E.g. www.gambling-equipment.co.uk Chip tray. Layout Cloth Discard Rack Step 1: Cut the wood to the following dimensions.
(Fig. a.1.1 – wooden base for blackjack table) Notice in Fig. a.1.1 the cut-out for the chip tray. Step 2: Place the foam covering over the wooden base, using a small amount of glue to hold it firm. Trim around the edges using an electric knife and cut out the area reserved for the chip tray.
(Fig. a.1.2 – foam covered base)
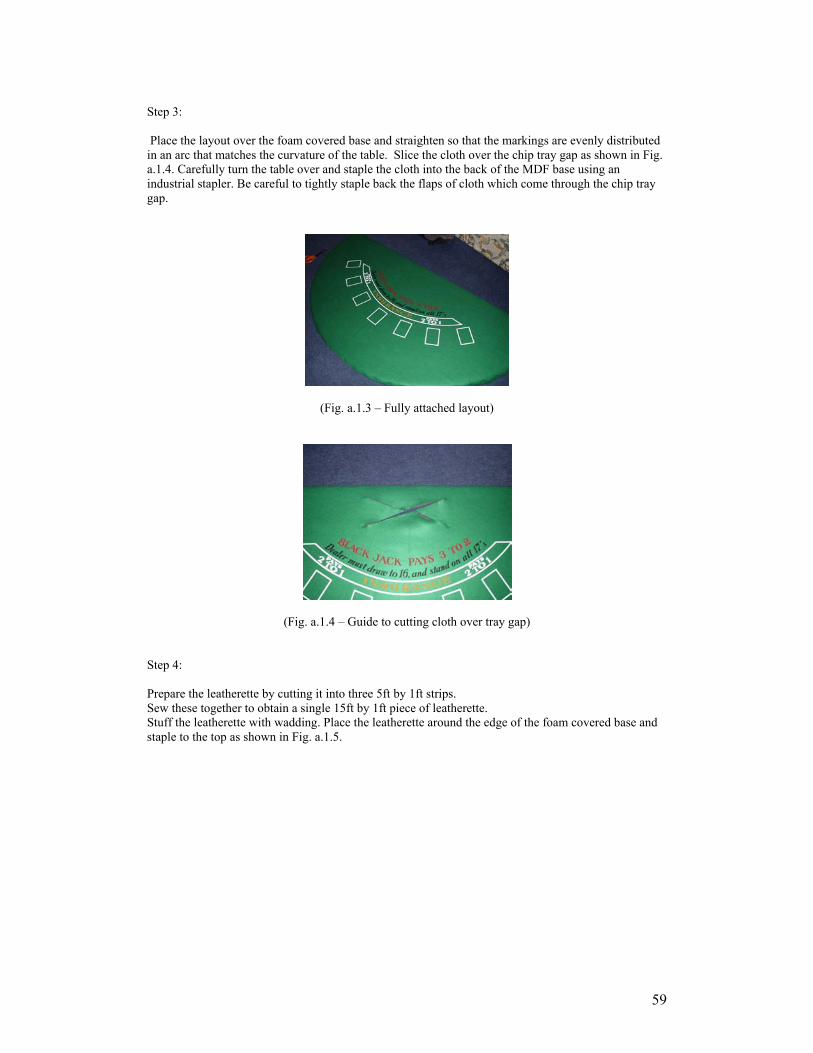
59
Step 3: Place the layout over the foam covered base and straighten so that the markings are evenly distributed in an arc that matches the curvature of the table. Slice the cloth over the chip tray gap as shown in Fig. a.1.4. Carefully turn the table over and staple the cloth into the back of the MDF base using an industrial stapler. Be careful to tightly staple back the flaps of cloth which come through the chip tray gap.
(Fig. a.1.3 – Fully attached layout)
(Fig. a.1.4 – Guide to cutting cloth over tray gap) Step 4: Prepare the leatherette by cutting it into three 5ft by 1ft strips. Sew these together to obtain a single 15ft by 1ft piece of leatherette. Stuff the leatherette with wadding. Place the leatherette around the edge of the foam covered base and staple to the top as shown in Fig. a.1.5.

60
(Fig. a.1.5 – manner of attaching leatherette to foam covered base) Pull leatherette over edge and firmly attach to underside to complete exterior padding. Step 5: Insert Chip Tray and screw in the discard rack (positions shown below).
(Fig. a.1.6 – finished result)

61
How to Play Blackjack
The object of the game is to draw cards that add up to 21, or as close as possible to 21 without going over. Everyone plays against the Croupier, who starts the game by dealing each player two cards and herself one, all of which are facing upwards. Once a player has been dealt both of their cards, she can either "Stand” (draw no more cards) or “hit” (be given additional cards). If the player’s card total is closer to 21 than the Croupier’s (without going over), you win. If it is less than the Croupier’s total you lose your bet. If a player exceeds 21 this condition is called "Bust", and the player immediately has a loosing hand. The Croupier must “hit” if her card count totals 16 or less. The Croupier must “stand” if her card count totals 17 or more. Ties are called “pushes” and no one wins on a push. The player does not lose her bet. Face cards count as ten. Aces count as 1 or 11, whichever is an advantage to the player, and all other cards count at face value. If the first card dealt to the Croupier is an Ace, the player may take an insurance bet against the Croupier having Blackjack. This bet pays 2 to 1. If a player has a winning hand which is “Blackjack”, (i.e. two cards; an ace and ten value card) then the house pays 3 to 2. Splitting Pairs If the first two cards dealt to a player is a pair (e.g. two 9’s, two 6’s) then the player has the option to split the pair into two separate hands. This is done by placing the same amount as the original bet next to the original bet. The Croupier will divide the hand into two separate hands which can then be played individually. Aces may be split, however the player will be dealt only one card on each ace and is not allowed to “hit” (receive any additional cards). Doubling Down Once a player has been dealt their first two cards, she then has the decision as to whether or not to double her bet. If a player decides to “Double Down”, chips to the same value as the original wager are placed on the left-hand edge of the bet square/circle. The player then receives one card. Once the player has received this card she is not allowed any additional cards (I.e. the player may not “hit” to improve their total). There is no doubling down allowed after a split.

62
Nuances of Dealing Blackjack which are pertinent to this
project
These regulations are rules which are generally used in all professional blackjack environments [MP01]. They are not restraints added as part of the project, but rather rules of the environment in which the project operates. A player indicates that she desires to play in a game of blackjack by placing a bet in the bet circle/square located directly in front of them. Each player is dealt one card in turn (clockwise) face up, after which the Croupier deals herself one card face up. The players then receive their second card dealt clockwise. At this stage each player has 2 cards and the Croupier only one. All cards are face up. Starting with the player on the Croupier's left ("first base"), each player is given the opportunity to play their hand (as described above) again in a clockwise manner. If a player "hits" a card and goes "bust", that player automatically has a loosing hand and the bet is removed immediately. When the final player on the Croupier’s right ("third base") has been taken care, of the Croupier deals herself another card face up. If the total value of the Croupier’s cards is less than 17 the Croupier must hit until either her hand has a value of 17 or more, or she "busts". If the Croupier "busts" all players with a wager remaining are deemed to have won. Otherwise only players with a hand totalling a number greater than the Croupier are winners. If a player has a total the same as the Croupier’s then this is termed a "push", and neither the house nor the player wins. All pays and collects are made in an anti-clockwise direction around the table with the cards being cleared as the wagers are paid out or collected. Placement of cards and chips is a very important part of blackjack security. Blackjack is mainly dealt from a shoe with the cards being placed between the relevant player’s bet square/circle and the Croupier. The cards overlap in a precise manner. The overlapping card is placed over the bottom right hand corner of the overlapped card. The top card must not obscure the centre of the underlying card. The Croupier’s hand is displayed differently. Each card is placed side by side directly in front of the Croupier with a gap of about 5mm between them. When placing a bet, it must be placed cleanly within the bet square/circle to be considered a wager. When doubling down or splitting pairs, the additional chips required for this wager are placed on the right hand edge (player’s perspective) of the bet square/circle. The insurance bet is placed directly in front of the players hand on the insurance curve. When placing this bet the player is expected to reach around her original wager. The player is not allowed to obscure her bet square/circle at any time. Once the first card has been dealt players are not allowed to disturb their bet in any way during a Blackjack game, indeed they are not allowed to place their hands anywhere near or over the bet squares/circles once a game commences. The end of the game is when the Croupier has collected up all the wagers and cards. Once the table is free of cards a player is free to move whatever chips may still be in the bet square/circle.
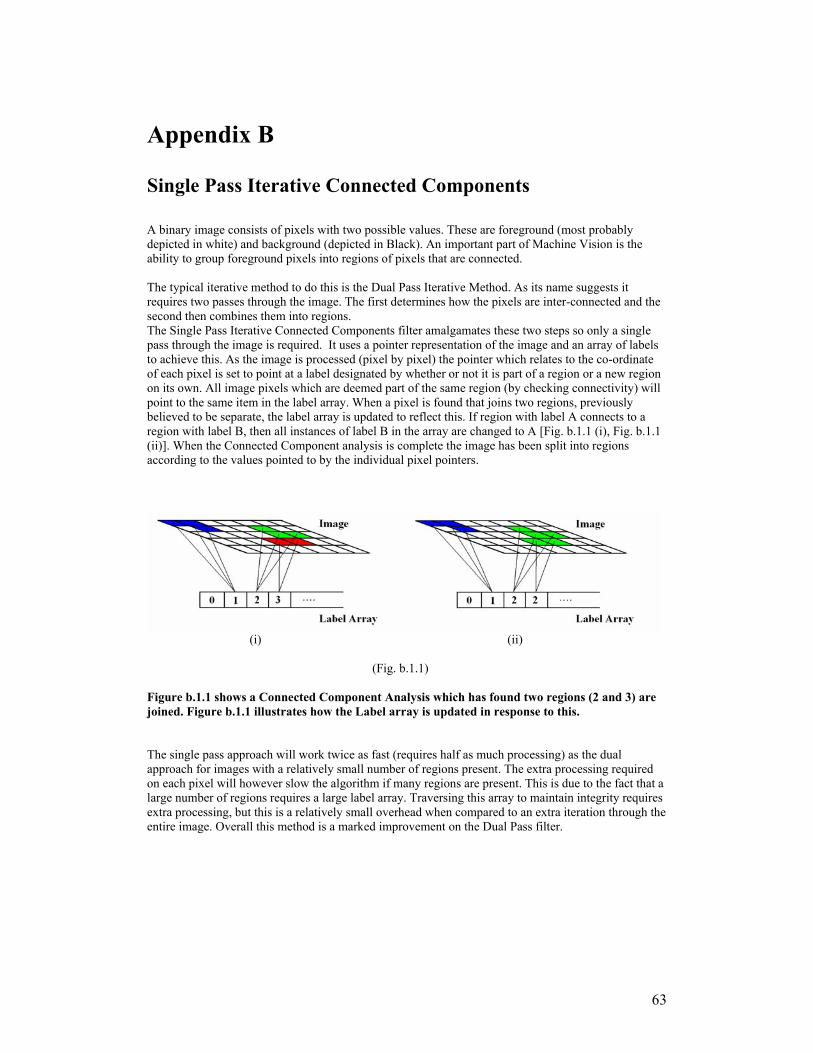
63
Appendix B
Single Pass Iterative Connected Components A binary image consists of pixels with two possible values. These are foreground (most probably depicted in white) and background (depicted in Black). An important part of Machine Vision is the ability to group foreground pixels into regions of pixels that are connected. The typical iterative method to do this is the Dual Pass Iterative Method. As its name suggests it requires two passes through the image. The first determines how the pixels are inter-connected and the second then combines them into regions. The Single Pass Iterative Connected Components filter amalgamates these two steps so only a single pass through the image is required. It uses a pointer representation of the image and an array of labels to achieve this. As the image is processed (pixel by pixel) the pointer which relates to the co-ordinate of each pixel is set to point at a label designated by whether or not it is part of a region or a new region on its own. All image pixels which are deemed part of the same region (by checking connectivity) will point to the same item in the label array. When a pixel is found that joins two regions, previously believed to be separate, the label array is updated to reflect this. If region with label A connects to a region with label B, then all instances of label B in the array are changed to A [Fig. b.1.1 (i), Fig. b.1.1 (ii)]. When the Connected Component analysis is complete the image has been split into regions according to the values pointed to by the individual pixel pointers.
(i) (ii) (Fig. b.1.1) Figure b.1.1 shows a Connected Component Analysis which has found two regions (2 and 3) are joined. Figure b.1.1 illustrates how the Label array is updated in response to this. The single pass approach will work twice as fast (requires half as much processing) as the dual approach for images with a relatively small number of regions present. The extra processing required on each pixel will however slow the algorithm if many regions are present. This is due to the fact that a large number of regions requires a large label array. Traversing this array to maintain integrity requires extra processing, but this is a relatively small overhead when compared to an extra iteration through the entire image. Overall this method is a marked improvement on the Dual Pass filter.

64
Convex Hull Taking a set S of n points in D dimensional space. The convex hull is the smallest convex polygon containing all points of S. Gift Wrap technique [SKI97] As this technique is only feasible in 2-D space this is an explanation of Gift Wrapping in 2-D. Taking a set S of n points in a 2 dimensional space, firstly sort the points in relation to the y axis low-high. Then identify the point with the lowest vertex (A). Incrementing along the sorted set find the point (B) for which all points in the set S are above or to one side of the line AB (i.e. the line AB does not exclude any members of the set S). Find the next point (C) such that all points are above or to one side of BC. Continue this iteratively until the highest point in the sorted set is reached. The Convex Hull will have been produced for half of the spatial description of set S. Repeat the technique from the highest vertex to the lowest to obtain the complete Convex Hull. The algorithm is O(nlogk) Where k denotes the number of edges (e.g. AB, BC….) Brief Notes on Ultimate Quickhull and Newhull [BDH96] [RSK00] Quickhull derives its name from Quicksort due to the similar construct that they both share. Quickhull is a recursive algorithm. Taking the set S of n points, a pivot is selected. This pivot is a chord of the convex hull i.e. it describes the line AB where A and B are known to be on the convex hull – the easiest way to obtain such a chord is to have the pivot representing the line between the highest and lowest points in S. Find the point which is furthest from AB, call this C. The points inside ABC cannot be on the hull and are put aside into set T0. Points outside edge AC are placed in set T1 and points outside edge BC are placed in set T2. Then Quickhull is recursively invoked on T1 and T2. Ultimate Quickhull and Newhull are both derivatives of Quickhull which used advanced algorithms to select the pivots in order to optimise speed. These algorithms are O(nlogn) Where n denotes the number of points Notice: In a circle n ≈ k and therefore both Gift Wrap and Ultimate Quickhull/Newhull algorithms are O(nlogn).


![[WIKI] Blackjack](https://static.documents.pub/doc/80x56/55cf8587550346484b8f0f32/wiki-blackjack.jpg)


