Density–distribution relationships in British butterflies. I. The effect of mobility and spatial scale
M. J. R. COWLEY*¶, C. D. THOMAS*, D. B. ROY†, R. J. WILSON*, J. L. LEÓN-CORTÉS*, D. GUTIÉRREZ*, C. R. BULMAN*, R. M. QUINN‡, D. MOSS† and K. J. GASTON§
*
Centre for Biodiversity & Conservation, University of Leeds, Leeds, LS2 9JT, UK;
†
Biological Records Centre, Institute of Terrestrial Ecology, Monks Wood, Abbots Ripton, Cambridgeshire, UK;
‡
Centre for Population Biology, Silwood Park, Ascot, UK; and
§
Biodiversity and Macroecology Group, Department of Animal and Plant Sciences, University of Sheffield, Sheffield, S10 2TN, UK
Summary
1.
Positive relationships between the density and distribution of species in taxonomicassemblages are well documented, but the underlying mechanisms remain poorlyunderstood. Two factors that are expected to be important in explaining variation in theserelationships are the spatial scale of analysis and the relative mobility of the study species.
2.
We examined density–distribution relationships in British butterflies at a variety ofspatial scales. Distributions were proportions of grid squares occupied: 50 m gridwithin 0·25 km
2
areas ( local), 500 m grid in 35 km
2
(regional), 10 km grid acrossEngland, Wales and Scotland (national), 153 000 km
2
grid squares across Europe(European), and also seven categories of international distribution (Global; 1 = Europeanendemic to 7 = in 5 + continents). Densities were measured using transect counts atlocal, regional and national scales.
3.
Different relationships between density and distribution occurred at different scalesof analysis. When we controlled for the effects of mobility and/or phylogenetic association,a positive relationship between density and distribution was apparent at local, regionaland national scales. Species’ national densities in Britain were positively correlated withtheir European distribution sizes, but significantly negatively correlated with theirglobal range sizes.
4.
Butterfly mobility had a positive effect on distribution and a negative effect on densityat all spatial scales. For a given total abundance, more mobile species had lower densitiesbut wider distributions, i.e. they were less aggregated than more sedentary species.
5.
The decreasing strength of the density–distribution correlation, and the eventualreversal of the pattern, with the increasing magnitude of difference between the scale atwhich density was measured relative to distribution, suggests that some element of nichemay be important in determining densities and distributions. However, the measure ofniche breadth analysed did not explain significant variation in density, distribution, orin the density–distribution relationship.
The local densities and regional distributions of speciesare not independent. Within an assemblage, speciesthat are locally common tend on average to be more
widespread than those that are locally rare. That is,there is a positive interspecific density–distributionrelationship. This pattern has been observed in a varietyof taxa, over a spectrum of spatial scales (for reviewssee Hanski 1982; Brown 1984; Gaston & Lawton1990; Hanski, Kouki & Halkka 1993; Lawton 1993;Gaston 1994a, 1996) and such is the volume of supportingevidence that it has been described as a general rule incommunity ecology (Hanski
Gaston, Blackburn & Lawton 1997). Eight principalmechanisms have been identified that could give rise tothe correlation, of which six can be considered biolog-ical whilst two imply that the relationship is artefactual(for a review see Gaston, Blackburn & Lawton 1997;see also Gaston, Blackburn & Lawton 1998; Hartley1998).
Many of the previous studies of interspecific density–distribution relationships have been concerned withestablishing its generality (Gaston 1996) and iden-tifying exceptions (Arita, Robinson & Redford 1990;Gaston & Lawton 1990). However, so many competinghypotheses predict a positive density–distribution rela-tionship (Gaston, Blackburn & Lawton 1997; Gaston
et al
. 1998; Hartley 1998) that simply documenting sucha relationship is of little help in distinguishing amongthe possible alternative causes. Thus, the exceptionsprovide particularly useful insights. The relationshiphas not yet been established for British butterflies, pre-vious studies having reported positive, zero and/ornegative relationships between density and distribu-tion depending on the data and analyses used (Hanski
et al
. 1993; Thomas
et al
. 1998; Dennis
et al
. 2000).One factor that has received little consideration, but
that is likely to be important in determining when apositive relationship is observed, is the spatial extent ofthe study (e.g. Brown & Nicoletto 1991; Gaston 1994a;Gaston & Blackburn 1996; Thomas
et al
. 1998). It hasbeen suggested that density–distribution correlationswill tend to become weaker as spatial extent increases(Brown 1984; Brown & Maurer 1987; Gaston 1994a),but no consistent pattern has yet emerged. Variation inthe form of the density–distribution relationship at dif-ferent spatial scales may also help identify the role ofthe various explanatory mechanisms that have beenproposed to explain the relationship. Only a few previ-ous studies have attempted this, and none has simult-aneously addressed the effects of species’ phylogeneticrelatedness (Bock 1987; Collins & Glen 1990; Niemelä& Spence 1994; Brown 1995; Thomas
et al
. 1998). Phylo-genetic relatedness should be examined because inter-specific density–distribution relationship could representsimple differences between taxonomic groups, ratherthan any general tendency for locally common speciesto be more widely distributed (cf. Harvey & Pagel 1991).
Here, we consider patterns in the density and distri-bution of British butterflies at local (0·25 km
2
),regional (35 km
2
), national (229 797 km
2
), European(10 400 000 km
2
) and global scales. We test: (i) if theform of the density–distribution relationship varies atdifferent spatial scales; (ii) if the relationship betweendensity and distribution becomes weaker as oneincreases the magnitude of the difference between thescale at which density is measured relative to that atwhich distribution is measured; (iii) the extent to whichdistribution sizes are correlated with distribution sizesmeasured at other spatial scales; and (iv) whether densitiesare correlated when they are measured over differentareas. The third and fourth questions are key issues in
macroecology (Gregory & Blackburn 1998). If densitiesand distributions are scale dependent, then studies thatonly consider a small proportion of the area occupiedby a species may not reflect broader patterns.
Understanding variation around the density–distribution relationship is also likely to help unravelthe roles of the various explanatory mechanisms(Hanski
et al
. 1993; Blackburn, Gaston & Gregory 1997;Quinn
et al
. 1997). Measures of butterfly mobility andniche breadth are included in the analysis. Mobility isconsidered important in relation to suggested meta-population dynamic mechanisms for the interspecificdensity–distribution relationship. These state that apositive density–distribution relationship may be gen-erated as a consequence of migration: species with highlocal densities will have low local extinction rates, andgenerate more migrants, decreasing the probability oflocal extinction elsewhere (rescue effect) and increasingthe colonization rate of empty habitats (Hanski 1991;Gyllenberg & Hanski 1992; Hanski
et al
. 1993). Aresultant prediction is that more dispersive speciesshould have wider distributions than less dispersivespecies of the same local density (Hanski
et al
. 1993).Several studies have suggested or documented that
more dispersive species do tend to have wider rangesizes than less dispersive species (Kunin & Gaston1993; Oakwood
et al
. 1993; Gaston 1994a; Gaston &Kunin 1997) and this has been demonstrated specifi-cally for British butterflies (Hodgson 1993; Dennis &Shreeve 1996, 1997; Dennis
et al
. 2000). The effects ofmobility on density–distribution relationships are lesswell established (Hanski
et al
. 1993).Variation in species niche or resource breadth has
also been proposed as an explanation for the interspe-cific density–distribution relationship. Brown (1984)argued that generalists able to use a wide range ofresources would become both widespread and locallyabundant, whilst more specialized species would beboth local and rare even where they do occur. Testsof this hypothesis have demonstrated positive cor-relations between niche breadth and distribution,although few have demonstrated a positive correlationbetween niche breadth and density (for a collation ofpublished studies, see Gaston, Blackburn & Lawton1997). Thomas & Mallorie (1985) found a positivecorrelation between the habitat breadth of Moroccanbutterflies and their European range sizes. Hodgson(1993) demonstrated that butterflies in Britain witha taxonomically wide range of food plants tend to bemore widely distributed than butterflies that use onlyone species or genus of host plant. Similarly, Dennis &Shreeve (1996, 1997) and Dennis
et al
. (2000) attrib-uted increased range size and incidence on offshoreislands partly to host plant and habitat range.
Unfortunately, many of the published correlationsbetween niche breadth and distribution suffer fromsample size effects (Gaston 1994a; Gaston, Blackburn& Lawton 1997). For example, if two species have thesame fundamental niche breadth, but differ in abundance
because natural enemies set their abundance, the moreabundant species is likely to be observed in morehabitats than the less abundant species. If niche breadthis measured as the number of habitats occupied, thiscould lead to an non-causative positive correlationbetween niche and distribution. Where sampling effectshave been accounted for, significant relationships bet-ween niche breadth and distributions have rarelybeen documented (Gaston, Blackburn & Lawton 1997).Intuitively, it seems reasonable to suppose that specieswith the ability to use a wide range of resources or witha wide ecological tolerance might be widely distributed,but it is not always so clear why they should also occurat higher density (Kouki & Häyrinen 1991; Hanski
et al
. 1993; Gaston, Blackburn & Lawton 1997).
Methods
Throughout the paper, we use the term ‘distribution’ torefer to the distribution size of species at each scale. Atlocal, regional, national and European scales this refersto the number of occupied grid squares, and at a globalscale to species’ entire geographical range sizes. In theterminology of Gaston (1991, 1994b) these are meas-ures of ‘area of occupancy’ (grid square counts) and‘extent of occurrence’ (range size).
The measure of density we employ is species’ meandensity where present. We refer to this simply as speciesdensity. Most comparative studies compare densitieswhere present or ‘ecological’ density as this avoids anartefactual relationship between density and distribu-tion resulting from the inclusion of increasing numbersof zeros in calculations of mean density for species thatoccur in fewer and fewer sites (Gaston 1996).
In the analyses, we compare butterfly density datacollected at local, regional and national scales withbutterfly distributions measured at the correspondingscales. For correlations between density and distribu-tion at European and global scales, we used species’national densities (i.e. from within Britain) with Euro-pean and global distributions; therefore, only a smallsubset of the European and global butterfly fauna isincluded.
All species density estimates were obtained using thebutterfly transect method (Pollard 1977; Pollard, Hall& Bibby 1986; Pollard & Yates 1993). This involvesa recorder counting the numbers of each speciesseen 2·5 m either side and 5 m in front of the recorderin weather suitable for butterfly activity. National,regional and local transect counts were all standardizedusing the same method (Pollard & Yates 1993) andreflect density where present, at the same resolution, inhabitat-based sampling units. Differences in the form ofthe density–distribution relationship measured at differentspatial scales must therefore be explained with referenceto scale rather than to methodological differences.
The butterfly transect method was first developed byPollard (1977) and was used solely for single speciescomparisons. This has also been the approach taken byall subsequent researchers, without actually testing itssuitability for multiple species comparisons. For singlespecies, the method is widely adopted and has beenvalidated in several studies (e.g. Thomas 1983; Pollard& Yates 1993). Our unpublished distance-measurementanalysis (D.M. Shuker & C.D. Thomas, unpublished)indicates that errors in density measures from thePollard transect approach are no greater between spe-cies than within species. Furthermore, the error is smallrelative to the total range of densities seen both withinand between species. Variation in visibility is also likelyto be linked to phylogeny. Visibility would mainly bea cause for concern if positive density–distributionrelationships disappeared or became weaker aftercarrying out phylogenetically controlled analysis (actuallythey became stronger).
The only species for which the method is unsuitableare five species that spend much of their time in the forestcanopy (
Satyrium pruni
L.
, Satyrium w-album
Knoch
,Thecla betulae
L.,
Quercusia quercus
L. and
Apaturairis
L.) and are therefore under-recorded on transectwalks (Pollard & Yates 1993). These species areexcluded from all analyses in the current paper (onlytwo of these species occur in the north Wales study area).
Variation in adult longevity also has the potentialto effect the reliability of multispecies comparisons.However, as with visibility, the life span of individualbutterflies is closely linked to phylogeny so this variationis effectively factored out in these analyses.
Two skipper butterflies,
Thymelicus sylvestris
Podaand
Thymelicus lineola
Ochsenheimer, are only distin-guished by the colour of the underside of the tip of theantenna, and cannot be distinguished in flight, so densityvalues are not used from transects where they co-occur.As there are no sites from which relative densities wereobtained with only
T. lineola
, this species was excludedfrom the analysis but
T. sylvestris
could be included.
Aricia agestis
Denis & Schiffermüller and
Aricia artax-erxes
Fabricus are practically indistinguishable, butallopatric. A few 10 km distribution records may beattributed to the wrong species, but this is likely to rep-resent a very low percentage of the total.
Pieris rapae
L.and
Pieris napi
L. are difficult to distinguish in flight andit is likely that mistakes will occur. Some of the nationalscale analyses were therefore repeated without them.At regional and local scales, only two recorders walkedall butterfly transects, so the quality of recording is con-sidered reliable enough to warrant their inclusion.
Local and regional butterfly density data were collectedin an approximately 35 km
2
area, the Creuddyn peninsula,located along the north coast of Wales, UK (53
This area is bordered by sea to the north and west, andby land to the south and east. The landscape is extremelymixed and includes a variety of semi-natural habitatsincluding limestone grassland, woodland, scrub, heath,coastal dune and bracken. The rest of the area consistsmainly of agricultural and urban habitats.
To stratify the collection of butterfly density data,the study area was divided into major land-use typesusing a classification derived from Phase-1 land coverfield data (JNCC 1990). Also included were additionalhabitats of relevance to butterflies that could be iden-tified from Ordnance Survey maps, e.g. drains, wood-land edge and road verge. In total, 16 coarse land-use(hereafter ‘habitat’) types were identified and in mostcases 10 samples of each were selected (Table 1). A but-terfly transect, usually 300 m in length, was locatedwithin each sample of a single habitat type. In total,there were 147 separate transect routes with a totallength of 43·1 km. Transects were walked every otherweek from April through to October 1997 and a stand-ardized yearly count was calculated for each site (totalnumber of individuals per 300 m per year). Species’regional densities were calculated as the mean of stand-ardized yearly counts at each site at which one or moreindividuals were recorded per 300 m per year.
The distribution of the 16 coarse habitat typesthat were used to stratify the study area can be usedto predict successfully the distributions and densitiesof individual butterfly species within the study region(Cowley
et al
. 2000). These habitats are therefore likelyto be correlated with environmental differences of rel-evance to the distributions and densities of butterflies.
For the collection of regional distribution data, thestudy area was divided into 140 cells using a 500-m grid,based on Ordnance Survey Maps (Ordnance Survey1994). Butterfly occurrences were collected at a 100-mresolution and expressed as species presence or absence
in each of the 500 m grid cells. Distributions were col-lected over a 3-year period (1996–98) by a team of fiveresearchers and are independent of the transect record-ing described above. During this sampling period morethan 14 000 distribution records were collected: an aver-age of over 100 records per grid square.
Five of the regional 500 m grid squares were selected atrandom. No single-habitat transects were located in thesegrid squares. Instead, each contained a 1 km butterflytransect that was monitored every other week fromApril through to October 1997. Transects were dividedinto sections according to habitat and a standardizedyear count (total number of individuals per 300 m, peryear) was calculated for each section.
Local
density
wasspecies’ mean density on all transects sections on whichone or more individuals were counted per 300 m, per year.
Within these five grid squares, butterfly distributionswere collected at a 50 m resolution and local distribu-tion was expressed as the proportion of 50 m gridsoccupied. Distributions were collected over a 3-yearperiod (1996–98) and were independent of the transectrecording described above. To ensure coverage of all 50m squares, each was systematically searched every otherweek in 1997 in weather suitable for butterfly activity.
Species national distributions are taken from the mapscontained in Heath, Pollard & Thomas (1984) and wereexpressed as the proportion of 10 km grid squaresoccupied. This measure of distribution is broadly cor-related with other measures of butterfly distribution inBritain for which comparisons have been attempted(Quinn, Gaston & Arnold 1996).
National butterfly densities were derived fromtransect counts of adult butterflies made at over 100sites across the UK as part of the British ButterflyMonitoring Scheme (BMS) (Pollard 1977; Pollard,Hall & Bibby 1986; Pollard & Yates 1993). BMStransects are divided into sections reflecting habitatsand transect walks are conducted weekly during a 26-week period from April to October. Species’ nationaldensities were calculated as the mean of all standard-ized yearly counts along each ‘occupied’ transect sec-tion. To make national densities comparable with thosecollected at local and regional scales, all butterflysection counts were divided by two (to standardizewith the north Wales biweekly counts) and expressed asthe number of individuals recorded per 300 m, per year,and a section was considered occupied if one or moreindividuals were counted per 300 m, per year.
Densities are considered for individual sections, ratherthan for entire transects to prevent systematic bias in favourof species that occurred on more habitats and thereforeon more transect sections. Density must be sampled inan ecologically meaningful unit or it becomes in effectanother measure of distribution (Bock & Ricklefs 1983).
Counts from all BMS transect locations were includedwith the exception of those considered to have unreliable
Table 1. All major habitat types in the north Wales study area
or inconsistent recording (E. Pollard, personal com-munication). The largest numbers of distributionalrecords used to generate the 1970–82 data class mapscontained in Heath, Pollard & Thomas (1984) were col-lected from 1978 to 1982 and so only transect counts fromthese 5 years were included. Species’ densities and dis-tributions can change over time so it is important thatthey are measured at a similar time (Hanski
et al
. 1993).Four species,
Carterocephalus palaemon
Pallas,
Melitaea cinxia
L.,
Maculinea arion
L. and
Lycaenadispar
Haworth were not recorded on any of the BMStransects between 1978 and 82 and could not beincluded. Five other species were excluded due to visib-ility or identification problems (see above). In total, adensity term was calculated for 49 out of Britain’s 58resident or regular migrant butterfly species. However,several of the rarest species are recorded on only a fewBMS transect sections, thus increasing the likelihoodthat densities values could be strongly affected by oneor more atypical sections. Certain analyses were there-fore repeated excluding species that occurred on fewerthan 10 transect sections between 1978 and 1982.
Some analyses were also carried out using data collectedduring only a single year. Those chosen were 1980 (the‘median’ year of 1978–82) and 1990 (10 years after themedian year). This provides an indication of how robustpatterns are if only a single year’s data are used, or ifdensity and distribution are measured at different times.
European distributions are based on the maps con-tained in Higgins & Riley (1980) and Tolman (1997)and are expressed as the proportion of occupied153 000 km
2
grid squares. These grids were created bysubdividing standard 611 000 km
2
WORLDMAPsquares (Williams 1992) into four.
To measure global range size, species distributionswere given a value according to the number of broadbiogeographic zones that are occupied (Higgins &Riley 1980; Tolman 1997). These zones and their scoresare as follows: 1, endemic to Europe; 2, endemic to Europeand/or North Africa/near–Middle East and distributedno further east than the Ural Mountains; 3, zone twoand elsewhere in Asia, but not reaching the Pacific; 4,zone three and reaching the Pacific; 5, occurring onthree continents (counting Europe and Asia as two, butwith North Africa and the near-Middle East includedwith Europe); 6, occurring on four continents (withNorth Africa and the near middle East included withEurope); 7, occurring on five or more continents.
One frequently suggested explanation for the density–distribution relationship is that species that occur atlow density will tend to be recorded at fewer locations,even when they occur widely (e.g. Brown 1984; Hanski
et al
. 1993). At national, European and global scales,
the distributions of butterflies are sufficiently wellknown (at the resolution analysed) that the possibilityof a purely artefactual basis for any density–distribu-tion relationship is extremely unlikely. At regional andlocal scales, the 500 m and 50 m distributions recordedfor the majority of species during the first year of fieldwork remained more or less unchanged even after afurther 2 years of sampling and three species wererecorded from
every
500 m square during the first year.An analysis of selected species by D. Gutiérrez
et al
.(unpublished) showed that estimated distribution sizesreached asymptotes during the study period. This sug-gests that our distributions are biologically meaningfuland largely independent of species density.
Several authors have attempted to classify British but-terfly species according to their relative mobility; forexample: Thomas (1984); Warren (1992); Pollard &Yates (1993) and Dennis & Shreeve (1996, 1997). Forthe current analyses, a more continuous index of mobilitywas desirable. Unfortunately, there does not appear tobe any biological characteristic that can reliably be con-sidered to reflect relative mobility; for example, wingsize, relative thorax mass and wing loading have provedunsatisfactory (Lewis 1997). We therefore took a newand slightly unusual approach to this problem. Ques-tionnaires were sent to leading butterfly ecologists inBritain and northern Europe and respondents wereasked to rank butterfly species according to their experi-ence of the relative mobility of each species. Given theexperience that exists and the volume of mark–release–recapture data that has been collected, the approachseemed suitable. The results from all replies (
n
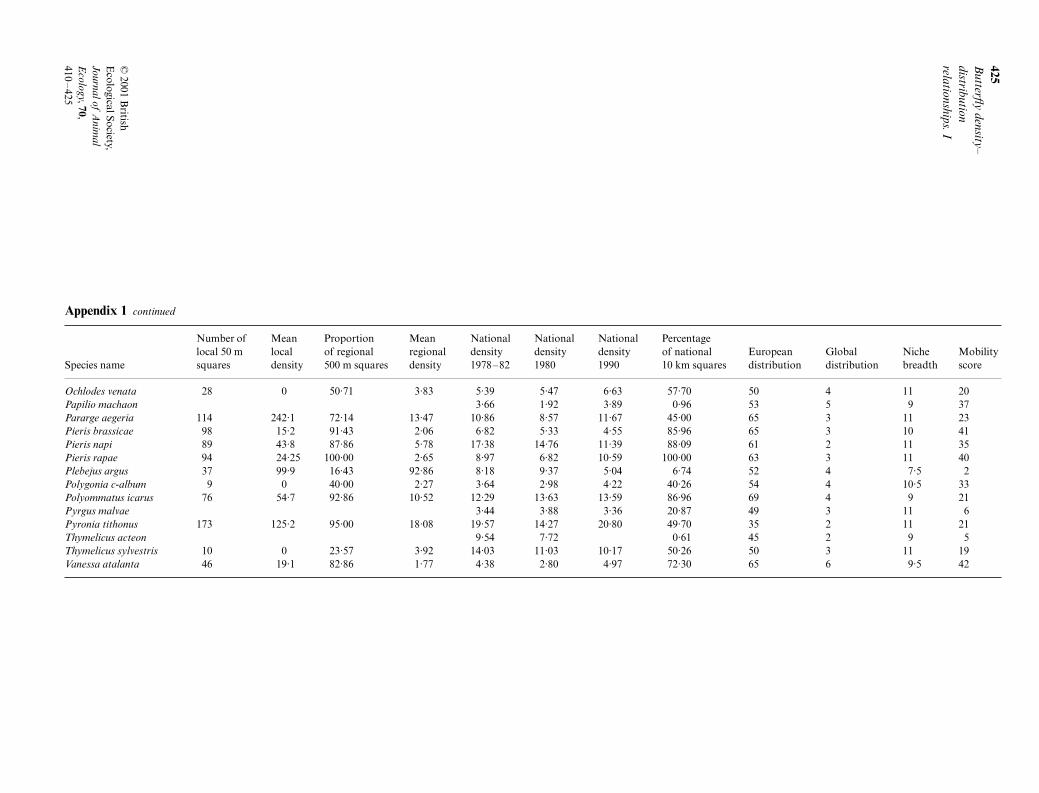
= 24)were used to generate a ‘consensus’ mobility rankingfor each species (Appendix 1). This ranking reflects theproportion of replies that classified a species as more,less or equally mobile than every other species.
There are potential errors in seeking a single rankingof species’ mobility irrespective of year, part of rangeand sex. However, this method should be an effectiveway of ‘averaging out’ some of these errors: respond-ents are from a variety of locations, will have worked inmany habitats and their judgement is based on manyyears experience. Whatever the uncertainties of theranking, it should be unbiased with respect to the cur-rent analysis, and we are confident that the ranking isstrongly correlated with real variation in mobility (itshould not, however, be used to distinguish betweenparticular pairs of species that lie close to one anotherwithin the ranking). We would expect the patternsobserved to strengthen with increasingly accuratemeasures of relative mobility.
The concept of the
n
-dimensional niche, while a power-ful heuristic tool, is impossible to define (Colwell
& Futuyma 1971), ultimately making it impossible totest the effect of niche on density–distribution rela-tionships. Following previous authors, we took theapproach of considering several important com-
ponents of species’ relative niche breadth. The com-ponents chosen were larval host-plant specificity,larval feeding specificity (parts of plants) and the levelof larval association with ants.
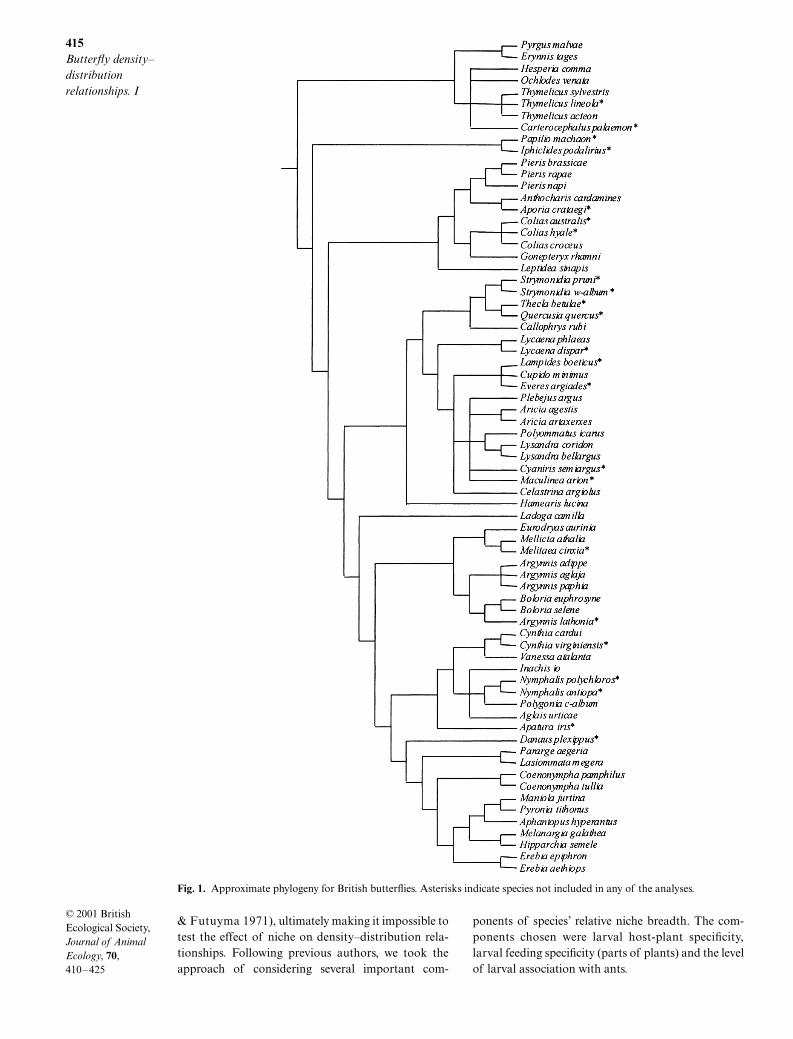
Fig. 1. Approximate phylogeny for British butterflies. Asterisks indicate species not included in any of the analyses.
In the absence of knowledge of how to weight the rel-ative importance of these aspects, we considered eachto have equal weighting. Species were scored as follows.For larval host-plant specificity: 1, monophage (largelyone species of host-plant); 2, restricted to one genus ofhost-plant; 3, feeding on one plant family; 4, feedingon plants from two to three families. For feeding spe-cificity: 1, using only the seeds or the flowers of theplant; 2·5, using only specific vegetative parts, e.g.new growth; 4, using most parts of the plant. For antassociation: 1, relationship with one genus only; 2, rela-tionship with more than one genus; 4, no specificrelationship with ants. These indices were summedsuch that each butterfly received a score in the range 3–12, with 3 representing the most specialized species.
All regressions between density and distribution werecalculated using the ordinary least squares (model 1)method (McArdle 1990; Blackburn & Gaston 1998).Density was always used as the dependent variable.Before statistical analyses were conducted, we trans-formed both density values and distributions tohomogenize variance. Density values were log
10
trans-formed, whilst distributions were arcsine transformed(distributional data are proportions of all grid squaresoccupied). Inaccuracies in the data and violated statis-tical assumptions may add to unexplained variance inour analyses but should not yield spurious positiverelationships.
The effects of phylogeny were tested using the Com-parative Analysis by Independent Contrasts package(CAIC, see Purvis & Rambaut 1994, 1995). CAIC cal-culates the difference (or contrasts) in the traits ofinterest between extant pairs of species: this contrastrepresents the amount of evolutionary divergence sincethey speciated from their common ancestor. In addi-tion, CAIC calculates contrasts at internal nodes of thephylogeny. Since we do not know what the ancestral
species at these nodes were like, values at nodes areaverages of the species (or nodes) that evolved fromthem. It is possible to weight these averages by thebranch lengths but, in these analyses, all branch lengthswere assumed equal. The standardized linear contrastscalculated by the CAIC programme can be ana-lysed using standard regression techniques (Pagel &Harvey 1989; Harvey & Pagel 1991) although regres-sions must be forced through the origin (Garland, Harvey& Ives 1992).
An approximate phylogeny for British butterflies(Fig. 1) was produced using data from Geiger (1981);Martin & Pashley (1992); Aubert
. (unpublished); A. Brower(unpublished) and N. Wahlberg (unpublished).
Relatively few studies of the interspecific density–distribution relationship have controlled for phylo-genetic effects (but see Arita 1993; Blackburn
et al
. 1997;Gaston, Blackburn & Gregory 1997; Quinn
et al
. 1997).Thus far, none of the positive relationships reported inthese studies (in birds, mammals and macrolepid-optera) have arisen due to the non-independence ofthe data points (Gaston, Blackburn & Lawton 1997).
Results
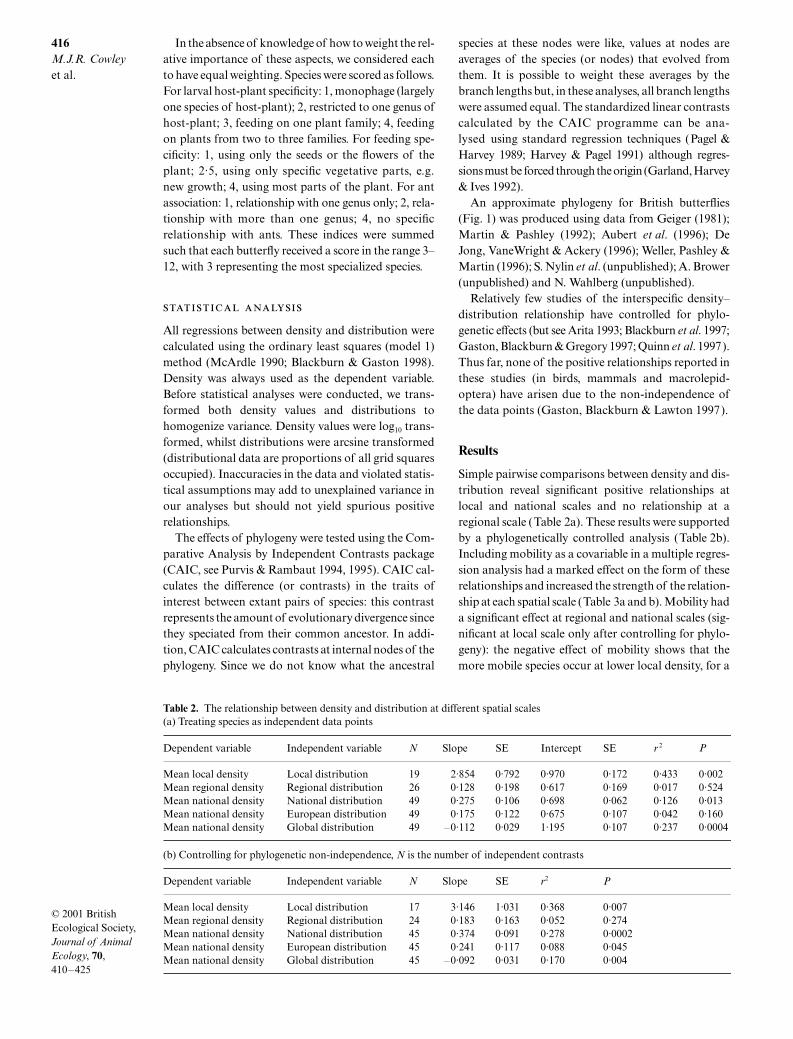
Simple pairwise comparisons between density and dis-tribution reveal significant positive relationships atlocal and national scales and no relationship at aregional scale (Table 2a). These results were supportedby a phylogenetically controlled analysis (Table 2b).Including mobility as a covariable in a multiple regres-sion analysis had a marked effect on the form of theserelationships and increased the strength of the relation-ship at each spatial scale (Table 3a and b). Mobility hada significant effect at regional and national scales (sig-nificant at local scale only after controlling for phylo-geny): the negative effect of mobility shows that themore mobile species occur at lower local density, for a
Table 2. The relationship between density and distribution at different spatial scales(a) Treating species as independent data points
(b) Controlling for phylogenetic non-independence, N is the number of independent contrasts
Dependent variable Independent variable N Slope SE Intercept SE r 2 P
Mean local density Local distribution 19 2·854 0·792 0·970 0·172 0·433 0·002Mean regional density Regional distribution 26 0·128 0·198 0·617 0·169 0·017 0·524Mean national density National distribution 49 0·275 0·106 0·698 0·062 0·126 0·013Mean national density European distribution 49 0·175 0·122 0·675 0·107 0·042 0·160Mean national density Global distribution 49 –0·112 0·029 1·195 0·107 0·237 0·0004
Dependent variable Independent variable N Slope SE r2 P
Mean local density Local distribution 17 3·146 1·031 0·368 0·007Mean regional density Regional distribution 24 0·183 0·163 0·052 0·274Mean national density National distribution 45 0·374 0·091 0·278 0·0002Mean national density European distribution 45 0·241 0·117 0·088 0·045Mean national density Global distribution 45 –0·092 0·031 0·170 0·004
given distribution size. At a regional scale, controllingfor the effects of mobility generated a significant pos-itive relationship between density and distribution.Niche breadth had no significant effect (
P
< 0·05) onthe form of the density–distribution relationship at anyspatial scale and was therefore removed from all mul-tiple regression analyses (Table 3).
The national scale analyses were repeated withoutmigrants, rarities or species with possible visibilityproblems, and using density data from only single years(Table 4a and b). A positive relationship between dens-ity and distribution remained despite any of thesechanges. However, when density data from single yearswere employed (1980 or 1990), the relationship only
Table 3. Summaries of multiple regressions of distribution and mobility to predict mean density (a) Treating species as independent data points
(b) Controlling for phylogenetic non-independence, N is the number of independent contrasts
Dependent variable Independent variable N Slope SE Intercept SE r 2 P
Mean local density Local distribution 19 2·716 0·754 1·331 0·266 0·521 0·002Mobility –0·026 0·015 0·106
Mean regional density Regional distribution 26 0·454 0·143 1·051 0·136 0·589 0·004Mobility –0·052 0·009 0·0001
Mean national density National distribution 49 0·452 0·123 0·836 0·081 0·228 0·017Mobility –0·010 0·004 0·0006
Mean national density European distribution 49 0·175 0·124 0·704 0·133 0·045 0·163Mobility –0·001 0·004 0·705
Mean national density Global distribution 49 –0·130 0·032 1·155 0·110 0·266 0·0004Mobility 0·005 0·003 0·1840
Dependent variable Independent variable N Slope SE r 2 P
Mean local density Local distribution 17 3·310 0·935 0·516 0·0030Mobility –0·052 0·024 0·049
Mean regional density Regional distribution 24 0·467 0·130 0·542 0·0016Mobility –0·066 0·014 0·0001
Mean national density National distribution 45 0·394 0·109 0·280 0·0008Mobility –0·002 0·005 0·734
Mean national density European distribution 45 0·232 0·112 0·092 0·060Mobility 0·002 0·005 0·686
Mean national density Global distribution 45 –0·124 0·033 0·257 0·0005Mobility 0·010 0·004 0·031
Table 4. The relationship between density and distribution at a national scale: (i) using density data from 1980 only (ii) usingdensity data from 1990 only (iii) excluding species recorded on fewer than 10 BMS transect sections between 1978 and 82(iv) excluding migratory species (Colias croceus, Pieris brassicae, P. rapae, Cynthia cardui and Vanessa atalanta) and (v) excludingP. rapae and P. napi(a) Treating species as independent data points
(b) Controlling for phylogenetic non-independence, N is the number of independent contrasts
Dependent variable Independent variable N Slope SE Intercept SE r 2 P
(i) Mean national density 1980 National distribution 47 0·212 0·113 0·728 0·068 0·074 0·068(ii) Mean national density 1990 National distribution 47 0·155 0·094 0·827 0·056 0·056 0·108(iii) Mean national density
(iv) Mean national density 1978–82, excluding migrants
National distribution 44 0·359 0·121 0·698 0·063 0·173 0·005
(v) Mean national density 1978–82, excluding whites
National distribution 47 –0·282 0·122 0·694 0·064 0·106 0·025
Dependent variable Independent variable N Slope SE r 2 P
(i) Mean national density 1980 National distribution 43 0·319 0·111 0·163 0·007(ii) Mean national density 1990 National distribution 43 0·248 0·084 0·173 0·005(iii) Mean national density
1978–82, excluding raritiesNational distribution 43 0·294 0·088 0·209 0·002
(iv) Mean national density 1978–82, excluding migrants
National distribution 40 0·360 0·098 0·259 0·0007
(v) Mean national density 1978–82, excluding whites
achieved statistical significance in phylogeneticallycontrolled analyses (Table 4b).
If species’ national densities are used with distribu-tions measured at European and global scales, there isno relationship at a European scale and a significantnegative relationship at a global scale (Table 2a). Inphylogenetically controlled analyses, a significantnegative relationship remains at the global scale andthere is a significant positive relationship at a Europeanscale (Table 2b).
The relationships between species density andmobility and between species distribution and mobilitywere also explored (Tables 5, 6). In general, mobil-ity had a negative effect on density (Table 5a and b)and a positive effect on distribution (Table 6a and b)although these effects were not always significant.The same analyses were carried out using species’niche breadth (Tables 7, 8). Niche breadth was notsignificantly related to density or distribution at anyspatial scale. Host-plant specificity has been shown
Table 5. The relationship between density and mobility at different spatial scales (a) Treating species as independent data points
(b) Controlling for phylogenetic non-independence, N is the number of independent contrasts
Dependent variable Independent variable N Slope SE Intercept SE r 2 P
Mean local density Mobility 19 –0·031 0·019 1·870 0·288 0·134 0·124Mean regional density Mobility 26 –0·040 0·010 1·223 0·145 0·408 0·0004Mean national density Mobility 49 –0·001 0·003 0·844 0·091 0·003 0·710
Dependent variable Independent variable N Slope SE r 2 P
Mean local density Mobility 17 –0·045 0·031 0·111 0·176Mean regional density Mobility 24 –0·048 0·016 0·271 0·008Mean national density Mobility 45 0·006 0·005 0·029 0·260
Table 6. The relationship between distribution and mobility at different spatial scales (a) Treating species as independent data points
(b) Controlling for phylogenetic non-independence, N is the number of independent contrasts
Dependent variable Independent variable N Slope SE Intercept SE r 2 P
Local distribution Mobility 19 –0·002 0·005 0·187 0·069 0·007 0·717Regional distribution Mobility 26 0·026 0·012 0·385 0·177 0·162 0·042National distribution Mobility 49 0·019 0·004 0·019 0·096 0·334 0·0001European distribution Mobility 49 0·000 0·004 0·797 0·106 0·000 0·987Global distribution Mobility 49 0·047 0·014 2·395 0·359 0·428 0·0021
Dependent variable Independent variable N Slope SE r 2 P
Local distribution Mobility 17 0·002 0·006 0·007 0·746Regional distribution Mobility 24 0·048 0·020 0·203 0·024National distribution Mobility 45 0·024 0·006 0·290 0·0001European distribution Mobility 45 0·007 0·006 0·033 0·225Global distribution Mobility 45 0·057 0·018 0·181 0·003
Table 7. The relationship between density and niche at different spatial scales (a) Treating species as independent data points
(b) Controlling for phylogenetic non-independence, N is the number of independent contrasts
Dependent variable Independent variable N Slope SE Intercept SE r 2 P
Mean local density Niche 19 0·081 0·097 0·680 0·943 0·039 0·417Mean regional density Niche 26 –0·016 0·069 0·872 0·689 0·002 0·814Mean national density Niche 49 0·000 0·029 0·820 0·282 0·000 0·985
Dependent variable Independent variable N Slope SE r 2 P
Mean local density Niche 17 0·106 0·149 0·030 0·486Mean regional density Niche 24 –0·127 0·070 0·126 0·082Mean national density Niche 45 –0·019 0·034 0·007 0·590
JAE508.fm Page 418 Friday, April 20, 2001 5:27 PM
419Butterfly density–distribution relationships. I
to be correlated with the distribution sizes of Britishbutterflies (Hodgson 1993). For the subset of speciesincluded in the current paper no such correlation wasevident (Spearman correlation of proportion of 10 kmsquares occupied and host plant specificity r = 0·26,n = 49, P = 0·67).
The extent to which the densities and distributionsof species are consistent over space appeared to be depend-ent on the magnitude of difference between the spatialscales being considered (Tables 9, 10). Densities ordistributions measured at local, regional and nationalscales were all positively correlated (although the rela-
tionship between local and national distributions wasnot significant) but local and regional distributionswere not correlated with European distributions and werenegatively correlated with global distributions. Nationaldistributions were positively correlated with Europeandistributions but not correlated with global distributions.
Discussion
The densities and distributions of British butterflies arepositively related at local, regional and national scales(Table 2a and b), although a positive relationship isonly detected at a regional scale if we control for theeffects of mobility (Table 3a and b). These results, takentogether, are broadly consistent with previous studieson other taxonomic groups that have demonstratedpositive relationships between density and distributionregardless of the spatial scale considered (e.g. Bock1987; Collins & Glenn 1990; Niemelä & Spence 1994;Brown 1995). Like the majority of previous studies,our r2 values are typically low, and the bulk of thevariance remains unexplained (Gaston 1996).
Our results confirm and extend the findings of aprevious analysis of density–distribution relationships
Table 8. The relationship between distribution and niche at different spatial scales (a) Treating species as independent data points
(b) Controlling for phylogenetic non-independence, N is the number of independent contrasts
Dependent variable Independent variable N Slope SE Intercept SE r 2 P
Local distribution Niche 19 0·035 0·020 –0·170 0·201 0·137 0·108Regional distribution Niche 26 –0·055 0·070 1·255 0·695 0·025 0·442National distribution Niche 49 0·039 0·037 0·053 0·360 0·022 0·300European distribution Niche 49 –0·017 0·034 0·962 0·327 0·005 0·616Global distribution Niche 49 0·054 0·126 3·92 1·227 0·004 0·672
Dependent variable Independent variable N Slope SE r 2 P
Local distribution Niche 17 0·026 0·029 0·048 0·384Regional distribution Niche 24 –0·122 0·088 0·078 0·177National distribution Niche 45 0·033 0·041 0·015 0·425European distribution Niche 45 0·022 0·040 0·007 0·583Global distribution Niche 45 0·141 0·139 0·023 0·316
Table 9. Matrix showing the Pearson correlation between species distributions at different spatial scales
1. Local distribution –
2. Regional distribution r = 0·56 –n = 19P = 0·012
3. National distribution r = 0·41 r = 0·72 –n = 19 n = 26P = 0·08 P < 0·0001
4. European distribution r = 0·08 r = 0·34 r = 0·64 –n = 19 n = 26 n = 49P = 0·74 P = 0·09 P < 0·0001
5. Global distribution r = –0·52 r = –0·15 r = 17 r = 0·50 –n = 19 n = 26 n = 49 n = 49P = 0·02 P = 0·47 P = 0·24 P < 0·00011 2 3 4 5
Table 10. Matrix showing the Pearson correlation betweenspecies densities at different spatial scales
1. Local density –
2. Regional density r = 0·73 –n = 19P < 0·0001
3. National density r = 0·66 r = 0·65 –n = 19 n = 26P = 0·002 P < 0·00011 2 3
in British butterflies (Hanski et al. 1993), and demon-strate that the reported relationship was not an artefactof treating species as independent data points. Control-ling for phylogenetic association actually strengthenedthe relationship between density and distribution(Table 2b). Phylogenetic non-independence has beenrejected as an explanation for the density–distributionrelationship in all previous studies that have controlledfor these effects (Gaston, Blackburn & Lawton 1997).Indeed, density and distribution are generally observedto exhibit rather little phylogenetic constraint (Gaston1998; Gaston & Chown 1999). The positive relation-ship between density and distribution was also un-affected by using only a single year’s data, or by theremoval of rare species, migrants or species with pos-sible identification problems (Table 4a and b).
Within Britain, relative butterfly densities and distri-butions are reasonably consistent over space: thosespecies that occur at high density and are widely dis-tributed within 0·25 km2 tend to occur at high densityand be widely distributed both in the surrounding35 km2 and at a national level. However, increasing thespatial scale over which distributions are compared,especially beyond the national scale, results in aweakening and ultimately to a reversal of these positiverelationships (Table 9).
As in other studies that consider densities and dis-tributions measured across several spatial scales (seeHengeveld & Haeck 1982; Gaston & Lawton 1990;Gaston 1990, 1994a), species that occur at high densityor are widely distributed at one scale tend to be so atlarger scales, but there is some evidence to suggestthat the strength of this correlation may decline as thedifference between the spatial scales increases (Bock1987). If we consider the relationship between densitymeasured at one spatial scale and distributions meas-ured over successively greater areas, we see a similareffect. The relationship between density and distribu-tion moves from being positive, to absent, to negativeas the magnitude of difference between the spatialscales increases (Tables 2, 3). Gaston & Lawton (1990)suggested that the strength of the density–distributionrelationship in British birds was dependent on the sim-ilarity of the area in which species’ densities were meas-ured (the reference habitat) compared to the area overwhich distributions were measured. In situations inwhich the reference habitat was atypical (based onfactors such as structure, climate or range of availablefood resources) an inverse relationship between densityand distribution was observed, whilst in intermediatecases, there was no relationship.
At a global scale, many British butterflies have rangesizes that cover several continents: many stretch farinto Asia and several into North America (Higgins &Riley 1980). In this context, Britain must be regardedas atypical due to: (i) the strong maritime influence onits climate; (ii) the relative scarcity of semi-natural hab-itat; and (iii) its position at the margins of the majorityof species’ ranges. Species that are specialized in such a
way as to achieve high density in Britain may not be sosuccessful and widespread at a global scale. Europeandistributions provide an intermediate case, and itappears that environmental conditions in Britain aresufficiently similar to those typical in Europe fornational densities to be positively correlated (albeitweakly) with European distributions.
Species that are regionally dense and widespread(presumably in some way because of their adaptations)may occur at lower densities and have small distribu-tions elsewhere in climates/environments to which theyare less well suited. This explanation implies that someelements of niche are important in determining speciesdensities and distributions. However, although nicheper se might be an important factor, our specific meas-ure of niche breadth failed to explain significant vari-ation in density or distribution separately (Tables 7, 8)or significant variation in the density–distribution rela-tionship. Niche-based explanations for the positivedensity–distribution relationship argue that generalistspecies should occur at high density and be widespread(Brown 1984). Previous studies have demonstrated apositive correlation between niche breadth and dis-tribution, although many of these correlations may bedue to sample size effects (Gaston 1994a). Few studieshave demonstrated a positive relationship between nichebreadth and density (Gaston, Blackburn & Lawton1997). In this case, there is no evidence to support eitherprediction. A previous study of British butterfliesfound that niche breadth measured as host-plantspecificity was positively correlated with species’national distribution size (Hodgson 1993). However,for the subset of British species used in these analysesthere was no significant relationship between hostplant specificity and distribution (see Results). A recentstudy of British birds also found no relationship betweenniche breadth and density or distribution (Gregory &Gaston 2000).
Failure to find a positive relationship between nicheand density or distribution might suggest that the rel-evant niche axis is not being measured. This is difficultto refute, and reflects the difficulty in making the con-cept of the n-dimensional niche operational (Colwell &Futuyma 1971). Brown’s hypothesis is therefore essen-tially impossible to test, as failure to find appropriaterelations between niche breadth and density or distri-bution can always be explained away. Where such rela-tionships are documented, it remains unclear howrobust they would be if niche breadths were measuredusing an alternative axis (Gaston, Blackburn &Lawton 1997).
Some metapopulation dynamic models predict apositive relationship between distribution measuredas the number (or proportion) of occupied patchesand population density within patches (e.g. Hanski &Gyllenberg 1993). These predict that, for a given density,more mobile species should have a wider distributionthan less mobile species, as dispersal may rescue smallpopulations from extinction and increase the probability
JAE508.fm Page 420 Friday, April 20, 2001 5:27 PM
421Butterfly density–distribution relationships. I
of unoccupied patches being colonized (Gyllenberg &Hanski 1992). The few studies that have directly testedthe effect of dispersal ability on density–distributionrelationships have demonstrated contradictory results,with more mobile species showing both negative andpositive deviation from the underlying relationship(Hanski et al. 1993; Gutiérrez & Menéndez 1997,respectively).
In our analyses of British butterflies, the metapopu-tion prediction is upheld as species that are more mobileshow negative deviation from the density–distributionrelationship (a lower density for a given distribution) atregional and national scales of analysis. However,other factors are also likely to be important: meta-population theory is only applicable to the distributionsand population dynamics of some British butterflies(Thomas 1995).
At a local scale, all species are likely to be relativelymobile within the context of a 0·25-km2 grid square, somobility is unlikely to be very important, as we found.Sedentary species that persist within these small sam-pling units often occupy reasonably large areas (relat-ive to 0·25 km2). More mobile species that occur in thesurrounding region sometimes move rapidly throughthese areas resulting in only a few localized distributionrecords. These effects will weaken the impact of mobil-ity, which barely achieved significance at this scale ofanalysis (Table 3).
At a regional scale, sedentary species have greaterpotential to be localized within the study area (Cowleyet al. 1999). Mobile species have a higher probability ofbeing recorded away from their main breeding habitatsresulting in mobility having a positive effect on distri-bution. At a national scale, mobile, and particularlymigratory species, are also likely to be recorded widelyfor similar reasons. At these scales, mobile species areless aggregated (see Wright 1991; Hartley 1998); for agiven number of individuals in one landscape, they canbe seen at lower densities in more locations. The effectof mobility reverses in the relationship betweennational density and global distribution size (Thomaset al. 1998): the combination of high density and highmobility increases global range size. There is no clearpattern at the intermediate, European scale.
Previous studies have demonstrated a positive rela-tionship between mobility and distribution (Kunin &Gaston 1993; Gaston & Kunin 1997), but it is difficultto interpret the causation. Species may have narrowdistributions because they fail to colonize suitable sites( low mobility causes limited distribution) (e.g. Gyllenberg& Hanski 1992) or low mobility could be a response tothe low probability of migrants encountering suitablesites (limited distribution of suitable breeding areascauses evolution of low mobility) (e.g. Thomas, Hill &Lewis 1998).
Our results suggest that the positive density–distributionrelationship in British butterflies is general and robust.The relationship is apparent at a variety of spatialscales and is not an artefact of species’ phylogenetic
association. If density and distribution are analysedat different spatial scales, the relationship weakens asthe magnitude of difference between scales increases,eventually becoming negative. This suggests that theinteraction of niche and environment may be impor-tant, although niche breadth was not directly related todensity or distribution, or to variation in the density–distribution relationship. Mobility was found to havea positive effect on distribution and a negative effect ondensity and more mobile species showed a negativedeviation from the underlying density–distributionrelationship (they were more ‘spread out’). Mobilityalso appeared to be responsible for some of theobserved difference in the relationship between densityand distribution at different scales of analysis. It wasencouraging that phylogenetic control and inclusion ofspecies’ mobility strengthened, rather than weakenedthe generality of the relationships between density anddistribution.
Acknowledgements
We were supported by NERC (LSPE) grant GST/04/1211. M. Cowley has a NERC CASE studentship jointwith ITE. J. León-Cortés was supported by a scholar-ship from the National Council of Science in Mexico(CoNaCyT, 92535), D. Gutiérrez was supported bya Marie Curie Training grant from the commissionof European Communities (ERBFMICT 961523).We are grateful to Tim Blackburn for assistance withthe CIAC analyses. We thank Rosa Menéndez, RogerDennis and Caroline Wilmot for distribution records,all who completed the butterfly mobility questionnaire,the North Wales Wildlife Trust, NERC ARS 98/5 andthe many landowners in the north Wales study area.Liz Howe at CCW provided Phase-1 survey data.
References
Arita, H.T. (1993) Rarity in Neotropical bats: correlations withphylogeny, diet, and body mass. Ecological Applications,3, 506–517.
Arita, H.T., Robinson, J.G. & Redford, K.H. (1990) Rarity inNeotropical forest mammals and its ecological correlates.Conservation Biology, 4, 181–192.
Aubert, J., Barascud, B., Descimon, H. & Michel, F. (1996)Molecular systematics of the Argynninae (Lepidoptera:Nymphalidae). Comptes rendus de l’Academie des sciencesSerie III – Sciences de la Vie, 319, 647–665.
Blackburn, T.M. & Gaston, K.J. (1998) Some methodologicalissues in macroecology. American Naturalist, 151, 69–83.
Blackburn, T.M., Gaston, K.J. & Gregory, R.D. (1997)Abundance–range size relationships in British birds: isunexplained variation a product of life history? Ecography,20, 466–474.
Blackburn, T.M., Gaston, K.J., Quinn, R.M., Arnold, H. &Gregory, R.D. (1997) Of mice and wrens: the relationbetween abundance and geographic range size in Britishmammals and birds. Philosophical Transactions of theRoyal Society of London B, 352, 419–427.
Bock, C.E. (1987) Distribution–abundance relationships ofsome Arizona landbirds: a matter of scale? Ecology, 68,127–129.
Bock, C.E. & Ricklefs, R.E. (1983) Range size and localabundance of some North American songbirds: a positivecorrelation.
American Naturalist
,
122
, 296–299.Brown, J.H. (1984) On the relationship between abundance and
distribution of species.
American Naturalist
,
124
, 255–279.Brown, J.H. (1995)
Macroecology
. University of ChicagoPress, Chicago.
Brown, J.H. & Maurer, B.A. (1987) Body size, ecologicaldominance and Cope’s Rule.
Nature
,
324
, 248–250.Brown, J.H. & Nicoletto, P.F. (1991) Spatial scaling of species
composition: body masses of North American land mam-mals.
American Naturalist
,
138
, 1478–1512.Collins, S.L. & Glenn, S.M. (1990) A hierarchical analysis
of species’ abundance patterns in grassland vegetation.
American Naturalist
,
135
, 632–647.Colwell, R.K. & Futuyama, F.J. (1971) On the measurement
of niche breadth and overlap.
Ecology
,
52
, 567–576.Cowley, M.J.R., Thomas, C.D., Thomas, J.A. & Warren, M.S.
(1999) Flight area of British Butterflies: assessing speciesstatus and decline.
Proceedings of the Royal Society
,
266
,1–6.
Cowley, M.J.R., Wilson, R.J., León-Cortés, J.L., Gutiérrez, D.,Bulman, C.R. & Thomas, C.D. (2000) Habitat-basedstatistical models for predicting the spatial distribution ofbutterflies and day-flying moths.
Journal of Applied Ecology
,
37
, 1–14.DeJong, R., VaneWright, R.I. & Ackery, R.R. (1996) The
higher classification of butterflies (Lepidoptera): problemsand prospects.
Entomologica Scandinavica
,
27
, 65–101.Dennis, R.L.H., Donato, B., Sparks, T.H. & Pollard, E.
(2000) Ecological correlates of island incidence and geo-graphic range among British butterflies.
Biodiversity
&
Conservation
,
8
, 248–254.Dennis, R.L.H. & Shreeve, T.G. (1996)
Butterflies on Britishand Irish Offshore Islands
. Gem Publishing Company,Wallingford, Oxon.
Dennis, R.L.H. & Shreeve, T.G. (1997) Diversity of butterflieson British islands: ecological influences underlying the rolesof area, isolation and the size of the faunal source.
patterns in British breeding birds: covariation of species’geographical range sizes at differing spatial scales.
Ecography
,
21
, 527–534.Gregory, R.D. & Gaston, K.J. (2000) Explanations of com-
monness and rarity in British breeding birds: separatingresource use and resource availability.
Oikos
,
88
, 515–526.Gutiérrez, D. & Menéndez, R. (1997) Patterns in the distribution,
abundance and body size of carabid beetles (Coleoptera:Carabiodae) in relation to dispersal ability.
Journal ofBiogeography
,
24
, 903–914.Gyllenberg, M. & Hanski, I. (1992) Single-species meta-
population dynamics: a structured model.
TheoreticalPopulation Biology
,
42
, 35–61.Hanski, I. (1982) Dynamics of regional distribution: the core
satellite species hypothesis.
Oikos
,
38
, 210–221.Hanski, I. (1991) Single-species metapopulation dynamics:
a structured model.
Theoretical Population Biology
,
42
,35–61.
Hanski, I. & Gyllenberg, M. (1993) Two general metapopu-lation models and the core-satellite species hypothesis.
American Naturalist
,
142
, 17–41.Hanski, I., Kouki, J. & Halkka, A. (1993) Three explanations of
the positive relationship between distribution and abundanceof species.
Species Diversity in Ecological Communities:Historical and Geographical Perspectives
(eds R.E. Ricklefs& D. Schluter), pp. 108–116. University of Chicago Press,Chicago.
Hartley, S. (1998) A positive relationship between local abund-ance and regional occupancy is almost inevitable (but notall positive relationships are the same).
Journal of AnimalEcology
,
67
, 992–994.Harvey, P.H. & Pagel, M.D. (1991)
The ComparativeMethod in Evolutionary Biology
. Oxford UniversityPress, Oxford.
Heath, J., Pollard, E. & Thomas, J.A. (1984)
Atlas of Butterfliesin Britain and Ireland
. Viking, Harmondsworth.Hengeveld, R. & Haeck, J. (1982) The distribution of abundance.
I. Measurements.
Journal of Biogeography
,
9
, 303–316.Higgins, L.G. & Riley, N.D. (1980)
A Field Guide to theButterflies of Britain and Europe
, 4th edn. Collins,London.
Hodgson, J.G. (1993) Commonness and rarity in Britishbutterflies.
Kouki, J. & Häyrinen, U. (1991) On the relationship betweendistribution and abundance in birds breeding on Finnishmires: the effect of habitat specialization.
Ornis Fennica
,
68
,170–177.
Kunin, W.E. & Gaston, K.J. (1993) The biology of rarity:patterns, causes and consequences.
Trends in Ecology andEvolution
,
8
, 209–301.Lawton, J.H. (1993) Range, population abundance and
conservation.
Trends in Ecology and Evolution
,
8
, 409–413.Lewis, O.T. (1997)
Ecology and evolution of butterfly dispersalin fragmented landscapes.
PhD Thesis, University of Leeds.Martin, J.A. & Pashley, D.P. (1992) Molecular systematic
analysis of a butterfly family and some subfamily relationships
JAE508.fm Page 422 Tuesday, April 24, 2001 9:42 AM
423Butterfly density–distribution relationships. I
(Lepidoptera: Papilionoidea). Annals of the EntomologicalSociety of America, 85, 127–139.
McArdle, B.H. (1990) When are rare species not there? Oikos,57, 276–277.
Niemelä, J.K. & Spence, J.R. (1994) Distribution of forestdwelling carabids (Coleoptera): spatial scale and the conceptof communities. Ecography, 17, 166–175.
Oakwood, M., Jurado, E., Leishman, M. & Westoby, M. (1993)Geographic ranges of plant species in relation to dispersal,morphology, growth form and diaspore weight. Journal ofBiogeography, 20, 563–572.
Ordnance Survey (1994) Pathfinder 736, Llandudno SH 78/88& part of SH 77/87. Ordnance Survey, Southampton.
Pollard, E. (1977) A method for assessing changes in theabundance of butterflies. Biological Conservation, 12, 115–134.
Pollard, E., Hall, M.L. & Bibby, T.J. (1986) Monitoring theabundance of butterflies, 1976–85. Joint Nature Conserva-tion Committee, Peterborough, UK.
Pollard, E. & Yates, T.J. (1993) Monitoring Butterflies forEcology and Conservation. Chapman & Hall, London.
Purvis, A. & Rambaut, A. (1994) Comparative Analysis byIndependent Contrasts, Version 2. Oxford University Press,Oxford.
Purvis, A. & Rambaut, A. (1995) Comparative analysis byindependent contrasts: an Apple Macintosh application foranalysing comparative data. Comparative Applied Bioscience,11, 247–251.
Quinn, R.M., Gaston, K.J. & Arnold, H.R. (1996) Relativemeasures of geographic range size: empirical comparisons.Oecologia, 107, 179–188.
Quinn, R.M., Gaston, K.J., Blackburn, T.M. & Eversham, B.E.(1997) Abundance–range size relationships of macro-lepidoptera in Britain: the effects of taxonomy and lifehistory variables. Ecological Entomology, 22, 453–461.
Thomas, J.A. (1983) A quick method for estimating butterflynumbers during surveys. Biological Conservation, 16,195–211.
Thomas, J.A. (1984) The conservation of butterflies in temperatecountries: past effort and lessons for the future. TheBiology of Butterflies (eds R.I. Vane-Wright & P.R. Ackery),pp. 531–733. Academic Press, London.
Thomas, C.D. (1995) Ecology and conservation of butterflymetapopulations in the fragmented British landscape.Ecology and Conservation of Butterflies (ed. A.S. Pullin),pp. 46–63. Chapman & Hall, London.
Thomas, C.D., Hill, J.K. & Lewis, O.T. (1998) Evolutionaryconsequences of habitat fragmentation in a localisedbutterfly. Journal of Animal Ecology, 67, 485–497.
Thomas, C.D., Jordano, D., Lewis, O.T., Hill, J.K., Sutcliffe, O.L.& Thomas, J.A. (1998) Butterfly distributional patterns,processes and conservation. Conservation in a ChangingWorld (eds G.M. Mace, A. Balmford & J.R. Ginsberg),pp. 107–138. Cambridge University Press, Cambridge.
Thomas, C.D. & Mallorie, H.C. (1985) Rarity, richness andconservation: butterflies of the Atlas mountains inMorocco. Biological Conservation, 33, 95–117.
Tolman, T. (1997) Butterflies of Britain and Europe. HarperCollins, London.
Warren, M.S. (1992) Butterfly populations. The Ecology ofButterflies in Britain (ed. R.H.L. Dennis), pp. 73–92.Oxford University Press, Oxford.
Weller, S.J., Pashley, D.P. & Martin, J.A. (1996) Reassessmentof butterfly family relationships using independent genesand morphology. Annals of the Entomological Society ofAmerica, 89, 184–192.
Williams, P.H. (1992) WORLDMAP priority areas for bio-diversity. Using Version 3. Privately distributed, London.
Wright, D.H. (1991) Correlations between incidence andabundance are expected by chance. Journal of Biogeography,18, 463–466.
Received 15 November 1999; revision received 28 October 2000