Page 1
Blended learning p. 1
EVALUATION OF A BLENDED LEARNING PROFESSIONAL
DEVELOPMENT PROGRAM FOR MIDDLE-SCHOOL MATHEMATICS AND
SCIENCE TEACHERS
Ronald D. Owston
([email protected] )
Margaret Sinclair
Herbert Wideman
Institute for Research on Learning Technologies
4700 Keele St., Toronto, Ontario
Canada M3J 1P3
Paper presented at the Annual Meeting of the American Educational Research
Association, San Francisco
April 9, 2006
Page 2
Blended learning p. 2
ABSTRACT
Blended learning is a promising, yet so far seldom used model for supporting
teacher professional development. The model combines the advantages of traditional
face-to-face interaction with the flexibility of online learning. In this study, we examine
two one-year professional development programs for middle school mathematics and
science/technology teachers that employed this model. We use Guskey’s (2000) five level
evaluation framework to assess the impact of the programs on teachers’ attitudes,
knowledge, and classroom practices, and on student engagement and perceptions of the
subjects. Overall, our results indicate that the program positively affected teacher
attitudes and content knowledge in certain curricular areas and motivated many to
transform their classroom practice to varying degrees. Despite this, student responses
were mixed: students viewed mathematics less favorably by the end of the program, but
became more positively inclined towards science/technology. The blended learning model
proved to have many positive features, although sustaining teacher involvement in the
online portion for the duration of the program was challenging.
INTRODUCTION
Improving the subject matter knowledge and pedagogical skills of teachers of
mathematics and science, particularly in middle schools, is a key priority of most district,
state/provincial, and federal education authorities (OECD, 2005; Ontario Ministry of
Education, 2004; U.S. Department of Education, 2005). Although there is general
consensus on the elements of what constitutes an effective teacher professional
development for mathematics and science teachers, the challenge is how to design and
implement a program that embodies these principles (Loucks-Horsley, Love, Stiles,
Mundry, & Hewson, 2003). One approach that appears promising now that the Internet is
widely accessible to teachers is to design programs that combine traditional face-to-face
professional development sessions with self-directed online learning. Ideally this model,
known as blended learning, allows developers to build programs that can combine the
increased motivation, socialization, intense focus, and spontaneity that can occur in live
sessions with the online sharing of thoughts and reflections, extended discussion, and
learning at times and locations convenient to the learner (Bonk & Graham, 2006). In this
Page 3
Blended learning p. 3
article we report on the evaluation of the Teacher eLearning (TeL) Project, a two year
professional development program for middle school mathematics and science teachers
that employed a blended learning model. The focus of our research was on how the
program affected teacher attitudes toward and pedagogical practices in these subjects and
on student perceptions and learning of the subjects.
PROFESSIONAL DEVELOPMENT AND BLENDED LEARNING
In the last decade or so, a consensus has emerged that traditional strategies of
professional development, based on one-shot workshops and lectures from outside
authorities, offer very limited growth opportunities for teachers. Research has shown that
professional development is most effective when it is long-term, collaborative, school-
based, focused on the learning of all students, and linked to the curricula that teachers
have to teach (Hiebert, Gallimore, & Stigler, 2002). When professional development is
conducted in this way, teachers of mathematics and science are more likely to change
their instructional practices, gain greater subject matter knowledge, and improve their
teaching skills (Garet, Porter, Desimone, Birman, & Yoon, 2001). The potential for the
professional development to have a direct positive impact on student achievement is also
increased (Cohen & Hill, 2001; Darling-Hammond & Youngs, 2002; Wenglinsky, 2000).
Moreover, Loucks-Horsley et al. (2003) emphasize that current conceptions of
professional development that focus on teacher collaboration and experiential learning
mirror contemporary reforms of mathematics and science education. They contend that
teachers who participate in professional development activities of this nature are better
prepared to introduce best practices into their classrooms as they have experienced this
kind of learning themselves.
Many different professional development strategies have been employed to
incorporate at least some of these principles. The choice of strategy depends upon the
particular purpose of the professional development—whether it be to develop awareness
to new approaches or content, build content and pedagogical knowledge, translate new
knowledge into practice, practice teaching in new ways, or to reflect on teaching and
learning (Brown & Smith, 1997). Strategies that have been used for mathematics and
science include professional networks, study groups, intensive summer institutes,
partnerships with scientists or mathematicians, coaching, lesson study, examining student
Page 4
Blended learning p. 4
work, and linking professional development closely to new curriculum materials (Loucks
et al., 2003). One new professional development strategy beginning to be used is blended
learning.
Typically, blended e-learning is viewed as mid-way along a continuum that at one
extreme has traditional face-to-face instruction, and at the other extreme totally web-
based instruction (Graham, 2006). Richards (2002) argues that blended learning should
not be seen as an “add-on” to instruction, but as an integrated component of a course
designed to produce a more effective learning environment. Indeed, there is evidence of
positive learning outcomes associated with blended learning as compared to entirely face-
to-face instruction and fully online learning. Franks (2002) reported that students in
blended learning courses outperform those in face-to-face and Internet only courses. The
University of Central Florida’s extensive experience with blended learning at the
undergraduate level suggests that on average, blended courses have higher success rates
and lower withdrawal rates than their comparable face-to-face courses (Dziuban,
Hartman, Juge, Moskal, & Sorg, 2006). Additionally, the majority of faculty teaching in
those courses indicated that more and higher quality interaction occurred in their blended
courses than in their comparable face-to-face sections. In a study of eight Canadian
universities, Owston, Garrison, and Cook (2006) reported that students liked that blended
learning provides scheduling flexibility and varied learning opportunities, while
maintaining traditional classroom experiences such as in-class discussion. Both faculty
and students in the study felt that the online component of blended learning encouraged
the development of critical thinking skills.
To date little research has been done on the blended approach for teacher
professional development; however Curtis and Swenson (2003) found that the blended
learning format was an effective model for meeting the needs and learning styles of busy
teaching professionals. And by blending online instruction with the field experiences of
pre-service teacher education candidates, National University was able to create engaging
and meaningful learning experiences for their teacher candidates (Reynolds & Greiner,
2006). Similarly, Oliver, Herrington, and Reeves (2006) describe and illustrate how
blended learning environments in a graduate education course can be designed around
authentic learning experiences to bring meaning and purpose to the learners’ activities.
Page 5
Blended learning p. 5
Two teacher professional development projects, Capital Area Technology and Inquiry in
Education (CATIE) (Holmes, Polhemus, & Jennings, 2005) and Teacher Institute for
Curriculum Knowledge about the Integration of Technology (TICKIT) (Bonk, Erhman,
L., Hixon, & Yamagata-Lynch, 2002), demonstrated how online activities and resources
can be blended with in-school experiences to create programs that would not be feasible
to offer entirely on-site. Blended learning offers other advantages which may be relevant
to professional development. These include: allowing instructors the opportunity to
develop e-learning skills in small increments; making training materials available to
learners before or after face-to-face workshops; and preserving the investment in
traditional teaching materials that have worked well in the past (Driscoll, 2002).
THE CURRENT STUDY
THE TEL PROJECT
The TeL Project was offered by a non-profit agency devoted to advancing public
education in Canada. The idea for the project arose from a senior level advisory
committee of the agency which recommended that action be taken to enhance the skills of
urban grade 6, 7, and 8 teachers of mathematics and science/technology. With financial
support from several public and corporate funding agencies, a two year professional
development project was developed and implemented by agency staff. The first year of
the project was devoted to professional development of mathematics teachers, the second
year to science/technology teachers. The authors were contracted through their university
to be arms’ length evaluators of TeL.
TeL had two main goals with regard to mathematics and science/technology
education: (1) to improve teacher attitudes, knowledge, and classroom practice; (2) to
improve student attitudes toward, engagement in, and learning of the subjects. The theory
of action articulated by the developers was that a blended learning model would allow the
program to achieve these goals by operating over an extended period of time so that
teachers could develop their skills within the confines of the program; allow teachers to
remain in their classrooms for the most part thus reducing the number of costly face-to-
face sessions; and receive ongoing feedback online from their peers and expert program
facilitators as they experimented with new pedagogical approaches in their classrooms.
Page 6
Blended learning p. 6
The expectation of the sponsoring agency was that this professional development model
would be sustainable and transferable to other schools and districts.
During the first year of TeL, the developers employed an implementation model that
began at the start of the school year with a daylong face-to-face session followed by an
eight week online session. This pattern was repeated two more times with the addition of
a final face-to-face session. Thus teachers had four face-to-face sessions and three eight-
week online sessions. Each pairing of a face-to-face session and subsequent online
session was referred to as a module, and each module had a specific theme. Schools that
had teachers participating in TeL were provided with a budget to hire substitutes for
teachers attending the face-to-face sessions; they were also given funds to release
teachers from their classrooms for a half day per week during the eight-week online
periods to provide them with time to plan and participate in online activities. The model
proved somewhat problematic in the first year because the second module conflicted with
normally busy times for teachers in late November and December when teachers had to
deal with the preparation of report cards, parent-teacher conferences, and Christmas
holiday events in their schools. As a result teachers did not participate online as fully as
they might otherwise have. Therefore, during the second year only two modules were
offered for the science/technology program with a hiatus during late November and
December.
All of the modules in TeL related directly to the Ontario (Canada) provincial
curriculum that the grade 6, 7, and 8 teachers in the project were responsible for teaching
(see http://www.edu.gov.on.ca/eng/curriculum/elementary/subjects.html). The
mathematics program focused on strands in Number Sense, Geometry, Algebra, and
Probability; the science/technology1 program dealt with stands on Life Systems, Earth
and Space Systems, and Matter and Materials, Energy and Control. The face-to-face
sessions, which were led by curriculum consultants from participating school districts,
typically began with a whole group introduction to the upcoming module topic in the
morning. Frequently, leaders would ask the group to break up into small working groups
to try out an activity or discuss a topic. During the afternoons teachers broke into one of
four or five multi-school teams that paralleled the online discussion group in which they
participated. This gave teachers an opportunity to work at hands-on activities, share their
Page 7
Blended learning p. 7
experiences in trying out ideas in their classrooms, and discuss the topics presented
during the morning. At the final session in each year small teams of teachers presented
projects they developed to the whole group: the mathematics teachers presented projects
on games to teach probability in their classrooms; and science/technology teacher teams
presented overly complex, Rube Goldberg-like machines.
The course management system eCollege was used for delivery of the online
component. Each week had a theme and structured activities. In any given week
participants might do any combination of the following: download professional articles,
video teaching examples, interactive applets, worksheets, and forms; join live moderated
chat sessions; discuss in online forums their implementation of program activities in their
classes; post reflective journals about their experiences trying out TeL Project activities;
or upload their work. Each of the online discussion groups, which consisted of 10 to 15
teachers, was led by an expert teacher hired to facilitate the discussions. Additionally, the
facilitators provided individual feedback on teachers’ reflective journals or raised
questions or discussion topics with their whole group. During the first year of the project
facilitators were not specifically trained on how to lead online discussions successfully;
however, during the second year training and monthly telephone meetings of facilitators
were held in order to improve the quality of their work.
DESIGN OF STUDY
Consistent with the objectives of the TeL Project, our study sought evidence of the
impact of the blended learning professional development program on teachers’ attitudes,
knowledge, and classroom practice for teaching mathematics and science/technology, and
on students’ attitudes toward and engagement in the subjects. Our work was guided by
Guskey’s (2000) five level framework for the evaluation of professional development
programs. Guskey argues that all too frequently evaluations of professional development
programs focus only on teacher reactions to programs, while neglecting teacher learning,
contextual information, and, most importantly, impact on students. To assess changes in
teacher perceptions (Guskey Level 1) and learning (Level 2) a questionnaire was
developed for mathematics teachers and a similar one for science/technology teachers,
and each was administered at the beginning and end of the respective programs. Some
questionnaires items were adapted from an instrument developed by Kennedy, Ball, and
Page 8
Blended learning p. 8
McDermott (1993) to assess how teachers’ knowledge, beliefs, and reasoning about
teaching change over time as a result of participation in various pre-service and in-service
education programs. From the teacher survey portion of the Repeat of the Third
International Mathematics and Science Study (TIMSS Study Center, 1998) we added
questions dealing with professional development practices, specifics of the teacher’s
class, use of technology, homework, and assessment practices. Several questions were
dealing with specifics of the teacher’s class were added from the U.S. National Science
Foundation supported survey Teaching, Learning, and Computing carried out by Becker
and Anderson (1998). The final surveys had 30 and 23 questions respectively for
mathematics and science/technology. Most questions had at least several sub-questions
and were of the Likert type, with the remainder requiring respondents to select from four
or five pre-determined options.
To assess Guskey’s Level 3—organizational support and change—schools principals
were interviewed at the end of each year using semi-structured protocols. Teachers’ use
of new knowledge and skills (Level 4) was assessed through (a) classroom observations
at the beginning and end of the each program, (b) an analysis of online discussion
postings and reflective journals each year, and (c) an evaluation forum which consisted of
small group interviews of teachers’ conducted during the last face-to-face session of each
year. Observations of lessons were carried out using the following protocol: we
interviewed teachers in advance of their lesson on what they were intending to teach,
observed what and how they taught, and then interviewed them afterwards for their
perceptions on how well the lesson had proceeded. Changes in student perceptions (Level
5) were assessed using separate pre-post program Likert scale questionnaires for
mathematics and science/technology adapted from the Science Work Experience
Programs for Teachers (SWEPT) project (see http://www.sweptstudy.org/), and
supplemented with some items from the student survey portion of the Repeat of the Third
International Mathematics and Science Study (see
http://timss.bc.edu/timss1999i/questionnaires.html). The student mathematics and
science/technology questionnaires had 20 and 13 questions respectively. Like the teacher
questionnaires, most student questions had additional sub-questions and they were mainly
Page 9
Blended learning p. 9
Likert type with the rest requiring respondents to select from four or five pre-determined
options.
The above mapping of data sources to Guskey’s levels indicates the primary data
source used for a particular level. For each level at least one additional data source was
used to triangulate the findings. For example, not only did we consider student survey
results to assess program impact on students, we interviewed teachers about changes that
they saw in students.
All teachers participating in TeL were from schools in a large Canadian urban area
who were nominated by their principals to take part in the project because of their desire
and interest to improve mathematics or science/technology instruction. Approximately
half of the teachers in both cohorts were from high SES schools and half from low SES
schools as designated by their school districts. Sixty-eight grade 6, 7, and 8 teachers
enrolled in the mathematics program and 65 in the science/technology program.
Developers hoped that most of the teachers from the first year would participate in the
second year, however only a small number did. Approximately 10% dropped out of both
programs before they ended. We obtained complete sets of pre-post survey responses
from 48 teachers in the mathematics program and from 33 teachers in the
science/technology program. The poorer response rate in science/technology was due to
many absences from the last face-to-face session when the post program survey was
administered; attempts to have teachers complete it later were not very successful.
Fourteen teachers in mathematics and 13 in science/technology were purposively
sampled for observation so as to represent all three grades from both high and low SES
schools. We had complete pre-post sets of survey responses from 477 students from the
mathematics teachers’ classes and 551 from the science/technology teachers’ classes.
DATA ANALYSIS
Survey data for teachers and for students for each year were analyzed separately
using a repeated measures (pre-post) ANOVA design. For the student analysis only, SES
was used as an independent variable. SES was not used as an independent variable in the
analysis of teacher data as there was no theoretical rationale for doing this as almost all
teachers received their initial training from one of several Ontario schools of education
having equivalent high standards; additionally, the sample size was small for this kind of
Page 10
Blended learning p. 10
analysis. While this basic design of this study has inherent limitations (Campbell,
Stanley, & Gage, 1966), we had no evidence of other significant events occurring at
schools either year that would have influenced teacher practices or student attitudes
significantly.
All interviews were recorded and transcribed. The project evaluation questions
provided initial categories for the analysis of the qualitative data, which included
interview transcripts, field notes, and online postings. From the initial categories,
subcategories were derived inductively using the constant comparative method described
by Bodgan and Biklen (1998).
RESULTS
IMPACT ON TEACHERS
Satisfaction with Overall Program (Guskey Level 1)
Overall teachers were very satisfied with both the mathematics and
science/technology TeL programs for the professional learning opportunity that they
afforded. For both programs, slightly more than half of the teachers surveyed said that the
program “fully met their expectations” and slightly fewer than half said that it “met their
expectations to some extent.” Noteworthy was that none felt that the programs “did not
meet many” or “any of their expectations.” Our qualitative data indicate that mathematics
teachers became more willing to experiment with new ideas, activities, and approaches in
their classrooms as a result of the program. Even those who were already quite confident
about their mathematics teaching abilities at the beginning of the program for the most
part appeared to have benefited by trying new ways of having students solve problems
and by thinking more broadly about the teaching of mathematics. Science/technology
teachers’ gained confidence to experiment with different teaching approaches that
featured hands-on exploratory learning, higher level questioning, use of new kinds of
teaching materials, greater student autonomy for designing projects, and grouping
students in mixed ability teams. Experienced science/technology teachers found the
material in the course to be a helpful refresher for techniques previously learned but not
necessarily implemented, and less experienced teachers valued the subject matter
knowledge learned and the insights and ideas gained for effective teaching of science and
technology.
Page 11
Blended learning p. 11
Satisfaction with Blended learning Experience
As described above, the program consisted of a combination of face-to-face sessions
and an online component. There was a general feeling that the face-to-face component,
with its opportunities for in-depth sharing and exchange of ideas, were extremely
valuable, and some teachers wanted more of this. Teachers in both programs felt that the
sessions provided both a chance to connect with other teachers at the same grade level
and share ideas, and also a chance to grow from the expertise of the facilitators and
fellow teachers. Participants especially valued the opportunities to come together and
celebrate their best practices, experiences, challenges, and lesson/unit plans. Teachers
who were the only teacher of a particular grade level at a school also spoke of how this
aspect of the program helped eliminate feelings of isolation.
With respect to the online sessions, two expectations for teachers were set out by the
TeL developers: (1) to post their reactions to articles and other assignments each week
and (2) to post at least one reflective journal every two weeks. There was mixed reaction
to these assignments from both the mathematics and science/technology teachers, with
some enjoying it and participating regularly, and others participating erratically or
entirely dropping out from the online component. The best indicator of commitment to
online participation was the regular posting of journals as this activity required time and
thoughtful reflection. In both mathematics and science/technology journal submission
tapered off as the course progressed. For mathematics, 89% of the teachers posted two or
more journals in Module A, 59% in Module B, and 56% in Module C. The
science/technology program had only two modules: 76% of teachers posted two or more
journals in Module A and 57% in Module B. This represents a relatively weak
participation rate, especially when one considers that teachers were provided with one-
half day per week release time to work on this and other program activities. Evidence
suggests that teachers were more likely to participate if they received good quality
feedback from their facilitators. When teachers commented during the evaluation forum
about the quality of their online experience, they felt there was a lack of community and
communication in their online sections. While they knew each other’s faces they did not
even know all the names of other teachers in their online section. A common comment
voiced by teachers was that “it is difficult to share with strangers.”
Page 12
Blended learning p. 12
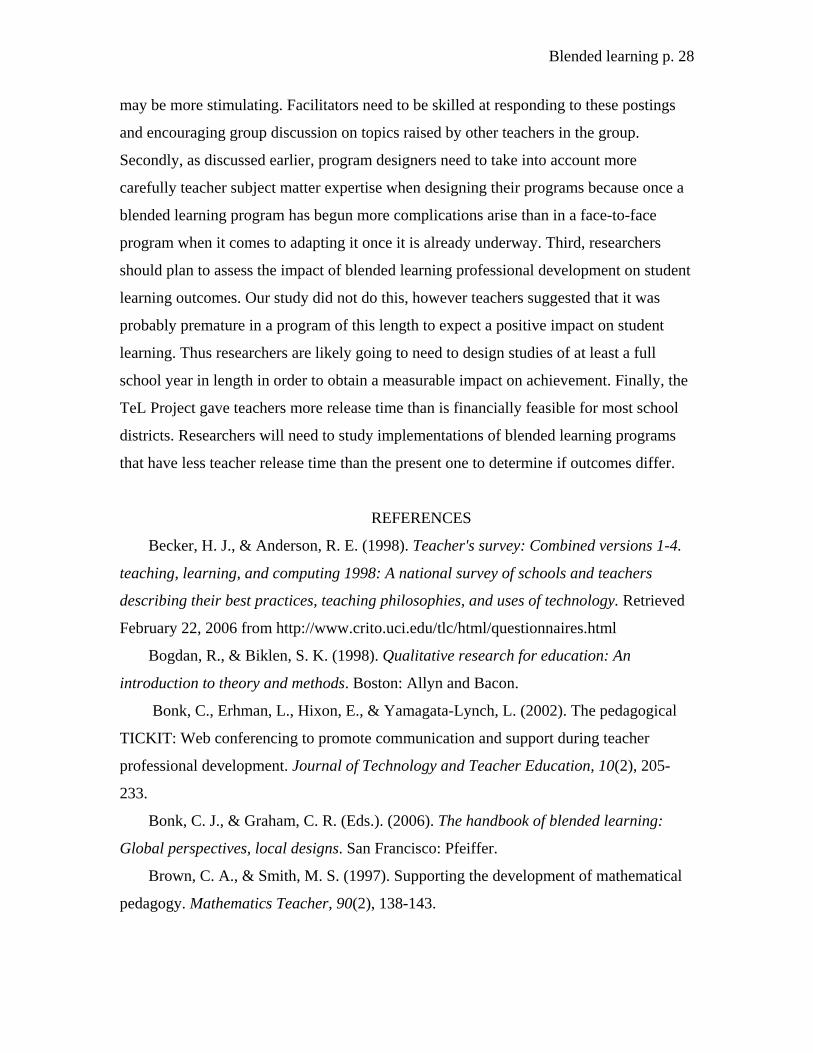
Teacher Learning (Guskey Level 2)
Teachers were asked to report on the pre- and post-surveys how well they were
prepared to teach various aspects of the curriculum. The areas where significant pre-post
differences were found are given in Table 1.2 Mathematics teachers were asked about
preparedness to teach eleven different areas of the curriculum. While increases in
preparedness were noted for all areas between pre- and post-test ratings, statistically
significant gains were noted only for the topic of Probability. Science/technology
teachers were asked about preparedness to teach the four main strands in the curriculum:
Life Systems, Earth and Space Systems, Matter and Materials, and Energy and Control.
Significant increases were reported in the first three of these topics with the fourth
showing a non-significant increase.
Insert Table 1 about here
Organizational Support and Change (Level 3)
Teachers we interviewed stated that they were provided with strong support for
participation in the project through encouragement from their principals, school goals that
emphasized the improvement of mathematics and science/technology teaching, and the
provision of necessary resources from schools, districts, and the TeL Program itself.
Principals reported that they were pleased with their teachers’ participation in the TeL
Project, and, in a few cases, they said that the project exceeded their expectations. Only
one issue stood out as problematic—teacher release time. Even though teachers were
provided with one half day release time per week to work on program-related activities,
approximately half of them did not use all the time they were afforded. Several reasons
were given for this: schools could not find qualified substitute teachers; teachers felt that
it was more trouble that it was worth preparing lessons for substitute teachers; teachers
felt that their students were suffering academically; and, in several cases, teachers said
that student behavioral problems developed due to their frequent absences from class.
Some teachers also experienced resentment from colleagues who wondered why they
were given so much time for professional development when they themselves had to take
courses and attend workshops after school. There were several cases during the first year
Page 13
Blended learning p. 13
of the program when schools received angry calls from parents about frequent teacher
absences. This did not happen during the second year because, we were told, principals
did a better job of informing parents in advance that their child’s teacher would be absent
regularly for professional development purposes. (One principal in a high SES
neighborhood withdrew her teachers after the mathematics orientation day when she
found out her teachers would be out of class so often because she felt that parents would
not tolerate the repeated absences.) A final problem was that some principals wanted
teachers to take one release day every two weeks rather than a half day weekly because of
difficulty in getting a substitute teacher for a half day. As a result those teachers did not
participate regularly each week. The problem was exacerbated when some teachers were
not permitted by their principals to remain home that day to work on the project (for
reasons of public perception). While working at school they were frequently interrupted
by other teachers and job-related demands.
The most notable change in school practices resulting from teachers participating in
the mathematics and science/technology programs was in the amount and nature of
teacher collaboration. Examples of this cited by principals include: more reflection and
sharing of ideas and practices among colleagues; teachers doing workshops at the school
and district levels for other teachers; teachers presenting mathematics and
science/technology teaching ideas at staff meetings; an increased number of same grade
and cross-grade team meetings that focused on pedagogical issues; and an increased
number of “bring and brag sharing of lessons” and teacher “lunch and learn” sessions.
Additionally, principals reported that teachers who were in the science/technology
program became more involved in co-curricular activities such as the organization of
science fairs and robotics challenges with other schools.
Changes in Classroom Practices (Guskey Level 4)
On the teacher survey several statistically significant changes in pedagogical beliefs
and practices were found between the beginning and end of each program. One question
that stood out as highly significant on both the mathematics and science/technology
surveys dealt with whether students should be allowed to leave a lesson “feeling confused
or stuck.” Pre- and post-survey means and probabilities are given in Table 2. The results
suggest that teachers believed that it was more acceptable to leave students feeling this
Page 14
Blended learning p. 14
way by the end of the program. This suggests that teachers adopted the TeL Project’s
philosophy of teaching mathematics and science/technology in a more open-ended,
constructivist way where students were not told solutions but had to puzzle over them and
find their own answers.
Insert Table 2 about here
Two other questions that showed statistically significant differences between pre-
and post-program survey for mathematics teachers are reported in Table 3. Questions 18c
and 27f together suggest important changes in teacher practice as teachers at the end of
the program seemed more skilled in questioning and they had students work in groups
more often. These changes were also consistent with the TeL Project’s pedagogical
philosophy.
Insert Table 3 about here
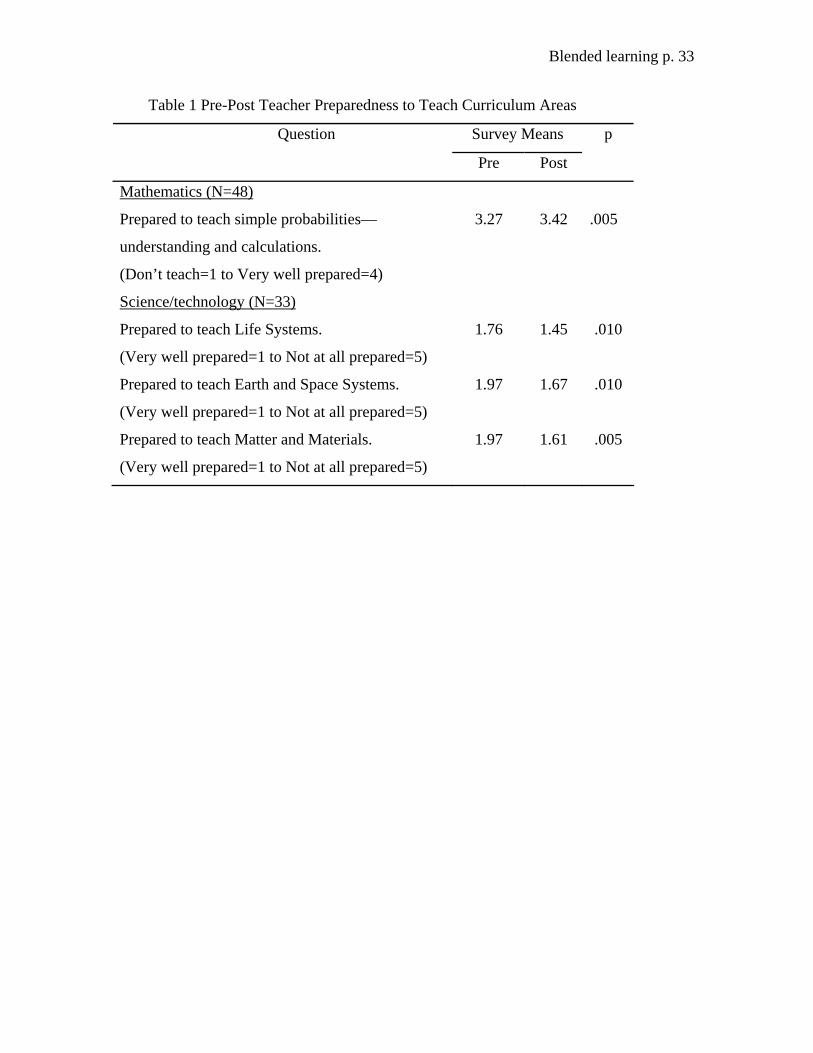
A greater number of pre-post statistically significant changes in teachers’ knowledge
about pedagogy were found for science/technology teachers than for mathematics. These
are presented in Table 4. Results suggest teachers at the end of the program were giving
less emphasis to rote learning of rules (4f); placed more value on mixed-ability student
grouping (11g); assigned more open-end problems to students (6c); and used computers
more (6d). Teachers also appeared to be allowing students to work more independently as
they were using more group work (7e), spending less time demonstrating experiments
(8h) and more time having students design their own experiments (8a), and giving fewer
lecture style presentations (8c). They also appeared to be relying on the textbook less (18)
and finding more uses for content covered in class (9h). By the end of the program, the
fact that teachers found their teaching less hampered by the shortage of equipment would
suggest that as the program evolved teachers found ways to do science and technology
experiments using everyday materials, mitigating the problem (14g).
Insert Table 4 about here
Page 15
Blended learning p. 15
In general, the views of school principals supported teacher responses. For both
subjects, principals noted that teachers showed increased their confidence in using a
variety of instructional strategies and materials directly as a direct result of the project.
Mathematics teachers made more use of manipulatives (e.g., three dimension paper
models of geometric shapes); science/technology teachers increased their use of school
lab facilities and equipment for hands-on activity. Both groups of teachers reportedly
made greater use of computers and the Internet for classroom activities and projects.
Additionally, principals said that teachers began to play a leadership role in their subject
areas: colleagues saw them as “experts” who could be called upon for help in curriculum
and teaching matters.
Classroom observations of the progress made by the sample of teachers we observed
were less sanguine. Presented below are examples of “weaker or little changed lessons”
and of “stronger lessons” for mathematics and science/technology. Of the 14 mathematics
observations, half of the lessons were judged stronger; eight (61%) of the 13
science/technology lessons were judged stronger. These classifications were made on the
basis of how well teacher lessons matched the TeL program’s recommended approaches
and, more generally, by evident characteristics of constructivist learning environments
(Bransford, Brown, & Cocking, 2000).
Weaker Lessons in Mathematics. Some teachers incorporated teaching practices
recommended by TeL—such as having students work in groups and carrying out
investigations designed around relevant contexts—and there was awareness of the
importance of sharing. However, the investigations were sometimes poorly structured or
were procedural learning disguised as constructivist learning, and many questions asked
by the teacher dealt with superficial aspects of the mathematics. Other teachers showed
no change in approach between our first and second observation and, in fact, employed
methods that were in conflict with the ideas presented in TeL. One prepared and taught
lessons that focused on less important mathematical activities for both sessions. Another
used a very traditional approach by focusing largely on teacher directed instruction in
procedures (some of which were beyond the elementary curriculum). A third used group
work at both sessions, but students worked on a disconnected set of problems/tasks and
Page 16
Blended learning p. 16
there was no attempt to draw students together to discuss strategies or build mathematical
connections.
Stronger Lessons in Mathematics. Three teachers used the probability game they had
created for the program; a fourth chose a game from the student text, noting that he had
not used the activity the year before but had recognized its value after participating in the
program. Although teachers did not fully capitalize on the potential of the games to help
their students make mathematical connections, they did demonstrate a budding awareness
of the following: that an activity must be carefully planned and orchestrated; that it is
necessary to consider possible student difficulties during planning; and that the opening
of the lesson needs to connect to prior knowledge and provide students with skills for the
activity. Another teacher moved from direct teaching to a much more open style, and at
the second observation talked about her new appreciation for letting students struggle
with an idea. She said that the TeL experience “opened her eyes to not being so teacher-
directed in the classroom.” A teacher who was already confident and knowledgeable,
showed in the second observation that she had moved from having students share what
they did, to having them compare and debate approaches. A final teacher in this group
taught an adequate but unfocused first lesson. Her second lesson was much more tightly
organized and effective. She commented that the TeL Project had made her see teaching
math as a priority, and had helped her reflect on her teaching practice.
Weaker Lessons in Science/technology. In these lessons all teachers employed at
least the opening and extended middle of the three-part lesson: the concluding part was
either missing or fairly weak.3 Typically, classes would end with a promise that there
would be a follow-up discussion during the next lesson. We observed one teacher who
had gone to considerable trouble to obtain materials, in this case, three ray boxes, and
three mirrors for demonstration. Although the lesson was very procedural, it clearly (to
the teacher) represented a big step forward as it was the first time she had made the effort
to acquire specific science/technology materials. In another class we visited, the teacher
had invited us to view her students’ work for a science fair project. We noted that much
of the students’ project work was “informational” and typical of what grade 3 students
could produce even though the students were in grade 8. Questioning skills of teachers in
Page 17
Blended learning p. 17
this category were typically weak and devoid of anything of substance about
science/technology. Questions were usually of the “Does it work?” type.
Stronger Lessons in Science/technology. Teachers in this category planned and
executed three-part lessons well. They had become skilled at making connections with
previous student learning, asking deeper level questions, and using small group hands-on
activities. For example, one teacher started by eliciting prior knowledge of pendulum
motion from a parallel experiment (done the previous day) that had examined the
relationship between pendulum length and pendulum. The students then began hands on
experimentation with pendulums. During the class the teacher circulated to groups and
assisted them in problem solving. She asked for answers but also asked “why” certain
results had been obtained and why and how students chose to carryout tasks as they did.
She also held impromptu brainstorming sessions involving the whole class during the
course of the lesson. After about 25 minutes of experimental activities by the students,
the teacher halted the class and began whole-group questioning. She probed their
understanding of what it means to make a prediction: “When I ask you to fill in your
prediction, what am I asking you to say – what is it exactly about?” Student: “What you
think is going to happen, like what string length will have more swings.” Teacher: “Yes –
am I looking for descriptions of the strength of the thrust?” Student: “No”… The teacher
then spent a few minutes clarifying the measurement of the angle to the plum line, asking
the class for measures of the 90 and 45-degree angles she demonstrated.
IMPACT ON STUDENTS (GUSKEY LEVEL 5)
We compared the results of the pre- and post-program student surveys to see how
students’ attitudes and perceptions toward the two subjects changed over the course of
the professional development programs. The mathematics results are presented first,
followed by science/technology.
Student Views of Mathematics
Responses to 25 questions had statistically significant pre-post differences. The
questions are readily grouped into four categories: time spent on mathematics; the
mathematics classroom; value of mathematics; and succeeding in mathematics. We report
pre-post differences between students from high and low SES schools only when they are
significant (p<.05).
Page 18
Blended learning p. 18
Time Spent on Mathematics. Students differed between the beginning and end of the
program on three questions related to time spent on mathematics as illustrated in Table 5.
Questions 3 and 4g suggest that students were spending less time working on
mathematics by the end of the program than they were at the beginning. This trend seems
to be carried over to other subjects as suggested by Q4h.
Insert Table 5 about here
Analyses of these data by SES, revealed that at the end of the program high SES
students reported spending significantly less time on mathematics work in one week than
low SES students (Q3; p=.020); less time studying mathematics or doing mathematics
homework after school (Q4g; p=.012); and less time on other school subjects (Q4h;
p=.0004).
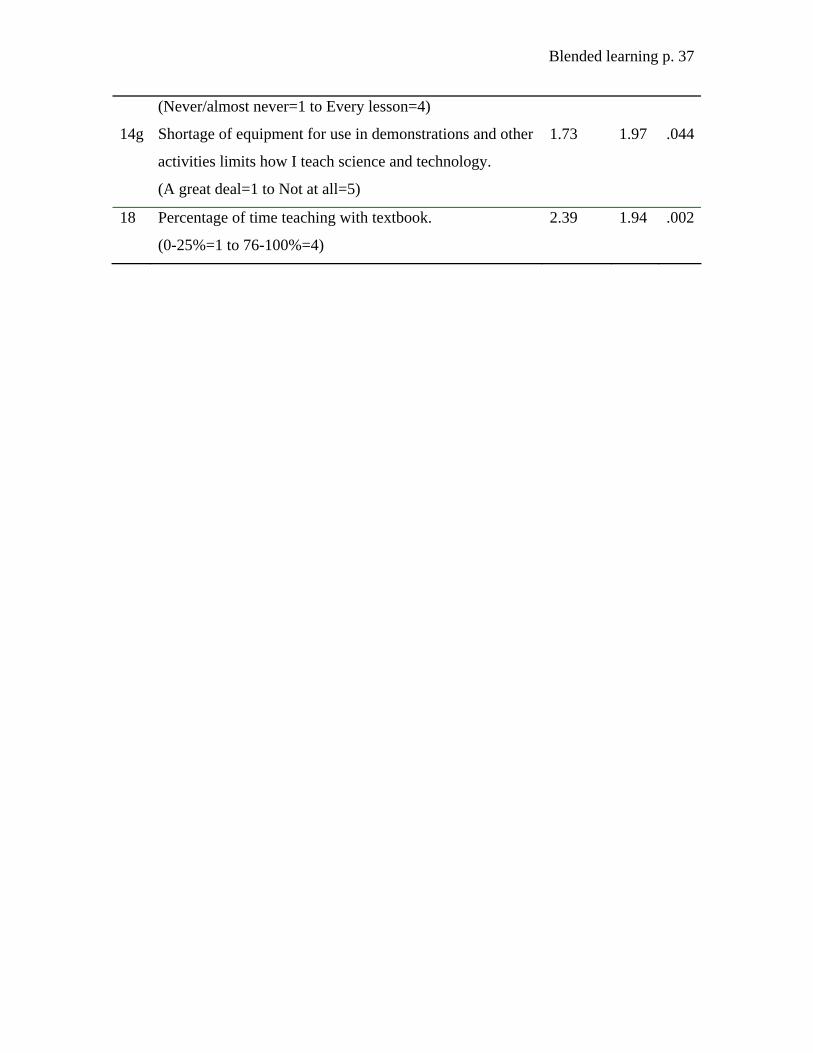
The Mathematics Classroom. Responses to questions 19b and 19f in Table 6 suggest
that teachers were trying to make the mathematics classroom more relevant to students as
more students agreed at the end than the beginning that new topics are introduced with
examples of the relevance of the topic. At the completion of the program students
reported doing less textbook work (Q8a) and more exercise sheets (Q8b), although low
SES students reported using textbooks more often than high SES students (p=.008) by the
end of the program. Project work seems to have dropped off at program’s end (Q8c), but
student writing on the (chalk/white) board increased (Q20q). Students perceived that they
wrote more quizzes and tests at the end of the program than the start (Q20c).
As for homework, students reported that at the end they had a greater opportunity to
begin the homework in class (Q20k), and that their teacher checked it less often (Q20j).
Whether as a consequence of less teacher checking or not, fewer students appear to agree
with the statement in question 9a that most students in the class do their homework.
Students appeared to be using computers and calculators more at program’s end than
the beginning (Q20g and Q20f), although high SES students used calculators more often
(p=.002) by the end of the program. The Web seems to be used less for mathematics
projects than before (Q16b); teachers are also using the overhead projector less (Q20p).
Page 19
Blended learning p. 19
Insert Table 6 about here
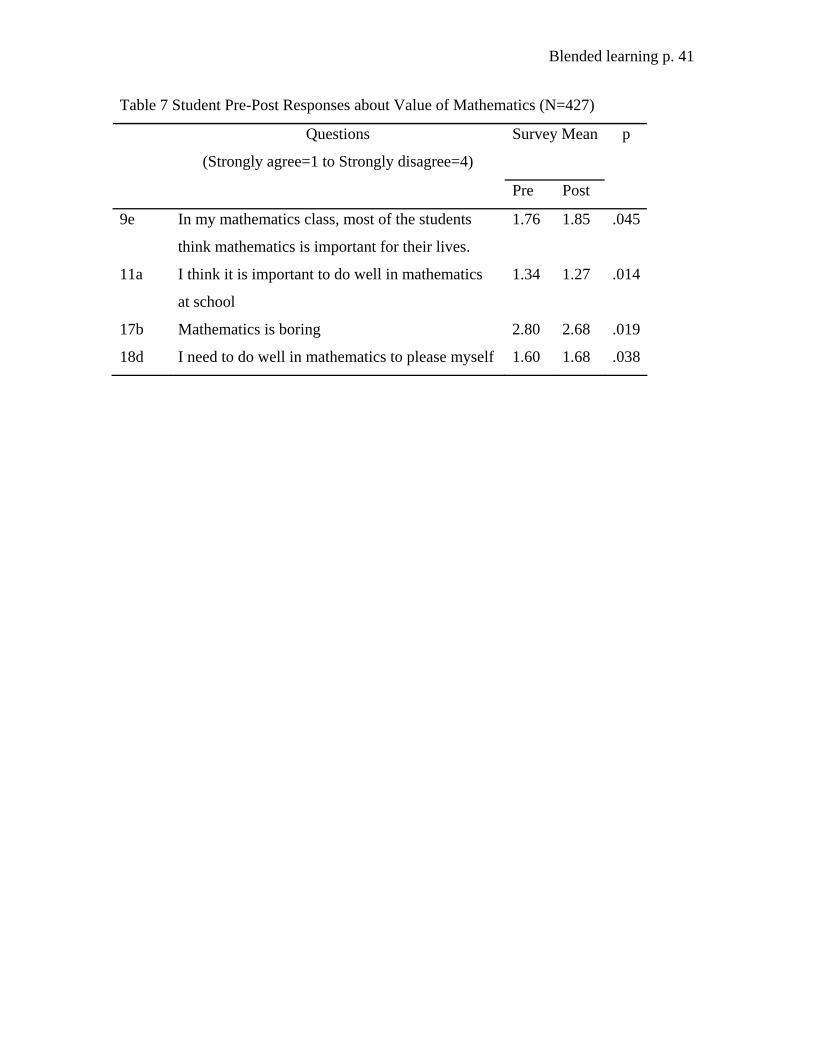
Value of mathematics. Unfortunately, overall students did not seem to value
mathematics as much at the conclusion as at the beginning. Mean student responses are
given in Table 7. Fewer students agreed with statements that mathematics is important in
their lives (9e) and that it is important to do well in mathematics to please themselves
(Q18d). Also disheartening is that more students agreed at the end than the beginning
with a statement that mathematics is boring (17b). The one positive sign is that
significantly more students at the end of the program responded that it is important to do
well in mathematics at school (11a); however, very significant SES effects were found
(p=.000) indicating that more low SES students than high SES students agreed with this
statement at the end of the program than at the beginning.
Insert Table 7 about here
Succeeding in Mathematics. Significantly more students disagreed at the end than at
the beginning that in order to succeed in mathematics you need lots of natural ability
(Q13a) and good luck (13b). More disagreed at the conclusion of the program that to do
well you need to memorize the textbook or notes (Q13d), which may suggests that more
students see that understanding is an important aspect of success in mathematics. This is
illustrated in Table 8 below.
Insert Table 8 about here
Teacher Views of Changes in Mathematics Students
In the evaluation forum teachers made comments about students in two areas:
activities students enjoyed and changes they noticed in the attitudes and abilities of
students.
Enjoyment of Mathematics Activities. Geometer’s Sketchpad, which none had used
before, was highlighted as an appealing software tool for students. Teachers commented
that it allowed students the ability to work at their own pace and have fun; teachers
Page 20
Blended learning p. 20
shared that students were very engaged with this program and were “laughing” in math
class. This was overwhelmingly something students delighted in using. Students also
enjoyed the used of tangrams and manipulatives like geoboards, which allowed them to
see the “why” of mathematics—and teachers noted that their students were more
successful both during and after the lesson in retaining their learning when these were
used. Classes liked taking an online student survey about their opinions of mathematics
that was given by teachers as part of the program. In general there was an increased
receptivity to mathematics on the part of students; teachers attributed this to the fact that
their delivery was making mathematics more fun and engaging for a diverse group of
learners.
Changes in Mathematics Attitudes and Abilities. Teachers noted better engagement
from students with lower mathematics skills, as well as improvements in students’ self
esteem, motivation, and attitudes. They spoke of increased student enjoyment of
mathematics: they felt that students took greater pleasure from the lessons, and this in
turn manifested itself in better student focus during the lesson, more self-management by
students, and a greater willingness to take risks. Of particular note were comments that
indicated that learners with attention deficit disorder and learning disabled students were
benefiting by being able to focus for longer periods of time. Also, teachers felt that there
was increased learning for bodily kinaesthetic learners in activities like Traffic Jam where
students line up and exchange places to learn pattern recognition and generalization.
Lastly, teachers felt that all learners demonstrated greater collaborative skills, higher
order thinking skills and enhanced problem solving skills as a result of their new teaching
methods.
Student Views of Science/technology
In contrast to the large number of significant pre-post survey differences in
mathematics, only four questions had statistically significant differences in
science/technology. These are shown in Table 9.
Page 21
Blended learning p. 21
Insert Table 9 about here
Questions 7b and 13c suggest significant changes in pedagogy between the
beginning and end of the program, with less use of worksheets and individual seat work,
respectively. As suggested by responses to question 13d, teachers appear to have
significantly increased the amount of time spent on hands-on activities, such as lab
experiments, to compensate for less time spent doing worksheets. This change
corroborates teacher reports discussed previously that more time was being spent on
active learning. The increase in hands-on activities (13d) may have led to a change in
student perception with regard to their learning success in science and technology.
Question 9d suggests that significantly fewer students viewed science and technology as
their weakest subject at the program end than had done so at the beginning.
Significant pre-post differences when analyzed by SES were found on three other
questions. Compared to students in low SES schools, students in high SES schools
reported that they: worked more on projects (p=.029); felt science/technology was more
important to everyday life (p=.041); and were asked more often to connect prior learning
with what they knew about a new topic being introduced (p=.019).
Teacher Views of Student Changes in Science/technology
Teachers reported that, in general, improvements were noticed in both student
confidence with, and a desire to learn, science/technology. Increased enthusiasm and
greater interest in the subject was noted by several teachers. Teachers also observed that
students were more willing to get involved with class experiments and report on their
findings. Students appeared to be more engaged in higher-level thinking and problem
solving. Some teachers noted that students were asking more questions, and that these
questions were more in-depth, and more thoughtful in nature. Others noticed fewer
behavioral comments from substitute teachers using the science/technology day plans
they left behind: they attribute such changes to the fact that students were more involved
in their learning.
There were mixed reports about the development of teamwork skills. Most reported
an improvement of student collaborative skills. They observed that students seemed
Page 22
Blended learning p. 22
better at helping each other, especially on specific jobs related to a given task. However,
teachers whose students were not used to teamwork felt that their students needed more
time to develop these skills.
According to teachers, hands-on learning opened the eyes of students to new
experiences, enabling them to make better connections between what they learn in school
and their own lives. Many teachers also noted that students were beginning to accept
more ownership for learning. They saw their role as having shifted from the “sage on the
stage” to a more facilitating one, which helped create an environment that encouraged
students to learn on their own.
What was abundantly clear from teachers was that the integration of hands-on
experiences into their classes, coupled with a focus on design and inquiry processes,
fueled a richer learning experience for students. Students became more able to make
connections to other learning and experiences in everyday life. Teachers saw the
inclusion of hands-on activities as beneficial to every kind of learner. In particular,
students who struggled with learning disabilities or those who had English as a second
language were able to contribute meaningfully when hands-on activities were employed.
Several teachers mentioned a connection between improved student grades and their
own professional growth; however, most felt that they had not had sufficient time to
gauge this accurately. They did, however, state that their professional development had
enabled them to better help their students grasp difficult concepts.
SUMMARY AND IMPLICATIONS
The purpose of this study was to assess the impact of the TeL blended learning
professional development program on the attitudes, knowledge, and classroom practice of
mathematics and science/technology teachers, and on the attitudes, engagement, and
learning of their students. TeL was organized in a modular format, with each module
consisting of a day-long face-to-face sessions followed by an eight week online session.
In the first year three modules were offered for mathematics, while in the second year
only two modules were offered for science/technology. The content of the program was
organized around Ontario provincial learning standards for each subject for grades 6, 7,
and 8. Besides program length and obvious content differences, there were two other
Page 23
Blended learning p. 23
differences between the programs. First, the facilitators of the online discussion groups
for science/technology were given a brief initial training and had regular monthly
meetings as a group with the program developers for the purpose of improving their
facilitation skills, training that the mathematics facilitators did not receive. Second, the
science/technology teachers had a considerably stronger background in their subject
matter knowledge than the mathematics teachers.
We used Guskey’s (2000) five evaluation levels as a framework for organizing the
presentation of our results. Next we summarize our results across the two programs in
terms of their impact teachers and students, the two main areas that this study
investigated. In doing so, we compare and contrast the outcomes of the programs and
draw out implications for the design of blended learning professional development
programs in general.
TEACHER IMPACT
What was abundantly clear across both programs was the high level of teacher
satisfaction with the professional development experience with which they were
provided. Added to this teachers gained the confidence needed to experiment with new
pedagogical approaches in their classrooms and to share and reflect upon their successes
and disappointments with their colleagues. In and of itself, this is a significant
accomplishment of the program as confidence development is a key component of in-
service teacher learning (Graven, 2003). The opportunity for teachers to learn on the job,
focus on the curriculum which they are expected to teach, and share with peers over an
extended period of time are well-recognized in the literature as key aspects of
professional growth (Mundry, 2005).
A closer examination of the teacher satisfaction data indicates that much of the
satisfaction stems from the face-to-face sessions, which teachers enjoyed and looked
forward to. Mixed feelings were expressed in terms of their satisfaction with the online
component. On the whole teachers did complete their weekly online assignments;
however, reflective journal writing tapered off in both programs to where just over half of
the teachers submitted two or more journals by program mid-points. This occurred even
though teachers were provided with teaching release time to do this as well as other
program-related assignments and activities. The journal participation rate did not improve
Page 24
Blended learning p. 24
in the second year despite scheduling the program to avoid peak work periods for
teachers.
The training of facilitators during the second year was deliberately undertaken with
the intent of improving the quality of the online discussion and journal submission as
skilled facilitation is critical for increasing the participation and quality of the online
experience (Salmon, 2003). Evidently facilitator skill was either insufficient to motivate
teachers to participate or teachers simply gave online activity lower priority over trying
out new approaches in their classrooms.
Although teachers were very satisfied with the program overall, their feelings about
how well it prepared them to teach the provincial curriculum varied between the two
groups of teachers. According to survey responses, by the end of the program
mathematics teachers felt significantly better prepared to teach only one topic
(Probability) out of eleven covered in the program, whereas science/technology teachers
felt better prepared to teach three out of four key strands. This finding was somewhat
surprising considering that the mathematics program was eight weeks longer than the
science/technology program. The only explanation we can deduce is that the relatively
weak subject area backgrounds of the mathematics teachers prevented them from
benefiting even with the additional program length. Forty two percent did not have any
mathematics training beyond high school and none had graduate training. On the other
hand, only 18% of the science/technology teachers completed their science education in
high school and the same number (18%) had graduate level science training. This finding
suggests that developers need to be more aware of teachers’ prior content knowledge and
plan programs so that teachers can learn the content that they will be teaching in ways
which are linked to the classroom (Cohen & Hill, 2001; Loucks-Horsley, 2003; Ma,
1999). The need for this is more critical for the online portion of blended learning
programs than the face-to-face part. This is because it may take developers more time to
realize teachers’ subject matter weaknesses as they do not receive the immediate
feedback from participants that they would get in face-to-face sessions. Additionally, it
may be more difficult to modify the online portion of a course while it is in progress
because participants may be at different stages in their progress through the course at any
Page 25
Blended learning p. 25
given time, so modifying sections that some have already completed would not be
desirable.
The TeL program did appear to affect teachers’ beliefs and practices. The most
significant pre-post change of all survey questions in both programs was the one that
dealt with whether it is acceptable to leave students puzzled at the end of a class. More
said that it was acceptable to do this, which suggests that teachers may have been
teaching mathematics and science/technology in a more open-ended, constructivist way
by the end of the program. Both mathematics and science/technology teachers’ responses
suggested that they became more skilled in questioning and had students work in groups
more often. Beyond this science/technology teachers reported shifting from whole class
lecturing and demonstrations of straightforward content to open-ended, student-centered
classrooms where students design, discuss, and report on their own experiments. They
also became more creative in teaching with everyday materials and not having to rely on
scarce lab equipment. Our classroom observations confirmed that these changes were
occurring and that more changes occurred in the science/technology classes than in
mathematics. Again, the most plausible reason why the mathematics teachers did not
change their practice as much is because of their weaker backgrounds, because teachers
with weaker content knowledge tend not to feel comfortable teaching higher-order
thinking skills and engaging in related practices, such as hands-on learning (Wenglinksy,
2000).
For the most part, teachers in the TeL program were well-supported by their schools.
The only barrier teachers faced was finding adequate time to complete all that was
expected of them in the program. Indeed, time for professional development is a key
issue that arises from most studies of school change (Fullan & Miles, 1992; Garet et al.,
1999). TeL was one of the most generous professional development programs we have
seen in terms of supporting teachers with teaching release time. In fact, so much time was
available that teachers did not want to make use of all of it. Thus the issue appears to be
not just providing adequate time, but helping teachers spend and allocate available time
(Loucks-Horsley et al., 2003). Teachers in TeL were generally not used to self-directed
professional development as it was normally something “delivered” to them. This implies
Page 26
Blended learning p. 26
that in the less structured online portion of a blended learning program teachers may need
more help in planning, allocating, and using the time available to them.
IMPACT ON STUDENTS
There were more pre-post differences on the student survey for mathematics than for
science/technology, although the changes were not all for the better. Fewer students
believed that mathematics is important in their lives and that it is important to do well in
mathematics to please themselves. Also discouraging is that more students agreed at the
end of the program than the beginning with a statement that mathematics is boring. This
finding is surprising as teacher reports suggested that students had become more
motivated and engaged in their mathematics work. Other aspects of the classroom that
students reported had changed, such as the teacher linking a new topic to past work and
everyday life, were confirmed by teachers.
The equivalent student questions for science/technology about whether the subject
was boring and its importance in their lives did not reveal any significant pre-post
differences. In fact, science/technology students’ attitudes appeared more positive at the
end of the program because fewer students felt that it was their weakest subject. Teachers
confirmed that science/technology students thought more positively toward the subject by
the end of the program. Students reported an increase in hands-on activities such as
experiments occurring in their classrooms, which teachers also said had happened.
Several interesting differential effects were found when comparing the pre-post
differences of students from high and low SES schools. More low SES students than high
SES students agreed that it is important to do well in mathematics at school by the end of
the program than at the beginning, which suggests that low SES students tend to benefit
at least attitudinally from hands-on, student centered mathematical activities that teachers
were employing. This finding contradicts Chall’s (2000) summary of empirical literature
which suggests that low SES students may be negatively affected by student centred
approaches as they are not able fully engage in the desired behaviors.
No pre-post differences were found for science/technology students on the same
question, however high SES science/technology students felt that the subject was more
important to everyday life by the end of the program. Other differential effects we found
were that high SES mathematics students reported using calculators more; they spent less
Page 27
Blended learning p. 27
time on mathematics work in one week; less time studying mathematics or doing
mathematics homework after school; and spent less time on other school subjects. For
their part high SES science/technology students reported working more on projects and
were asked more often by their teachers to connect prior learning with what they knew
about a new topic being introduced.
Overall our findings on student impact suggest that the TeL professional
development, which was delivered by a blended learning model and focused on
curriculum teachers have to teach, can positively influence some aspects of student
attitudes and engagement. In and of itself, the finding that a professional development
program offered over time that focuses on learning standards has a positive impact is not
surprising. What is worthy to note, however, is that a program in which teachers met only
three to four times during a school year had this effect. Clearly, there was a value added
from the online component which attests to the significance of the blended learning
model.
IMPLICATIONS FOR RESARCH AND PRACTICE
At this point very little use has been made of the blended learning model in K to 12
teacher in-service programs, despite its rise in popularity worldwide (Bonk & Graham,
2006). Currently, the model is being employed in formal, accredited pre-service programs
offered by schools of education (Reynolds & Greiner, 2006), general university degree
programs (Owston, Garrison, & Cook, 2006), and in training for industry (Lewis &
Orton, 2006). This study suggests that blended learning has promising potential for
changing teacher practice and influencing student behavior. At the same time it can
reduce the need to bring teachers together as often at a central location as done in
traditional district-wide professional development, thus potentially lowering district costs
particularly if an online learning system is already in place.
Several aspects of blended learning professional development need to be explored
more adequately before widespread adoption of the model. Two of these are the nature of
the online tasks given to teachers as part of the program and the role of the online
facilitators. In this program we saw that teachers were not particularly motivated to post
online reflective journals, even though they got helpful feedback from facilitators. We
suggest that shorter weekly postings on teacher reflections in a course discussion forum
Page 28
Blended learning p. 28
may be more stimulating. Facilitators need to be skilled at responding to these postings
and encouraging group discussion on topics raised by other teachers in the group.
Secondly, as discussed earlier, program designers need to take into account more
carefully teacher subject matter expertise when designing their programs because once a
blended learning program has begun more complications arise than in a face-to-face
program when it comes to adapting it once it is already underway. Third, researchers
should plan to assess the impact of blended learning professional development on student
learning outcomes. Our study did not do this, however teachers suggested that it was
probably premature in a program of this length to expect a positive impact on student
learning. Thus researchers are likely going to need to design studies of at least a full
school year in length in order to obtain a measurable impact on achievement. Finally, the
TeL Project gave teachers more release time than is financially feasible for most school
districts. Researchers will need to study implementations of blended learning programs
that have less teacher release time than the present one to determine if outcomes differ.
REFERENCES
Becker, H. J., & Anderson, R. E. (1998). Teacher's survey: Combined versions 1-4.
teaching, learning, and computing 1998: A national survey of schools and teachers
describing their best practices, teaching philosophies, and uses of technology. Retrieved
February 22, 2006 from http://www.crito.uci.edu/tlc/html/questionnaires.html
Bogdan, R., & Biklen, S. K. (1998). Qualitative research for education: An
introduction to theory and methods. Boston: Allyn and Bacon.
Bonk, C., Erhman, L., Hixon, E., & Yamagata-Lynch, L. (2002). The pedagogical
TICKIT: Web conferencing to promote communication and support during teacher
professional development. Journal of Technology and Teacher Education, 10(2), 205-
233.
Bonk, C. J., & Graham, C. R. (Eds.). (2006). The handbook of blended learning:
Global perspectives, local designs. San Francisco: Pfeiffer.
Brown, C. A., & Smith, M. S. (1997). Supporting the development of mathematical
pedagogy. Mathematics Teacher, 90(2), 138-143.
Page 29
Blended learning p. 29
Campbell, D. T., Stanley, J. C., & Gage, N. L. (1966). Experimental and quasi-
experimental designs for research. Chicago: R. McNally.
Chall, J. S. (2000). The academic achievement challenge: What really works in the
classroom? New York: Guilford Press.
Cohen, D. K., & Hill, H. C. (2001). Learning policy: When state education reform
works. New Haven: Yale University Press.
Curtis, L., & Swenson, P. (2003). Hybrid courses plus: Blending F2F, online and
handheld computer for effective learning. Society for Information Technology and
Teacher Education International 2003 Conference Proceedings, 520-523.
Darling-Hammond, L., & McLaughlin, M. W. (1996). Polices that support
professional development in an era of reform. In M. W. McLaughlin, & I. Oberman
(Eds.), Teacher learning: New policies, new practices (pp. 202-218). New York:
Teachers College Press.
Darling-Hammond, L., & Youngs, P. (2002). Defining “highly qualified teachers”:
What does “scientifically-base research” actually tell us? Educational Researcher, 31(9),
13-25.
Driscoll, M. (2002, March). Blended learning: Let’s get beyond the hype. e-
Learning, p. 54.
Dziuban, C., Hartman, J., Juge, F., Moskal, P., & Sorg, S. (2006). Blended learning
enters the mainstream. In C. J. Bonk & C. R. Graham (Eds.), The handbook of blended
learning: Global perspectives, local designs (pp. 195-206). San Francisco: Pfeiffer.
Franks, P. (2002). Blended learning: What is it? How does it impact student
retention and performance? World Conference on E-Learning in Corporate, Government,
Health, & Higher Education, 1477-1480.
Garet, M. S., Porter, A. C., Desimone, L., Birman, B. F., & Yoon, K. S. (2001).
“What Makes Professional Development Effective? Results from a National Sample of
Teachers.” American Educational Research Journal, 38(4), 915–945.
Page 30
Blended learning p. 30
Graham, C. R. (2006). Blended learning systems: Definition, current trends, and
future directions. In C. J. Bonk & C. R. Graham (Eds.), The handbook of blended
learning: Global perspectives, local designs (pp. 195-206). San Francisco: Pfeiffer.
Graven, M. (2003). Teacher learning as changing meaning, practice, community,
identity and confidence: The story of Ivan. For the Learning of Mathematics, 23(2), 28 -
36.
Guskey, T. R. (2000). Evaluating professional development. Thousand Oaks, CA:
Corwin Press.
Hiebert, J., Gallimore, R., & Stigler, J. W. (2002). A knowledge base for the
teaching profession: What would it look like and how can we get one? Educational
Researcher, 31(5), 3-15.
Holmes, A., Polhemus, L., & Jennings, S. (2005). CATIE: A blended approach to
situated professional development. Journal of Educational Computing Research, 32(4),
381-394.
Kennedy, M. M., Ball, D. L., & McDiarmid, G. W. (1993). A study package for
examining and tracking changes in teachers' knowledge. East Lansing, MI: Michigan
State University, National Center for Research on Teacher Education.
Lewis, N. J., & Orton, P. Z. (2006). Blending learning for business impact: IBM’s
case for learning success. In C. J. Bonk & C. R. Graham (Eds.), The handbook of blended
learning: Global perspectives, local designs (pp. 61-75). San Francisco: Pfeiffer.
Loucks-Horsley, S., Love, N., Stiles, K. E., Mundry, S., & Hewson, P. W. (2003).
Designing professional development for teachers of science and mathematics. Thousand
Oaks, CA: Corwin Press.
Ma, L. (1999). Knowing and teaching mathematics: Teachers’ understanding of
fundamental mathematics in China and the United States. Hillsdale, NJ: Erlbaum.
Mundry, S. (2005). What experience has taught us about professional development,
facilitating mathematics and science reform: Lessons learned. National Network of
Eisenhower Regional Consortia and Clearinghouse. Retrieved February 22, 2006 from
http://www.sedl.org/pubs/ms90/experience_pd.pdf
Page 31
Blended learning p. 31
Oliver, R., Jerrington, J, & Reeves, T. C. (2006). Creating authentic learning
environments through blended learning approaches. In C. J. Bonk & C. R. Graham
(Eds.), The handbook of blended learning: Global perspectives, local designs (pp. 502-
514). San Francisco: Pfeiffer.
Ontario Ministry of Education. (2004). Teaching and learning mathematics: The
report of the Expert Panel on Mathematics in Grades 4 to 6 in Ontario. Toronto: Author.
Retrieved February 22, 2006 from
http://www.edu.gov.on.ca/eng/document/reports/numeracy/panel/index.html
Organisation for Economic Co-operation and Development. (2005). Attracting,
developing and retaining effective teachers - final report: Teachers matter. Paris: Author.
Revtrieved February 22, 2006 from http://www.oecd.org
Owston, R. D., Garrison, D. R., & Cook, K. (2006). Blended learning at Canadian
universities: Issues and practices. In C. J. Bonk & C. R. Graham (Eds.), The handbook of
blended learning: Global perspectives, local designs (pp. 338-350). San Francisco:
Pfeiffer.
Reynolds, T., & Greiner, C. (2006). Integrating field experiences in online teacher
education: A natural blend? In C. J. Bonk & C. R. Graham (Eds.), The handbook of
blended learning: Global perspectives, local designs (pp. 209-219). San Francisco:
Pfeiffer.
Richards, C. (2003). Distance education, on-campus learning, and e-learning
convergences: An Australian exploration. International Journal on E-Learning, 1(3), 30-
39.
Salmon, G. (2003). E-moderating: The key to teaching and learning online. New
York: RoutledgeFalmer.
TIMSS Study Center (1998). Science teacher questionnaire: Main survey. Chestnut
Hill, MA: Boston College.
U.S. Department of Education. (2005). The Secretary’s fourth annual report on
teacherquality: A highly qualified teacher in every classroom. Washington, DC: Author.
Retrieved February 22, 2006 from
http://www.ed.gov/about/reports/annual/teachprep/2005Title2-Report.pdf
Page 32
Blended learning p. 32
Wenglinsky, H. (2000). How teaching matters: Bringing the classroom back into
discussions of teacher quality. Princeton, NJ:
Page 33
Blended learning p. 33
Table 1 Pre-Post Teacher Preparedness to Teach Curriculum Areas
Survey Means Question
Pre Post
p
Mathematics (N=48)
Prepared to teach simple probabilities—
understanding and calculations.
(Don’t teach=1 to Very well prepared=4)
3.27 3.42 .005
Science/technology (N=33)
Prepared to teach Life Systems.
(Very well prepared=1 to Not at all prepared=5)
1.76 1.45 .010
Prepared to teach Earth and Space Systems.
(Very well prepared=1 to Not at all prepared=5)
1.97 1.67 .010
Prepared to teach Matter and Materials.
(Very well prepared=1 to Not at all prepared=5)
1.97 1.61 .005
Page 34
Blended learning p. 34
Table 2 Pre-Post Teacher Beliefs about Acceptability of Leaving Students Puzzled
Survey Mean Question
Pre Post
p
Mathematics (N=48)
Students should never leave a math session feeling confused or
stuck.
(Strongly agree=1 to Strongly disagree=7)
3.92 4.63 .000
Science/technology (N=33)
Students should never leave a science and technology lesson
feeling confused or stuck.
(Strongly agree=1 to Strongly disagree=5)
2.91 3.61 .000
Page 35
Blended learning p. 35
Table 3 Pre-Post Changes in Mathematics Teacher Practice (N=48)
Question Survey Mean p
Pre Post
18c A student in your class identifies a square as a
rectangle. What would you say or do? I’d ask the
student, “what’s a square, what’s a rectangle, and
try to get students to remember the difference.”
(Definitely do=1 to Definitely not do=4)
1.63 2.02 .012
27f How often do you have students work in small
groups to come up with a joint solution or
approach to a problem or task.
(Never=1 to Almost everyday=5)
3.65 3.85 .011
Page 36
Blended learning p. 36
Table 4 Pre-Post Changes in Science/technology Teacher Practice (N= 33)
Survey Means Question
Pre Post
p
4f Focusing on rules is a good idea. It gives students a useful
structure around which to learn.
(Strongly agree=1 to Strongly disagree=5)
2.44
2.72 .027
11g It is not a good idea for students to work in mixed ability
small groups because the brighter students will do all the
work.
(Strongly agree=1 to Strongly disagree=5)
4.34 3.91 .046
6c How often do you ask students to work on problems for
which there is no immediate and obvious method or
solution
(Never/almost never=1 to Every lesson=4)
2.00 2.36 .003
6d How often do you usually ask students to use computers to
solve exercises or problems?
(Never/almost never=1 to Every lesson=4)
1.48 1.73 .009
7e How often do students work in small groups without
assistance from the teacher?
(Never/almost never=1 to Every lesson=4)
1.97 2.30 .009
8a How often do you spend time on students conducting
experiments of their own design?
(Very often=1 to Almost never=4)
3.00 2.67 .019
8c How often do you spend time on making lecture-style
presentations?
(Very often=1 to Almost never=4)
2.52 2.88 .005
8h How often do you spend time on demonstrations of
experiments?
(Very often=1 to Almost never=4)
2.30 2.61 .016
9h How often are your students engaged in finding one or
more uses of content covered?
1.91 2.36 .007
Page 37
Blended learning p. 37
(Never/almost never=1 to Every lesson=4)
14g Shortage of equipment for use in demonstrations and other
activities limits how I teach science and technology.
(A great deal=1 to Not at all=5)
1.73 1.97 .044
18 Percentage of time teaching with textbook.
(0-25%=1 to 76-100%=4)
2.39 1.94 .002
Page 38
Blended learning p. 38
Table 5 Student Pre-Post Responses about Time Spent on Mathematics (N=427)
Question Survey Mean p
Pre Post
3 Total amount of time in one week usually put into
mathematics.
(No time=1 to More than 5 hrs=5)
3.28 3.13 .009
4g The total amount of time in one day that you usually spend
studying mathematics or doing mathematics homework
after school.
(No time=1 to More than 5 hrs=5)
2.45 2.34 .007
4h The total amount of time in one day that you usually spend
studying or doing homework in school subjects other than
mathematics.
(No time=1 to More than 5 hrs=5)
2.77 2.64 .005
Page 39
Blended learning p. 39
Table 6 Student Pre-Post Responses about the Mathematics Classroom (N=427)
Survey
Mean
Question
Pre Post
p
8a In my mathematics class students often work using a textbook.
(Strong agree=1 to Strongly disagree=4)
1.96 2.06 .007
8b In my mathematics class students often work from exercise
sheets to practice what the teacher has taught.
(Strong agree=1 to Strongly disagree=4)
1.88 1.78 .010
8c In my mathematics class students often work on projects.
(Strong agree=1 to Strongly disagree=4)
2.57 2.78 .000
19b When we begin a new topic in mathematics, we begin by
discussing an example related to everyday life.
(Almost always=1 to Never=4)
2.40 2.24 .003
19f When we begin a new topic in mathematics, we begin by
trying to solve an example related to the new topic.
(Almost always=1 to Never=4)
1.98 1.81 .001
20q How often…do students write on the board.
(Almost always=1 to Never=4)
2.61 2.49 .013
20c How often…do you have a quiz or test.
(Almost always=1 to Never=4)
1.87 1.79 .064
9a In my mathematics class most of the students do their
homework.
(Almost always=1 to Never=4)
1.98 2.07 .008
20k How often…begin homework in class.
(Almost always=1 to Never=4)
1.62 1.53 .042
20j How often…teacher checks homework.
(Almost always=1 to Never=4)
1.66 1.79 .006
20g How often…use computers.
(Almost always=1 to Never=4)
3.40 3.31 .045
16b How often used the World Wide Web to access information 2.94 3.11 .003
Page 40
Blended learning p. 40
for mathematics projects.
(Almost always=1 to Never=4)
20f How often…use calculators.
(Almost always=1 to Never=4)
2.38 2.04 .000
20p How often…teacher uses an overhead projector.
(Almost always=1 to Never=4)
2.53 2.70 .001
Page 41
Blended learning p. 41
Table 7 Student Pre-Post Responses about Value of Mathematics (N=427)
Survey Mean
Questions
(Strongly agree=1 to Strongly disagree=4)
Pre Post
p
9e In my mathematics class, most of the students
think mathematics is important for their lives.
1.76 1.85 .045
11a I think it is important to do well in mathematics
at school
1.34 1.27 .014
17b Mathematics is boring 2.80 2.68 .019
18d I need to do well in mathematics to please myself 1.60 1.68 .038
Page 42
Blended learning p. 42
Table 8 Student Pre-Post Responses about Succeeding Mathematics (N=427)
Survey Mean
Question
(Strongly agree=1 to Strongly disagree=4)
Pre Post
p
13a To do well in mathematics at school you need
lots of natural ability
2.31 2.40 .039
13b To do well in mathematics at school you need
good luck
2.98 3.08 .035
13d To do well in mathematics at school you need to
memorize the textbook or notes
2.32 2.46 .007
Page 43
Blended learning p. 43
Table 9 Pre-Post Student Responses about Science/technology (N=401)
Survey Mean Question
Pre Post
p
7b In my science and technology class, students
often work from exercise sheets to practice what
the teacher taught.
(Strongly agree=1 to Strongly disagree=4)
1.89 2.03 .002
9d Science and technology is my weakest subject.
(Strongly agree=1 to Strongly disagree=4)
3.15 3.29 .009
13c In our science and technology class we work
from worksheets or textbooks on our own.
(Almost always=1 to Never=4)
1.83 1.93 .025
13d In our science and technology class we work on
hands-on activities such as lab experiments.
(Almost always=1 to Never=4)
2.55 2.40 .026
Page 44
Blended learning p. 44
ENDNOTES
1 The Ontario curriculum combines science and technology into one subject which is
referred to in this article as science/technology. Science includes what is traditionally
taught in science at this level; technology deals with the application of knowledge to meet
an identified need or solve a specific problem using materials, energy, and tools.
Science/technology is described in the curriculum as not only a body of knowledge but “a
way of knowing.” 2 Due to space considerations non-significant results are not shown on all
questionnaire data. 3 The three-part lesson advocated by the TeL program is a lesson that had an
introduction to make connections with previously learned concepts, a substantial middle
during which time students engaged in exploratory activity, and a significant closing
were teachers lead a discussion on key learnings from the lesson.