35
blinkx plc H12015 Results London, UK 11 November 2014
| Date post: | 19-May-2018 |
| Category: |
Documents |
| Upload: | trankhuong |
| View: | 214 times |
| Download: | 1 times |

blinkx plc
H12015 Results
London, UK 11 November 2014

Safeharbor Statement
2
This announcement or presentation contains (or may contain) certain forward-looking statements with respect to certain of
blinkx's plans and its current goals and expectations relating to its future financial condition and performance and which involve
a number of risks and uncertainties. blinkx cautions readers that no forward-looking statement is a guarantee of future
performance and that actual results could differ materially from those contained in the forward-looking statements. These
forward-looking statements can be identified by the fact that they do not relate only to historical or current facts. Forward-
looking statements sometimes use words such as 'aim', 'anticipate', 'target', 'expect', 'estimate', 'intend', 'plan', 'goal', 'believe', or
other words of similar meaning. Examples of forward-looking statements include, among others, statements regarding blinkx's
future financial position, income growth, impairment charges, business strategy, projected levels of growth in its markets,
projected costs, estimates of capital expenditure, and plans and objectives for future operations of blinkx and other statements
that are not historical fact.
By their nature, forward-looking statements involve risk and uncertainty because they relate to future events and circumstances,
including, but not limited to US and UK domestic and global economic and business conditions, the effects of blogs and media
coverage, the effects of continued volatility in credit markets, market-related risks such as changes in interest rates and
exchange rates, the policies and actions of governmental and regulatory authorities, changes in legislation, the further
development of standards and interpretations under International Financial Reporting Standards ("IFRS") applicable to past,
current and future periods, evolving practices with regard to the interpretation and application of standards under IFRS, the
outcome of pending and future litigation, the success of future acquisitions and other strategic transactions and the impact of
competition - a number of which factors are beyond blinkx's control. As a result, blinkx's actual future results may differ materially
from the plans, goals, and expectations set forth in blinkx's forward-looking statements.
Any forward-looking statements made herein by or on behalf of blinkx speak only as of the date they are made. Except as
required by the FCA, AIM or applicable law, blinkx expressly disclaims any obligation or undertaking to release publicly any
updates or revisions to any forward-looking statements contained in this announcement or presentation to reflect any changes in
blinkx expectations with regard thereto or any changes in events, conditions or circumstances on which any such statement is
based. Neither the content of the Company's website (or any other website) nor the content of any website accessible from
hyperlinks on the Company's website (or any other website) is incorporated into, or forms part of, this announcement.

Agenda
Overview
Financials
Sector Trends
Vision and Growth
Appendix
3

H1 2015 Highlights
Source: eMarketer, blinkx Estimates 1. Does not include acquisition and non-recurring expense, purchase intangibles Includes, or share base compensation 2. Adjustments include acquisitions and non-recurring expenses, share based compensation and other income
• Continued robust sector growth, with an accelerating shift to mobile
• Evolving standards continue to impact demand relationships and requirements
• Increasing consolidation, particularly within the supply side of the ecosystem
• Revenue of $106M, Adjusted EBITDA of ~$1M
• 20% contribution from mobile versus 1% in H12014
• Strong, debt free balance sheet with ~$115M in cash
• 299 staff, including Technology(93), Sales (86), Operations (51), Services (21), G&A (39), Marketing (9)
• Realignment and restructuring of resources to focus on fast growing segments of the sector
• Continued Integration of acquisitions to facilitate cross-product, cross-device offerings at scale
• Products: Focus on Audience, Content, Advertiser and Platform offerings
• Technology: Common data, targeting, reporting, advertising and content management platforms
• Marketing: Brand consolidation, leadership in industry consortia and events, integrated sales support
• Disruption of $100B video advertising market as linear and digital TV converge and standards evolve
• Accelerating shift from desktop to mobile and from direct to automated (programmatic) trading
• Race to scale through consolidation across both supply and demand portions of the ecosystem
4
Outlook
Financials
Operations
Initiatives
Sector

Commercial Model
5
Consumer Advertiser
Content

Ad Units
6
Ric
h M
ed
ia
Vid
eo
Pre
roll
Vid
eo
Se
arc
h
Co
mp
ariso
n S
ho
pp
ing
Co
nte
xtu
al
Mo
bile
Vid
eo
Mo
bile
Ba
nn
er
Mo
bile
Ric
h M
ed
ia
Na
tiv
e, So
cia
l

Key Financials
7
Notes: 1. H12015 numbers in line one, H12014 Numbers in line two
2. EBITDA adjustments include acquisitions and non-recurring expenses, share based compensation and other income 3. Current employee count includes staff reduction from a calendar year peak of 343
Revenue
$106.0m $111.6m
Adj. EBTIDA
$1.0m $18.2m
Adj. PBT
-$3.4.m $15.1m
Net Cash
$114.5m $69.4m
Employees
299 270
Mobile
20% 1%

H1 2015 KPIs
8
PREMIUM CONVENTIONAL TECH &
SERVICES OPPORTUNITY TOTAL
01010
11001
10110
Notes:
Premium: High Value Motion ads Direct sold Exchange traded Video, rich media, text, ads Conventional: High Volume, Static Ads, Agency representation Desktop, Mobile, Banner Ads Technology & Services: Relate to managing digital assets and advertising services that support current revenue streams Opportunity: Access to interactions blinkx.com, blinkx Syndicates and Affiliates and emerging channels, e.g. mobile, ConnectedTV
Revenue ($)
Revenue (%)
$74.9
71%
$26.4M
25%
$4.7M
4%
$106.0M
100%
eCPM ($) $8.73 $0.50
Interactions (B)
Volume (%)
9
3%
53
20%
199
77.0%
261
100%

KPI Trends
9 Note: Figures above are unaudited
0
50
100
150
200
250
300
350
H1 '12 H2 '12 H1 '13 H2 '13 H1 '14 H2 '14 H1 '15
Opportunity
Premium
Conventional
Volume Trends, (B)
$4.45 $4.78 $4.67 $4.80
$5.65
$7.92
$8.73
$0.67 $0.66 $0.82 $0.85 $0.83 $0.71 $0.50
H1 '12 H2 '12 H1 '13 H2 '13 H1 '14 H2 '14 H1 '15
Premium Conventional
Pricing Trends, ($/eCPM)
16 16 31
45 43 53 61
55
226
254
314 322 305
261
H1 '12 H2 '12 H1 '13 H2 '13 H1 '14 H2 '14 H1 '15
Monetisation
Interaction
Interaction & Monetisation Trends, (B) Interaction & Monetisation Trends, (B)
80% 80% 77% 79% 76% 76% 71%
11% 16% 18% 18% 21% 21% 25%
9% 4% 5% 3% 3% 3% 4%
H1 '12 H2 '12 H1 '13 H2 '13 H1 '14 H2 '14 H1 '15
Premium Conventional Tech & Services
Revenue Contribution, (%)

Sector Trends
10
‣ Offline Spend Continues to Move Online
‣ Growth of Video and Accelerating Shift to Mobile
‣ Rise of Automated (Programmatic) Trading
‣ Emerging and Evolving Standards
‣ Industry Consolidation

Ad Spend Continues to Migrate
11
37
43 40 40
34 33
2012 2013
Digital Broadcast Print
US Digital, Broadcast, Print ($B)
Source: eMarketer, Kleiner, Perkins, Caufield and Byers, IAB
32 32 30
27 25
11
19
28
40
49
2013 2014 2015 2016 2017
Desktop* Mobile**
US Digital Ad Spending, by Channel, 2012 - 2017 ($B)
20
23
26
28
31
10 11
12 13
15
4 6
8 10
11
3 4
5 7
9
2 2 2 2 3
2013 2014 2015 2016 2017
Search Banners and other*Video Rich mediaSponsorships
US Digital Ad Spending, 2013 - 2017 ($B)
5%
12%
38%
25%
20% 19%
10%
45%
22%
4%
Print Radio TV Internet Mobile
Time Spent Ad Spend
Media Consumption v. Ad Spend, 2014
$30B Opportunity

By The Numbers
29,000+ Websites 5,000+ Publishers 1,000+ Brands
74% Reach (US)1 73% Reach (UK)1 72% Reach (Canada)1
3,210 CPU Cores 1.7+ GB/Sec 200K+ Queries/Sec 15K+ Ads Served/Sec
Mobile Impressions2
Mobile Web — 2.1 B 1.2 Billion (Smartphone)
900 Million (Tablet)
In-App – 500 MM 350 Million (Smartphone)
150 Million (Tablet)
Display Impressions2
120 Billion
Video Impressions2
1 Billion
Programmatic Scale, Scope and Reach
12
1. comScore, September 2014
2. Access to Monthly Impressions, not all of which are monetized

Growth Vision
13
Connect audiences and brands through professional content

Cross Screen
14

Conclusions
15
VIDEO MOBILE PROGRAMMATIC DATA
0011010101010
0101110001010
0110101100101
0110100001001
1010010101001
0101110100100
• Sector continues to demonstrate robust growth and change
• Tech-media company with unique strengths and offerings in digital video
• Disciplined financials with profitable, revenue growth and cash management
• Unique, diverse assets in hyper growth segments of the sector
• Expanding universe of organic and inorganic growth opportunities
• Connecting digital audiences, brands through professional content at scale

Appendix
A. Sector Overview
B. Corporate Overview
C.Ecosystem, Business Model
D. Products and Services
16

A1. Mobile Shift and Video Growth
17
Avg. Time (Min/User/Day) Spent 2014 US
346 268 80 Radio
Source: eMarketer, IAB
300
600
900
1200
1500
1800
2100
2007 2008 2009 2010 2011 2012 2013 2014 2015
Mobile Internet Users Desktop Users
Mobile Internet Users vs Desktop Users, (B,WW)
4 6
8 10
11
2013 2014 2015 2016 2017
Online Video Spend ($B) Online Video Spend ($B)
11
19
28
40
2013 2014 2015 2016 2017
Online Video Spend ($B) Mobile Spend ($B)
49

A2. Growth of Programmatic Spend
18 Source: eMarketer , IDC, Magna Global
28% 34% 41% 47% 52%
25% 29%
32% 32%
31%
47% 36%
27% 21% 17%
2013 2014 2015 2016 2017
RTB Non-RTB Non-programmatic
US Display Ad Spending Share, by Type, % of Total
$110
$437
$1,051
$1,929
$2,996
$0.00
$500.00
$1,000.00
$1,500.00
$2,000.00
$2,500.00
$3,000.00
$3,500.00
2013 2014 2015 2016 2017
RTB-based mobile sales
US Real-Time Bidding Based Mobile Sales ($B)
$6.0
$8.3
$12.1
$17.9
$23.2
$0.00
$5.00
$10.00
$15.00
$20.00
$25.00
2013 2014 2015 2016 2017
Programmatic display ad spending
Programmatic Display Ad Spending ($B)
$3.4
$4.9
$6.8
$9.0
$10.7
19% 22% 25% 28% 29%
0.00%
10.00%
20.00%
30.00%
40.00%
50.00%
60.00%
70.00%
80.00%
90.00%
100.00%
$0.00
$2.00
$4.00
$6.00
$8.00
$10.00
$12.00
2013 2014 2015 2016 2017
RTB digital display ad spending
US Real-Time Bidding (RTB) Digital Display Ad Spending($B)

A3. Measurement and Consolidation
19
“Facebook To Improve Video Ads
Through LiveRail Acquisition” - Forbes
“European TV Giant RTL to Acquire
Majority Stake in Video Ad Firm
SpotXchange” – Hollywood Reporter
“Publicis to buy 20 percent of
digital advertising group Matomy”
- Reuters
“AOL Acquires Attribution
Company Convertro For $101M” – Ad Exchanger
“Viewability Standards Raise More
Questions Than They Answer” - MediaPost
“Video ad industry is in a state of
content chaos, says Yahoo CMO” – Marketing Week
“Digital Video Faces Viewability &
Measurement Hurdles” – Beet.tv
“Online Native Ads Are Held To
Higher Standards Than Those On
TV” – Tech Crunch

A4. Ecosystem Evolution
20
Definitions: NWK – Ad Network, DESK. – Trading Desk, EXCH - Exchange
CONTENT
TECHNOLOGY
CORE MKT. PLACE INFRA.
AUDIENCE
Own Represent Aggregate
ADVERTISER
Brands Agencies Platforms
NWK SSP DSP DESK SSP EXCH
Distribution
R&D
Platform
Common
Creation
TEXT VIDEO APPS
Monetization

B1. Corporate Snapshot
21
1. Adjusted for acquisitions and non-recurring expenses, share based compensation, other income
History Founded 2004
IPO 2007
Headquarters London, UK
San Francisco, CA
Locations 15 Offices
US, UK and Canada
Employees 299 Total : 299 staff, including Technology(93), Sales (86), Operations (51), Services
(21), G&A (39), Marketing (9), 15 Contractors
Technology Desktop and Mobile Video, Search, Discovery, Content Management,
Syndication, Application Distribution and Advertising Platform
Financials
(Mar 31, 2014)
$247.2M – Revenue (+36.1% YOY)
$39.6M – Adjusted EBITDA1 (+83.8% YOY)
$126.9M – Net Cash
Partnerships 70+ Agencies
1,400+ Content Partners
1,000+ Brands
5,000+ Publishers

B2. History
22
premium mobile video
Apr 2009 May 2011 Nov 2011 Aug 2013 Dec 2013 May 2014
Structure Asset Purchase 1 Stock Purchase Stock Purchase Asset Purchase 2 Stock Purchase Stock Purchase
Products
App development,
licensing,
distribution and
monetization
platform
Display and rich
media advertising
network for long-tail
independent web
publishers
Self-service, auction
based performance
ad network (AdOn),
digital agency
(Prime Visibility)
Video content
syndication,
distribution and
audience extension
platform
Ultra premium,
brand focused
mobile video
technology and ad
platform
Mobile self-service
Demand Side
Platform (DSP) for
targeted
campaigns across
mobile ad units
Rationale
Expand supply of
organic, owned
and operated
audiences and
apps
Expand supply of
audiences from long
tail publishers for
new video
audience
Expand scale,
scope and reach of
audiences, new
products and
services
Accelerate video
content syndication
monetization
audience extension
Extend desktop
offerings into mobile
content,
technology,
advertising at scale
Accelerate
programmatic and
mobile offerings
including DSP and
Data Management
Platform (DMP)
1. Purchase of certain net assets from the Zango Companies from a consortium of financial institutions in a foreclosure sale 2. Purchase of certain net assets from Grab Networks Holdings Inc.

B3. Text v. Video Search
23
Text search engines miss the VIDEO in Video Search
blinkx actually WATCHES the video
Tesla Motors, Headquarter, Silicon
Valley, Electric
October, 2013
Tags: Tesla, Electric, Silicon Valley
http://www.aol.com/video/translogic-3-tesla-motors-part-2/517141686/
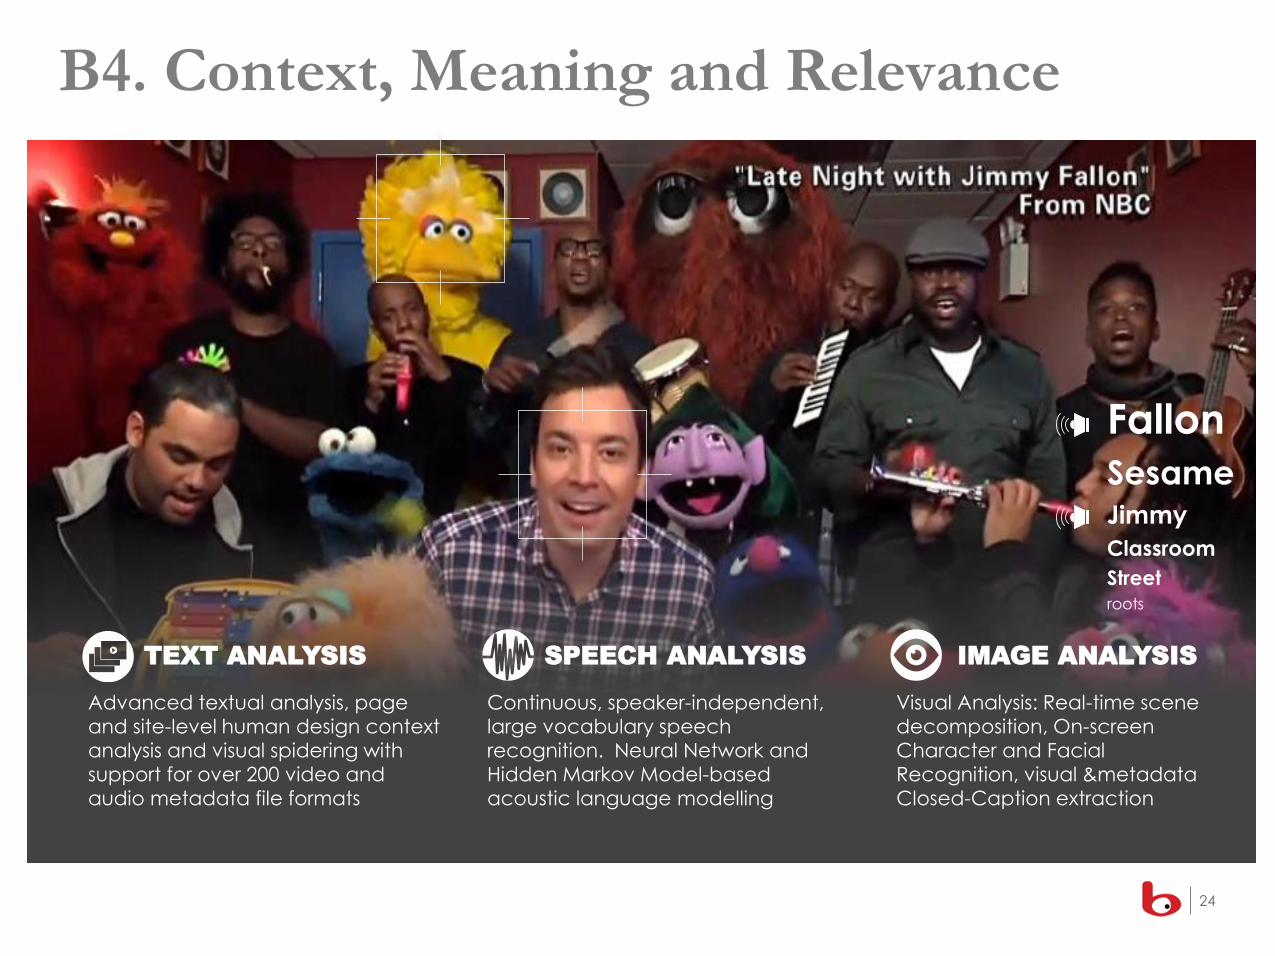
TEXT ANALYSIS
Advanced textual analysis, page
and site-level human design context
analysis and visual spidering with
support for over 200 video and
audio metadata file formats
Continuous, speaker-independent,
large vocabulary speech
recognition. Neural Network and
Hidden Markov Model-based
acoustic language modelling
Visual Analysis: Real-time scene
decomposition, On-screen
Character and Facial
Recognition, visual &metadata
Closed-Caption extraction
IMAGE ANALYSIS SPEECH ANALYSIS
Fallon
Sesame Jimmy
Classroom
Street
roots
B4. Context, Meaning and Relevance
24

B5. Competitive Map
PREMIUM CONTENT
1,400+ content partnerships ensure
ads always appear within brand-
safe, professional video content
PREMIUM ADVERTS
Serving 1,000+ brands, our patent-
pending advertising technology,
AdHoc, delivers unique targeting
for higher ROI on ad spend
AT SCALE
blinkx powers some of the largest
portals on the web. Acquisitions
increased the size of blinkx‘s overall
reach significantly to 5,000+
publishers
25

C1. Ecosystem
26
Consumer Advertiser
Website
Content

C2.Value Flow
27
Consumer Advertiser
Website
Content
$$$
$ Content
Att
en
tio
n
Co
nte
nt
Au
die
nc
e

C3. Fragmentation
28
Advertisers
Website
$$$
$ Content
Att
en
tio
n
Co
nte
nt
Au
die
nc
e
Consumers
Content Apps

C4. blinkx Engine
29
Web Publishers Agencies
AD
AD
AD
blinkx automatically matches digital audiences and brands through professionally generated content millions of times a day every day in real time.
Consumers Advertisers
Content Apps

Desktop
C5. Revenue Equation
30
Owned Controlled
Acquired
Agencies
Consumers Advertisers
Supply Demand
Mobile
Conn. TV
Dir. Sales
Exchanges
Platforms
Integrated Advertising Campaigns
Content Apps

C6. blinkx Ecosystem
31
Content
Aggregators Agencies/Platforms Audiences Advertisers
Search Discovery Syndication
Content Ads Audiences
Video Text Social Display Mobile
Applications

C7. Business Model
32
Audience
Content
Advertisers
Licensed Indexed
Platform
Traded
Search
blinkx
Syndicates
Display
Connected TV
Mobile
Monetisation
Conventional
Premium
I
Direct
Sold
II
Opportunity

D1. Integrated Advertising Model
33
Marketing Objective, Volume & Format
Conversion Metric, Price
Awareness
(Video, Display)
Interest
(Social)
Consideration
(Email)
Conversion
(Search)
Visits
$0.01/Visit
Audiences
$0.05/Profile
Signups
$0.25/Lead
Purchase
$1.00/Click
Ad Unit
Illustrative
Source: blinkx

D2. Adaptive-Screen
34

D3. Multi-Screen
35


