BLM Public Outreach – Session Report May-June 2015 Page 1 Report on Public Outreach Sessions For the BUREAU OF LAND MANAGEMENT RESOURCE MANAGEMENT PLANS FOR WESTERN OREGON August 2015 Prepared by DS Consulting, through Oregon Consensus
Transcript
BLM Public Outreach – Session Report May-June 2015
Page 1
Report on Public Outreach Sessions
For the BUREAU OF LAND MANAGEMENT
RESOURCE MANAGEMENT PLANS FOR WESTERN OREGON
August 2015
Prepared by DS Consulting, through Oregon Consensus
BLM Public Outreach Sessions May-June 2015 Page 2
Table of Contents Executive Summary .............................................................................................................................................. 3
Appendices: ‘Unofficial’ Comments & Questions from Public*
Appendix A: Forest Management and Wildlife Workshops ............................................................... 8
Appendix E: Elected Officials & Public Session ………………………………………………………….…28
Appendix F: List of BLM Outreach Events Facilitated by Oregon Consensus …………………32
*Unofficial public comments and questions were recorded on flipcharts in small group
discussions at some of the Issue Specific Workshops. Additionally, during the plenary
sessions, public questions and responses from the workshop presenters were recorded by
the Facilitation Team. Flipchart notes and plenary questions and answers are provided in
the Appendices. Official public comments, which were also provided during these
sessions, are not provided in this report. Instead they will be included in BLM’s report.
Due to format changes made in response to participant preferences, no comments were
recorded for the Eugene Recreation Workshop, Salem Socio-Economic Workshop, or
Elected Officials’ Session in Salem. Unofficial comments also were not recorded at the
Open Houses.
BLM Public Outreach Sessions May-June 2015 Page 3
BLM Public Outreach Sessions
Draft Resource Management Plan for Western Oregon May-June 2015
Executive Summary
The U.S. Bureau of Land Management (BLM), with the assistance of Oregon Consensus, have worked together over the past two and a half years to convene a series of public outreach sessions as part of the BLM’s planning process to revise its Resource Management Plans (RMP) for Western Oregon (See Appendix F). The BLM is revising the resource management
plans for its Coos Bay, Eugene, Medford, Roseburg, and Salem Districts and the Lakeview
District’s Klamath Falls Field Office. The planning area for this RMP revision encompasses
western Oregon and includes approximately 2.5 million acres of public land managed by the
BLM. In May and June 2015, following the April 24th release of the BLM’s Draft Environmental Impact Statement and RMP for Western Oregon, the BLM again, consulted with the Oregon Consensus facilitators to provide neutral, third-party facilitation of a series of open houses and work sessions to educate and engage the public during the formal Public Comment period. A total of 525 public participants attended the spring 2015 outreach sessions conducted in Coos Bay, Eugene, Grants Pass, Klamath Falls, Medford, Portland, Roseburg, and Salem. Each session was facilitated by a team of neutral, third-party, professional
facilitator/mediators provided by Oregon Consensus. Facilitators were available to help capture informal input from the public, manage conflicts, and encourage members of the public to write formal comments. This summary report is written by that team of facilitators and describes the goals, design, implementation, and results of this effort.
Goals The goals of the spring 2015 public outreach sessions were twofold:
1. To educate the public about the BLM’s draft plan and planning process in order to support quality comments being sent to the BLM during the formal Public Comment period; and
2. To engage the public in informal dialogue in order to provide an opportunity for sharing information and building both the BLM’s and the public’s knowledge base.
Process Design & Implementation Plan Two separate types of meetings were designed to meet these goals: open houses, which were informal settings that gave a broad range of information about crucial subjects in the plan, and issue-specific workshops, which focused more intently on a particular subject that the BLM had learned was important to the public in prior public outreach sessions. Open Houses: The Open Houses were designed to allow members of the public a self-guided viewing of information ‘topic stations’ which were set up around the room. Information was provided at each station via large ‘storyboards’, maps that related to the topic, videos of speakers addressing issues pertinent to the topic, and staff who were able to answer questions about the topic. Fact sheets and issue papers were also available as handouts at each station. Topic stations included: the Range of Alternatives; Forest Management; Wildlife; Riparian/Stream; Socio-Economic; and Recreation.
BLM Public Outreach Sessions May-June 2015 Page 4
In addition, two separate areas were set aside that included: an “Interactive Mapping Station” that allowed participants to get very specific with sites they cared about by using computers to look at the BLM’s GIS online mapping tool; and a separate ‘Comments’ table where public members could sit, talk to each other, and then write and submit official public comments. As part of the design, BLM staff members were available at each station to help answer questions and provide basic information about the Draft RMP/EIS. Facilitators were also available to help members of the public find the information they cared about, facilitate discussions between the BLM staff and public members, manage conflicts if/when they arose, and encourage attendance at the Issue Specific Work Shops. Originally, six open houses were scheduled, one in each of the districts. However, after numerous requests from the public, the BLM held an additional open house in Portland. The following Open Houses were held:
May 19 - Roseburg May 20 – Eugene May 21 – Salem May 26 – Klamath Falls
May 27 – Medford May 28 – Coos Bay June 15 – Portland
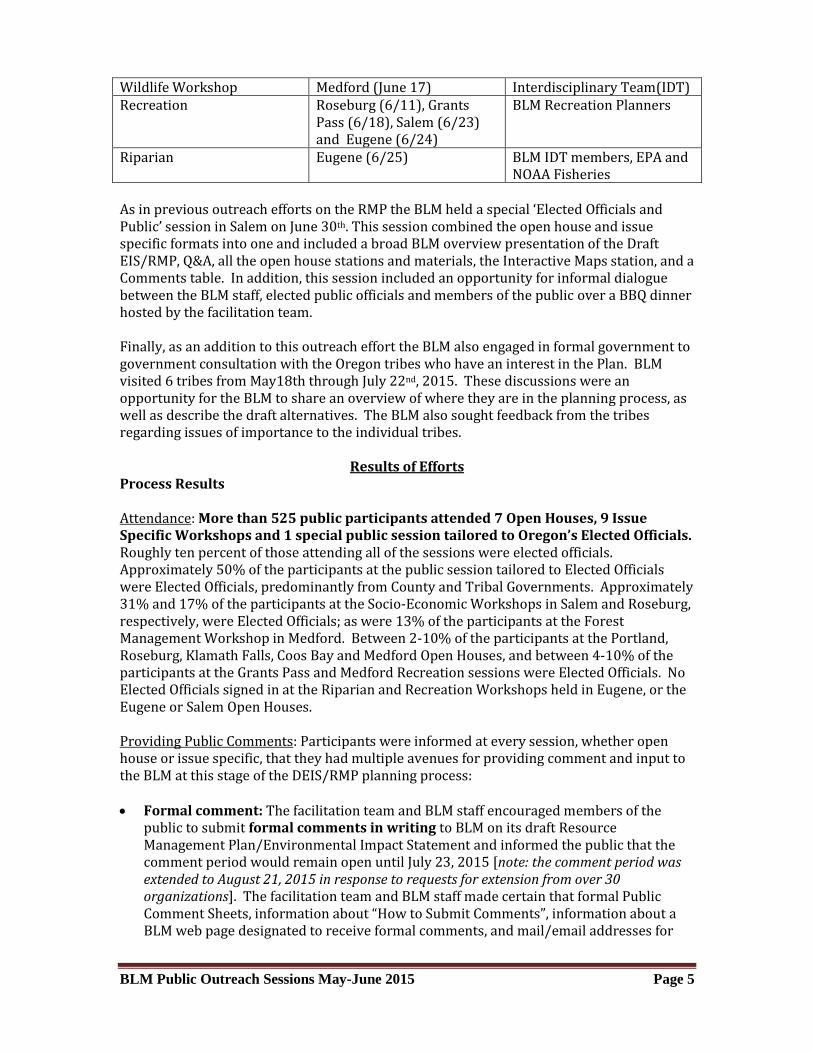
Issue Specific Work Shops: Different from the open houses, the issue specific workshops were designed to be educational and engaging on a particular topic which had seen interest from the public in past public outreach efforts. The Forest Management and Wildlife, Riparian, and Socio-Economic workshops began with a moderated presentation in a plenary setting given by members of the team who did analysis on the topic. The presentations, lasting 45-60 minutes and aimed to give enough overview information about the issue so as to be helpful to the public seeking to draft comments, were followed by clarifying questions and answers in the plenary setting. Partner agency specialists from Oregon Department of Forestry, US EPA, NOAA Fisheries, USFWS and USFS were also on hand to add technical expertise and knowledge. After a break, participants were invited to go to smaller group settings for informal, facilitated dialogue and more in-depth questions and answers with the presenters about a particular aspect relating to the issue. When appropriate, the facilitators took informal notes on large wall charts (see appendices below). The Recreation workshops were designed to meet the same objective of the Issue Specific workshops (in-depth educational information on a particular topic with time for engaged discussion), yet be more similar to the informal Open Houses to enable hands-on interaction with maps and staff who knew the recreation areas. Each ‘Area Station’ included maps of local Recreation Management Areas (RMAs) for the public to review and on which they could write informal feedback. In addition, there also was the online “Interactive Maps Station” where participants could look more closely at specific RMAs and drop an official comment directly on the online map. The following Issue Specific Workshops were convened in the areas noted: Topic Where (When) Who Presented
Socio-Economic Workshop Salem (6/9) and Roseburg (6/10)
Riparian Eugene (6/25) BLM IDT members, EPA and NOAA Fisheries
As in previous outreach efforts on the RMP the BLM held a special ‘Elected Officials and Public’ session in Salem on June 30th. This session combined the open house and issue specific formats into one and included a broad BLM overview presentation of the Draft EIS/RMP, Q&A, all the open house stations and materials, the Interactive Maps station, and a Comments table. In addition, this session included an opportunity for informal dialogue between the BLM staff, elected public officials and members of the public over a BBQ dinner hosted by the facilitation team. Finally, as an addition to this outreach effort the BLM also engaged in formal government to government consultation with the Oregon tribes who have an interest in the Plan. BLM visited 6 tribes from May18th through July 22nd, 2015. These discussions were an opportunity for the BLM to share an overview of where they are in the planning process, as well as describe the draft alternatives. The BLM also sought feedback from the tribes regarding issues of importance to the individual tribes.
Results of Efforts Process Results Attendance: More than 525 public participants attended 7 Open Houses, 9 Issue Specific Workshops and 1 special public session tailored to Oregon’s Elected Officials. Roughly ten percent of those attending all of the sessions were elected officials. Approximately 50% of the participants at the public session tailored to Elected Officials were Elected Officials, predominantly from County and Tribal Governments. Approximately 31% and 17% of the participants at the Socio-Economic Workshops in Salem and Roseburg, respectively, were Elected Officials; as were 13% of the participants at the Forest Management Workshop in Medford. Between 2-10% of the participants at the Portland, Roseburg, Klamath Falls, Coos Bay and Medford Open Houses, and between 4-10% of the participants at the Grants Pass and Medford Recreation sessions were Elected Officials. No Elected Officials signed in at the Riparian and Recreation Workshops held in Eugene, or the Eugene or Salem Open Houses. Providing Public Comments: Participants were informed at every session, whether open house or issue specific, that they had multiple avenues for providing comment and input to the BLM at this stage of the DEIS/RMP planning process: Formal comment: The facilitation team and BLM staff encouraged members of the
public to submit formal comments in writing to BLM on its draft Resource Management Plan/Environmental Impact Statement and informed the public that the comment period would remain open until July 23, 2015 [note: the comment period was extended to August 21, 2015 in response to requests for extension from over 30 organizations]. The facilitation team and BLM staff made certain that formal Public Comment Sheets, information about “How to Submit Comments”, information about a BLM web page designated to receive formal comments, and mail/email addresses for
BLM Public Outreach Sessions May-June 2015 Page 6
submitting formal comments were made available to everyone at the Open Houses, Issue Specific Workshops and Elected Officials’ Session.
Informal discussion and input: As noted above, the public outreach sessions were designed to allow BLM to ‘check in’ with the public, inform them about the planning process and results of the Effects Analysis of the range of alternatives, and to receive both formal and informal feedback from stakeholders about their resource interests. The sessions were intentionally designed to provide opportunity for dialogue between the BLM staff and members of the public. There also was time for informal dialogue among community members. The appendices to this Executive Summary provide more detail of some of the questions and ideas heard from public participants.
Interactive Maps as a Source of Comments: One added tool to this process was the
Interactive Map station which utilized the BLM’s GIS mapping of the planning area and overlaid the possible alternatives and actions so that members of the public could “see” the potential impacts of the plan on areas they cared about. As more people became familiar with this tool, more people were both excited to use it and pass the tool along to friends. During the April-July comment period, 1,897 “unique users” logged onto the Interactive Maps, many of them using this format to log their formal comments.
Public Evaluation of Outreach Format: Participants were also asked to provide input about the usefulness of the outreach sessions themselves. In a review of post-session evaluation sheets, all Open House locations reported that the information provided by BLM staff was more than useful to help provide comments, as was the opportunity to ask BLM staff questions. On average 74% of those who responded said the information provided via videos, handouts, storyboards/maps, and the interactive mapping program was more than useful. Evaluations received from the Issue Specific Workshops revealed similar trends, 100% of those who responded said that the information provided via videos, handouts, storyboards/maps, and the interactive mapping program was more than useful. Additionally, the majority of respondents noted that they felt that they had enough opportunity to ask questions, express their views, learn from others, engage in useful dialogue, and have their input acknowledged. Results of Efforts The following list captures common themes that the facilitation team heard consistently across many or all of the locations. Note that this is not an exhaustive list of what was heard; instead, a more detailed list of un-official comments provided and captured during the sessions is available in the Appendices:
Support community stability with increased funds, especially in areas hit hardest by the lack of O&C funds.
o Increased funds could come from timber harvest OR other sources. Get creative with jobs: more available and a broader range of opportunities. Balance land management and harvest with protecting habitats that support
endangered species, game species, clean water and fish. Recreation, of all sorts, matters.
o Equestrian, mountain bikes, hunting, off-road-vehicles, hiking and others.
BLM Public Outreach Sessions May-June 2015 Page 7
o Provide more continuity of Recreation Management Areas (RMAs) between BLM parcels in the checkerboard landscape.
Some people care about specific places, while others want BLM to protect entire wilderness areas.
Neighboring landowners, both trial and individual landowners, want a say in how the BLM manages adjacent lands because of the potential impacts to their own land.
Fire is a concern for everyone –this year and into the future. Be clearer about the Oregon and California Lands Act and its historical and legal
precedent.
Conclusion BLM’s 2015 Spring Public Outreach effort was designed to provide opportunities to build awareness and share information about the Draft RMP/EIS and potential effects of the draft alternatives. The design sought to facilitate effective public input so that the BLM is better able to draft a mutually acceptable Proposed RMP/EIS (PRMP). Part of what the BLM wanted to understand through these sessions was what the public would want to see in the final RMP and why. As such, these sessions were structured largely on providing initial information that could be discussed in small group and one-on-one conversations between the BLM and members of the public. The discussions were aimed at surfacing questions and identifying what and where more detailed information could be found in the Draft EIS/RMP so that an engaged public could articulate useful comments to help the BLM move from a draft to a final Plan. The Open House and Issue Specific Workshops created opportunities for valuable dialogue between the BLM and public. Many participants noted that talking to the BLM staff was the most valuable part of the session (see Report on Public Outreach Sessions Evaluation). These sessions also offered opportunity for the BLM staff to learn and share information with the BLM and the outside experts who have been working to develop the plan and conduct the analysis. In the end, the outreach sessions surfaced many questions, and highlighted areas on which the BLM will need to focus as it proceeds with developing its Proposed Resource Management Plan for Western Oregon. All of the un-official comments included in this report, as well as the official comments submitted, will be utilized by the BLM’s Inter Disciplinary Team (IDT) as it proceeds with analysis for the development of the Proposed RMP. This report will be shared with the BLM Oregon and Washington State Director, BLM’s Westside Steering Committee, and posted on the DS Consulting and BLM RMP website for review by the public. This report is respectfully submitted to the BLM by the Oregon Consensus facilitation firm of DS Consulting.
BLM Public Outreach Sessions May-June 2015 Page 8
Appendix A: Forest Management and Wildlife Workshops SALEM - June 16, 2015 Plenary Questions and Answers
Q: Would the BLM consider an additional alternative outside of those already proposed?
o A: Yes, however, any new alternative would have to also meet the Purpose and Need.
Q: Regarding the Allowable Sale Quantity (ASQ), how much of the harvest will be fiber versus lumber?
o A: Not sure, however, the differences between alternatives do not vary much in percentage. The analysis focused on saw-logs, and part of the analysis looked at the size of logs.
Q: What is the non-ASQ wood used for? Restoration, large woody debris, mill wood? o A: These details will be included in the ‘Management Direction’ in the
Proposed RMP. There are various uses for non-ASQ wood, for instance, Alternative A calls for only non-commercial thinning, except in the dry forests, thus much of that will be used for restoration. Non-ASQ can produce logs for streams, fuel reduction, etc.
Q: Is there a standard for canopy retention when thinning younger stands? o A: It would depend on the justification for thinning younger stands – some
thinning is intended to create habitat or improving quality of habitat. Refer to appendix B re: canopy retention for more information.
Q: The Barred Owl population is growing, what encounter rates did you use for Northern Spotted Owl and Barred Owls?
o A: We used actual observed Barred Owl encounter rates from the 2011 meta-analysis. We use the actual data because we are required to use what is reasonably foreseeable.
Q: Do you have a determination of significance between the analysis for the alternatives, specifically in regards to Recovery Action 10 and 32?
o A: The BLM analysis says that all alternatives would effectively implement the recovery actions; however, there are incremental differences of relative success.
Q: In the dispersal analysis did you analyze prey populations? o A: No, the dispersal analysis was based on forest structure. There is no
scientific basis for prey based owl dispersal. Q: What factors led to the in-migration to the Barred Owl?
o A: This is a current topic with a lot of scientific debate, more information is needed.
Q: Did you consider the increased impact of wildfires as a result of 100 years of accumulating biomass in these forests?
o A: Yes, in the Suitability Analysis. See Appendix D of the Draft RMP/EIS. Q: What assumption did you make about non-BLM lands? Did you assume they
were managed as private or other federal lands? o A: We broke out the non-BLM lands into sections. We modeled habitat
change using data from 1996-2012 and projected out into the future for each strata.
Q: The BLM utilized Jack Ward Thomas findings stating that 25 pairs of Northern Spotted Owls are self-sustaining. Why is it important to analyze for dispersal if you are assuming that the Large Block Reserves will be self-sustaining with 25 pairs?
BLM Public Outreach Sessions May-June 2015 Page 9
o A: The Jack Ward Thomas findings and criteria have been reiterated through the years and this criterion has remained valid. There is a need for continual genetic interchange in order to maintain these owl populations, there will be population decline if there is not dispersal and genetic mixing.
Q: The Purpose and Need states that older and more structurally complex forests are important. Can your analysis link various conditions of stands to quality of habitat for specific species? And can these stands then be ranked depending on the actual value to the species?
o A: For this analysis we mapped Relative Habitat Suitability. It’s not all biologically equal, we can look and see spatially what stands are very important, and which do not contribute as much. However, in order to stay within Recovery Action 32, we need to protect older and structurally complex stands.
Q: What is the viability of maintaining biological diversity through trapping and transporting?
o A: Trapping and transporting is not currently happening and so we did not analyze for it.
Q: Can you explain how you can have a historic condition with no seral habitat? o A: The literature that we used did not specifically break out the early seral
habitat; it does not, however, mean that it was not there. Q: How will Special Status Species be managed?
o A: They are managed under the BLM’s Special Status Species policy, which was not included in this part of the analysis.
Q: Under Alternatives A and C, Survey and Manage is not required for the North Coast DPS. If listed will Survey and Manage be required for those species?
o A: Not necessarily, listed status does not equate to requirement to survey and manage.
Q: How is high quality, early seral habitat defined? o A: Early successional with or without structure (live and dead trees).
Q: What kind of data was used to determine the 5% early seral habitat as historic conditions?
o A: Literature used is cited in the Draft RMP/EIS. (pg. 686)
Small Group Flip Chart ‘Unofficial’ Comments and Questions Timber Management Strategies
Why not do some salvage after a burn in order to reduce impact of future burns? What can you do after a large stand scale burn to promote/restore complexity and
structure? Is new carbon storage modelling incorporated in this analysis (2014 data?) Did analysis conclude that natural regeneration and early seral habitats do not have
an impact on future harvest?
MEDFORD - June 17, 2015 Plenary Questions and Answers
Q: You said that all alternatives will produce more timber than the ‘No Action’ alternative, but if actually implementing the ‘No Action’ alternative, it would produce more than all of the alternatives, except Alternative C.
o A: We are not able to achieve NW Forest Plan expectations, due to other legal requirements. What would have been produced equals about 277
BLM Public Outreach Sessions May-June 2015 Page 10
million billion feet/year, however, those yields are dependent on harvest inside occupied Northern Spotted Owl sites.
Q: Are drought conditions going to be considered in harvest? o A: This part of the analysis is from 2012, so the current drought conditions
will not be included; we do address drought in the ‘climate change/carbon storage’ section, which elaborates on the analysis.
Q: What changed in the science since the NW Forest Plan that backs up your forest management recommendations to reduce riparian reserves and clear cut?
o A: Since 1995, every year new research has come out that is relevant to management of these lands. We brought all that information forward; see the Draft RMP/EIS appendices, they are rich with citations of information that we did not have in 1995.
Q: Why did you define ‘older’ age trees at 80 years? o A: Sub-Alternative C defines ‘older’ trees as 80 year old trees; Alternative C
defines these trees as 160 years. The age definition varies across alternatives. Ages were chosen to promote recovery of endangered species; through this analysis, we hope to determine the best age. Structural complexity is our objective and we see that complexity starting around age 80 and up.
Q: Regarding fire, are you including active post-fire management considerations, i.e. commercial timber salvage?
o A: Yes, we are looking at management responses to fire and fuels. However, only Alternative C requires commercial timber sales for fire management.
Q: What percentage of the lands are O&C Lands? o A: The vast majority of the lands in the planning area are O&C Lands.
Q: This plan takes away discretion of the District Managers with regards to clear cutting and directs Districts to do certain clear cutting or high intensity management.
o A: That is a good observation to provide as a comment for the BLM. Please make sure to also include what you like or don’t like about that option, and why.
Q: Can you speak to sampling/sampling error from your Northern Spotted Owl analysis?
o A: HEXsim [model used] is not intended to produce accurate forecasts, rather it is intended to compare trends and population changes across the alternatives. That said, simulations show similar results to what biologists are seeing in the field.
Q: How do you distinguish mature, multiple canopy structurally complex forest from those forests loaded with ladder fuel?
o A: If the forest is darker and more dense, it is likely choking out the ladder fuels, although land could have both. The base information is from field observations and vegetation modeling and data are coalesced into the Woodstock-modelled outputs.
Q: Different alternatives define ‘structurally complex’ differently; why not use one definition?
o A: There are two cut offs: Stand age (not ideal predictor for owl nesting habitat) but still, 80 years or older is best. Second – “protect structurally complex forest” has no definition yet, so we are comparing consequences to timber based and owl conservation across these definitions.
BLM Public Outreach Sessions May-June 2015 Page 11
Q: You mentioned that the decision to begin control of Barred Owls has not yet been made; I thought the Barred Owl control program was to begin this Fall in the southern part of the range?
o A: The USFWS is currently conducting a research project to test the viability of a Barred Owl removal program. The program has not yet been established.
Q: How do you make calculations based on removal of Barred Owls if the decision has not yet been made?
o A: The meta-analysis has a Barred Owl encounter rate and effect on Northern Spotted Owls (utilizing actual observed encounter rates and effect.) We asked USFWS for advice on what they think the effect would be with a Barred Owl removal program, and ran that.
Q: What kind of structure in the forest maximizes deer, elk, cougar and bear populations?
o A: Based on the literature, deer and elk like early successional, high quality forage; I am not sure what cougar and bear like.
Q: Murrelet populations have not gotten better; are there any indicators for murrelets? How can you predict the murrelet population getting worse and then better if they have never demonstrated that capability?
o A: The latest reports show murrelets as stable. Forecast and modeling tools say we can increase acreages of good habitat over time, leading to improvements in the species. And we have actually seen that trend with murellet populations.
Q: Did you analyze compounding effects of harvest and fire? o A: In the vegetation modeling, wildfire was a component throughout the
modeling. Additional details regarding the fire model can be found in Appendix D of the Draft RMP/EIS.
Q: Did you look at the potential Endangered Species Act listing for fisher? And how that listing might affect the action alternatives?
o A: Not sure at this point. The habitat modeling aspect did not change; however, it would certainly influence policy decision-making.
Q: Did you analyze the effects of fuels thinning and prescribed fire, specifically the impacts on species?
o A: The objectives were common to all alternatives, so the assumption is that there would be no change for hazardous fuels across alternatives. We did run assumptions about levels of prescribed fires in conjunction with harvest; analyzed across many disciplines. Acres burned by wildfire are incorporated in habitat modeling. Assume prescribed burning would be low intensity so no impact on habitat.
Q: Did you analyze small game species? o A: Yes, some. Look in Appendix R for more detail.
Q: In Alternative C, any forest land burned by wildfire would be mandated to be harvested, is that correct? If true, matches hold the key to management, not the BLM; someone might light fires to accomplish this.
o A: Timber salvage is not mandated anywhere; late successional reserve management has some removal for commercial purposes in Alternative C, unlike all others.
Small Group Flip Chart ‘Unofficial’ Comments and Questions Timber Management Strategies
BLM Public Outreach Sessions May-June 2015 Page 12
What is the definition of sustained yield? o What variables go into the equation? o There are different definitions of sustained yield (timber production,
conservation, etc.) o Pg. 6 of the Draft Resource Management Plan (Draft RMP) gives a definition
of sustained yield – is it accurate? Oregon & California Lands Act (O&C Act) has many objectives, not only timber
objectives Moist forest versus dry forest – how are these defined?
o How often do moist forests burn? o Does the BLM offer biomass from excess fuel?
In Southern Oregon many areas in the Harvest Land Base (HLB) are inaccessible – how are the logging costs for these inaccessible areas calculated?
Are logging system costs/uses calculated? Will clear cuts be planted or regenerated naturally?
o Is the BLM planting monocultures? Biomass left in place is more valuable to the forest Prescribed fire is preferred What was the re-entry cycle for uneven aged management
“Other” Wildlife Conservation Strategies Can the BLM consider a Spotted Owl Hatchery Program? Is the effect of the alternatives on game species balanced with effects of the
alternatives on endangered species? Consider the impact of alternatives on hunting and fishing – there seems to be
declining BLM interest in these areas Buying out cattle permits adversely affects meadow management Cattle grazing affects elk grazing
Northern Spotted Owl (NSO) Management Strategies How do you know active management will be better than natural systems? What science is the BLM using? What about contradictory science? Is it too late to request to analyze the Deer Creek Association’s “natural selection”
alternative? How is it that in southern reaches of the state, owl populations will be stable and
even increase in 50 years, even without the Barred Owl? Habitat is causing the decline in NSO, not the Barred Owl Are prior land disturbances factored into the analysis?
The presentation seems misleading in regard to the influence of the Barred Owl . Could there be an alternative that considers other surrogate species to analyze
ecological functions? Does the reserve system change by decade? What method is the BLM using to sample?
o Concern for overlap and double counting sites; are birds being banded? o Also concern for computer simulated owls
What is the sampling error in the analysis? When did the Barred Owl first become an issue in Oregon? Are we in jeopardy of losing habitat in the very southern portion – Illinois Valley? Can the BLM affect the Coos Bay area bridge with so much private timber land?
BLM Public Outreach Sessions May-June 2015 Page 13
Fire and Fuels More prescription fires to limit wildfire Is the BLM consistently analyzing the economic effect of fires? How? How does the plan measure the severity of fires? What science was used for fire/fuels analysis? Was opposing research considered in the fire/fuel analysis? What are Late Successional Reserves (LSR) likely to contribute? Has the BLM defined management objectives for LSR? OR Department of Forestry is
curious: how do we use OR not use fire? Can alternatives determine rate of spread of fire from public to private land? Does the plan include or analyze fire mitigation by prevention, instead of mass
mobilization of fire extinguishing efforts?
Early Seral-Stage Forest Vegetation Only Alternative C produces early seral habitat?
o Look at Swanson (2011); O’Neill (2001) BLM at bottom of range (5-20%)
o <5% imperils large # of wildlife; now <2% What species do well in mature forests? Are there any species that favor mature
forests to structurally complex forests? Retaining complexity rather than just replanting is important A large percentage of the Land Base is in reserves
o Is this in response to sensitive species? Did Washington D.C. double the riparian buffers from recommended? Is there a mandate for BLM to maintain, or sustain, historic species variability on its
land? o Or is this USFS? o Are there obligations to early seral?
Is there opportunity to promote early seral by postponing or modifying recovery? Is there anything in the Endangered Species Act to prevent extinction or species “on
the brink”? How do you determine what to do to prevent extinction? Are elk management plans referenced in the plan?
Appendix B: Recreation Workshops ROSEBURG - June 11, 2015 Small Group Flip Chart ‘Unofficial’ Comments and Questions Recreation Management Areas: Coos Bay
RMA#4 Love the Dean Creek Elk viewing RMA#23 Want wilderness designation in Wasson RMA#15 North Spit needs added personnel to be able to enforce OHV Snowy Plover
Restrictions RMA#5 Open up the road to the Doerner Trailhead
North Umpqua River Area Oregon recreation related jobs are growing at a much faster rate, with less volatility
than are timber jobs! (DEIS 567) Therefore, instead of looking to increase ASQ, focus on growth in recreation.
BLM Public Outreach Sessions May-June 2015 Page 14
Look for opportunities (e.g. easements, land purchases, land swaps) to enhance connectivity between recreation areas (e.g. RMA 15 NNE) and/or other federal, state, county lands).
Mainstem Umpqua River Umpqua River Wildlife Area ACEC – do not remove the ACEC designation Focus on non-motorized recreation opportunities Do not “grandfather” in off road vehicles (OHV) areas just because they’ve been
informally (illegally) established RMA#25 North Bank : Consider creating OHV area
White Rock The more, the better! Restore damaged sensitive areas before considering new emphasis areas Commit to controlling damaging OHV use
GRANTS PASS - June 18, 2015 Small Group Flip Chart ‘Unofficial’ Comments and Questions Lands with Wilderness Characteristics
No motorized uses – Roundtop Mountain LWC RMA – Deer Creek Watershed
o Manage for non-motorized trails/walking/botanizing/ swimming Recreation Management Areas: Ashland
Public involvement process related to the travel + transportation inventory/management process
Butte Falls RMA#117 OHV’s should be included/enlarged Need map showing existing motorized routes Acknowledge OHV use N&E of RMA#117 and RMA#35 Existing OHV use/trails: Butte Falls – Medco – North of Trail – Elderberry –
Goolaway o System of OHV trails exists near Butte Falls
Would like to see concentrated OHV use areas Would like to see long distance loops Fear that if an area isn’t in RMA polygon, that it is automatically closed to motorized
use
Grants Pass Emphasize hiking recreation areas in the Illinois Valley Swimming, picnicking, horseback riding, bicycling and other non-motorized
recreation o Birding, botany o Fishing
French Flat / Logan cut o Why? Close to town/next to communities, take flowers historic mining
areas, etc. Protect Lake Selmac #1 recreation lake in Josephine County all surrounding BLM
land; critical for recreation tourism Deer Creek Watershed on highly traveled Highway 199 is hugely valuable for
tourism or recreation economic opportunities
BLM Public Outreach Sessions May-June 2015 Page 15
Low impact walking trails for seniors and wheelchair accessible recreation opportunities
Recreation for the traveling public is critical for Illinois Valley tourism marketing
SALEM - June 23, 2015 Small Group Flip Chart ‘Unofficial’ Comments and Questions Wild & Scenic Rivers
Consider air strips in this RMA? Increased parking for horse trailers and increased equestrian access into the
Salmon-Huckleberry Wilderness areas Would be nice to see the roads clearer on table maps to be more oriented for visual
aids Tillamook
Consider landing strips Would like to see BLM give more attention to horse use in the plan Support rails to trail Vernonia to Scappoose; if paving routes, also provide gravel
or natural surface to better accommodate equestrian use Molalla & Quartzville
The same or more equestrian use plus camping grounds with sufficient horse trailer parking
Possible air strips in this RMA? Mary’s Peak
Back country aviation, cross-country skiing, rock hounding on the beach Would like to see Corvallis to Sea Trail
Appendix C: Riparian Workshops EUGENE - June 25, 2015 Plenary Questions and Answers
Q: What is the motivation for developing a new plan? o A: The BLM conducted a Resource Management Plan (RMP) evaluation and
found that we are not accomplishing what the existing RMP objectives, not having the anticipated effects and the plan is not sustainable. Also, there have been a lot of changes since the 1995 RMP, including new Northern Spotted Owl Recovery Plans, designated Critical Habitat and new scientific data on owls.
Q: The Northwest Forest Plan (NWFP) met multiple purposes through the wider riparian buffers, why is the BLM proposing narrower buffers? An increase in timber production could lead to an increase in community resiliency. Why is the BLM only focusing on these two purposes?
o A: Those purposes are linked to the Purpose and Need Statement. We set out to identify what to do for fish, water, Northern Spotted Owls, timber, and recreation. All of these purposes are incorporated in the alternatives and Draft RMP/EIS. We also had guidance to provide predictability, so we set up land-use allocations that do not compete. The NWFP has a much broader set of objectives, however, is included in the range of alternatives.
BLM Public Outreach Sessions May-June 2015 Page 16
Q: How does the BLM plan to incorporate the Key Watershed concept of prioritizing watersheds for restoration?
o A: Our philosophy is to have the Draft RMP/EIS be a draft, not a pre-final. We are seeking to explore these concepts between the draft and final and incorporate information from the analysis, public and partner input, and pick and choose different components from the alternatives.
Q: Are you doing a Watershed Analysis during the planning process or is that for the implantation phase?
o A: The 1995 RMP process did not have a lot of Watershed Assessment data. Now we have access to a lot of that data in our corporate database and can query that database for our analysis. The current analysis will also feed into that database and there will likely be some project level analysis as well.
Q: Why is the BLM not considering the needs of other wildlife when designing the Riparian Reserve approaches?
o A: What we do for owls is different than what we do for fish. We are creating different allocations for the different species in order to make the plan more predictable. Managing the entire landscape for all species is a different management approach, more like the NWFP, which is still on the table. If you think that is the way to go, comment with your rationale.
Q: Some of the components of the plan were developed by the BLM Interdisciplinary Team, some by an interagency team. Do you distinguish between the authorship in the plan?
o A: Yes, in Chapter 4 of the Draft RMP/EIS.
Q: The road analysis looks at new road construction and density; does it also look at the current roads?
o A: Yes, the analysis looked at sediment contributions from the existing roads.
Q: Can you explain the rationale for the varying Riparian Reserve widths across the alternatives?
o A: The objectives of the Inner Zone vary: some are focused on shade, capturing structural wood, picking up potential debris flows, avoiding risk, etc.
Q: The NWFP standards and guidelines are clear and effective and discourage sediment input and logging. These should still be discouraged.
Q: The BLM should use the Riparian Reserve widths from the ‘No Action’ Alternative and re-write the Management Direction.
o A: That sounds like a good comment to provide.
Q: Due to the checker-board ownership there are no buffers on some sections of private timber lands. The BLM is not managing land that they have full ownership on, and you need to consider how other landowners are managing.
o A: The cumulative effects are considered to the extent possible.
Q: Riparian Reserves should be prioritized over other land allocations. o A: The Draft RMP/EIS does not prioritize the purposes from the Purpose and
Need.
Q: Does the debris flow prone area go beyond the Timber Production Capability Classification (TPCC) lands?
o A: We identify areas that are most prone to debris flow and allocate Riparian Reserve 100ft around those.
BLM Public Outreach Sessions May-June 2015 Page 17
Q: Do you evaluate the cumulative impacts? Including impacts from adjacent lands, which often use higher level intensity management? What tools are available to evaluate these impacts?
o A: It depends on what you are analyzing. For instance, water temperature at the plan level is not easy to quantify, however, you can qualitatively assess this. We can quantify BLM impacts and see how it varies across alternatives. Where we can’t quantify other landowner’s impacts, we try to do so qualitatively. And we will quantify effects at the project level, even if we can’t at the plan level.
Q: Do you measure the Riparian Reserve widths with a horizontal or slope width? o A: Slope distance.
Q: Does the analysis include sediment input from roads and erosion? o A: The road analysis is just sediment from roads. There is a separate landslide
analysis in the Hydrology section.
Q: Why are you not proposing to continue the Key Watershed concept? o A: The Key Watershed concept from the NWFP prioritizes watersheds for
restoration. We did not want to designate some watersheds as being more important that others, instead we wanted to treat them all the same and see what the analysis results said. If we are going to prioritize watersheds, it is better to do so with the results of the analysis in hand.
Q: How does the BLM determine unstable slopes? o A: These areas are not mapped, however, are included in the Riparian Reserve
allocation. The BLM identifies unstable areas in the TPCC, which is a field based determination.
Q: Climate is not discussed in the Riparian Reserves, how to the alternatives vary in terms of carbon in the Riparian Reserves?
o A: The Carbon and Climate analysis is extensive in the Draft RMP/EIS; however, the Effects Analysis does not break it out by allocations impact specifically. Alternative D has the greatest increase in carbon storage, Alternative C has the smallest; however, they all increase over time.
Q: On pg. 76 of the Draft RMP/EIS it states that Preferred Alternative B does not meeting the Purpose and Need purpose for fish. Can you expand on this?
o A: The Preferred Alternative is a short lived decision. There are difference detected by the analysis and some alternatives performed better than Alternative B in some aspects. We want to explore how to achieve the highest levels for streams, while obtaining aspects of the Preferred Alternative that we liked.
Q: What about meandering streams? This high quality habitat moves outside of 1 site-potential tree width. Do not get fixated on static modelling.
Small Group Flip Chart ‘Unofficial’ Comments and Questions Effects Analysis
Discussion regarding ability of the analysis to be sensitive enough to accurately sense differences in outcomes, especially responding temporally & in particular to critical habitats
Why isn’t there analysis about slope water retention / water capture on slopes? Water retention would seemingly be impacted by stand age & disturbance / replacement.
Ditch line flow of water diverting flow from streams / redirecting natural flows
BLM Public Outreach Sessions May-June 2015 Page 18
Not being able to quantify at this scale – i.e., having uncertainty – isn’t a bad thing & the specific attributes being discussed are spot on discussions for projects
What is the new language in the RMP that will identify monitoring such as what is shown in the NWFPP; (a) info is to come – some will come from consultation; what is the EPAs position on monitoring? (b) supportive of monitoring
Will monitoring issue be addressed? Hear a lot of “don’t monitor because of funding” How many acres within the new alternatives (Alts B and C specifically) would be
harvested on a decadal basis? Has numbers to show; Alt B RR=500k total, harvest/decade = 15k, Alt C RR=370k total, harvest/decade = 7k, how were % shade treatments calculated.
Tell a better story about the magnitude of change anticipated; i.e., change won’t occur on large %’s & where change occurs is small part of the landscape
Analysis highlights small increases in roads/sediment for alternatives, but doesn’t address that some watershed are already in conditions above thresholds for density/sediment.
How is deferred maintenance of roads factored into the impacts? How does the modeling reconcile the ‘No Action’ Alternative’s impacts? When
moving forward we would be implementing 1995 RMP as written, not as we have in the past?
Why isn’t sedimentation from logging (in harvest units/not just roads/ haul) addressed in analysis of timber harvests? Soil coming off slopes into streams.
Not an adequate monitoring program and there is a cyclic event of ‘no effect’ calls and a lack of understanding the baseline
A 59% reduction in aquatic systems (Alt B from ‘No Action’ Alt) will get BLM and regulatory agencies in trouble; not looking at the larger ecological system is a mistake
Following best available science & NEPA is a must The Preferred Alternative doesn’t best meet the P&N for water; why not? The P&N doesn’t have the economic contributions to communities – threw out
smaller communities Biggest failure of the plan is aquatics which the O&C Lands Act says to address In-stream wood recruitment discussion of distance for where LWD comes from; EIS
discusses slopes/steepness and seems to misrepresent analysis cited; (a) meant to discuss valley slopes & distance mobility
Landslide potential analysis include variances in geology and shade Delineation of MITA/LITA seems randomly designated – how were they delineated? What is required in a cumulative effects analysis – aren’t you required to look at
other land ownerships and actions? It is hard to find and tease out; is a retrospective look possible? (a) modeling incorporates analysis across landscapes and uses past as projection for future non-BLM managements
There are Alternatives A, B, C and D; are there options for E, G, F later? (a) not new, but different combinations of the ‘Lego blocks’ of existing alternatives are possible
How are you choosing Alt B as the Preferred? There is nothing that is best all across; how did you choose?
Why aren’t Riparian Reserve (RR) zones different for moist and dry forests? Does this plan give Managers and Biologists enough latitude to do what is needed if
RR zones are the same regardless of fish and forests adjacent? How does modeling incorporate streams? Are they mythical or real? (a) BLM has a
lot of data that allows for a fairly good understanding of streams at this scale.
BLM Public Outreach Sessions May-June 2015 Page 19
Aquatic Conservation Strategy/Northwest Forest Plan and the New RMP Are retention areas identified in outer zone? (a) Yes, and differ by alternative. Apprehension with ACS is that original construct didn’t include such prescriptive,
functional approaches Would like to see a fuller set of ecological benefits addressed in the draft Where is confidence estimates, error probability reflected in analysis? Achieving less sediment risk and delivery in road network across checkerboard
needs a better collective forum Want to see more distinct differences between the alternatives Looking back needed time to try different approaches, monitored then used to
inform What criteria does BLM use to address unstable areas? (a)Noted in TPCC database,
is addressed more specifically in draft; room for scientific input? Challenges with what can be implemented compared to the ‘no action’ alternative
i.e. how NWFP is written Is there anything in draft to allow for land exchange for block ownership? (a) No
because mechanism for it to work isn’t there. Is it possible to have no management actions based on watershed conditions? Can it be enough to have stated conservation values to bring about desired
management actions? How specific or scientific based do they need to be? Can be challenging to figure out best path to achieve goals by various federal
agencies, easier for all to get behind big picture. Thinning rationale differs among alternatives Actions in inner zone are important, i.e. tree tipping balanced with natural cycles,
forward placement Identify opportunities to better align key watersheds with desired values and
reasons why doing so There are different levels of risk associated with adverse effects Ways to address risk with EPA Clean Water Degradation Act? Why was a 3% threshold used? (a) There was a margin of safety applied because
landscapes can be “messy” How can risks for shade loss be better addressed by agencies, i.e. factored into
management activities, i.e. thinning? Can positive emulative impacts be strived for when planning across landscapes? State forest practices pose challenges, interest in support efforts on adjacent lands
to bring about desired outcomes, i.e. increase stream shade Is ESA consultation happening at planning level or project level? Specifically with
USFWS in 2nd site potential tree zone? How is the ‘No Action’ Alternative /1995 plan as written reconciled?
Implementation levels have varied over past 20 years Why was Alt B picked as the preferred alternative? Look at the evolution of riparian management to measure for meeting objectives, i.e.
landslide risk factors In draft, hard to see cumulative effects/impacts i.e. spatially, especially with
checkerboard landscape Acknowledgement of watershed analysis in draft but hard to see translation to
project level NEPA Key could be developing benchmarks when implementing i.e. temperature, wood,
sediment
BLM Public Outreach Sessions May-June 2015 Page 20
Interest in better understanding treatment of NWFP with different approaches by BLM and USFS
Important for USFS to take scientific look before engaging in planning; BLM took problem solving approach
Want to better understand how arrived at low, moderate, etc. harvest levels and relation to water/landscape layer
Stream Types & Upland Management Want to see figures on specific regions and geographic hotspots in riparian areas Why does the public have to come up with better options when the BLM is paid to
do this? What about cumulative effects? Would like full disclosure of bad things from alternatives Alternative A – no commercial logging? Can’t find any monitoring for fish habitat, fish populations, monitoring water quality
parameters If monitoring is only in the Environmental Assessment the public will not be able to
comment Why are the buffers in the new RMP smaller than they were with the NW Forest
Plan? We should cut less and preserve the habitat for species to exist Let’s have an Alternative with the least amount of cutting, to benefit wildlife and
fish. We shouldn’t talk about board feet, but the number of acres restored to high
ecological function Alternative A – most protective, but smaller BLM should have a preservation mindset Timber cutting should be the least important ‘No Action’ Alternative is inconsistent as written and has a lot of assumptions Environmental groups are not happy, the only message that gets heard is via
litigation Species recovery plans need to be incorporated into the RMP RMP is a foreshadowing of where the Forest Practices Act is heading Breaking out the stream types is an innovation Need to consider more than temperature, include wood, sediment, roads, large
wood, etc. Take PowerPoint and convert it into an article for the Oregonian; it’s hard to read
17,000 pages, but the PowerPoint, tables, graphics really make sense and are good public relations
Highlight process for operational efficiency RMP – NEPA
Riparian Management Approaches: Appropriate Tools & Practices Roads – analysis was additive Background conditions are high and analyzed effects were small comparatively Road densities are important, especially in proximity to streams How do you compare this with the Oregon Forest Practices Act? How would a fish bearing stream fare under the OFP Act? Are there repercussions from actions that adversely affect private lands? How do regulatory agencies assess impacts to streams and fish with the
checkerboard ownership?
BLM Public Outreach Sessions May-June 2015 Page 21
A lot of acres are in reserves; there should be opportunities to manage these stands The plan is currently analyzed as a board brush approach; better to leave the
detailed planning to implementation What is affecting Bull Trout the most? Habitat fragmentation? None of the action alternatives meet the Riparian Reserves of the NWFP Could NWFP Riparian Reserves be combined with the large no cut butters of some
action alternatives? Preservation alternative is missing Is fresh water regulation tied to ocean fisheries? Look at the connection between the fishing industry and fresh water conditions What are the impacts from freshwater fisheries resource management on the fishing
industry; socioeconomics 46% urea-based krill applied upslope; won’t that have an impact on riparian? (pg.
1013); fertilization Reduce fuel loading in Riparian Reserves to reduce the risk of catastrophic fires
especially in dry forests Fire retardants are not addressed in this plan Rain on snow (ROS) susceptible watersheds
o The plan only shows a couple of ROS susceptible watersheds Why were more watersheds not analyzed? Oregon spotted frogs historically were in the Willamette Valley, not anymore, were
they in the Illinois Valley? USFWS says likely not. How does upslope water flow affect stream flow or how does upslope water flow
into streams? o It’s not just stream shade; capture the hydrologic flow from upslope o Upland regeneration affects hydrologic flow; some alternatives do consider
natural regeneration harvest; these may respire less water and maintain better hydrologic flow in adjacent streams
Sediment delivery has been analyzed in relation to roads, but has BLM considered the erosion/sediment delivery from logging systems?
BLM Public Outreach Sessions May-June 2015 Page 22
Appendix D: Socio-Economic Workshops
SALEM – June 9, 2015 Plenary Questions and Answers
Q: Is there some sort of weighted average that incorporates things like the Governor’s direction to re-open a local mill, or the difference in impact of a job in a rural area versus an urban area?
o A: There is an economic profile of areas that captures some of this. The modelling program, ‘Implan’ gives a net impact of a job to each county, it also assess whether or not the money stays in the county. The BLM decision makers are aware of how specific counties are more or less affected by job creation.
Q: Comment about using OFRI (Oregon Forest Resources Institute) as a source of data with regards to employment in the forest products industry. This may be biased information, inflated versus the Department of Labor or other government data. (Referred to tables 3-175 and 3-176).
o A: For this broad analysis we used national data, for the timber analysis we felt that OFRI had the most relevant data.
Q: Why did you use data from 2012 since it is such a low baseline? Why not use a historical average?
o A: We wanted to use the best available and consistent data across the analysis. The analysis does use historical data and incorporates low and high points. Timber prices for example are based on long-term trends. Additionally, the data varies depending on the question you are asking.
Q: The ‘Key Points’ section of the Draft RMP/EIS is where most people will look to understand the impacts; these key points are misleading because using 2012 data makes all of the alternatives look like good options.
o A: The ‘No Action’ Alternative is not a static point; in terms of volume of harvest and price we are modelling conditions for the full 100 year period. ‘Implan’ [the modelling program] is limited to the current data and is a snap-shot, however, 2012 data was the most current and consistent data we found.
Q: ‘Implan’ is widely recognized for being flawed; it is a snap-shot projected out 20 years. It does not include the downward trend in timber industry wages, or the upward trend in recreation jobs. Show trends.
Q: Can you clarify why the numbers used in the analysis for wage earnings are different than the Oregon Office of Economics, which show timber industry jobs to be at or below other jobs in the state?
Q: Are you assuming full employment? If not, the analysis is not following federal regulations and needs to be revised. Either way, you should explain your assumption.
Q: The analysis needs to clarify that you are looking at more than just timber jobs – you are also looking at indirect and induced effects.
Q: The analysis shows the economic outputs via narrow boxes (timber and recreation) and needs to also show the non-consumptive values such as clean water. These are not consumptive, however they are valuable. The analysis needs to extend to the amenity market, currently the analysis only accounts for about 50% of the amenity market.
Q: The alternatives are based around different forest management strategies; however, it is hard to discern the cause and effect of the forest management and recreation opportunities.
o A: You can see across the alternatives that the highest timber revenue alternatives are not the highest recreation alternatives. In general, the
BLM Public Outreach Sessions May-June 2015 Page 23
recreation management objectives are compatible with the timber management objectives.
Q: When the analysis says that ‘employment is going down’ it is only in regards to the economic factors that you are analyzing for, it does not include the non-market effect on jobs. You should analyze for the non-market effect, there is data to do so.
Q: Did you look at all of the potential impacts of payments to counties? Specifically the National Research Council 2000 report detailing the relationship between how higher county receipts correlate with additional social conditions such as increases in alcohol and drug abuse, violence, etc.?
o A: We did not feel that we could make a strong connection between those factors.
Q: Does the certainty of federal BLM timber sales affect the outcome? Do you account for the market effect of the federal regulations? Such as not being able to export the timber, and the lower risk of federal timber sales?
o A: We did not incorporate potential changes in the current federal regulations.
Q: How did you describe the volatility of the last 20 years of the timber market in Western Oregon as compared to the rest of the nation?
o A: The analysis describes that if the BLM actions affect the market it will have some impact on industry. The BLM does not act in a vacuum.
Q: Is the ‘No Action’ alternative described in the Capacity and Resiliency analysis the NW Forest Plan as written?
o A: Yes.
Q: The analysis did not account for the relationship between large and small cities. Money flows from larger to smaller cities. The capacity and resiliency of small towns increases when recreation jobs are created to support recreation influx from larger cities.
Q: An increase in recreation or scenery will likely have a greater impact in the Rogue River area than increasing the timber production.
Q: The analysis needs to recognize that if there is not enough timber production, the local mills will go away and those towns will lose year-round employment.
Q: The analysis is missing the story of the impact that BLM lands have on these communities. In this analysis there is a discrepancy towards the population centers and the demand side. People coming into the rural communities from the population centers do not fund rural county Commissioners.
Q: The analysis shows that the Preferred Alternative costs less than other alternatives and includes thinning instead of regeneration harvest. Regeneration harvest costs less to implement than thinning, how is it that the analysis shows the thinning alternatives costing less than the regeneration alternatives?
o A: The cost to BLM is not varied by the activity in this analysis. We are talking to the BLM Inter-Disciplinary Team about how to base some of the next round of analysis on cost per/acre.
Q: The analysis needs to include the implications of climate change to the BLM budget, and the President’s Executive Order.
Q: The BLM needs to factor in the other costs of regeneration harvest, including the cost of social acceptance.
Q: Global wood product needs and population are increasing, is there anything in the analysis that recognizes the impact of what would happen if the timber has to come
BLM Public Outreach Sessions May-June 2015 Page 24
from other lands? The timber will have to come from somewhere, what are the impacts if it is not from BLM lands? How do those impacts compare?
o A: This is not a net analysis and does not include those bigger picture market dynamics. Some of those bigger picture market dynamics factor into the pricing included in the goods and services analysis. The global timber market is not factored into the analysis, and there is no assumption that the BLM actions will influence market prices.
Q: There are inconsistencies in the information provided. There are also inconsistencies with what those on the ground see and the analysis outcomes.
o A: Thank you; that is why the public comment period is so vital. We need the public to review and help us clear up inconsistencies.
Q: Is it fair to compare the volatility of timber industry to the rest of industries? The analysis says that increases in the timber industry add to the volatility of the economies, however, volatility is inherent in business, especially in Southern Oregon. Fire is also a real issue and has a big impact on habitat. The Biscuit Fire had a direct effect on loss of Northern Spotted Owl habitat.
Q: How did you determine the value of carbon storage? A stud in a house also holds carbon, is this considered in the analysis?
o A: Yes, however, a stud and a tree are valued differently. We use federal guidelines that determine the ton of carbon. The wood product values include decay values.
Q: The analysis used a mid-line estimate of values for carbon storage, however, these values are incomplete and don’t assess the risk. The Federal Interagency Working Group Report gives criteria and has mandates to use the best available science. This analysis is not describing the risks, for example to ocean acidification, or major threshold events (Frances Moore 2015 study).
Q: It would be helpful if the analysis showed the tradeoffs of alternatives. What do you lose with one, and what do you gain with others?
Q: County Commissioners are elected to represent their constituencies, thus the BLM should count Commissioner’s comments as more than one comment – they should instead count as one for each county constituent.
o A: The BLM decision makers recognize the importance and significance of County Resolutions, however, we are not quantifying those comments as individual comments. This is not a vote. We hope the Cooperating Agency Advisory Group process has allowed the County interests to be heard. All comments will be reviewed and recognized.
Q: This analysis is inadequate; there are different baselines used throughout the analysis. The AOCC would like to see the analysis run with 1995 data as the baseline. This will show the significance of job creation.
Q: Is the volatility analysis saying that the timber market is stable and can’t grow? o A: That is an important question – what would an increase in timber mean for
the market?
Q: The non-market effects, such as improvements in amenities, recreation, etc., can positively impact communities.
Q: It would be helpful to see a synthesis of the analysis – the Draft RMP/EIS is data heavy.
Q: The revenues from forest lands come to the school – these counties need more revenue coming in a constant flow.
BLM Public Outreach Sessions May-June 2015 Page 25
Q: Curry County wants to have law enforcement to protect communities, if timber receipts don’t come in, there will be no more law enforcement to protect recreationalists.
Q: The comments need to be heard and addressed, and at the end of the day cutting timber comes at a cost – carbon cost equals $60/ every $1 paid to the counties. The BLM needs to weigh these costs and tell the whole story.
ROSEBURG - June 10, 2015 Plenary Questions and Answers
Q: You didn’t mention the Oregon and California Lands Act (O&C Act) when you listed the legal mandates that you manage within – do you manage to the O&C Act as well as the other mandates mentioned?
o A: Yes, the BLM manages to the O&C Act, which also has many socio-economic aspects as well.
Q: Does Issue #6 in the analysis, which focuses on the impact of alternatives on people with low incomes, take into account the services that counties will no longer be able to provide to the population?
o A: Issue 3 does in part, as it assesses the county payments, specifically, the proportion of each county’s budget that comes from county payments. However, we did not analyze the effect on the county’s actual budget.
Q: You call them ‘payments’, I call them ‘services’ – those with the lowest incomes are hit the hardest by the lack of services. Some counties, including Douglas County, are on the path to insolvency. Does your analysis take into account the effect of what happens to counties when they do not receive those services?
o A: The analysis touches on those issues through Issue 3 and the Community of Place interviews, in which the ‘trickle down’ concept was mentioned. We did not analyze the effect of how the ‘payment’ will be effected across the range of alternatives in regards to the impact on services provided by the counties.
Q: Look at the children to understand the socio-economic impacts, a good source to look into is the ‘Children and Families Programs’, which illustrate the amount of kids in the ‘disadvantaged’ category, telling an important element of the story. Douglas County also has a conference to discuss how to address these issues.
o A: Yes, the challenge in analysis is being able to draw a direct connection; please help us draw those connections via your comments.
Q: The baseline data used is the ‘No Action’ alternative which the BLM has stated is not implementable. Some of the alternatives increase the timber harvest even though BLM cannot sustain the harvest levels now. Why are you measuring the analysis against the ‘No Action’ as written? You are measuring against something that is not implementable. Why not measure against something that is implementable – like the real situation in 2012?
o A: Yes, the socio-economic analysis considers the ‘No Action’ to be the 1995 RMPs as written, not as implemented. We needed to establish a baseline condition from which we could compare the alternatives. We tried to explore measuring against what is actually happening, however, cannot project that out into the future because the 1995 RMPs are on a path of departure and there is no way to predict the point of departure.
Q: So you never have comparison with the existing condition?
BLM Public Outreach Sessions May-June 2015 Page 26
A: Correct, the socio-economic analysis describes the most current quantitative data – with economics think about ‘with’ or ‘without’ not ‘before’ and ‘after’.
Q: Table 3-73 on page 16 of the handout shows the value of recreation dollars under all alternatives and the value of timber. Timber values are lower than recreation under all alternatives. What components go into adding value into recreation versus timber?
o A: There is variation across all alternatives in regards to recreation; however, it is not easy to quantify a dollar value. The timber and recreation analysis is different. Timber is a market, recreation a non-market value. For recreation, we used a federally designed approach to understand people’s values of recreation opportunities – how much would they pay for the recreation experience? The calculation provides a net benefit to the user, not actual transactions. Values beyond those opportunities are included in Issue 2, for example the spending that happens indirectly with recreation.
Q: Does that include the value of hotel stays, gas, etc.? A: That sort of ripple effect is broken down in Issue 2; for
example, the goods and services that are associated with timber and recreation. We tried to isolate the direct effects of BLM actions.
Q: This Draft RMP/EIS and analysis are created to inform the decision maker. The O&C Act was established to offset the high federal ownership in these counties and thus lack of income. How is the socio-economic analysis, which shows 27% of historic levels of payments to counties, incorporated into the Preferred Alternative? How is this then carried forward into the proposed?
o A: The BLM planning regulations require the identification of a Preferred Alternative in the Draft EIS. We are considering this a short lived decision. In regards to the socio-economic analysis resulting influencing the identification of the Preferred Alternative, we wanted to make sure that the receipts exceeded the current payments.
Q: And the timber lands will be managed for sustained yield… how do these facts play into the formulation of the Proposed Alternative?
A: The critical next step is the public comment period, until the comment period is over; all we can do is get ready for the development of the Proposed Alternative. All of the public comments factor into the development of the Proposed.
Q: 67% of the lands in Curry County are public trust lands; there is a direct line from timber harvest to County services. Timber harvest is reduced year after year, and so receipts are reduced too. Alternative B shows a negative effect – I know it is not the final, but BLM needs to take care of those negative effects. How are you going to fix it?
o A: At this point, we have laid out a suite of options; however, do not have the final yet. The analysis highlighted effects of actions and made us aware of the effects, so now we know that it needs to be addressed.
Q: One thing that the analysis is missing, which is an environmental justice issue, is the impact on individual’s property values in these low income communities. My property is up in value because it is adjacent to BLM land. If you log it, the value goes down 10%. Increasing logging because tax payers refuse to pay taxes will actually have a huge impact on low income communities.
BLM Public Outreach Sessions May-June 2015 Page 27
Q: In the analysis is the value of recreation geographically dispersed? If someone starts a trip in one area and finishes it in another, is that factored in?
o A: We used the best available data from the monitoring of visitor numbers by recreation type – this estimated the value of recreation experiences, and drills down into the site specific level.
Q: You need to go back to the 1960s-1980s to compare the alternatives. Going back to the 1990s only allows you to compare low years to other low years. Look at the data of children in schools and the services needed in the schools, for example school lunch programs. In 2000, there were 500+ people working for the County government, now there are less than 300. It is not fair to compare the low and the low, need to look at comparing the low and high.
Q: How were ecosystem services measured? For instance clean water, carbon storage, etc.… How do you account for the value of clean water in streams and rivers?
o A: We had subject matter experts look into the ecological based effects and the overall effected environment. If there is variation across the range of alternatives, it is shown where it was detectible. For water quality, all water quality standards are met across all alternatives. Whereas there is substantial variation across the alternatives in regards to carbon storage; the carbon sequestration analysis can be found in the Climate Change section of the analysis.
Small Group Flip Chart ‘Unofficial’ Comments and Questions Impact on Communities: Jobs/Economic Stability, Capacity and Resiliency, Environmental Justice
Study low income communities; can get an influx of people moving in to enjoy natural resources
o Consider indirect inputs to communities BLM holds a lot of land; it is valuable as it is. Base timber harvests on environmental
values not just on economics (environmental values are as valuable as economics) Consider long term economic and environmental impacts Rivers, streams, and fish - The BLM needs to protect these, they are very important
and there are lots of problems with temperature and chemical spray Consider the cost of action to society Logging jobs have changed since the 1990s, it is largely mechanized and does not
require as many workers; is this being considered? o Logging technology is different because of computerized equipment
less people are needed which in turn equals less jobs Is the BLM considering that how society is living is different now as compared to
1990’s and before? There needs to be more pressure on BLM to protect lands when private landowners
are clear cutting all around Need to look into long term impacts from low educated jobs brain drain kids
move away to better jobs o Consider ways for BLM to develop ways to keep kids here with better jobs
“Earn to Learn and Serve Program” is a good example (Partnership with USFS, BLM, Phoenix, Community College, and Umpqua Watersheds)
Health of the ecosystems is a concern
BLM Public Outreach Sessions May-June 2015 Page 28
How do you get retirees and people with disposable funds and start-ups/entrepreneurs into our community?
o Recreation is key to draw them in o Non-market values really affect market values o Wilderness and views
Payments to Counties Children are the ‘canary in the coal mine’ for non-market effects How does the “No Action” alternative account for the difference between the NWFP
and current practice? The counties need to equalize property taxes paid by private landowners, so
industrial timber owners pay the same as everyone else If you consider jobs, consider that most logs cut on private land are exported; what
incentives could be given to keep Douglas County cut logs in Douglas County mills? The BLM should consider cumulative effects of the timber industry, including
private landowners, on jobs…i.e. impact on exporting logs Appreciate having local/district level maps Forest management should promote a diversity of industries, not just timber
o Diversification would increase economic stability
Market and Non-Market Goods and Services More harvest than alternative counties, need higher receipts for counties There is not enough consideration given to non-market resources and assets Consider the market value of the carbon market (bio-char/bio fuel); it is happening
in California, can it happen here? Concerned about the effect of timber harvest on property values; consider analyzing
this We need more time for the comment period More detailed socio-economic analysis for sub-alternatives Want to see a chart in the RMP that shows payments to counties, dating back to
1962 (e.g. Vol. 2, p. 484, Fig. 3-144); also, to add context to harvest decrease Study the impact of harvest on recreation visits Seek data on naturalness and effect on health, recreation and visitation Show trend in jobs per harvest over time
Appendix E: Elected Officials and Public Session
SALEM – June 30, 2015 Plenary Questions and Answers
Q: For the record, both Jackson and Josephine Counties were not members of the Cooperating Agency Advisory Group.
Q: Receipts are important to the Counties, knowing this, why did the BLM design Alternatives A and B to only provide 50% of the historic amount of receipts?
o A: Yes, receipts are important, however, it is not the BLM’s only purpose. The BLM needs to also provide for other purposes such as the Endangered Species Act and Clean Water Act. All alternatives had to be able to meet all of the components of the Purpose and Need Statement.
BLM Public Outreach Sessions May-June 2015 Page 29
Q: The term ‘receipts’ is used a lot. People need to understand that these ‘receipts’ equate to funding for public health, public safety, the livability of our communities – the habitat of the human species. This needs to be considered in the decision making process, please.
Q: In the past there was a lot of regeneration harvest, now there is more thinning proposed. Regeneration harvest is more valuable than thinning.
Q: The 2012 County payments are causing the current financial issues in the Oregon and California (O&C) Counties; Alternative B has even less receipts than the 2012 payments. Is the BLM factoring this in?
o A: The BLM did not design the analysis aiming for a specific number of receipts; the results are simply what the analysis shows. That being said, the Socio-Economic and Community Resiliency Analyses were robust analysis and will also feed into decision making. The selection of Alternative B as the Preferred Alternative is a short lived decision.
Q: The BLM needs to review the data regarding the 1989 receipts. The Draft RMP/EIS shows $115million in receipts that year, which does not resonate with the payments to counties in 1989. The highest payment ever received was $103 million.
o A: The BLM will review the data to make sure the numbers are accurate. Q: The Coquille Tribe has made significant investments in the Northwest Forest
Plan’s Monitoring program, however, do not see this carried forward in the Draft RMP/EIS. Will this plan support an adaptive management process?
o A: Monitoring data was utilized for the analysis; there is specific data for specific areas, some of which was integrated.
Q: Does the monitoring data used reconcile with U.S. Fish and Wildlife Service’ (USFWS) objectives for Northern Spotted Owl?
o A: We are working with USFWS; they have been cooperators throughout the process. The modelling conducted by the BLM for the Draft RMP/EIS was the same modeling used by the USFWS for their Critical Habitat designations; however, we made the models more regionally specific. Also, the USFWS is part of an independent team that helped design the alternatives.
Q: Is the National Oceanic and Atmospheric Administration (NOAA) also involved in the planning process?
o A: Yes, NOAA is a cooperating partner. NOAA has been engaged specifically in the riparian/stream alternative development.
Q: Is the BLM only planning to increase fire resiliency in the dry forests? Fire season was declared in some moist forests as early as January 2015; these forests also need increased resiliency.
o A: Moist forests would also be treated to increase fire resiliency, however, the ability to impact fire resiliency is more pronounced in the dry forests.
Q: Why do the alternatives suggest that recreation and timber production are mutually exclusive?
o A: Recreation and timber production are not mutually exclusive. In regards to recreation, the alternatives look at providing a range of recreation use, from low to high. Anywhere that you see a ‘Recreation Management Area’ on the Draft RMP/EIS maps, it signifies an area that is being considered for recreation use. This means the BLM would develop and manage for the designated recreation uses.
Q: Has the BLM discussed the additional services needed to provide recreation opportunities?
BLM Public Outreach Sessions May-June 2015 Page 30
o A: This conversation will happen between the Draft RMP/EIS and the Final RMP. There are 5.5 million people using these lands for recreation and we now have national policy stating the need to have a focused and strategic approach to managing for recreation. Under the current RMP, all BLM lands are designated as recreation lands, this new RMP will focus on how, where, when, and why recreation use is permitted.
Q: How do you define ‘recreation’? o A: The BLM is utilizing findings from the State of Oregon’s comprehensive
recreation plan which identified 16 primary recreation activities, including things such as motorized and non-motorized activities, camping, fishing, etc. The State’s plan was statistically validated with details such as participation rates and distance from population centers.
Q: Does the BLM’s plan factor in the cost of up-keep of these recreation opportunities? Does it make sure that the opportunities are viable and supported throughout the life of the plan?
o A: The BLM Management Direction noted in the Draft RMP/EIS states that the BLM will have to establish partnerships to help support recreation opportunities. BLM has been successfully partnering to develop and maintain recreation facilities in the past, so precedent has been set as to how to do that.
Q: In my area there have been three BLM recreation sites that were recently shut down due to lack of funding. How is the BLM going to support more recreation sites? Also, roads have been closed due to lack of funding.
o A: The recreation demand has shifted away from some of the old BLM recreation sites. If you look at the range of alternatives, Alternatives A and B reduce the amount of recreation sites, whereas, Alternatives C and D increase the amount of recreation sites. There may not be large investments needed.
Q: Has the BLM identified where the recreation expansion might happen? If the BLM is not going to cut more timber in rural areas, there is an expectation that recreation will be the new revenue. There is a need for more tourist dollars in rural areas, and if the BLM is focusing on increasing recreation use around population centers, it will not help rural economies.
o A: All 341 Recreation Management Areas are mapped and can be found on the Interactive Mapping site, available on the BLM’s RMP for Western Oregon’s website. Recreation is one piece of it, however, travel and tourism has both direct and indirect spending, which requires infrastructure to support the spending. The BLM is planning how to strategically invest to maximize the benefits to communities.
Q: These counties don’t have Search and Rescue services to back up the recreation opportunities.
o A: That is a great comment to submit. Q: How is the BLM going to mitigate the loss of timber revenue to Counties?
Receipts support public services; this looks like the BLM is moving away from the O & C Act requirements.
o A: This plan will provide a sustained yield of timber, there may be disagreement on the ASQ numbers; however, the BLM will provide a sustained yield. The Harvest Land Base does not have a linear relation to the receipts. The BLM does not want to make it harder for the Counties to provide services.
BLM Public Outreach Sessions May-June 2015 Page 31
Q: How does the BLM expect to pay for the additional costs that their actions will put on the Counties?
Q: Recreation on public lands leads to lost hikers and such. The Search and Rescue teams are County crews; an increase in recreation will mean increased costs to County’s bottom line. There is concern about recreation increasing the cost to the Counties.
Q: Will the BLM be extending the Public Comment period as requested? When should we expect a response?
o A: At this point the BLM is not planning on extending the official Public Comment period, as we are trying to stay on the original timeline commitment made during the public scoping process. We made a commitment to the public to fix the inadequacies of the current RMP, and want to stick to the timeline stated. The public should expect an official response from the BLM soon.
Q: Many of these comments have been made to the BLM throughout the planning process, what are we doing wrong that is making it so that the BLM does not hear us?
o A: We do hear you, and have all along the way. In response to what we’ve heard, we incorporated County interviews into the Socio-Economic Analysis in order to figure out what is important to each County. At this point in the formal planning process, we need comments written and submitted by interested parties in order to be considered ‘official’.
Q: Prior to developing the alternatives did the BLM work with their Solicitors to check and see if it is acceptable to put O & C lands into reserves? The O & C Act calls for these lands to be used to generate a sustained yield of timber.
o A: Yes, the Solicitors were involved in review the Purpose and Need which was released in June 2014. In order to make a ‘sustainable’ yield of timber the BLM also has to fulfill other purposes of the plan.
Q: It is important for people to recognize that receipts come from money produced via timber and equate to family wage jobs. If there are family wage jobs in these counties, there is less need for services. The timber industry provides jobs if you let us.
Q: The Counties are not begging for receipts, it is our right. Due to the loss of timber and jobs 70% of our children are on free or reduced lunches as school. We’ve lost 3-5 mills in the last decade. We’ve lost jobs due to environmental and social issues.
BLM Public Outreach Sessions May-June 2015 Page 32
Appendix F: BLM Outreach Events Facilitated by OR Consensus May 19, 2015, Open House, Roseburg May 20, 2015, Open House, Eugene May 21, 2015, Open House, Salem May 26, 2015, Open House, Klamath Falls, May 26, 2015 May27, 2015, Open House, Medford May 28, 2015, Open House, Coos Bay June 9, 2015, Socio-economic workshop, Salem June 10, 2015, Socio-economic workshop, Roseburg June 11, 2015, Recreation workshop, Roseburg June 15, 2015, Open House, Portland June 16, 2015, Forest Management and Wildlife workshop, Salem June 17, 2015, Forest Management and Wildlife workshop, Medford June 18, 2015, Recreation workshop, Grants Pass June 23, 2015, Recreation workshop, Salem June 24, 2015, Recreation workshop, Eugene June 25, 2015,Riparian workshop, Eugene June 30, 2015, Public meeting with invitation for elected officials, Salem Planning Criteria and Preliminary Alternatives Meetings were held at the following dates/locations: March 3, 2014, Portland March 5, 2014, Eugene March 6, 2014, Salem March 10, 2014, Roseburg March 11, 2014, Coos Bay March 12, 2014, Medford March 13, 2014, Klamath Falls Roseburg Meeting with Invited Elected Officials - March 17, 2014, Roseburg Community listening sessions on the four key elements were held at the following dates/locations: December 3, 2013, Corvallis December 10, 2013, Medford December 11, 2013, Coos Bay December 18, 2013, Roseburg Recreation Outreach workshops were held at the following dates/locations: January 29, 2013, Medford January 30, 2013, Roseburg January 31, 2013, Springfield February 5, 2013, Portland Public Meetings during the Scoping Period were held at the following date/locations: May 16, 2012, Medford May 17, 2012, Grants Pass May 23, 2012, Klamath Falls May 24, 2012, Salem May 29, 2012, Springfield
BLM Public Outreach Sessions May-June 2015 Page 33
May 30, 2012, Coos Bay May 31, 2012, Roseburg June 5, 2013, Portland