1955-1964 A Study of the Price to Book Relationship Frank E. Block I n an earlier article, the author developed an argument in favor of greater consideration of book value in common stock analysis.^ It was and is believed that effectively used assets are the basis of profitability, growth, dividends and certain other factors which establish value. Without an adequate understanding of the ways in which assets and profitability interact upon each other, the valuation process becomes exceedingly diffi- cult. SYMBOLS USED In this article, certain letters are used consistently to represent words and ratios, as follows: F = Price per share E = Earnings per share B = Book value per share A = Dividend payout ratio P/B = The ratio of price to book value P/E — The price/earnings ratio, or "multiplier" E/B = Return on equity, or "profitability" AE = Dividend The earlier article presented the formula: P/B - P/E X E/B, where P/E is the price/earnings ratio, but may also be used in the sense of a multiplier. When P/E is used in the sense of a multiplier, E/B represents underlying profitability rather than merely current earnings. The price to book value ratio is important because it draws together the external and internal factors of price, completing the cycle of market and company analysis, for the price/earnings ratio is the stock market aspect of a company and the return on equity is the stockholder's vindication. This article attempts to examine some of the rela- tionships between profitability (E/B), the P/E ratio, growth, volatility of earnings, etc., and to discuss the peculiar behavior of P/E ratios. The study of these factors may tell us something about P/B, or the price paid for book value. Reprinted from Financial Analysts Joumal (September/October 1964):108-17. THE PRICBEARNINGS RATIO Attention must first be directed to two perverse characteristics of the price/earnings ratio—the well known "counter movement" of price/earnings ra- tios, and the "U" characteristic. These two factors account heavily for what often seem to be com- pletely irrational movements in price/earnings ra- tios. THE COUhTTER MOVEMENT The counter movement principle as first intro- duced by Nicholas Molodovsky in 1953 in the Financial Analysts Journal (then The Analysts Jour- nal).^ His subsequent writings on related topics provided amplification of this phenomenon. With- out question, Molodovsky's counter movement principle was a major breakthrough which pro- vided analysts with their first clear insight into the behavior of price/earnings ratios. The counter movement is the tendency of price/earnings ratios to move in the opposite direc- tion from earnings. If earnings deviate from the level considered to be "normal" by the market, the price/earnings ratio merely adjusts itself to a level which will leave the market price unchanged, except to the extent that other influences enter the picture. Thus, it is clear that price is more closely related to "normal earnings," "average earnings," "basic earning power," "intrinsic value'/' etc., than to temporary earnings deviations within an expectable range of fluctuations. If the fluctuation in earnings exceeds the market's expectation and is, therefore, uncharacteristic of what the market considers normal, it is probable that the stock will be reappraised by the market immediately and new standards of normalcy will be established. While the counter movement has been well covered in the Financial Analysts Journal by Molodovsky and others, many security analysts persist in making recommendations based on pro- jections of current or "next year's" earnings, with- out regard to whether those earnings are merely normal cyclic fluctuations or a change in the un- derlying earrung power of the company. Financial Analysts Journal / January-February 1995 63
Transcript
1955-1964
A Study of the Price to Book RelationshipFrank E. Block
I n an earlier article, the author developed anargument in favor of greater consideration of
book value in common stock analysis.^ It was andis believed that effectively used assets are the basisof profitability, growth, dividends and certainother factors which establish value. Without anadequate understanding of the ways in whichassets and profitability interact upon each other,the valuation process becomes exceedingly diffi-cult.
SYMBOLS USEDIn this article, certain letters are used consistentlyto represent words and ratios, as follows:
F = Price per shareE = Earnings per shareB = Book value per shareA = Dividend payout ratio
P/B = The ratio of price to book valueP/E — The price/earnings ratio, or "multiplier"E/B = Return on equity, or "profitability"
AE = Dividend
The earlier article presented the formula:
P/B - P/E X E/B,
where P/E is the price/earnings ratio, but may alsobe used in the sense of a multiplier. When P/E isused in the sense of a multiplier, E/B representsunderlying profitability rather than merely currentearnings.
The price to book value ratio is importantbecause it draws together the external and internalfactors of price, completing the cycle of market andcompany analysis, for the price/earnings ratio isthe stock market aspect of a company and thereturn on equity is the stockholder's vindication.This article attempts to examine some of the rela-tionships between profitability (E/B), the P/E ratio,growth, volatility of earnings, etc., and to discussthe peculiar behavior of P/E ratios. The study ofthese factors may tell us something about P/B, orthe price paid for book value.
Reprinted from Financial Analysts Joumal (September/October1964):108-17.
THE PRICBEARNINGS RATIOAttention must first be directed to two perversecharacteristics of the price/earnings ratio—the wellknown "counter movement" of price/earnings ra-tios, and the "U" characteristic. These two factorsaccount heavily for what often seem to be com-pletely irrational movements in price/earnings ra-tios.
THE COUhTTER MOVEMENTThe counter movement principle as first intro-duced by Nicholas Molodovsky in 1953 in theFinancial Analysts Journal (then The Analysts Jour-nal).^ His subsequent writings on related topicsprovided amplification of this phenomenon. With-out question, Molodovsky's counter movementprinciple was a major breakthrough which pro-vided analysts with their first clear insight into thebehavior of price/earnings ratios.
The counter movement is the tendency ofprice/earnings ratios to move in the opposite direc-tion from earnings. If earnings deviate from thelevel considered to be "normal" by the market, theprice/earnings ratio merely adjusts itself to a levelwhich will leave the market price unchanged,except to the extent that other influences enter thepicture. Thus, it is clear that price is more closelyrelated to "normal earnings," "average earnings,""basic earning power," "intrinsic value'/' etc.,than to temporary earnings deviations within anexpectable range of fluctuations. If the fluctuationin earnings exceeds the market's expectation andis, therefore, uncharacteristic of what the marketconsiders normal, it is probable that the stock willbe reappraised by the market immediately andnew standards of normalcy will be established.
While the counter movement has been wellcovered in the Financial Analysts Journal byMolodovsky and others, many security analystspersist in making recommendations based on pro-jections of current or "next year's" earnings, with-out regard to whether those earnings are merelynormal cyclic fluctuations or a change in the un-derlying earrung power of the company.
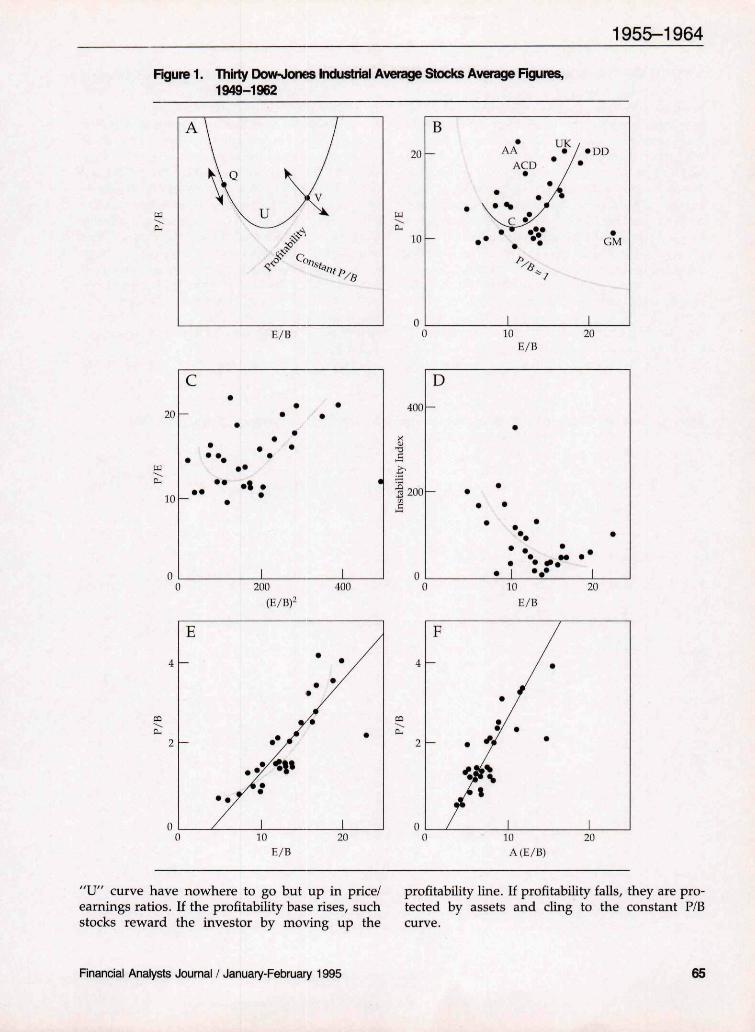
Less familiar is what the author calls the "U"characteristic. If the reader will refer to Figure 1-Athe following discussion may be somewhat clearer.The "U" characteristic is a relationship of price tobasic earning power rather than to current earn-ings.
If earning power were the only criterion ofvalue, stocks with a return on equity (E/B) of zerowould have no value and the price/earnings ratio(P/E) would be meaningless. Earnings multipliersrise with expectations of growth. Since growth isclosely related to the return on equity, the price/earnings ratio should rise when basic profitabilityrises. This is shown in Figure 1-A as a broken line,rising as E/B increases, and is called the profitabilityline. There are reasons to think that this line shouldbe curved and concave upward, rather than astraight line, as we shall see later.
The profitability line tends to have the greatestinfluence on those companies whose earnings areso large a part of the valuation picture as toeliminate assets, per se, from consideration. Stocksof low profitability tend to be influenced, increas-ingly as E/B declines, by assets. Thus, a secondbroken line is shown—the constant price to book value/me—which intersects the profitability line. Somestocks are influenced almost completely by theconstant P/B line.
The constant P/B line represents a marketvaluation of stocks of below average or no profit-ability. The P/B constant for a given company willdepend on the composition of its assets, the pos-sible value of those assets in a merger or liquida-tion, the earnings potential of the assets under animproved management or less competitive condi-tions, the timing and likelihood of such develop-ments, and so on. The degree of optimism orpessimism in the stock market would also be animportant influence.
If all other characteristics of payout, earningsinstability, size, industry, quality, etc., were thesame, we would expect stocks to fall on son:ie linesuch as the solid line in Figure 1-A. This curve isshaped roughly like the letter "U". As profitabilitydeclined, a stock would begin to reach a point atwhich the influence of the constant P/B line wouldovercome the influence of the profitability line.Similar stocks of different profitability should pro-vide a "U" shaped curve when P/E is plottedagainst E/B, using average figures for a reasonablylong period of time.
The slope of the profitability line of a particu-
lar stock is influenced by quality, payout, growth,cyclicality, and similar factors. The market pro-vides us with a family of constant book valuecurves crossed by a family of profitability lines.Each combination of one constant book value lineand one profitability line constitutes a mathemati-cal "class" of stocks which would have a particular"U" curve. These curves are dynamic, changingwith market conditions. Thus, we should not ex-pect all stocks to follow a single "U" curve nor asingle stock to adhere to a fixed "U" curve for along period of time.
When earnings undergo short term depar-tures from their "normal" level, price/earningsratios react automatically, simply because the de-nominator has changed. Point "V" on the "U"curve represents a stock which is valued in termsof its earnings. In accordance with the countermovement principle, the price/earnings ratioshould adjust in the directions of the small arrowsto reflect the temporary departures of earningsfrom their norm.
Point "Q" represents a low profitability stockand is found on the constant P/B portion of the"U" curve. Such a stock will merely move up ordown the "U" curve with fluctuations in earningssince the market appraises this stock almost en-tirely in terms of its assets. It will not depart fromthe "U" curve as "V" will.
It should be noted that "V" moves up anddown a line which is somewhat similar to a con-stant P/B line. If "V's" earnings can be expressedin terms of a fixed return on equity, then thecounter movement will be reflected in movementsup and down a fixed P/B line—in essence, pricecould be viewed either in terms of a multiplier ofearning power or as a capitalizer of the equityassets which provided those earnings. The resultswould be the same! However, in the rare case of a"V" whose earnings are only loosely related toassets, the counter movement should be expressedin terms of price and earnings per share only.
The existence of the "\J" characteristic is help-ful in explaining the anomaly that high price/earnings ratios are often associated with very un-profitable companies, as well as with those whichare highly profitable. The low P/E stocks are thosewhich are associated with below average profit-ability, but have not yet moved up either theconstant price to book value line or the profitabilityline. A number of studies, some of them using theDJIA, have shown that the low P/E stocks regularlyoutperform stocks with average or high price/earnings ratios.^ The stocks at the bottom of the
A STUDY OF THE DOW-OONESThe author has prepared a statistical study of the30 stocks currently in the Dow-Jones IndustrialAverages, covering the years 1949-62. Those 14years covered bear, bull, and intermediate mar-kets, more than three full business cycles, and atleast one minor war. They should be representa-tive of the postwar economy and its stock marketthrough 1962. Unless the Millennium has come,we can expect the stock markets of the future to beexposed periodically to similar developments. Theaverage figures are shown in Table 1. The 30 stocksare listed in the order of their profitability (E/B).
To determine the relative instability of earn-ings, a simple index was devised, consisting of thesum of all year-to-year percentage declines in earn-ings per share for each stock. (Standard deviationis not the best measure of earnings instability,since it is largely the downward movements in
earnings which give investors the cold horrors.Upward fluctuations in earnings are borne withexemplary fortitude by most investors.)
The results of the study are presented in fourseries of figures. The first two series deal in aver-age figures for the fourteen years. The two finalseries of charts show the figures for individualyears. The relationships developed are based en-tirely on history. It is not intended to deprecate theimportance of expectations—for most of any valu-ation process is oriented toward the future ratherthan the past. This study must, therefore, be takenin the context of market expectations, or valua-tions, as they existed in the pessimistic and opti-mistic markets of the years 1949 through 1962.Those expectations are just as much a part ofhistory as the growth rates or dividend payouts ofthat time span.
Figure 1-B shows the effect of profitability
Table 1. Selected Statistics for 30 Dow^ones Industriai Average Stocks Average Figures, 1949-1962
(E/B) on the price/earnings ratio. None of thestocks averaged a price to book ratio below 0.67over the period 1949-62. A statistically significantlinear relationship existed between profitabilityand the price/earnings ratio, although it was poor.If three stocks are ignored, Alcoa, Allied Chemical,and General Motors, there is a hint of a "U"characteristic curve. Such a curve, roughly drawn,is shown on the chart as a broken line.
It is the existence of this "U" plus some of thelonger term counter movements which prevent agood "straight line" statistical relationship be-tween P/E and E/B. If we eliminate stocks of verylow profitability and high earnings instability, therelationship between P/E and E/B offers a well-behaved linear pattern.
The refusal of General Motors, Alcoa andAllied Ghemical to follow the "U" curve closelycan be explained better by the pattern of price/earnings ratios in their respective industries thanby the factors covered in this study. This matter ismost complex and must be treated in a separatearticle. However, the reader will note in Figure 1-Bthat General Motors sold at roughly the same P/Eratio as Chrysler and that Allied Chemical's P/Eratio was near that of the other tM,'o chemicalsdespite substantial differences in the levels of prof-itability. Similarly, Table I shows a tendency forthe P/E ratios in other industries to fall in a narrowrange.
The influence of profitability on price/earningsratios is slightly exponential because of the impactof profitability on growth. Price/earnings ratios aregreatly influenced by expectations of growth. Eig-ure 1-C shows (E/B)̂ plotted against P/E. Hereagain the linear relationship was mediocre, butstatistically significant, and the "V" curve slightlymore pronounced than in Figure 1-B.
Eigure 1-D reveals that earnings instabilityand profitability do not appear to have a linearrelationship. The cause and effect dilemma raisesquestions about the instability index. It is clear thathigh profitability is associated with a strong resis-tance to earnings declines.
No graphs are shown plotting earnings insta-bility and payout against the price/earnings ratio.However, such graphs merely show that the rela-tionship is poor, and that stocks with highly vola-tile earnings are likely to be found in the low P/Egroup. There is a fine statistical relationship be-tween P/E and the instability index expressed as athird-degree parabola, but this may be merely amathematical oddity. The important influence ofpayout on the price/earnings ratio is badly blurred
by overriding influences. Thus, these graphs werenot included.
Figure 1-E provides some interesting informa-tion on the price to book value relationship. SinceFigure 1-E plots P/B against E/B, one would thinkthat the book value figure, B, would cancel out andthe results would be the same as a graph of priceversus earnings. Actually, Figure 1-E rearrangesthe position of the points on the graph, but not therelationship of price to earnings. Thus, Figure 1-Epermits us to see that there is a good linearrelationship between P/B and E/B but that thepoints follow more closely a curved line (slightlyconcave upward, such as the roughly drawn bro-ken line shown) than the solid straight line. Thiscurved line does not appear when P is plottedagainst E, but is significant in indicating that theP/B to E/B relationship is slightly exponential. Thisshould have been expected since P/B is the productof E/B X P/E and P/E has already been shown tobear a modest statistical relationship to E/B andeven to (E/Bf.
Figure 1-F shows that the influence of the paidout (dividend) portion of earnings bears a goodrelationship to price and that the relationship ap-pears to be linear. This linearity is to be expectedsince "paid out" earnings have no influence ongrowth. It is the retained portion of earningswhich cause growth—not the paid out portion.
Figures 2-A and 2-B reveal that earnings anddividends tend to control the ratio of price to bookvalue in individual years, 1949 in this case, as wellas over a span of years.
Figures 2-C and 2-D show clearly the strongpotency of profitability in determining the growthof earnings and of book value. The sharp decline inreturn on equity in the 1949-62 period preventedactual earnings growth rates from equaling thoseof book value. The growth in book value correlatesextremely well with the growth formula:**
Annual growth rate ^(1 - payout) X (Return on equity)
This formula says, for example, that if a com-pany earned 16 percent on equity and paid outone-fourth of these earnings as dividends, bookvalue would rise by the remaining 12 percent. Thiswould permit a theoretical increase in earnings of12 percent if the company could reinvest the re-tained earnings at the same 16 percent rate onequity.
Figure 3 shows the individual records of eachof 30 DJIA stocks for the years 1949-62. Thegraphs are plotted on a logarithmic scale. The price
to book ratio is shown as a heavy line, profitabilityas a light line, and the P/E ratio as a dotted line. Onlogarithmic paper, the P/B line is the sum of theheights of the P/E and E/B lines, less two cyclesbecause E/B is expressed as a percentage ratherthan a decimal figure. The number at the bottom ofeach company chart is the average dividend pay-out ratio. The companies are identified by theirNew York Stock Exchange symbols. The stocks areplaced in the order of their average E/B, startingwith the highest, GM, at the left top chart andreading to the right.
Out of this jungle of apparently aimless lines a
few patterns can be discerned by the ir\dustriousreader:
1. Ignoring for the moment the fluctuations ofindividual years, a glance across the 30figures will show a generally declining pat-tern of average P/E and P/B ratios as thelevel of profitability declines.
2. The trends generally were downward forE/B and, happily, upward for P/E and P/Bfrom 1949 to 1962.
3. The counter movement was especiallyvivid for the more cyclic companies.
Rgure 3. Thirty Dow-Jones Industrial Average Stocks, 1949-1962
40.0
20.0
10.0
5.0
2.0
1.0
0.5
40.0
20.0
10.0
5.0
2.0
1.0
0.5
40.0
20.0
10.0
5.0
2,0
1.0
0.5.
GM
65
SD
44
BS
62
DD
78
G E .••
OI
C
63
UA ,
AC
64
UK
70
GT
68
Payout (%)
E/BP/EP/B
66
57
X
'57
1955-1964Rgure 3. Thirty DownJones Industrial Average Stocks, 1949-1962
40.0
20, tl
10.0
5.0
2.0
1.0
0.5
40.0
20.0
10.0
5.0
2.0
1.0
0340.0
20.0
10.0
5.0
2.0
1.0
0.5,
GF
54
EK
56
PG
58 53
TX
37
AT
62
IP JM
64
AGD
63
AA
A./ ; \
41
wx .. T
71
HR
60
A
67
swx
V
79
Payout (%)
E/BP/EP/B
1955-1964
good examples of stocks on a constant P/Bline, near the liquidation level. Certainother stocks followed constant P/B lineswhich were probably related to the hope-fully better earnings which might exist in amore obliging environment. The P/B ratioof all of these stocks failed to participate inthe general upward trend of P/B ratios.
5. The P/E ratio and the resulting P/B ratiowere depressed by earnings instability andlow payout and elevated by stable earningsand high payout.
6. The twelve stocks with the best growth inearnings per share (See Table 1) were allfound to be among the top 15 in profitabil-ity.
7. The stocks having the least earnings stabil-ity were largely found in the least profitablegroup.
8. Certain stocks consistently sold at muchlower or higher prices than could be ex-plained by Figure 3 or by statistical analysisof the factors in Table 1. Examples areTexaco, Standard Oil of California andGeneral Motors among the apparentlycheap stocks, and Alliecl Chemical, Alcoaand Westinghouse among those over-priced.
9. The ratio of price to book value movedmore slowly than P/E or E/B, revealing inan orderly manner the market's changingappraisal of the value of each company'sequity.
The final figure (Figure 4) shows the action ofP/E and E/B as indexes relative to the comparableDJIA ratios. The P/B index is not shown, but itstrends and variations can be approximated byvisualizing a line half way between the P/E and theP/B indexes.
Figure 4 shows clearly that stocks which "beatthe Dow" in profitability level also beat the Dow inprice/earnings ratios.
1. The counter movement continued to ap-pear even after the influence of the marketwas removed. GM is a marvelous "mirrorimage"!
2. The price/earnings index of the more prof-itable stocks generally had an upwardtrend, while the P/E trend of the less fortu-nate stocks was unfavorable. This probablyreflected the increasing emphasis on"growth" stocks in the latter years of theperiod studied.
3. High volatility and low payout tended toreduce the level of the price/earnings in-dex.
4. Comparison of Figures 3 and 4 shows thatthe market influences strongly both price/earnings ratio and price to book ratios.
CONCLUSIONThis study of the 30 DJIA stocks hardly providesthe reader with the sort of news which impels himto run, shouting, into the board room. Most of theresults were known or expectable through thereader's experience or intuition.
Yet, throughout the study, profitability shinesforth as a clear beam of light, leading the way tothe price paid for equity assets. Retum on equityappears as a direct influence on the price/earrungsratio, re-emerges as a major cause of growth and isseen in a consistent pattern with earnings stability.Even payout is controlled by expectations of prof-itability.
The counter movement and the "U" charac-teristics guide us in understanding why there is noneat linearity between P/E and E/B. We have alsoseen that growth and earnings instability causeexponential rather than linear relationships. Hope-fully, we can now grasp the dangers of a simplisticapproach to earnings capitalizers and price to bookratios. The approach to price must consider theinterplay between the multiplier and profitabilityin the light of the counter movement, the "U"characteristic and other non-linear ingredients.
There are obvious advantages to a systemwhich could appraise all stocks in terms of amultiple of equity assets—that is, a ratio of under-lying market worth to book value—as opposed tothe currently popular system of valuing stocks interms of earnings per share in some cases andequity assets in others. Since the basic earningpower of a company can be expressed in terms ofreturn on equity, there is no reason why analystscannot, if they wish, reorient their approach to-ward a unified system based on price to bookn^ultipliers rather than earnings multipliers. Anasset approach need in no way inhibit the conceptof discounting future values, and has the specialadvantage of forcing the analyst to study the assetneeds of growth—a sadly neglected art. An assetvaluation approach would also provide, automat-ically, for the counter movement and the "U"characteristic. We submit that the P/B formula is abasis for such a system.
Finally, we have reviewed the DJIA in somedetail. To the degree that (1) the structure of our
economy, (2) the political and social environment,and (3) the course of international affairs havechanged, we can expect the stock market to changefrom what it has been in the past. Though thefuture will not re-enact the past, the stock market
will remain wedded to the fundamental elementsof stock values. The emphasis on each element willsurely change, but the elements will remain tiedtogether in the same structural relationship whichwe have discussed.
Financial Analysts Joumal / January-February 1995
1955-1964
FOOTNOTES
1. F.E. Block, "The Place of Book Value in Common Stock 3. See S.F. Nicholson, "Price-Earnings Ratios," Financial Ana-Evaluation," financial Analysts Journal (March/April 1964): lysts Journal (July/August 1960):43-45.29-33. 4. M. Kisor, Jr., "The Financial Aspects of Growth," Financial
2. N. Moiodovsky, "A Theory of Price-Earnings RaHos," The Analysts Journal (March/April 1964):46-51.Analysts journal (November 1953):65-80.


![· 26 fd.n. 63 27 in. 63 29 63 30 ffn. 63 30 in. 63 30 ffn. 63 31 fJ.n. 63 01 111.8. 63 02 63 04 gxJ.tJ. 63 63 08 63 08 63 10 111.8. 63 11 63 08 63 19 f].n. 63 25 fin. 63 25 ffn.](https://static.documents.pub/doc/80x56/60108244c72a76533f3ba5ab/26-fdn-63-27-in-63-29-63-30-ffn-63-30-in-63-30-ffn-63-31-fjn-63-01-1118.jpg)


