Blood Smear Malarial Parasite Detection Austin Zheng Department of Electrical Engineering Stanford University [email protected]I. I NTRODUCTION Malaria, a blood-borne disease transmitted by mosquitoes, involves the infection of red blood cells in humans and other organisms by protists of the genus Plasmodium. Current state of the art for medical diagnosis and research purposes involves drawing a blood sample from a patient or research subject. This blood sample is smeared onto a slide and stained in order to color cell nuclei. Because mature red blood cells do not possess nuclei, the stain only strongly marks malarial parasites. The slide can then be examined under a microscope in order to count the number of infected red blood cells. Figure 1 presents an example micrograph. Fig. 1. Example image A red blood cell is considered infected if at least one parasite can be detected within its interior. White blood cells and free-floating parasites are not considered. The current state of the art involves manual counting by a laboratory technician or other individual, who can distinguish staining artifacts from actual nuclei, white blood cells, and (depending on specific requirements) life cycle and species of malarial parasites [1]. Although manual counting is relatively inexpensive to implement, adequate sensitivity requires proper training and supervision of technicians. This poses problems for both medical care providers in impoverished regions of the world as well as laboratory settings which may benefit from automation of a tedious and time-consuming task [2]. Conceivably, automation of this task could both facilitate laboratory efficiency as well as provide an alternative diagnostic tool in conjunction with mobile phone based microscopy in developing countries [3]. This paper describes a basic image processing pipeline implemented in MATLAB which detects Plasmodium falciparum parasites within a micrograph of a blood smear slide and attempts to determine which red blood cells in an image are infected. Efficacy of this pipeline is demonstrated, and a number of potential improvements and directions for further development are discussed. II. PREPROCESSING Blood smear micrographs (see Figure 1) are first transformed into the hue-saturation-value (HSV) color space using the rgb2hsv function. This transforms a standard red-green-blue image (such as those obtained from digital cameras) into a three-dimensional vector whose dimensions correspond to the hue (H), saturation (S), and value (V) of each pixel in the image (Figure 2). Fig. 2. HSV color space image Two masks are created from the V component of the image, which is relatively insensitive to the presence or absence of purple stain areas. The V component is subjected to histogram equalization (histeq). Histogram equalization tends to ‘spread out’ the range of grayscale values comprising an image and provides a form of normalization that allows both edges and nuclei to be more easily thresholded across differently lit images. Because the interiors of red blood cells are significantly darker than the surrounding background Otsu thresholding is carried out in order to create an area mask which determines whether or not a particular region of the image lies within a red blood cell (Figure 3). It is possible to exploit optical artifacts in the V component by conducting thresholding on a band of values (for histogram-equalized images, between around 0.6 and 0.7)
Malaria, a blood-borne disease transmitted by mosquitoes,involves the infection of red blood cells in humans and otherorganisms by protists of the genus Plasmodium. Currentstate of the art for medical diagnosis and research purposesinvolves drawing a blood sample from a patient or researchsubject. This blood sample is smeared onto a slide and stainedin order to color cell nuclei. Because mature red blood cellsdo not possess nuclei, the stain only strongly marks malarialparasites. The slide can then be examined under a microscopein order to count the number of infected red blood cells.Figure 1 presents an example micrograph.
Fig. 1. Example image
A red blood cell is considered infected if at least oneparasite can be detected within its interior. White bloodcells and free-floating parasites are not considered. Thecurrent state of the art involves manual counting by alaboratory technician or other individual, who can distinguishstaining artifacts from actual nuclei, white blood cells, and(depending on specific requirements) life cycle and species ofmalarial parasites [1]. Although manual counting is relativelyinexpensive to implement, adequate sensitivity requires propertraining and supervision of technicians. This poses problemsfor both medical care providers in impoverished regions ofthe world as well as laboratory settings which may benefitfrom automation of a tedious and time-consuming task [2].Conceivably, automation of this task could both facilitatelaboratory efficiency as well as provide an alternativediagnostic tool in conjunction with mobile phone basedmicroscopy in developing countries [3].
This paper describes a basic image processing pipeline
implemented in MATLAB which detects Plasmodiumfalciparum parasites within a micrograph of a blood smearslide and attempts to determine which red blood cells in animage are infected. Efficacy of this pipeline is demonstrated,and a number of potential improvements and directions forfurther development are discussed.
II. PREPROCESSING
Blood smear micrographs (see Figure 1) are firsttransformed into the hue-saturation-value (HSV) colorspace using the rgb2hsv function. This transforms astandard red-green-blue image (such as those obtained fromdigital cameras) into a three-dimensional vector whosedimensions correspond to the hue (H), saturation (S), andvalue (V) of each pixel in the image (Figure 2).
Fig. 2. HSV color space image
Two masks are created from the V component of theimage, which is relatively insensitive to the presence orabsence of purple stain areas. The V component is subjectedto histogram equalization (histeq). Histogram equalizationtends to ‘spread out’ the range of grayscale values comprisingan image and provides a form of normalization that allowsboth edges and nuclei to be more easily thresholded acrossdifferently lit images. Because the interiors of red blood cellsare significantly darker than the surrounding background Otsuthresholding is carried out in order to create an area maskwhich determines whether or not a particular region of theimage lies within a red blood cell (Figure 3).
It is possible to exploit optical artifacts in the V componentby conducting thresholding on a band of values (forhistogram-equalized images, between around 0.6 and 0.7)
Fig. 3. RBC area mask
to produce a reasonable approximation of the edges of thecells (Figure 4). This outline mask is then subjected toCanny edge detection [4] to create an edge map comprised ofsingle-pixel edges (Figure 5). It is also possible, dependingon the characteristics of the map, to perform morphologicaldilation and erosion on the area mask to create this outline. Aparticularly complex example is provided in Figures 6 and 7.In this example it is conceivable that morphological erosioncould be carried out on the area mask and then appliedto the edge mask in order to create a significantly cleaneredge mask devoid of the ‘noise’ beyond the edges of the cells.
Fig. 4. RBC outline mask
Fig. 5. Edge detection (portion)
III. PARASITE CANDIDATE DETECTION
The H and S components are used to detect and differentiateregions which have been stained (including candidate parasite
Fig. 6. Poor-quality area mask
Fig. 7. Edge mask
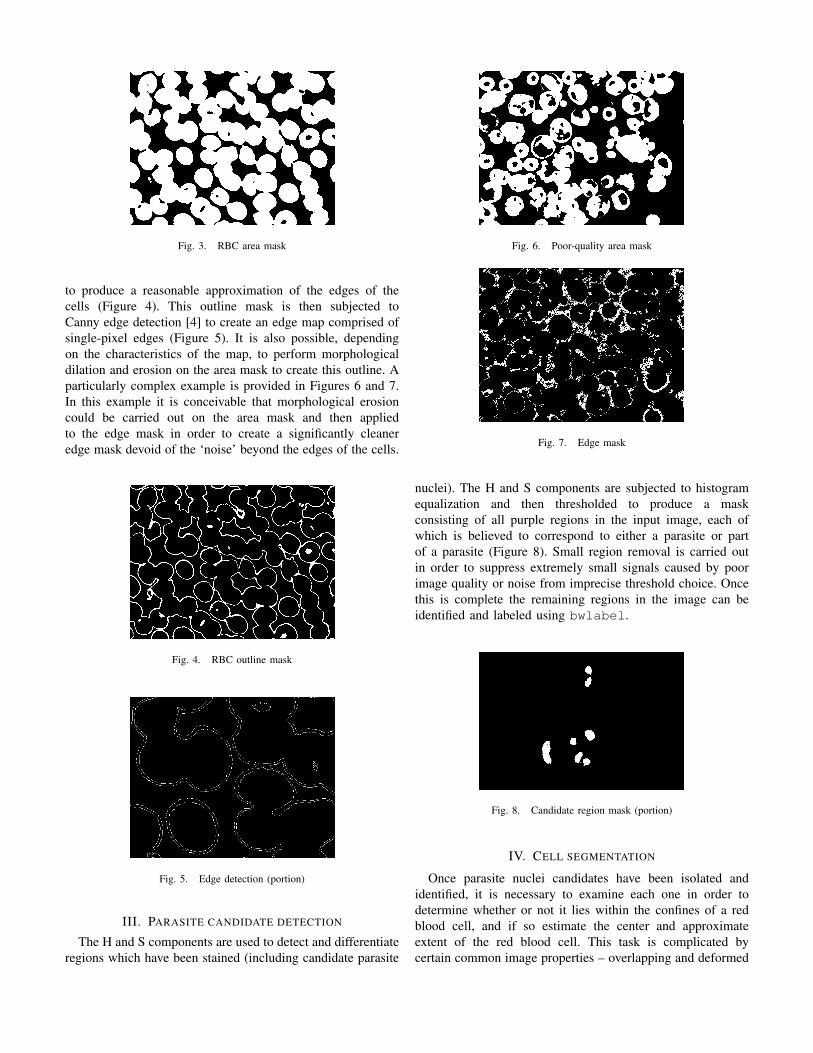
nuclei). The H and S components are subjected to histogramequalization and then thresholded to produce a maskconsisting of all purple regions in the input image, each ofwhich is believed to correspond to either a parasite or partof a parasite (Figure 8). Small region removal is carried outin order to suppress extremely small signals caused by poorimage quality or noise from imprecise threshold choice. Oncethis is complete the remaining regions in the image can beidentified and labeled using bwlabel.
Fig. 8. Candidate region mask (portion)
IV. CELL SEGMENTATION
Once parasite nuclei candidates have been isolated andidentified, it is necessary to examine each one in order todetermine whether or not it lies within the confines of a redblood cell, and if so estimate the center and approximateextent of the red blood cell. This task is complicated bycertain common image properties – overlapping and deformed
blood cells, low contrast, and blur from poor focusing.
Cell segmentation is accomplished by examining a‘window’ surrounding each parasite nuclei candidate. Thiswindow comprises a 500 pixel by 500 pixel area surroundingthe centroid of the nuclei region on the candidate mask. Celloutline and cell area masks corresponding to this windoware obtained and used to determine whether blood cells existwithin the window region and whether or not the parasitecandidate in question lies within a red blood cell.
Six ring-shaped masks of progressively larger radius are‘slid’ across the outline mask in order to detect circularregions, including incomplete regions corresponding to cellswhich are overlapping, partially outside the window region, ormisshapen. This results in a number of line segments whichare then labeled and categorized using regionprops. Linesegments whose length is computed to be greater than 20%of the average circumference of the mask are consideredpotential candidates for the edge of a red blood cell; linesegments are weighed according to the proportion of theirlength to the average circumference in order to place greateremphasis on longer, continuous line segments. The weighedsum of all candidate line segment lengths is then calculated;if this value exceeds a threshold based on the circumferenceof the mask a circle (and by extension, a red blood cell) isconsidered to have been detected and the current coordinatesare stored. The RBC area mask for the window is alsochecked; proposed circles which do not lie within a darkgreen region are considered spurious and rejected. Figure 9demonstrates an appplication of this algorithm to a portion ofthe edge map shown in Figure 5.
Fig. 9. Sample window region, with estimated cell locations and radii
A number of parameters affect the effectiveness of thecircle detection algorithm. An increased difference betweenthe inner and outer radii of the mask allows for improveddetection of ovoid and deformed cells, but also results inincreased sensitivity to spurious line segments and ‘prematuredetection’ (fitting a smaller circle to an outline where a
larger circle might have more accurately reflected the size ofthe red blood cell). The line segment length sum thresholdalso reflects a trade-off between detecting circles withpoorly-defined edges (for instance, circles which overlap) andspurious fitting. Finally, weighting of candidate line segmentsreflects a balance between ‘rewarding’ longer line segmentsas being more likely to signify an actual cell edge while stillbeing capable of detecting cells whose edges are comprisedof several shorter line segments.
Once cell segmentation has been carried out for all nucleicandidate regions the cell radius and center coordinateinformation can be used to both count the number of infectedred blood cells and plot candidate cell locations onto theoriginal image for further examination. A post-processingstep not currently implemented calculates the distance ofcandidate locations and attempts to consolidate close-by cellcandidates into clusters; each cluster is then ‘consolidated’into a single cell for counting and analysis purposes.
V. RESULTS
The image processing pipeline was applied to five testimages. Candidate nuclei within 250 pixels of the edge ofthe image were intentionally ignored due to time constraintsand limitations with the test harness. These images werechosen due to their lack of visual noise (red blood cells areevenly colored, no background artifacts) in order to carry outa baseline performance evaluation and identify strengths andweaknesses in the pipeline.
Test images 2 and 3 exhibit the highest performance. Testimage 2 (Figure 11) demonstrates the identification of fourred blood cells containing parasites and estimates a boundaryfor each of the cells. These boundaries fall into four distinctclusters, which could be correlated through further analysis(consolidating cells with very close centers together). In testimage 3 (Figure 12), seven cells containing parasite nucleiare identified, and the borders of the predicted red blood cellsare clearly delineated.
Test images 1 (Figure 10) and 4 (Figure 13) demonstratesseveral limitations of the system as it currently exists. Testimage 1 is dominated by parasites in the schizont stage,which appear as round purple clusters containing manydark purple spots. Each of the spots within the schizont iscurrently detected as a separate candidate and analyzed assuch. The three schizonts in the middle of the image areclearly detected, but a large number of spurious detectionscharacterize both these three schizonts and the fourth one tothe upper right. These spurious detections are caused whencell segmentation is carried out on some of the schizont spotsnear the edge of the cluster. Test image 4 exhibits similarissues with schizont detection, exhibiting two high accuracydetections of schizonts and a large number of close-by
spurious signals.
Test image 5 (Figure 14) poses significant complicationsfor detection, as a large number of red blood cells areclumped together and edges between adjacent cells areindistinct to nonexistent. There are three strong infected cellcorrelations, one strong correlation with a spurious stain (dueto insufficient candidate processing), and a number of highlyimprecise detections which could not properly characterizethe cell within which a parasite resided. Finally, of particularnote are the two candidates near the lower right sectionof the image. Both these candidates lie within a group ofcells which touch in multiple places and have no visibleinternal edges to aid with cell segmentation. These candidatesdemonstrate the weakness of an approach (such as this one)which exclusively tries to fit parasite candidates into bloodcells without additional heuristics.
Fig. 10. Image 1, categorized
Fig. 11. Image 2, categorized
VI. FURTHER WORK
A. Automatic selection of parameters
The image processing pipeline currently depends on anumber of hand-selected parameters, most of which are usedfor thresholding HSV images or the circle detection algorithm.These values were chosen based on empirical performancein order to produce acceptable results with the set of testimages, and may or may not be valid for a different batch of
Fig. 12. Image 3, categorized
Fig. 13. Image 4, categorized
blood smear slides taken under differing lighting conditions.Further work should be conducted into determining algorithmsto adaptively adjust these values with minimal user input.
B. Parasite candidate mask processing
Currently no processing is carried out on the parasitecandidate mask except for small region removal in order tosuppress image noise. A significant opportunity exists to carryout analysis on the parasite regions and perform consolidationin order to increase accuracy and reduce noise. In particular,parasites in the schizont life stage exhibit a large number ofdark round stains clustered into a roughly circular or ellipsoidarea colored a lighter purple, while ring stage parasites arecharacterized by the presence of a faint purple ring surround-ing the nucleus. It should be feasible to use two differentcandidate masks, one more selective than the other, in orderto combine related candidate regions into single candidates.This would significantly reduce redundant work (in particular,circle detection on candidate regions which are part of thesame malaria parasite) and allow for different cell detectionstrategies to be applied based on the type of the parasite.
C. Circle detection and heuristics
The circle detection algorithm currently uses only a veryrudimentary set of heuristics in order to determine whetherthe line segments contained within the ring-shaped maskcomprise the outline of a cell. There is significant opportunityfor improving the methods used to discern valid and invalidline segments. An example may be estimating the curvature
Fig. 14. Image 5, categorized
of a particular line segment by calculating the distance ofvarious points along its length from the mask center, orattempting to detect the sharp ‘points’ in an outline formedwhen two circles overlap.
Furthermore, in some cases it may be impractical or impos-sible to extract an outline for a particular group of adjacentcells due to poor edge differentiation. In this case alternativeheuristics may be necessary in order to identify or countinfected red blood cells in the ‘blob’. At the very least, thepipeline should be able to identify such trouble spots and flagthem for human examination.
D. Preprocessing
The images used for testing the processing pipeline werechosen due to low levels of visual noise. Visual noise includesfaint ‘background’ red blood cells which cannot easily bedistinguished from the background through Otsu thresholdingalone, as well as dark regions within red blood cells caused bytheir characteristic shape. Visual noise results in large portionsof the area and outline masks which degrades performance.It may be necessary to further characterize and mitigate thisnoise in order to ensure robust performance.
E. Performance
At the present time processing a single blood smear imagerequires anywhere from thirty seconds to multiple minutesuntil completion. This is due mostly to the sliding maskcircle detection algorithm used to attempt to fit circles to theoutline mask. Improvements in parasite mask processing andcircle detection, described above, as well as refactoring ofexisting MATLAB code should greatly decrease the amountof time required to process a single image.
VII. CONCLUSION
A preliminary image processing pipeline for detectingmalarial parasites within red blood cells was developed, andits capabilities and limitations were characterized. Althoughthe pipeline exhibits basic functionality, further work isnecessary in order to improve robustness to the point whereit can be usefully applied to a wide variety of images. A
number of areas of potential improvement were identified,and will provide guidance as development continues. Thecurrent pipeline provides a useful framework which can berefined and extended in order to improve accuracy, toleranceof image noise, and further capabilities.
ACKNOWLEDGMENT
The author would like to thank Hao Li of BogyoLab at the Stanford University School of Medicine forproviding the impetus for this project and the blood smearimages. The author also wishes to express his gratitude andappreciation to his project advisor Vijay Chandrasekhar andcourse teaching assistant David Chen for their support andadvice, as well as Professor Bernd Girod for teaching EE 368.
The author would also like to acknowledge the useof MATLAB code by Peter Bone (”Draw a circle in amatrix/image”) and Zhenhai Wang (”Draw a circle.”),obtained from MathWork’s MATLAB Central web site, fordrawing circles into matrices and upon graphs.
REFERENCES
[1] D.C. Warhurst, J.E. Williams, Laboratory diagnosis of malaria, ACPBroadsheet No 148, 1996.
[2] P. Guerin, P. Olliaro, F. Nosten, P. Druilhe, R. Laxminarayan, F. Binka,W. Kilama, N. Ford, N. J. White, Malaria: current status of control, di-agnosis, treatment, and a proposed agenda for research and development,The Lancet, Infectous Diseases vol 2, p. 566, 2002.
[3] Breslauer DN, Maamari RN, Switz NA, Lam WA, Fletcher DA (2009)Mobile Phone Based Clinical Microscopy for Global Health Applications.PLoS ONE 4(7): e6320. doi:10.1371/journal.pone.0006320
[4] T. Nattkemper, W. Schubert, T. Hermann, H. Ritter, A hybrid system forcell detection in digital micrographs, 2004.