+ All Categories
Home > Documents > ~BLOOD UREA NITROGEN LEVELS OF WHITE-TAILED DEER/ AS …

~BLOOD UREA NITROGEN LEVELS OF WHITE-TAILED DEER/ AS …

Date post: 25-Mar-2022
Category:
Upload: others
View: 4 times
Download: 0 times
Share this document with a friend
57
UREA NITROGEN LEVELS OF WHITE-TAILED DEER/ AS AN INDEX OF CONDITION AND NUTRITIONAL INTAKE by Donald Eugene Thesis submitted to the Graduate Faculty of the Virginia Polytechnic Institute and State University in partial fulfillment of the requirements for the degree of APPROVED: MASTER OF SCIENCE in Wildlife Management P. F. Scanlon July, 1974 Blacksburg, Virginia 24061
Transcript

~BLOOD UREA NITROGEN LEVELS OF WHITE-TAILED DEER/ AS AN INDEX OF CONDITION AND NUTRITIONAL INTAKE

by

Donald Eugene ~Buckland1t

Thesis submitted to the Graduate Faculty of the

Virginia Polytechnic Institute and State University

in partial fulfillment of the requirements for the degree of

APPROVED:

MASTER OF SCIENCE

in

Wildlife Management

P. F. Scanlon

July, 1974 Blacksburg, Virginia 24061

LD ...5"55 V%55 /974

133;< c.::L.

ACKNOWLEDGEMENTS

I would like to express sincere appreciation to all members

of my graduate committee for their guidance and helpful suggestions

during the course of my study. Dr. Roy L. Kirkpatrick, committee

chairman, provided invaluable advice, supervision, and encourage­

ment throughout the study. Dr. Henry S. Mosby is thanked for

his willingness to advise and make recommendations regardless

of his always heavy workload. Thanks are extended to Dr. Patrick

F. Scanlon for his interest shown and his advice given. Recognition

is also due Dr. Harold E. Burkhart who, although not a committee

member, provided statistical counseling when needed.

I am ful to the Southeastern Cooperative Wildlife

Disease Study group for providing serum samples from wild deer.

I would also like to thank the Virginia Commission of Game and

Inland Fisheries and the Radford Army Ammunition Plant personnel

for their help in obtaining fawns.

Special thanks are offered to Wes Abler who used the same

fawns in his project and who devoted many hours of his time in

fawns. Thanks are also extended to the

following graduate students who helped in collecting blood samples

and caring for fawns; Edward Reed, Ralph Mirarchi, Bob Zepp,

Mack Walls, Joe Lint, John Estep, Tom Jones, and several others.

Appreciation is extended to Wanda Morehead for her technical

assistance in analysis of blood samples.

ii

iii

I am grateful to the Division of Forestry and Wildlife for

providing financial assistance during my graduate study and the

Virginia Cooperative Wildlife Research Unit for incurring many

of the incidental costs created by the captive fawn project •

.., Finally, I would like to thank my fiancee, Nancy St. Clair

for her typing the many drafts of my thesis, and for her

patience, understanding, and encouragement during the latter

part of my graduate career.

TABLE OF CONTENTS

ACKNO'WLEDGE:MENTS. • • • • • • • • • • • • • • • • • • • • • • • • • • • • • • • • • • • • • • • • • ii

TABLE OF CONTENTS... • • • • • • • • • • • • • • • • • • • • • • • • • • • • • • • • • • • • • • i v

LIS T OF TABLES............................................ vi

INTRODUCTION ••• • • • • • • • • • • • • • • • • • • • • • • • • • • • • • • • • 0 •••••••••• 1 ,

LI TERA.TURE REVIEW •••••••••••• Q • • • • • • • • • • • • • • • • • • • • • • • • • • • • 3

Physiological Indices................................ 1

Blood Urea Nitrogen.................................. 7

Metabolic Pathways Leading to Urea Synthesis ••••••••• 10

Ruminants. • •• • • • • • • • • • • • • • • • • • • • • • • • • • • • • • • • • • • • 10

Nonruminants ••.....•.•..•.•......••••.•..•..•..• 11

MATERIALS AND IvIETHODS..................................... 13

Capti ve Dee r. • • • • • • • • • • • • • • • • • • • • • • • • • • • • • • • • • • • • • • • • 13

Fawn Procurement ••••• 13

Experimental Design •••••.••••.•••.••..•....••..• 13

Food Consumption .••.••.•.••••••.••.••.•••.•.•.•• 20

Sampling and Weighing ••••••••••••...•.....•..••• 20

BUN Analysis •••••••• 21

Data Analysis •• 21

Wild Deer............................................ 23

B UN A n a 1 y sis • • • • • • • • • • • • • • • • • • • • • • .............. 24

Data Analysis •••••• . . . . . . . . . . . . . . . . . . . . . . . . . . . . . 24

RES'ULTS • 0 • • • • • • • • • • • • • • • • • • • • • • • • • • • • • • • • • • • • • • • • • • • • • • • • • 25

Captive Deer......................................... 25

Food Consumption •••..••.•••••••.•••••..•.••••.•• 25

iv

v

Weight Gains •••••••

Page

25

BUN Va lues. . • . • • . . . . . . • . . . . • • . . . • . • . • . . • • . . • . . . . . •. 25

Wild Deer............................................... 29

DISCUSSION AND CONCLUSIONS ••••••••••••••.•••••••••••••••.•••• 36

REFERENCES CITED............................................. 44

VITA ••••.•...••.••••..••••••••••.••.•.•.•..• 0 • • • • • • • • • • • • • • •• 48

Table

1

2

3

4

5

6

7

8

9

10

11

12

LIST OF TABLES

Formulation of original rations fed to captive fawns ••••••••••• o ••••••••••••••••••••••••••••••• 15

Formulation of final rations fed to captive fawns... ••....•••. •.••••....• .••••..••••••.•••.• 17

Proximate analysis and calculated energy values for original rations ••••••••••••••••••••••.•••• 18

Proximate analysis and calculated energy values for final rations •••••••••••••••••••••••••••••• 19

Average food consumption (kg/deer/day) of captive fawns on experimental rations ••••.••••••••••••• 26

Mean weight gains (kg) of captive fawns on experimental rations for a 20 week period •••••••

Mean squares from the analysis of variance of weight gains for captive deer ••••••••••••••••••

BUN means (mg/IOO ml) of 19 captive fawns on experimental rations for a 20 week period ••.••••

Mean square from the analysis of variance of BUN values for captive deer ••••••••••••••••••••

Seasonal means of BUN values (mg/IOO ml) for deer collected from selected areas of the Southeast,

27

28

30

31

1967-70... ••. ••... ••.... •.• •••.. •.••....•...•..• 32

Mean squares of BUN values for deer collected from selected areas of the Southeast, 1967-70 •••

Partial correlation coefficients, by season, between BUN values and several other variables of deer collected from selected areas of the

33

Southeast, 1967-70.............................. 35

vi

INTRODUCTION

The classical objective of wildlife managers is to provide

the public with the maximum number of hours of outdoor recreation

by means of the wildlife resource without impairing that resource

for future usea A biologist is continually concerned with the

deterioration of wildlife populations and habitats. However,

to evaluate populations and habitats from quantitative view is

not sufficient; the quality or condition must also be evaluated

if managers are to achieve their long-run objective. Any

technique that would assist biologists in both quantitative and

qualitative evaluations could further elucidate ecological­

nutritional relationships and could help assure that neither

wildlife populations nor habitat would be seriously impaired for

future use.

Any reproducible structural or biochemical measurement that

can be taken from an animal so that the results of such measure­

ments can be related to the relative condition of the animal, the

surrounding environment, or preferably both may be called a

"physiological index. 1f Most of the indices thus far developed

have had the disadvantage of either being too subjective or

requiring dead or dying animals. There is great need of such

indices for the white-tailed deer (Odocoileus virginianus). The

white-tailed deer has become one of the most popular game species

in the United States, particularly in the Southeast. Populations

1

2

are increasing, interactions between humans and deer are intensifying,

hunter pressure is increasing, and the demand for quantity and

quality of animals is increasing.

An ideal index should be one that could be measured without

injury to the animal. Blood parameters would seem to be logical

measurements since deer could be immobilized (usually by remote

injection of drugs) or live-trapped and released unharmed after

drawing a blood sample. However, the problem with many blood

parameters is their extreme variability and inconsistency. Blood

urea nitrogen (BUN) levels seem to be a reasonably stable parameter

for use as a physiological index.

The specific objectives of the present study were (1) to

determine if BUN levels in white-tailed deer collected from

several areas of the Southeast could be related to body weight,

season, sex, age, subjective measurements of condition, and

proximate analysis of rumen contents, and (2) to determine the

influence of protein and energy levels on BUN values of captive

deer.

LITERATURE REVIEW

Physiological Indices

Bailey (1969) compiled information on the use of rumino­

reticular contents and blood constituents as measures of

nutritional condition in deer. Twenty-one characteristics from

23 studies were examined. Deer in these studies were arbitrarily

classified by Bailey (ibid.) into condition categories of either

good, normal, or poor. Most of the measurements, when compared

between studies, had extreme variation and lacked the sensitivity

to differentiate between animals in the condition classes. This

seemed especially true of such characteristics as erythocyte counts,

packed cell volume, hemoglobin, blood glucose, serum proteins,

and other serum biochemical and hematological values which are

prone to change because of excitement, muscular activity, endocrine

responses, or other reactions caused by environmental stressors.

Klein (1962) used Sitka deer (Odocoileus hemious sitkensis)

rumen content analyses to test known differences in the range

quality (determined by the forage analyses) between two islands

in Alaska. Nitrogen percentage of rumen contents was significantly

different between the two islands in three of four age groups

tested and crude fiber percentages were significantly different

in two of two age groups tested. It was concluded that rumen

content analysis could be employed for evaluation of forage and

range quality of wild ruminants. Bruggemann et al. (1968) also

3

concluded that rumen content analyses could be used to provide

information on food selection and digestive processes.

Porterfield (1970) obtained serum from captive deer and

wild deer and performed serum lipid and protein analyses, but

failed to find sufficient evidence to support assessment of

nutritional status of the deer from serum lipid and protein levels.

Data from wild deer were analyzed by use of a stepwise mUltiple

regression technique. Body weight was chosen as the dependent

variable and independent variables were lipid fractions, protein

fractions, albumin/globulin ratio, sex, age, condition index, and

season. Data from captive deer were similarly analyzed except

that mean weekly food consumption was the dependent variable. All

independent variables remained the same except lipid fractions

were excluded.

An index for assessment of nutritional status of the Columbian

black-tailed deer (Odocoileus hemious columbianus) was developed

by Bandy et al. (1956). Body weight was predicted first from

heart girth and then body weight was predicted from hind foot

length and a comparison of ratios of the two body weight estimates

was made for individual deer. This index was based on the

contention that skeletal growth and hind foot length, once attained,

are not influenced as much as heart girth is by nutritional levels.

Bandy et ale (ibid.) noted that even if the animal was on a low

plane of nutrition, the heart girth would be influenced to a

greater relative extent than would skeletal measurements. An

5

index value of 1 supposedly indicated a "normal" animal. A value

less than 1 indicated poor condition, and a value greater than 1

indicated excellent condition.

Klein (1964) measured body weights, and femur and hind foot

lengths from Sitka deer from two islands in Alaska, one of which

had been shown previously by Klein (1962) to be higher quality

habitat. Significant differences between islands in femur/hind

foot ratios were found in three of four age groups. The author

felt that femur/hind foot ratios are not as influenced by genetics

as body weights and therefore are more reliable for evaluating

nutritional condition than body weights.

A very detailed paper by Riney (1955) described different

techniques for determining condition (total fat reserves) of red

deer (Cervus ---,---.;..' • The measurements used were kidney fat

index, back fat, abdominal fat, fat content and appearance of

bone marrow, girth measurement, body weight, and antler

characteristics. Data from 500 red deer showed kidney fat index

to be the most satisfactory for detecting deer of different

condition and from different environments.

Ransom (1965) plotted percent femur fat against a kidney fat

index for 34 female white-tailed deer of different ages. The

results showed that the kidney fat index could be used to assess

conditions when the kidney fat index value was 30 or above, but

where the index fell below 30, best evaluation could be achieved

using percent femur fat. The conclusion was that kidney fat

6

reserves are not completely exhausted in animals before the

initiation of femur fat mobilization and that kidney fat indices

should be used for fat deer and femur fat indices for deer in

poor condition. The fat content of tissue underlying the grinding

teeth of the mandible was examined by Baker and Lueth (1966) as a

possible index of condition. Moderate correlation coefficients

(0.396, 0.478, and 0.507) were found between mandibular cavity

tissue (MCT) fat content and femur fat, general condition class,

and weight, respectively. Means of HCT fat content segregated

deer with regard to poor and fair condition classes, but lacked

the sensitivity to differentiate well between fair and good

condition classes. The authors recommended further research to

investigate the deposition and usage of MCT fat, to elucidate

the mechanisms involved, and to improve the techniques and assays

required, before the index could be implemented as a management

tool.

Dauphine (1971) analyzed data from 411 barren-ground caribou

(Rangifer tarandus groenlandicus) to determine changes in their

physical condition. Condition was again used to mean total fat

reserves. The data collected included body weights, back fat,

abdominal fat, kidney fat, and fat content of femur marrow. The

author concluded that kidney fat and abdominal fat were effective

indices over the entire range of condition, but a better evaluation

of condition could be achieved if all four indices were examined

and evaluated collectively.

7

Two of the less scientific methods that have been used to

estimate condition of deer have been visual observations and antler

size. Riney (1960) described a subjective system for assessing

condition of ungulates. The technique was based on symptoms of

inanition e~1ibited by the animals and animals were classified by

visual observation into good, medium, or poor condition classes.

Antler size has long been used by sportsmen to reflect the "quality"

of deer, and in most cases antler size and growth of antlers are

indicators of nutritional intake (French et aI, 1956; Long et al.

1959). Neither of these measurements are considered to be reliable

indices of the nutritional status of deer because of individual

animal variation and the subjectiveness involved.

Blood Urea Nitrogen

No literature reviewed dealt directly with the use of blood

urea nitrogen (BUN) levels as an index of condition for deer and

deer habitat, but several authors have provided supporting evidence

that BUN levels could be used as a physiological index.

Lewis (1957) in his experiments with sheep, concluded that

BUN levels were dependent on the diet of the animal and that BUN

levels paralleled rumen ammonia levels after a delay of 4-8 hours.

Preston et ale (1965) conducted experiments to determine if BUN

levels could be related to protein intake in finishing lambs.

In all experiments, BUN was significantly increased by increasing

protein levels fed to lambs. Preston et al. (1961) in an earlier

experiment showed similar results for steer calves.

8

Four Jersey steers were used in a nitrogen depletion-repletion

experiment by Biddle and Evans (1973). The steers were placed on

three consecutive 4 week periods to standarize, to deplete, and

to replete body nitrogen. The protein level for the periods was

15, 5, and 14 percent, respectively. Plasma urea nitrogen levels

were significantly lower in the depletion period than in either

the standardization or repletion periods.

Ullrey et al. (1968) found BUN values to differ between

white-tailed deer fed balsam fir and those fed white-cedar. BUN

values for deer on the balsam fir diet decreased from pretreatment

values while BUN values for deer on the cedar diet increased.

Cedar has more crude protein than does balsam fir. Teeri (1958)

sampled fawns on a 16 percent crude protein diet and showed that

all fawns exhibited similar BUN values when on this diet.

Seal and Erickson (1969) tested differences in BUN values of

white-tailed deer of different sex and ages (adult male vs.

adult female vs. juvenile male vs. juvenile female) but found no

significant differences. Seal et ale (1972b) showed some seasonal

differences in BUN values, but the deer on the high diet consistently

exhibited higher BUN levels than did animals on the moderate diet.

The high diet consisted of white cedar browse, ad libitum,

supplemented with pelleted feed and the moderate diet consisted

of white cedar browse only.

Franzmann (1972) working with bighorn sheep (Ovis canadensis)

found the BUN values reflected protein intake. He also determined

9

that BUN values, unlike numerous other blood parameters, are not

significantly affected by excitement. Seal et ala (1972a) also

determined that BUN levels were significantly unaffected by

restraint or certain immobilizing drugs in the white-tailed deer.

The literature has not been limited entirely to ruminants

as work has been done also with monogastric animals. Fonnecbeck

and Symons (1969) tested the effects of diet on BUN levels in horses

and concluded that horses fed high protein diets had higher BUN

levels than those fed low protein diets. Eggum (1970) utilized

17 feeding experiments with rats to conclude that a direct

correlation existed between the protein content in the diet and

BUN levels. He also showed that, in pigs, BUN levels increased

for the first 3-4 hours after feeding and then reached a plateau.

Dror and Bondi (1969) calculated a cubic prediction equation

for BUN levels in rams based on protein as a percentage of the

theoretical requirement for maintenance. Preston et ala (1965)

calculated a prediction equation between BUN levels and protein

intake for lambs. The correlation coefficient (r) had a value of

0.99. Eggum (op. cit.) calculated an equation for the same

two variables in his study and found an r value of 0.95.

All of the above literature seems to substantiate that BUN

levels are somewhat predictive and could feasibly be used as an

index of animal or habitat condition for white-tailed deer.

10

Metabolic Pathways Leading to Urea Synthesis

A knowledge of protein metabolism, ammonia formation, and

urea formation, excretion and recycling is fundamental to the

understanding of BUN levels and pathways. The explanation

below was taken from information presented by Hungate (1966),

Allen (1970),Phillipson (1970),and Fontenot (1971).

Ruminants

Digestion breaks proteins into their basic building blocks,

amino acids. Digestion is accomplished by protease enzymes cleaving

peptide bonds of proteins to produce short-chained amino acids.

The fate of these amino acids is twofold: (1) either they are

absorbed through the rumen or lower gastro-intestinal (Gl) tract

(2) or they are subjected to the action of microbes present in the

rumen. The amino acids in the former case are transported to

deficient tissues and organs throughout the body via the systemic

circulation. Amino acids in the latter case may be used by the

microbial population for their own body protein or for energy

purposes. End products of their activities include carbon

dioxide, ammonia, and short-chained fatty acids. Ammonia is the

principal product when considering urea synthesis. Ammonia is

absorbed through the rumen wall where it enters the portal blood.

Most of the absorbed ammonia is transported to the liver and

converted to urea by the Krebs-Henseleit cycle. Urea levels may

be measured in the systemic circulation. Rumen microbes are

not able to synthesize and assimilate large amounts of dietary

11

protein into microbial protein, except when large amounts of

energy are also available. As a result, large amounts of

ammonia are produced when high levels of protein are digested.

These high levels of ammonia result in high levels of ammonia

in the systemic circulation. High energy levels would lower

the levels of BUN since the high level of energy would allow

the microbes to be more efficient in their utilization of

dietary protein and less ammonia would be produced and thus less

urea formed. An additional capability of ruminants is the

ability to recycle urea and to use it as a nitrogen source during

periods of low dietary protein intake. The urea that escapes

urinary excretion is either absorbed directly through the rumen

wall or is introduced into the rumen via saliva. Houpt (1959)

showed that urea was recycled and that energy sources had an

influence on recycling. Supplemental carbohydrates increased the

amount of urea recycled in sheep on a low protein diet when compared

to sheep on a low protein diet with no supplemental energy sources.

Systemic blood levels of urea would be lowered in animals which

were on low protein diets, not only because of low ammonia

production, but also possibly because of the amount of urea

removed by the recycling mechanism.

Nonruminants

Protein digestion in nonruminants is basically the same

process as for ruminants except that all absorption of free

amino acids occurs through the small intestine and lower in the

12

GI tract. Amino acids in excess of the body requirements are

catabolized for energy by the liver with an end product of

ammonia. The resulting ammonia is converted to urea in the

liver by the Krebs-Henseleit cycle and excreted in the urine

by the kidney. BUN levels are also detectable in nonruminants.

MATERIALS AND METHODS

Captive Deer

Fawn Procurement

Twelve female fawns were captured at the Radford Army

Ammunition Plant near Radford, Virginia during the spring of

1973 using the method described by Downing and McGinnes (1969).

Twelve additional female fawns were obtained from the Virginia

Commission of Game and Inland Fisheries and were from various

regions of the state. Five additional female fawns were born

to captive does in the V.P.I. & S.U. deer pen facilities. All

fawns were successfully reared to 3~ months of age using

techniques described by Buckland et al. (1974).

Experimental Design

The design used in this study was a 2x2 factorial with

energy and protein as the factors. High and low levels of both

energy and protein produced four treatments: high energy-high

protein (HEHP), high energy low protein (HELP), low energy-high

protein (LEHP), and low energy-low protein (LELP). Ullrey et al.

(1970) reported daily digestible energy maintenance requirements

for deer to be 158 kcal per kg body weight?·75 Our objective

was to formulate high energy rations to contain twice the amount

of daily energy required to maintain a 45.4 kg deer or approximately

5597 kcal. The basis for this was to assure that the fawns were

provided enough energy for both maintenance and growth. Daily

13

14

food consumption per deer was estimated to be 1.82 kg. After

considering food consumption, high energy rations were formulated

to contain 3080 kcal/kg. It was decided to try to achieve a

30 percent restriction in energy, i.e. provide 2156 kcal/kg for

low energy rations. The basis for this was to restrict the

animals enough to show differences in treatments, but not to

restrict the animals to such an extent to retard their growth

for future studies. The goal for high protein rations was in

the range of 15-20 percent and the goal for low protein rations

7-11 percent. Ullrey et al. (1967) reported that female fawns were

capable of maintenance and growth on a 7.8 percent crude protein diet,

although the growth was less than for fawns on higher protein

diets.

Formulation of acceptable rations proved to be more difficult

than was originally expected. The first formulation of rations

(Table 1) was fed beginning on 15 September, but was not suitable.

The deer, especially the ones on low energy rations, did not eat

and began deteriorating in condition. It was thought the amount

of straw in the rations was undesirable and not palatable to the

deer. On 26 September, low energy rations were reformulated to

contain more orchardgrass hay and no straw. After this change,

low energy animals continued to decrease food consumption and to

decline in condition. Until this time, the rations had been

ground, but not pelleted. It was decided to pellet the rations

to increase palatability and to eliminate any selective feeding

Table 1. Formulation of original rations fed to captive fawns.

High energy High energy Low energy Low energy High protein Low protein High protein Low protein

Constituent (Eercent) (Eercent) (Eercent) (Eercent)

Alfalfa meal 36.0 0.0 0.0 19.8

Soybean oil meal 14.0 0.0 31.8 0.0

Orchardgrass 4.8 30.0 0.0 30.0 ........

Straw 0.0 2.8 56.0 30.0 \ .• .'1

Corn 33.0 55.0 0.0 8.0

Molasses 9.0 9.0 9.0 9.0

P04 0.7 0.7 0.7 0.7

Mineralized Salt 1.5 1.5 1.5 1.5

Vitamin premix 1.0 1.0 1.0 1.0

16

that may have occurred earlier. On 11 October, unused amounts of

the ground higll energy rations were taken to the mill and

pelleted. Unused amounts of the low energy diets were discarded.

New low energy ration formulations were also pelleted. These new

low energy rations contained neither straw nor orchardgrass, but

corncobs were substituted as roughage and filler. Both low energy

diets increased in percent crude protein and digestible energy

as a result of these changes, but the rations proved to be more

palatable. The final change in rations was made on 25 October

when all but the low energy-high protein rations were reformulated.

This final formulation (Table 2) was an attempt to make percent

crude protein and digestible energy more equitable between protein

treatments and energy treatments. Proximate analyses and digestible

energy values of the initial formulation and the final formulation

are presented in Table 3 and Table 4, respectively.

Actual restriction in energy was only 18 percent as opposed

to the desired 30 percent. All digestible energy values for the

constituents are based on sheep digestive values taken from

tables in Crampton and Harris (1969).

All animals were weighed on 14 September 1973. The eight

heaviest animals were assigned to Group I and started on the

experimental feed regimes the following day. Within the group,

animals were assigned randomly to one of four treatments with

treatments assigned randomly to pens. The remaining fawns were

weighed on 28 September, the eight heaviest animals assigned to

Table 2. Formulation of final rations fed to captive fawns.

High energy High energy Low energy Low energy High protein Low protein High protein L0\4 protein

Constituent (percent) (.eercent) (percel1t) (percent)

Alfalfa meal 30.8 15.0 46.8 32.8

Soybean oil meal 16.0 0.0 16.0 0.0

Corn 35.0 52.8 0.0 15.0 ~ "'-J

Corn cobs 6.0 20.0 25.0 L~O. 0

Molasses 9.0 9.0 9.0 9.0

P04 0.7 0.7 0.7 0.7

Mineral salt 1.5 1.5 1.5 1.5

Vitamin premix 1.0 1.0 1.0 1.0

Table 3. Proximate analysis and calculated energy values for original rations.

High energy High energy Low energy Lmv energy High protein Low protein High protein 10\" protein

Component (~cent) (Eercent) (Eercent) (percent)

Dry matter 88.61 57.04 87.66 87.82

Crude protein 17.00 9.25 18.19 9.44 !-'

Ether extract 2.36 2.93 1.18 1.96 CIJ

Crude fiber 16.62 15.44 27.02 28.47

Ash 8.63 6.80 9.10 9.26

Nitrogen free extract 55.39 65.58 44.51 50.87

Calculated digestible energy values

(kcal/kg) 3025 3052 2180 2182

Table 4. Proximate analysis and calculated energy values for final rations.

High energy High energy Low energy Low energy High protein Low protein High protein Low protein

<Eercent) (Eercent) (J>ercentJ (pe~c~[l_~)

Dry matter 87.95 86.46 87.83 86.90

Crude protein 18.19 9.19 18.19 10.00

Ether extract 1.66 1.99 2.lB 1.28 !-'

'" Crude fiber 15.15 12.92 21.41 23.73

Ash 7.B3 4.90 9.41 7.56

Nitrogen free extract 57.17 71.00 48.81 57.43

Calculated digestible energy values

(kca1/kg) 3052 3075 2507 2489

20

Group II, randomized as above, and begun on experiment 29 September.

Group III, comprised of the next eight heaviest animals, was

randomized and started on experimental rations 14 October.

All animals within the same group, assigned to the same

treatment, were housed two per pen. Groups also represented

age differences; Group I contained the oldest fawns, Group III

contained the youngest fawns, and Group II was intermediate.

Grouping was necessary to reduce the possible variation in

treatment effects due to different initial body weights and/or

ages.

Food Consumption

Daily food consumption was recorded for each pair of animals

within treatments. These values were averaged on a monthly basis

to give mean average daily consumption per month. Since some

animals within treatments died during the experiment, some values

represented consumption data for one fawn only.

Sampling and Weighing

All experimental animals were bled and weighed one day prior

to being placed on experimental rations, and every 4 weeks thereafter

for a period of 24 weeks. The data included 1 set of pre­

experimental data, 5 sets of experimental data, and 1 set of post­

experimental Juta for each animal.

Each fawn was physically restrained and blood sampling was

accomplished by jugular phlebotomy using Vacutainers (Becton­

Dickinson). Fawns were always bled prior to weighing and during

21

the morning hours to minimize the effects of excitement and

diurnal variation. Body weights were obtained by use of a

modified platform scale.

BUN Analysis

Serum sam.ples were analyzed for BUN by a diacetyl monomixe

procedure (Sigma Chemical Company, 1971). Concentrations of

BUN were determined by use of a Bausch and Lomb Spectronic 20

colorimeter. Results from preliminary samples that were run in

duplicate indicated that the procedure was accurate and reproducible

and therefore future samples were not run in duplicate. A standard

curve was established over the range of BUN values expected. A

blank solution and at least three standard urea solutions were

run with each set of serum samples to assure the validity of the

assay. If the standards were not consistently in agreement with

corresponding values on the curve) a new set of standards was

prepared and a new standard curve established. Consistency in

pipetting was accomplished by using transfer pipets for the

reagents and Eppendorf microliter pipets for making dilutions.

Data Analysis

Initially, the sample size of the experiment was 24 animals,

but through the course of the experiment six animals were lost

due to illnesses and accidents. Of these six animals, one was

euthanized just prior to the last sampling period. A final

experimental BUN value was calculated for this animal by the

method of missing data calculation described by Snedecor (1956).

22

One degree of freedom was subtracted when the test mean square was

computed in order to compensate for the calculated value. No

missing data values were calculated for the weight gains analysis,

since it was thought that weights could not be justifiably

predicted because of the lack of consistency in weight gains

between animals in the same treatment. Values from the other

animals lost were incomplete and were omitted from the BUN and

weight gains analyses.

Serum BUN values were analyzed by analysis of variance using

a least squares regression procedure from the Statistical Analysis

System (sAS Barr and Goodnight, 1971). Sources of variation were

partitioned into main effects (group, energy, and protein) and

their interactions and monthly values and their interactions.

A different mean square term was used to test main effects than

was used to test monthly effects. The former test term was an

estimate of the variation in BUN values between animals on the

same treatment and was an estimate of the variation in BUN values

between animals on the same treatment in the same pen during the

same month and was designated by month x animal (pen). The tests

were based on expected mean square values which were determined

by Burkhart (pers. con~.) for the model of analysis, which was

considered to be purely random.

Monthly ~,J(;"!ight gains were also analyzed by analysis of

variance using the &AS package. Group, energy, protein and

their interactions were the sources of variation.

23

Wild Deer ----

Serum samples from wild deer were provided by the Southeastern

Cooperative Wildlife Disease Study (SCWDS) group stationed at the

University of Georgia, Athens, Georgia. Deer were collected as

part of a disease research project. All animals were shot with

high powered rifles without regard to sex, age, or condition. Blood

was taken, processed for sera, and then frozen for future use.

Five deer were killed during each season in six areas of the south-

eastern United States. During the first year (1967-68) of the

study, collections were made from one area each week for six

successive weeks during each season in the following order:

(1) A. P. Hill Military Reservation in Virginia, (2) Forks

Game Management Area in South Carolina, (3) Chocolocco Game

Management Area in Alabama, (4) Daniel Boone Game Management

in North Carolina, (5) Eglin Air Force Base in Florida, and

(6) Fort Stewart Military Reservation in Georgia. During the

last two years (1968-69, 1969-70) of the study, deer were again

collected seasonally, but the order of sampling was random.

Daniel Boone Game Management Area and Eglin Air Force Base

were not sampled during the third year. In all years the spring

collections were made between mid-April and late May, the summer

collections between mid-July and late August, the fall collections

between mid-October and late November, and the winter collections

between mid-January and late February.

A visual estimate of physical condition was made for each deer

at the time of necropsy. The condition was classified as excellent,

24

good, fair, or poor and were later coded for statistical purposes

as 4, 3, 2 and 1, respectively.

BUN Analysis

Analysis of serum for BUN was identical to the procedure used

for captive deer.

Data Analysis

BUN values were analyzed by analysis of variance using the

SAS package previously described. Three areas had one missing

sample, however; the BUN values were estimated by substituting

the mean of the respective subgroup for the missing value. One

degree of freedom was subtracted from the appropriate error mean

square for each missing sample. Two areas were not sampled during

the third year of the study, and the data were analyzed by area

to prevent a confusing of the results. An analysis of variance

table was produced for each area with year and season as main

effects.

Partial correlations, by season, were also determined between

BUN values and other variables that were available on the individual

deer. This was accomplished by using an option of the SAS package.

Kirkpatrick et aL (1969) had previously obtained rumen samples from

the SCWDS for the first year deer and had conducted proximate

analyses and food habits analyses. Analyses were later performed

on deer collected during the second and third year (unpub1.). Age,

weight, and physical condition data were also available for

correlation.

RESULTS

Captive Deer

Food Consumpti~£

Food consumption data are presented in Table 5. No statistical

analysis was performed. After the first month of the study, all

animals, regardless of group or treatment, decreased their food

consumption. Animals on low energy diets tended to eat slightly

more than animals on high energy diets, but overall mean food

consumption seemed to be equitable between groups and between

treatments.

Weight Gains

Mean weight gains are presented in Table 6. The mean squares

from the analysis of variance of these data are presented in

Table 7. Mean weight gains for animals on high protein rations

(2.21 kg) were significantly higher (P <.05) than those of animals

on low protein rations (1.55 kg). There were no significant group

or energy effects and no significant interactions. All sources

were tested with the estimate of variance between animals on the

same treatment in the same pen which was denoted animal (pen).

BUN Values

The overall mean BUN value for fawns before the experiment

began was 17.4 mg/lOO mI. Pretreatment group BUN means (mg/lOO ml)

were as follows: Group I, 13.7; Group II, 21.2; and Group III, 17.4

Post-treatment group BUN values (mg/IOO ml) in the same above

order were 18.4, 23.1, and 19.6. The overall mean was 20.4 mg/IOO mI.

25

26

Table 5. Average food consumption (kg/deer/day) of captive fawns on experimental rations.

Honth of experiment

Treatment 1 2 3 4 5

Group I

HEHPb 1.61 1.38 1.07 0.57 HELpc 1.77a 1.43a 0.87a 0.72a

LEHPd 1.75a 1.66a 1.28a 0.94a

LELpe 1.70 1.69 1.38 1.03

Group 2

HEHP 1.36 1.57 1.30 1.07 0.93 HELP 1.30 1.33 1.10 1.06 0.64 LEHP 1.26 1.42 0.90 1.34a 0.84

a

LELP 1.28 1.60 1.38 1.13 0.93

Group 3

HEHP 1.27 1.27 1.04 0.80 0.92 HELP 2.03 0.95 0.84 0.60 0.85 LEHP 1.13 1.20 1.08 0.95

a 1.15

a

LELP 1.13a 1.36 1.14 0.86 1.14

Overall monthly means

HEHP 1.31 1.48 1.24 0.98 0.81 HELP 1.67 1.35 1.12 0.84 0.74 LEHP 1.20 1.46 1.21 1.19 0.98 LELP 1.20 1.60 1.40 1.12 1.03

Overall treatment means

HEHP 1.16 HELP 1.14 LEHP 1.21 LELP 1.27

a Values are for one fawn only; other values are average values for two fawns.

b High energy-high protein. c High energy-low protein. d Low energy-high protein. e Low energy-low protein.

27

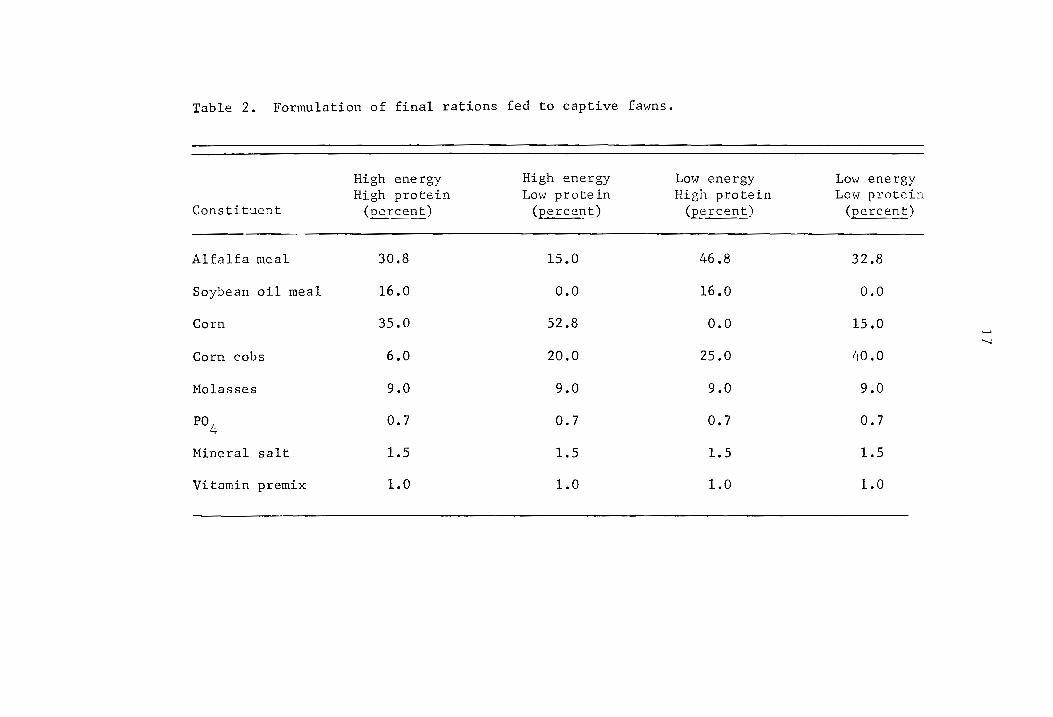
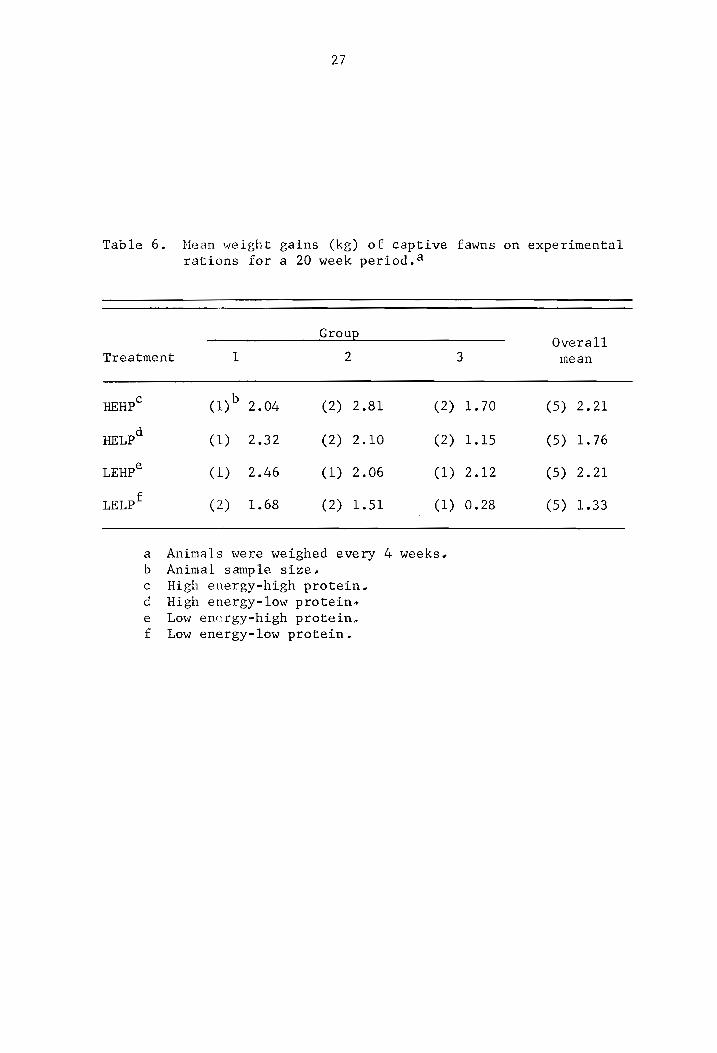
Table 6. Hean ,,,eight gains (kg) of captive fawns on experimental rations for a 20 week period. a

GrouE

Treatment 1 2

HEHpc

HELPd

LEHpe

LELPf

(l)b 2.04 (2) 2.81 (2)

( 1) 2.32 (2) 2.10 (2)

( 1) 2.46 (1) 2.06 (1)

(2) 1.68 (2) 1.51 (1)

a Animals were weighed every 4 weeks, b Animal sample size, c High energy-high protein" d High energy-low protein~ e Low energy-high protein~ f Low energy-low protein.

3

1.70

1.15

2.12

0.28

Overall mean

(5) 2.21

(5) 1.76

(5) 2.21

(5) 1.33

28

Table 7. Mean square from the analysis of variance of weight gains for captive deer.

Source Degrees of freedom Mean sguare

Group 2 5.88

Energy 1 2.24

Protein 1 9.57*

Group x energy 2 0.62

Group x protein 2 1.42

Energy x protein 1 2.66

Group x energy x protein 2 1.12

Animal (pen) 6 1.32

* (P <.05).

29

These latter values were obtained after placing all fawns on a

standard ration for one month after feeding of experimental

rations was complete.

Mean BUN values are presented in Table 8. The mean squares

from the analysis of variance of these data are presented in

Table 9. BUN values were significantly lower (P <.01) for animals

in high energy groups (16.4 mg/IOO ml) than in low energy groups

(17.5 100 ml). Protein had an opposite effect. Animals on

high protein rations (23.0 mg/IOO ml) exhibited significantly

higher (P ~.001) BUN values than did animals on low protein,

rations (11.3 mg/IOO ml). There was no significant group effects

or main effect interactions when testing with animal (pen) as the

error term.

The remaining sources of variation were tested with the

appropriate term of month x animal (pen). The only source that

was significant was the interaction between month and protein

(P < .001) •

Wild Deer ----Seasonal means of BUN values, by area, are presented in

Table 10. Results from overall ana s (not considering areas

separately) included significant interactions which

could not be easily explained. Ana is by area removed one

component of the interaction and made interpretation less difficult.

The results from the analysis of variance, by area, of BUN

values for deer collected by the SCWDS are presented in Table 11.

30

Table 8. BUN means (mg/100 m1) of 19 captive fawns on experimental rations for a 20 week period.

Months of Sampling

Treatment S8mp1e 1 2 3 4 5

Group 1

HEHP~ (2) 22.0 26.0 20.5 19.5 20.5 HELP ( 1) 5.3 6.5 8.0 10.0 7.5 LEHP

c (1) 32.3 28.5 25.0 24.5 24.5

LELPd (2) 9.5 10.8 11.5 15.0 10.8

Group 2

HEHP (2) 30.5 20.5 17.3 18.8 19.2 HELP (2) 6.5 7.0 10.0 11.2 17.5 LEHP (1) 30.5 31.0 24.0 24.5 23.0 LELP (2) 12.8 9.8 18.5 17.0 15.8

Group 3

HEHP (2) 21.8 20.8 21.5 25.2 25.8 HELP (2) 5.8 11.8 10.8 13.2 8.5 LEHP (1) 27.5 20.0 24.0 20.0 18.5 LELP (1) 13.5 10.0 13.0 13.5 10.5

Overall monthly means

HEHP (6) 24.7 22.4 19.8 21.2 21.8 HELP (5) 6.0 8.8 9.9 11.8 11.9 LEHP (3) 30.1 26.5 24.3 23.0 22.0 LELP (5) 11.6 10.2 14.6 15.5 12.7

Overall treatment means

HEHP (30) 22.0 HELP (25) 9.7 LEHP (15) 25.2 LELP (25) 12.9

a High energy-high protein. b High energy-low protein. c Low energy-high protein. d Low energy-low protein.

31

Table 9. Mean square from the analysis of variance of BUN values for captive deer.

Source Degree of freedom

Group 2 Energy 1 Protein 1 Group x energy 2 Group x protein 2 Energy x protein 1 Group x energy x protein 2 Animal (pen) 7

Month Month x protein Month x energy Month x group Month x energy x protein Month Month Month Month

Total

x group x protein x group x energy x group x energy x animal (pen)

(P <.01). (P '( .001) •

x

4 4 4 8 4 8 8

protein 8 27a

93

Mean square

20.35 236.47**

3330.92*** 40.39 27.59 0.40

10.25 17.21

5.82 72.86-1'** 16.02 6.34 2.64

18.61 10.63

9.31 8.30

a One degree of freedom subtracted for missing data calculation.

32

Table 10. Seasonal means of BUN values (mg/100 m1) for deer collected from selected areas in the Southeast, 1967-1970.

Year

1a

2b 3c

1 2 3

1 2 3

1 2

1 2

1 2 3

Season

Spring Sununer Fall Winter

A. P. Hill Military Reservation? Virginia

13 .. 2 5.7 6.7 12.5 14.1 7.4 9.1 8.5 12.1 11.5 20.7 12.1

Forks Game Management Area, South Carolina

10.6 11.1 8.5 14.2 9.1 10.0 16.3 13.8

14.2 2.8 6.8 9.2

Choco1occo Game Management Area, Alabama

6.9 12.0 4.9 12.4 3.9 7.0 4.1 9.4 7.5

Daniel Boone Game Management Area 2

14.2 13.2 4.7 7.9 13.2 4.9

Eglin Air Force Base? Florida

8.1 10.6

Fort Stewart

a 1967-68. b 1968-69. c 1969-70.

6.3 6.8 9.2

7.7 3.4 8.3 6.3

Military Reservation?

7.1 5.5 8.2

9.6 9.9 5.9

13.6 14.2

7.8

North Carolina

3.7 4.8

11.6 8.1

Georgia

20.9 8.1 6.7

Table 11. Mean squares of BUN values for deer collected from selected areas of the Southeast 1967-70.

Source of Variation

Area Year Season Year x Season

A. P. Hill Military (2) a 132. 33"' .. ,,~* Reservation, Virginia (3) 68. 40'l'd .. (6) 73.80'1':"'< .....

Forks Game Management Area, South Carolina (2) 86.55"'" (3) 53.29 (6) 72.ll~'n'(

Chocolocco Game Management Area, Alabama (2) 31.18 (3) 79. !.~2·k'l' .. ",< (6) 71.82~':'I'd:,

Daniel Boone Game Management Area, North Carolina (1) 15.62 (3) 200. 74--' .... b ... (3) 28.91

Elgin Air Force Base, Florida (1) 3.91 (3) 50. 56~': (3) 21.42

Fort Stewart Military Reservation, Georgia (2) 79.26 (3) 75.48 (6) 91.34~'(

a Degrees of freedom are in parentheses to the left of each mean square. ",O ... ·k (P <.001)

*--'.. (P <.01) * (P <.05)

Error

(47) 12.92

(48) 22.11

(48) 71.45

(32) 10.71

(32) 11.64

(46) 37.42

LV w

34

There were significant differences in BUN values between years

in A. P. Hill Nilitary Reservation (P < .001), and Forks Game

Management Area (P<.05). Significant differences between

seasons were found for A. P. Hill Military Reservation (P <:.01),

Chocolocco Game Management Area (P<.OOl), Daniel Boone Game

Management Area (P<.OOl), and Eglin Air Force Base (P<.05).

However, there were significant year x season interactions in

four of the six areas.

Partial correlation coefficients, by season, between BUN

values and other variables are presented in Table 12. BUN values

for deer collected in the spring were significantly correlated with

age (r=0.32), and weight (r=0.28). During summer significant

correlations were found between BUN and crude protein (r=0.33),

ash (r=0.26), unidentifiable finely ground matter (r= -0.31), and

fungi (r=O.35). During fall, BUN values were significantly

correlated with weight (r=0.36), crude protein (4=0.44), ether

extract (r= -0.28), crude fiber (r= -0.27), fungi (r=0.25), and

so ft frui t -0.27). BUN values in winter were correlated with

ash (r= -0.23), nitrogen free extract (r= -0.29), and uniden­

tifiable finely ground matter (r=0.26).

35

Table 12. Partial correlation coefficients, by season, between BUN values and several other variables of deer collected from selected areas of the Southeast, 1967-70.

Variable

Characteristics

Age Weight Condition

Proximate analysis

a Dry matter Crude protein Ether extract Crude fiber Ash Nitrogen

Food habits

b Ufgm Leaves of woody plants Herbaceous stems and leaves Acorns Fungi Grasses and sedges Soft fruit Woody stems and buds Hard fruit

Season

Spring

0.32'1h'( 0.28·/(

-0.18

0.19 -0.11 0.02 0.05

-0.08 0.09

-0.09 0.09

-0.05 0.08

-0.22 0.16

-0.12 -0.11 0.02

Summer

-0.16 0.00

-0.06

-0.05 0.33**

-0.04 -0.18 0.261'­

-0.27

-0.3l~(

-0.11 0.16 0.08 0.35i~

-0.20 -0.19 -0.03 -0.09

Fall

0.11 o • 36'ki(

-0.09

-0.04 o .44*'1b~

-0.28';'( -0.27'1''-0.14

-0.02

-0.09 -0.20 -0.05 0.06 0.25 i (

0.12 -0.27* -0.08

0.13

Winter

0.09 0.07 0.17

0.10 0.14

-0.18 -0. 23")~** 0.61

-0.29·k

0.26* 0.02 0.04

-0.11 -0.12

0.15 -0.12 -0.01 -0.04

a This variable and all remaining variables are expressed as percentages.

b Unindcntifiab1e finely ground matter. * (P<.05) • .,'(~~ ( p <. 01) . *** (P <. 001).

DISCUSSION AND CONCLUSIONS

The decline of food consumption throughout the study may have

been a result of voluntary food restriction by the animals.

Voluntary food restriction in deer has been documented by Long

et ale (1965). Another explanation is that animals on low energy

rations may have eaten more to make up for the deficit in energy,

but is not likely since rations did not differ as much in energy

as was originally planned. Although no statistical analysis was

performed, it appears that the quantity of food consumed was not

a significant source of variation for the BUN data.

The effect of protein on weight gains of fawns was similar to

results reported by Ullrey et ale (1968). In his study, fawns

that consumed high protein diets weighed more than fawns on low

protein diets.

Protein is important to the growth of young animals and this

was verified by the weight gains analysis. Energy probably also

has an effect, but the effect may have been masked, since the

experimental design had only an 18 percent restriction in energy

intake, whereas there was about a 50 percent restriction in

protein intake.

BUN values for fawns on experimental rations compared favorably

with values reported by Tumbleson et ale (1968) and Seal and

Erickson (1969). Some of the results from the analysis of

variance of BUN values were as expected and agreed with the

36

37

results of Preston et a1. (1961) who used a similar experimental

design with steer calves. Their rations consisted of different

levels of energy and different levels of protein. Steers on

high energy rations, when compared to steers on low energy rations,

exhibited lower BUN values. Animals on high protein rations, when

compared to animals on low protein rations, exhibited higher BUN

values. High energy intake allows the microbial population of

ruminants to be more efficient in their utilization of protein

and not as much ammonia is produced and converted to urea as

would be produced with low energy diets. If energy intake is

constant, animals on high protein diets would have greater BUN

values. High protein intake results in a greater production of

ammonia and larger amounts of urea which create a higher BUN

concentration. If protein is constant, animals on low energy diets

would have greater BUN values.

The significant month x protein interaction for captive fawn

data could not be explained other than to say that the effect of

protein intake on BUN values was not the same from month to month,

and no pattern could be discerned.

Significant differences in BUN values of SCWDS deer between

years in two areas may be attributed to differences in seasonal

climatic conditions that occurred during the years. Differences

in precipitation, temperature, and other climatic conditions could

cause differences in the quantity and quality of vegetation available

to deer and the nutritive intake would be reflected by the BUN

38

level. Annual fluctuations in climate and vegetation may have

been fairly consistent in the four other areas, since no annual

differences were shown in BUN levels.

Three of the four areas that had significant seasonal

differences in BUN values exhibited conflicting patterns. Deer

from A. P. Hill Military Reservation had lowest values during

spring for all three years sampled. This agreed with the results

of Skeen (1974) who determined BUN values to be higher for deer

collected during spring than for deer collected during other

seasons in Western Virginia. Deer from Daniel Boone Game

Management Area had lowest values during winter and next to lowest

during fall for both years sampled. Deer from Eglin Air Force

Base exhibited lowest values during fall for both years sampled.

No pattern could be determined for the remaining three areas.

The significant year x season interactions in four of the six

areas meant that seasonal differences in BUN levels, in addition

to varying between areas, also varied within the same area between

collection years. Some of these seasonal differences may be

attributed to the seasonal occurrence of certain food items.

Two examples follow. Succulent vegetation, which is relatively

high in protein, is most prevalent in spring. Acorns, which are

low in protein, but relatively high in energy, are present in

greatest abundance in fall. Differing amounts of these and other

foodstuffs which occur seasonally could logically alter protein

and energy intake and the differing intakes would be reflected in

39

BUN levels. If BUN values are to be assumed a measure of

nutritional regime, then it must be concluded that nutritional

regime varied \.lidely between and within the areas of the Southeast

that were sampled.

Correlation coefficients and their significance may be mis­

leading unless carefully examined. With a large enough sample

size, significant correlations may be determined between almost

any two variables. One must consider the coefficient of

determination (r2) of correlations to determine if biological

significance was equal to statistical significance. The

definition of an r2 value is the amount of variation of the

dependent variable (BUN value) that could be explained by its

relationship with the independent variable. The basis for

biological significance is left to individual researchers, but

most would probably be confident in a correlation with an r2

value of 0.50 (50 percent). This would mean a correlation

coefficient (r) would have to have a value of 0.70 or higher

before it was considered biologically significant. No correlations

in this study Here found to be of that magnitude. Some of the

significant correlations were thought to be coincidental and

were not explainable. The correlation of BUN value and age was

considered a coincidental correlation since it was only significant

in one season. The reason for this was unknown since other

seasonal r values were very low and Seal and Erickson (1969) failed

to fine age differences in BUN levels in their study. Body weight

40

was significantly correlated with BUN values during the spring and

fall. The other two seasons had exceptionally low r values.

Condition was not correlated with BUN values, but the results may

have been misleading. Condition, a discreet variable (excellent,

good, fair, or poor), was coded and entered into a correlation

ma.trix. The results may be invalid since the other measures are

continuous variables. Weight and condition are related and it

follows that condition and BUN values should be related, especially

where weight was found to be correlated with BUN values. It is

thought by the author that a measure such as kidney fat index (a

continuous measure of condition) would be significantly correlated

with BUN values. It was expected that the correlation between

BUN and crude protein of rumen contents, would be higher and more

consistent than was found since BUN values had been shown in the

former part of this study to be significantly affected by protein

intake. The reason for low r values in the winter and spring

was not known. Ether extract, which is a measure of fat, and crude

fiber, which is an indirect measure of digestibility followed

similar trends and both exhibited negative correlations with BUN

level only during the fall. No explanation could be given. The

correlation of BUN with ash content which was significant in

summer and winter could not be explained. Nitrogen free extract,

a measure of energy, had negative correlations with BUN values

during three of the four seasons and the correlation was significant

only in winter. The negative correlations of BUN and energy

follow the results of the captive deer results. No reasonable

explanations or assumptions could be made for any of the

statistically significant food habits correlations. A different

type of analysis of these data may render further explanations.

A multiple regression analysis, by season, would show what variables

explain the largest amount of variation in BUN values. It should

again be emphasized that correlations do not imply cause and effect

relationships.

The opposite effects that protein and energy had on BUN values

may make the use of BUN values undesirable as a physiological index,

but is still believed that BUN values could be useful as a management

tool to evaluate trends on a particular deer range from year to

year and to compare and rank similar physiographic areas. Baseline

data for an area should be collected over a range of conditions and

subsequent BUN values could be compared with what was considered to

be a normal or average year. One problem that could be encountered

is the misinterpretation of a high BUN value. This could be a

result of either a low energy-high protein diet or an extremely

poor diet, which resulted in protein catabolism. It is not known

at what level of dietary protein intake that deer begin catabolizing

body protein, but the result is a high BUN level. Fr'anzmann (1972)

determined this level to be around five percent for bighorn sheep.

He has suggested (pers. corom.) that experimental deer be placed on

varying levels of protein intake to determine at what level

catabolism occurs. Another variable, such as serum glutamic-

oxalacetic transaminase (SGOT), that could be measured and used

in conjunction \vith BUN may help determine when catabolism occurs.

Amino acids, in excess of what are needed for protein synthesis,

cannot be stored and are degraded and the resulting oc::;keto acid is

used for energy if the animal has need for energy. SGOT is

responsible for catalyzing the transfer of an amino acid group

of glutonic acid to form the resulting ~ketoglutaric acid (\fuite

et ale 1968). A high BUN value implies either a high protein

intake and an excess of amino acids, some of which had been

converted to urea or a high level as a result of protein catabolism.

A high SGOT level would indicate that amino acids were in excess

of normal intake and that some had been converted into energy

producing compounds. A high level of both BUN and SGOT would

verify that a higher than average BUN value was attributable

to a high dietary protein intake and not to body protein catabolism.

Tumbelson et al. (1968) reported a significant (P < .01) correlation

(0.49) between the level of SGOT activity and serum BUN levels.

The age of the serum samples from the SCWDS may have

influenced the BUN results. Samples were frozen for 4-7 years

before analysis was begun. During this time if the samples

were thawed and exposed to bacterial contamination, ureas

may have been formed and some urea hydrolyzed to ammonia, thus

decreasing the urea content. It is not known whether or not

samples were exposed to freezing and thawing or contamination,

but it is proposed that more field studies similar to the SCWDS

43

project be done to study the feasibility of using BUN levels

as a management technique, and that the sera be assayed promptly

to prevent possible deterioration.

REFERENCES CITED

Allen. R. S. 1970. Protein metabolism. Pages 576-594 in M. J. Sevenson, ed. Dukes' physiology of domestic animals. Cornell University Press, Ithaca. 1963 pp.

Bailey, J. A. 1969. Rumino-recticular contents and blood constituents as parameters of nutritional condition in North America deer. Pages 94-117 in J. A. Bailey and J. G. Nagy, eds. Recent advances in wildlife nutrition, papers from a graduate seminar in wildlife biology. Colorado State Univ., Ft. Collins, Colo. (unpubl.).

Baker, M. F., and F. X. Lueth. 1966. Mandibular cavity tissue as a possible indicator of condition in deer. Proc. Southeast Assoc. Fish Game. 20:69-74.

Bandy, P. J., \v. D. Kitts, A. J. Wood, and I. M. Cowan. 1957. The effect of age and plane of nutrition on the blood chemistry of the Columbian black-tailed deer. Can. J. Zool. 35(2):283-289.

Bandy, P. J., 1. M. Cowan, W. D. Kitts, and A. J. t.Jood. 1956. A method for the assessment of the nutritional status of wild ingulates. Can. J. Zool. 34(1):48-52.

Barr, A. J., and J. H. Goodnight. 1971. Statistical analysis system. North Carolina State University, Raleigh.

Biddle, G. N., and J. L. Evans. 1973. Nitrogen utilization in cattle using a nitrogen depletion-repletion technique. J. Anim. Sci. 36(1):123-129.

Brctggemann, J., D. Giesecke, and Walser-Karst. 1968. Methods for studying microbial digestion in ruminants post mortem with special reference to wild species. J. Wildl. Manage. 32(1):198-207.

Buckland, D. E., W. A. Abler, R. L. Kirkpatrick, and J. B. Whelan. 1974. An improved husbandry system for rearing fawns in captivity. J. Wildl. Manage. (in press).

Crampton, E. W. and L. E. Harris. 1969. Applied animal nutrition. Second ed. W. H. Freeman and Company, San Francisco, Calif. 753 pp.

44

45

Dauphine, T. C., Jr. 1971. Physical variables as an index to condition in barren-ground caribou. Trans. Northeast Sect. Wildl. Soc. 28:91-108.

Dror, Y, and A. Bondi. 1969. Utilization of surplus protein by sheep. J. Agric. Sci., Crumb. 72:237-330.

Eggum, B. O. 1970. Blood measurement as a technique for assessing portein quality. Brit. J. Nutr. 24:983-988.

Elliott, R. C., and J. H. Topps. 1963. Studies of protein requirements of ruminants. 1. Nitrogen balance trials on two breeds of African cattle given diets adequate in energy and low in protein. Brit. J. Nutr. 17:539-547.

Fonnesbeck, P. V., and L. D. Symons~ 1969. Effect of diet on concentration of protein urea nitrogen, sugar, and cholesterol of blood plasma of horses. J. Anim~ Sci. 28(2):216-219.

Fontenot, J. P. 1971. Nitrogen metabolism and nutrition in ruminants. Pages 575-599 in D. C. Church et al., eds. Digestive Physiology and Nutrition of Ruminants, Vol. 2. Oregon State University, Corvallis. 401-801.

Franzmann, A. W. 1972. Environmental sources of variation of bighorn sheep physiological values. J. Wildl. Manage. 36(3):924-932.

French, C. E., L. C. McEwen, N. D. Nagruder, R. H. Ingram and R. W. SHift, 1956. Nutrient requirements for growth and antler development in the white-tailed deer. J. Wildl. Manage. 20(3):221-232.

Houpt, T. R. 1959. Utilization of blood urea in ruminants. 197(1):115-120. Am. J. Physiol.

Hungate, R. E. 1966. Conversions of nitrogenous materials. Pages 281-330 in R. E. Hungate, ed. The rumen and its microbes. Academic Press, Inc., New York. 533 pp.

Kirkpatrick, R. I.., J. P. Fontenot, and R. F. Harlow. 1969. Season<J1 changes in rumen chemical components as related to forages consumed by white-tailed deer in the Southeast. Trans. N. AnI. Wildie Nat. Resour. Conf. 34:229-238.

Klein, D. R. quality.

1962. Rumen contents analysis as an index to range Trans. N. Am. Wildl. Nat. Resour. 27:150-164.

46

Klein, D. R. 1964. Range-related differences in growth of deer reflected in skeletal ratios. J. Mammal. 45(2):226-235.

Lewis, D. 1957. Blood-urea concentration in relation to protein utilization in the ruminant. J. Agric. Sci., Camb. 48(4): 438-466.

Long, T. A., R. L. Cowan, G. D. Strawn, R. S. Wetzel, and R. C. Miller. 1965. Seasonal fluctuation in feed consumption of the white-tailed deer. Penn. Agr. Exp. Stat Prog. Rep. 262. 5 pp.

Phillipson, A. T. 1970. Ruminant digestion. Pages 424-483 in M. J. Swenson, ed. Dukes f physiology of domestic animals-.­Cornell University Press, Ithaca 1463 pp.

Preston, R. L., L. H. Bresser, and G. B. Thompson, 1961. Blood urea in cattle as affected by energy, protein, and stilbestrol. J. Anim. Sci. 29(4):977 (abstract).

Preston, R. L., D. D. Schnakenberg, and W. H. pfander. 1965. Blood urea nitrogen as affected by protein intake. J. Nutr. 86(3):281-288.

Ransom, A. B. 1965. Kidney and marrow fat as indicators of white­tailed deer conditions. J. Wildl. Manage. 24(2):397-399.

Riney, T. 1955. Evaluating condition of free-ranging red deer (Cervus elaphus), with special reference to New Zealand. New Zealand J. Sci. Technol. 36(5):429-463, Sec. B.

Riney, J. 1960. A field technique for assessing physical condition of some ungulates. J. Wildl. Manage. 24(1):92-94.

Seal, U. S. and A. W. Erickson. 1969. Hematology, blood chemistry, and protein polymorphisms in white-tailed deer. Compo Biochem. Physiol. 30:695-713.

Seal, U. S., J. J. Ozoga, A. W. Erickson, and L. J. Verme. 1972a. Effects of immobolization on blood analyses of white-tailed deer. J. Wildl. Manage. 36(4):1034-1040.

Seal, U. S., L. J. Verme, J. J. Ozoga, and A. W. Erickson. 1972b. Nutritional effects on thyroid activity and blood of white­tailed deer. J. Wildl. Manage. 36(4):1041-1052.

Sigma Chemical Company, 1971. The colorimetic determination in blood, plasma, or serum of urea nitrogen at 515-540 mu. St. Louis, 10 pp.

47

Skeen, J. E. 1974. The relationship of certain rumino-reticu1ar and blood variables to the nutritional status of white­tailed deer. Ph. D. thesis. Virginia Polytechnic Institute and State Univ. 98 pp.

Snedecor, G. W. 1956. Statistical methods. 5th ed. The Iowa State College Press, Ames. 534 pp.

Teeri, A. E., W. Virchow, N. F. Colovas, and F. Greeley. 1958. Blood composition of white-tailed deer. J. Manunal. 39(2):269-274.

Topps, J. H., and R. C. Elliott~ 1967. Partition of nitrogen in the urine of African sheep given a variety of low-protein diets. Anim. Prod. 9:219.

Tumbleson, M. E., M. G. Wood, A. R. Donunert, D. A. Murphy, and L. J. Korschgen. 1968. Biochemic studies on serum from white-tailed deer in Missouri. Am. J. Vet. Clin. Path. 2:121-125.

Ullrey, D. E., W. H. Youatt, H. E. Johnson, L. D. Fay, and B. L. Bradley. 1967. Protein requirements of white-tailed deer fawns. J. Wi1d1. Manage. 31(4):679-685.

U1lrey, D. E., W. G. Youatt, H. E. Johnson, L. D. Fay, B. E. Brent, and K. E. Kemp. 1968. Digestabi1ity of cedar and balsam fir browse for white-tailed deer. J. Wildl. Manage. 32(1):162-171.

White, A., P. Handler, and E. L. Smith. 1968. Principles of biochemistry. 4th ed. McGraw-Hill Book Company, New York. 1187 pp.

VITA

Donald Eugene Buckland, son of Mr. and Mrs. D. A. Buckland,

was born in Princeton, West Virginia on November 29, 1950. He

attended public schools in Peterstown, West Virginia and graduated

from Peterstown High School in June, 1968.

He matriculated at Virginia Polytechnic Institute in the

fall of 1968. He graduated with distinction in June, 1972, and

received a Bachelor of Science degree in forestry and wildlife.

The author continued his education at Virginia Polytechnic

Institute and State University in the fall of 1972, as a candidate

for the Master of Science degree in wildlife management. While

at Virginia Polytechnic Institute and State University, he was

elected to Xi Sigma Pi, Phi Sigma Society, Gamma Sigma Delta,

and Phi Kappa Phi. He is also a member of The Wildlife Society

and The American Soc of Mamma1ogists.

48

BLOOD UREA NITROGEN LEVELS OF WHITE-TAILED DEER AS AN INDEX OF CONDITION AND NUTRITIONAL INTAKE

by

Donald Eugene Buckland

(ABSTRACT)

Serum samples from 95 captive fawns on experimental rations

and 317 samples from wild deer collected from six areas of the

southeastern United States were analyzed for blood urea nitrogen

(BUN) content use of a diacetyl monoxime procedure.

Captive fawns were fed one of the following rations for a

20 week period: high energy-high protein (HEHP); high energy-

low protein (HELP); low energy-high protein (LEHP); or low

energy-low protein (LELP). Percent crude protein and calculated

digestible energy values (kca1/kg) for the four rations were

HEHP 18.2, 3052; HELP 9.2, 3075; LEHP 18.2; 2507; and LELP 10.0,

2489. Overall means for BUN values (mg/IOO ml) for the four

treatment groups were 22.0, 9.3, 25.2, and 12.8, respectively.

Analysis of variance showed that high protein levels significantly

increased BUN values (P <.001), while high energy levels

significantly decreased them (P<O.Ol). Analysis of variance for

wild deer BUN values showed seasonal effects on BUN levels for

four of the six areas, but no consistent seasonal trends were

determined either between or within areas. Partial correlation

coefficients, by season, resulted in several significant correlations

between BUN values and age, weight, physical condition, proximate

analysis of rumen contents, and food habits. Although significant,

many of the correlations were not explained and were considered

to be coincidental.

The extreme variation in BUN values for wild deer was

undesirable and the opposite effects that protein and energy had

on BUN values for captive deer makes interpretation of nutritional

intake difficult. For these reasons, BUN values may have limited

use as a physiological index.


Recommended