Blood Pressure Averaging Methodology: Decreasing the Rate of Misdiagnosing Hypertension Data Collection: Dr. Robert Smith, Analysis: David Quinn, Shawn St.Pierre & Pooja Sinha Background: Increasing evidence suggests that blood pressure measurements during physical examinations in doctors’ offices can be inaccurate due to multiple factors (ref Table 1 & 1a). As presented in Dr. Kaplan’s text on Clinical Hypertension, misdiagnosis of hypertension can occur for multiple reasons. Inoffice measurements can vary based on technique of the examiner, equipment being utilized for blood pressure measurements and attributes of the patient’s health as well as activities the patient has participated in during the day of the exam. Even the most seemingly inconsequential factors can cause variability in systolic and diastolic blood pressure as noted in the Table 1 and Table 1a below: A broad range of studies reviewed by the National High Blood Pressure Education Program shows that blood pressure measurement errors can range between 5 15mmHG. Given that a patient’s blood pressure classification as normal, prehypertensive, or hypertensive can change over a range as little as 20mmHg, it is important to obtain the most accurate representation of true blood pressure in order to reduce the risk of misdiagnosis. Inaccurate blood pressure readings can lead to overprescribing blood pressurelowering medication that may result in adverse events associated with hypotension. Additionally, doctors and other healthcare providers may prescribe lifestyle changes for patients who may not truly be suffering from blood pressure related conditions, leading to changes in the patients’ quality of life. Merely labeling a person, “hypertensive” may cause negative effects as well as enough sympathetic nervous system activity to change hemodynamic measurements (Rostrup, et al., 1991). To counter potentially inaccurate inoffice readings, the American Heart Association recommends that a clinician take at least two readings on each patient separated by a 1 minute interval and the average of those readings should be documented as the patient’s blood pressure. If the difference between the two readings varies by more than 5 mmHg, the AHA recommends including an additional one to two readings in the final average. (Pickering et al, pg 151 152 2004). Another methodology employed by many healthcare providers to understand a patient’s true blood pressure and associated classification, is the use of home blood pressure monitors. A home blood pressure monitor evaluates a patient’s blood pressure throughout the day in the patient’s natural environment. The average of these intraday readings is perceived as a more accurate reflection of the patient’s blood pressure than a single inoffice reading. In support of this hypothesis, Linda Beckett and Marshall Godwin published a study in “BMC Cardiovascular Disorders” in 2005 that showed a six reading inoffice average better predicted home monitoring results than the average of three single readings across the patient’s three most recent office visits. (Beckett, Godwin, BMC Cardiovascular, 2005.) *Wisconsin Heart Disease & Stroke Prevention Program 2010
Transcript
Blood Pressure Averaging Methodology: Decreasing the Rate of Misdiagnosing Hypertension
Data Collection: Dr. Robert Smith, Analysis: David Quinn, Shawn St.Pierre & Pooja Sinha
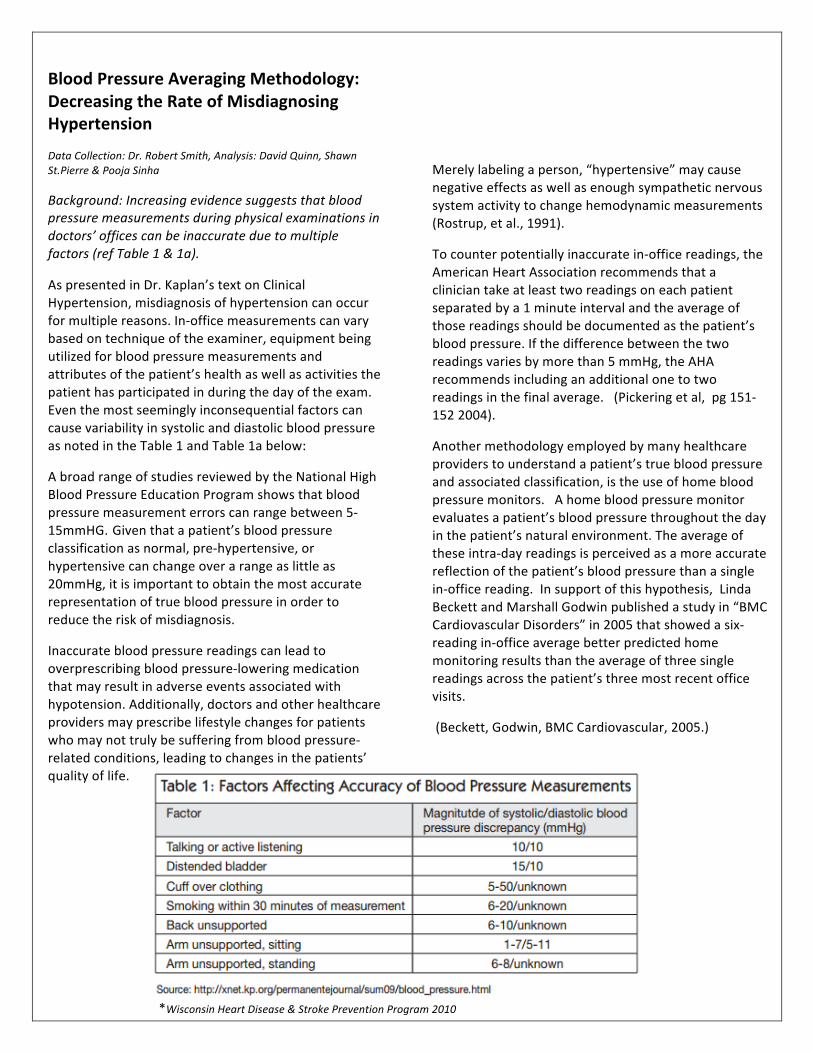
Background: Increasing evidence suggests that blood pressure measurements during physical examinations in doctors’ offices can be inaccurate due to multiple factors (ref Table 1 & 1a).
As presented in Dr. Kaplan’s text on Clinical Hypertension, misdiagnosis of hypertension can occur for multiple reasons. In-‐office measurements can vary based on technique of the examiner, equipment being utilized for blood pressure measurements and attributes of the patient’s health as well as activities the patient has participated in during the day of the exam. Even the most seemingly inconsequential factors can cause variability in systolic and diastolic blood pressure as noted in the Table 1 and Table 1a below:
A broad range of studies reviewed by the National High Blood Pressure Education Program shows that blood pressure measurement errors can range between 5-‐15mmHG. Given that a patient’s blood pressure classification as normal, pre-‐hypertensive, or hypertensive can change over a range as little as 20mmHg, it is important to obtain the most accurate representation of true blood pressure in order to reduce the risk of misdiagnosis.
Inaccurate blood pressure readings can lead to overprescribing blood pressure-‐lowering medication that may result in adverse events associated with hypotension. Additionally, doctors and other healthcare providers may prescribe lifestyle changes for patients who may not truly be suffering from blood pressure-‐related conditions, leading to changes in the patients’ quality of life.
Merely labeling a person, “hypertensive” may cause negative effects as well as enough sympathetic nervous system activity to change hemodynamic measurements (Rostrup, et al., 1991).
To counter potentially inaccurate in-‐office readings, the American Heart Association recommends that a clinician take at least two readings on each patient separated by a 1 minute interval and the average of those readings should be documented as the patient’s blood pressure. If the difference between the two readings varies by more than 5 mmHg, the AHA recommends including an additional one to two readings in the final average. (Pickering et al, pg 151-‐152 2004).
Another methodology employed by many healthcare providers to understand a patient’s true blood pressure and associated classification, is the use of home blood pressure monitors. A home blood pressure monitor evaluates a patient’s blood pressure throughout the day in the patient’s natural environment. The average of these intra-‐day readings is perceived as a more accurate reflection of the patient’s blood pressure than a single in-‐office reading. In support of this hypothesis, Linda Beckett and Marshall Godwin published a study in “BMC Cardiovascular Disorders” in 2005 that showed a six-‐reading in-‐office average better predicted home monitoring results than the average of three single readings across the patient’s three most recent office visits.
(Beckett, Godwin, BMC Cardiovascular, 2005.)
*Wisconsin Heart Disease & Stroke Prevention Program 2010
The purpose of this study was to compare single in-‐office blood pressure readings to average in-‐office blood pressure readings and observe the differences in accuracy and potential variation in diagnoses between the two methodologies.
Methods: This study was a retrospective quantitative analysis designed to compare single in-‐office automated blood pressure readings to the average of multiple automated blood pressure readings. The data was collected by Dr. Robert Smith and his staff at The St. Francis Care cardiology clinic in Hartford, CT. Blood pressure readings were collected on 187 adult patients using a Welch Allyn Connex® Vital Signs Monitor (Model 6300) with Office Profile and automatic base-‐lining technology enabled.
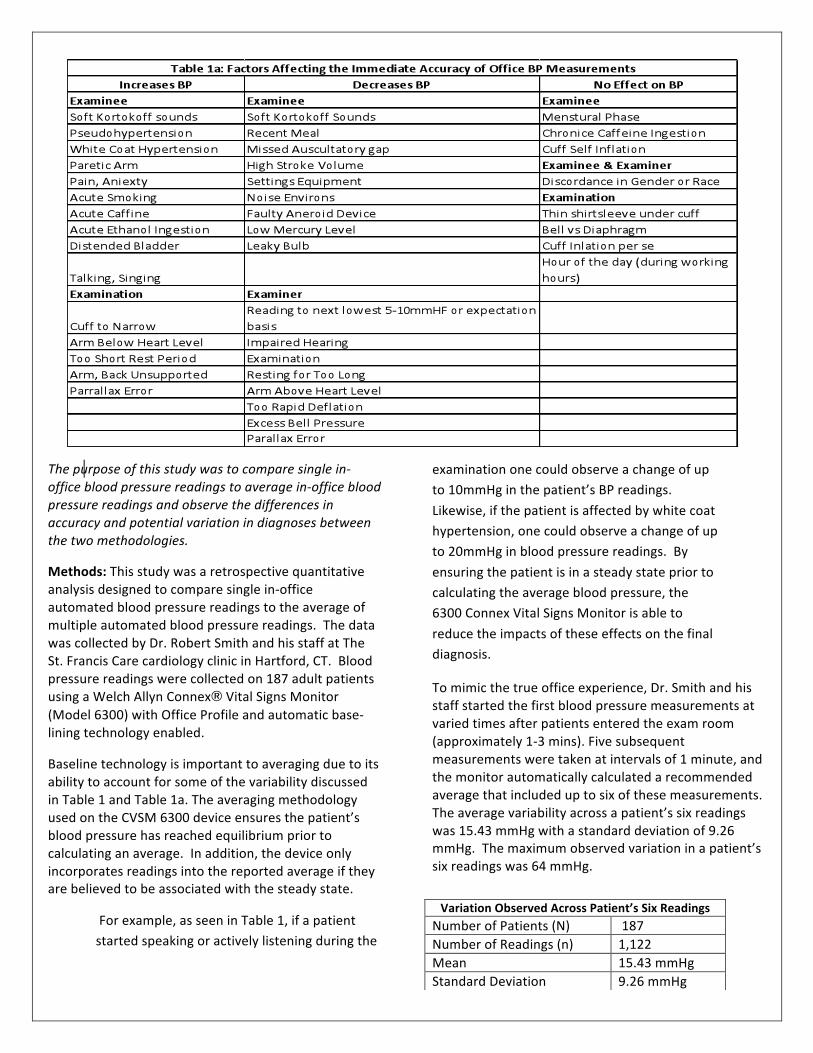
Baseline technology is important to averaging due to its ability to account for some of the variability discussed in Table 1 and Table 1a. The averaging methodology used on the CVSM 6300 device ensures the patient’s blood pressure has reached equilibrium prior to calculating an average. In addition, the device only incorporates readings into the reported average if they are believed to be associated with the steady state.
For example, as seen in Table 1, if a patient started speaking or actively listening during the
examination one could observe a change of up to 10mmHg in the patient’s BP readings.
Likewise, if the patient is affected by white coat hypertension, one could observe a change of up to 20mmHg in blood pressure readings. By
ensuring the patient is in a steady state prior to calculating the average blood pressure, the 6300 Connex Vital Signs Monitor is able to
reduce the impacts of these effects on the final diagnosis.
To mimic the true office experience, Dr. Smith and his staff started the first blood pressure measurements at varied times after patients entered the exam room (approximately 1-‐3 mins). Five subsequent measurements were taken at intervals of 1 minute, and the monitor automatically calculated a recommended average that included up to six of these measurements. The average variability across a patient’s six readings was 15.43 mmHg with a standard deviation of 9.26 mmHg. The maximum observed variation in a patient’s six readings was 64 mmHg.
Variation Observed Across Patient’s Six Readings Number of Patients (N) 187 Number of Readings (n) 1,122 Mean 15.43 mmHg Standard Deviation 9.26 mmHg
Clinical categorization of hypertension has traditionally followed the Joint National
Committee on Prevention, Detection, Evaluation and Treatment of High Blood Pressure (Table 2). The clinical diagnosis
between categories of hypertension can change with very small differences in readings (1 mmHg in some cases).
The distribution in Table 3 shows the frequency of the difference found between the highest and lowest readings in increments of 5mmHg. 75% (141 of 187) of the sample population exhibited variation in their six readings greater than 10mmHg. Given this variability, it is evident that using a single measurement instead of an average could result in misdiagnosis and treatment of these subjects. Furthermore, this illustrates the importance of averaging and the evaluation of blood pressure in a steady state to diminish the effects of reading to reading variability
Certain oscillometric blood pressure technologies eliminate the first reading from calculating the average, based on the assumption that it will be the highest reading and skew the average higher. However, only
41% of the first blood pressure readings were found to be the highest in each set of 6 measurements (Table 4). The technologies that eliminate the first reading under the assumption that it is highest therefore are not necessarily achieving more accurate representations of the patient’s blood pressure. To achieve a more accurate average, technologies should ensure the patient has achieved a steady state condition.
Results: (Table 6): 28 of the subjects (15%) had an initial systolic reading above 140 mmHg and an average below 140 mmHg. Of this group, the average drop from the first systolic reading to the averaged systolic reading was 18.7 mmHg. Given the JNC guidelines, patients in this group would have been categorized as hypertensive based on a single first reading but as pre-‐hypertensive or normal based on their averaged readings. 25 of the subjects (13%) had an initial systolic reading between 130 mmHg and 139 mmHg and an average below 130 mmHg. Of this group, the average drop from the initial systolic reading to the averaged systolic reading was 17.3 mmHg.
Table 4 Reading #
Frequency of Reading Being the Highest in a Set of 6
1 41% 2 15% 3 14% 4 6% 5 11% 6 14%
Table 6: Patient Diagnosis By Method
Normal
Pre-‐Hypertensive
Hypertensive
Single Reading 63 68 50
(6) Reading Average 79 81 22
Re-‐Categorization post Average Reading
16 13 28
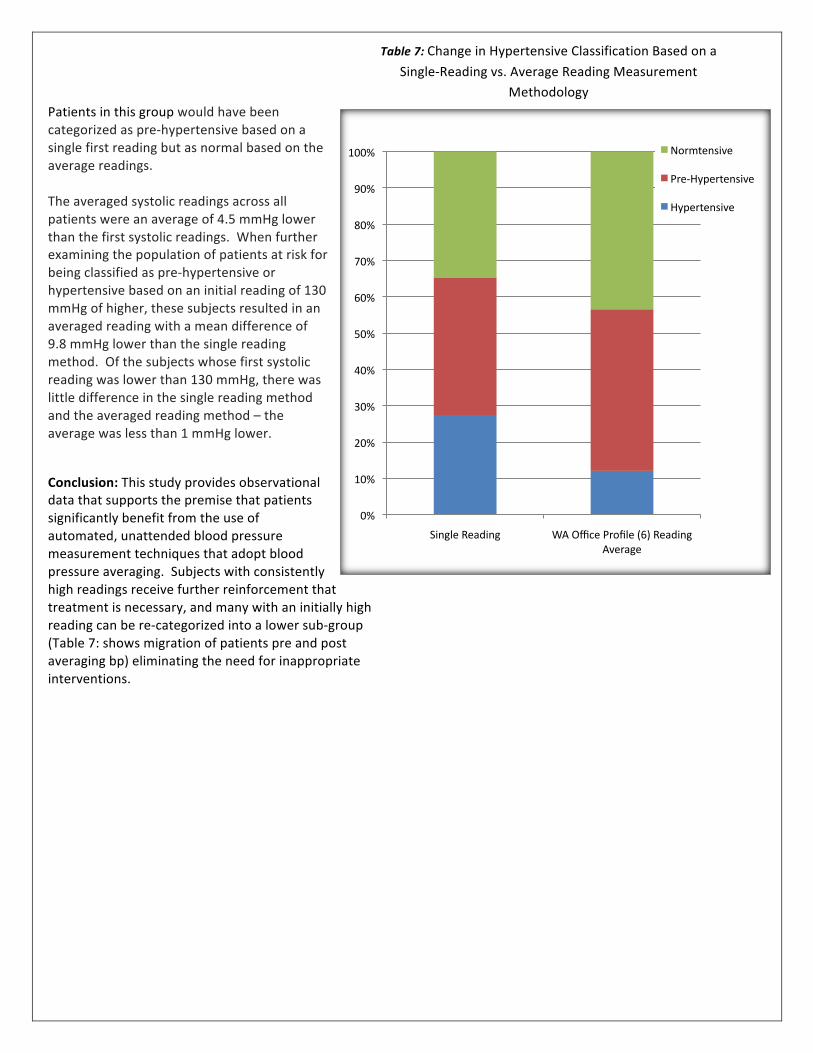
Patients in this group would have been categorized as pre-‐hypertensive based on a single first reading but as normal based on the average readings. The averaged systolic readings across all patients were an average of 4.5 mmHg lower than the first systolic readings. When further examining the population of patients at risk for being classified as pre-‐hypertensive or hypertensive based on an initial reading of 130 mmHg of higher, these subjects resulted in an averaged reading with a mean difference of 9.8 mmHg lower than the single reading method. Of the subjects whose first systolic reading was lower than 130 mmHg, there was little difference in the single reading method and the averaged reading method – the average was less than 1 mmHg lower.
Conclusion: This study provides observational data that supports the premise that patients significantly benefit from the use of automated, unattended blood pressure measurement techniques that adopt blood pressure averaging. Subjects with consistently high readings receive further reinforcement that treatment is necessary, and many with an initially high reading can be re-‐categorized into a lower sub-‐group (Table 7: shows migration of patients pre and post averaging bp) eliminating the need for inappropriate interventions.
0%
10%
20%
30%
40%
50%
60%
70%
80%
90%
100%
Single Reading WA Office Profile (6) Reading Average
Normtensive
Pre-‐Hypertensive
Hypertensive
Table 7: Change in Hypertensive Classification Based on a
Single-‐Reading vs. Average Reading Measurement Methodology
REFERENCES Linda Beckett, Marshall Godwin. The BpTRU automatic blood pressure monitor compare to 24 hour ambulatory blood pressure monitoring in the assessment of blood pressure in patients with hypertension. BMC Cardiovascular Disorder 2005, 5:18 doi 10.1186/1471-‐2261-‐5-‐18
Norman M Kaplan, Ronald G Victor. Kaplans Clinical Hypertension Tenth Edition. Lippincot Williams & Wilkins 2010
Thomas G. Pickering, John E Hall, Lawrence J Appel, Bonita E Falkner, John Graves, Martha N Hill, Daniel W jones, Theodore Kurtz, Sheldon G Sheps and Edward J Roccella. Recommendations for Blood Pressure Measurement in Humans and Experimental Animals: Part 1: Blood Pressure Measurement in Humans: A Statement for Professional from the Subcommittee of Professional and Public Education of the American Heart Association Council on High Blood Pressure Research. Hypertension 2005;45;142-‐161 originally published online Dec 20 2004; DOI 10.1161/01.HYP.0000150859.47929.8e
Rostrup M Mundal MH, Westheim A et al. Awareness of high blood pressure increased arterial plasma catecholamine’s, platelet noradrenaline and adrenergic responses to mental stress. J Hypertens 1991:9: 159-‐166
Wisconsin Heart Disease & Stroke Prevention Program Bureau of Community Health Promotion Division of Public Health Wisconsin Department of Health Services Blood Pressure Measurement Toolkit: Improving Accuracy, Enhancing Care, 2010.
Dr. Robert Smith is board certificated in Internal Medicine and Cardiology. He is a practicing cardiologist at Saint Francis Hospital and Medical Center and an associate professor of Medicine at the University Of Connecticut School Of Medicine in Farmington CT where he attended medical school.