INDUSTRY WAGE SURVEY Machinery Manufacturing l MARCH-MAY 1961 Bulletin No. 1309 UNITED STATES DEPARTMENT OF LABOR Arthur J. Goldberg, Secretary BUREAU OF LABOR STATISTICS Ewan Clague, Commissioner Digitized for FRASER http://fraser.stlouisfed.org/ Federal Reserve Bank of St. Louis
Transcript
INDUSTRY WAGE SURVEYMachinery Manufacturing
lMARCH-MAY 1961
Bulletin No. 1309
UN ITED STA TES DEPA RTM EN T OF LABORArthur J. Goldberg, Secretary
BUREAU OF LABOR STA TISTIC S Ewan Clague, Commissioner
Digitized for FRASER http://fraser.stlouisfed.org/ Federal Reserve Bank of St. Louis
INDUSTRY WAGE SURVEY
Machinery Manufacturing
M A R C H -M A Y 1961
B u lletin No. 1309November 1961
UNITED STATES DEPARTMENT OF LABORArthur J. Goldberg, Secretary j l ' M i
v -BUREAU OF LABOR STA TISTIC S
Ewan Clague, Commissioner
For sale by the Superintendent of Documents, U.S. Government Printing Office, Washington 25, D.C. Price 30 centsDigitized for FRASER http://fraser.stlouisfed.org/ Federal Reserve Bank of St. Louis
Digitized for FRASER http://fraser.stlouisfed.org/ Federal Reserve Bank of St. Louis
Preface
The present study is the 15th in a series of surveys of occupational wages in machinery (nonelectrical) manufacturing industries, conducted by the Bureau of Labor Statistics, Wage data for selected occupations in 21 areas were obtained largely by m ail between March and May 1961 from establishments visited by Bureau field economists in a sim ilar study conducted during the winter of 1959—60, Personal visits were made to nonrespondents and to respondents reporting unusual changes since the previous survey. Individual reports issued at the com pletion of the survey in each area, usually within a few weeks after the payroll period studied, are available on request. Most of the occupational data relate to men workers but data for a few women1 s jobs are shown in some of the areas.
This report brings together and analyzes data for all 21 areas. Occupational data are presented for the machinery industries as a whole in each of the 21 areas and separately for machine tools, metal cutting types and for special dies and tools, die sets, jigs and fixtures, and m achine-tool accessories and measuring devices in selected areas. The distributions of workers by occupational earnings contained in the separate area releases are reported here for six jobs. Data on wage practices and supplementary wage benefits were not obtained in the cu rrent study; however, such information from the previous study is summarized in this report.
This report was prepared by Fred W. Mohr of the Bureau*s Division of Wages and Industrial Relations. Field work for the survey was directed by the Assistant Regional D irectors for Wages and Industrial Relations.
i i i
Digitized for FRASER http://fraser.stlouisfed.org/ Federal Reserve Bank of St. Louis
Digitized for FRASER http://fraser.stlouisfed.org/ Federal Reserve Bank of St. Louis
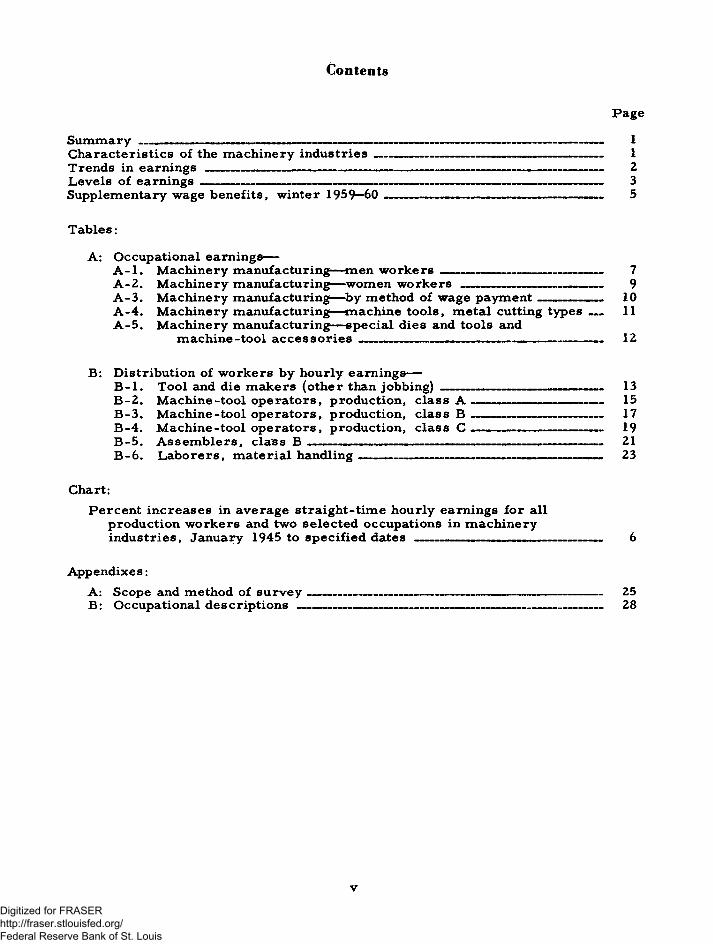
Contents
Page
S u m m a ry ------------- --- ----------- ----------- ----------------- ----------------------------------------------------— ~ 1C h aracteristics o f the m ach inery in d u s tr ie s ______________________________________ 1Trends in e a r n in g s __________________________________________________________________ 2L evels o f e a rn in g s ____________________________________________________ 3Supplem entary wage benefits, w inter 1959—60 ---------------------------- --------------------------- 5
Tables:
A : Occupational earnings—A - l . M achinery m anufacturing— m en w o r k e r s ___________________________ 7A - 2. M achinery m anufacturing— women w o r k e r s ______________________ 9A - 3. M achinery m anufacturing— by m ethod o f wage p a y m en t---------------- 10A -4 . M achinery m anufacturing— m achine too ls , m etal cutting t y p e s __ 11A - 5. M achinery m anufacturing— sp ecia l d ies and tools and
m ach in e -too l a c c e s s o r i e s __________________________________ ______ 12
B: D istribution o f w orkers by hourly earnings—B - l . T oo l and die m akers (other than jo b b in g )----------------------------- —--------- 13B -2 . M ach ine-too l op era tors , production , c la ss A ----------------- 15B -3 . M ach ine-too l op era tors , production , c la ss B ----------------------------------------17B -4 . M ach ine-too l o p e ra to rs , production , c la ss C ________ 19B -5 . A ssem b lers , c l as s B ------------------------------------------------------------------------- 21B -6 . L a b orers , m ateria l h an d lin g________________________________________ 23
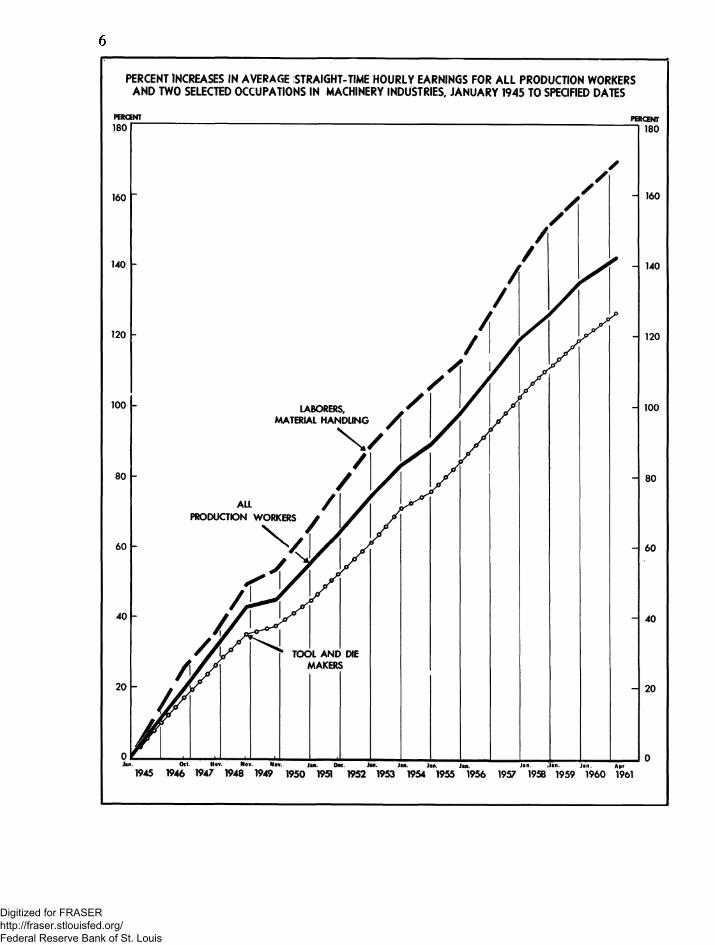
Chart:P ercen t in crea ses in average stra igh t-tim e hourly earnings fo r a ll
production w ork ers and two se lected occupations in m ach inery industries, January 1945 to sp ecified dates ______________________ ________ 6
Appendixes:A: Scope and m ethod o f s u r v e y --------------------------------------------------------------------------- 25B: O ccupational d e s c r ip t io n s ------------------------------------------------------------------------------ 28
vDigitized for FRASER http://fraser.stlouisfed.org/ Federal Reserve Bank of St. Louis
Digitized for FRASER http://fraser.stlouisfed.org/ Federal Reserve Bank of St. Louis
Industry W age Survey-—
Machinery Manufacturing, March—May 1961
Summary
A verage stra ight-tim e hourly earnings o f production and related w ork ers in the n on e lectrica l m ach inery industries ro s e by 3. 1 p ercen t during the past year in 21 a reas surveyed by the Bureau o f L abor Statistics in MarchHMay 1961. 1
D etroit, with average stra igh t-tim e hourly earnings above $3. 15 fo r m ost sk illed jo b s studied, continued to lead in pay lev e ls fo r m ach inery w ork ers am ong the areas studied. T ool and die m ak ers w ere generally the h ighest paid occu p a tional group studied, averaging m ore than $3 an hour in a m a jor ity o f the a rea s .
C h aracteristics o f the M achinery Industries
M achinery (n on electrica l) m anufacturing, as defined fo r pu rp oses o f this study, includes a group o f m etalw orking industries w hose products d iffer greatly in s ize , com plexity , and use. F or exam ple, som e establishm ents w ere p r im a rily engaged in the production o f ba ll and ro lle r bearings, w hereas others m anufactured such item s as industrial m ach inery, p re c is io n m etalw orking too ls , o r e le ctron ic com puting m ach ines. In the 21 areas com bined, approxim ately on e -fifth o f the w ork ers w ere em ployed in each o f 3 industry groups— construction , m ining, and m ateria l handling m ach inery and equipment; m etalw orking m ach in ery and equipm ent; and general industrial m ach inery and equipment.
V arious types o f m ach inery w ere m anufactured in each o f the a rea s studied. In som e areas, how ever, a substantial p rop ortion o f the w ork ers w ere engaged in the production o f a particu lar group o f m ach inery item s. F or exam ple, a la rge percentage o f the w ork ers w ere em ployed in the m anufacture o f fa rm m ach inery and equipment in M ilwaukee; o ilfie ld m ach inery and equipm ent in Dallas and Houston; and m etalw orking m ach inery and equipm ent in Cleveland, D etroit, Pittsburgh, and W orcester .
At the tim e o f the survey, estim ated em ploym ent in the m ach inery in du stries in the resp ectiv e a rea s ranged fro m few er than 3, 500 in Denver and Portland to 77, 000 in Chicago. Other m a jor a reas included D etroit (59, 000), Milwaukee (49, 000), L os A ngeles—Long Beach (37, 000), and C leveland (35, 000). Em ploym ent a lso exceeded 25, 000 in H artford, Newark and J e rse y City, and P h ila delphia; w as betw een 10, 000 and 25, 000 in Boston, Buffalo, Houston, M inneapolis— St. Paul, New Y ork City, P ittsburgh, St. L ouis, and San F ra n c isco —Oakland; and betw een 7, 000 and 10, 000 in B altim ore, D allas, and W orcester .
A pproxim ately tw o-fifth s o f the estim ated h a lf-m illion w ork ers in the m a ch inery industries in the 21 areas w ere em ployed in establishm ents with few er than 250 w ork ers , another tw o-fifth s in establishm ents with 250 to 2, 499 w ork ers , and on e-fifth in establishm ents em ploying 2, 500 or m ore . The la rg es t o f these three estab lish m en t-s ize groups accounted fo r a m a jority o f the w ork ers in H artford and M ilwaukee and a lm ost on e-h a lf in Philadelphia. In contrast, establishm ents
1 See appendix A fo r scop e and m ethod o f survey. F or defin itions o f a reas and the p a y ro ll p eriod cov ered in the resp ectiv e a reas, see table in appendix A.
1Digitized for FRASER http://fraser.stlouisfed.org/ Federal Reserve Bank of St. Louis
2
with few er than 250 w ork ers em ployed a m a jority o f the w ork ers in D allas, D enver, L os A ngeles—Long B each, New Y ork City, Portland (O r e g .), and San F ra n c isco — Oakland, and a lm ost on e-h a lf in Boston, C hicago, and D etroit.
Data concern ing unionization w ere not obtained in the 1961 study. At the tim e of the 1959—60 survey, how ever, nearly th ree-fou rth s o f the production em p loyees in the 21 a reas com bined w ere in establishm ents having labor-m anagem ent con tracts coverin g a m a jority o f their w ork ers . 2 By area , con tract cov era ge ranged from v irtually a ll o f the production w ork ers in San F ra n c isco —Oakland to about tw o-fifths in B altim ore and Los A ngeles—Long B each, and one-eighth in Dallas*
Data concern ing the prevalen ce o f incentive wage paym ents a lso w ere not obtained in the cu rren t study. At the time o f the prev iou s survey, a m ajority o f the production w ork ers in each o f the 21 areas studied w ere paid on an hourly- rate ba s is . The prop ortion s o f the w ork ers who w ere paid on an incentive basis ranged from le ss than one-tenth in D allas, D etroit, Houston, and the three W est Coast c it ie s , to about tw o-fifths in H artford and W orcester .
Trends in Earnings
A verage stra ight-tim e hourly earnings o f production w ork ers in the 21 areas studied ro se 3. 1 percent between the w inter o f 1959—60 and M a rch - May 1961, com pared with an in crea se o f 4. 1 percent between the w inters of 1958-59 and 1959-60.
In a m a jority o f the a rea s , changes in average stra ight-tim e hourly pay leve ls between the pay p eriod s studied in I960 and 1961 w ere within a range of 3 to 4. 5 percen t. The in crea se was greatest in M inneapolis—St. Paul (5 .9 percent)* A verage changes in two areas am ounted to le s s than 2 percen t. V ariations in wage m ovem ents am ong areas m ay be partly attributable to the tim ing and f r e quency o f wage negotiations am ong establishm ents in the a rea s . F or exam ple, Houston which had p ra ctica lly no change since the I960 survey p eriod had the la rgest in crea se— 7 .4 percent— between 1959 and I960 and the sm allest in crea se between 1958 and 1959*
G eneral wage changes usually account for m ost o f the y e a r -to -y e a r m ov e m ent in earnings; how ever, other fa cto rs such as labor turnover, incentive earn ings, and changes in em ploym ent in establishm ents with different pay le v e ls , a lso a ffect the trend in w ages. Thus, during a period o f declining econ om ic activ ity , an in crea se in the ov era ll lev e l o f w ages m ay re fle ct a reduction in the p ro p o r tion o f w ork ers with the least sen iority and the low est leve l of earnings, rather than any adjustm ent in individual rates* During p eriod s o f expansion, the r e v erse m ay be true.
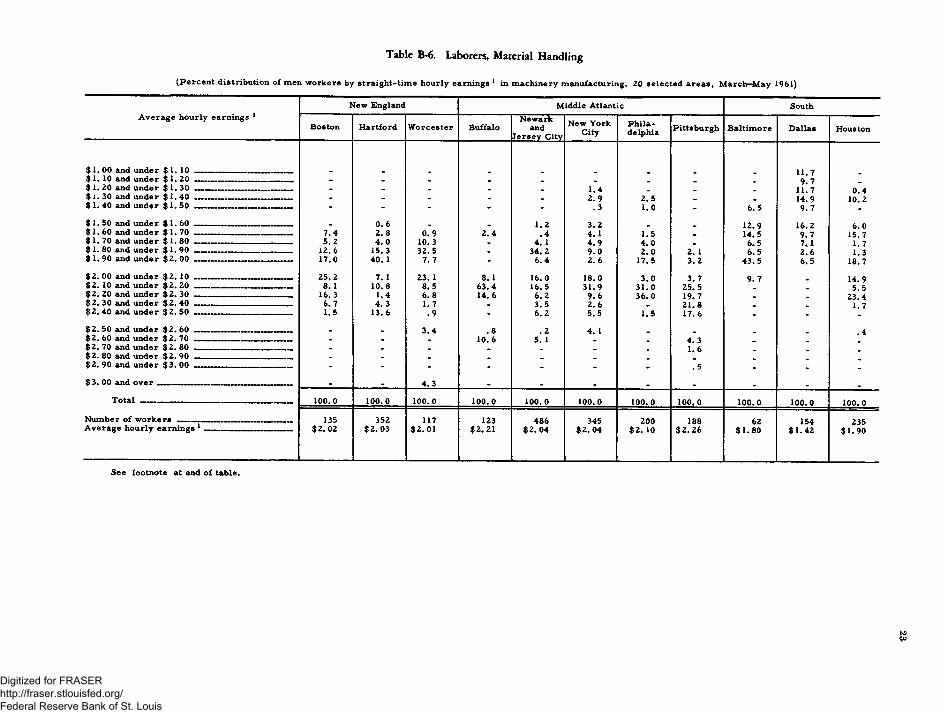
The extent o f wage m ovem ent varied between the sk illed and unskilled occupations studied, as w ell as am ong areas* F or the 21 areas com bined, av erage stra ight-tim e hourly earnings o f tool and die m akers (other than jobbing) ro se 3 .6 percent, or about 11 cents an hour during I960, com pared with an incre a se o f 4 p ercen t, or about 8 cents fo r m ateria l handling laborers* Since 1945, when the fir s t occupational wage relationship study was conducted fo r the m achinery in du stries, there has been a substantial reduction in the percentage d ifferentia ls between the w ages o f these two groups* During this p eriod , av erage earnings o f m ateria l handling la b orers in crea sed by 169.7 percen t and
2 See Wage Structure: M achinery M anufacturing, W inter 1959—60, BLS R eport 170 ( I 960JT
Digitized for FRASER http://fraser.stlouisfed.org/ Federal Reserve Bank of St. Louis
3
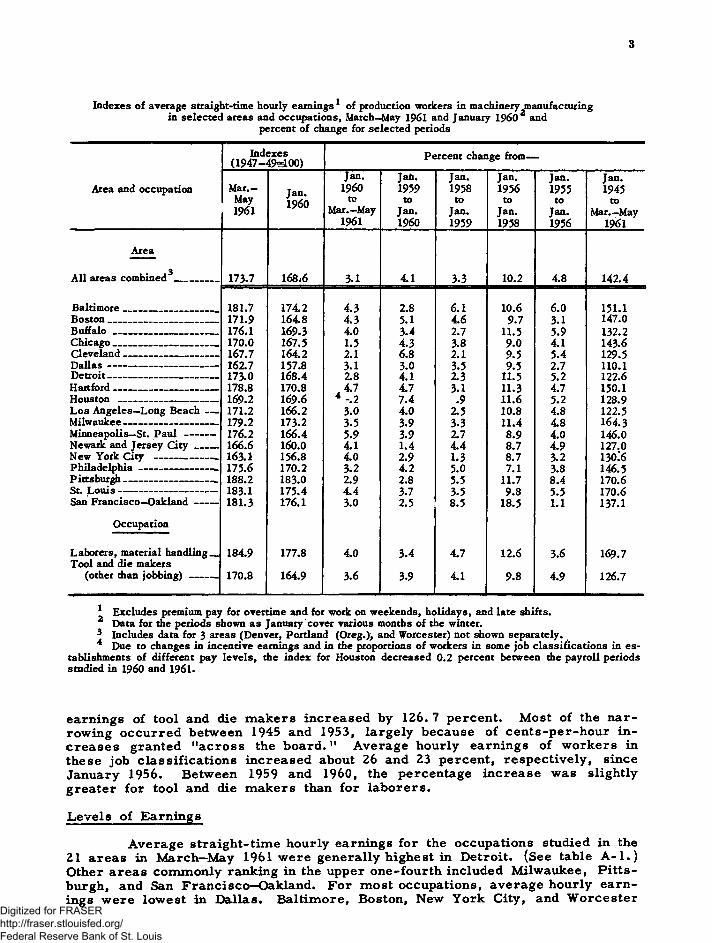
Indexes of average straight-time hourly earnings1 of production workers in machinery manufacturing in selected areas and occupations, March—May 1961 and January I9602 and
percent of change for selected periods
Indexes(1947-49=100) Percent change from—
Area and occupation Mar.-May1961
Jan.I960
Jan.1960
toMar.-May
1961
Jail.1959to
Jan.1960
Jan.1958 to
Jan.1959
Jan.1956to
jan.1958
Jan.1955to
Jan.1956
Jan.1945
toMar.—May
1961
Area
All areas combined3________ 173.7 168.6 3.1 4.1 3.3 10.2 4.8 142.4
* Excludes premium pay for overtime and for work on weekends, holidays, and late shifts.2 Data for the periods shown as January cover various months of the winter.3 Includes data for 3 areas (Denver, Portland (Oreg.), and Worcester) not shown separately.4 Due to changes in incentive earnings and in the proportions of workers in some job classifications in es
tablishments of different pay levels, the index for Houston decreased 0.2 percent between die payroll periods studied in I960 and 1961.
earnings o f tool and die m akers in crea sed by 126. 7 percen t. M ost of the n a rrow ing o ccu rre d between 1945 and 1953, la rge ly because o f cen ts -p er-h ou r in c r e a s e s granted "a c r o s s the b o a r d .11 A verage hourly earnings o f w ork ers in these job c la ss ifica tion s in crea sed about 26 and 23 percen t, resp ectiv e ly , since January 1956. Between 1959 and I960, the percentage in crea se was slightly g reater fo r tool and die m akers than fo r la b orers .
L evels o f Earnings
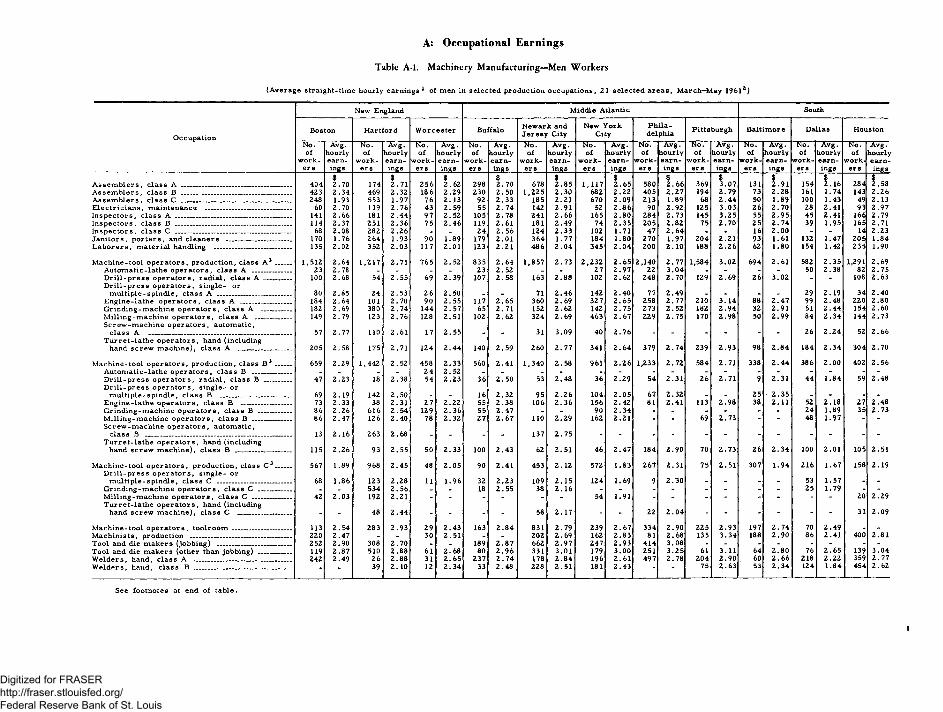
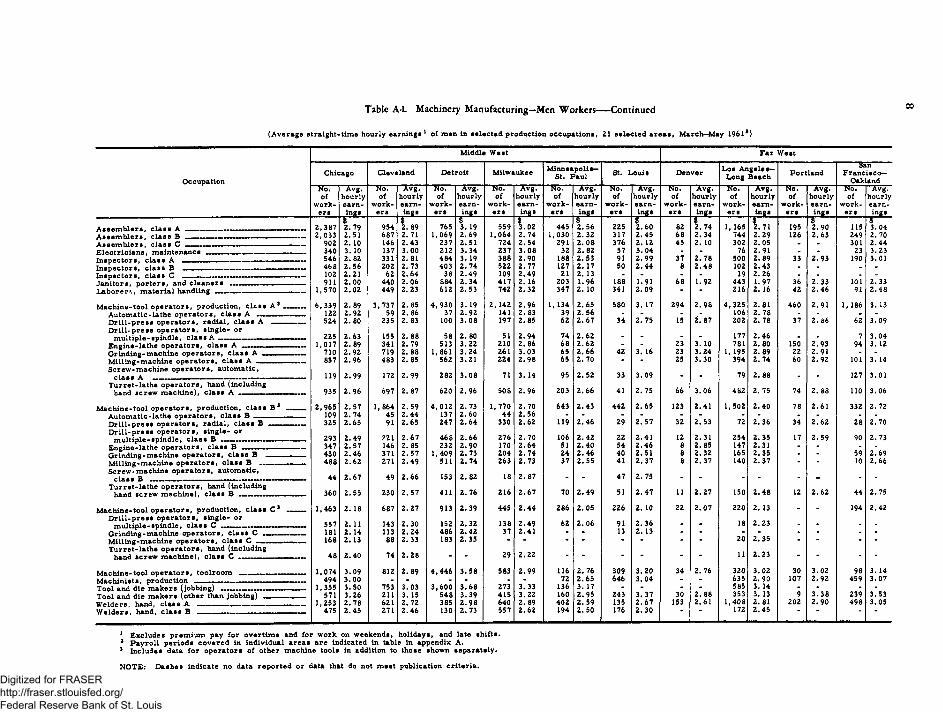
A verage stra ight-tim e hourly earnings fo r the occupations studied in the 21 areas in M arch -M ay 1961 w ere generally h ighest in D etroit. (See table A - l . ) Other a reas com m only ranking in the upper on e-fou rth included M ilwaukee, P itts burgh, and San F ra n c isco —Oakland. F or m ost occupations, average hourly earn ings w ere low est in D allas. B altim ore, Boston, New Y ork City, and W orcester
Digitized for FRASER http://fraser.stlouisfed.org/ Federal Reserve Bank of St. Louis
4
ranked com paratively low fo r severa l occupations. D ifferen ces between the highest and the low est area average hourly earnings fo r m ost occupations ranged from 80 cents to $1. 10.
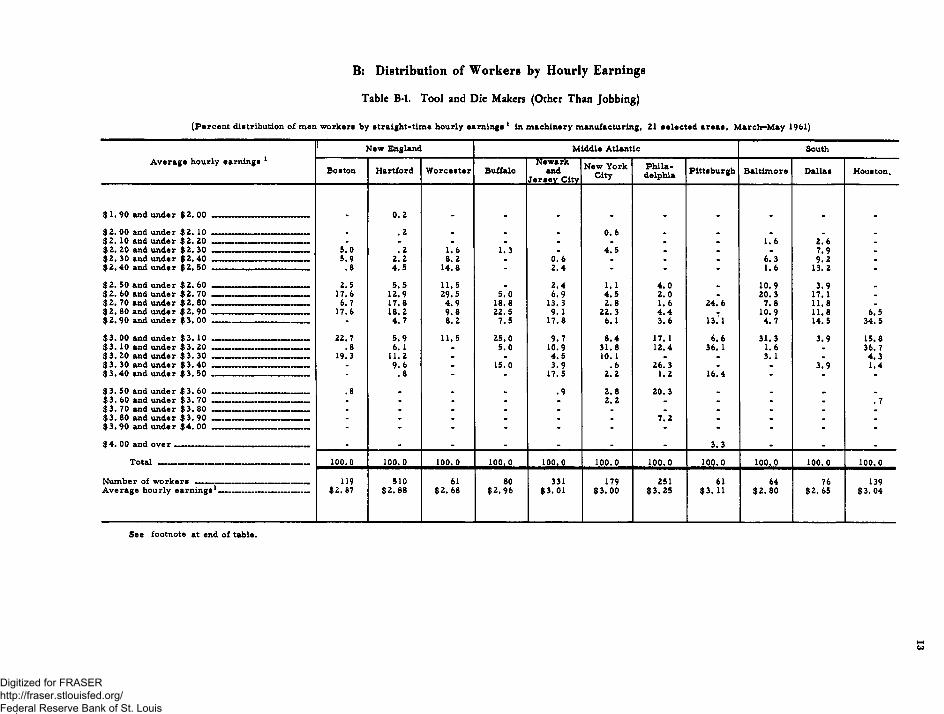
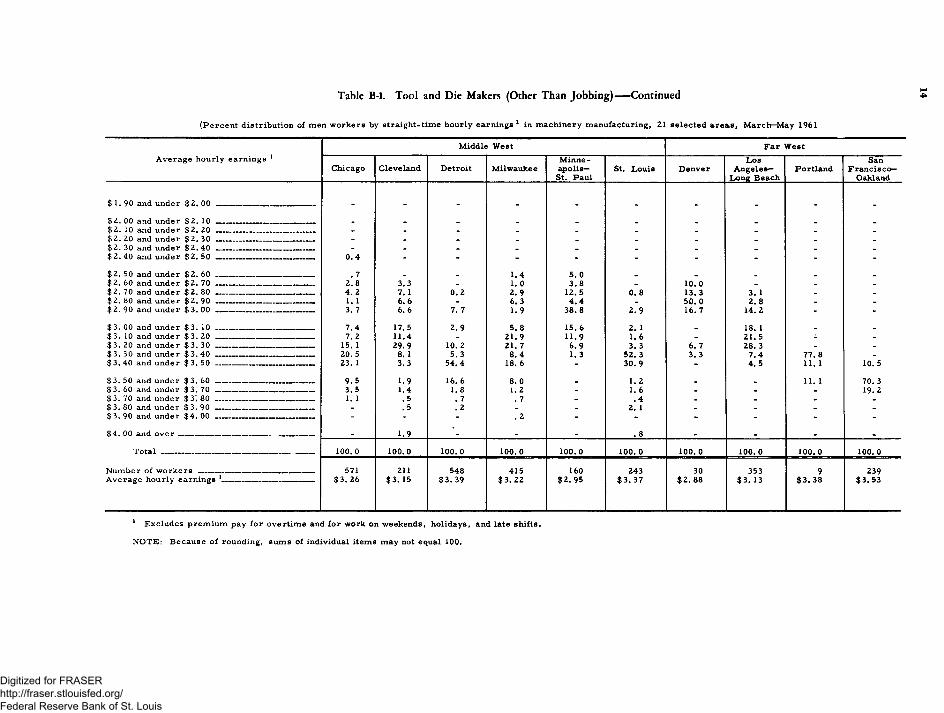
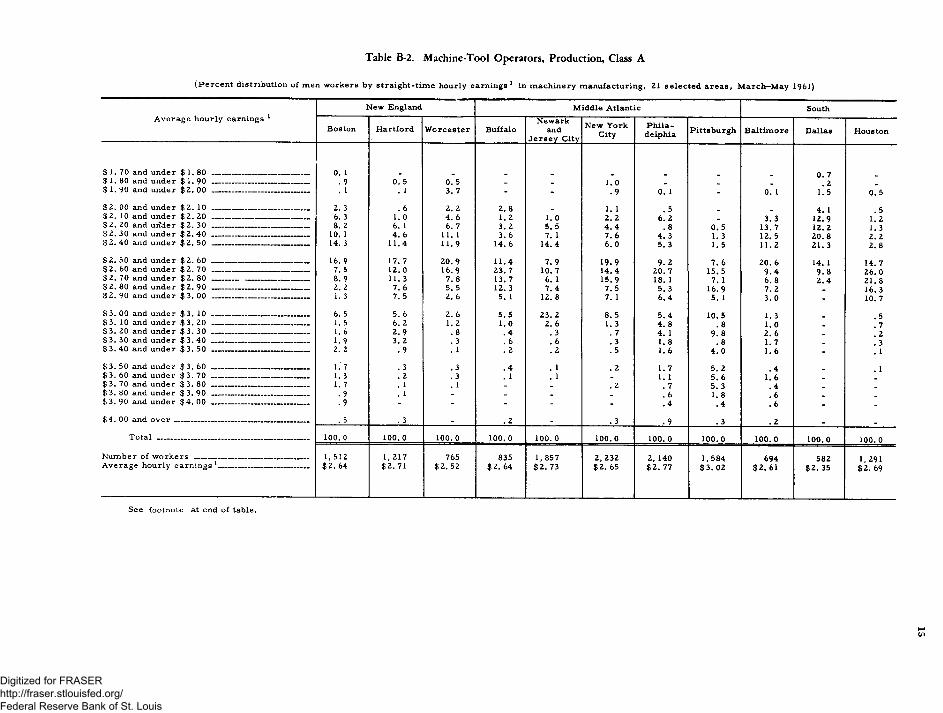
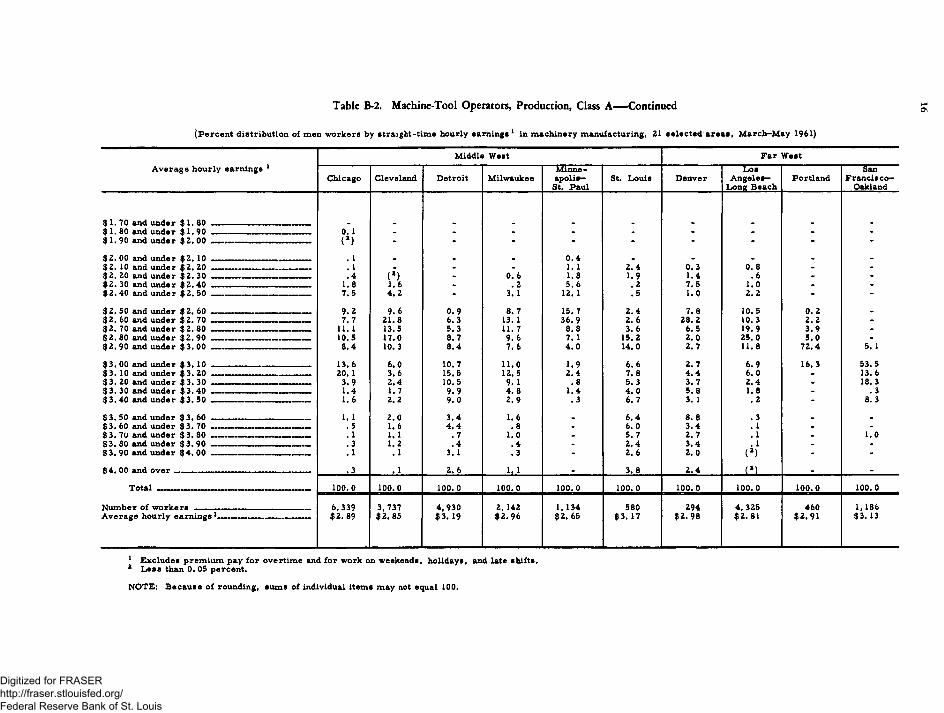
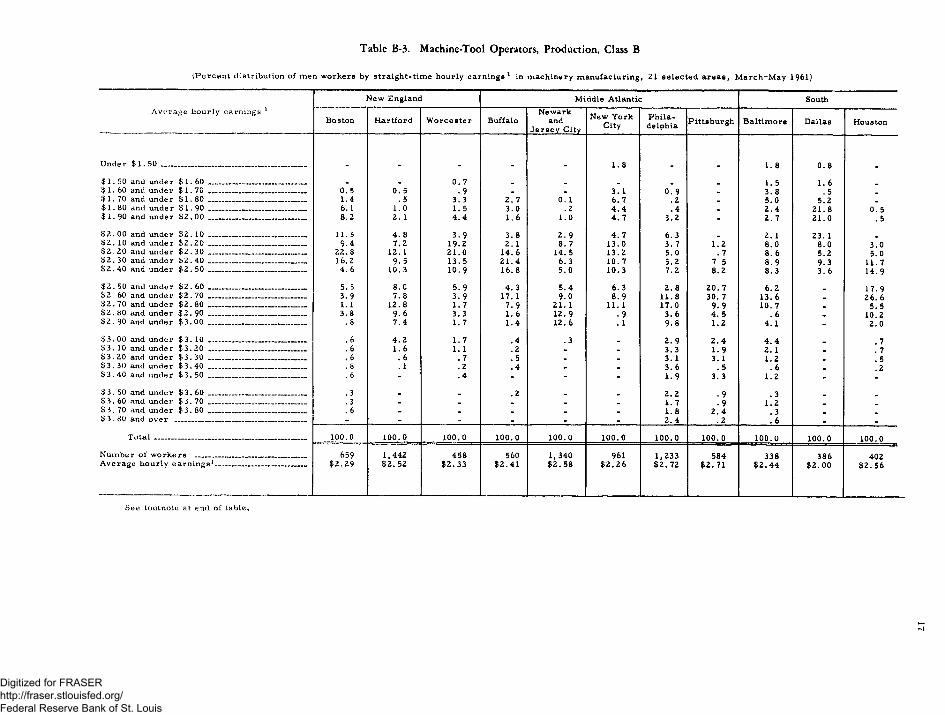
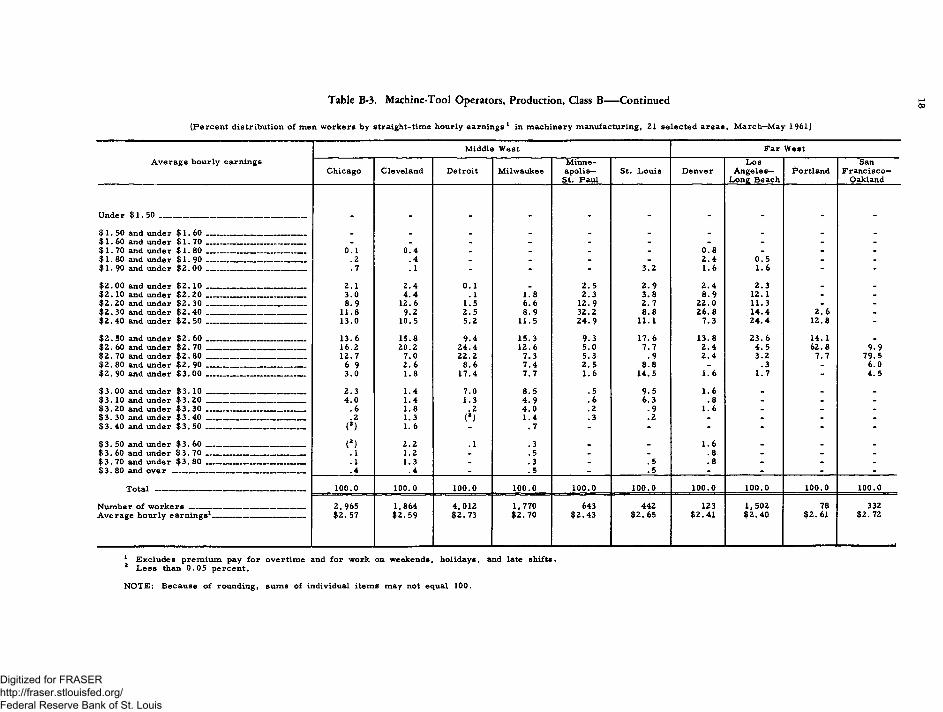
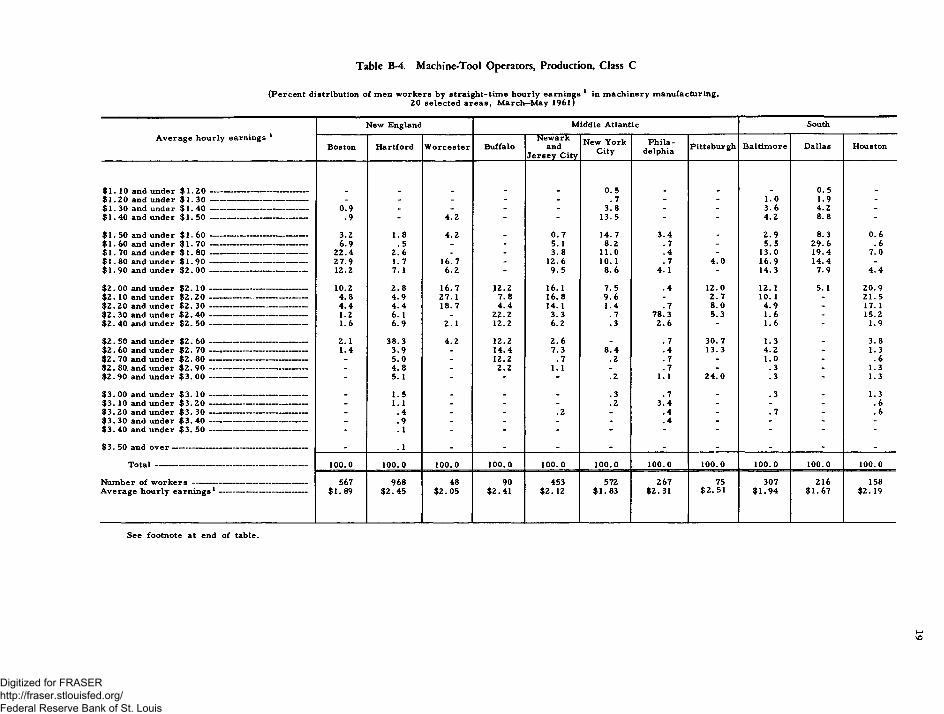
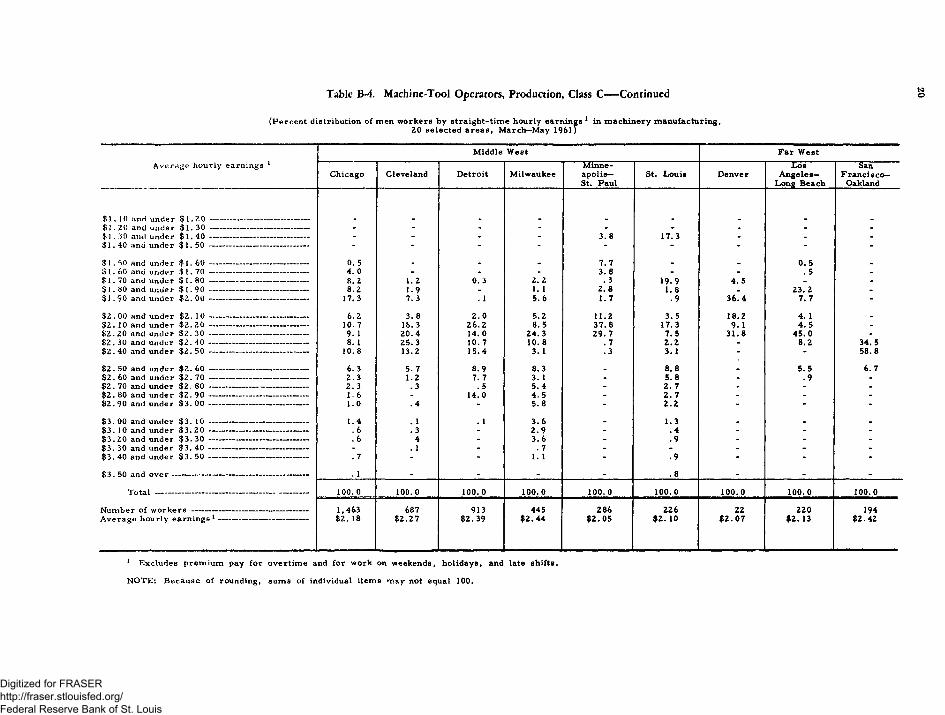
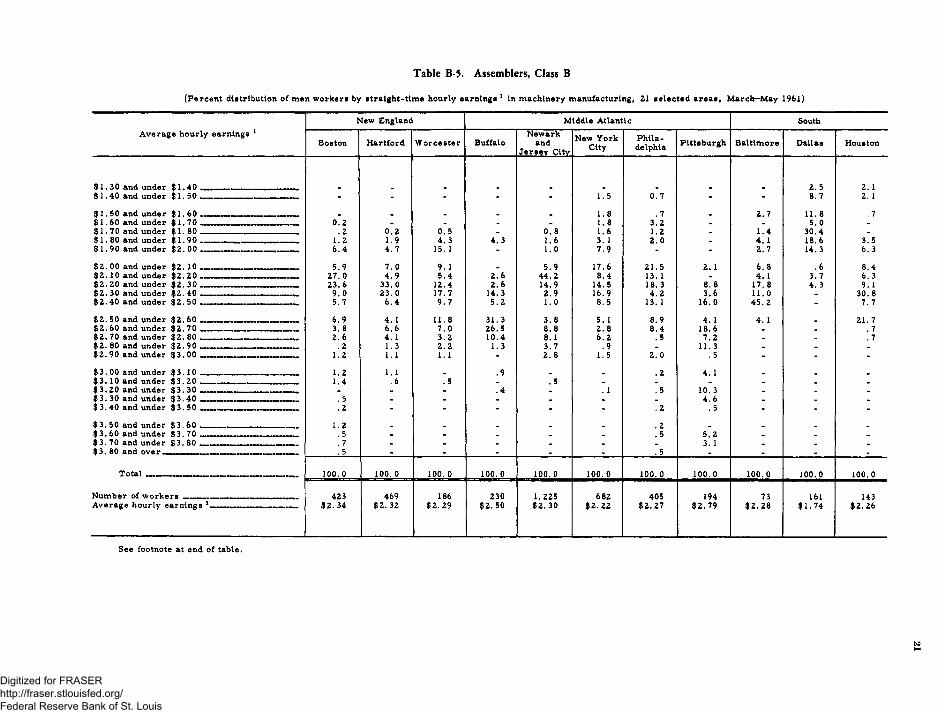
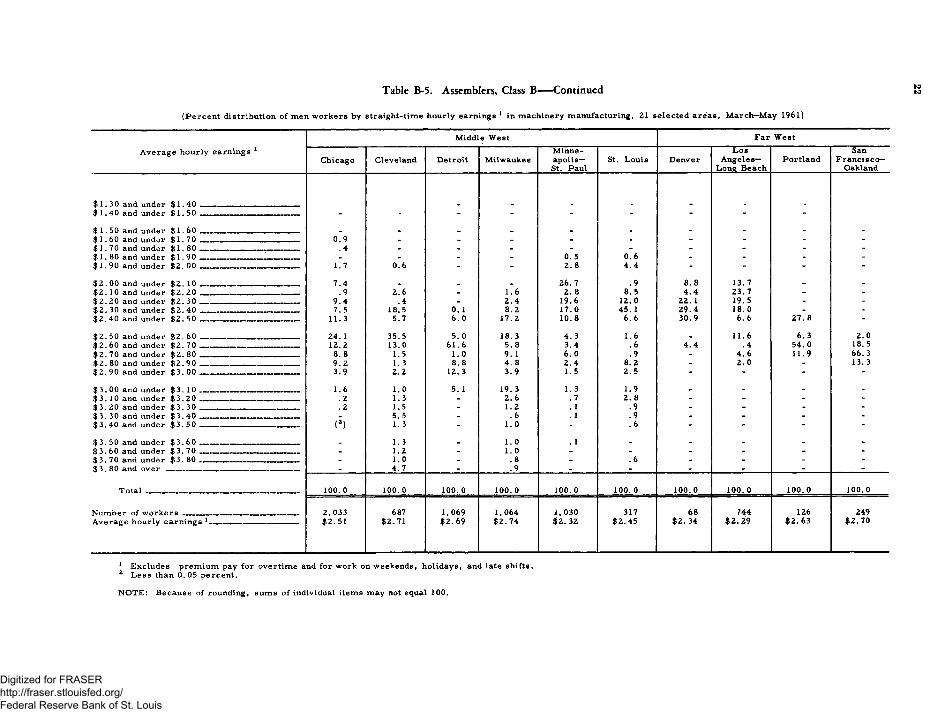
T oo l and die m akers w ere the highest paid occupational group studied in m ost a rea s . Men engaged in the production o r m aintenance o f too ls and d ies used in the establishm ents in w hich they w ere em ployed had average earnings o f $3 or m ore in 13 o f the 21 a rea s . Their average earnings ranged from $ 2 .6 5 an hour in D allas to $ 3 .5 3 in San F ra n cisco—Oakland. M ach ine-tool op era tors , who set up their own m achines and p e r fo rm a variety o f m achining operations to c lo s e to leran ces (c la ss A ), had average hourly earnings ranging fro m $2. 35 in D allas to $3 . 19 in D etroit; in about half o f the a re a s , their average earnings w ere above $2. 75 an hour. A rea averages fo r m en in the interm ediate group o f m a ch in e -too l op era tors (c la ss B) ranged from $2 to $2 . 73 and fo r those who p erform ed m ore routine, repetitive operations (c la ss C), fro m $ 1 .6 7 to $ 2 .5 1 .
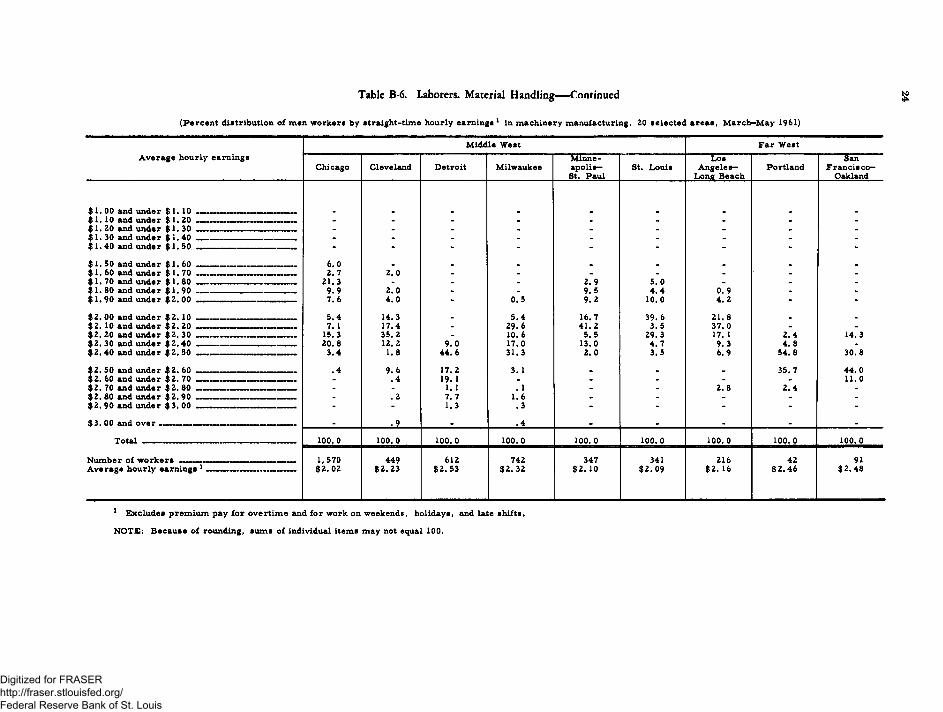
Janitors and c lea n ers , the low est paid o f the m en 's job s studied in nearly a ll a rea s , averaged from $ 1 .4 7 an hour in Dallas to $ 2 .3 4 in D etroit. W here com p arison s w ere p o s s ib le , area average earnings fo r m ateria l handling la b o re rs w ere genera lly from 10 to 20 cents h igher. D allas and B altim ore w ere the only a reas in w hich w ork ers in either o f these job s averaged le s s than $1. 75 an hour.
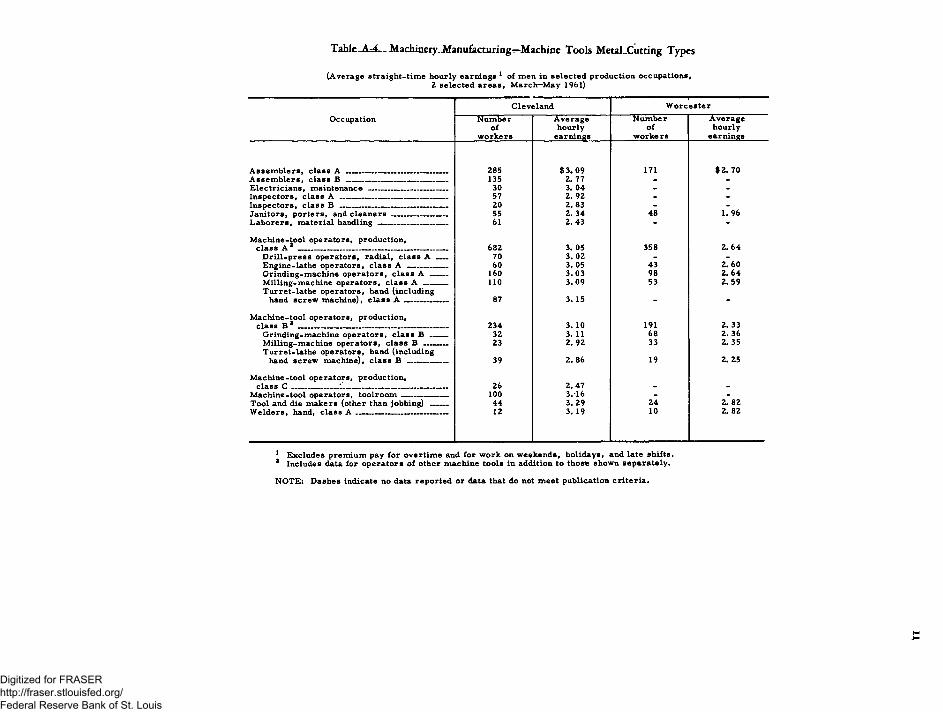
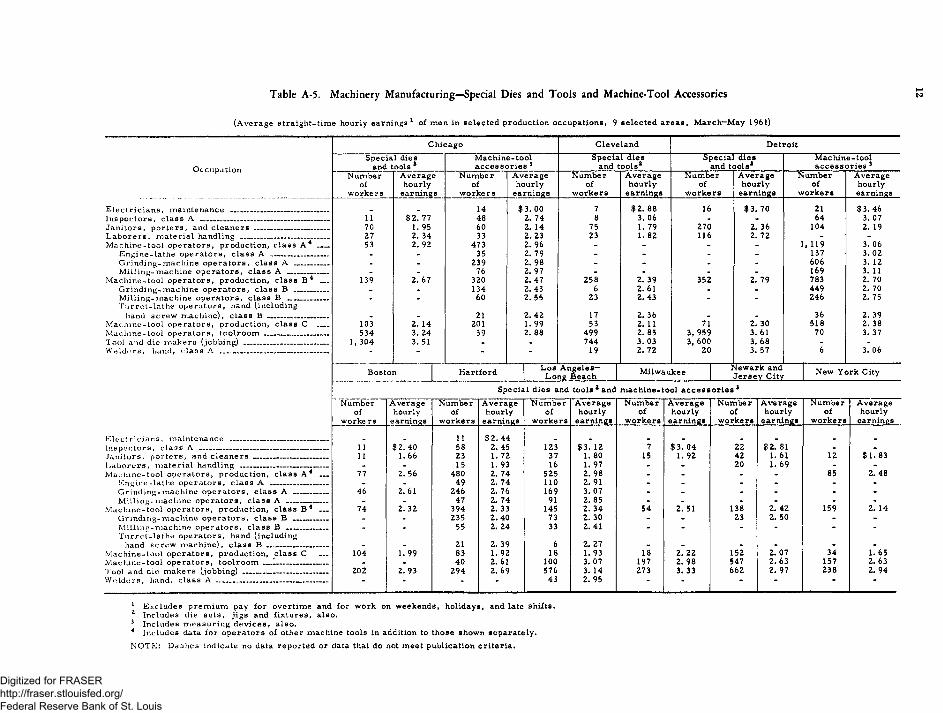
In C leveland, a cen ter o f m anufacture o f m etal cutting types o f m achine too ls , occupational average earnings in this branch o f the industry w ere genera lly h igher fo r m ost o f the job s w hich cou ld be com pared than in the m ach inery in du stries as a w hole. (See table A - 4 . ) In Chicago and D etroit, the two la rgest m ach inery producing a rea s , pay lev e ls fo r m ost o f the job s that cou ld be c o m pared w ere higher in shops producing sp ecia l d ies and to o ls , die sets , jig s and fixtu res than in plants m anufacturing m ach in e -too l a c c e s s o r ie s and m easuring d ev ices (table A -5 ).
Data w ere a lso tabulated fo r the sp ecia l d ies and too ls industry in C leve land and fo r sp ecia l d ies and too ls and m ach in e-too l a c c e s s o r ie s industries in B oston , H artford , L os A ngeles—Long B each, M ilwaukee, Newark and Jersey City, and New Y ork City; o ilfie ld m ach inery in L os A ngeles—Long B each; paper and printing m ach inery in New Y ork City; and textile m ach inery in Philadelphia.
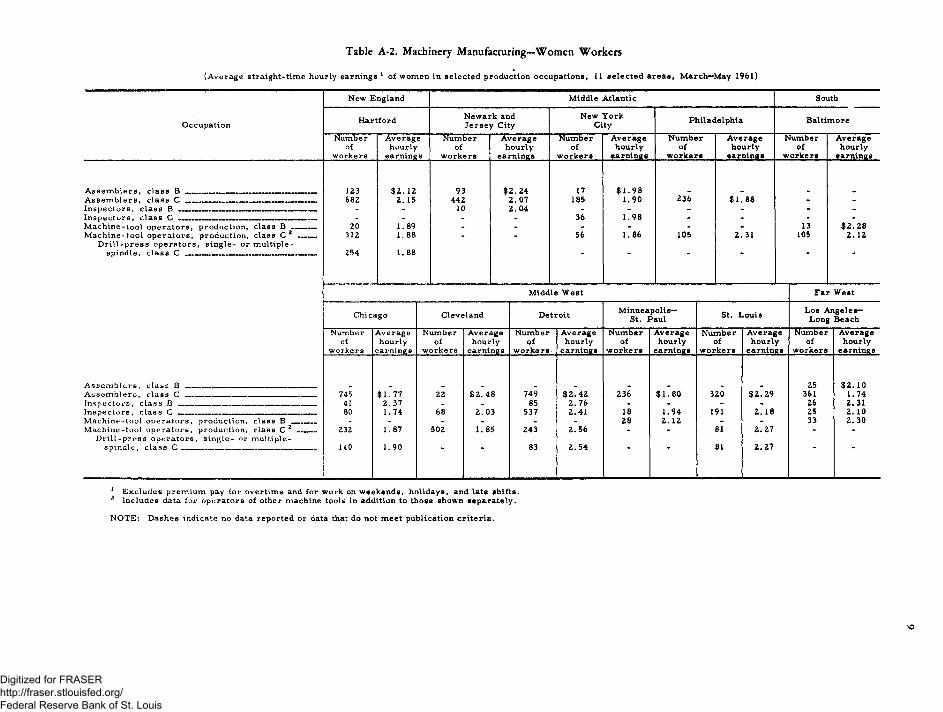
W om en, accounting fo r a re la tive ly insignificant prop ortion o f the w ork e rs in the m achinery in du stries, 3 w ere m ost com m only em ployed in routine a s sem bly and inspection o r repetitive m achine operations. In the 10 a rea s fo r w hich data a re presented in table A -2 fo r those perform in g routine assem bly operations (c la ss C), their average earnings ranged from $ 1 .7 4 in L os A n g e le s - Long B each to $ 2 .4 8 in C leveland.
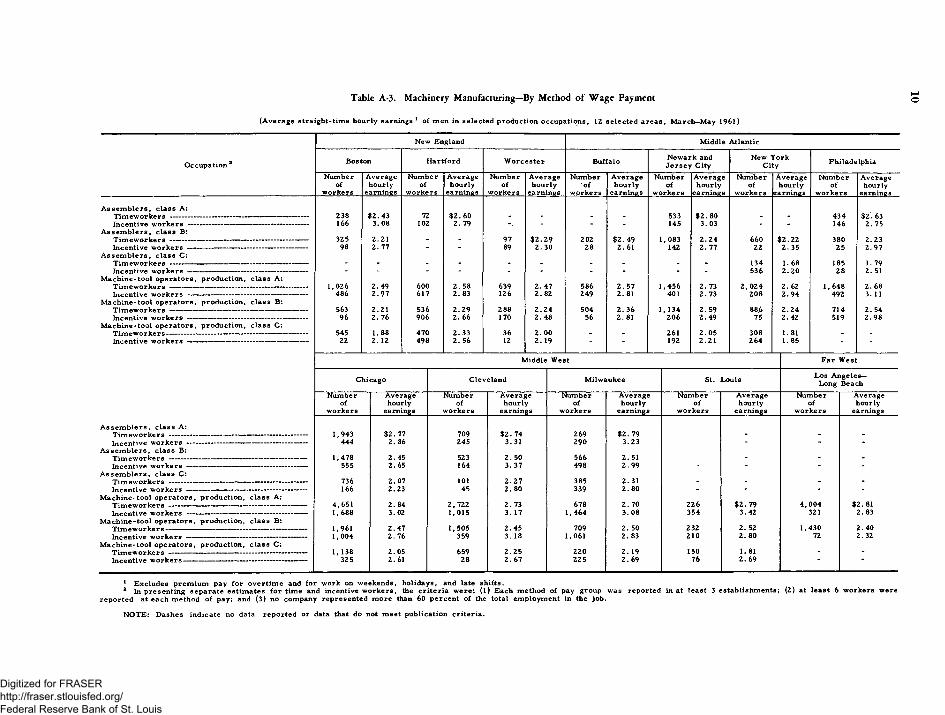
In nearly a ll instances w here com parison s by m ethod o f wage paym ent w ere p o s s ib le , w ork ers paid on an incentive basis had higher average earnings than w ork ers in the sam e occupation who w ere paid on a tim e b a s is (table A - 3).
3 The 1959—60 study indicated that wom en accounted fo r few er than a tenth o f the m ach inery m anufacturing plant w ork ers in the 21 a rea s com bined .
Digitized for FRASER http://fraser.stlouisfed.org/ Federal Reserve Bank of St. Louis
5
Supplementary Wage B enefits, W inter 1959—60
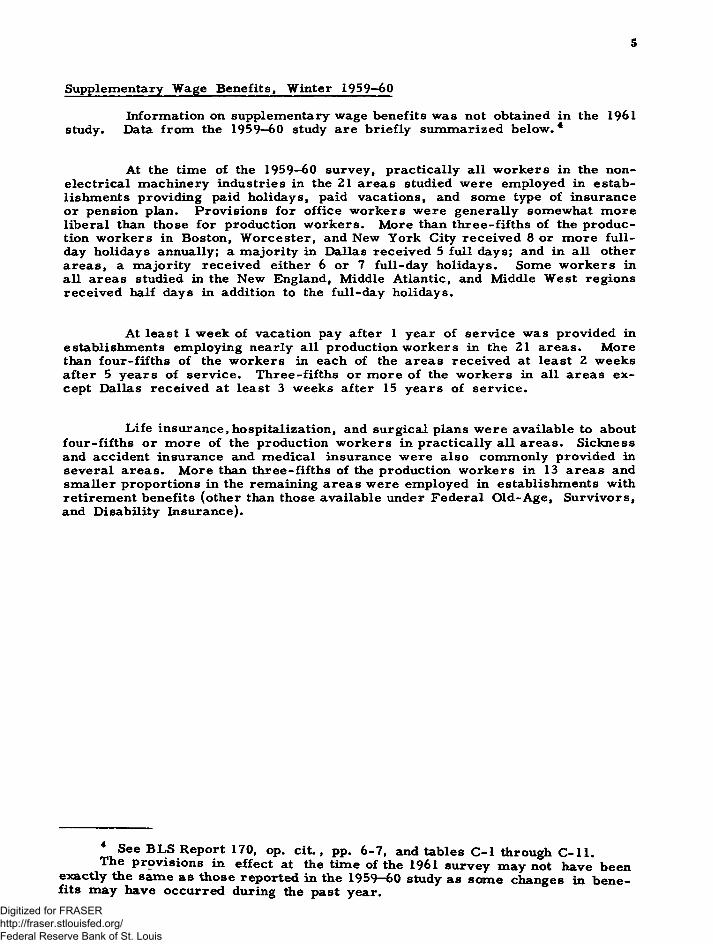
Inform ation on supplem entary wage benefits was not obtained in the 1961 study. Data from the 1959—60 study are b r ie fly sum m arized b e lo w .4
At the tim e o f the 1959—60 survey, p ra ctica lly a ll w ork ers in the none le c tr ica l m ach inery industries in the 21 areas studied w ere em ployed in establishm ents provid ing paid holidays, paid vacations, and som e type o f insurance o r pension plan. P rov is ion s fo r o ffice w ork ers w ere gen era lly som ewhat m ore lib e ra l than those fo r production w ork ers . M ore than th ree -fifth s o f the p rod u ction w ork ers in Boston, W orces te r , and New Y ork City re ce iv e d 8 or m ore fu ll- day holidays annually; a m a jority in Dallas re ce iv ed 5 fu ll days; and in a ll other a rea s , a m a jority re ce iv e d either 6 or 7 fu ll-d ay holidays. Some w ork ers in a ll a reas studied in the New England, Middle A tlantic, and M iddle W est reg ion s re ce iv ed half days in addition to the fu ll-d ay holidays.
At lea st 1 w eek o f vacation pay a fter 1 year o f se rv ice w as prov ided in establishm ents em ploying nearly a ll production w ork ers in the 21 a rea s . M ore than fou r -fifth s o f the w ork ers in each o f the a reas re ce iv e d at least 2 w eeks a fter 5 y ea rs o f s e rv ice . T h ree -fifth s o r m ore o f the w ork ers in a ll a rea s e x cept Dallas re ce iv ed at least 3 w eeks a fter 15 y ea rs o f s e rv ice .
L ife in su ran ce,h osp ita lization , and su rg ica l plans w ere available to about fou r-fifth s o r m ore o f the production w ork ers in p ra ctica lly a ll a re a s . S ickness and accident insurance and m ed ica l insurance w ere a lso com m only prov ided in sev era l a rea s . M ore than th ree -fifth s o f the production w ork ers in 13 a rea s and sm aller p rop ortion s in the rem aining a rea s w ere em ployed in establishm ents with retirem en t benefits (other than those available under F ed era l O ld -A ge , S u rv ivors, and D isability Insurance).
4 See B LS R eport 170, op. c i t . , pp. 6 -7 , and tables C - l through C - l l .The p rov is ion s in e ffe ct at the tim e o f the 1961 survey m a y not have been
exactly the sam e as those rep orted in the 1959“~60 study as som e changes in ben efits m ay have o ccu rred during the past year.
Digitized for FRASER http://fraser.stlouisfed.org/ Federal Reserve Bank of St. Louis
6
Digitized for FRASER http://fraser.stlouisfed.org/ Federal Reserve Bank of St. Louis
A: Occupational Earnings
Table A-l. Machinery Manufacturing—Men Workers
(Average straight-time hourly earnings 1 of men in selected production occupations, 21 selected areas, March—May 19 6la)
New England Middle Atlantic South
OccupationBoston Hartford Worcester Buffalo Newark and
multiple-spindle, class B — -------------------------------Engine-lathe operators, class B ---------------------------Grinding-machine operators, class B --------- — —
1 Excludes premium pay for overtime and for work on weekends, holidays, and late shifts.2 Payroll periods covered in individual areas are indicated in table in appendix A.3 Includes data for operators of other machine tools in addition to those shown separately.
NOTE: Dashes indicate no data reported or data that do not meet publication criteria,
Digitized for FRASER http://fraser.stlouisfed.org/ Federal Reserve Bank of St. Louis
Table A-2. Machinery Manufacturing—Women Workers
(Average straight-tim e hourly earnings 1 of women in selected production occupations, 11 se lected areas, March—May 1961)
O ccu p a tion
New E ngland Middle Atlantic South
H a rtfo rd Newark and Jersey City
New York City Philadelphia Baltimore
N um bero f
w o rk e rs
A v era g eh ou rly
earn in gs
N um bero f
w o rk e rs
Averagehourly
earnings
Numberof
workers
Averagehourly
earnings
Numberof
workers
Averagehourly
earnings
Numberof
workers
Averagehourly
earnings
A s s e m b le r s , c la s s B __ _____ _____ _ . . . ______ 123 $ 2 . 12 93 $2 . 24 17 $ 1 .9 8A s s e m b le r s , c la s s C ______ _____ ___ __________ __ 682 2. 15 442 2. 07 185 1 .9 0 236 $ 1 .8 8 - -I n s p e c t o r s , c la s s B ___ ___ ________ _____________ -v_ - - 10 2. 04 - - - - - -I n s p e c t o r s , c la s s C . . . . . . . . . . ____ ____ ___ - - - - 36 1 .9 8 - - - -M a c h in e -to o l o p e r a to r s , p rod u ction , c la ss B . ^ . . . . 20 1.89 - - - - - - 13 $ 2 .2 8M a c h in e -to o l o p e r a to r s , p rod u ction , c la ss C 2 . . . . . . 312 1 .8 8 . - 56 1 .8 6 105 2 .31 105 2. 12
D r i l l - p r e s s o p e r a to r s , s in g le - o r m u ltip le -sp in d le , c la s s C __ __ __ ____ __ _____ 254 1 .8 8
Middle W est Far W est
Chicago Cleveland Detroit Minneapolis— St. Paul St. Louis Los A n geles-
Long BeachNumber
ofw o rk e rs
Averagehourly
earnings
Numberof
workers
Averagehourly
earnings
Numberof
workers
Averagehourly
earnings
Numberof
workers
Averagehourly
earnings
Numberof
workers
Averagehourly
earnings
Numberof
workers
Averagehourly
earnings
A s s e m b l e r s , c la s s B _______ ___________________________ _ 25 $ 2 .1 0A s s e m b l e r s , c la s s C ______________ __—__ ______ _____ _ 745 $ 1 .7 7 22 $ 2 .4 8 749 $ 2 .4 2 236 $ 1 .8 0 320 $ 2 .2 9 361 1 .7 4I n s p e c to r s , c l a s s B ___________ _______ ___ _____ _ 41 2. 37 - - 85 2 .7 6 - - - - 26 2.31I n s p e c t o r s , c la s s C _______ - __ 80 1 .74 68 2 .0 3 537 2 .4 1 18 1 .9 4 191 2. 18 25 2. 10M a c h i n e - t o o l o p e r a t o r s , p roduct ion , c la ss B - - - - - - 28 2 .1 2 - - 33 2 .3 0M a c h i n e - t o o l o p e r a t o r s , p rod u ct ion , c la s s C 2 -____
D r i l l - p r e s s o p e r a t o r s , s i n g le - o r m u lt ip le -232 1 .87 502 1 .85 243 2 .5 6 * “ 81 2 .2 7 ■
140 1 .9 0 83 2 .5 4 81 2 .2 7
1 E x clu d e s p re m iu m pay fo r ov e r tim e and fo r w ork on w eek en d s, h o lid a y s , and la te sh ifts .2 In clu d es data fo r o p e r a to r s o f other m ach in e too ls in add ition to those show n se p a ra te ly .
N O T E : D ash es in d ica te no data re p o rte d o r data that do not m e e t p u b lica tion c r it e r ia .
VO
Digitized for FRASER http://fraser.stlouisfed.org/ Federal Reserve Bank of St. Louis
(Average straight-time hourly earnings 1 of men in selected production occupations, 12 selected areas, March—May 1961)
Table A-3. Machinery Manufacturing—By Method of Wage Payment O
Occupation2
New England Middle Atlantic
Boston Hartford Worcester Buffalo Newark and Jersey City
1 Excludes premium pay for overtime and for work on weekends, holidays, and late shifts.2 In presenting separate estimates for time and incentive workers, the criteria were: (l) Each method of pay group was reported in at least 3 establishments; (2) at least 6 workers were
reported at each method of pay; and (3) no company represented more than 60 percent of the total employment in the job.
NOTE: Dashes indicate no data reported or data that do not meet publication criteria.
Digitized for FRASER http://fraser.stlouisfed.org/ Federal Reserve Bank of St. Louis
D rill-press operators, radial, class A ___ 70 3 .0 2 - -Engine-lathe operators, class A ----------------- 60 3. 05 43 2. 60Grinding-machine operators, class A ------- 160 3 .0 3 98 2. 64Milling-machine operators, class A ---------- 110 3. 09 53 2 .5 9Turret-lathe operators, hand (including
hand screw machine), class A ------------------ 87 3. 15 - -
Grinding-machine operators, class B _____ 32 3. 11 68 2 .3 6Milling-machine operators, class B . . — 23 2. 92 33 2 .3 5Turret-lathe operators, hand (including
hand screw machine), class B __ . . . . 39 2. 86 19 2. 25
Machine-tool operators, production,r1a*B f •' 26 2. 47 - -
Machine-tool operators, toolroom _____________ 100 3 .1 6 - -Tool and die makers (other than jobbing) ------- 44 3. 29 24 2. 82W elders, hand, class A — ----- ------------- — 12 3. 19 10 2. 82
1 Excludes premium pay for overtime and for work on weekends, holidays, and late shifts.2 Includes data for operators of other machine tools in addition to thosie shown separately.
NOTE: Dashes indicate no data reported or data that do not meet publication criteria.
Digitized for FRASER http://fraser.stlouisfed.org/ Federal Reserve Bank of St. Louis
Table A-5. Machinery Manufacturing—Special Dies and Tools and Machine-Tool Accessories
(Average straight-tim e hourly earnings 1 of men in selected production occupations, 9 se lected areas, March—May 1961)
O ccup at ion
E l e c t r i c i a n s , m aintenance -----------------------------------------I n s p e c t o r s , c la s s A ------------------------------------------------------J an ito rs , p o r t e r s , and c l e a n e r s -------------------------------L a b o r e r s , m a te r ia l handling ________________________M a c h i n e - t o o l o p e r a t o r s , p rod u ct ion , c la s s A 4 -----
E n g in e - la th e o p e r a t o r s , c l a s s A ------------------------G r in d in g - m a c h in e o p e r a t o r s , c la s s A ---------------M i l l in g -m a c h i n e o p e r a t o r s , c l a s s A -----------------
M a c h i n e - t o o l o p e r a t o r s , p rod u ct ion , c la s s B 4 __G r in d in g - m a c h in e o p e r a t o r s , c l a s s B _________M i l l in g -m a c h i n e o p e r a t o r s , c l a s s B ___________T u rr e t - la t h e o p e r a t o r s , hand (inc luding
hand s c r e w m a ch in e ) , c la s s B --------------------------M a c h i n e - t o o l o p e r a t o r s , p roduct ion , c la s s C ___M a c h i n e - t o o l o p e r a t o r s , t o o l r o o m ______________ -__Tool and die m a k e r s ( jobb ing) _______________________W e ld e r s , hand, c la s s A ---------------------------------------------
E l e c t r i c i a n s , m a intenance ___________________________In s p e c t o r s , c la s s A ------------------------------------------------------Jan ito rs , p o r t e r s , and c l e a n e r s ____________________L a b o r e r s , m a te r ia l handling _______________ - ________M a c h in e - t o o l o p e r a t o r s , p rod u c t ion , c la s s A 4 __
Engin e- lathe o p e r a t o r s , c l a s s A ________________G r in d i n g - m a c h i n e o p e r a t o r s , c l a s s A _________M il l in g -m a c h i n e o p e r a t o r s , c la s s A ___________
M a c h i n e - t o o l o p e r a t o r s , p rod u c t ion , c l a s s B 4 —G ri n d i n g - m a c h i n e o p e r a t o r s , c l a s s B _________M i l l in g -m a c h in e o p e r a t o r s , c l a s s B -----------------T u rr e t - la t h e o p e r a t o r s , hand ( including
hand s c r e w m a ch in e ) , c l a s s B --------------------------M a c h i n e - t o o l o p e r a t o r s , p rod u c t ion , c l a s s CM a c h i n e - t o o l o p e r a t o r s , t o o l r o o m — 1----------------------T o o l and die m a k e r s ( jobb ing) ------------------------------------W e l d e r s , hand, c la s s A -----------------------------------------------
C h ica g o C lev e la n d D e tro itS p ec ia l d ies M a ch in e -to o l S p e c ia l d ie s S p ec ia l d ies M a ch in e -to o l
and too ls 1 2 a c c e s s o r ie s 3 4 and t o o ls 2 and t o o ls 2 a c c e s s o r ie s 3N um ber A v era g e N u m ber A v e ra g e N u m ber A v e ra g e N u m ber A v e ra g e N um ber A v era g e
o f hou rly o f h ou rly o f h ou rly o f h ou rly o f hou rlyw o rk e rs earn in gs w o rk e rs earn in gs w o rk e rs earn in gs w o rk e rs earn in gs w o rk e rs earn ings
1 E x c lu d e s p r e m iu m pay fo r o v e r t im e and fo r w ork on w eek en ds, h o lid a ys , and late sh ifts .2 Inc lu des die se t s , j i g s and f ix tu re s , a lso .3 Inc lu des m e a s u r i n g d e v i c e s , a l s o .4 Inc lu des data fo r o p e r a to r s o f o th er m ach in e too ls in add ition to th ose show n sep a ra te ly . N O T E : D a sh es indica te no data r e p o r te d o r data that do not m eet p u b lica tion c r it e r ia .
Digitized for FRASER http://fraser.stlouisfed.org/ Federal Reserve Bank of St. Louis
B: Distribution of Workers by Hourly Earnings
Table B-l. Tool and Die Makers (Other Than Jobbing)
(Percent distribution of men workers by straight-time hourly earnings 1 in machinery manufacturing, 21 selected areas, March-May 1961)
Average hourly earnings 11 New England Middle Atlantic South
$ 3 . 50 and under $ 3 . 60 ___________________________ .3 _ .2 _ 2 .2 .9 .3$ 3 . 60 and under $ 3 . 70 __ ... _ ___ ..... .... _ .3 _ _ _ 1. 7 . 9 1 .2 _ _$ 3 . 70 and under $ 3 .8 0 _ _ _ _ _ .. _ . 6 _ _ „ _ 1 .8 2 .4 . 3 _ _$ 3 .8 0 and o v e r ..... _ „ ......... ....... ................. .... - - - - - - 2 .4 .2 .6
T ota l ... ....... ____ 100.0_ 100.0 100.0 100 .0 100 .0 100 .0 1 00 .0 100 .0 100.0 100.0 100.0
N u m ber o f w o rk e rs ______ _____________ ___ 659 1,442 458 560 1,340 961 1 ,233 584 338 386 402A v e ra g e h o u r ly e a r n in g s 1_________________________ $ 2 .2 9 $ 2 .5 2 $ 2 .3 3 $ 2 .4 1 $ 2 .5 8 $ 2 .2 6 $ 2 .7 2 $ 2 .7 1 $ 2 .4 4 $ 2 .0 0 $ 2 .5 6
S ee footn ote at end of tab le .
Digitized for FRASER http://fraser.stlouisfed.org/ Federal Reserve Bank of St. Louis
(Percent distribution of men workers by straight-tim e hourly earnings1 in machinery manufacturing, 21 selected areas, March—May 1961)
Table B-3. Machine-Tool Operators, Production, Class B— Continued 00
Average hourly earningsMiddle W est Far W est
Chicago Cleveland Detroit MilwaukeeMinneapolis—
St. PaulSt. Louis Denver
LosA n g e le s -
Long BeachPortland
SanFrancisco—
Oakland
Under $ 1 . 5 0 ...............................................
$3 . 00 and under $3. 10 -___ ——____________ „_____ 1 .4 . 1 . 1 3 . 6 _ 1 .3 _ _$3. 10 and under $3. 20 ----------------------------------------- .6 .3 - 2 . 9 - .4 - - -$ 3 . 2 0 and under $3. 30 ----------------------------------------- .6 4 - 3 . 6 - .9 - - -$3. 30 and under $3. 40 ----------------------------------------- - . 1 - . 7 - - - - -$ 3 . 4 0 and under $3 . 50 ----------------------------------------- . 7 - - 1. 1 - .9 - - "
$3 . 50 and o v e r -------- _______________________________ . l - - - - .8 - - -
N u m ber o f w o rk e rs -------------------------------------------------A v e ra g e h o u r ly e a r n in g s 1 -------------------------------------
1 Excludes prem ium pay for overtim e and for work on weekends, holidays, and late shifts.
N OTE: Because of rounding, sum s of individual items m ay not equal 100.
Digitized for FRASER http://fraser.stlouisfed.org/ Federal Reserve Bank of St. Louis
25
Appendix A: Scope and Method of Survey
Scope o f Survey
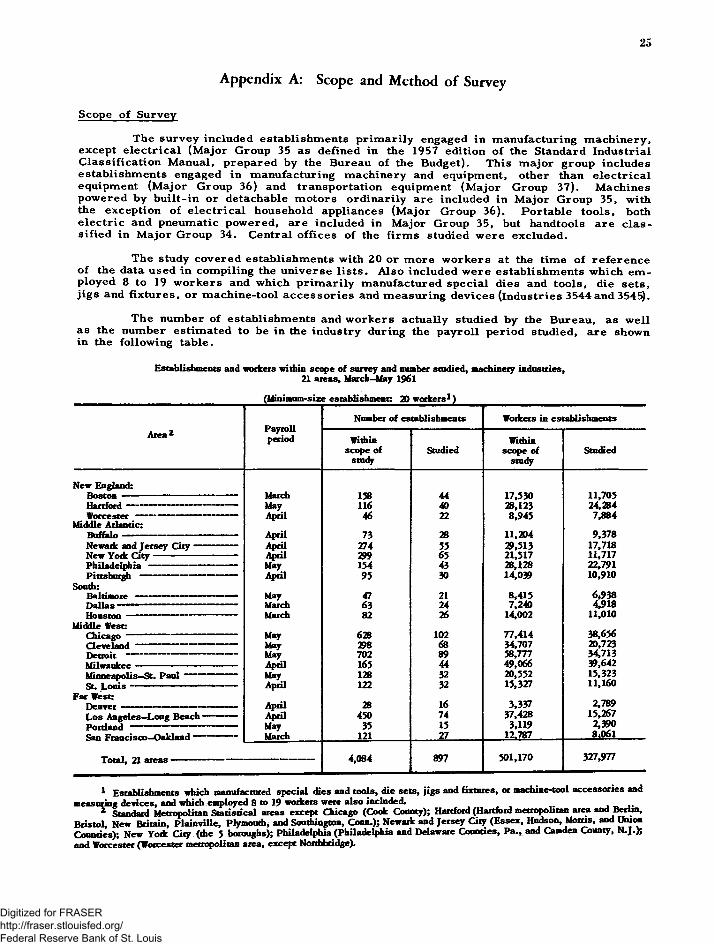
The survey included establishm ents p rim arily engaged in manufacturing m ach inery, except e le c tr ica l (M ajor Group 35 as defined in the 1957 edition o f the Standard Industrial C lassification Manual, prepared by the Bureau o f the Budget). This m ajor group includes establishm ents engaged in manufacturing m achinery and equipment, other than e le c tr ica l equipment (M ajor Group 36) and transportation equipment (M ajor Group 37). M achines pow ered by bu ilt-in or detachable m otors ord inarily are included in M ajor Group 35, with the exception o f e le c tr ica l household appliances (M ajor Group 36). Portable too ls , both e le c tr ic and pneum atic pow ered, are included in M ajor Group 35, but handtools are c la s s ified in M ajor Group 34. Central o ffices o f the firm s studied w ere excluded.
The study covered establishm ents with 20 or m ore w orkers at the tim e o f re feren ce o f the data used in com piling the universe lis ts . A lso included w ere establishm ents which em ployed 8 to 19 w orkers and which p rim arily manufactured specia l dies and too ls , die sets, jig s and fixtures, or m achine-tool a c ce sso r ie s and m easuring devices (industries 3544 and 3545).
The number o f establishm ents and w orkers actually studied by the Bureau, as w ell as the number estim ated to be in the industry during the payroll period studied, are shown in the follow ing table.
Establishments and workers within scope of survey and number studied, machinery industries,21 areas, March-May 1961
Area*
New England:B oston------------------ -------Hartford — --------------------W orcester----- ---------------
Middle Atlantic:Buffalo —-------- --------------Newark and Jersey City —New Yodc C ity----- ---------Philadelphia-----------------Pittsburgh — ---------------
Middle West:Chicago ------------------------Cleveland--------------Detroit — --------------------Milwaukee — --------- -------Minneapolis—St. P au l-----St. L ou is-----------------------
Far West:Denver — ------------ --------Los Angeles—Long BeachP ortland-----------------------San Francisco—Oakland “
Total, 21 areas----- — 1 2
(Minimum-size establishment: 20 workers*)
Payrollperiod
Number of establishments Workers in e stablishments
1 Establishments which manufactured special dies and tools, die sets, jigs and fixtures, or machine-tool accessories and measuring devices, and whichemployed 8 to 19 workers were also included.
2 Standard Metropolitan Statistical areas except Chicago (Code County); Hartford (Hartford metropolitan area and Berlin, Bristol, New Britain, Plainville, Plymouth, and Southington, Conn.); Newark and Jersey City (Essex, Hudson, Morris, and Union Counties); New Yoik City (the 5 boroughs); Philadelphia (Philadelphia and Delaware Counties, Pa., and Camden County, N.J.); and Worcester (Worcester metropolitan area, except Northhridge),
Digitized for FRASER http://fraser.stlouisfed.org/ Federal Reserve Bank of St. Louis
26
Method o f Study
Data w ere obtained from establishm ents surveyed the previous year, prin cipally by m ail but in som e instances by personal v isits o f Bureau fie ld econom ists under the d irection o f the Bureau's A ssistant Regional D irectors fo r Wages and Industrial R elations. The survey was conducted on a sam ple basis . To obtain appropriate a ccu racy at minim um cost, a greater proportion of large than of sm all establishm ents was studied. In com bining the data, how ever, a ll establishm ents w ere given their appropriate weight. A ll estim ates are p r e sented, th erefore , as relating to a ll establishm ents in the industry group in the areas, e x cluding only those below the minim um size at the tim e o f re feren ce o f the universe data.
Establishm ent Definition
An establishm ent, fo r purposes of this study, is defined as a single physical location where industrial operations are perform ed . An establishm ent is not n ecessa rily identical with the company, which may consist o f one or m ore establishm ents.
Employment
The estim ates o f the number o f w orkers within the scope o f the study are intended as a general guide to the size and com position o f the labor fo r ce included in the survey. The advance planning n ecessa ry to make a wage survey requ ires the use o f lists o f establishm ents assem bled considerably in advance o f the payroll period studied.
Production W orkers
The term ' ’production w ork ers" as used in this report, includes working forem en and all nonsupervisory w orkers engaged in nonoffice functions. A dm inistrative, executive, p rofession a l, and technical personnel and force -a ccou n t construction em ployees, who w ere utilized as a separate work fo rce on the f irm 's own p rop erties , w ere excluded.
Occupations Selected fo r Study
Occupational class ifica tion was based on a uniform set o f job descriptions designed to take account o f interestablishm ent and in terarea variations in duties within the sam e job . (See appendix B fo r listing o f these job d escr ip tion s .) The occupations w ere chosen fo r their num erical im portance, their usefulness in co llective bargaining, o r their representativeness o f the entire job sca le in the industry.
Occupational Earnings
Earnings data fo r the selected jobs (tables A - l through A -5 ) are shown fo r fu lltim e w orkers, i. e. , those hired to work a fu ll-tim e schedule fo r the given occupational class ifica tion . Working su perv isors , apprentices, learn ers, beginners, trainees, handicapped, tem porary , and probationary w orkers were not included.
The wages represent average straight-tim e hourly earnings, excluding prem ium pay fo r overtim e and fo r w ork on weekends, holidays, and late sh ifts. Incentive paym ents, such as those resulting from p iecew ork 'or production bonus system s and cost-o f-liv in g bonuses w ere included as part o f the workers* regular pay; but nonproduction bonus paym ents, such as Christm as o r yearend bonuses w ere excluded. The estim ated average hourly earnings for each occupation w ere obtained by weighting each rate (o r hourly earning) by the num ber o f w orkers receiv ing the rate.
Occupational em ploym ent estim ates re fer to the total in a ll establishm ents within the scope o f the study and not to the num ber actually surveyed. B ecause o f the variation in occupational structure among establishm ents, estim ates o f occupational em ploym ent are subject to considerable fluctuation attributable to sam pling. Hence, they serve only to indicate the relative num erical im portance o f the jobs studied. The fluctuations in em ployment do not m ateria lly affect the accu racy o f the earnings data.
Digitized for FRASER http://fraser.stlouisfed.org/ Federal Reserve Bank of St. Louis
27
Wage Trends
The m achinery index ser ies has been developed from data obtained in the Bureau*s program o f occupational wage surveys and is based on stra ight-tim e hourly earnings o f men production w orkers in se lected m achinery occupations.
The indexes fo r 1945, 1946, and 1947 are based on "m iscellan eous m ach inery" which consists o f a ll types o f m achinery m anufacture except e le c tr ica l m achinery, m achine tools , and m ach in e-too l a c ce sso r ie s . F or 1949 and su ccess ive yea rs , the inform ation includes machine tools and m ach in e-tool a c ce sso r ie s , as w ell as m iscellaneous m achinery. In ord er to m inim ize the effect o f the shift in industrial coverage, the two sets o f indexes w ere linked by applying the percent o f change in the m iscellaneous m achinery group from 1947 to 1948 to the previous 1947 index. The 1948 index computed in this fashion is the published index. To compute the 1949 index, the percentage change in a ll m achinery from 1948 to 1949 was applied to this 1948 index.
Since the 1959 survey was based on a rev ised definition o f the m achinery industries group as provided in the 1957 edition o f the SIC Manual, a linking procedu re was n ecessary to m inim ize the e ffect on the index o f the change in industry definition. This was done by computing the percent o f change from 1958 to 1959 fo r those establishm ents included in both surveys. This percentage change was then applied to the 1958 index (com puted on the p r e vious industry definition) to obtain the index fo r 1959.
Indexes were constructed fo r each area to m inim ize the e ffect o f changes in o c cu pational com position o f the work fo rce and in the relative im portance in the industry o f the areas studied. F or each year in a pa ir o f su ccess ive years (1945—46, 1946—47, e t c . ) , the average straight-tim e hourly earnings fo r each se lected occupation w ere weighted by the number em ployed in that occupation during the latter o f the 2 yea rs . The result each year was an area aggregate fo r all selected job s . The percentage relationship between the ag gregates fo r the pair o f years was computed and then linked to the index fo r the ea r lie r of the 2 years. The resulting indexes based on 1945 w ere then converted to a 1947—49 base by dividing a ll the indexes by the average of the indexes fo r 1947—49.
In 1952, the occupational coverage o f the m ach inery industries survey was in creased to include all m ach in e-tool operators , c la sses A , B, and C (except operators o f certain specia l m achines). Coverage o f m ach ine-tool operators be fore 1952 was lim ited to s in g le - and m ultip le-spindle d r il l-p re s s operators, engine-lathe operators , grinding- m achine operators, and m illing-m ach ine operators. The indexes since 1952 have been co m puted on the basis o f the broader occupational coverage indicated above. In addition, a system o f constant weights has been utilized (rather than weighting by the actual em ployment in an occupation during the latter o f the 2 years). The constant weights are based on an average o f 1953 and 1954 em ploym ent. Their use thus elim inates the e ffect o f changes in occupational com position o f the work fo rce .
Definitions fo r production and too lroom m ach in e-too l operators and tool and die m akers w ere rev ised in I960. In computing the percent o f change from 1959 to I960 in areas affected by the changes, the average earnings used fo r these job s , fo r the purposes o f this index, in both years were based on the earnings o f w orkers c la ss ified in accordance with the rev ised definitions.
In obtaining the com posite index for a ll areas com bined, the techniques follow ed w ere s im ilar to those em ployed in determ ining area indexes. The technique used in computing the com posite index fo r the ea rlie r years, 1945—52, was as fo llow s: F or each year in a pa ir(1945—46, 1946—47, e t c . ) , an overa ll aggregate fo r a ll areas com bined was obtained. This aggregate was computed by weighting the overa ll average (aggregate earnings in se lected jobs divided by the total em ploym ent in se lected jobs) fo r each area by total production w orker em ploym ent in the industry and area in the second o f the 2 years . F rom this point, the p rocedure was identical with that used in constructing individual area indexes fo r these years. F or indexes since 1952, a system o f constant area weights has been used, thereby eliminating the e ffect o f changes in the relative im portance in the industry o f the area studied.
Digitized for FRASER http://fraser.stlouisfed.org/ Federal Reserve Bank of St. Louis
28
Appendix B: Occupational Descriptions
The prim ary purpose o f preparing job descriptions for the B ureau 's wage surveys is to a ss ist its fie ld staff in classify ing into appropriate occupations w orkers who are em ployed under a variety o f p ayroll titles and different w ork arrangem ents from establishm ent to establishm ent and from area to area . This is essentia l in order to perm it the grouping o f occupational wage rates representing com parable job content. Because o f this em phasis on inter establishm ent and in terarea com parability o f occupational content, the B ureau 's job descrip tions m ay d iffer significantly from those in use in individual establishm ents or those prepared for other pu rposes. In applying these job descrip tion s, the Bureau's fie ld econom ists are instructed to ex clude working su p erv isors , apprentices, lea rn ers , beginners, trainees, handicapped, p art-tim e, tem porary , and probationary w ork ers .
ASSEMBLER
(Bench a ssem b ler ; floor assem bler ; jig a ssem bler ; line assem bler ; subassem bler)
A ssem bles a n d /or fits together parts to form com plete units or subassem blies at a bench, conveyor line, or on the flo o r , depending upon the s ize o f the units and the organ ization o f the production p ro ce s s . W ork m ay include p rocessin g operations requiring the use o f handtools in scraping, chipping, and filing o f parts to obtain a desired fit as w ell as power tools and specia l equipment when punching, riveting, soldering, or welding o f parts is n eces - sary . W orkers who p erform any o f these p rocessin g operations exclu sively as part o f spec ia lized assem bling operations are excluded .
C lass A — A ssem bles parts into com plete units or subassem blies that requ ire fitting o f parts and decis ions regarding proper perform ance o f any component part or the a s sem bled unit. W ork involves any com bination o f the follow ing: A ssem bling from draw ings, blueprints or other w ritten specifica tions; assem bling units com posed o f a variety o f parts an d /or subassem blies; assem bling large units requiring carefu l fitting and adjusting o f parts to obtain sp ecified clearan ces; and using a variety o f hand and pow ered tools and p rec is ion m easuring instrum ents.
C lass B— A ssem bles parts into units or subassem blies in accordance with standard and p rescr ib ed p roced u res . W ork involves any com bination o f the follow ing: A ssem blinga lim ited range o f standard and fam ilar products com posed o f a number o f sm a ll- or m ed iu m -size parts requiring som e fitting or adjusting; assem bling large units that r e quire little or no fitting o f com ponent parts; working under conditions where accurate perform an ce and com pletion o f w ork within set tim e lim its are essentia l for subsequent assem bling operations; and using a lim ited variety o f hand or pow ered too ls .
C lass C— P erform s sh o r t-cy c le , repetitive assem bling operations. W ork does not involve any fitting or making decisions regarding proper perform ance o f the component parts or assem bling p roced u res.
O perates one or m ore lathes equipped with autom atic feed m echanism s for actuating the cutting too ls over the com plete w ork cy c le . Autom atic lathes m ay differ as to type o f construction (horizontal or v e rtica l); number o f spindles (single or m ultiple); m ethod o f feed (hand-feed, autom atic-chucking, or h opper-feed ); m ethod o f holding the w ork (in chucks or between cen ters); and m ethod o f presenting the tools to the stock in sequence (turrets, s lid es , revolving w ork stations). (F or descrip tion o f c la ss o f w ork, see m ach ine-tool operator, p rodu ction .)
Digitized for FRASER http://fraser.stlouisfed.org/ Federal Reserve Bank of St. Louis
29
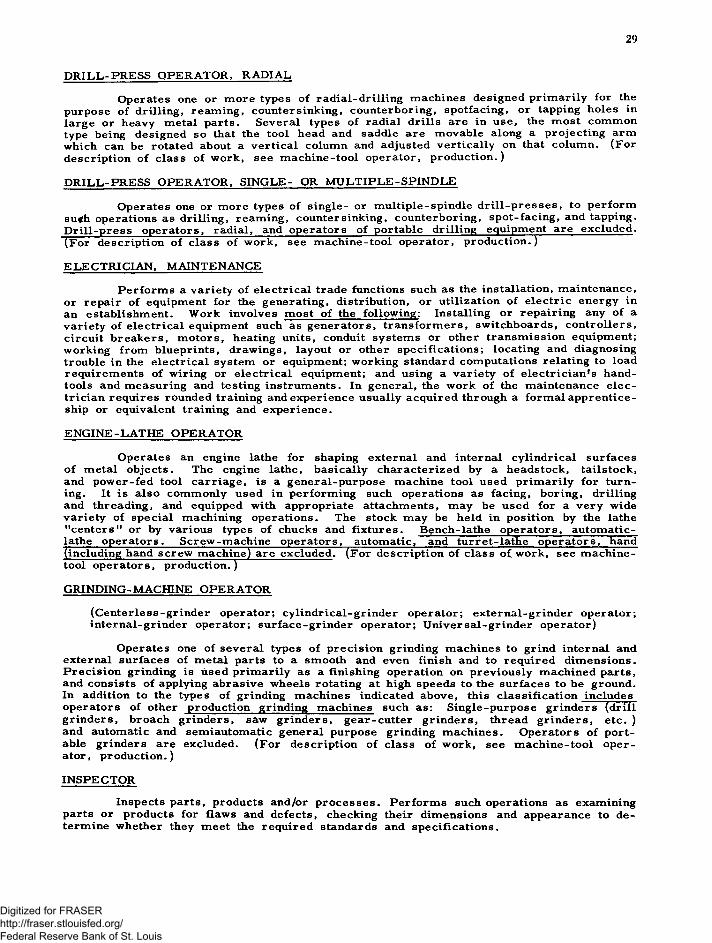
DRILL-PRESS OPERATOR, RADIAL,
Operates one or m ore types o f rad ia l-d rillin g m achines designed prim arily for the purpose o f drilling , ream ing, countersinking, counter boring, spotfacing, or tapping holes in large or heavy m etal parts. Several types o f radial d rills are in use, the m ost com m on type being designed so that the tool head and saddle are m ovable along a projecting arm which can be rotated about a vertica l colum n and adjusted v ertica lly on that colum n. (F or description o f c la ss o f w ork, see m ach in e-too l operator, p rod u ction .)
DRILL-PRESS OPERATOR, SINGLE- OR M ULTIPLE-SPINDLE
Operates one or m ore types o f sin g le - or m ultip le-sp indle d r il l-p r e s s e s , to p erform su0h operations as drilling, ream ing, countersinking, counter boring, spot-facin g , and tapping. D r ill-p re ss op era tors , radial, and operators o f portable drilling equipment are excluded . (F or description o f c la ss o f w ork , see m ach in e-too l operator, p rod u ction .)
ELECTRICIAN, MAINTENANCE
P erform s a variety o f e le c tr ica l trade functions such as the installation, m aintenance, or repair o f equipment for the generating, distribution, or utilization o f e le c tr ic energy in an establishm ent. W ork involves m ost o f the follow ing: Installing or repairing any o f avariety o f e le c tr ica l equipment such as gen erators, tra n sform ers , sw itchboards, con tro lle rs , c ircu it break ers, m otors , heating units, conduit system s or other transm ission equipment; working from blueprints, drawings, layout or other specifica tions; locating and diagnosing trouble in the e le c tr ica l system or equipment; working standard com putations relating to load requirem ents o f w iring or e le c tr ica l equipment; and using a variety o f e le c tr ic ia n 's hand- tools and m easuring and testing instrum ents. In general, the w ork o f the m aintenance e le c trician requ ires rounded training and experience usually acqu ired through a form al apprenticeship or equivalent training and experien ce .
ENGINE-LATHE OPERATOR
O perates an engine lathe for shaping external and internal cy lindrica l surfaces o f m etal ob je cts . The engine lathe, basica lly characterized by a headstock, ta ilstock , and p ow er-fed tool ca rria ge , is a gen eral-purpose m achine tool used p rim arily for turning. It is a lso com m only used in perform ing such operations as facing, boring, drilling and threading, and equipped with appropriate attachm ents, m ay be used for a v ery wide variety o f specia l machining operations. The stock m ay be held in position by the lathe ‘ 'cen ters11 or by various types o f chucks and fix tu res. Bench-lathe op era tors , autom atic- lathe op era tors . S crew -m achine op era tors , autom atic, and turret-lathe op era tors , hand (including hand screw m achine) are excluded . (For descrip tion o f c la ss o f w ork, see m ach ine- tool op era tors , p rod u ction .)
GRINDING-MACHINE OPERATOR
(C en terless-grin der operator; cy lin d rica l-g rin der operator; ex ternal-grinder operator; in ternal-grinder operator; su rface -grin d er operator; U n iversa l-grinder operator)
Operates one o f severa l types o f p rec is ion grinding m achines to grind internal and external surfaces o f m etal parts to a sm ooth and even finish and to requ ired dim ensions. P re c is io n grinding is used p rim arily as a finishing operation on prev iously m achined parts, and consists o f applying abrasive wheels rotating at high speeds to the su rfaces to be ground. In addition to the types o f grinding m achines indicated above, this cla ss ifica tion includes operators o f other production grinding m achines such as: S ingle-purpose grin ders (d rillg rin d ers, broach grin ders, saw grin ders, gear-cu tter g rin ders, thread g rin d ers, e tc . ) and autom atic and sem iautom atic general purpose grinding m ach ines. O perators o f p ortable grinders are excluded. (F or descrip tion o f c la ss o f w ork , see m ach in e-too l op er a tor, produ ction .)
INSPECTOR
Inspects parts, products and/or p ro ce s s e s . P erform s such operations as examining parts or products for flaws and defects , checking their dim ensions and appearance to determ ine whether they m eet the requ ired standards and sp ecifica tion s.
Digitized for FRASER http://fraser.stlouisfed.org/ Federal Reserve Bank of St. Louis
30
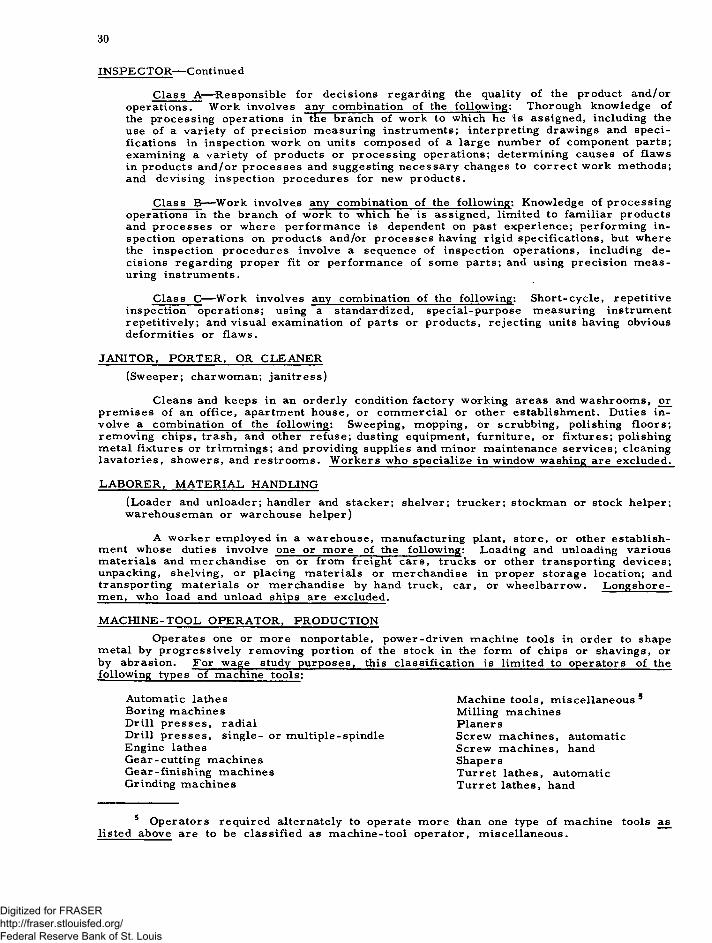
INSPE C TOR— Continue d
C lass A— R esponsible for decisions regarding the quality o f the product an d /or operations. W ork involves any com bination o f the follow ing: Thorough knowledge ofthe processin g operations in the branch of w ork to which he is assigned, including the use o f a variety o f p recis ion m easuring instrum ents; interpreting drawings and sp ec ifications in inspection w ork on units com posed of a large number of component parts; examining a variety o f products or processin g operations; determ ining causes o f flaws in products an d /or p ro ce sse s and suggesting n ecessary changes to co rre c t w ork m ethods; and devising inspection procedures for new products.
C lass B— W ork involves any com bination o f the follow ing: Knowledge of p rocessin g operations in the branch o f w ork to which he is assigned, lim ited to fam iliar products and p ro ce sse s or where perform ance is dependent on past experience; perform ing in spection operations on products and/or p rocesses having rig id specifica tions, but where the inspection procedures involve a sequence o f inspection operations, including decisions regarding proper fit or perform ance of som e parts; and using p recis ion m ea suring instrum ents.
C lass C— W ork involves any com bination o f the follow ing: S h ort-cy cle , repetitiveinspection operations; using a standardized, specia l-pu rpose m easuring instrum ent repetitively ; and visual examination o f parts or products, re jecting units having obvious deform ities or flaw s.
JANITOR, PORTER, OR CLEANER (Sweeper; charwom an; jan itress)
Cleans and keeps in an ord erly condition factory working areas and w ashroom s, or p rem ises o f an o ffice , apartment house, or com m ercia l or other establishm ent. Duties in volve a com bination o f the follow ing: Sweeping, mopping, or scrubbing, polishing flo o rs ;rem oving chips, trash, and other re fu se ; dusting equipment, furniture, or fixtures; polishing m etal fixtures or trim m ings; and providing supplies and m inor maintenance se rv ice s ; cleaning lava tories , show ers, and restroom s. W orkers who specia lize in window washing are excluded.
LABORER, M ATERIAL HANDLING(Loader and unloader; handler and stacker; shelver; trucker; stockm an or stock helper; warehousem an or warehouse helper)
A w orker em ployed in a w arehouse, manufacturing plant, s tore , or other establish ment whose duties involve one or m ore of the follow ing: Loading and unloading variousm ateria ls and m erchandise on or from freight ca rs , trucks or other transporting dev ices ; unpacking, shelving, or placing m ateria ls or m erchandise in proper storage location ; and transporting m ateria ls or m erchandise by hand truck, car, or w heelbarrow . L ongsh orem en, who load and unload ships are excluded .
M ACHINE-TOOL OPERATOR, PRODUCTIONOperates one or m ore nonportable, pow er-driven m achine tools in order to shape
m etal by p rog ress iv e ly rem oving portion o f the stock in the form o f chips or shavings, orby abrasion . For wage study purposes, this follow ing types o f m achine to o ls :
Autom atic lathes Boring m achines D rill p re sse s , radialD rill p re sse s , sin g le - or m ultip le-spindleEngine lathesG ear-cutting m achinesGear - fini shing m achine sGrinding m achines
class ifica tion is lim ited to operators o f the
Machine too ls , m iscellaneous 5M illing m achinesP lanersScrew m achines, automatic Screw m achines, hand ShapersTurret lathes, automatic T urret lathes, hand
5 O perators requ ired alternately to operate m ore than one type o f m achine tools as listed above are to be c la ss ified as m ach in e-tool operator, m isce llaneou s.
Digitized for FRASER http://fraser.stlouisfed.org/ Federal Reserve Bank of St. Louis
31
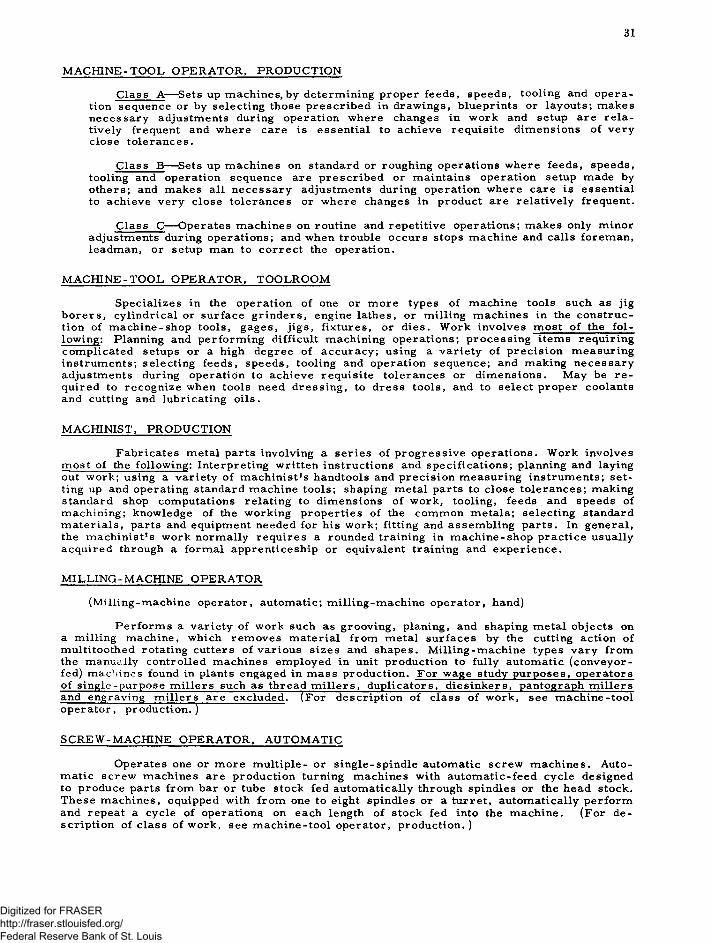
MACHINE-TOOL OPERATOR, PRODUCTION
Class A— Sets up m achines, by determining proper feeds, speeds, tooling and op era tion sequence or by selecting those p rescr ib ed in drawings, blueprints or layouts; m akes n ecessary adjustments during operation where changes in w ork and setup are re la tively frequent and where care is essential to achieve requisite dim ensions of very close to lerances.
C lass B— Sets up m achines on standard or roughing operations where feeds, speeds, tooling and operation sequence are p rescrib ed or maintains operation setup made by others; and m akes all n ecessary adjustments during operation where care is essential to achieve very close tolerances or where changes in product are re latively frequent.
C lass C— Operates m achines on routine and repetitive operations; m akes only m inor adjustments during operations; and when trouble occu rs stops m achine and ca lls forem an, leadm an, or setup man to co rre c t the operation.
MACHINE-TOOL OPERATOR, TOOLROOM
Specializes in the operation of one or m ore types of m achine tools such as jig b o re rs , cy lindrica l or surface grin ders, engine lathes, or m illing m achines in the con stru ction of m achine-shop too ls, gages, jig s , fixtures, or d ies . W ork involves m ost o f the fo llow ing: Planning and perform ing difficult machining operations; p rocessin g item s requiringcom plicated setups or a high degree o f accu racy ; using a variety of p recis ion m easuring instrum ents; selecting feeds, speeds, tooling and operation sequence; and making n ecessary adjustments during operation to achieve requisite tolerances or dim ensions. May be r e quired to recogn ize when tools need dressing , to dress too ls , and to se lect proper coolants and cutting and lubricating o ils .
MACHINIST, PRODUCTION
F abricates m etal parts involving a series o f p rogress ive operations. W ork involves m ost of the follow ing: Interpreting written instructions and specifica tions; planning and laying out work; using a variety o f m a ch in is ts handtools and p recis ion m easuring instrum ents; setting up and operating standard m achine too ls ; shaping m etal parts to c lose to lerances; making standard shop computations relating to dim ensions o f w ork, tooling, feeds and speeds of m achining; knowledge of the working properties of the com m on m etals; selecting standard m ateria ls , parts and equipment needed for his work; fitting and assem bling parts. In general, the m achin ist’ s work norm ally requ ires a rounded training in m ach ine-shop practice usually acquired through a form al apprenticeship or equivalent training and experience.
MILLING-MACHINE OPERATOR
(M illing-m achine operator, autom atic; m illing-m ach ine operator, hand)
P erform s a variety of w ork such as grooving, planing, and shaping m etal ob jects on a m illing m achine, which rem oves m ateria l from m etal surfaces by the cutting action of m ultitoothed rotating cutters o f various s izes and shapes. M illing-m achine types vary from the manually controlled m achines em ployed in unit production to fully autom atic (con veyor- fed) m achines found in plants engaged in m ass production. For wage study purposes, operators o f single-purpose m ille rs such as thread m ille rs , duplicators, d iesinkers, pantograph m ille rs and engraving m ille rs are excluded . (For description of c lass of w ork, see m ach in e-too l op era tor , p rod u ction .)
SCREW-MACHINE OPERATOR, AUTOMATIC
Operates one or m ore m ultip le- or single-sp indle autom atic screw m ach ines. Autom atic screw m achines are production turning m achines with autom atic-feed cycle designed to produce parts from bar or tube stock fed autom atically through spindles or the head stock. These m achines, equipped with from one to eight spindles or a turret, autom atically perform and repeat a cycle of operations on each length o f stock fed into the m achine. (For descrip tion o f c lass of w ork, see m ach in e-too l operator, produ ction .)
Digitized for FRASER http://fraser.stlouisfed.org/ Federal Reserve Bank of St. Louis
32
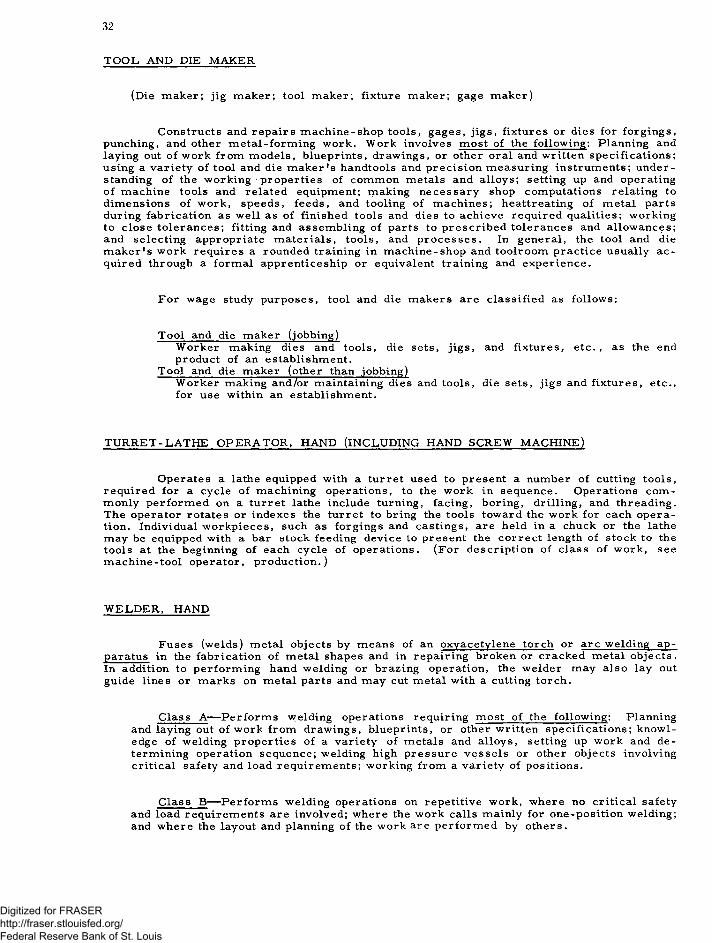
TOOL AND DIE MAKER
(Die m aker; jig m aker; tool m aker; fixture m aker; gage m aker)
C onstructs and repa irs m ach ine-shop too ls , gages, jig s , fixtures or dies for forg ings, punching, and other m eta l-form in g w ork . Work involves m ost o f the follow ing: Planning and laying out o f work from m odels, blueprints, drawings, or other oral and written specifica tions; using a variety o f tool and die m ak er 's handtools and p rec is ion m easuring instrum ents; understanding o f the working properties of com m on m etals and a lloys; setting up and operating o f m achine tools and related equipment; making n ecessary shop computations relating to dim ensions o f w ork, speeds, feeds, and tooling of. m achines; heattreating of m etal parts during fabrication as w ell as o f finished tools and dies to achieve requ ired qualities; working to c lose to leran ces; fitting and assem bling of parts to p rescr ib ed tolerances and allow ances; and selecting appropriate m ateria ls , too ls , and p ro ce sse s . In general, the tool and die m ak er ’ s w ork requ ires a rounded training in m achine-shop and toolroom practice usually a c quired through a form al apprenticeship or equivalent training and experien ce.
For wage study purposes, tool and die m akers are c la ss ified as follow s:
T ool and die m aker (jobbing)W orker making dies and too ls , die sets, jig s , and fixtures, etc . , as the end product of an establishm ent.
T ool and die m aker (other than jobbing)W orker making and/or maintaining dies and too ls , die sets, jigs and fixtures, e tc ., for use within an establishm ent.
TURRET-LATH E OPERATOR, HAND (INCLUDING HAND SCREW MACHINE)
Operates a lathe equipped with a turret used to present a number o f cutting too ls , requ ired for a cycle o f machining operations, to the w ork in sequence. Operations co m m only perform ed on a turret lathe include turning, facing, boring, drilling, and threading. The operator rotates or indexes the turret to bring the tools toward the work for each op era tion. Individual w ork p ieces, such as forgings and castings, are held in a chuck or the lathe may be equipped with a bar stock feeding device to present the co rre c t length of stock to the tools at the beginning of each cycle o f operations. (For description of class of w ork, see m ach in e-too l operator, p rodu ction .)
WELDER, HAND
Fuses (welds) m etal ob jects by means of an oxyacetylene torch or arc welding apparatus in the fabrication o f m etal shapes and in repairing broken or cracked m etal ob jects . In addition to perform ing hand welding or brazing operation, the w elder may a lso lay out guide lines or m arks on m etal parts and may cut m etal with a cutting torch .
C lass A— P erform s welding operations requiring m ost of the follow ing: Planningand laying out o f w ork from drawings, blueprints, or other written specifica tions; knowledge o f welding properties o f a variety of m etals and a lloys, setting up w ork and determ ining operation sequence; welding high pressu re v esse ls or other ob jects involving cr it ica l safety and load requirem ents; working from a variety of positions.
C lass B-— P erform s welding operations on repetitive w ork, where no cr it ica l safety and load requirem ents are involved; where the w ork calls m ainly for one-position welding; and w here the layout and planning o f the w ork are perform ed by others.
Digitized for FRASER http://fraser.stlouisfed.org/ Federal Reserve Bank of St. Louis
INDUSTRY WAGE STUDIES
The following reports cover part of the Bureau's program of industry wage surveys. These reports cover the period 1950 to date and may be obtained free upon request as long as a supply is available. However, those for which a price is shown are available only from the Superintendent of Documents, U.S. Government Printing Office, Washington 25, D.C., or any of its regional sales offices.
I. Occupational Wage Studies
Manufacturing
Apparel:
Men's Dress Shirts and Nightwear, 1950 —Series 2, No. 80
Men's and Boys* * Dress Shirts and Nightwear, 1954 BLS Report No. 74
❖ Men's and Boys* Shirts (Except Work Shirts) andNightwear, 1956 — BLS Report No. 116
Men's and Boys' Suits and Coats, 1958 —BLS Report No. 140
Women's and Misses' Coats and Suits, 1957 —BLS Report No. 122
Women's and Misses* Dresses, I960 —BLS Report No. 193
Work Clothing, 1953 - BLS Report No. 51❖ Work Shirts, 1955 and 1956 — BLS Report No. 115❖ Work Shirts, 1957 — BLS Report No. 124
Chemicals and Petroleum:Fertilizer, 1949-50 — Series 2, No. 77
❖ Fertilizer Manufacturing, 1955 and 1956 — BLS Report No. I l l❖ Fertilizer Manufacturing, 1957 — BLS Report No. 132
Industrial Chemicals, 1951 — Series 2, No. 87 Industrial Chemicals, 1955 — BLS Report No. 103 Petroleum Production and Refining, 1951 —
Digitized for FRASER http://fraser.stlouisfed.org/ Federal Reserve Bank of St. Louis
I. Occupational Wage Studies— Continued
Nonmanufacturing
Auto Dealer Repair Shops, 1958 — BLS Report No. 141 Banking Industry, I960 — BLS Report No. 179 Crude Petroleum and Natural Gas Production, I960 —
BLS Report No. 181Department and Women’s Ready-to-Wear Stores, 1950 —
Series 2, No. 78
Electric and Gas Utilities, 1950 - Series 2, No. 79 Electric and Gas Utilities, 1952 - BLS Report No. 12 Electric and Gas Utilities, 1957 - BLS Report No. 135 Hotels, I960 - BLS Report No. 173 Power Laundries and Dry Cleaners, I960 —
BLS Report No. 178
II. Other Industry Wage Studies
Communications Workers, Earnings in October 1956 — BLS Report No. 121Communications Workers, Earnings in October 1957 — BLS Report No. 138Communications Workers, Earnings in October 1958 - BLS Report No. 149Communications Workers, Earnings in October 1959 — BLS Report No. 171Factory Workers’ Earnings — Distributions by Straight-Time Hourly Earnings, 1954 — BLS Bull. No. 1179 ( 25 cents) Factory Workers’ Earnings — 5 Industry Groups, 1956 — BLS Report No. 118Factory Workers’ Earnings — Distribution by Straight-Time Hourly Earnings, 1958 — BLS Bull. No. 1252 (40 cents) Factory Workers* Earnings — Selected Manufacturing Industries, 1959 — BLS Bull. No. 1275 (35 cents)Wages in Nonmetropolitan Areas, South and North Central Regions, October I960 — BLS Report No. 190
Retail Trade, Employee Earnings in October 1956:Initial Report — BLS Report No. 119 (30 cents)Building Materials and Farm Equipment Dealers — BLS Bull. No. 1220-1 (20 cents) General Merchandise Stores — BLS Bull. No. 1220-2 (35 cents)Food Stores - BLS Bull. No. 1220-3 (30 cents;Automotive Dealers and Gasoline Service Stations — BLS Bull. No. 1220-4 (35 cents) Apparel and Accessories Stores - BLS Bull. No. 1220-5 (45 cents)Furniture, Home Furnishings, and Appliance Stores — BLS Bull. No. 1220-6 (35 cents) Drug Stores and Proprietary Stores - BLS Bull. No. 1220-7 (15 cents)Summary Report — BLS Bull. No. 1220 (55 cents)
Regional Offices
U.S. Department of Labor Bureau of Labor Statistics 18 Oliver Street Boston 10, Mass.
U.S. Department of Labor Bureau of Labor Statistics 341 Ninth Avenue New York 1, N.Y.
U.S. Department of Labor Bureau of Labor Statistics 1371 Peachtree Street, NE. Atlanta 9> Ga.
U.S. Department of Labor Bureau of Labor Statistics 105 West Adams Street Chicago 3> Ul.
U.S. Department of Labor Bureau of Labor Statistics 630 Sansome Street San Francisco 11, Calif.
☆ U .S. GOVERNMENT PRINTING O FFICE: 1961 0 -620080
Digitized for FRASER http://fraser.stlouisfed.org/ Federal Reserve Bank of St. Louis