EMPLOYEE EARNINGS AND HOURS in retail food stores JUNE 1965 • grocery stores Bulletin No. 1501-3 UNITED STATES DEPARTMENT OF LABOR W. Willard Wirtz, Secretary BUREAU OF LABOR STATISTICS Arthur M. Ross, Commissioner Digitized for FRASER http://fraser.stlouisfed.org/ Federal Reserve Bank of St. Louis
Transcript
EMPLOYEE EARNINGS AND HOURS in
retail food stores
JUNE 1965
• grocery stores
Bulletin No. 1501-3
UNITED STATES DEPARTMENT OF LABOR
W. Willard Wirtz, Secretary
BUREAU OF LABOR STATISTICS
Arthur M. Ross, Commissioner
Digitized for FRASER http://fraser.stlouisfed.org/ Federal Reserve Bank of St. Louis
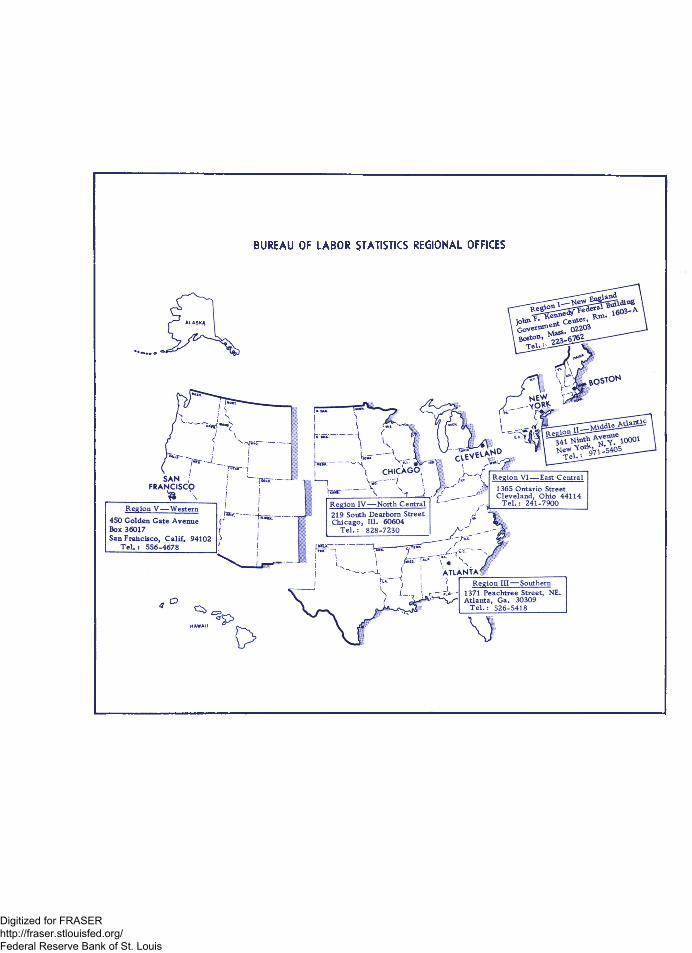
BUREAU OF LABOR STATISTICS REGIONAL OFFICES
Digitized for FRASER http://fraser.stlouisfed.org/ Federal Reserve Bank of St. Louis
E M P L O Y E E E A R N IN G S A N D H O U R S in
retail food stores
JUNE 1965
• grocery stores
’I T '
Bulletin No. 1501-3June 1966
UNITED STATES DEPARTMENT OF LABOR
W. Willard Wirtz, Secretary
BUREAU OF LABOR STATISTICS
Arthur M. Ross, Commissioner
For sale by the Superintendent of Documents, U.S. Government Printing Office, Washington, D.C., 20402 - Price 30 cents
Digitized for FRASER http://fraser.stlouisfed.org/ Federal Reserve Bank of St. Louis
Digitized for FRASER http://fraser.stlouisfed.org/ Federal Reserve Bank of St. Louis
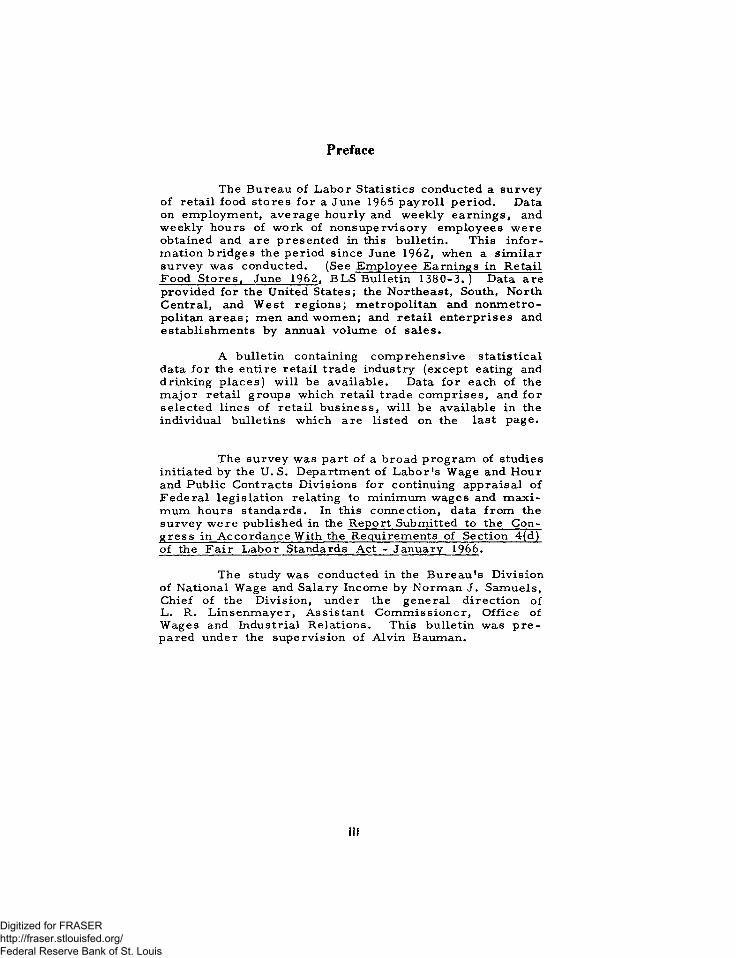
Preface
The Bureau of Labor Statistics conducted a survey o f retail food stores fo r a June 1965 payroll p eriod . Data on em ploym ent, average hourly and weekly earnings, and weekly hours of work of npnsupervisory em ployees w ere obtained and are presented in this bulletin. This in fo r m ation bridges the period since June 1962, when a s im ila r survey was conducted. (See Em ployee Earnings in Retail Food S tores, June 1962, BLS Bulletin 1380-3 .) Data are provided for the United States; the Northeast, South, North Central, and W est reg ion s; m etropolitan and n onm etropolitan a reas; m en and w om en; and retail en terprises and establishm ents by annual volum e of sa les.
A bulletin containing com prehensive statistica l data for the entire retail trade industry (except eating and drinking p la ces) w ill be available. Data fo r each of the m a jor retail groups which retail trade com p rises , and fo r se lected lines of retail business, w ill be available in the individual bulletins which are listed on the last page.
The survey was part o f a broad program of studies initiated by the U. S. Department o f L abor 's Wage and Hour and Public Contracts D ivisions for continuing appraisal of Federa l legislation relating to minimum wages and m a x imum hours standards. In this connection, data from the survey w ere published in the Report Submitted to the Congress in A ccordan ce With the Requirem ents of Section 4(d) of the F a ir L abor Standards Act - January 1966.
The study was conducted in the B ureau 's D ivision of National Wage and Salary Incom e by Norman J. Samuels, Chief o f the D ivision, under the general d irection of L. R. L insenm ayer, Assistant C om m issioner, O ffice of Wages and Industrial Relations. This bulletin was p r e pared under the supervision o f Alvin Bauman.
m
Digitized for FRASER http://fraser.stlouisfed.org/ Federal Reserve Bank of St. Louis
Digitized for FRASER http://fraser.stlouisfed.org/ Federal Reserve Bank of St. Louis
Contents
P age
S cope and m ethod o f s u rv e y --------------------------------------------------------------- .------------------------- 1
T a b les :
F ood s to re s —1. C um ulative n u m e rica l and p e rce n t d is tr ib u tion s o f n on su p er-
v is o r y em p lo y e e s by a v era g e s tra ig h t-t im e h ou rly ea rn in g s ,United States and re g io n s , June 1965 -------------------------------------------------- 5
2. C um ulative p e rce n t d is tr ib u tion o f n o n su p e rv is o ry e m p loy ees bya v era g e s tra ig h t-t im e h ou rly e a rn in g s , by m etrop o lita n and n on m etrop olita n a re a s , U nited States and re g io n s , June 1965____ 6
3. C um ulative p e rce n t d is tr ib u tion o f nonsupe rv is o r y e m p loy eesby a vera ge s tra ig h t-t im e h ou rly ea rn in g s , by sex ,U nited States and re g io n s , June 1965 -------------------------------------------------- 7
4. C um ulative p e rc e n t d is tr ib u tion o f nonsupe rv is o r y e m p loy eesb y a v era g e s tra ig h t-t im e h ou rly ea rn in g s , by e n te rp r is e andesta b lish m en t s a le s - s iz e c la s s e s , U nited States, m etrop o lita nand n on m etrop olita n a r e a s , and re g io n s , June 1965 ----------------------- 8
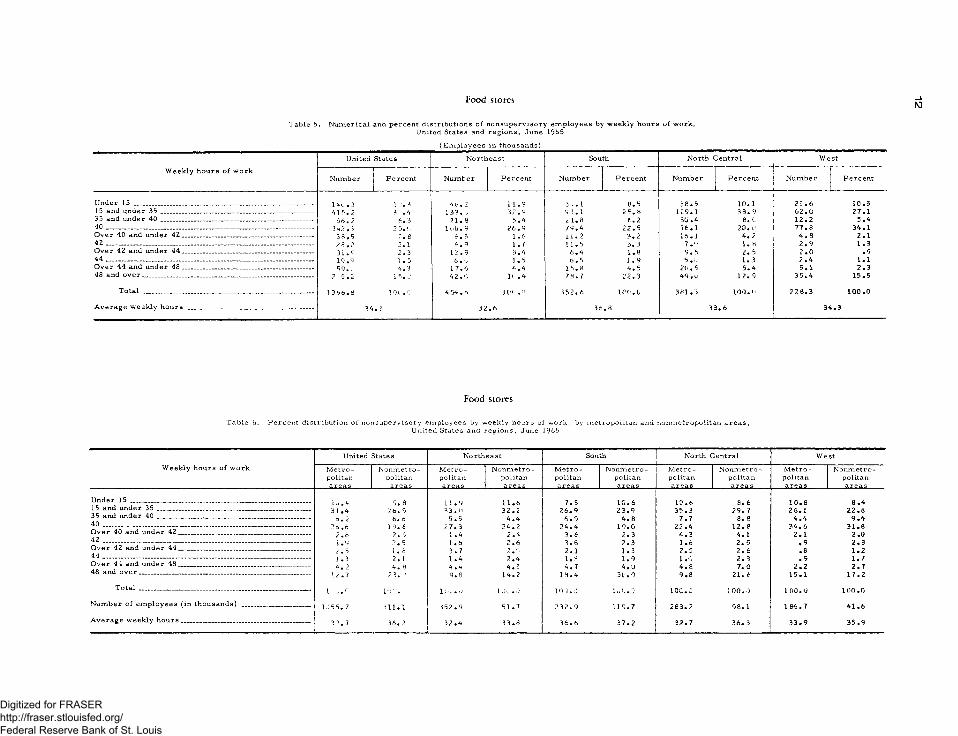
5. N u m e rica l and p e rce n t d is tr ib u tion s o f nonsupe r v is o r ye m p lo y e e s by w eek ly h ou rs o f w ork , U nited States andre g io n s , June 1965----------------------------------------------------------------------------------- 12
6. P e r c e n t d is tr ib u tion o f n o n su p e rv iso ry e m p lo y e e s by w eek lyh ou rs o f w ork , b y m etro p o lita n and n on m etrop olita n a re a s ,U nited States and re g io n s , June 1965 -------------------------------------------------- 12
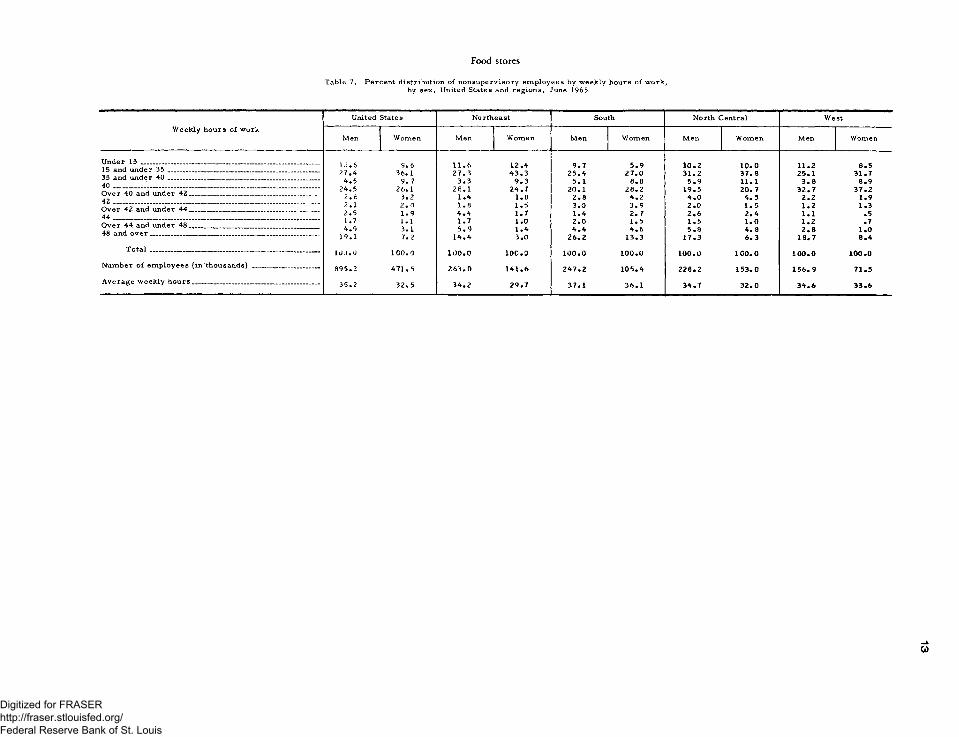
7. P e r c e n t d is tr ib u tion o f n o n su p e rv iso ry e m p lo y e e s by w eek lyh ou rs o f w ork , by sex , U nited States and re g io n s , June 1965-------- 13
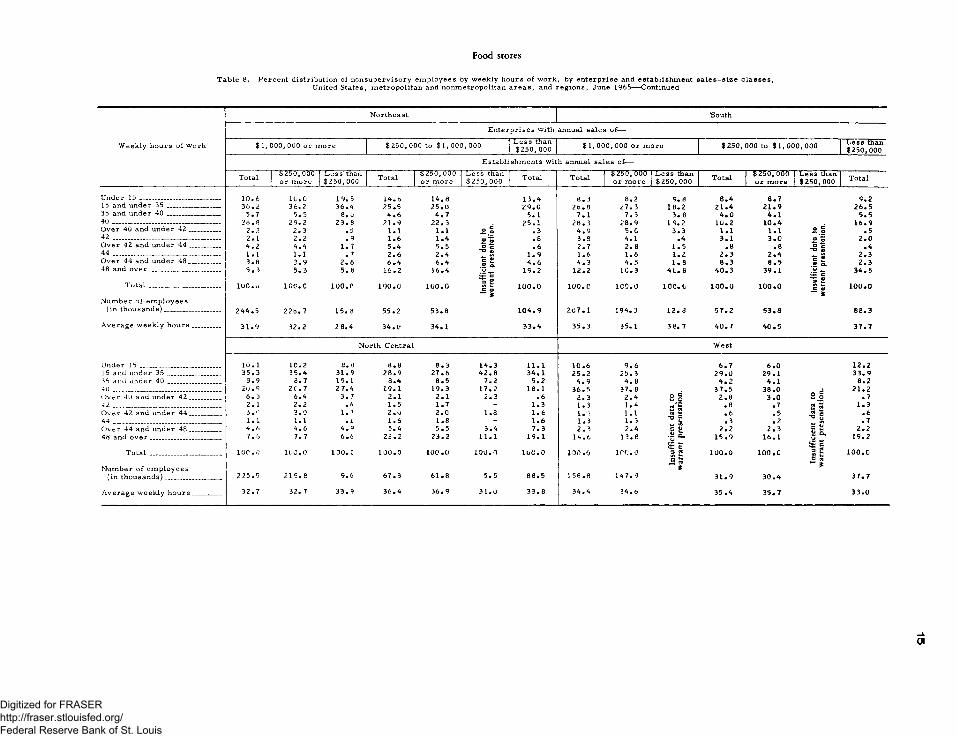
8. P e r c e n t d is tr ib u tion o f n o n su p e rv iso ry e m p lo y e e s by w eek lyh ou rs o f w ork , by e n te rp r is e and esta b lish m en t s a le s - s iz ec la s s e s , U nited S tates, m etrop o lita n and n on m etrop olita na re a s , and re g io n s , June 1965 ------------------------------------------------------------- 14
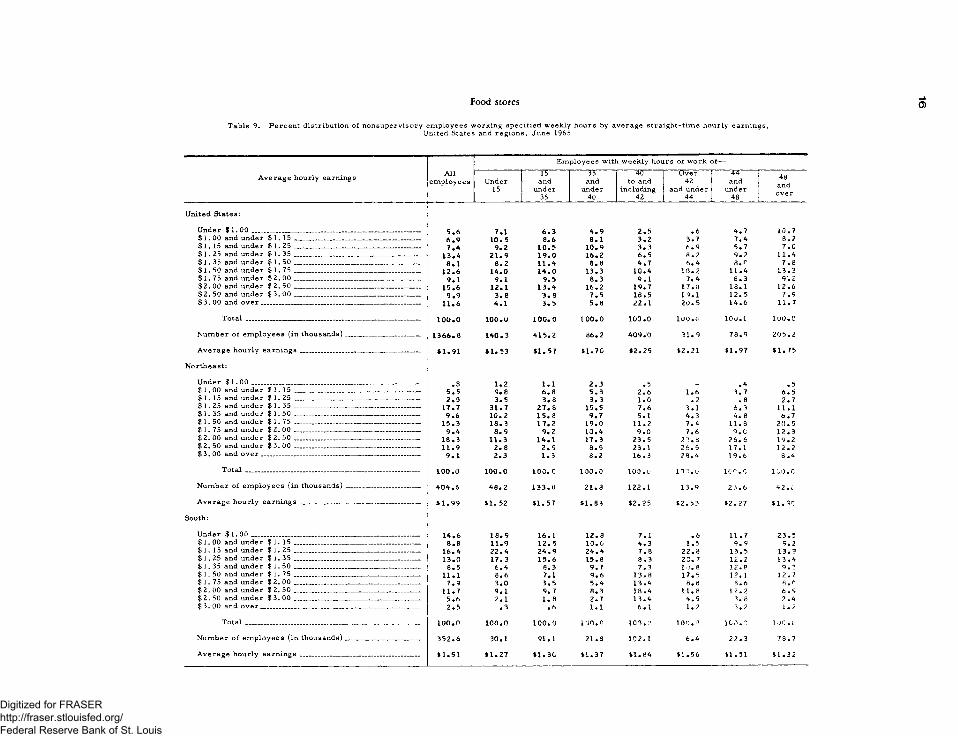
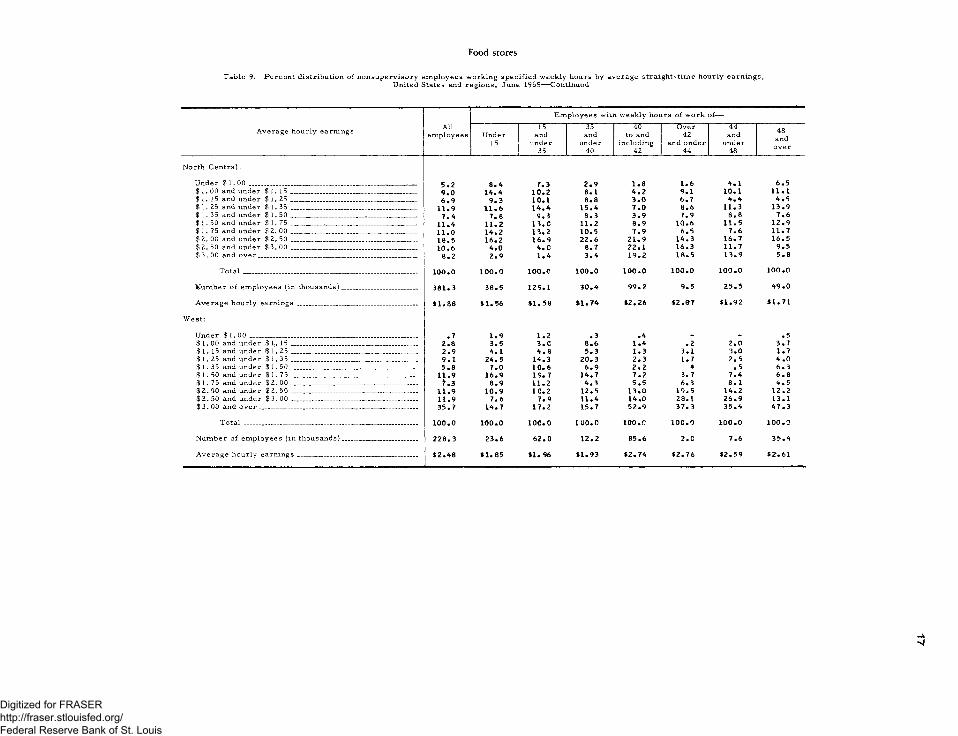
9. P e r ce n t d is tr ib u tion o f n o n su p e rv iso ry e m p lo y e e s w ork ings p e c if ie d w eek ly h ou rs by a vera ge s tra ig h t-t im e h ou rlye a rn in g s , United States and re g io n s , June 1965------------------------------- 16
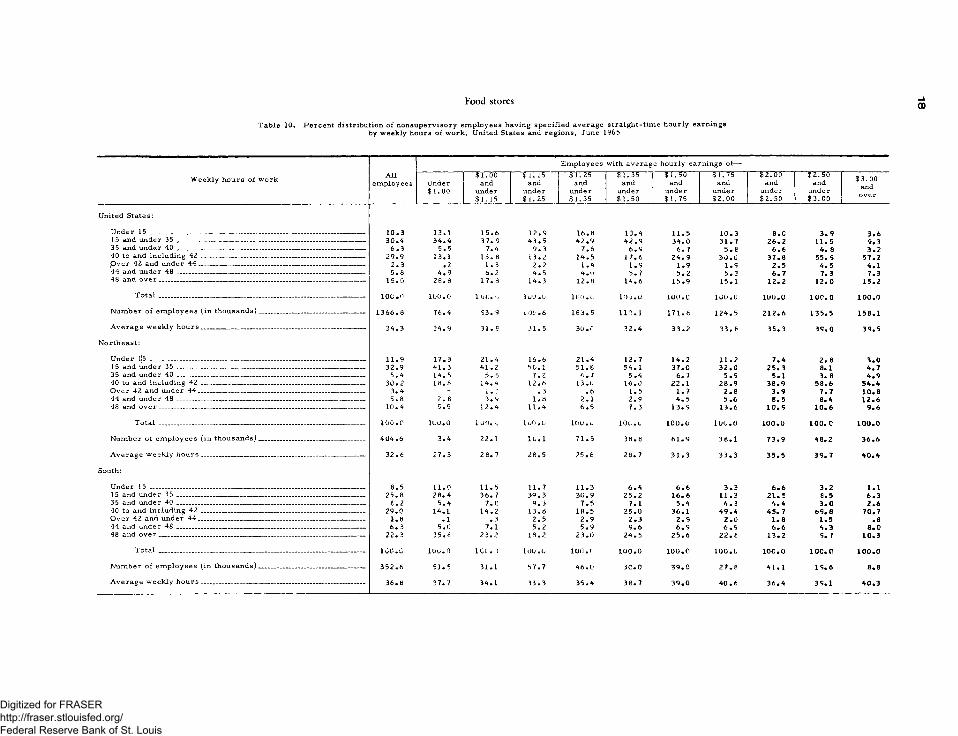
10. P e r ce n t d is tr ib u tion o f n o n su p e rv iso ry em p lo y e e s havings p e c if ie d a v era g e s tra ig h t-t im e h ou rly earn in gs by w eek lyh ou rs o f w ork , United States and re g io n s , June 196 5 --------------------- 18
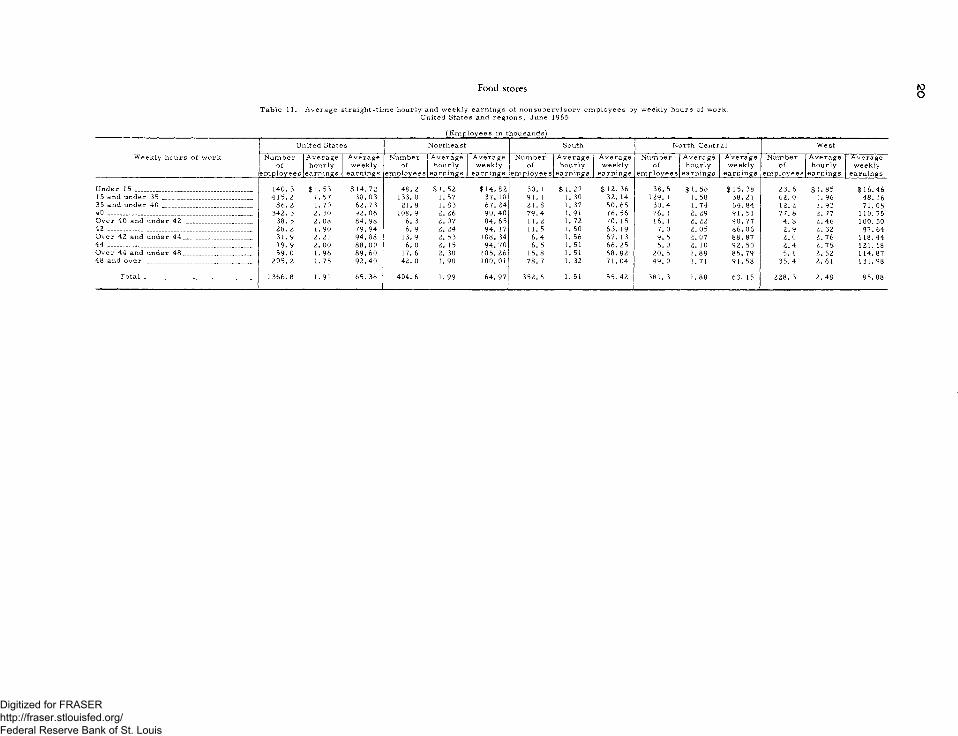
11. A v era g e s tra ig h t-t im e h ou rly and w eek ly earn in gs of n on su p e rv is o r y e m p lo y e e s by w eek ly h ou rs o f w orkx U nited Statesand re g io n s , June 1965 _________________________________________________ 20
G r o c e r y s to r e s —12. C um ulative n u m e rica l and p e rce n t d is tr ib u tion s o f n o n su p e r
v is o r y e m p lo y e e s by a vera ge s tra ig h t-t im e h ou rly ea rn in g s ,U nited States and re g io n s , June 1965 -------------------------------------------------- 21
13. C um ulative p e rce n t d is tr ib u tion o f n o n su p e rv iso ry em p lo y e e sby a vera ge s tra ig h t-t im e h ou rly ea rn in g s , by m e tro p o lita n and n on m etrop o lita n a r e a s , U nited States and re g io n s ,June 1965 --------------------------------------------------------------------------------------------------- 22
14. C um ulative p e rc e n t d is tr ib u tion o f n o n su p e rv iso ry em p lo y e e sby a vera ge s tra ig h t-t im e h ou rly e a rn in g s , by sex ,United States and re g io n s , June 1965-------------------------------------------------- 23
v
Digitized for FRASER http://fraser.stlouisfed.org/ Federal Reserve Bank of St. Louis
Contents— Continued
P age
T a b les— Continued
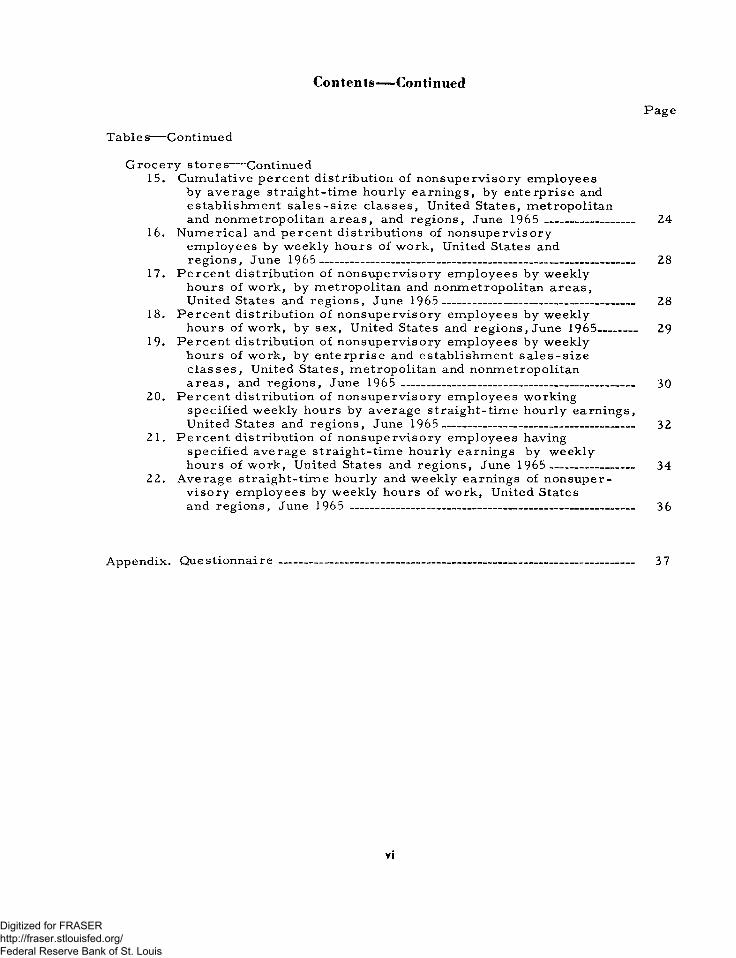
Grocery stores— Continued15. C um ulative p e rc e n t d is tr ib u tion o f n o n su p e rv iso ry e m p loy ees
by a vera ge s tra ig h t-t im e h ou rly ea rn in g s , by e n te rp r is e andesta b lish m en t s a le s - s iz e c la s s e s , U nited States, m etrop o lita nand n on m etrop o lita n a re a s , and re g io n s , June 1965 ------------------------ 24
16. N u m e rica l and p e rc e n t d is tr ib u tion s o f n o n su p e rv iso rye m p lo y e e s by w eek ly h ou rs o f w ork , U nited States andre g io n s , June 1965 ------------------------------------------------------------------------------------ 28
17. P e r ce n t d is tr ib u tion o f n o n su p e rv iso ry e m p lo y e e s by w eek lyh ou rs o f w ork , by m etrop o lita n and n on m etrop o lita n a re a s ,U nited States and re g io n s , June 1965__________________________________ 28
18. P e r ce n t d is tr ib u tion o f n o n su p e rv iso ry e m p lo y e e s by w eek lyh ou rs o f w o rk , by sex , U nited States and re g io n s , June 1965_______ 29
19. P e r ce n t d is tr ib u tion o f n o n su p e rv iso ry e m p lo y e e s by w eek lyh ou rs o f w ork , by e n te rp r is e and esta b lish m en t s a le s - s iz ec la s s e s , U nited States, m e tro p o lita n and n on m etrop olita na r e a s , and re g io n s , June 1965 -------------------------------------------------------------- 30
20. P e r c e n t d is tr ib u tion o f n o n su p e rv iso ry e m p lo y e e s w ork ings p e c if ie d w eek ly h ou rs by a vera ge s tra ig h t-t im e h ou rly ea rn in g s , U nited States and re g io n s , June 1965--------------------------------------------------- 32
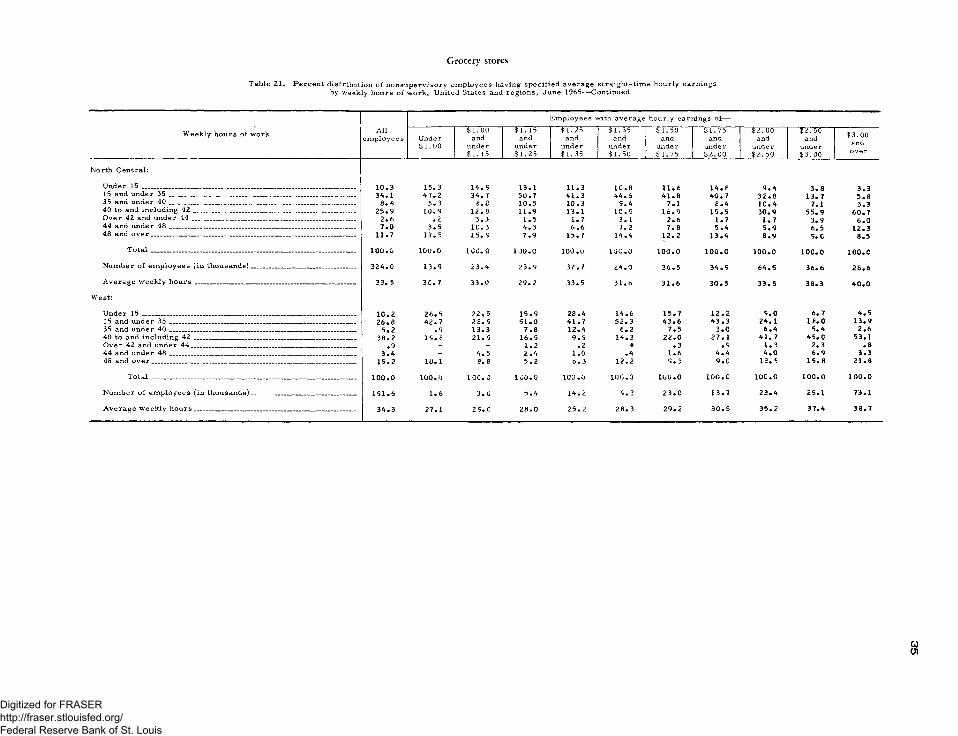
21. P e r c e n t d is tr ib u tion o f n o n su p e rv iso ry e m p lo y e e s havings p e c if ie d a v era g e s tra ig h t-t im e h ou rly earn in gs by w eek lyh ou rs o f w ork , U nited States and re g io n s , June 1965_______________ 34
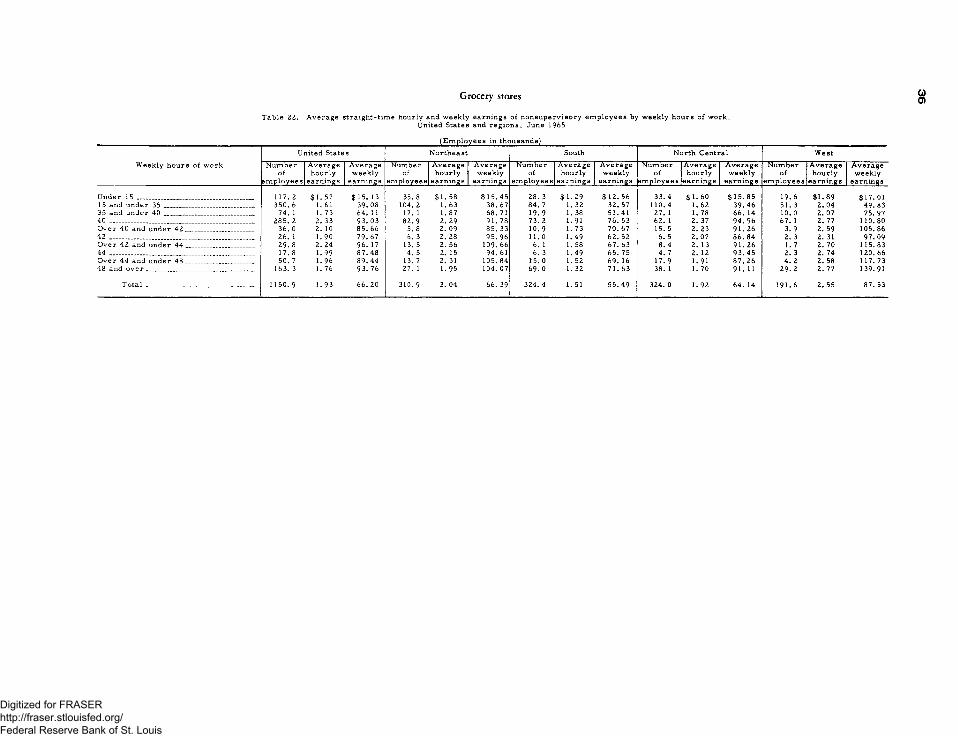
22. A v e ra g e s tra ig h t-t im e h ou rly and w eek ly earn in gs o f n on su p e rv is o r y em p lo y e e s by w eek ly h ou rs o f w ork , U nited Statesand re g io n s , June 1965 ---------------------------------------------------------------------------- 36
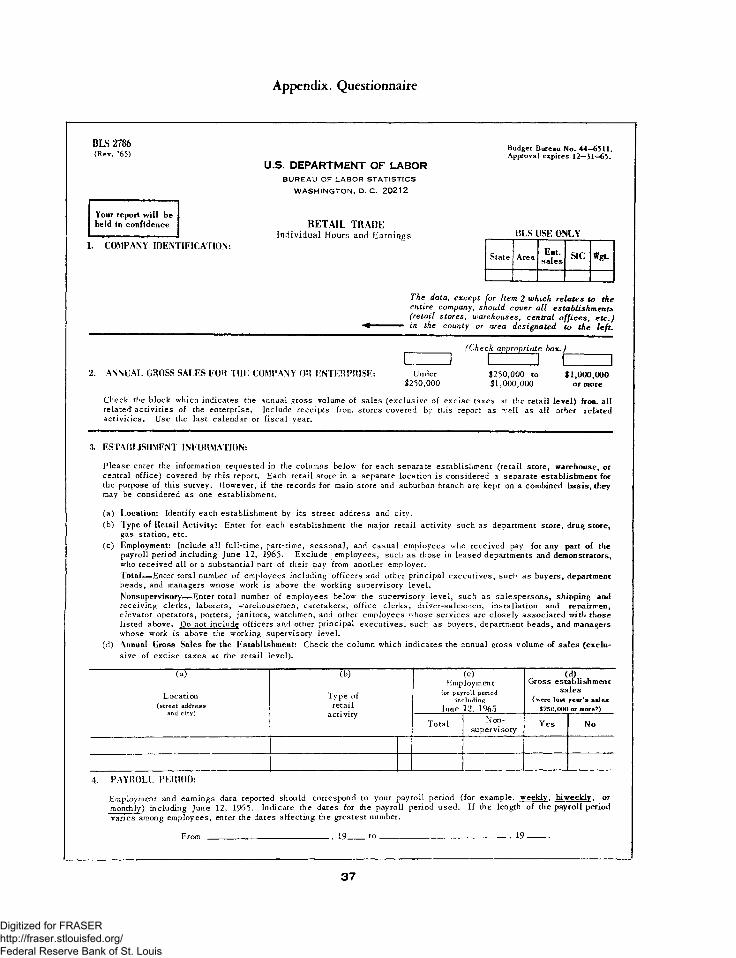
Appendix. Questionnaire 37
Digitized for FRASER http://fraser.stlouisfed.org/ Federal Reserve Bank of St. Louis
Employee Earnings and Hours in Retail Food Stores, June 1965
Scope and Method of Survey
Scope of Survey
This bulletin relates to those retail establishments which were classified, according to the 1957 edition of the Standard Industrial Classification Manual, as part of the food major industry group (SIC 54). Stores within this group were further identified as grocery stores (SIC 541). The major group includes retail stores primarily engaged in selling food for home preparation and consumption and covers grocery stores, meat and fish markets, fruit and vegetable markets, confectioneries, dairy products stores, bakeries, and egg and poultry dealers. Establishments primarily engaged in processing and distributing milk and cream are classified in manufacturing.
Grocery stores are commonly known as supermarkets, food markets, and delicatessen stores and are primarily engaged in the retail sale of all sorts of packaged and fresh foods.
Geographically, the 5 0 States and the District of Columbia are covered. The data reflect earnings and hours of work of nonsupervisory employees for a payroll period including June 12, 1965.
Sample DesignThe sample was designed to yield national and regional estimates for the major in
dustry group and for the line of business for which separate data are shown. A stratified sample design was used with variable sampling ratios depending on the kind of business and employment size. For example, the sample size for the line of business shown separately was proportionately larger than for those not published and the probability of selection increased with the employment size of the unit.
The following tabulation shows the number of units included in the sample of the food group and in the grocery stores for which separate data are published:
Kind o f business Number o f units
Food group ----------------------------------------------------------------------------------------------------- 4 ,6 7 4Grocery s t o r e s -------------------------------------------------------------------------------------------- 3 ,8 6 9
Establishment samples were obtained from three different sources: (1) State unemployment insurance listings furnished employer reporting units with four or more employees. (2) The large chainstore enterprises provided current lists of retail stores and auxiliary units from which a sample of such units was selected. It was necessary to obtain these lists from the large chainstore enterprises because State unemployment insurance listings frequently provide data on a statewide or county basis for such companies rather than on an individual establishment basis. (3) The Bureau of the Census sample used in conjunction with its Monthly Survey of Retail Sales covered single-unit retail stores with fewer than four employees. The Census coverage of small units was necessary to supplement the Bureau's universe list for retail trade, since State unemployment insurance laws in many States do not cover employers with fewer than four employees.
Method of CollectionThe majority of the establishments included in the sample were solicited for infor
mation by mail. The largest units were visited in person by field economists of the Bureau of Labor Statistics, as were the smallest units by the Bureau of the Census enumerators acting as agents for the BLS. Personal visits were also made to a sample of the nonrespondents to the mail questionnaire.
1
Digitized for FRASER http://fraser.stlouisfed.org/ Federal Reserve Bank of St. Louis
2
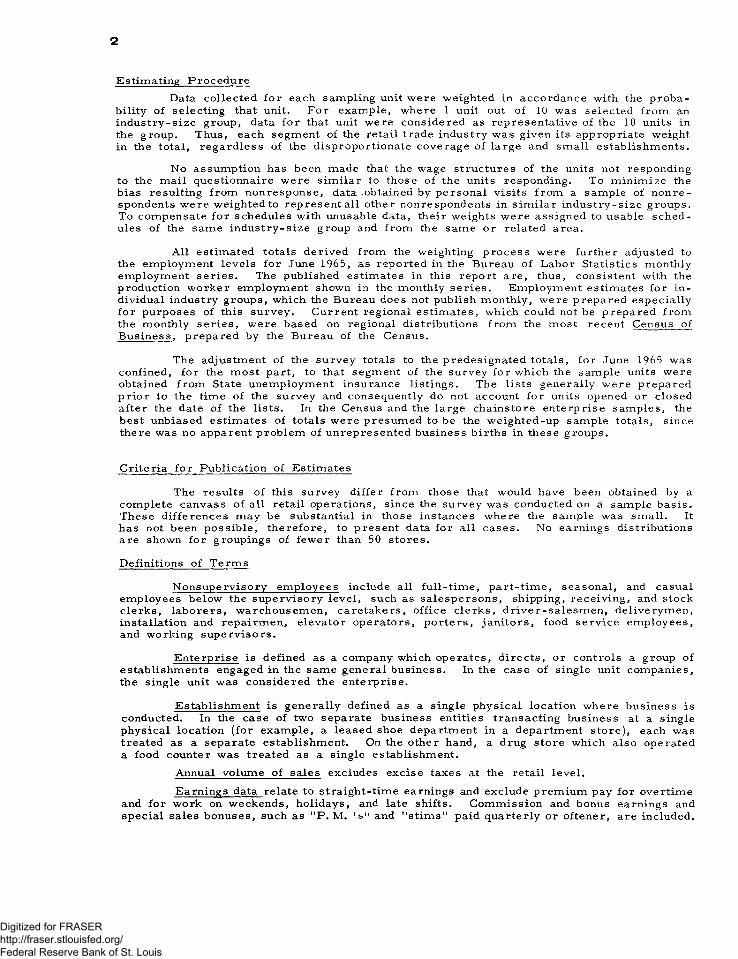
Estimating ProcedureData collected for each sampling unit were weighted in accordance with the proba
bility of selecting that unit. For example, where 1 unit out of 10 was selected from an industry-size group, data for that unit were considered as representative of the 10 units in the group. Thus, each segment of the retail trade industry was given its appropriate weight in the total, regardless of the disproportionate coverage of large and small establishments.
No assumption has been made that the wage structures of the units not responding to the mail questionnaire were similar to those of the units responding. To minimize the bias resulting from nonresponse, data obtained by personal visits from a sample of nonrespondents were weightedto represent all other nonrespondents in similar industry-size groups. To compensate for schedules with unusable data, their weights were assigned to usable schedules of the same industry-size group and from the same or related area.
All estimated totals derived from the weighting process were further adjusted to the employment levels for June 1965, as reported in the Bureau of Labor Statistics monthly employment series. The published estimates in this report are, thus, consistent with the production worker employment shown in the monthly series. Employment estimates for individual industry groups, which the Bureau does not publish monthly, were prepared especially for purposes of this survey. Current regional estimates, which could not be prepared from the monthly series, were based on regional distributions from the most recent Census of Business, prepared by the Bureau of the Census.
The adjustment of the survey totals to the predesignated totals, for June 1965 was confined, for the most part, to that segment of the survey for which the sample units were obtained from State unemployment insurance listings. The lists generally were prepared prior to the time of the survey and consequently do not account for units opened or closed after the date of the lists. In the Census and the large chainstore enterprise samples, the best unbiased estimates of totals were presumed to be the weighted-up sample totals, since there was no apparent problem of unrepresented business births in these groups.
Criteria for Publication of Estimates
The results of this survey differ from those that would have been obtained by a complete canvass of all retail operations, since the survey was conducted on a sample basis. These differences may be substantial in those instances where the sample was small. It has not been possible, therefore, to present data for all cases. No earnings distributions are shown for groupings of fewer than 50 stores.
Definitions of Terms
Nonsupervisory employees include all full-time, part-time, seasonal, and casual employees below the supervisory level, such as salespersons, shipping, receiving, and stock clerks, laborers, warehousemen, caretakers, office clerks, driver-salesmen, deliverymen, installation and repairmen, elevator operators, porters, janitors, food service employees, and working supervisors.
Enterprise is defined as a company which operates, directs, or controls a group of establishments engaged in the same general business. In the case of single unit companies, the single unit was considered the enterprise.
Establishment is generally defined as a single physical location where business is conducted. In the case of two separate business entities transacting business at a single physical location (for example, a leased shoe department in a department store), each was treated as a separate establishment. On the other hand, a drug store which also operated a food counter was treated as a single establishment.
Annual volume of sales excludes excise taxes at the retail level.Earnings data relate to straight-time earnings and exclude premium pay for overtime
and for work on weekends, holidays, and late shifts. Commission and bonus earnings and special sales bonuses, such as nP. M. ' s " and "stim s" paid quarterly or oftener, are included.
Digitized for FRASER http://fraser.stlouisfed.org/ Federal Reserve Bank of St. Louis
3
Individual average hourly earnings for employees not paid by the hour (e. g. , salary, commissions) were obtained by dividing individual earnings reported by the number of hours worked during the corresponding period.
Individual weekly earnings were obtained by multiplying the individual average hourly earnings by the number of hours worked during a single week in June 1965.
Group average hourly earnings published in this report were obtained by dividing total individual weekly earnings by total individual weekly hours worked.
Group average weekly earnings were obtained by dividing the sum of the individual weekly earnings by the number of employees represented in the group total.
Weekly hours of work are for a 1-week period and include hours paid for vacations, holidays, sick leave, etc.
Group average weekly hours were obtained by dividing total weekly hours worked by total number of nonsupervisory employees.
Regions used in this study include the following: Northeast— Connecticut, Maine,Massachusetts, New Hampshire, New Jersey, New York, Pennsylvania, Rhode Island, and Vermont; South— Alabama, Arkansas, Delaware, District of Columbia, Florida, Georgia, Kentucky, Louisiana, Maryland, Mississippi, North Carolina, Oklahoma, South Carolina, Tennessee, Texas, Virginia, and West Virginia; North Central— Illinois, Indiana, Iowa, Kansas, Michigan, Minnesota, Missouri, Nebraska, North Dakota, Ohio, South Dakota, and Wisconsin; and West—Alaska, Arizona, California, Colorado, Hawaii, Idaho, Montana, Nevada, New Mexico, Oregon, Utah, Washington, and Wyoming*
Metropolitan areas as used in this report refers to those cities and county areas defined by the Bureau of the Budget as "Standard Metropolitan Statistical Areas. " Metropolitan areas include those counties containing at least one central city of 50, 000 population and those counties around such cities which are metropolitan in character and economically and socially integrated with the county containing the central city. For a more detailed description, see Standard Metropolitan Statistical Areas, 1964, prepared by the Bureau of the Budget.
Digitized for FRASER http://fraser.stlouisfed.org/ Federal Reserve Bank of St. Louis
Table Note
Because of rounding, sums of individual items may not equal totals.
Dash (-) indicates no employees.
Asterisk (*) indicates fewer than 50 employees or less than 0. 05 percent.
Digitized for FRASER http://fraser.stlouisfed.org/ Federal Reserve Bank of St. Louis
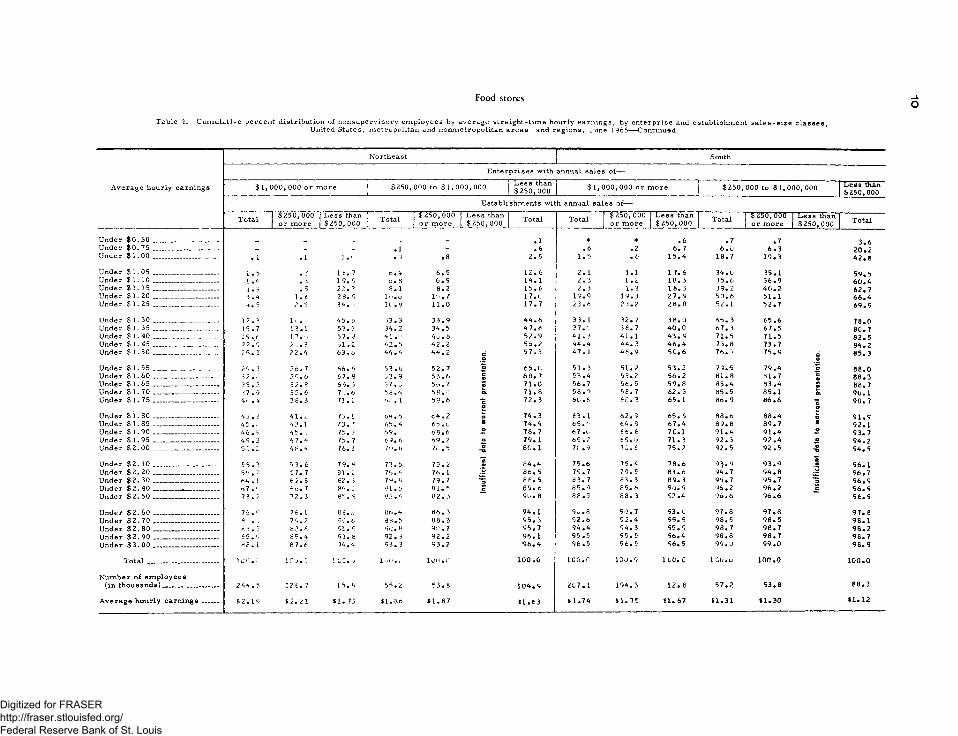
Food stores
Table 1. Cumulative numerical and percent distributions of nonsupervisory employees by average straight-time hourly earnings,United States and regions, June 1965
(Employees in thousands)
Average hourly earningsUnited States Northeast South North Central West
Number Percent Number Percent Number Percent Number Percent Number Percent
Average hourly earn in gs_______ ___ _________________ $ 1 .,51 $1 .,99 $ 1 .51 $1 .88 $2. 4 8
01
Digitized for FRASER http://fraser.stlouisfed.org/ Federal Reserve Bank of St. Louis
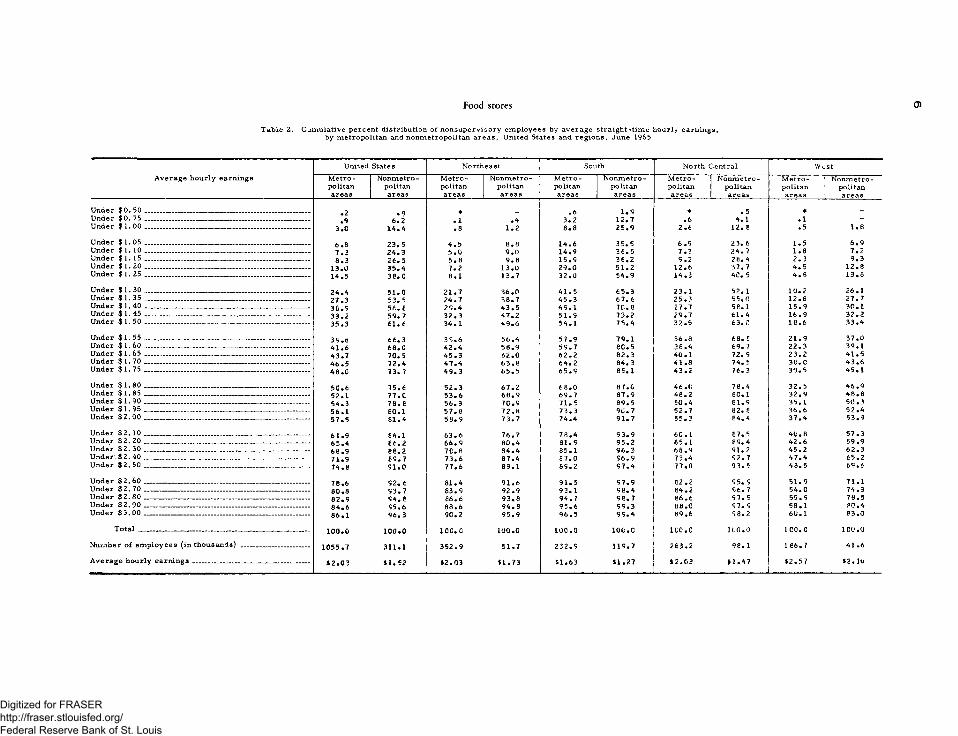
Food stores 0)
Table 2. Cumulative percent distribution of nonsupervisory employees by average straight-time hourly earnings,by metropolitan and nonmetropolitan areas, United States and regions, June 1965
Average hourly earningsUnited States Northeast South North Central West
Digitized for FRASER http://fraser.stlouisfed.org/ Federal Reserve Bank of St. Louis
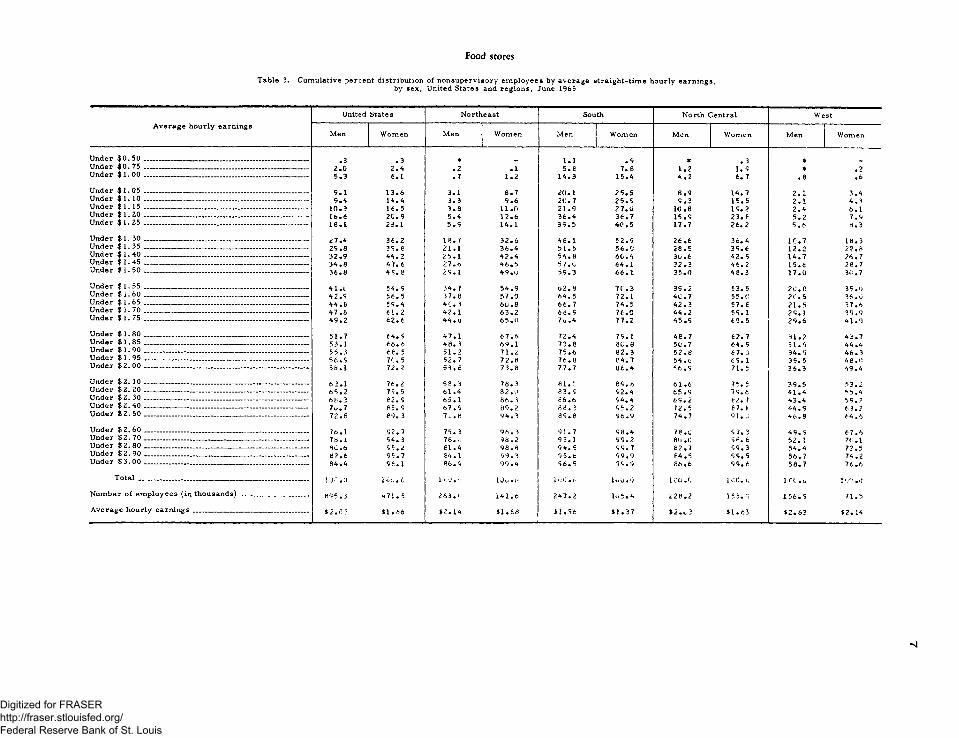
Food stores
Table 3. Cumulative percent distribution of nonsupervisory employees by average straight-time hourly earnings,by sex, United States and regions, June 1965
Average hourly earningsUnited States Northeast South North Central West
Digitized for FRASER http://fraser.stlouisfed.org/ Federal Reserve Bank of St. Louis
Food stores 00
Table 4. Cumulative percent distribution of nonsupervisory employees by average straight-time hourly earnings, by enterprise and establishment sales-size classes,United States, metropolitan and nonmetropolitan areas, and regions, June 1965
United States
Enterprises with annual sales of—
Average hourly earnings $ 1, 000, 000 or more $250, 000 to $1 , 000, 000 Less than $2 50 ,0 00
Digitized for FRASER http://fraser.stlouisfed.org/ Federal Reserve Bank of St. Louis
Food stores
Table 4. Cumulative percent distribution of nonsupervisory employees by average straight-time hourly earnings, by enterprise and establishment sales-size classes,United States, metropolitan and nonmetropolitan areas, and regions, June 1965— Continued
Metropolitan areas Nonmetropolitan areas
Enterprises with annual sales of—
Average hourly earnings $ 1, 000, 000 or more $250, 000 to $ 1, 000,000 Less than $250 ,0 00 $ 1, 000, 000 or more $250, 000 to $ 1, 000,000 Less than
$250, 000Establishments with annual sales of—
Total $250 ,000 or more
Less than $250, 000 Total $250, 000
or moreLe ss than $250 , 000 Total Total $250 ,0 00
Digitized for FRASER http://fraser.stlouisfed.org/ Federal Reserve Bank of St. Louis
Food storesO
Table 4. Cumulative percent distribution of nonsupervisory employees by average straight-time hourly earnings, by enterprise and establishment sales-size classes,United States, metropolitan and nonmetropolitan areas and regions, June 1965— Continued
Average hourly earnings
Northeast South
Enterprises with annual sales of—
$ 1, 000, 000 or more $250, 000 to $ 1, 000, 000 Le ss than $250, 000 $ 1, 000, 000 or more $250, 000 to $ 1, 000,000 Less than
$250 ,000Establishments with annual sales of—
Total $2 50 ,0 00 or more
Less than $2 50 ,0 00 Total $2 50 ,0 00
or moreLe ss than $250 ,0 00 Total Total $250 ,0 00
Average hourly ea rn in gs_____ S 2 .1 5 * 2.21 $1 . 73 $1.86 $ 1 .8 7 $ 1 .6 3 $ 1.74 $ 1 .7 5 $1. 67 $1 .31 $1 .3 0 $1.12
Digitized for FRASER http://fraser.stlouisfed.org/ Federal Reserve Bank of St. Louis
Food stores
Table 4.. Cumulative rcent distribution of nonsupervisory employees by average straight-time hourly earnings, by enterprise and establishment sales-size classes,United States, metropolitan and nonmetropolitan areas, and regions, June 1965— Continued
Average hourly earnings
North Central West
Enterprises with annual sales of—
$ 1, 000, 000 or more $250, 000 to $ 1, 000,000 Le ss than $250 ,0 00 $ 1, 000, 000 or more $250, 000 to $ 1, 000, 000 Less than
Average weekly hours _____________________________________ 34 32J________________
.6 36 .8 3 3 . 6 3 4 .3
Food stores
Table 6. Percent distribution of nonsupervisory employees by weekly hours of work, by metropolitan and nonmetropolitan areas,United States and regions, June 1965
Digitized for FRASER http://fraser.stlouisfed.org/ Federal Reserve Bank of St. Louis
Food stores
Table 7. Percent distribution of nonsupervisory employees by weekly hours of work,by sex, United States and regions, June 1965
Weekly hours of work
Under 15 ________________________________15 and under 3 5 ________________ ________35 and under 4 0 ________________________4 0 _________ _______________________________Over 40 and under 4 2 ________ __________4 2 _____________________________ __________Over 42 and under 4 4 __________________4 4 ________________________________________Over 44 and under 4 8 __________________48 and o v e r _____________________________
Digitized for FRASER http://fraser.stlouisfed.org/ Federal Reserve Bank of St. Louis
Food stores
Percent distribution of nonsupervisory employees by weekly hours of work, by enterprise and establishment sales-size classes,United States, metropolitan and nonmetropolitan areas, and regions, June 1965
Under 15 ____________________15 and under 3 5 ____________35 and under 4 0 ____________4 0 ____________________________Over 40 and under 4 2 _____4 2 __________ _________________Over 42 and under 4 4 _____4 4 ____________________________Over 44 and under 4 8 _____48 and o v e r _________________
T o t a l _________________
Number of employees (in thousands)_____________
A v e r ag e weekly hours____
Metropolitan areas Nonmetropolitan areas
Enterprises with annual sales of—
$ 1, 000, 000 or more $250, 000 to $ 1 ,000 , 000 Less than $250, 000 $ 1, 000,000 or more $250, 000 to $ 1, 000,000 Less than
$250 ,0 00
Establishments with annual sales of—
Total $ 2 5 MOOor more
Le ss than $250 ,0 00 Total $250 ,0 00
or moreLe ss than $2 50 ,0 00 Total Total $250 ,0 00
Digitized for FRASER http://fraser.stlouisfed.org/ Federal Reserve Bank of St. Louis
Food stores
Table 8. Percent distribution of nonsupervisory employees by weekly hours of work, by enterprise and establishment sales-size classes,United States, metropolitan and nonmetropolitan areas, and regions, June 1965— Continued
Northeast South
Enterprises with annual sales of—
Weekly hours of work $ 1, 000, 000 or more $250, 000 to $ 1, 00 0 , 000 Less than $250 ,0 00 $ 1, 000,000 or more $250 ,0 00 to $ 1, 000, 000 Less than
$250,000Establishments with annual sales of—
Total $250 ,000 or more
Le ss than $250 ,000 Total $250, 000
or moreLess than $2 50 ,0 00 Total Total $250 ,0 00
Digitized for FRASER http://fraser.stlouisfed.org/ Federal Reserve Bank of St. Louis
Food stores 0)
Table 9. Percent distribution of nonsupervisory employees working specified weekly hours by average straight-time hourly earnings,United States and regions, June 1965
T o t a l .................................... ........................................................ — 100.0 100.0 100.0 100.0 100.0 100.0 100. C 100.0
T o t a l ______________________________________________ ______ 100.0 100.0 100.0 100.0 io n . : ! 100.0 100.0 lOO.i.
Number of employees (in thousands)______________ _______ 3 5 2 .6 30 .1 91 .1 21.8 102.1 6 . 4 2 2 . 3 7 8 . 7
Average hourly earnings _ . _ . _ _ _ _ _ S I . 51 S I . 27 S1.3C $ 1 .3 7 $ 1 .8 4 $ 1 .5 6 $1 .51 $ 1 . 3 2
Digitized for FRASER http://fraser.stlouisfed.org/ Federal Reserve Bank of St. Louis
Food stores
Table 9. Percent distribution of nonsupervisory employees working specified weekly hours by average straight-time hourly earnings,United States and regions, June 1965— Continued
Digitized for FRASER http://fraser.stlouisfed.org/ Federal Reserve Bank of St. Louis
Food stores 00
Table 10. Percent distribution of nonsupervisory employees having specified average straight-time hourly earningsby weekly hours of work, United States and regions, June 1965
Digitized for FRASER http://fraser.stlouisfed.org/ Federal Reserve Bank of St. Louis
Food stores
Table 10. Percent distribution of nonsupervisory employees having specified average straight-time hourly earningsby weekly hours of work, United States and regions, June 1965— Continued
Digitized for FRASER http://fraser.stlouisfed.org/ Federal Reserve Bank of St. Louis
T a b le 11. A v e ra g e stra igh t-t im e h ou rly and w eek ly ea rn in gs o f n o n su p e rv iso ry e m p lo y e e s by w eek ly hou rs o f w ork ,United States and re g io n s , June 1965
(E m p lo y e e s in thousands)
W eekly h ou rs o f w orkUnited States N ortheast South N orth C entral W est
Digitized for FRASER http://fraser.stlouisfed.org/ Federal Reserve Bank of St. Louis
Grocery stores
Table 12. Cumulative numerical and percent distributions of nonsupervisory employees by average straight-time hourly earnings,United States and regions, June 1965
(E m p lo y e e s in thousands)
Average hourly earnings
United States Northeast South North Central West
Number Percent Number Percent Number Percent Number Percent Number Percent
Digitized for FRASER http://fraser.stlouisfed.org/ Federal Reserve Bank of St. Louis
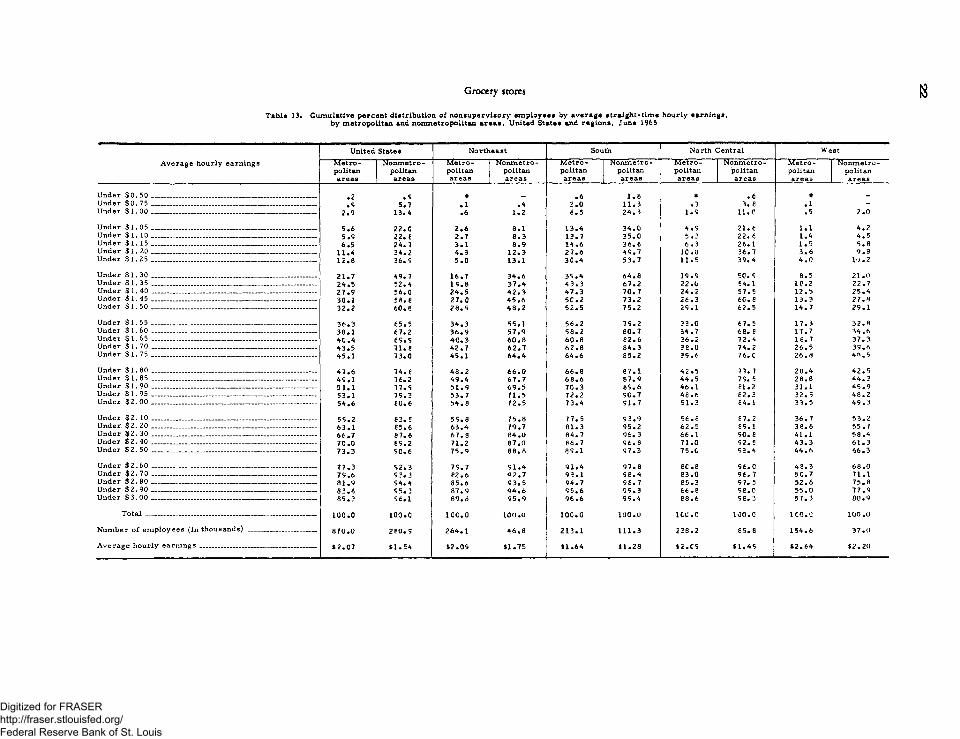
Grocery stores 18
Table 13. Cumulative percent distribution of nonsupervisory employees by average straight-time hourly earnings,by metropolitan and nonmetropolitan areas, United States and regions, June 1965
Digitized for FRASER http://fraser.stlouisfed.org/ Federal Reserve Bank of St. Louis
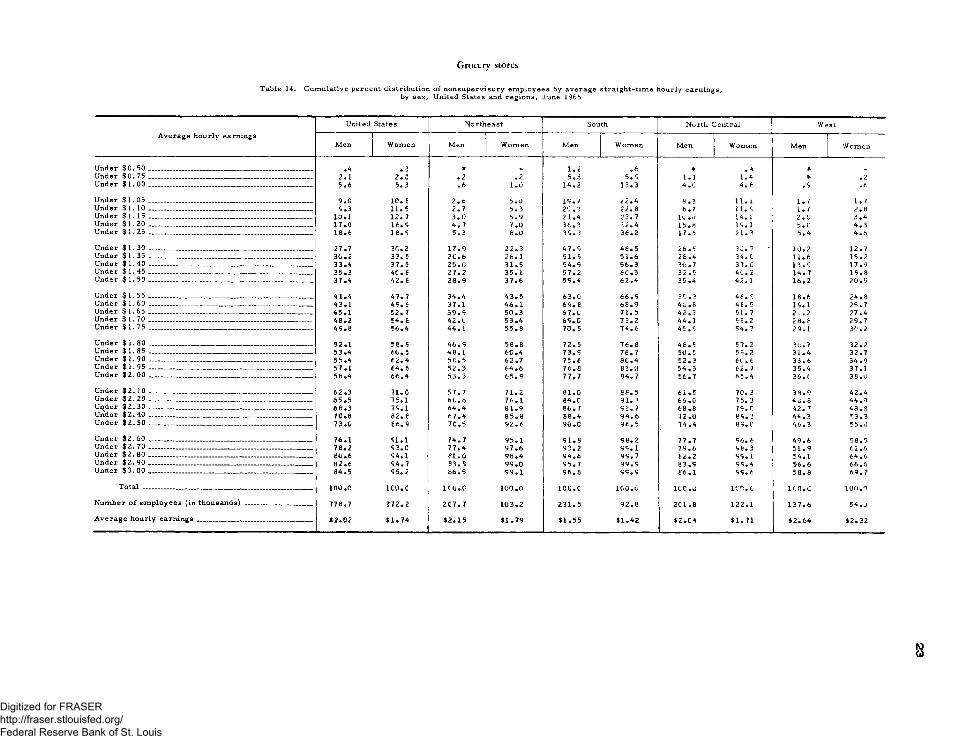
Grocery stores
Table 14. Cumulative percent distribution of nonsupervisory employees by average straight-time hourly earnings,by sex, United States and regions, June 1965
Average hourly earningsUnited States Northeast South North Central West
Digitized for FRASER http://fraser.stlouisfed.org/ Federal Reserve Bank of St. Louis
Grocery stores
Table 15. Cumulative percent distribution of nonsupervisory employees by average straight-time hourly earnings, by enterprise and establishment sales-size classes,United States, metropolitan and nonmetropolitan areas, and regions, June 1965
Digitized for FRASER http://fraser.stlouisfed.org/ Federal Reserve Bank of St. Louis
Grocery stores
Table 15. Cumulative percent distribution of nonsupervisory employees by average straight-time hourly earnings, by enterprise and establishment sales-size classes,United States, metropolitan and nonmetropolitan areas, and regions, June 1965— Continued
Average hourly earnings
Metropolitan areas Nonmetropolitan areas
Enterprises with annual salesi of—
$ 1, 000, 000 or more $250, 000 to $ 1, 000,000 Le ss than $2 50 ,0 00 $ 1, 000, 000 or more $250, 000 to $ 1, 000,000 Less than
$250 ,000Establishments with annual sales of—
Total $250 ,000 or more
Less than $250 ,0 00 Total $250 ,0 00
or moreLe ss than $250, 000 Total Total $ 2 50 ,0 00
Digitized for FRASER http://fraser.stlouisfed.org/ Federal Reserve Bank of St. Louis
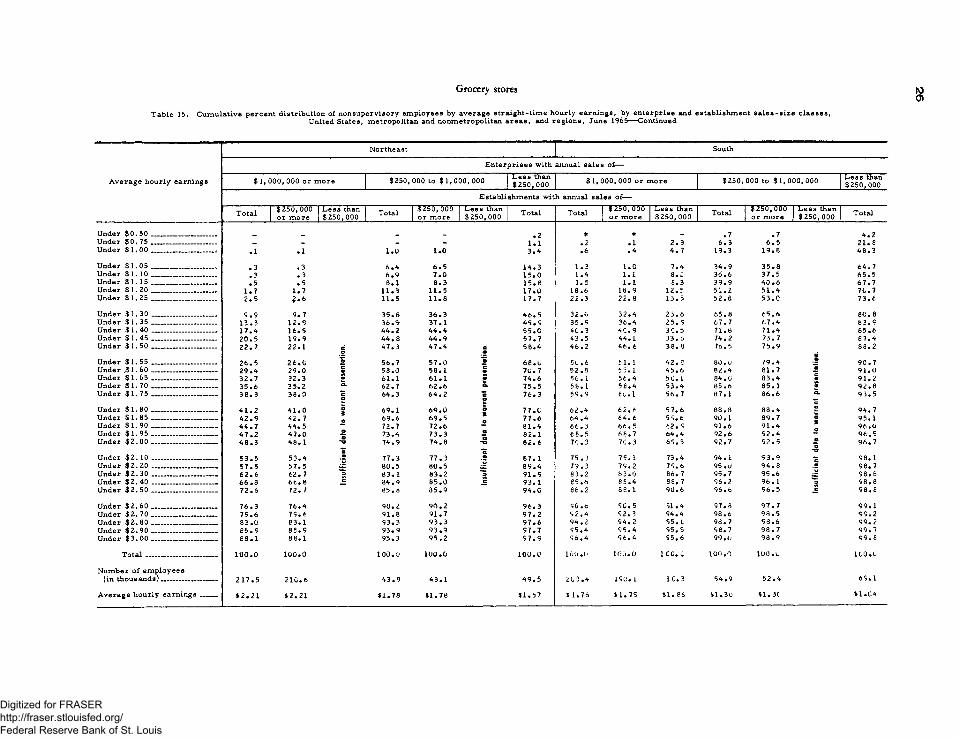
Grocery stores
Table 15. Cumulative percent distribution of nonsupervisory employees by average straight-time hourly earnings, by enterprise and establishment sales-size classes,United States, metropolitan and nonmetropolitan areas, and regions, June 1965— Continued
Average hourly earnings
Northeast South
Enterprises with annual sales of—
$ 1, 000, 000 or more $250, 000 to $ 1, 000,000 Less than $ 2 5 0 ,0 00 $ 1, 000, 000 or more $250, 000 to $ 1, 000, 000 Less than
$250 ,000Establishments with annual sales of—
Total $2 50 ,0 00 or more
Le ss than $250 ,0 00 Total $250, 000
or moreLe ss than $250 ,0 00 Total Total $ 2 50 ,0 00
Digitized for FRASER http://fraser.stlouisfed.org/ Federal Reserve Bank of St. Louis
Grocery stores
Table 15. Cumulative percent distribution of nonsupervisory employees by average straight-time hourly earnings, by enterprise and establishment sales-size classes,United States, metropolitan and nonmetropolitan areas, and regions, June 1965—-Continued
Average hourly earnings
North Central West
Enterprises with annual sales of—
$ 1, 000, 000 or more $250, 000 to $ 1, 000,000 Less than $2 50 ,0 00 $ 1, 000, 000 or more $250, 000 to $ 1, 000,000 Less than
$250, 000Establishments with annual sales of—
Total $250 ,0 00 or more
Le ss than $250 ,0 00 Total $250 ,0 00
or moreLe ss than $2 50 ,0 00 Total Total $ 2 50 ,0 00
Table 17. Percent distribution of nonsupervisory employees by weekly hours of work, by metropolitan and nonmetropolitan areas,United States and regions, June 1965
Digitized for FRASER http://fraser.stlouisfed.org/ Federal Reserve Bank of St. Louis
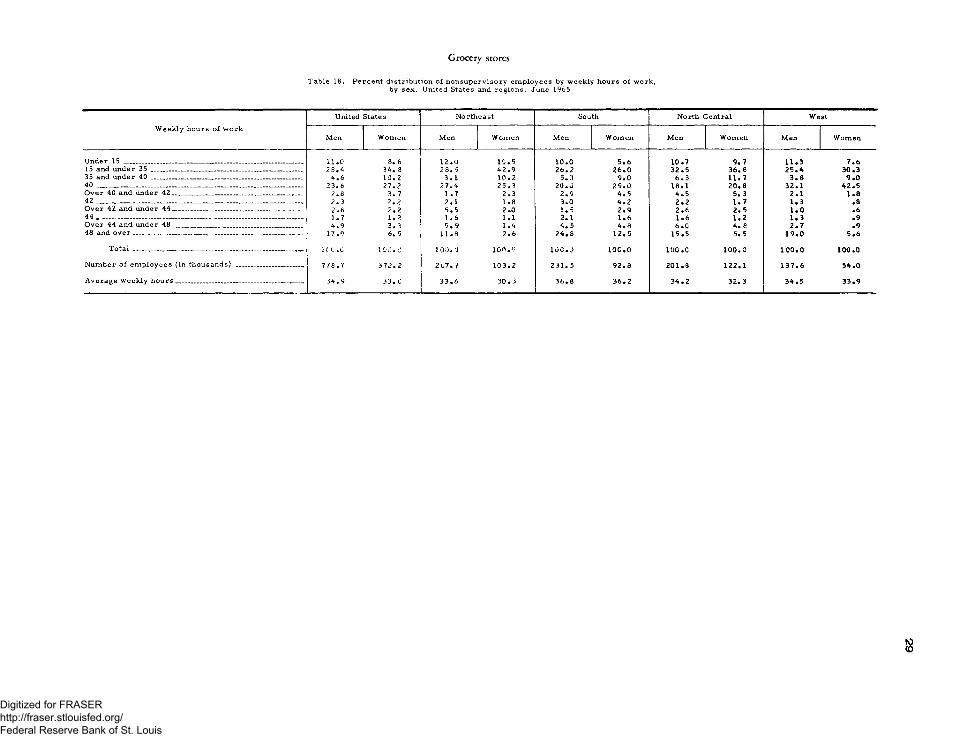
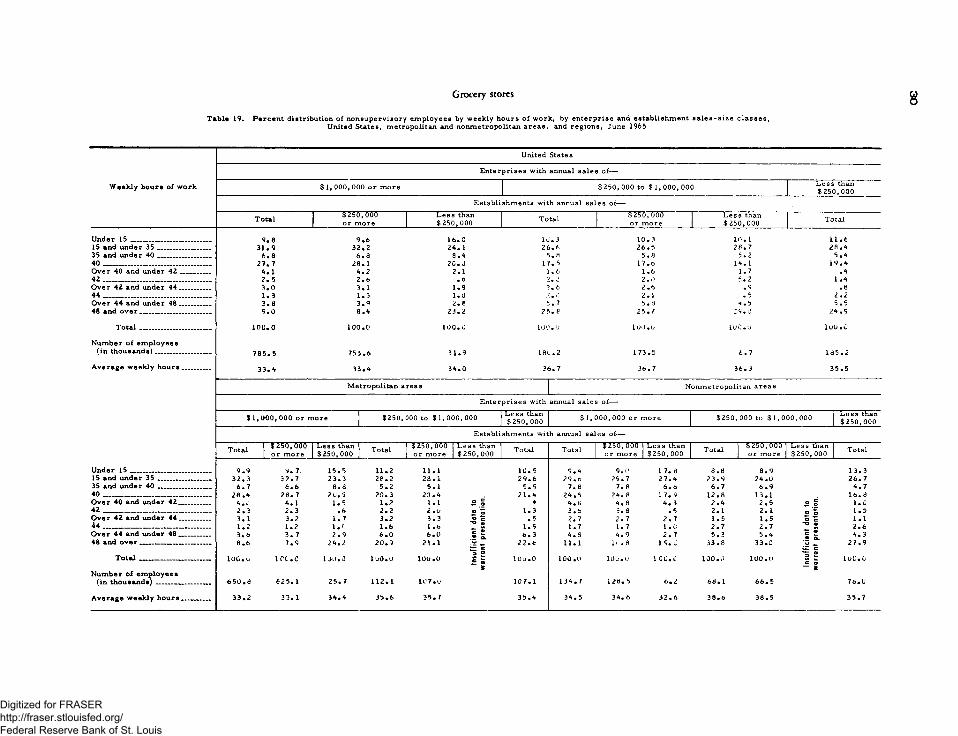
Grocery stores8
Table 19. Percent distribution of nonsupervisory employees by weekly hours of work, by enterprise and establishment sales-size classes,United States, metropolitan and nonmetropolitan areas, and regions, June 1965
United States
Weekly hours of work
Enterprises with annual sales of—
$ 1, 000,000 or more $2 50 ,0 00 to $ 1 ,0 0 0 ,0 0 0 Le ss than $2 50 ,0 00
A v e ra g e w e e k ly h o u r s _________ 3 3 . 2 33 . 1 3 4 .4 3 5 .6 3 5 .7 3 5 .4 3 4 .5 3 4 .6 3 2 . 6 3 8 .6 3 8 .5 3 5 . 7
Digitized for FRASER http://fraser.stlouisfed.org/ Federal Reserve Bank of St. Louis
Grocery stores
Table 19. Percent distribution of nonsupervisory employees by weekly hours of work, by enterprise and establishment sales-size classes,United States, metropolitan and nonmetropolitan areas, and regions, June 1965----Continued
Weekly hours of work
Under 1 5 ________________________1 5 and under 3 5 ________________35 and under 4 0 ________________4 0 .............................................. ........ ...Over 40 and under 4 2 _________4 2 _______________________________ _Over 42 and under 4 4 _________4 4 ________________________________Over 44 and under 4 8 _________48 and ov e r_____________________
T o t a l________ __________ _
Number ol employees (in thousands)_________________
Average weekly hours________
Under 15 ________________________15 and under 3 5 ________________35 and under 4 0 _____________40 ...................... .........................Over 40 and under 4 2 ________4 2 ............. ...................................6 ver 42 and under 4 4 ________4 4 ___________________________Over 44 and under 4 8 ________48 and o v e r_____________________
T o t a l_____________________
Number of employees (in thousands)_________________
Average weekly hours________
$ 1, 000, 000 or more
Northeast South
Enterprises with annual sales of—
$250 ,0 00 to $ 1 ,0 0 0 ,0 0 0 Le ss than $ 250,000 $ 1, 000, 000 or more $250, 000 to $ 1,000, 000 Less than
Digitized for FRASER http://fraser.stlouisfed.org/ Federal Reserve Bank of St. Louis
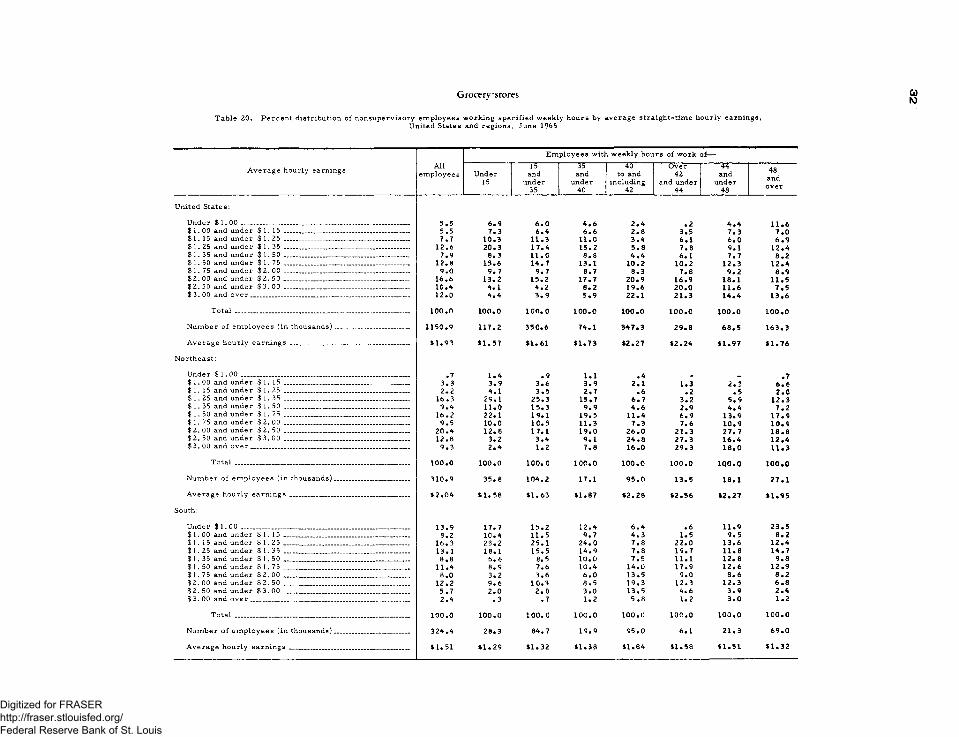
Grocery stores
Table 20. Percent distribution of nonsupervisory employees working specified weekly hours by average straight-time hourly earnings,United States and regions, June 1965
Digitized for FRASER http://fraser.stlouisfed.org/ Federal Reserve Bank of St. Louis
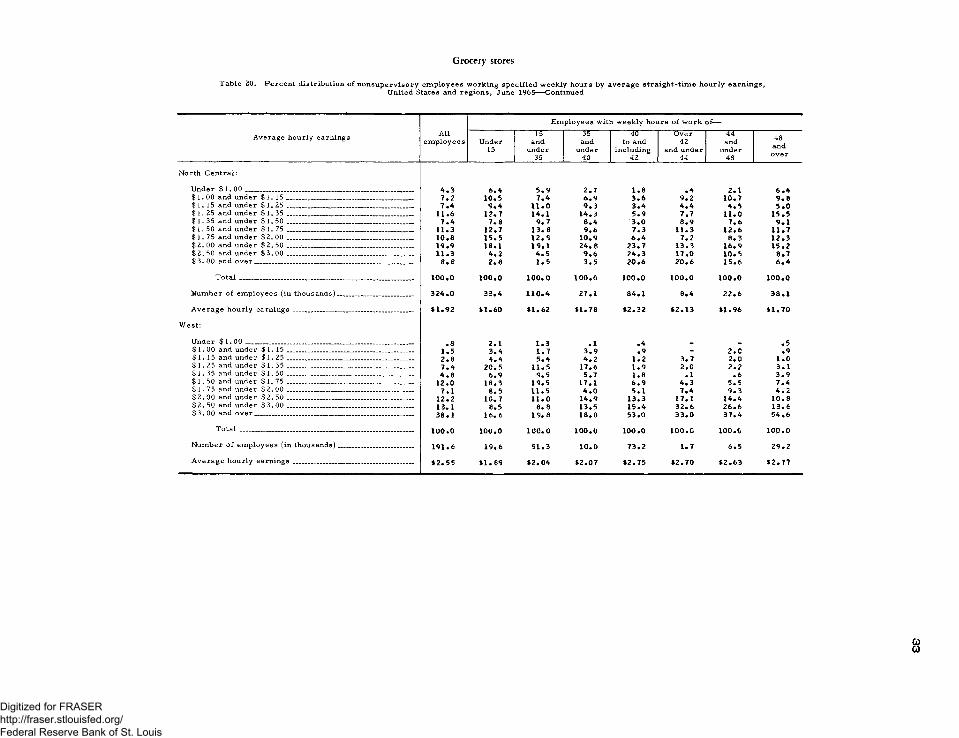
Grocery stores
Table 20. Percent distribution of nonsupervisory employees working specified weekly hours by average straight-time hourly earnings,United States and regions, June 1965— Continued
E m p loy ees w ith w eek ly houtfs o f w o rk o f—
A v era g e h ou rly earn ings A lle m p lo y e e s Under
N u m ber o f e m p lov ees fin thousands) 1 9 1 . 6 1 9 . 6 5 1 . 3 1 0 . 0 7 3 . 2 1 . 7 6 . 5 2 9 . 2
A v e ra g e h ou r ly earn ings $2 . 5 5 $1 . 89 $2 . 0 4 $2 . 0 7 $2 . 7 5 $2 . 7 0 $2 . 6 3 $2 . 7 7
COCO
Digitized for FRASER http://fraser.stlouisfed.org/ Federal Reserve Bank of St. Louis
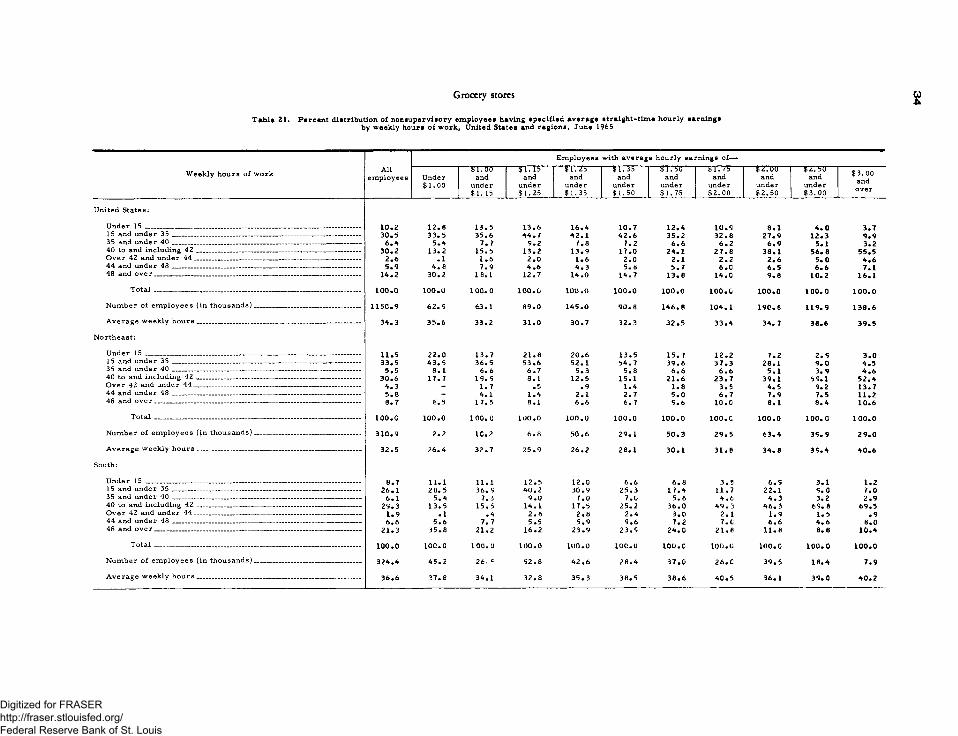
Grocery stores8
Table 21. Percent distribution of nonsupervisory employees having specified average straight-time hourly earningsby weekly hours of work, United States and regions, June 1965
Digitized for FRASER http://fraser.stlouisfed.org/ Federal Reserve Bank of St. Louis
Grocery stores
Percent distribution of nonsupervisory employees having specified average straight-time hourly earnings by weekly hours of work, United States and regions, June 1965— Continued
Digitized for FRASER http://fraser.stlouisfed.org/ Federal Reserve Bank of St. Louis
Appendix. Questionnaire
B L S 2 7 8 6(Rev. ’65)
U.S. D E P A R T M E N T O F L A B O RB U R E A U O F L A B O R S T A T I S T I C S
W A S H I N G T O N , D . C . 20212
Your report will beHeld in confidence R E T A I L T R A D E— . ....- ... Individual Hours and Earnings
1. COMPANY IDENTIFICATION:
Budget Bureau No. 44—6511. Approval expires 12—31—65.
BLS USE O N L Y
State Area Ent.sales SIC Wgt.
The data, except for Item 2 which relates to the entire company, should cover all establishments (retail stores, warehouses, central offices, etc.) in the county or area designated to the left.
( C h e ck appropriate box.)
2. ANNUAL GROSS SALES FOR THE COMPANY OR ENTERPRISE: Under $2 50 ,0 00 to $1,000,000$250 ,000 $ 1 ,000 ,00 0 or more
Check the block which indicates the annual gross volume of sales (exclusive of excise taxes at the retail level) from all related activities of the enterprise. Include receipts from stores covered by this report as well as all other related activities. Use the last calendar or fisca l year.
3. ESTABLISHMENT INFORMATION:
Please enter the information requested in the columns below for each separate establishment (retail store, warehouse, or central office) covered by this report. Each retail store in a separate location is considered a separate establishm ent for the purpose of this survey. However, if the records for main store and suburban branch are kept on a combined basis , they may be considered as one establishm ent.
(a) Location: Identify each establishment by its street address and city.(b) Type of Retail Activity: Enter for each establishment the major retail activity such as department store, drug store,
gas station, etc.(c) Employment: Include all full-tim e, part-time, seasonal, and casual employees who received pay for any part o f the
payroll period including June 12, 1965. Exclude em ployees, such as those in leased departments and demonstrators, who received all or a substantial part of their pay from another employer.Total— Enter total number of em ployees including officers and other principal executives, such as buyers, department heads, and managers whose work is above the working supervisory level.Nonsupervisory— Enter total number of employees below the supervisory level, such as salespersons, shipping and receiving clerks, laborers, warehousemen, caretakers, office clerks, driver-salesm en, installation and repairmen, elevator operators, porters, janitors, watchmen, and other em ployees whose services are c losely associated with those listed above. Do not include officers and other principal executives, such as buyers, department heads, and managers whose work is above the working supervisory level.
(d) Annual Gross Sales for the Establishment: Check the column which indicates the annual gross volume of sales (exclusive of excise taxes at the retail level).
(a)
Location( s t r e e t a d d r e s s
a n d c i t y )
(b)
Type of retail
activity
(c)Employment
fo r p a y r o l l p e r i o d i n c l u d i n g
June 12, 1 % 5
Gross establishment sa le s
( w e r e l a s t year’s sales
$ 2 5 0 ,0 0 0 o r more?)
Total Nonsupervisory
Y e s N o
4. PAYROLL PERIOD:
Employment and earnings data reported should correspond to your payroll period (for example, w eekly, biw eekly, or monthly) including June 12, 1965. Indicate the dates for the payroll period used. If the length of the payroll period varies among em ployees, enter the dates affecting the greatest number.
From ____________________________________ _ 19_____t o ----------------------------------------------------------- , 1 9 ----------
37
Digitized for FRASER http://fraser.stlouisfed.org/ Federal Reserve Bank of St. Louis
3 8
5. EARNINGS AND HOURS OF WORK OF NONSUPERVISORY EMPLOYEES:This study is designed to provide information on hourly earnings and weekly hours of work for both male and female nonsupervisory employees and working supervisors for a payroll period including June 12, 1965. The number of employees in each establishment for which earnings and hours data are reported should correspond with the number of nonsupervisory employees shown in item 3(c) on page 1. The information requested should be reported separately for each establishment and the establishment identified. Earnings data for food counter, cafeteria, or restaurant workers in Department, Drug, or Variety Stores should be entered only on the blue supplement provided. Data for all other employees should be reported in Item 5 of this form.
Report earnings and hours separately for each employee unless these data are identical for two or more employees. Do not report aggregate earnings and hours for several employees. For convenience of reporting for employees paid on other than an hourly basis, columns 5 through 8 are provided. Data will not, however, be published separately by various methods of pay. Instructions and examples for reporting the necessary data in each column are listed below.
INSTRUCTIONS(Please read, carefully to avoid correspondence)
Complete columns 1, 2, and 3 for all nonsupervisory employees covered by this report (see examples 1—5).
Column (1 )— Indicate whether the employee is male (M) or female (F ).
Column (2)— Use a separate line for each employee and enter " 1 ,” unless two or more em ployees of the same sex work the same number of hours during the selected week, and receive identical hourly or salary rates (see example I). Data are to be reported individually for each employee whose earnings are based entirely or in part on com m issions or bonuses (see examples 3, 4, and 5).
Column (3 )— Enter the number of hours worked during the week of June 6 to June 12, 1965. Include hours paid for sick leave, holidays, vacations, etc. These hours should relate to a 1-week period regardless of the length of the payroll period.
Use column 4 to report earnings of employees paid on an hourly basis (see example 1).
Column (4)— Enter the base (straight-time) hourly rate. Premium pay for overtime work should not be reported. This column may also be used to report earnings of em ployees paid on other than an hourly b asis if average straight-time hourly earnings are available. For em ployees paid a commission or bonus in addition to an hourly rate, a lso complete columns 7 and 8 (see example 4).
Use columns 5 and 6 to report earnings of employees paid on a weekly, biweekly, monthly, or semimonthly basis (see example 2).
Column (5 )— Enter for each employee the straight-time earnings for the salary period (w eekly, biweekly, monthly, or semimonthly) including June 12, 1965. Include straight-time pay for overtime, but exclude overtime premium. Do not include "d r a w s ” against commission as salary.
Column (6)— Enter the number of hours worked during the salary period (weekly, biweekly, monthly, or sem imonthly). Include hours paid for sick leave, holidays, vacations, etc. For em ployees paid a commission or bonus, also complete columns 7 and 8 (see example 5).
Use columns 7 and 8 to report earnings of nonsupervisory employees based entirely or in part on commissions and bonuses (see example 3).
Column (7)— Enter for each employee the total commission and/or bonus earnings, including "P M ’ s , ” "S tim s,” or any special bonuses based on sales paid quarterly or oftener by the store. Th ese earnings are to be reported for the commission or bonus period including June 12, 1965. If the com m issions earned during that pay period are not representative of normal commission earnings, a longer period may be used. If store em ployees receive both commission and bonus payments for an identical period of time, report the combined figure (see example 4). If bonus payments cover a period longer than the commission period, add only the prorated amount of the bonus to the commission earnings that correspond to the commission period (see example 5).
Column (8)— Enter the number of hours worked during the commission or bonus period. (The hours should refer to the total hours worked during the period (weekly, biweekly, monthly, or semimonthly) and not necessarily only to those hours during which commissions or bonuses were earned.) For em ployees paid an hourly rate or salary in addition to commissions or bonuses, it is also necessary to complete column 4, or columns 5 and 6 (see examples 4 and 5).
EXAMPLES(See illustrations on next page)
J. Two women each worked 36% hours during the selected week, and each was paid a straight-time hourly rate of $1.05-
2- One man worked 40 hours during the selected week, and received a salary o f $125, exclusive o f premium pay for overtime, for 88 hours worked during the salary period (A month).
3• One man worked 32lA hours during the selected week and was paid on a straight commission basis, receiving $215.70 for 168 hours.
4- One woman worked 40 hours during the selected week and was paid an hourly rate of $1.25; she also received $35 in commissions and $7.50 in aPM’s* for 173.6 hours worked during the commission period (1 month).
5. One man worked 3714 hours during the selected week, and was paid a weekly salary of $75; he also earned commissions o f $102 during a 1-month period (162 hours) and $150 in bonuses during a 3-month period. Only V3 of the bonus, or $50 is reported so that the bonus period corresponds to the commission period.
Digitized for FRASER http://fraser.stlouisfed.org/ Federal Reserve Bank of St. Louis
3 9
5. EARNINGS AND HOURS OF WORK OFNONSUPERVISORY EMPLOYEES — Continued
B L S U S E O N L Y
Sch. C s t .s a le s
Citys iz e Emp. Class
emp.
Complete these columns foreach nonsupervisory employee.
Use this column for nonsupervisory employees paid on an hourly basis.
Use these columns for nonsupervisory employees paid other than on an hourly basis.
( 1)
Sex(M or
F )
(2)
Num bero f
e m p lo y e e s
(3)H ours w orked
during the w e e k o f June 6 —12, 1965
(4)
Straight-tim e hourly rate
(5)Straight-tim e
sa lary for s a la ry period
in c lu d in g Jun e 12, 1965
(6)
H ours w orked during
s a la ry p eriod
(7 )
T o ta lco m m iss io n s
a n d /o r bonus pay
(8 )
H ours w orked during
co m m iss io n p eriod
I llu s tra t io n s o f ex a m p le s on p a g e 2.
1 . F 2 $ 1 n s $ $
? M 1 4 0 . 0 _ _ 1 2 5 . 0 0 8 3 .0
a M i 3 2 5 2 1 5 . 7 0 165? 0
4 F 1 4 D .0 U S 4 2 5 0 _ 173.61 ______2 2 5 _______ 7 5 . 0 0 _____ 2 2 5 _________, i f s i . o n _____________
DATA FOR EACH ESTABLISHMENT SHOULD BE REPORTED SEPARATELY AND THE ESTABLISHMENT IDENTIFIED.
1
2
3
4
5
6
7
8
91 0
11
1 2
1 3
1 4
1 5
1 6
1 7
1 8
1 9
2 0
21
2 2
2 3
2 4
2 5
2 6
2 7
2 8
2 9
3 0
31
3 2
Do you want a copy of the Bureau’ s report on this su rvey?---------Yes [ | No \
Name and title of person furnishing data(Please type or print)
Digitized for FRASER http://fraser.stlouisfed.org/ Federal Reserve Bank of St. Louis
Digitized for FRASER http://fraser.stlouisfed.org/ Federal Reserve Bank of St. Louis
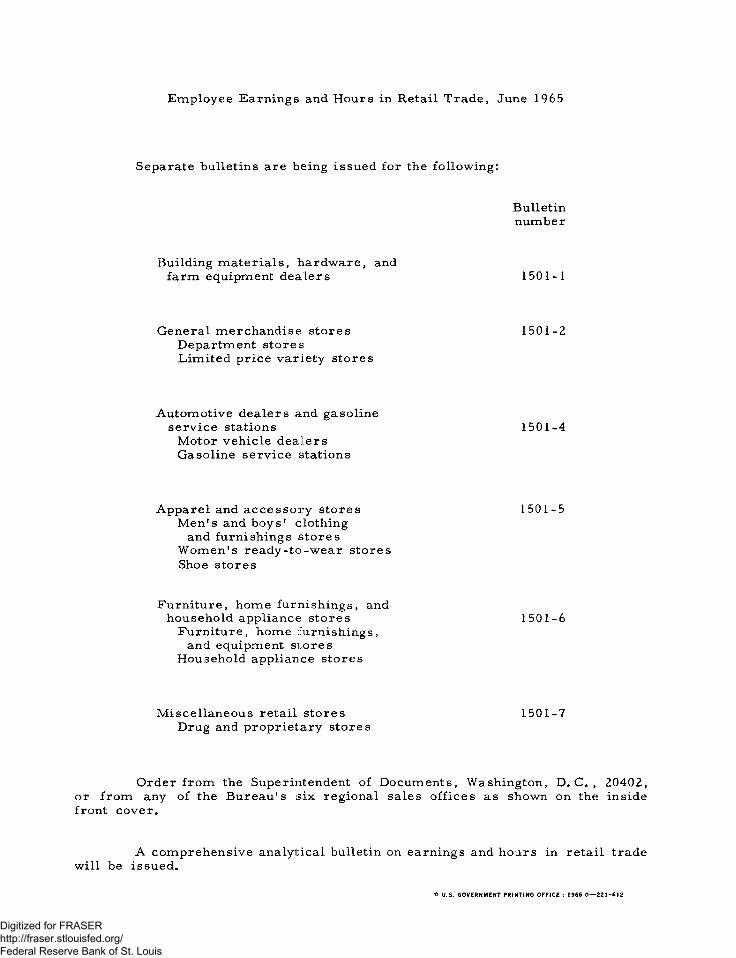
E m p lo y e e E arn ings and H ours in R eta il T r a d e , June 1965
Separate bullet ins a re being is s u e d f o r the fo llow in g :
B ulletinn u m ber
Building m a t e r ia l s , h a rd w a re , and fa r m equipm ent d e a le r s 1501-1
G en era l m e r ch a n d is e s to re s D epartm ent s to res L im ited p r i c e v a r ie ty s to re s
1501-2
A u tom otive d e a le r s and ga so lin e s e r v i c e stations
M otor v e h ic le d e a le r s G aso line s e r v i c e stations
1501-4
A p p a re l and a c c e s s o r y s to re s M e n 's and b o y s ' c loth ing
and furn ish in gs s to re s W o m e n 's r e a d y - t o -w e a r s to re s Shoe s to r e s
1501-5
F u rn itu re , h om e furn ish in g s , and hou seh o ld app liance s to re s
F u rn itu re , h om e fu rn ish in g s , and equipm ent s to re s
H ousehold app liance s to re s
1501-6
M is ce l la n e o u s re ta i l s to re s Drug and p ro p r ie ta r y s to re s
1501-7
O rd e r f r o m the Superintendent o f D ocu m en ts , W ashington , D. C. , 20402,o r f r o m any o f the B u re a u 's s ix reg ion a l sa les o f f i c e s as shown on the ins ide fron t c o v e r .
A co m p r e h e n s iv e ana ly tica l bulletin on earn in gs and h ou rs in re ta i l trade w ill be issu ed .
* U.S. GOVERNMENT PRINTING OFFICE : 1966 0 -2 2 1 -6 1 2
Digitized for FRASER http://fraser.stlouisfed.org/ Federal Reserve Bank of St. Louis