+ All Categories
Home > Documents > bls_1973_1977.pdf

bls_1973_1977.pdf

Date post: 13-Dec-2015
Category:
Upload: fedfraser
View: 215 times
Download: 2 times
Share this document with a friend
Popular Tags:
59
Industry Wage Survey: Paints and Varnishes, November 1976 U.S. Department of Labor Bureau of Labor Statistics 1977 Bulletin 1973 Digitized for FRASER http://fraser.stlouisfed.org/ Federal Reserve Bank of St. Louis
Transcript

Industry Wage Survey: Paints and Varnishes, November 1976U.S. Department of Labor Bureau of Labor Statistics 1977Bulletin 1973

Digitized for FRASER http://fraser.stlouisfed.org/ Federal Reserve Bank of St. Louis

Industry Wage Survey: Paints and Varnishes, November 1976U.S. Department of Labor Ray Marshall, SecretaryBureau of Labor Statistics Julius Shiskin, Commissioner 1977Bulletin 1973

Digitized for FRASER http://fraser.stlouisfed.org/ Federal Reserve Bank of St. Louis

For sale by the Superintendent of Documents, U S. Government Printing Office Washington, D .C . 20402

Stock No. 029-001-02116-0

Digitized for FRASER http://fraser.stlouisfed.org/ Federal Reserve Bank of St. Louis

Preface

This bulletin summarizes the results of a Bureau of Labor Statistics survey of wages and supplementary benefits in the paints and varnishes manufacturing industries in November 1976. A similar study was conducted in November 1970.

Separate locality releases were issued earlier for Atlanta, Ga.; Baltimore, Md.; Chicago, 111.; Cleveland, Ohio; Dallas-Fort Worth, Tex.; Detroit, Mich.; Los Angeles- Long Beach, Calif.; Louisville, Ky.-Ind.; New Brunswick-Perth Amboy-Sayerville, N.J.; New York, N.Y.-N.J.; Newark, N.J.; Philadelphia, Pa.-N.J.; St. Louis, Mo.-Ill.; and San Francisco-Oakland, Calif. Copies of these releases are available from the Bureau of Labor Statistics, Washington, D.C. 20212, or any of its regional offices.

This study was conducted in the Bureau’s Office of Wages and Industrial Relations. Mark Sieling of the Division of Occupational Wage Structures prepared the analysis in this bulletin. Field work for the survey was directed by the Assistant Regional Com­missioners for Operations.

Other reports available from the Bureau’s program of industry wage studies as well as the addresses of the Bureau’s regional offices are listed at the end of this bulletin.

Material in this publication is in the public domain and may be reproduced without permission of the Federal Government. Please credit the Bureau of Labor Statistics and cite the name and number of the publication.

Digitized for FRASER http://fraser.stlouisfed.org/ Federal Reserve Bank of St. Louis

Digitized for FRASER http://fraser.stlouisfed.org/ Federal Reserve Bank of St. Louis

Contents

Page

Summary ................................................................................................................................................................................... 1Industry characteristics............................................................................................................................................................. 1

Products and processes ...................................................................................................................................................... 1Employment trends ............................................................................................................................................................. 1Location................................................................................................................................................................................. 2Establishment size ............................................................................................................................................................... 2Union contract coverage .................................................................................................................................................... 2Method of wage payment .................................................................................................................................................. 2

Average hourly earnings ........................................................................................................................................................... 2Occupational earnings ............................................................................................................................................................. 3Establishment practices and supplementary wage provisions................................................................................................ 4

Scheduled weekly hours and shift practices ...................................................................................................................... 4Paid holidays ........................................................................................................................................................................ 4Paid vacations........................................................................................................................................................................ 4Health, insurance, and retirement plans ............................................................................................................................ 4Other selected benefits............................................................................................................... 4

Text table:1. Pay relatives for three occupations in paint manufacturing, November 1976 ......................................................... 3

Reference tables:Average hourly earnings:

1. By selected characteristics ....................................................................................................................................... 5

Earnings distribution:2. All establishments...................................................................................................................................................... 6

Occupational averages:3. All establishments...................................................................................................................................................... 74. By size of establishment ............................................................................................................................................ 95. By labor-management contract coverage and size of establishment...................................................................... 11

Occupational earnings:6. Atlanta, Ga . ............................................................................................................................................................... 137. Baltimore, Md............................................................................................................................................................... 148. Chicago, 111.................................................................................................................................................................... 159. Cleveland, O hio................................................................................................................................ 16

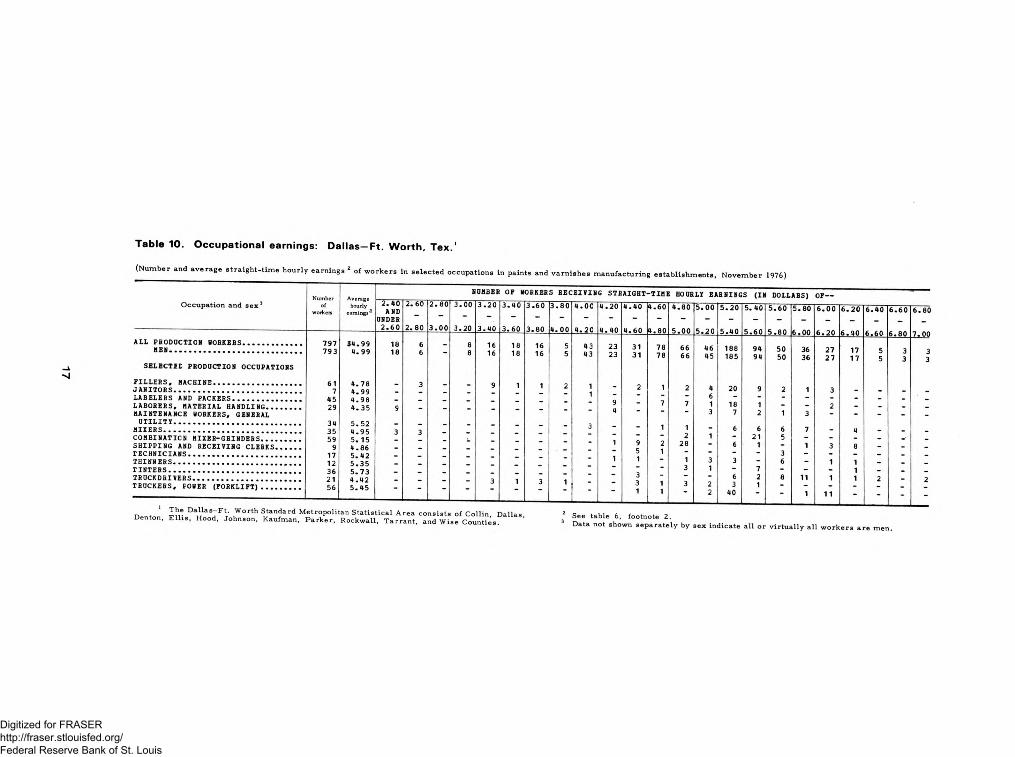
10. Dallas-Fort Worth, T e x .............................................................................................................................................. 1711. Detroit, Mich............................................................................................................................................................... 1812. Los Angeles-Long Beach, Calif................................................................................................................................... 1913. Louisville, Ky.-Ind...................................................................................................................................................... 2014. New Brunswick-Perth Amboy-Sayreville, N.J........................................................................................................... 2115. New York, N.Y............................................................................................................................................................ 2216. Newark, N.J................................................................................................................................................................. 2317. Philadelphia, Pa.-NJ.................................................................................................................................................... 2418. St. Louis, Mo .-111......................................................................................................................................................... 2519. San Francisco-Oakland, Calif..................................................................................................................................... 26

v

Digitized for FRASER http://fraser.stlouisfed.org/ Federal Reserve Bank of St. Louis

Contents—Continued

Establishment practices and supplementary wage provisions:20. Method of wage payment .......................................................................................................................................... 2721. Scheduled weekly hours ............................................................................................................................................ 2822. Shift differential provisions ...................................................................................................................................... 2923. Shift differential practices ........................................................................................................................................ 3024. Paid holidays .............................................................................................................................................................. 3125. Paid vacations.............................................................................................................................................................. 3226. Health, insurance, and retirement plans.................................................................................................................... 3627. Other selected benefits .............................................................................................................................................. 38

Appendixes:A. Regression analysis .......................................................................................................................................................... 39B. Occupational pay m atrix................................................................................................................................................. 42C. Scope and method of survey .......................................................................................................................................... 44D. Occupational descriptions ............................................................................................................................................... 48

VI

Digitized for FRASER http://fraser.stlouisfed.org/ Federal Reserve Bank of St. Louis

Paints and Varnishes, November 1976

Summary

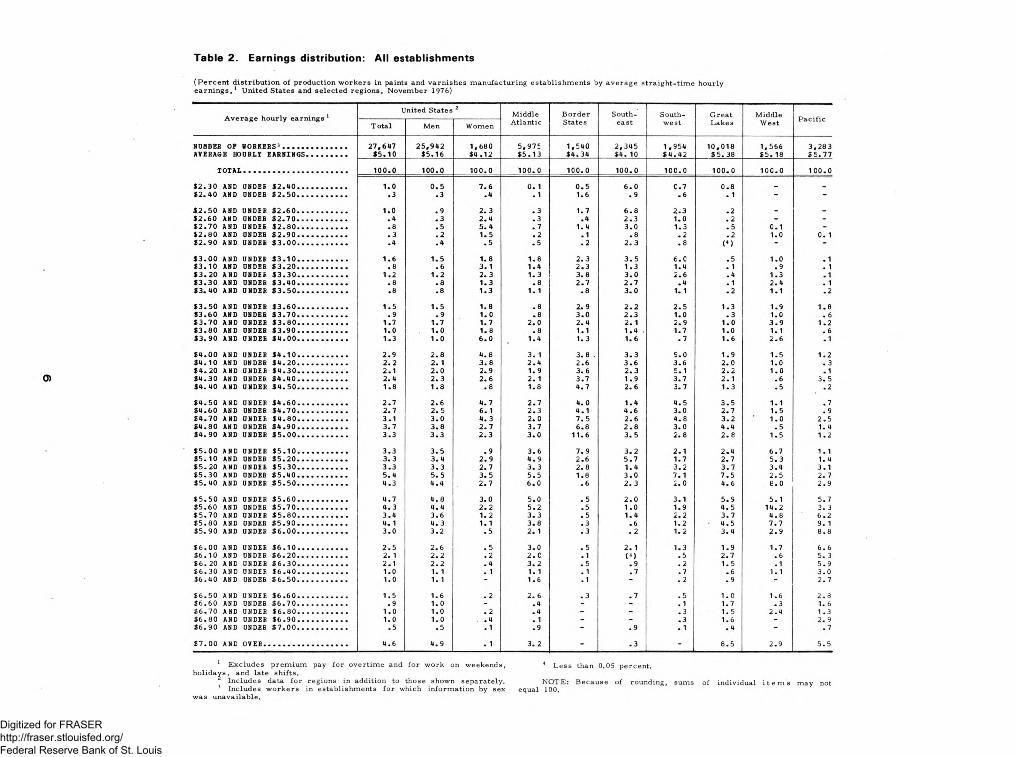
Straight-time earnings of production and related workers in paints and varnishes manufacturing plants averaged $5.10 an hour in November 1976.1 Earnings of slightly over 90 percent of the nearly 28,000 production workers in the study—those in plants with at least 20 employees— were within a range of $3 to $7 an hour, with workers in the middle 50 percent of the array earning from $4.38 to $5.81 an hour.

Regionally, averages ranged from $4.10 in the South­east to $5.77 in the Pacific region.2 Workers in the Great Lakes and Middle Atlantic regions—about three- fifths of the industry’s work force—averaged $5.38 and $5.13 an hour, respectively.

Among occupations studied separately, average hourly earnings ranged from $4.59 for labelers and packers to $5.72 for general utility maintenance work­ers.3 Combination mixers-grinders, the largest occupa­tional classification studied, averaged $5.13. Occupa­tional earnings varied with size of establishment, labor- management contract coverage, and location in or outside metropolitan area, among other characteristics.

Paid holidays, usually 9 to 11 annually, and paid vacations, after qualifying periods of service were provided to nearly all production and office workers in the survey. Vacation provisions were somewhat more liberal at shorter lengths of service for office than for production workers—a common finding of most BLS wage surveys.

Life, hospitalization, surgical, and basic medical insurance plans each covered all or nearly all pro­duction and office workers, and pension plans about nine-tenths of each group.

Industry characteristics

Products and processes. Nationally, establishments whose principal products were paints employed over nine-tenths of all production workers. Plants chiefly producing other surface coatings such as varnishes, lacquer, and enamels; or allied products such as putties, caulking compounds, wood fillers and sealers, and paint and varnish removers, each accounted for about 4 percent o f the work force.

Paint is a mixture of pigments suspended in a liquid. The liquid, either oil or water, is called a vehicle and binds together the pigment particles which give the paint its color. Varnish, which contains no pigment, is used in making paints and finishes. Enamels are paints with varnish or synthetic resin vehicles that dry with hard glossy surfaces. Lacquers are quick-drying fin­ishes used mainly for mass-produced items.

Paint manufacturing is a batch process rather than a continuous production process (used in many other chemical industries). Pigments are mixed, blended with part of the vehicle to form a paste, and ground to break down the agglomerates of pigment. Then the product is thinned as specified by formula. After this mixture is prepared and approved by the laboratory, it is ready for packaging.

Employment trends. The industry’s employment level tends to be highest in the summer and lowest in the winter partly due to fluctuations in the demand for and use of paints. Between the last two BLS wage surveys of this industry— 1970 and 1976—production employ­ment in the peak season of each year generally exceed­ed the yearly low by about 7 to 15 percent.4

Based on the Bureau’s monthly establishments sur­vey, the paint industry’s production work force declin­ed by 8 percent between the November 1970 and November 1976 occupational wage surveys.5 Employ­ment hit its nadir in 1975; since then, monthly levels have been 1 to 6 percent higher than those a year

* See appendix C for scope and method of survey.

2 For definitions o f the regions, see appendix C, table C-l, footnote1 .

1 See appendix D for occupational descriptions.4 Employment data are based on the Bureau’s monthly series

published in Employment and Earnings. The estimate of the number of production workers within the scope of the study is intended only as a general guide to the size and composition of the labor force in the survey. It differs from that published in the monthly series (35,200) primarily by the exclusion o f establishments employing fewer than 20 workers. The advance planning necessary to make the survey required the use of lists of establishments assembled considerably in advance of data collection. Thus, establishments new to the industry are omitted, as are establishments originally classified improperly and found to be in other industries at the time of the survey.

5 See Industry Wage Survey: Paints and Varnishes, November 1970, Bulletin 1739 (Bureau of Labor Statistics, 1972).

1

Digitized for FRASER http://fraser.stlouisfed.org/ Federal Reserve Bank of St. Louis

earlier. Except for technicians and general utility maintenance workers, employment in most occupations studied has declined.

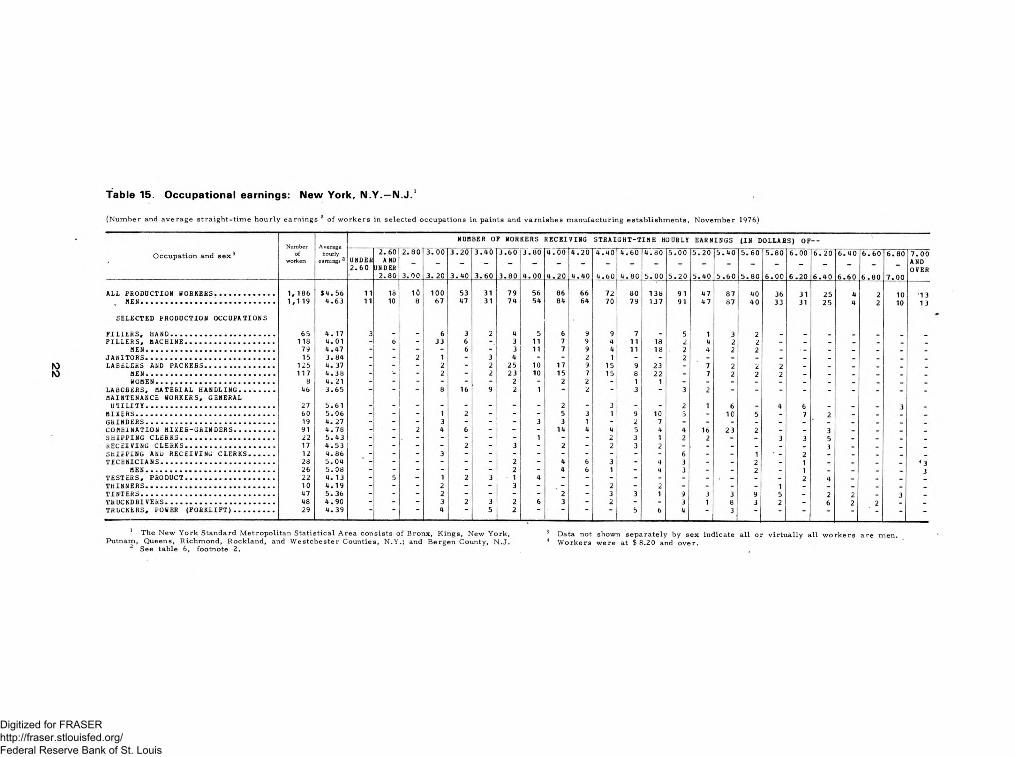
Location. In November 1976, the Great Lakes region accounted for 36 percent of all paints and varnishes workers and the Middle Atlantic, for 22 percent. The Border States, Southeast, Southwest, Middle West, and Pacific regions each accounted for between 5 and 12 percent. Establishments located within metropolitan areas accounted for slightly over 96 percent of the total production work force.6 About one-half of the workers were employed in the 14 metropolitan areas studied separately, with the largest numbers in Chicago (3,049), Los Angeles-Long Beach (1,825), Detroit (1,283), Cleveland (1,253), New York (1,186), and Philadelphia (1,194).

Establishment size. Only 125 of the 645 establishments covered by the survey employed 100 workers or more, but these plants accounted for about 54 percent of the total production work force. Regionally, the propor­tion of workers in the larger size establishments— 100 workers or more—ranged from about two-fifths in the Southwest to slightly over two-thirds in the Great Lakes.

Union contract coverage. Establishments with labor- management contracts covering a majority of their production work force accounted for slightly over two-thirds of the industry’s work force in 1976. The proporation of workers covered by collective bargain­ing agreements was about nine-tenths in the Middle Atlantic and Pacific regions, about three-fourths in the Middle West, two-fifths in the Southeast and South­west, and about three-tenths in the Border States.

The e x t e n t of u n i o n i z a t i o n v a r i e d s o m e w h a t by s i z e

of establishment. Slightly over three-fourths of the workers in establishments employing 100 workers or more were in plants operating under collective bargain­ing agreements; in establishments of 20 to 99 workers the proportion was about three-fifths.

The Brotherhood of Painters and Allied Trades, the principal union of the industry nationwide, accounted for about three-tenths of all production workers cov­ered under labor-management contracts. The International Brotherhood of Teamsters, Chauffeurs, Warehousemen, and Helpers; the Oil, Chemical and Atomic Workers Inter­national Union (AFL-CIO); and the United Steel Workers of America (AFL-CIO) each accounted for between 10 and 16 percent of all orgainzed workers.

Method of wage payment. All production workers were paid time rates (table 20). Formal rate structure plans providing single rates for specific job categories or formal ranges of rates each applied to slightly more

than two-fifths of the workers. Individual rates with wages determined by worker qualifications applied to about one-tenth of all production workers. Regionally, individual rates were most prevalent in the Southeast and Southwest, where about one-third of the workers were under such plans. Other significant deviations from the national norm were the Border States and the Middle West, where nearly three-fourths of the work­ers were under range-of-rate plans, and in the Middle Atlantic, where three-fifths were under single rate plans.

Average hourly earnings

Straight-time earnings of production and related workers in the paint industry averaged $5.10 an hour in November 1976 (table 1). The Bureau’s monthly Em­ployment and Earnings series shows that between November 1970 and November 1976 earnings of paint workers increased 57 percent compared with 63 per­cent for manufacturing workers as a group.

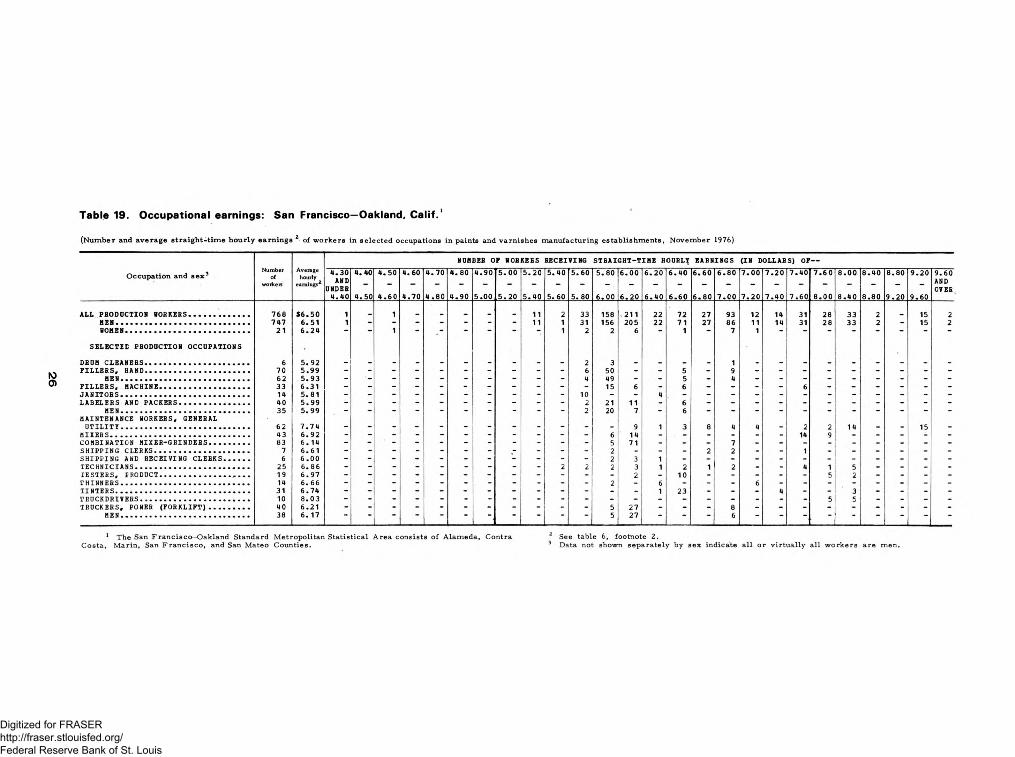
Average wage levels for regions ranged from $5.77 an hour in the Pacific to $4.10 in the Southeast. In the Great Lakes and Middle Atlantic regions, which to­gether employed about three-fifths of the work force, earnings averaged $5.38 and $5.13 respectively. Among the 14 areas for which separate data were developed, hourly earnings averaged the highest in San Francisco- Oakland ($6.50) and the lowest in Baltimore ($4.30).

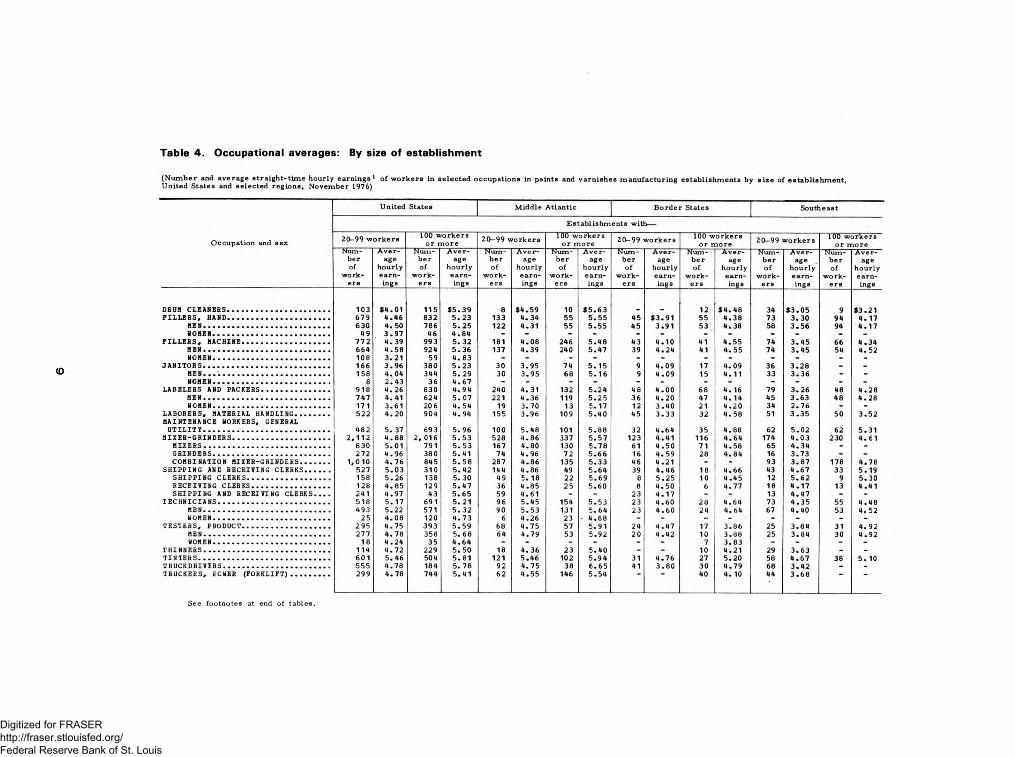
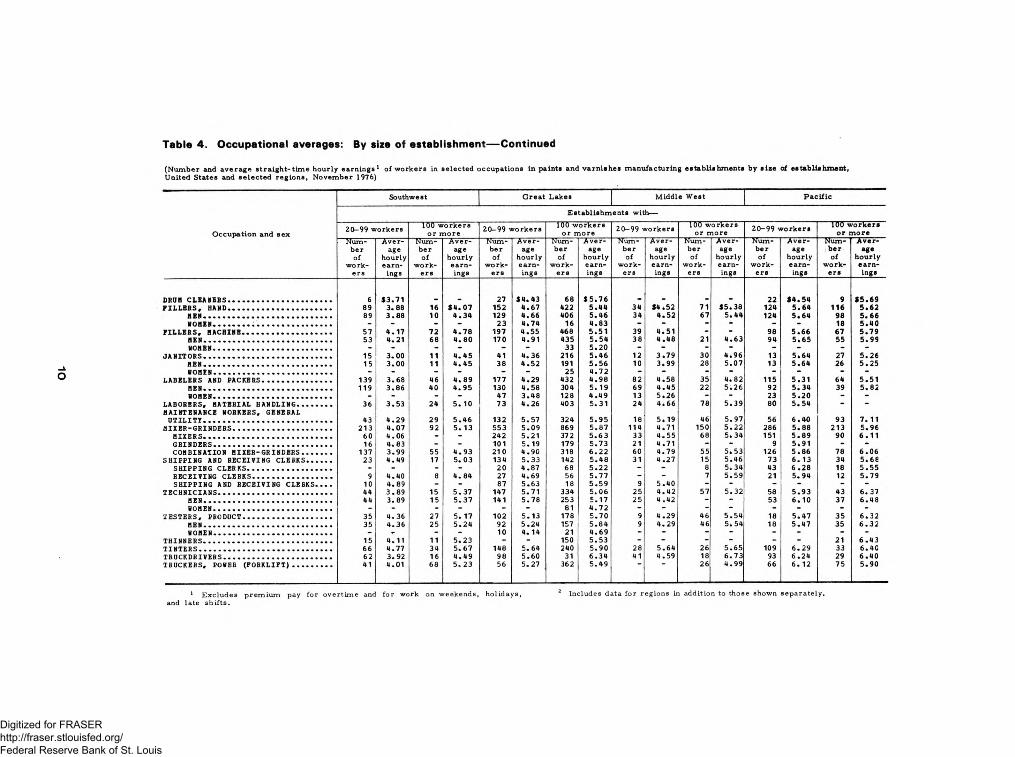
On average, production workers in establishments employment 100 workers or more held a 16-percent hourly wage advantage over those in establishments of 20 to 99 workers ($5.44 to $4.69). Regionally, the wage rate advantages of workers in the largest establishments were: 25 percent in the Middle Atlantic, 22 percent in the Southwest, 16 percent in the Southeast and Middle West, 13 percent in the Great Lakes, 9 percent in the Border States, and less than 1 percent in the Pacific region.

Establishments having labor-management agree­ments covering the majority of their workers paid an average of $5.35 an hour—78 cents, or 17 percent more than establishments without such coverage. The wage rate advantage held by workers in union establishments ranged from 4 percent in the Middle Atlantic region to 18 percent in the Middle West.

The above discussion has illustrated some wage­determining factors such as establishment size and union contract coverage. The survey cross-tabulations do not isolate wage-determining characteristics and their effect on earnings. Appendix A, however, pre­sents a brief technical note on results of a multiple

4 Standard Metropolitan Statistical Areas as defined by the U.S. Office of Management and Budget through February 1974.

2

Digitized for FRASER http://fraser.stlouisfed.org/ Federal Reserve Bank of St. Louis

regression in which the singular effects of some char­acteristics were isolated to a measurable degree. In some cases, there were marked dissimilarities between average earnings differentials produced by cross­tabulations (simple regression) and those produced by multiple regression techniques. Production workers in union establishments, for example, averaged 78 cents an hour more than their nonunion counterparts, but appar­ently less than one-half of this differential (36 cents) can be attributed solely to unionization (appendix tables A -l and A-2).

Individual earnings were widely dispersed, with 90 percent of the workers earning between $3 and $7 an hour in November 1976; the middle 50 percent earned between $4.38 and $5.81 an hour (table 2). The proportion of workers at the upper end of the earnings array varied widely among regions. For example, about 6 percent or less of the workers in the Border States, Southeast, and Southwest earned at least $6 an hour, while corresponding proportions were 11 percent in the Middle West, 19 percent in the Middle Atlantic, 22 percent in the Great Lakes, and 38 percent in the Pacific region.

Occupational earnings

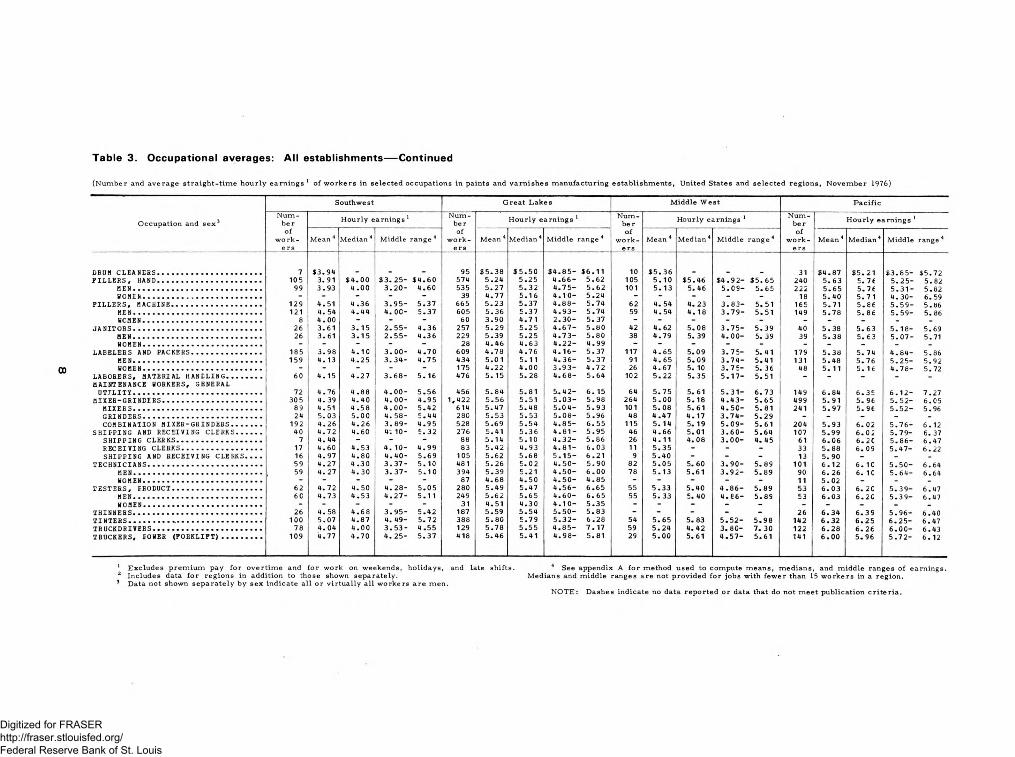
Nineteen occupations were selected to represent various skills and wage levels of production workers in the industry in November 1976 (table 3). These occu­pations made up just over two-thirds of the surveyed production work force. National averages for the jobs shown separately ranged from $5.72 an hour for general utility maintenance workers to $4.59 an hour for labelers and packers. Combination mixers and grinders, the largest occupational classification studied separate­ly, averaged $5.13 an hour.

The occupational wage structure of workers making paints and varnishes in November 1976 was more compressed than that reported in the Bureau of Labor Statistics 1970 survey. The mean difference between all possible pairings of the 14 occupational average hourly earnings studied in both years declined from 10 percent in 1970 to 7 percent in 1976. This 3-percent decline shows that, taken as a whole, occupational average hourly rates have moved closer to each other during this period (appendix B). The mean difference between one occupation and all others declined significantly for 4 of the 14 occupations studied separately—general utility workers, janitors, labelers and packers, and technicians.

Changes in wage ralationships between two separate occupations, such as technician’s wages compared only to mixer’s, were not developed for this survey, although such comparisons are possible.7

Occupational wage relationships within regions did not always follow the national pattern. Mixers, for

example, averaged 7 cents an hour more nationally than technicians ($5.26 compared to $5.19). In the Middle Atlantic, Border States, and Pacific regions, however, technicians held a higher average wage rate than mixers (27, 9, and 15 cents respectively).

The highest occupational averages were usually found in the Pacific region; the lowest in the Southeast. Wage advantages for workers in the Pacific over those in the Southeast ranged from 73 percent for truck drivers to 22 percent for shipping and receiving clerks. Text table 1 shows that interregional wage differences vary by occupation. (See table 3 for a more detailed display of these differences.)

Text table 1. Pay relatives for three occupations in paint manufacturing, November 1976

Region Fillers,hand

Mixers-grinders

Shippingand

receivingclerks

P a c if ic ................................... 149 136 122Great L a k e s ......................... 138 128 111M iddle A t la n t ic .................. 124 118 104M iddle W e s t......................... 135 115 95S o u th w e s t............................ 103 101 97Southeast ............................ 100 100 100

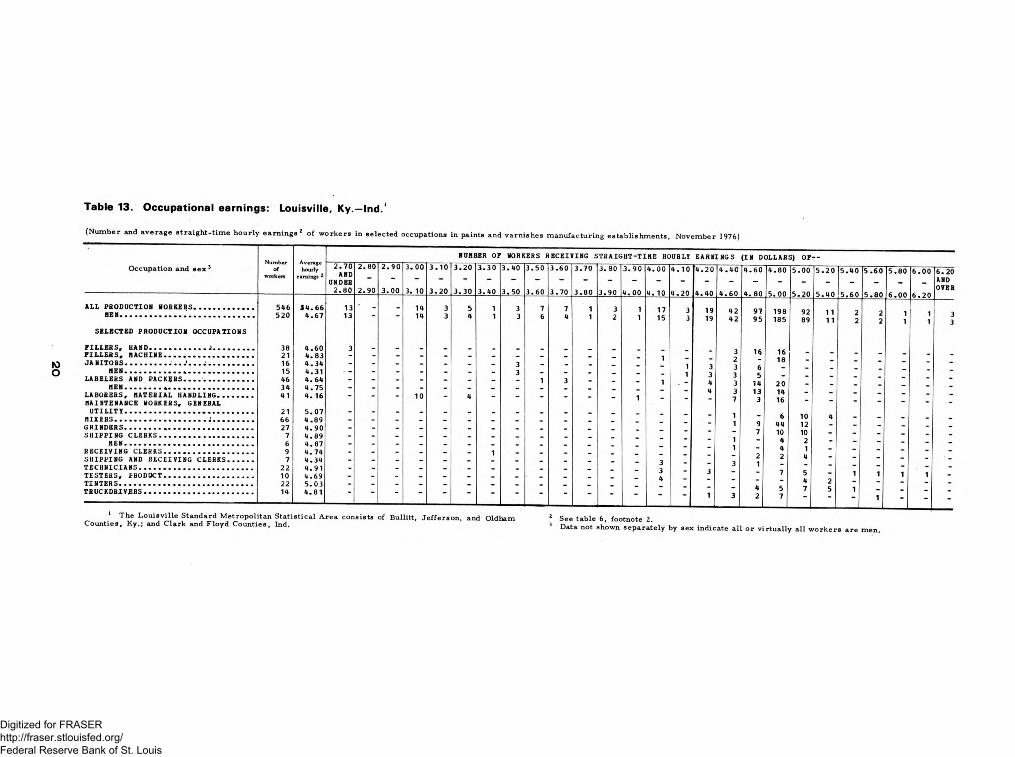
Earnings of the highest paid workers within a given occupation and area usually exceeded those of the lowest paid by a least $1.50 an hour (tables 6-19). Consequently, some workers in jobs with relatively low averages (as compared to the overall average in the industry) earned more than some workers in jobs with much higher averages. The extent of such overlap is illustrated by the following tabulation, which shows the number of general utility maintenance workers ($5.74) and labelers and packers ($4.62) in Chicago by specific hourly earnings intervals:

General u tility maintenance Labelers and

workers packers

$3.60 and under $4 .00 — 82$4.00 and under $4 .40 - 13$4.40 and under $4 .80 4 31$4.80 and under $5 .20 16 25$5.20 and under $5 .60 18 52$5.60 and over 86 16

7 Lack of individual establishment data for the 1970 surveyprevented significance testing of changes between individual occupa­tional wage rates during the 1970-76 period.

3Digitized for FRASER http://fraser.stlouisfed.org/ Federal Reserve Bank of St. Louis

Nationally, and in regions where such comparisons could be made, occupational averages were usually higher in establishments employing 100 workers or more than in smaller establishments and in establishments having labor-management contracts covering a majority of their workers (tables 4-5).

Establishment practices and supplementary wage provi­sions. Data were also obtained for production and office workers on certain establishment practices (production work­ers only), and on selected supplementary wage benefits, in­cluding paid holidays, paid vacations, and health, insurance and retirement plans.

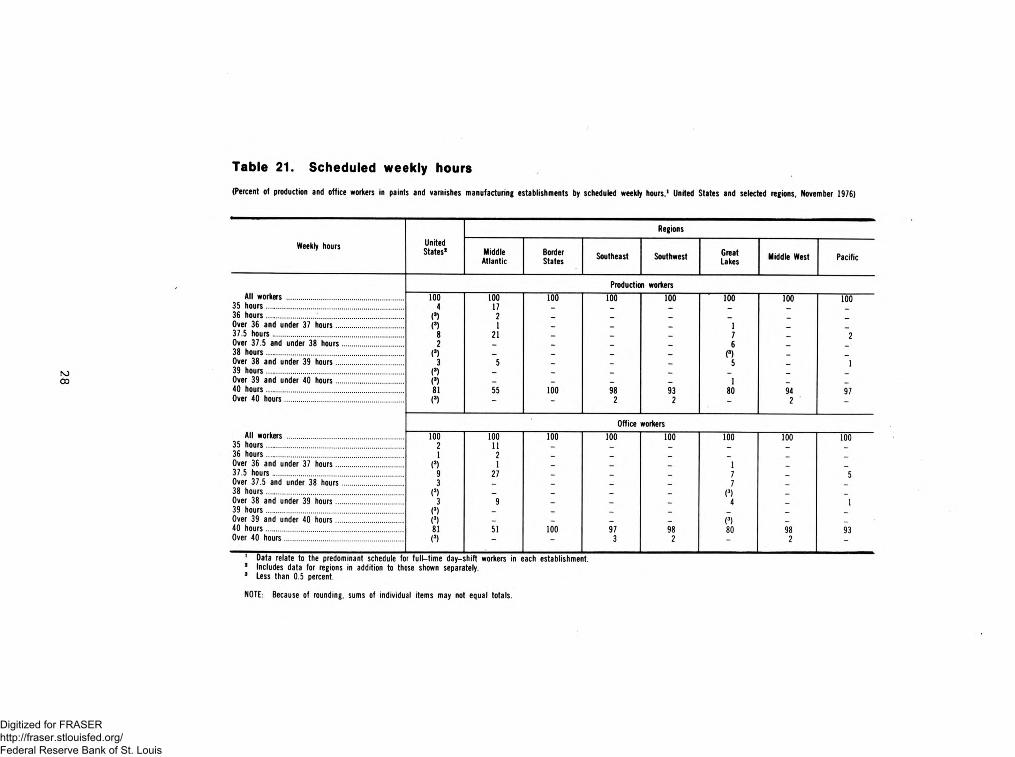
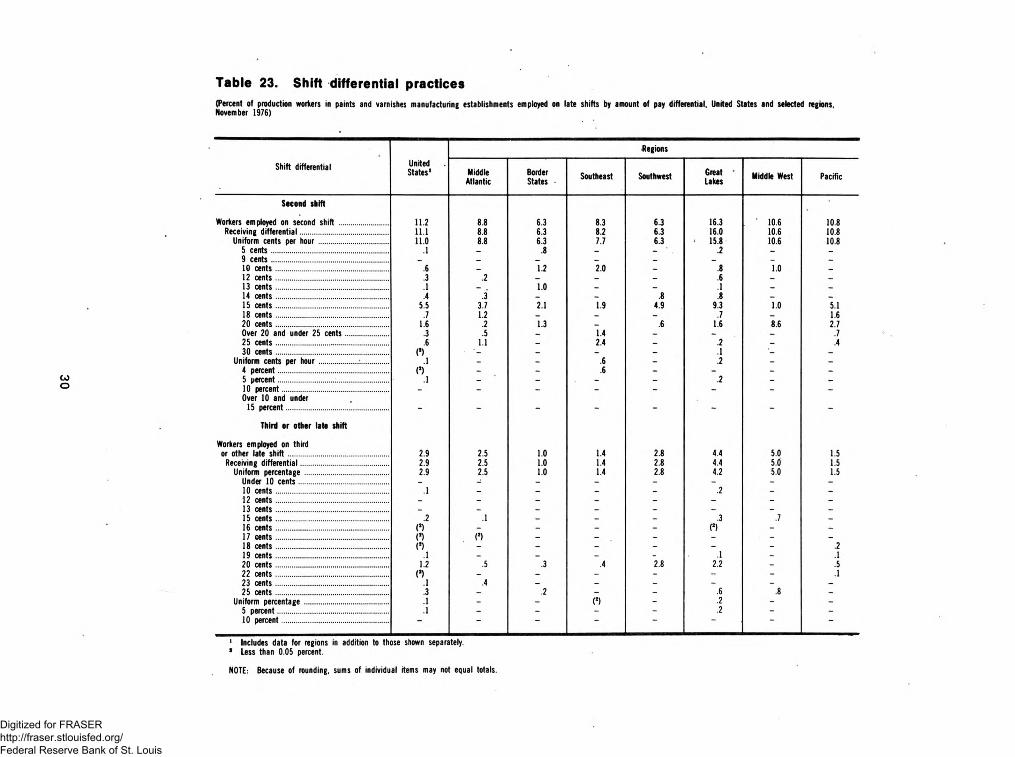
Scheduled weekly hours and shift provisions. Work sched­ules of 40 hours a week were in effect in establishments employing 94 percent of the production work force and about 81 percent of the office workers (table 21). Nearly all production workers were in establishments having provisions for second shifts, and about seven-eighths were covered by provisions for third or other late shifts (table 22). At the time of the survey, however, only about 11 percent of the pro­duction workers were actually employed on second shifts and about 3 percent on third or other late shifts (table 23). Late-shift workers usually received extra pay above day-shift rates, the most common premium being 15 cents an hour for second-shift work and 20 cents for third or other late shifts.

Paid holidays. All establishments provided paid holi­days, usually 9 to 11 annually, to production and office workers (table 24). Regionally, the number of holidays most commonly provided ranged between 11 and 12 days in the Middle Atlantic and 7 to 9 days in the Border States, Southeast, and Southwest.

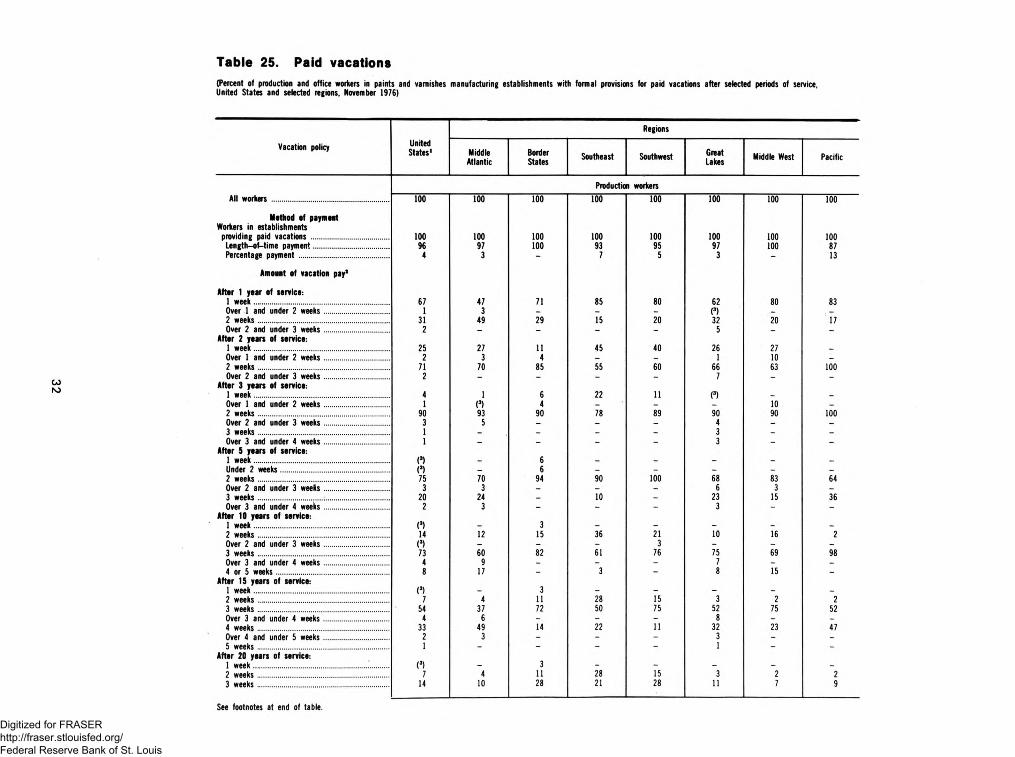
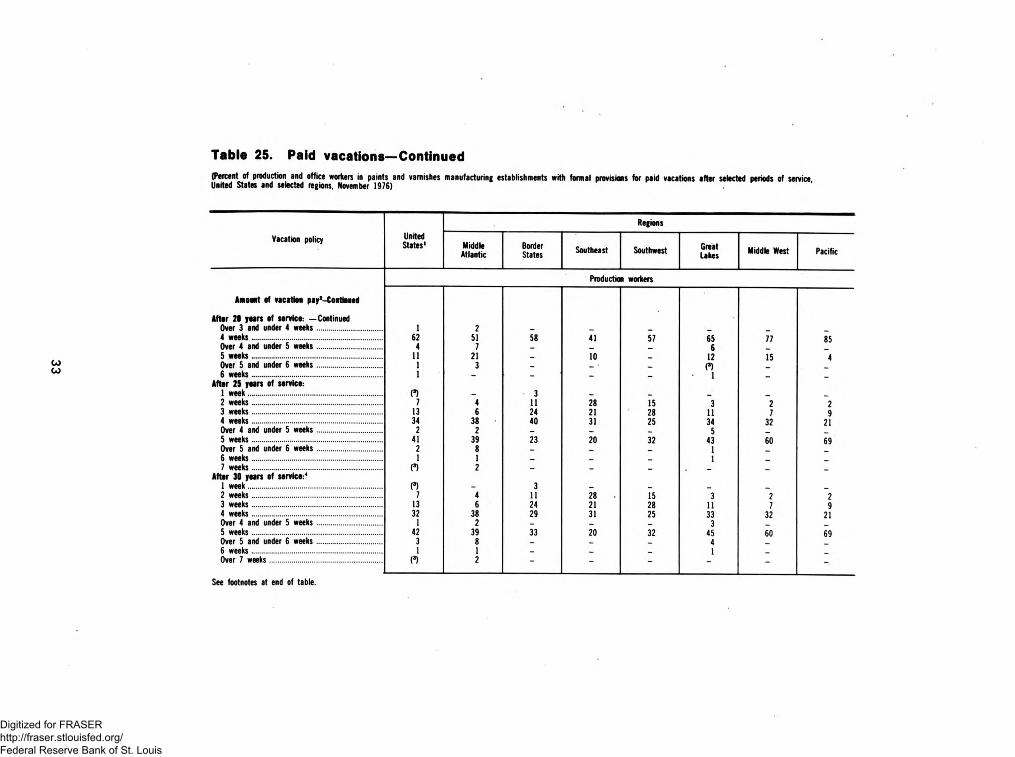
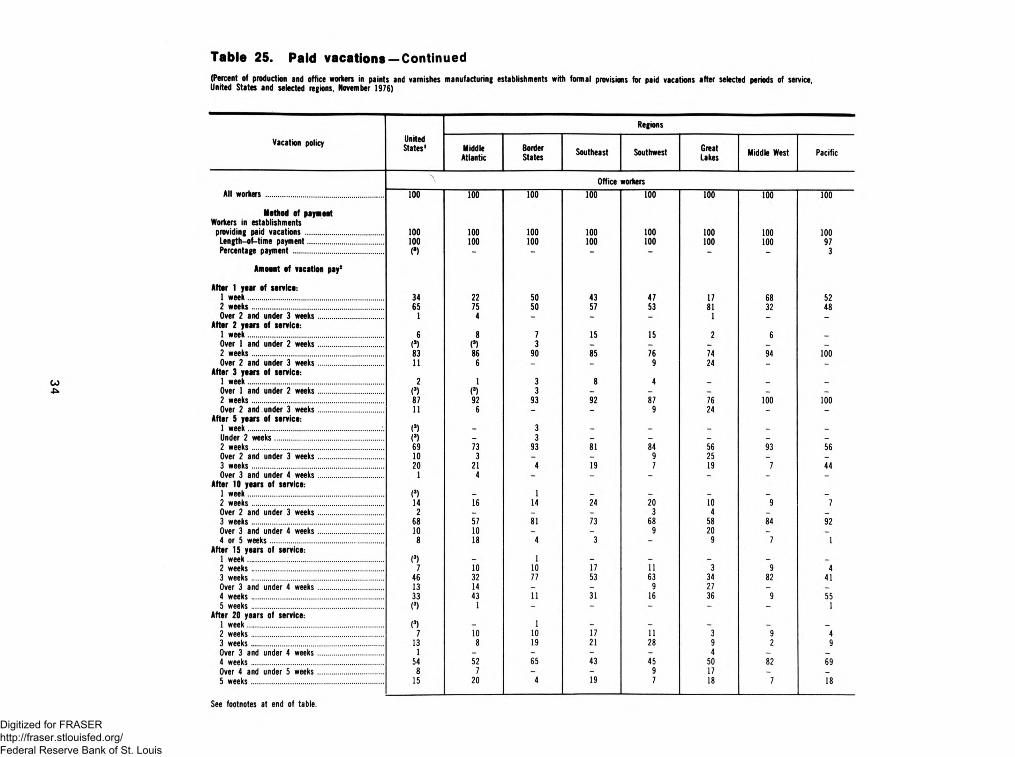
Paid vacations. Paid vacations, after qualifying periods of service, were provided by establishments employing all production and office workers (table 25). The most common provision for production workers were 1 week of vacation pay after 1 year of service, 2 weeks after 2 years, and 3 weeks after 10 years. The most common

provisions for office workers were 2 weeks after 1 year and 3 weeks after 10 years. A majority of both production and office workers in every region received at least 4 weeks of vacation after 20 years.

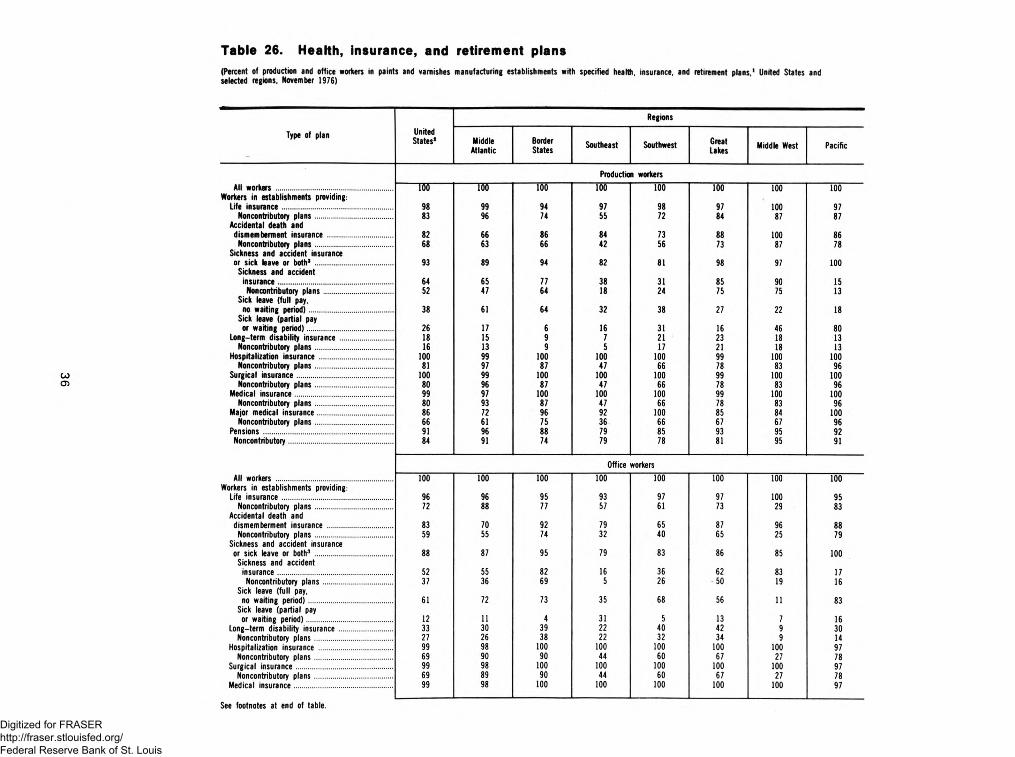
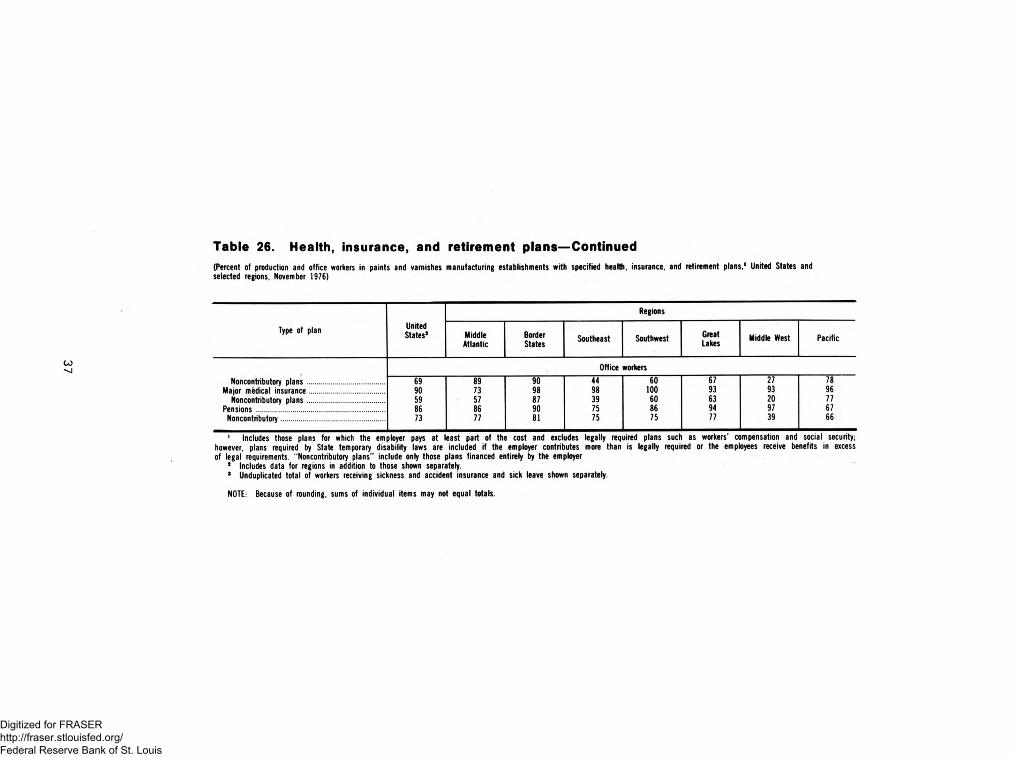
Health, insurance and retirement plans. Life, hospitali­zation, surgical, and basic medical insurance plans, at least partly paid for by employers, were available to all or virtually all production and office workers (table 26). Accidental death and dismemberment insurance applied to about four-fifths of all production and office workers. Sickness and accident insurance and/or sick leave applied to about nine-tenths of both groups. Retirement pension plans in addition to Federal social security benefits were available in establishments em­ploying about nine-tenths of the workers.

Noncontributory plans—those for which the em­ployer pays the entire cost—were more prevalent for production than for office workers. Noncontributory medical insurance plans, for example, were provided to four-fifths of all production workers, while just under seven-tenths of all office workers were under similar plans.

There was little regional variation in the incidence of life, hospitalization, surgical, and medical insurance plans. Certain other benefits, however, did differ some­what among regions. In the Middle Atlantic, for example, about seven-tenths of both production and office workers were covered by major medical insur­ance compared to about nine-tenths or more of workers in the Border States, Southeast, Southwest, and Pacific regions.

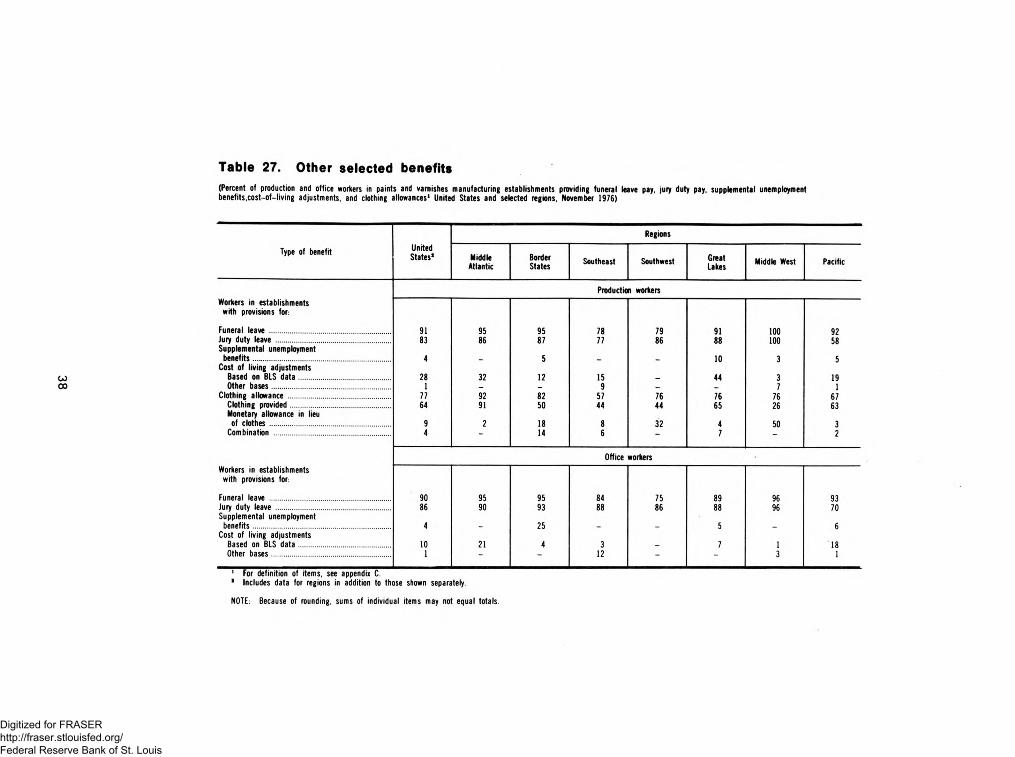
Other selected benefits. Pay provisions for funeral leave and jury duty were reported in establishments employ­ing at least seven-tenths of all production and office workers (table 27). Establishments reporting provisions for cost-of-living adjustments employed about three- tenths of the production workers and about one-tenth of the office workers. Establishments providing work clothing and/or a monetary allowance for such cloth­ing employed nearly four-fifths of all production work­ers.

4Digitized for FRASER http://fraser.stlouisfed.org/ Federal Reserve Bank of St. Louis

Table 1. Average hourly earnings: By selected characteristics

(Num ber and a v e r a g e s tr a ig h t - t im e hourly e a r n in g s 1 of product ion w o r k e r s in paints and v a r n i sh es manufactur ing e s ta b l i sh m e n ts by s e l e c t e d c h a r a c t e r i s t i c s , United States and s e l e c te d r e g io n s , N o v e m b e r 1976)

United States 1 2 Middle 1Atlantic Border St ates Southeast Southwest Great Lakes Middle West P a c i f ic

ItemN u m ­

berof

w o r k ­ers

A v e r ­age

hourly earn -inS8

N u m ­berof

w o r k ­ers

A v er - age

hourly e a r n ­ings

N u m ­berof

w o r k ­e r s

A v er - age

hour lye a r n ­ings

N u m ­berof

w o r k ­e r s

A v er - age

hourly earn - ings

N u m ­berof

w o r k ­e r s

Aver - age

hourly e a r n ­ings

N u m ­berof

work - er s

Aver - age

hourly e a r n ­

ings

N u m ­berof

w o r k ­ers

A v e r ­age

hourlye a r n -

N u m ­berof

w o r k ­e r s

A v er - age

hourly e a r n -

ALL PRODUCTION WORKERS3 ........................... 2 7 , 6 4 72 5 , 9 4 2

1 ,6 8 0

$ 5 . 1 0 5 , 9 7 5 2 , 3 4 5 * 4 . 1 0 4 . 1 82 . 9 5

1 . 9 5 41 ,8 8 7

$ 4 . 4 2 1 0 , 0 1 8 $ 5 . 3 8 1 , 5 6 6 $ 5 . 1 8 3 , 2 8 3 $ 5 . 7 7MEN............................................................................WOMEN...................................................................... n* 159

4 . 4 5 9 , 139 5 . 4 8 1 , 4 9 2 5 . 2 2 3 , 124 5 . 8 167 3 . 4 5 879 4 . 2 7 74 4 . 46 134 5 . 11

S IZ E OF ESTABLISHMENT:2 0 - 9 9 NORKERS................................................ 1 2 , 6 1 6

1 5 ;0 3 11 , 2 2 31 , 1 2 2

3 . 8 04 . 4 2

1 , 1 6 279 2

4 . 0 6 3 , 1 7 6 4 . 9 4 609 4 . 7 3 1 , 7 9 2 5 . 7 8100 WORKERS OR MORE................................ 5 . 4 4 2 , 949 r" - t ib. / I 7 9 j 4 . 94 6 , 842 5 . 5 8 957 5 . 47 1 ,4 9 1 5 . 7 6S IZE OF CCMMUNITI:

METROPOLITAN AREAS 4 .............................. 2 6 , 4 8 71 , 1 6 0

5 . 14 4 . 0 4

5 . 1 3 1 , 9 7 8 367

4 . 2 8 3 . 10

1 ,8 3 8 4 . 4 3 9 , 6 0 7 5 . 3 9 1 ,4 6 2 5 . 2 8 3 , 2 8 3 5 . 7 7NON METROPOLITAN AREAS...........................1, j 40

* 4 11 4 . 97 * ~ *LABOR-MANAGEMENT CONTRACTS:

ESTABLISHMENTS WITH-MAJORITI OF WORKERS COVERED... NONE OR MINORITY OF WORKERS

COVERED......................................................

1 8 , 8 2 8

8 , 8 1 9

5 . 3 5

4 . 5 7

5 , 166 5 . 15 424 4 . 85 999

1 ,3 4 6

4 . 4 5

3 . 8 4

694

1 , 2 6 0

4 . 8 5 7 , 0 4 6 5 . 5 1 1 , 1 9 4 5 . 3 8 2 , 9 0 8 5 . 8 4

4 . 1 8 2 , 9 7 2 5 . 0 7 372 4 . 5 6 3 75 5 . 2 5

1 E xc lu d es p rem iu m pay for ov er t im e and for work on w ee k e n d s , h o l id ays , and la te sh i f t s .

2 Inclu des data for reg io ns in addition to th o se shown sep arate ly .3 Inc ludes w ork ers in e s ta b l i sh m ents for wh ich information by s e x was

unava i la b le .

4 Standard M etropol itan S ta t i s t ica l A r e a s M an ag ement and Budget through F eb ru ary 1974.

def ined by the U.S. O ff ice of

Digitized for FRASER http://fraser.stlouisfed.org/ Federal Reserve Bank of St. Louis

Table 2. Earnings distribution: All establishments

( P e r c e n t d i s tr ibut io n of product ion w o r k e r s in paints and v a r n i sh es man ufacturing e s ta b l i sh m e n t s by a v e r a g e s tr a ig h t - t im e hourly e a r n i n g s , 1 United Sta tes and se le c te d re g io n s , N ovem b er 1976)

United States 2B ord er South-A v e r a g e hour ly earn in gs 1

Total Men Women Atlantic States ea s t w e s t Lakes West Pac i fi c

NUMBER OF HORKERS3 .................................... 2 7 . 6 4 7 2 5 , 9 4 2 1 , 6 8 0 5 , 9 7 5 1 , 5 4 0 2 , 3 4 5 1 , 9 5 4 1 0 , 0 1 8 1 ,5 6 6 3 , 2 8 3AVERAGE HOURLY EARNINGS...................... $ 5 . 1 0 $ 5 . 1 6 $ 4 . 1 2 $ 5 . 1 3 $ 4 . 3 4 $ 4 . 10 $ 4 . 4 2 $ 5 . 38 $ 5 . 18 $ 5 . 7 7

TOTAL.......................................................... 1 0 0 . 0 1 0 0 .0 1 0 0 . 0 1 0 0 . 0 1 0 0 . 0 1 0 0 . 0 10C.0 1 0 0 . 0 1 0 0 . 0 1 0 0 . 0

$ 2 . 3 0 AND UNDER $ 2 . 4 0 ........................... 1 . 0 0 . 5 7 . 6 0 . 1 0 . 5 6 . 0 C .7 0 . 8 _ .$ 2 . 4 0 AND UNDER $ 2 . 5 0 ........................... . 3 . 3 .4 . 1 1 .6 . 9 . 6 . 1 - -

$ 2 . 5 0 AND UNDER $ 2 . 6 0 ............................ 1 . 0 . 9 2. 3 . 3 1 . 7 6 . 8 a . 3 . 2 _ -$ 2 . 6 0 AND UNDER $ 2 . 7 0 ........................... . 4 . 3 2 . 4 . 3 .4 2 . 3 1 .0 . 2 - -

$ 2 . 7 0 AND UNDER $ 2 . 8 0 ............................ . 8 . 5 5. 4 . 7 1 . 4 3 . 0 1 .3 . 5 0 .1 -$ 2 . 8 0 AND UNDER $ 2 . 9 0 ........................... . 3 . 2 1 . 5 . 2 . 1 . 8 . 2 . 2 1 .0 0 . 1$ 2 . 9 0 AND UNDER $ 3 . 0 0 ........................... . 4 . 4 . 5 . 5 . 2 2 . 3 . 8 (4 ) - -

$ 3 . 0 0 AND UNDER $ 3 . 1 0 ........................... 1 . 6 1 . 5 1 . 8 1 . 8 2 . 3 3 . 5 6.C . 5 1 . 0 . 1$ 3 . 1 0 AND UNDER $ 3 . 2 0 ............................ . 8 . 6 3 . 1 1 . 4 2 . 3 1 . 3 1 .4 . 1 . 9 . 1$ 3 . 2 0 AND UNDER $ 3 . 3 0 ........................... 1 . 2 1 . 2 2. 3 1 . 3 3 . 8 3 . 0 2 . 6 . 4 1 .3 . 1$ 3 . 3 0 AND UNDER $ 3 . 4 0 ........................... . 8 . 8 1 . 3 . 8 2 . 7 2 . 7 . 4 . 1 2 . 4 . 1$ 3 . 4 0 AND UNDER $ 3 . 5 0 ............................ . 8 . 8 1 . 3 1 . 1 . 8 3 . 0 1. 1 . 2 1 .1 . 2

$ 3 . 5 0 AND UNDER $ 3 . 6 0 ............................ 1 . 5 1 . 5 1. 8 . 8 2. 9 2 . 2 2 . 5 1 . 3 1 . 9 1 . 8$ 3 . 6 0 AND UNDER $ 3 . 7 0 ............................ . 9 . 9 1 . 0 . 8 3 . 0 2 . 3 1 .0 . 3 1 .0 . 6$ 3 . 7 0 AND UNDER $ 3 . 8 0 ............................ 1 . 7 1 . 7 1 .7 2 . 0 2. 4 2 . 1 2 . 9 1 . 0 3 . 9 1 . 2$ 3 . 8 0 AND UNDER $ 3 . 9 0 ........................... 1 .0 1 . 0 1. 8 . 8 1 .1 1 . 4 1 .7 1 .0 1 .1 . 6$ 3 . 9 0 AND UNDER $ 4 . 0 0 ............................ 1 . 3 1 . 0 6 . 0 1 . 4 1 . 3 1 . 6 . 7 1 . 6 2 . 6 . 1

$ 4 . 0 0 AND UNDER $ 4 . 1 0 ........................... 2 . 9 2 . 8 4 . 8 3 . 1 3 . 8 3 . 3 S.O 1 . 9 1 . 5 1 . 2$ 4 . 1 0 AND UNDER $ 4 . 2 0 ............................ 2 . 2 2 . 1 3 . 8 2 . 4 2 . 6 3 . 6 3 . 6 2 . 0 1 .0 . 3$ 4 . 2 0 AND UNDER $ 4 . 3 0 ............................ 2 . 1 2 . 0 2 . 9 1. 9 3 . 6 2 . 3 5 .1 2 . 2 1 . 0 .1$ 4 . 3 0 AND UNDER $ 4 . 4 0 ........................... 2 . 4 2 . 3 2 . 6 2 . 1 3 .7 1 . 9 3 . 7 2 . 1 . 6 3. 5$ 4 . 4 0 AND UNDER $ 4 . 5 0 ............................ 1 . 8 1 . 8 . 8 1 . 8 4 . 7 2 . 6 3 .7 1 . 3 . 5 . 2

$ 4 . 5 0 AND UNDER $ 4 . 6 0 ............................ 2 . 7 2 . 6 4. 7 2 . 7 4 . 0 1 . 4 4 . 5 3 . 5 1 .1 . 7$ 4 . 6 0 AND UNDER $ 4 . 7 0 ........................... 2 . 7 2 . 5 6 . 1 2 . 3 4 . 1 4 . 6 3 . 0 2 . 7 1 . 5 . 9$ 4 . 7 0 AND UNDER $ 4 . 8 0 ............................ 3 . 1 3 . 0 4 . 3 2 . 0 7 . 5 2 . 6 4 . 8 3 . 2 1 . 0 2 . 5$ 4 . 8 0 AND UNDER $ 4 . 9 0 ........................... 3 . 7 3 . 8 2 . 7 3 . 7 6 . 8 2 . 8 3 . 0 4 . 4 . 5 1. 4$ 4 . 9 0 AND UNDER $ 5 . 0 0 ............................ 3 . 3 3 . 3 2 . 3 3 . 0 1 1 . 6 3 . 5 2 . 8 2 . 8 1 . 5 1 . 2

$ 5 . 0 0 AND UNDER $ 5 . 1 0 ............................ 3 . 3 3 . 5 . 9 3 . 6 7 . 9 3 . 2 2 .1 2 . 4 6 . 7 1 .1$ 5 . 1 0 AND UNDER $ 5 . 2 0 ........................... 3 . 3 3 . 4 2 . 9 4 . 9 2 . 6 5 . 7 1 .7 2 . 7 5 . 3 1. 4$ 5 . 2 0 AND UNDER $ 5 . 3 0 ............................ 3 . 3 3 . 3 2 . 7 3 . 3 2 . 8 1 . 4 3 . 2 3 . 7 3 . 4 3 . 1$ 5 . 3 0 AND UNDER $ 5 . 4 0 ........................... 5 . 4 5. 5 3 . 5 5 . 5 1 .8 3 . 0 7 . 1 7 . 5 2 . 5 2. 7$ 5 . 4 0 AND UNDER $ 5 . 5 0 ............................ 4 . 3 4 . 4 2 . 7 6 . 0 . 6 2 . 3 2 . 0 4 . 6 6 . 0 2 . 9

$ 5 . 5 0 AND UNDER $ 5 . 6 0 ........................... 4 . 7 4 . 8 3 . 0 5 . 0 . 5 2 . 0 3 .1 5 . 9 5 . 1 5 . 7$ 5 . 6 0 AND UNDER $ 5 . 7 0 ........................... 4 . 3 4 . 4 2 . 2 5 . 2 . 5 1 . 0 1 .9 4 . 5 14 . 2 3. 3$ 5 . 7 0 AND UNDER $ 5 . 8 0 ............................ 3 . 4 3 . 6 1. 2 3 . 3 . 5 1 . 4 2 . 2 3 . 7 4 . 8 6 . 2$ 5 . 8 0 AND UNDER $ 5 . 9 0 ........................... 4 . 1 4 . 3 1 .1 3 . 8 . 3 . 6 1 .2 4 . 5 7 . 7 9 . 1$ 5 . 9 0 AND UNDER $ 6 . 0 0 ............................ 3 . 0 3 . 2 . 5 2 . 1 . 3 . 2 1 .2 3 . 4 2 . 9 8 . 8

$ 6 . 0 0 AND UNDER $ 6 . 1 0 ........................... 2 . 5 2 . 6 . 5 3 . 0 . 5 2 . 1 1 .3 1 . 9 1 .7 6 . 6$ 6 . 1 0 AND UNDER $ 6 . 2 0 ............................ 2. 1 2 . 2 . 2 2 .C . 1 <4) . 5 2 . 7 . 6 5. 3$ 6 . 2 0 AND UNDER $ 6 . 3 0 ............................ 2 . 1 2 . 2 . 4 3 . 2 . 5 . 9 . 2 1 . 5 .1 5 . 9$ 6 . 3 0 AND UNDER $ 6 . 4 0 ........................... 1 . 0 1. 1 . 1 1 .1 . 1 . 7 .7 . 6 1 .1 3 . 0$ 6 . 4 0 AND UNDER $ 6 . 5 0 ........................... 1 . 0 1. 1 * 1 . 6 . 1 - . 2 . 9 - 2 . 7

$ 6 . 5 0 AND UNDER $ 6 . 6 0 ........................... 1 . 5 1 . 6 . 2 2 . 6 . 3 . 7 . 5 1 . 0 1 .6 2 . 8$ 6 . 6 0 AND UNDER $ 6 . 7 0 ............................ . 9 1 .0 - . 4 - - . 1 1 .7 . 3 1 . 6$ 6 . 7 0 AND UNDER $ 6 . 8 0 ............................ 1 . 0 1 .0 . 2 . 4 - - . 3 1 . 5 2 . 4 1 . 3$ 6 . 8 0 AND UNDER $ 6 . 9 0 ........................... 1 . 0 1 .0 . 4 . 1 - - . 3 1 .6 - 2 . 9$ 6 . 9 0 AND UNDER $ 7 . 0 0 ............................ . 5 . 5 . 1 . 9 - . 9 . 1 . 4 . 7

$ 7 . 0 0 AND OVER.............................................. 4 . 6 4 . 9 . 1 3. 2 - . 3 - 8 . 5 2 . 9 5 . 5

1 E x c lu d e s p r e m iu m pay for o v e r t im e and for work on w eek en d s , h o l id a y s , and la te shi fts .

Inc lude s data for reg io ns in addition to th ose shown separate ly . 3 Inclu des w o r k e r s in e s ta b l i sh m en ts for which in formation by se x

w a s unavaila b le .

4 L e s s than 0 .05 percen t.

NOTE: B e c a u s e of rounding, sum s of individual i t e m s m a y not equal 100.

Digitized for FRASER http://fraser.stlouisfed.org/ Federal Reserve Bank of St. Louis

Table 3. Occupational averages: All establishments

(Num ber and a v e r a g e s t r a ig h t - t im e hour ly ear nings 1 of workers in s e le c te d occupations in paints and v a r n i sh e s manufacturing e s ta b l i sh m e n t s , United St ate s and se le c te d r eg io n s , N o v em b er 1976)

United State 2 Middle Atlantic Border States Southeast

Occup at ion and s e x 3Nu m-

be r Hour ly e arnings N u m ­ber H ourly earn in gs 1 N u m -

be r H ou rly earnings N u m -ber H ou rly earnings 1

ofwork-

e rsMean 4 Median4 Middle range 4

ofw o r k ­

e r sMean 4 Median 4 Middle range 4

ofw o r k ­

e r sMean 4 Median 4 Middle range 4

ofw o r k ­

e r sMean 4 Median 4 Middle r a n g e 4

DRUM CLEANERS.......................................................... 21« $ 4 . 7 4 1 4 . 8 5 $ 3 . 6 0 - $ 5 . 6 8 18 $ 5 . 1 7 $ 5 . 3 0 $ 5 . 1 z - $ 5 . 5 3 14 $ 4 . 52 43 $ 3 . 0 9 $ 3 . 0 0 $ 2 . 6 0 - $ 3 . 4 5FILLERS, HAND......................................................... 1, 511 4. 88 4 . 9 0 4 . 2 6 - 5 . 6 2 168 4 . 6 9 4 . 6 7 4 . 2 4 - 5 . 3 b 100 4 . 1 7 * 4 . 4 1 $ 3 . 5 0 - $ 4 . 7 1 167 3. 79 4. OC 2. 5 3 - 5 . 0 8

MEN....................................................................... 1, 416 4 .9 1 5 . 0 0 4 . 2 8 - 5 . 6 2 177 4 . 6 9 4 . 5 5 4 . 2 0 - 5 . 3 6 98 4 . 16 4. 41 . 3 . 5C- 4 . 70 152 3 . 9 4 4 .1C 2 . 7 5 - 5 . 0 8WOMEN................................................................. 95 4. 39 4 . 5 0 3. 6 5 - 5 . 2 4 - - - - - - - - - - - - - - -

FILLERS, MACHINE.................................................. 1 , 7 6 5 4 . 9 1 5 . 0 5 4 . 2 6 - 5 . b4 427 4 . 8 8 4 . 9 0 4 . 19- 5 . 58 84 4 . 32 4. 67 3 . 8 8 - 4 . 9 1 14C 3 . 8 7 3 .5 C 3 . 0 0 - 5 . 0 4MEN....................................................................... 1, 5ti£ 5 . 0 3 5. 16 4 . 4 7 - 5 . 7 1 377 5 . 0 8 5 . 0 9 4 . 5 4 - 5 . 6 5 80 4 . 4 0 4 . 7 2 3 . 9 C - 4 . 9 1 128 3 . 9 0 3. 50 2 . 7 6 - 5. 16WOMEN.................................................................. 167 3 . 7 8 3 . 5 0 3 . 0 C - 4 . 7 1 - - - - - - - - - - - - - - -

JANITORS....................................................................... 54 6 4 . 84 a . 99 4 . 0 7 - 5 . 6 0 104 4 . 8 0 5 . 1 2 u .z b- 5 . 3 5 26 4 . 0 9 4 . 3 0 3 . 5 6 - 4 . 7 2 4 1 3 . 28 2 . 7 5 2 . 3 5 - 4 . 03MEN....................................................................... 502 4. 89 5 . 0 0 4 . 0 9 - 5 . 6 3 9b 4 . 7 9 4 . 9 7 4 . * 8 - 5 . 3 5 24 4 . 10 4. 30 3. 59 - 4. 72 28 3 . 36 2 . 7 6 2 . 4 0 - 4 . 0 3WOMEN.................................................................. 44 4 . 2 7 4 . 5 6 3. 4 6 - 4. 99 - - - - - - - - - - - - - - -

LABELERS AND PACKERS...................................... 1 , 7 4 6 4 . 59 4 . 7 C 3 . 9 8 - 5 . 3 2 372 4 . 6 4 4 . 5 6 4 . 14- 5 . 2 5 11b 4 . 0 9 4 . 2 5 3 . 6 0 - 4. 77 127 3 . 64 3 .5C 2 . 7 5 - 4 . 4 8MEN....................................................................... 1 , 3 7 1 4 .7 1 4 . 7 6 4 . 15 - 5 . 3 7 34C 4 . 6 7 4. 59 4. 15 - 5 . 2 5 b3 4 . 1 7 4. 35 3 . 6 0 - 4 . 7 7 93 3 . 9 7 4 . 10 3 . 0 0 - 4 . 69WOMEN.................................................................. 377 4. 12 4 . 0 0 3 . 5 9 - 4 . 8 4 32 4 . 3 0 4 . 2 8 3 . 5 8 - 5 . 0 6 33 3 . 9 1 4 .0 0 3. 6C- 4. 50 34 2 . 7 6 2 . 7 5 2 . 3 5 - 2 . 7 5

LABORERS, MATERIAL HANDLING...................MAINTENANCE WORKERS, GENERAL

1 , 4 2 6 4 . 6 7 4 . 7 8 3 . 9 0 - 5 . 4 1 264 4 . 5 6 4 . 8 5 3 . 4 5 - 5 . 3 6 77 3 . 8 5 4. 10 3 . 0 0 - 4 . 7 6 101 3 . 4 4 3 . 3 5 2 . 5 0 - 4 . 4 0

UTILITY....................................................................... 1 , 1 7 5 5 . 7 2 5 .7 4 5 . 2 0 - 6 . 1 8 20 1 5 . 6 8 5 . 6 8 5 . 2 8 - 6 . 0 7 67 4 . 77 4. 66 4 . 4 0 - 5. 12 124 5 . 1 7 5 .2C 4 . 4 0 - 5 . 8 4MIXER-GRINDERS....................................................... 4, 128 5. 20 5. 32 4. 6 4 - 5 . 8 1 865 5 . 1 4 5 . 1 4 4 . 6 2 - 5 . 5 b 239 4 . 5 2 4 . 8 0 4 . 1 5 - 4 . 94 40 4 4. 36 4 . 36 3 . 4 5 - 5 . 3 1

MIXERS....................................................................... 1 , 6 2 1 5 . 2 6 5 . 3 7 4 . 7 8 - 5 . 9 0 297 5 . 2 3 5 . 2 2 4 . 7 0 - 5 . 7 6 132 4 . 54 4. 82 4 . 2 5 - 4. 91 96 4 . 2 9 4 . 1 6 3 . 4 0 - 4 . 6 9GRINDERS.................................................................. 652 5. 22 5 . 3 3 4. 7 1 - 5 . 7 4 146 5 . 3 0 5 . 4 5 4 . 9 4 - 5 . 7 4 44 4 . 7 5 4 . 9 0 4 . 7 0 - 5 . 0 0 37 3 . 7 7 3 . 4 5 3 . 3 5 - 3 . 9 2COMBINATION MI XER-GR IN D ERS................ 1 , 8 5 5 5 . 1 3 5 . 1 7 4 . 5 0 - 5 . 8 3 422 5 . 0 1 5 . 0 4 4 . 6 2 - 5 . 4 5 63 4 . 30 4. 27 3 . 6 1 - 5 . 0 5 271 4 . 4 7 4 . 4 1 1o90 5 . 3 1

SHIPPING ANE RECEIVING CLERKS.............. 837 5. 17 5 . 2 2 4. 53 - 5 . 8 6 193 5 . 0 6 5 . 1 6 4 . 5 3 - 5 . 6 9 57 4 . 5 2 4 . 5 2 4 . 1 3 - 4 . 9 4 76 4 . 8 9 4 . 8 2 4 . 24- 5 . 6 2SHIPPING CLERKS............................................... 296 5 . 2 7 5 . 4 1 4 . 5 8 - 6 . 0 0 71 5 . 3 3 5 . 4 8 4 . 8 2 - 5 . 5 2 18 4 . 8 1 4. 90 4 . 15- 5. 03 21 5 . 4 8 5 . 5 2 5 . 3 7 - 5 . 6 2RECEIVING CLERKS............................................ 257 5 . 16 5 . 0 0 4 . 5 5 - 5 . 6 7 61 5 . 16 5 . 3 3 4 . 6 0 - 5 . 8 7 14 4 . 6 1 - - - 31 4 . 2 7 4 . 05 3 . 9 5 - 4 . 8 2SHIPPING AND RECEIVING CLER KS. . . . 284 5 . 07 5 . 1 5 4 . 4 5 - 5 . 8 3 61 4 . 6 4 5 . 1 4 4 . 1 0 - 5 . 2 2 25 4 . 2 7 4 . 38 4 . 1 3 - 4. 45 24 5 . 18 5. 05 4 . 5 0 - 6 . 0 2

TECHNICIANS............................................................... 1 , 2 0 9 5 . 1 9 5 . 1 5 4 . 5 0 - 5 . 8 9 250 5 . 5 0 5 . 5 3 4 . 7 2 - 6 . 13 51 4 . 6 3 4. 91 4 . 11 - 5 . 15 128 4 . 4 1 4 . 5 0 3 . 6 0 - 5 .0 1MEN....................................................................... 1 , 0 6 4 5. 27 5 . 2 3 4. 5 0 - 5 . 9 5 221 5 . 6 0 5 . 6 6 4 . 3 1 - b 47 4 . 6 2 4 . 9 1 4 . 1 1 - 5 . 15 120 4 . 45 4. 55 3 . 6 4 - 5 . 0 1WOMEN.................................................................. 145 4 . 6 2 4 . 5 0 4 . 4 4 - 4 . 9 5 29 4 . 7 5 4 . 5 3 4 . 2 4 - 5 . 1 2 - - - - - 8 3 . 7 0 - - -

TESTERS, PRODUCT................................................. 688 5. 23 5 . 2 5 4. 3 9 - 6 . 1 9 125 5 . 2 8 5 . 7 3 4 . 3 0 - 6 . 2 9 41 4 . 2 1 o o 3 . 7 5 - 4 . 9 2 56 4 . 44 4. 66 3 . 5 4 - 5 . 2 3MEN....................................................................... 635 5 . 2 9 5 . 2 9 4 . 4 9 - 6 . 2 2 117 5 . 3 0 5 . 7 3 4 . 3 0 - 6 . 2 9 30 4 . 24 4. 13 3 . 7 5 - 4 . 6 1 55 4 . 4 3 4 . 6 6 3 . 4 5 - 5 . 2 5WOMEN.................................................................. 53 4 . 50 4 . 3 8 4. 0 0 - 4 . 9 7 8 4 . 9 5 - - - 11 4 . 1 4 - - - - - - - -

THINNERS....................................................................... 343 5 . 2 4 5 . 5 0 4 . 8 7 - 5 . 6 9 41 4 . 9 4 5 . 1 5 4 . 4 8 - 5 . 3 1 16 4 . 54 4. 70 4 . 1 9 - 5. 07 41 4 . 0 7 4 . 3 5 2 . 5 0 - 5 . 1 1TINTERS.......................................................................... 1 , 1 0 5 5 . 6 2 5 . 6 7 5 . 0 0 - 6 . 2 5 223 5 . 6 8 5 . 6 3 5 . 2 4 - 6 . 0 7 58 4 . 9 6 5. 07 4 . 7 8 - 5 . 2 9 96 4 . 8 4 4 . 9 5 4 . 7 0 - 5 . 5 7TRUCKDRIVERS............................................................ 7 3S 5 . 0 3 4 . 9 0 4 . 0 0 - 6 . 0 9 130 5 . 3 0 5 . 2 0 4 . 5 0 - 6 . 2 4 71 4 . 2 2 4 . 50 3 . 9 1 - 4. 9C 90 3 . 6 2 3 . 7 5 2 . 5 0 - 4 . 2 5TRUCKERS, EOWER (FORKLIFT)...................... 1 , 0 4 3 5 . 2 3 5 . 3 7 4 . 8 3 - 5 . 8 1 208 5 . 2 4 5 . 3 7 5 . 1 0 - 5 . 7 6 64 4 . 0 2 4 . 0 1 3 . 5 0 - 4 . 4 5 66 4 . 1 4 4 . 3 8 2 . 8 5 - 5 . 1 2

See footn otes at end of table.

Digitized for FRASER http://fraser.stlouisfed.org/ Federal Reserve Bank of St. Louis

Table 3. Occupational averages: All establishments— Continued

(Num ber and a v e r a g e s t r a i g h t - t im e h o u r ly ea rn in g s 1 of w o r k e r s in s e le c te d occupat ions in paints and v a r n i sh e s manufacturing e s ta b l i sh m e n ts , United St ate s and se le c te d reg io n s , N o v em b er 1976)

Southwest Great La k es Middle W est P a c i f ic

Occupation and s e x 3N u m ­

ber Hour ly earn ings N u m - be r H ourly earn in gs N u m -

be r Hourly earnings 1 N u m -ber H our ly earn in gs 1

ofw o r k ­

e r sMean 4 Median 4 Middle range 4

ofw o r k ­

e r sMean 4 Median 4 Middle range 4

ofwo rk -

e r sMean 4 Median 4 Middle range 4

ofw o r k ­

e r sMean 4 M edia n4 Middle range 4

DRUM CLEANERS.......................................................... 7 $ 3 . 9 9 95 $ 5 . 3 8 $ 5 . 5 0 $ 9 . 8 5 - $ 6 . 1 1 10 $ 5 . 3 6 31 $ 9 . 8 7 $ 5 . 2 1 $ 3 . 8 5 - $ 5 . 7 2FILLERS, HAND.......................................................... 105 3. 91 $ 9 . 0 0 $ 3 . 2 5 - $ 9 . 6 0 579 5 . 2 9 5 . 2 5 9 . 6 6 - 5 . 6 2 105 5 . 1 0 $ 5 . 9 6 $ 9 . 9 2 - $ 5 . 6 5 290 5 . 6 3 5. 76 5 . 2 5 - 5 . 8 2

MEN....................................................................... 99 3 . 9 3 9 . 0 0 3 . 2 0 - 9 . 6 0 535 5 . 2 7 5 . 3 2 9 . 7 5 - 5 . 6 2 101 5 . 1 3 5. 96 5 . 0 9 - 5 . 6 5 222 5 . 6 5 5 . 7 6 5 . 3 1 - 5 . 8 2WOMEN......................... ........................................ - - - - 39 9 . 7 7 5 . 1 6 9 . 1 0 - 5 . 2 9 - ~ - - - 18 5. 90 5 . 7 1 9 . 3 0 - 6 . 5 9

FILLERS, MACHINE.................................................. 129 9 . 5 1 9 .3 6 3 . 9 5 - 5 . 3 7 665 5 . 2 3 5 . 3 7 9 . 8 8 - 5 . 7 9 62 9. 59 9. 23 3 . 8 3 - 5 . 5 1 165 5 . 7 1 5 . 8 6 5 . 5 9 - 5 . 8 6MEN....................................................................... 121 9. 59 9 . 9 9 9 . 0C- 5 . 3 7 605 5 . 3 6 5 . 3 7 9 . 9 3 - 5 . 7 9 59 9 . 5 9 9 . 1 8 3 . 7 9 - 5 . 5 1 199 5 . 7 8 5 . 8 6 5 . 5 9 - 5. 86WCMEN.................................................................. 8 9 . 0 0 - - - 60 3 . 9 0 9 . 7 1 2 . 3 0 - 5 . 3 7 - - - - - - - _ _ -

JANITORS....................................................................... 26 3 . 6 1 3 . 1 5 2 . 5 5 - 9 . 3 6 257 5 . 2 9 5 . 2 5 9 . 6 7 - 5 . 8 0 92 9 . 6 2 5 . 0 8 3 . 7 5 - 5 . 3 9 90 5 . 3 8 5 . 6 3 5 . 1 8 - 5 . 6 9MEN....................................................................... 26 3 . 6 1 3 . 1 5 2 . 5 5 - 9 . 3 6 229 5 . 3 9 5 . 2 5 9 . 7 3 - 5 . 8 0 38 9 . 7 9 5. 39 9 . 0 0 - 5. 39 39 5 . 3 8 5. 63 5 . 0 7 - 5 .71WOMEN.................................................................. - - - 28 9 . 96 9 . 6 3 9 . 2 2 - 9 . 9 9 - - - - - - - - - -

LABELERS AND PACKERS....................................... 185 3 . 9 8 9 .1C 3 . 0 0 - 9 . 7 0 609 9 . 7 8 9 . 7 6 9 . 1 6 - 5 . 3 7 117 9 . 6 5 5 . 0 9 3 . 7 5 - 5. 91 179 5 . 3 8 5. 79 9 . 8 9 - 5 . 8 6MEN........................................................................ 159 9 . 1 3 9 . 2 5 3 . 39 - 9 . 7 5 939 5 . 0 1 5. 1 1 9 . 3 6 - 5 . 3 7 91 9 . 6 5 5 . 0 9 3 . 7 9 - 5 . 9 1 131 5 . 9 8 5 . 7 6 5 . 2 5 - 5 . 9 2WOMEN.................................................................. - 175 9 . 2 2 9 . 0 0 3 . 9 3 - 9 . 7 2 26 9 . 6 7 5. 10 3 . 7 5 - 5. 36 98 5 . 11 5 . 16 9 . 7 8 - 5 . 7 2

LABORERS, MATERIAL HANELING.................... 60 9 . 1 5 9 . 2 7 3 . 6 8 - 5 . 1 6 976 5 . 15 5 . 2 8 9 . 6 8 - 5 . 6 9 102 5 . 2 2 5 . 3 5 5 . 1 7 - 5 . 5 1 - - - - -MAINTENANCE WORKERS, GENERAL

UTILITY....................................................................... 72 9 . 7 6 9 . 8 8 9 . 0 0 - 5 . 5 6 956 5 . 8 9 5 . 8 1 5 . 9 2 - 6 . 15 69 5 . 7 5 5. 61 5 . 3 1 - 6 . 7 3 199 6 . 8 9 6 . 3 5 6 . 1 2 - 7 . 2 7MIXER-GRINDERS....................................................... 305 9. 39 9. 90 9. 0 0 - 9 . 9 5 1 ,9 2 2 5 . 5 6 5 . 5 1 5 . 0 3 - 5 . 9 8 269 5 . 0 0 5 . 1 8 9 . 9 3 - 5 . 6 5 999 5 . 9 1 5 . 96 5 . 5 2 - 6.C5

MIXERS....................................................................... 89 9 . 5 1 9 . 5 8 9 . 0 0 - 5 . 9 2 619 5 . 9 7 5 . 9 8 5 . 0 9 - 5 . 9 3 101 5 . 0 8 5. 61 9 . 5 0 - 5 . 8 1 291 5 . 9 7 5 . 96 5 . 5 2 - 5 . 9 6GRINDERS.................................................................. 29 5 . 0 3 5 . 0 0 9 . 5 8 - 5 . 9 9 280 5 . 5 3 5 . 5 3 5 . 0 8 - 5 . 9 6 98 9 . 9 7 9 . 1 7 3 . 7 9 - 5 . 2 9 - - - - -COMBINATION MIXER-GRINDERS................. 192 9 . 2 6 9 . 2 6 3 . 8 9 - 9 . 9 5 528 5 . 6 9 5 . 5 9 9 . 8 5 - 6 . 5 5 115 5 . 1 9 5. 19 5 . 0 9 - 5 . 6 1 209 5 . 9 3 6. 02 5 . 7 6 - 6 . 1 2

SHIPPING AND RECEIVING CLERKS.............. 90 9 . 7 2 9 . 6 0 9i 10- 5 . 3 2 276 5 .9 1 5 . 3 6 9 . 8 1 - 5 . 9 5 96 9 . 6 6 5 .0 1 3 . 6 0 - 5 . 6 9 107 5 . 9 9 6 . 0 2 5 . 7 9 - 6. 37SHIPPING CLERKS............................................... 7 9 . 99 - - 88 5 . 1 9 5 . 1 0 9 . 3 2 - 5 . 8 6 26 9 . 1 1 9. 08 3 . 0 0 - 9. 95 61 6 . 0 6 6 .2C 5 . 8 6 - 6 . 9 7RECEIVING CLERKS............................................ 17 9 . 6 0 9 . 5 3 9 . 10- 9 . 9 9 83 5 . 9 2 9 . 9 3 9 . 8 1 - 6 . 0 3 11 5 . 3 5 - - - 33 5 . 8 8 6 . 0 9 5 . 9 7 - 6 . 2 2SHIPPING AND RECEIVING C L E R K S . . . . 16 9 . 9 7 9 . 8 0 9 . 90 - 5 . 6 9 105 5 . 6 2 5 . 6 8 5 . 1 5 - 6 . 2 1 9 5 . 9 0 - - - 13 5 . 9 0 - - _

TECHNICIANS............................................................... 59 9 . 2 7 9 . 3 0 3 . 3 7 - 5 . 1 0 981 5 . 2 6 5 . 0 2 9 . 5 0 - 5 . 9 0 82 5 . 0 5 5 . 6 0 3 . 9 0 - 5 . 8 9 101 6 . 1 2 6 . 1C 5 . 5 0 - 6 . 6 9MEN....................................................................... 59 9. 27 9 . 3 0 3. 3 7 - 5 . 1 0 399 5 . 3 9 5 .2 1 9 . 5 0 - 6 . 0 0 78 5 . 1 3 5 . 6 1 3 . 9 2 - 5 . 8 9 90 6 . 2 6 6. 1C 5 . 6 9 - 6 . 6 9WOMEN.................................................................. ~ - - - 87 9 . 6 8 9 . 5 0 9 . 5 0 - 9 . 8 5 - - - - - 11 5 . 0 2 - - _

TESTERS, PRODUCT.................................................. 62 9. 72 9 . 5 0 9 . 2 8 - 5 . 0 5 280 5 . 9 9 5 . 9 7 9 . 5 6 - 6 . 6 5 55 5 . 3 3 5 . 9 0 9 . 8 6 - 5 . 8 9 53 6 . 0 3 6. 2 C 5 . 3 9 - 6 . 9 7MEN....................................................................... 6 C 9 . 7 3 9 . 5 3 9 . 2 7 - 5 . 1 1 299 5 . 6 2 5 . 6 5 9 . 6 0 - 6 . 6 5 55 5 . 33 5. 90 9 . 8 6 - 5 . 8 9 53 6 . 0 3 6 . 2 C 5 . 3 9 - 6 . 9 7WOMEN.................................................................. - - - - - 31 9 .5 1 9 . 3 0 9 . 1 0 - 5 . 3 5 - - - - - _ _ - _ _

THINNERS........................................................................ 26 9. 58 9 . 6 8 3 . 9 5 - 5 . 9 2 187 5 . 5 9 5 . 5 9 5 . 5 0 - 5 . 8 3 - - - - 26 6 . 3 9 6 . 3 9 5 . 9 6 - 6 . 9 0TINTERS......................... ................................................. 100 5 . 0 7 9 . 8 7 9. 99 - 5 . 7 2 388 5 . 8 0 5 . 7 9 5 . 3 2 - 6 . 2 8 59 5 . 6 5 5 . 83 5 . 5 2 - 5 . 9 8 192 6 . 3 2 6 . 2 5 6 . 2 5 - 6 . 9 7TRUCKDRIVERS............................................................ 78 9 . 0 9 9 . 0 0 3 . 5 3 - 9 . 5 5 129 5 . 7 8 5 . 5 5 9 . 8 5 - 7 . 1 7 59 5 . 2 9 9. 92 3 . 8 0 - 7. 30 122 6 . 2 8 6 . 2 6 6 . 0 0 - 6 . 9 3TRUCKERS, POWER (FORKLIFT)...................... 109 9 . 7 7 9 . 7 0 9 . 2 5 - 5 . 3 7 918 5 . 9 6 5 . 9 1 9 . 9 8 - 5 . 8 1 29 5 . 0 0 5 . 6 1 9 . 5 7 - 5 . 6 1 191 6 . 0 0 5 . 9 6 5 . 7 2 - 6 . 12

1 E x c lu d e s p r e m iu m pa y for o v e r t im e and for work on weekends , h o l id ays , and late sh i ft s . 4 Se e appendix A for metho d used to compute m e a n s , m e d ia n s , and m iddle rang es of earn in gs .2 Inc lude s data for r eg io n s in addition to those shown sep arate ly . Medians and m iddle rang es are not prov ided for jobs with f ew e r than 15 w o r k e r s in a reg ion .3 Data not shown s e p a r a te l y by s e x ind icat e all or v ir tua l ly a ll workers a r e m en .

NOTE: D a sh es in d icate no data rep orted or data that do not m e e t p u b lication c r ite r ia .

Digitized for FRASER http://fraser.stlouisfed.org/ Federal Reserve Bank of St. Louis

Table 4. Occupational averages: By size of establishment

(N u m b er and av era g e s tr a ig h t-t im e hourly e a r n in g s1 of w o rk ers in s e le c te d o ccu p ation s in p ain ts and v a r n ish es m an u factu rin g e s ta b lish m e n ts by s iz e of e s ta b lish m e n t,U n ited S ta tes and se le c te d re g io n s , N ovem ber 1976)

United States Middle Atlantic B o r d e r States Southeas t

E s ta b l i s h m e n ts with—

Occup ation and s e x 20-9 9 w o r k e r s 100 w o r k e r s or m o r e 20—99 w o r k e r s 100 wo r k e r s

or m o r e 20—99 w o r k e r s 100 w o r k e r s or m o r e 20—99 w o r k e r s 100 w o r k e r s

or m o r eNum­

berof

work­ers

A v e r ­age

hourlye a r n ­ings

Nu m­be rof

w ork ­e r s

A v e r ­age

hour lyearn­ings

N u m ­be rof

w ork ­ers

A v e r ­age

hourlyearn­ings

Nu m ­be rof

w o r k ­ers

A v e r ­age

hourlyearn­ings

Nu m ­berof

w ork ­e r s

A v e r ­age

hourlyearn­ings

Nu m ­be rof

w ork ­e r s

A v e r ­age

hourlye a r n ­ings

Nu m­berof

w o r k ­ers

A v e r ­age .

hour lyearn­ings

Nu m ­berof

w ork ­e r s

A v e r ­age

hourlyearn ­ings

DRUM CLEANERS.............................................................. 103 $ 4 . 0 1 115 $ 5 . 3 9 8 $ 4 . 5 9 10 $ 5 . 6 3 12 $ 4 . 4 8 34 $ 3 . 0 5 9 $ 3 . 2 1F I L L E R S . HAND............................................................. 6 7 9 4 . 4 6 832 5 . 23 133 4 . 3 4 55 5 . 5 5 45 $ 3 . 9 1 55 4 . 3 8 73 3 . 3 0 94 4 . 17

MEN............................................................................ 6 30 4 . 50 786 5 . 2 5 122 4 . 3 1 55 5 . 5 5 45 3 . 9 1 53 4 . 3 8 58 3 . 5 6 94 4 . 1 78 0 B E N ...................................................................... 49 3 . 9 7 46 4 . 8 4 - - - - - - - - - - - -

F I L L E R S . MACHINE.................................................... 7 7 2 4 . 39 99 3 5. 32 181 4 . 0 8 246 5 . 4 8 43 4 . 1 0 41 4 . 5 5 74 3 . 4 5 66 4 . 3 4MEN............................................................................ 6 64 4 . 5 8 92 4 5 . 3 6 137 4 . 3 9 240 5 . 4 7 39 4 . 2 4 41 4 . 55 74 3 . 4 5 54 4 . 52WOMEN...................................................................... 108 3 . 2 1 59 4 . 83 - - - - - - - - - - - -

J A N I T O R S ............................................................................ 166 3 . 9 6 380 5 . 2 3 30 3 . 9 5 74 5 . 1 5 9 4 . 0 9 17 4 . 0 9 36 3 . 2 8 - -MEN............................................................................ 158 4 . 0 4 344 5 . 29 30 3 . 9 5 68 5 . 1 6 9 4 . 0 9 15 4 . 1 1 33 3 . 3 6 - -WOMEN...................................................................... 8 2 . 4 3 36 4 . 6 7 - - - - - - - - - - - -

LABELERS AND PACKERS......................................... 9 18 4 . 2 6 830 4 . 94 240 4 .3 1 132 5 . 2 4 48 4 . 0 0 68 4 . 16 79 3 . 2 6 48 4 . 2 8MEN............................................................................ 7 4 7 4. 41 624 5 . 0 7 221 4 . 3 6 119 5 . 2 5 36 4 . 2 0 47 4 . 14 45 3 . 6 3 48 4 . 2 8WOMEN...................................................................... 17 1 3 . 6 1 20 6 4. 54 19 3. 70 13 5 . 1 7 12 3 . 4 0 21 4 . 2 0 34 2 . 7 6 - -

LABORERS, MATERIAL HANDLING..................... 522 4 . 2 0 904 4 . 94 155 3 . 9 6 109 5 . 4 0 45 3 . 3 3 32 4 . 5 8 51 3 . 3 5 50 3 . 5 2MAINTENANCE WORKERS, GENERAL

U T I L I T Y ............................................................................ 4 8 2 5 . 3 7 693 5 . 96 100 5 . 4 8 101 5 . 8 8 32 4 . 6 4 35 4 . 8 8 62 5 . 0 2 62 5 . 3 1MI X E R - G R I N D E R S .......................................................... 2 , 1 1 2 4 . 8 8 2 , 016 5 . 5 3 528 4 . 8 6 337 5 . 5 7 123 4 . 4 1 116 4 . 6 4 174 4 . 0 3 230 4 . 6 1

MI X E R S ............................................................................ 8 3 0 5 . 0 1 791 5 . 53 167 4 . 8 0 130 5 . 7 8 61 4 . 5 0 71 4 . 5 8 65 4 . 3 4 - -GR I ND E RS ...................................................................... 2 72 4 . 9 6 38 0 5 . 4 1 74 4 . 9 6 72 5 . 6 6 16 4 . 59 28 4 . 8 4 16 3 . 7 3 - -COMBI NATI ON MI XE R- GRI NDERS.................. 1 ,0 1 0 4 . 7 6 845 5 . 58 287 4 . 8 6 135 5 . 3 3 46 4 . 2 1 - - 93 3 . 8 7 178 4 . 7 8

S H I P P I N G AND RECEI VI NG CLERKS............... 527 5 . 0 3 310 5 . 4 2 144 4 . 8 6 49 5 . 6 4 39 4 . 4 6 18 4 . 6 6 43 4 . 6 7 33 5 . 1 9S H I P P I N G CLERKS.................................................. 158 5 . 2 6 138 5. 30 49 5. 18 22 5 . 6 9 8 5 . 2 5 10 4 . 4 5 12 5 . 6 2 9 5 . 3 0RE CE I VI N G CLERKS............................................... 128 4 . 8 5 129 5 . 4 7 36 4 . 8 5 25 5 . 6 0 8 4 . 5 0 6 4 . 7 7 18 4 . 1 7 13 4 . 4 1S H I P P I N G AND RECEI VI NG CLERKS____ 241 4 . 9 7 43 5 . 6 5 59 4 . 6 1 - - 23 4 . 1 7 - - 13 4 . 4 7 - -

T E C H N I C I A N S .............................................................. 5 1 8 5 . 1 7 691 5 . 21 96 5 . 4 5 154 5 . 5 3 23 4 . 6 0 28 4 . 6 4 73 4 . 3 5 55 4 . 4 8MEN...................................................................... 4 93 5 . 2 2 571 5 . 3 2 90 5 . 5 3 131 5. 64 23 4 . 6 0 24 4 . 64 67 4 . 4 0 53 4 . 52WOMEN................................................................ 25 4 . 0 8 120 4 . 73 6 4 . 2 6 23 • 4 . 8 8 - - - - - - - -

T E S T E R S , PRODUCT ................................................. 2 9 5 4 . 7 5 393 5 . 5 9 68 4 . 7 5 57 5 . 9 1 24 4 . 4 7 17 3 . 8 6 25 3 . 8 4 31 4 . 92MEN...................................................................... 277 4 . 78 358 5 . 6 8 64 4 . 7 9 53 5 . 9 2 20 4 . 4 2 10 3 . 8 8 25 3 . 8 4 30 4 . 9 2WOMEN................................................................. 18 4 . 2 4 35 4 . 6 4 - - - - - - 7 3 . 8 3 - - - -

T H I N N E R S ...................................................................... 114 4 . 7 2 229 5 . 50 18 4 . 3 6 23 5 . 4 0 - - 10 4 . 2 1 29 3 . 6 3 - -T I N T E R S ......................................................................... 6 0 1 5 . 46 504 5 . 8 1 121 5 . 4 6 102 5 . 9 4 31 4 . 7 6 27 5 . 2 0 58 4 . 6 7 38 5 . 10TRUCKDRI VERS ........................................................... 555 4 . 7 8 184 5. 78 92 4 . 7 5 38 6 . 6 5 41 3 . 8 0 30 4 . 7 9 68 3 . 4 2 - -TRUCKERS, POWER ( F O R K L I F T ) ...................... 2 99 4 . 7 8 744 5 . 4 1 62 4 . 5 5 146 5 . 5 4 40 4 . 10 44 3 . 6 8

See footno tes at end of tables,

Digitized for FRASER http://fraser.stlouisfed.org/ Federal Reserve Bank of St. Louis

Table 4 . Occupational averages: By size of establishment— Continued

(N um ber and a v era g e s tr a ig h t -t im e hourly e a r n in g s 1 o f w ork ers in s e le c te d o ccu p ation s in paints and v a r n ish es m anufacturing e s ta b lish m e n ts by s iz e of e s ta b lish m e n t,U nited S ta tes and s e le c te d r e g io n s , N ovem b er 1976)

S outhw est G r e a t L a k e s M idd le W est P a c if ic

E s ta b l i s h m e n ts w ith—

O ccup ation and s e x 2 0 - 9 9 workers 100 w o r k e r s or m o r e 2 0 - 9 9 w o r k e r s 100 w o r k e r s

or m o re 2 0 - 9 9 w o r k e r s 100 wo r k e r s or m o re 2 0 - 9 9 w o r k e r s 100 w o r k e r s

or m o r eNu m­

berof

wo rk- e r s

A v e r ­age

hourlyearn­

ings

Nu m­berof

w ork ­e r s

A v e r ­age

hour lyearn­ings

Nu m ­berof

w o r k ­ers

A v e r ­age

hourlyearn ­ings

Nu m ­berof

w ork ­e r s

A v e r ­age

hourlyearn­ings

Nu m­berof

work ­ers

A v e r ­age

hourlyearn ­ings

Nu m ­berof

w o r k ­ers

A v e r ­age

hourlyearn ­ings

N u m ­berof

work ­e r s

A v e r ­age

hourlyearn­ings

Nu m­berof

w ork ­e r s

A v e r ­age

hour lyearn­ings

DRUB CLEANERS.......................................................... 6 $ 3 . 7 1 27 $ 9 . 9 3 68 $ 5 . 7 6 22 $ 4 . 5 4 9 $ 5 . 6 9FILLERS, BAND......................................................... 89 3 . 8 8 16 $ 9 . 0 7 152 9 . 6 7 922 5 . 9 4 34 $ 4 . 5 2 71 $ 5 . 3 8 124 5 . 6 4 116 5 . 6 2

BEN....................................................................... 89 3 . 8 8 10 9 . 3 9 129 9 . 6 6 906 5 . 4 6 34 4 . 5 2 67 5 . 4 4 124 5 . 6 4 98 5 . 6 6HOBEN...................... ......................................... - - - - 23 9 . 7 9 16 4 . 8 3 - - - - - 18 5 . 4 0

FILLERS, BACBINB.................................................. 57 9 . 1 7 72 9 . 7 8 197 9 . 5 5 968 5 . 5 1 39 4 . 5 1 - - 98 5 . 6 6 67 5 . 7 9BEN....................................................................... 53 9 . 2 1 68 9 . 80 170 9 . 9 1 935 5 . 5 4 38 4 . 4 8 21 4 . 6 3 94 5 . 6 5 55 5 . 9 9HOBEN.................................................................. - - - - - - 33 5 . 2 0 - - - - - - -

JANITORS....................................................................... 15 3 . 0 0 11 9 . 95 91 9 . 3 6 216 5 . 4 6 12 3 . 7 9 30 4 . 9 6 13 5 . 6 4 27 5 . 2 6BEN....................................................................... 15 3 . 0 0 11 9 . 9 5 38 9 . 5 2 191 5 . 5 6 10 3 . 9 9 28 5 . 0 7 13 5 . 6 4 26 5 . 2 5HOBEN.................................................................. - - - - - - 25 4 . 7 2 - - - “ - - -

LABELERS AND PACKERS....................................... 139 3 . 6 8 96 9 . 89 177 9 . 2 9 932 4 . 9 8 82 4 . 5 8 35 4 . 8 2 115 5 . 3 1 64 5 . 5 1REN....................................................................... 119 3 . 8 6 90 9 . 9 5 130 9 . 5 8 30 9 5 . 19 69 4 . 4 5 22 5 . 2 6 92 5 . 3 4 39 5 . 8 2HOBEN.................................................................. - - - - 97 3 . 9 8 128 4 . 4 9 13 5 . 2 6 - - 23 5 . 2 0 - -

LABORERS, BATERIAL HANDLING................... 36 3 . 5 3 29 5 . 10 73 9 . 2 6 903 5 . 3 1 24 4 . 6 6 78 5 . 3 9 80 5 . 5 4 -BAINTENANCE HORKERS, GENERAL

UTILITY....................................................................... 9 3 9 . 2 9 29 5 . 9 6 132 5 . 5 7 329 5 . 9 5 18 5 . 1 9 46 5 . 9 7 56 6 . 4 0 93 7 . 1 1BIXER-GRINDERS....................................................... 213 9 . 0 7 92 5 . 13 553 5 . 0 9 869 5 . 8 7 114 4 . 7 1 150 5 . 2 2 286 5 . 8 8 21 3 5 . 9 6

MIXERS........................................................................ 60 9 . 0 6 - - 292 5 . 2 1 372 5 . 6 3 33 4 . 5 5 68 5 . 3 4 151 5 . 8 9 90 6 . 1 1GRINDERS.................................................................. 16 9 . 8 3 - - 101 5 . 1 9 179 5 . 7 3 21 4 . 7 1 - - 9 5 . 9 1 - -COMBINATION BIXER-GRINDERS................. 137 3 . 9 9 55 9 . 9 3 210 9 . 9 0 318 6 . 2 2 60 4 . 7 9 55 5 . 5 3 126 5 . 8 6 78 6 . 0 6

SHIPPING AND RECEIVING CLERKS.............. 23 9 . 9 9 17 5. 03 139 5 . 3 3 192 5 . 4 8 31 4 . 2 7 15 5 . 4 6 73 6 . 13 34 5 . 6 eSHIPPING CLERKS............................................... - - - - 20 9 . 8 7 68 5 . 2 2 - - 8 5 . 3 4 43 6 . 2 8 18 5 . 5 5RECEIVING CLERKS............................................ 9 9 . 9 0 8 9 . 8 9 27 9 . 6 9 56 5 . 7 7 - - 7 5 . 5 9 21 5 . 9 4 12 5 . 7 9SHIPPING AND RECEIVING CLER KS. . . . 10 9 . 8 9 - - 87 5 . 6 3 18 5 . 5 9 9 5 . 4 0 - - - -

TECHNICIANS............................................................... 9 9 3 . 8 9 15 5 . 3 7 197 5 . 7 1 339 5 . 0 6 25 4 . 4 2 57 5 . 3 2 58 5 . 9 3 43 6 . 37MEN....................................................................... 9 9 3 . 8 9 15 5 . 3 7 191 5 . 7 8 253 5 . 1 7 25 4 . 4 2 - 53 6 . 1 0 37 6 . 4 8HOMEN.................................................................. - - - - - 81 4 . 7 2 - - - - - -

TESTERS, PRODUCT................................................. 35 9 . 3 6 27 5. 17 102 5 . 13 178 5 . 7 0 9 4 . 2 9 46 5 . 5 4 18 5 . 4 7 35 6 . 3 2BEN.................................................................... .. 35 9 . 3 6 25 5 . 2 9 92 5 . 2 9 157 5 . 8 4 9 4 . 2 9 46 5 . 54 18 5 . 4 7 35 6 . 3 2HOBEN.................................................................. - V- - - 10 9. 19 21 4 . 6 9 - - - - - - -

THINNERS.......................................................................... 15 9 .1 1 11 5 . 2 3 - - 150 5 . 5 3 - - - 21 6 . 4 3TINTERS............................................................................. 66 9 . 7 7 39 5 . 6 7 198 5. 69 290 5 . 9 0 28 5 . 6 4 26 5 . 6 5 109 6 . 2 9 33 6 .4 CTRUCKDRIVERS.............................................................. 62 3 . 9 2 16 9 . 9 9 98 5 . 6 0 31 6 . 3 4 41 4 . 5 9 18 6 . 7 3 93 6 . 2 4 29 6 . 4 0TRUCKERS, POHER (FORKLIFT) ....................... 91 9 .0 1 68 5 . 23 56 5 . 2 7 362 5 . 4 9 26 4 . 9 9 66 6 . 12 75 5 . 9 0

1 E x c lu d e s p r e m iu m pay for o v e r t im e and for work on w eekends , ho l id ays , 2 Includes data for reg io ns in addition to th ose shown sep a ra te ly ,and la te sh i ft s .

Digitized for FRASER http://fraser.stlouisfed.org/ Federal Reserve Bank of St. Louis

Table 5. Occupational averages: By labor-management contract coverage and size of establishment

(N um ber and a v e r a g e s tr a ig h t -t im e h ourly e a r n in g s 1 of w ork ers in se le c te d o ccu p a tio n s in paints and v a r n ish es m anufacturing e s ta b lish m e n ts by la b o r-m a n a g em en t co n tra ct c o v e ra g eand s iz e o f e s ta b lish m e n t, U nited S ta tes and se le c te d reg io n s, N ovem b er 1976)

United States 2 Middle At lantic Southeast Great Lakes

E s ta b l i s h m e n ts with—

Occup at ion and s i z eMajori tycovered

None or m in or i ty c o v e re d

Majorityc o v ered

None or m in or i ty co v e re d

Majorityco v e re d

None or m in or i ty c o v ered

Majori tyc o v ered

None or m in or i ty c o v ered

Majorityc o v e re d

^one or m inor ity covered

of e s ta b l i sh m e n t N u m ­berof

w o r k ­e r s

Aver - age

hourly earn -

ings

N u m ­ber

ofw o r k ­

e r s

A v e r ­age

hourlye a r n ­ings

N u m ­berof

work - er s

A v e r ­age

hourly earn - ings

N u m ­ber

ofw o r k ­

e r s

A v e r ­age

hour lye a r n ­ings

N u m ­berof

w o r k ­ers

A v er - age

hourly e a r n ­

ings

N u m ­berof

w o r k ­ers

A v e r ­age

hourlye a r n ­ings

Num - ber

ofw o r k ­

ers

Aver - age

hourly e a r n ­ings

Num - ber of

work - er s

A v e r ­age

hourlye a r n ­ings

Nu m - ber

ofw o r k ­

e r s

A v e r ­age

hourlye a r n ­ings

Num - ber

ofw o r k ­

ers

Aver - age

hourly e a r n ­ing8

DRUM CLEANERS:2 0 - 9 9 WORKERS............ 53 $ 4 . 7 2 50 $ 3 . 2 5 6 $ 4 . 5 2 - - 9 $ 3 . 7 6 - - 19 $ 4 . 9 9 - - 10 $ 5 . 11 - -100 WORKERS OR MORE..... 91 5. 68 24 4 . 3 0 10 5 . 6 3 - - - - - - 59 5 . 8 9 9 00 9 5 . 6 9 - •

FILLERS, HAND:2 0 - 9 9 WORKERS............ 417 4. 88 2 62 3 . 7 8 127 4 . 3 3 - - 1 1 4 . 6 4 62 $ 3 . 0 6 97 4 . 88 55 4 . 3 0 104 5 . 7 4 20 $ 5 . 1 1100 WORKERS OR MORE..... 644 5 . 2 9 188 4 . 9 9 55 5 . 5 5 - - 72 4 . 1 9 - - 306 5 . 4 3 116 5 . 4 6 1 16 5 . 6 2 - -

FILLERS, MACHINE:2 0 - 9 9 WORKERS............ 474 4 . 7 5 29 8 3 . 8 1 157 4 . 0 6 24 $ 4 . 1 6 - - 52 3 . 51 112 5 . 3 1 85 3 . 5 5 98 5 . 6 6 “100 WORKERS OR MORE..... 770 5 . 3 8 223 5 . 1 4 214 5 . 4 3 - - 41 4 . 4 5 25 4 . 1 6 380 5 . 4 8 88 5. 66 67 5 . 7 9 - *

JANITORS:2 0 - 9 9 WORKERS............ 80 4 . 5 8 86 3 . 3 9 22 3 . 9 8 8 3 . 8 8 13 4 . 0 1 23 2 . 8 6 17 5 . 2 4 24 3 . 7 3 13 5 . 6 4 -100 WORKERS OR MORE..... 324 5. 30 56 4 . 83 71 5 . 1 3 - - - - - - 180 5 . 50 36 5 . 2 8 27 5 . 2 6

LABELERS AND PACKERS:2 0 - 9 9 WORKERS............ 555 4 . 67 363 3 . 6 4 212 4 . 3 0 28 4 . 3 4 1 8 3 . 9 5 6 1 3 . 0 5 104 4 . 7 2 73 3 . 6 6 106 5 . 4 4 “ -100 WORKERS OR MORE.....

LABORERS, MATERIAL HANDLING:584 5 .0 1 246 4 . 7 7 112 5 . 1 5 25 4 . 2 8 - 293 4 . 9 8 139 4 . 9 9 64 5 . 5 1

2 0 - 9 9 WORKERS............ 296 4 . 54 226 3 . 7 7 117 3 . 9 3 38 4 . 0 6 9 4 . 1 3 42 3 . 18 41 4 . 3 4 32 4 . 1 5 73 5 . 5 4 *100 WORKERS OR MORE.....

MAINTENANCE WORKERS, GENERAL740 4 . 9 3 164 5 . 0 2 94 5 . 3 2 “ 35 3 . 3 7 15 3 . 8 8 315 5 . 3 5 88 5 . 1 8 '

UTILITY:2 0 - 9 9 WORKERS............ 2 97 5. 65 185 4 . 9 1 87 5 . 4 1 - - 24 5 . 0 9 38 4 . 9 8 88 5 . 7 6 44 5 . 1 7 48 6 . 4 8 8 5 . 9 3100 WORKERS OR MORE..... 537 6 . 12 156 5 . 4 1 85 5 . 8 4 - - 38 5 . 6 9 24 4 . 7 0 262 6 . 0 1 62 5 . 7 0 93 7 . 1 1

MIXER-GRINDERS:2 0 - 9 9 WORKERS............ 1 , 2 9 3 5. 12 819 4 . 50 426 4 . 7 6 102 5 . 2 6 43 4 . 4 4 131 3 . 90 365 5 . 2 5 188 4 . 7 7 2 38 5 . 9 1 48 5 . 7 0100 WORKERS OR MORE..... 1 , 5 7 6 5 .6 1 440 5 . 2 2 319 5 . 5 6 - - 126 4 . 9 1 104 4 . 2 5 693 5 . 8 3 176 6 . 0 1 213 5 . 9 6 * *

MIXERS:2 0 - 9 9 WORKERS............ 465 5 . 3 3 365 4 . 6 1 131 4 . 9 2 36 4 . 3 9 - - 63 4 . 32 110 5 . 4 9 132 4 . 9 8 139 5 . 9 3 -100 WORKERS OR MORE..... 620 5. 61 171 5. 21 115 5 . 7 7 - - - - - - 285 5 . 5 9 87 5 . 7 9 90 6 . 1 1 *

GRINDERS:2 0 - 9 9 WORKERS............ 152 5. 19 120 4. 66 36 4 . 2 9 - - - - 14 3 . 5 2 69 5 . 7 0 32 4 .C 8 9 5 . 9 1 * *100 WORKERS OR MORE.....

COMBINATION MIXER-GRINDERS:301 5 . 5 8 79 4 . 7 7 69 5 . 6 6 ~ ~ 137 5 . 9 0 42 5 . 1 6 ~ '

2 0 - 9 9 WORKERS............ 676 4. 97 334 4 . 3 3 259 4 . 7 5 - - 39 4 . 3 7 54 3. 51 186 4 . 9 4 24 4 . 5 8 90 5 . 8 8 36 5 . 8 0100 WORKERS OR MORE.....

SHIPPING AND RECEIVING CLERKS:655 5 . 6 3 190 5 . 4 1 135 5 . 3 3 ~ 124 4 . 9 2 271 6 . 0 5 * 78 6 . 0 6

2 0 - 9 9 WORKERS............ 323 5. 38 204 4 . 4 6 112 5 . 0 1 32 4 . 3 6 16 4 . 79 27 4 . 59 98 5 . 4 8 36 4 . 9 1 66 6 . 2 9 “ -100 WORKERS OR MORE..... 237 5. 41 73 5. 44 45 5 . 6 2 - - 21 5 . 2 8 12 5 . 0 3 112 5 . 33 30 6 . 0 6 34 5 . 6 8

SHIPPING CLERKS:2 0 - 9 9 WORKERS............ 95 5 . 7 1 63 4 . 56 40 5 . 2 9 9 4. 68 - - - - - - - 40 6 . 4 0 - -100 WORKERS OR MORE..... 112 5. 39 26 4. 91 20 5 . 6 8 - - - - 6 5. 1 1 61 5 . 26 7 4 . 8 5 18 5 . 5 5 *

RECEIVING CLERKS:2 0 - 9 9 WORKERS............ 78 5. 16 50 4. 37 30 4 . 7 0 6 5 . 6 3 - - 12 3 . 8 5 16 5 . 0 3 11 4 . 2 0 18 6 . 2 4100 WORKERS OR MORE.....

SHIPPING AND RECEIVING CLERKS:98 5 . 3 5 31 5 . 85 23 5 . 5 9 " 7 3 . 9 6 6 4. y 4 41 5 . 4 0 “ “ 12 5 . 7 9

2 0 - 9 9 WORKERS............ 150 5 . 2 9 9 1 4. 44 42 4 . 9 6 17 3 . 7 5 6 4.28 - - 75 5 . 5 6 12 6 . 0 4 “ *100 WORKERS OR MORE..... 27 5 . 7 5 16 5 . 4 8 - - - - - - - - 10 5 . 4 2 - - ~

TECHNICIANS:2 0 - 9 9 WORKERS............ 3 18 5 .4 1 200 4 . 7 9 76 5 . 3 6 20 5 . 7 9 39 4.46 34 4 . 2 3 102 5 . 6 2 45 5 . 9 3 54 5 . 9 0 * -100 WORKERS OH MORE..... 500 5. 31 191 4. 97 103 5 . 6 2 35 4 . 6 5 268 5 . 10 66 4 . 9 3 43 6 . 3 7

S ee footn otes at end of ta b le .

Digitized for FRASER http://fraser.stlouisfed.org/ Federal Reserve Bank of St. Louis

Table 5. Occupational averages: By labor-management contract coverage and size of establishment— Continued

(Num ber and a v e r a g e s t r a i g h t - t im e hourly e a r n i n g s 1 of w o r k e r s in se le c te d occupat ions in paints and v a r n i sh es man ufacturing e s ta b l i sh m e n t s by lab o r -m a n a g e m e n t contract cov e ra g e and s i z e of e s ta b l i sh m e n t , United States and s e l e c te d regions , Novem ber 1976)

United States 2 Middle Atlantic Southeast Great Lakes Pac i fi c

E s ta b l i s h m e n ts with—

Occup at ion and s i z e of e s ta b l i sh m e n t

Majori tycovered

None or m inori ty covered

Majori tycovered

None or m in or i tyered

Majori tyco v e re d

None or cov

m in or i tyered

Majori tyc o v ered

None or m in or i ty c o v ered

Majori tycovered

None or m inor ity co v ered

N u m ­berof

w o r k ­e r s

A v e r ­age

hourly earn - ings

N u m ­berof

work - ers

Aver - age

hourly earn - ings

N u m ­berof

w o r k ­e r s

A v e r ­age

hourly earn -

ings

N u m ­ber

ofw o r k ­

ers

A v e r ­age

hourlye a r n ­

ings

N u m ­berof

w o r k ­e r s

Aver - age

hourly e a r n ­ings

N u m ­ber

' of w o r k ­

ers

Aver - age

hourly earn - ings

N u m ­berof

w o r k ­e r s

Aver - age

hourly e a r n ­ings

N u m ­berof

w o r k ­ers

A v er - age

hourly earn - ings

N u m ­berof

w o r k ­e r s

A v e r ­age

hourly earn - ings

N u m ­berof

wo rk- er s

A v e r ­age

hourlye a r n ­ings

TESTERS, FEODUCT:158 $ 4 . 8 6 137 $ 4 . 63 52 $ 4 . 6 3 16 $ 5 . 1 3 6 $ 4 . 9 1 19 $ 3 . 5 0 42 $ 5 . 2 9 60 $ 5 . 0 2 17 $ 5 . 4 42 7 3 5 . 7 0 12 0 5 . 3 4 57 5 . 9 1 - - 17 5 . 3 5 14 4 . 4 1 110 5 . 5 2 68 6 . 0 0 35 6 . 3 2 - -

THINNERS:75 5 . 2 5 39 3 . 6 9 14 4 . 14 23 3 . 35 . . . . _ . _ .

187 5. 66 42 4 . 8 1 23 5 . 4 0 _ - - - - - 122 5 . 68 28 4 . 8 9 21 6 . 4 3 - -

TINTERS:392 5 . 7 4 209 4 . 9 4 105 5 . 4 5 16 5 . 52 16 5 . 2 5 42 4 . 4 5 113 5 . 9 1 35 4 . 7 7 87 6 . 3 8 22 $ 5 . 96321 5. 94 183 5. 57 85 5 .9 1 _ . 12 5 . 5 1 Z b 4 . 90 141 6 . 0 7 99 5 . 6 5 33 6 .4 C - -

TRUCKDRIVERS:257 5. 39 298 4 . 2 4 82 4 . 7 7 10 4 . 5 6 19 4 . 4 5 49 3 . 0 2 56 5 . 6 1 42 5 . 58 61 6 . 4 5 32 5 . 8 4122 6 . 3 8 62 4 . 6 1 38 6 . 6 5 - - - - - - 27 6 . 3 1 - - 29 6 . 4 0 - -

TRUCKERS, FCWER (FORKLIFT) :175 5 . 2 5 124 4. 12 43 4 . 2 5 39 3 . 5 9 40 5 . 3 9 _ _ 64 6 . 1 3 _

614 5 . 4 9 130 5 . 0 2 145 5 . 5 4 _ - _ - - 302 5 . 4 9 60 5 . 5 0 75 5 . 9 0 - -

1 E x c lu d e s p r e m iu m pay for o v e r t i m e and for work on w e e k e n d s , ho lidays , and la te sh i ft s . NOTE: Da sh es indicate no data repo rted or data that do not m ee t publication c r i t e r ia .2 Includes data for r eg io n s in addition to those shown separate ly .

Digitized for FRASER http://fraser.stlouisfed.org/ Federal Reserve Bank of St. Louis

Table 6. Occupational earnings: Atlanta, Ga.

(N um ber and a v era g e s tr a ig h t -t im e hourly earn in gs 2 of w ork ers in se le c te d o ccu p ation s in paints and v a r n ish es m anufacturing e s ta b lish m e n ts , N ovem b er 1976)

1 The Atlanta Standard Metropol itan Sta ti s ti ca l Area c o n s is t s of Butts , Ch erokee , Clayton, Cobb, DeKalb , Dou gla s , F a y e t te , F o r s y th , Ful ton, Gwinnett, Henry, Newton, Paulding, Rockd ale , and Walton C o u n t i e s .

2 E x c lu d e s p r e m i u m pay for o v e r t im e , and for work on w e e k e n d s , h o l id ays , and late shi fts . T h e s e s u r v e y s , b a s e d on a r e p r es e n ta t iv e sam p le of e s ta b l i sh m e n ts , are des ign ed to m e a s u r e the l ev e l of o ccu p at io n a l e a r n in g s at a p ar t ic u lar t im e . Thus , co m p a riso n s with prev io u s s tu d ie s may not

r e fl ect exp ec te d wage m o v em e n ts b e c a u s e of change in the s a m p le c om p osi t io n , and shifts in employm ent among es ta b l i sh m e n ts with di ffe ren t pay l e v e l s . Such s h i f t s , for e x a m p le , could d e c r e a s e an occupat ional a v e r a g e , even though m o st e s ta b l i sh m e n ts in c r e a s e d w a g e s be tw een p er io d s be ing compared. All of the product ion w o r k e r s c o v e re d by the s u rvey w e r e paid on a t im e b a s i s .

Data not shown s e p a r a te ly by s e x indicate a l l or v ir tu a l ly a l l w o r k e r s a r e men.

Digitized for FRASER http://fraser.stlouisfed.org/ Federal Reserve Bank of St. Louis

Table 7. Occupational earnings: Baltimore. M d .1

(N um ber and a v e r a g e s tr a ig h t -t im e h o u r ly ea rn in g s 2 of w o rk ers in se le c te d occupations in paints and v a r n ish es m anufacturing e s ta b lish m e n ts , N ovem b er 1976)

1 The B a ltim o r e Standard M etro p o lita n S ta tis t ic a l A rea c o n s is t s of B a ltim o re C ity , and Anne 2 See tab le 6, footn ote 2.A ru n d el, B a lt im o r e , C a r r o ll, H arford , and H oward C ou nties. 3 Data not shown se p a r a te ly by sex in d icate a l l or v ir tu a lly a l l w o rk ers a re m en.

Digitized for FRASER http://fraser.stlouisfed.org/ Federal Reserve Bank of St. Louis

Table 8. Occupational earnings: Chicago, III.1

(N um ber and a v e r a g e s tr a ig h t -t im e hourly earn in gs 2 of w ork ers in se le c te d occu p ation s in paints and v a r n ish es m anufacturing e sta b lish m en t.; , N ovem ber 1976)

Occupation and sex 3Number Average

NUME ER 01 WOR KERS 1ECEIVING STRAIGHT-TIME HOURLY EARNINGS IN DOLLARS) OF- .of

workershourly

earnings2 UNDER AND3 . 6 0 3 . 8 0 y . o o y . "20 y . y c y . 6 0 y . 8 0 5.CO 5 . 2 0 5 . y o 5 . 6 0 5 . 8 0 6 . 0 0 6 . 2 0 6 . 9 0 6 . 6 0 6 . 8 0 7 . 0 0 7 . 9 0 7 . 8 0 8 . 2 0 8 . 6 0

3 . 0 0 UNDER _ AND3 . 2 0 3 . y o 3 . 6 0 3 . 8 0

oo3- y . 2 C y . y o y . 6 C y . a o 5 . 0 0 5 . 2 0 5 . y o 5 . 6 0 5 . 8 0 6 . 0 0 7 4 0OVER

ALL PROD UCTION WORKERS............... 3 , 0 4 9 $ 5 . 1 3 3 73 0

i y 99 25 7

1 5 0 1 5 7 2 16 2 y 7 3 0 9 1 8 9

7 8 0—

MEN............................... 32 5 6 337 3 8 2 2 3 4 1 3 5 33 3 9 2 7 1 5 3 2 1 1

WOMEN............................ u . 5 91 2 9 1 9 3 1 9 9 2 9 5 1 6 7 2 3 5 2 9 2 3 7 1 2 2 7 1 3 9 3 3 3 9 2 7 1 5 3 2 1 1 2 12 5 3 2 8 2 3 y a 1V 1 7 2 1 y 5 1 1 7 1

SELECTED PRODUCTION OCCUPATIONS

DRUM CLEANERS.......................... 2 5 2 3

1 8 5 1 6 2

2 3

'I VI4 . 6 1

** • - 8 3 3 2 - 2 1

FILLERS, HAND....................... " 1 * 11 9

8 - 3 3 2 - 2 1 - - - _ _ _y . 8 3 y . 8 5

3 4 1 8 1 5 i y 12 7 6 y 5 - 5WOMEN............................ - _ -

3 _ 7 1 36

3 y 1 6 1 5 i y 3 1 6 y 5 - 5 - - - - - - - - -FILLERS, MACHINE................... 120

1105 . y 1 5 . 3 9

- - 3 i - 1 2 1 - 5 12 • 1 3 2 6 y 2 9 4 1JANITORS .................................................. “ 3 1 “ 1 2 1 * 5 1 2 1 3 1 6 9 2 9 4 1 _ _ _ _

MEN.................................................. 4*5465

5 6 2 9 - 4 6 2 - - - - _ _ _2 1 9 y . 6 2

* 5 4 2 7 - 4 6 - 2

MEN..................................................... ■ “ 4 7 8 6 7 4 1 27 8 17 9 2 10. 1 3 1 3 _ _ _ _WOMEN............................ y * 3 3

2 25 62 3

~ 1 2 1 1 4 15 3 8 - 1 2 3 -• - - _ _ _ _LABORERS, MATERIAL HANDLING........ 1 5 0 y . 8 1 2

6 6 2 16 4 2 4 10 1

MAINTENANCE WORKERS, GENERAL 3 8 3 5 5 9 1 1 20 1 y 2 3 1 ~ - - - - - _UTILITY..........................

MIXERS............................. ' “ 1 3 7 9 10 8 1 5 3 5 16 1.2 7 _ 1 _GRINDERS........................... t ^ j “ 9 7 5 13 3 2 1 8 20 1 7 7 7 19 1 - _ _COMBINATION MIXER-GRINDERS...”...... 1 0 5 5 . y 7

2 7 6 9 10 21 ~ 2 8 2SHIPPING CLERKS....................... 1 2 3 18 “ 1 8 19 2 7 9 - - - _ 4 _

MEN............................... “ 8 4 6 3 3 _ 3RECEIVING CLERKS................. 1 5

“ 8 2 6 3 3 3MEN............................ ” 4 ~ 4 - 2 ~ - 3 - 2 _ _

SHIPPING, AND RECEIVING CLERKS...... 3 3 5 . 5 74 “ y ' 3 - 2 - _ _ _

MEN............................ _ 6 ~ 3 5 4 4 - y 4 - _ _ _TECHNICIANS....................... 10

“ b 3 5 2 4 - 4 4 _ _ _MEN ............................ 2 7 2 5 1 5 9 10 1 1 5 5 9 18 2 i y _ 1WOMEN............................. 5*02 2

10 5 20 1 1 9 9 10 3 3 4 1 7 2 1 4 _ 1 3TESTERS. PRODUCT............ _ 8 1 5 . 0 0 5

2 5 4 1 1 2 2 5 1 - - _ _MEN........................... 9 4 5 8 13 6 10 5 6 1 1 _ 3 _ _ _WOMEN............................ ̂ ^ ~ 3 5 2 5 b 1 3 5 8 5 6 1 1 _ 3 _ _

THINNERS............................ 5 * 2 62 4 2 _ 2 - 1 2 ~ - - - _

8 620

5 . 6 97 . 5 7

” 2 2 “ 3 9 3 7 7 19 - 3TRUCKDRIVERS..................... * 4 1 1 “ 1 2 3 2 3 9 20 8 10 10 5 7 - _ _ _ _TRUCKERS, POWER (FORKLIFT)..........1 1 6 7 5 . 3 1 - * - - - - 3 1 1 3 8 31 7 8 3 9 2 4 33

y 1 “ 19 “

McHenryThandC WCiri8 CounUde s ! d M e tr ° P° litan S U t l s t i c a l Area c o n s ts t s of Cook, Du Page , Kane, Lake, 2 See table 6, footnote 2.Data not shown s e p a r a te ly by sex indica te a l l or vi r tua l ly a ll w o r k e r s are men.

Digitized for FRASER http://fraser.stlouisfed.org/ Federal Reserve Bank of St. Louis

Table 9. Occupational earnings: Cleveland, O hio1

(N um ber and a v era g e s tr a ig h t -t im e hourly earn in gs 2 of w ork ers in s e le c te d occu p ation s in paints and v a r n ish e s m anufacturing e s ta b lish m e n ts , N ovem b er 1976)

NUMBER OP WORKERS RECEIVING S TRAIG HT-TIM E HOURLY EARNINGS ( IN DOLLARS) OF—

Occupation and sex3 Numberofworkere

Average hourly earnings 2

2.30AND

UNDER2.40

2. 40

2.60

2.60

2.80

2.80

3.00

3.00

3.20

3.20

3.40

3.40

3.60

3

3.

60

80

3.80

4. 00

4.00

4. 20

4. 20

4. 40

4.40

4. 60

4.60

4. 80

4.80

5.00

5.00

5.20

5. 20

5.40

5.40

5.60

5.60

5.80

5.80

6.00

6.00

6.20

6.20

6.40

6 .40

6.60

6.60

6.80

6.80

7.00

7.00

7.20

7.20ANDOVER

ALL PRODUCTION WORKERS............ 1,253 *5.11 54 _ 8 4 6 11 38 23 75 70 37 101 29 22 36 36 98 165 283 42 9 55 32 12 4 3HEN........................... 1,051 5. 37 - - 5 4 6 11 35 21 19 45 35 65 27 22 35 32 96 154 282 42 9 55 32 12 4 3WOMEN.......................... 2 02 3.75 54 - 3 - * * 3 2 56 25 2 36 2 - 1 4 2 11 1 “ * _ ”

SELECTEE PRODUCTION OCCUPATIONSDRUM CLEANERS..................... 7 5. 12 - - - - - - - 1 - 1 - - - - - 1 - 4 - - - - - - - -FILLERS, HAND..................... 20 4.86 - - ~ - - - - 6 2 - - - - - 9 3 - ~ “ “FILLERS, MACHINE.................. 153 4.66 27 - - - ~ - 13 - “ - 12 - 5 18 9 3 5 55 2 - ~ 4 “ “

HEN.......................... 11 8 5.17 - - - - - - 13 - - 11 - 4 18 8 - 4 55 1 - 4 - -LABELERS AND PACKERS....................................... 79 4.30 21 - - - - - - 2 2 12 4 4 - - - - 5 28 1 “

HEN........................................................................ 35 5.19 4 4 4 - - - - 5 17 1 - -WOMEN.................................................................. 44 3.59 21 - - - - 2 2 8 - - - - - - 1 1 “ - “ - -

MAINTENANCE WORKERS, GENERALUTILITY....................................................................... 90 5.71 - - - - - - - - - - 1 - 7 - 4 2 2 7 3 10 ~ 1 1 - 2

COMBINATION MIXER-GRINDERS...................... 76 5. 34 - - - - _ - 4 - 5 3 5 1 10 - 6 - 8 1 2 13 - 18 - - - -RECEIVING CLERKS.................................................. 19 5.02 - - - - - - 3 - - 4 - 1 - 1 5 4 - 1 - “ -

SHIPPING AND RECEIVING CLERKS.............. 19 5.20 - - - - - - - - - 2 - 5 - - - 2 4 4 2 - - - - -TESTERS, PRODUCT.................................................. 15 3.47 3 - - 1 6 1 - - - 2 - - 2

__TRUCKDRIVERS............................................................ 1 1 4.54 - * * - - 5 - * * - - - 4 - 2 - - - -

1 The C levelan d Standard M etrop o litan S ta tis t ic a l A rea c o n s is t s of Cuyahoga, G eauga, Lake, 2 See tab le 6, footnote 2.and M edina C o u n ties. 3 Data n o t show n se p a r a te ly by s e x in d icate a l l or v ir tu a lly a l l w o rk ers are m en.

Digitized for FRASER http://fraser.stlouisfed.org/ Federal Reserve Bank of St. Louis

Table 10. Occupational earnings: Dallas—Ft. W orth, Tex.

(N um ber and a v e r a g e s tr a ig h t-t im e h o u rly earn in gs 2 of w o rk ers in s e le c te d o ccu p ation s in paints and v a r n ish es m anufacturing e s ta b lish m e n ts , N o v em b er 1976)

O ccup ation and s e x 3

AIL PRODUCTION WORKERS. BEN...............

SELECTEE PRODUCTION OCCUPATIONSFILLERS, HACHINE.............JANITORS.....................LABELERS AND PACKERS.........LABORERS, HATERIAL HANDLING... MAINTENANCE WORKERS, GENERALUTILITY.....................

MIXERS.......................COMBINATION MIXER-GRINDERS.... SHIPPING AND RECEIVING CLERKS.TECHNICIANS..................THINNERS.....................TINTERS......................TRUCKDRIVERS.................TRUCKERS, POWER (FORKLIFT)....

797793

hourlyearnings'

$ 4 . 9 94 . 9 9

4 . 7 84 . 9 94 . 9 84 . 3 5

5 . 5 2 4 . 9 5 5 . 15 4 . 8 6 5 . 425 . 3 5 5 . 7 3 4 . 4 2 5 . 4 5

NUMBER OF WORKERS RECEIVING STRAIGHT-TIME HOURLY EARNINGS (IN DOLLARS) OF —2: ! ° 2 . 6 0 I 2 . 8 0 3 . 0 0 1 3 .2 0 | 3 . 4 0 I 3 . 6 0 I 3 . 8 0 I 4 . 0 C I 4 . 2 0 I 4 . 4 0 |4.6 0 4 . 8 0 [5 . 00 5 . 2 0 5. 40 5 . 6 0 | 5 . 80 I 6 . 0 0 |6 . 20 6 . 4 0 16 . 6 0 6 . 8 0

188185

Denton r f v F V y f o r t h Standard M etropolitan S ta tis t ic a l A rea c o n s is t s of C o llin , D a lla s,Denton, E l l i s , Hood, Johnson, Kaufm an, P a rk er . R ockw all. T arrant, and W ise C o u n tie s . See tab le 6, footnote 2.

Data not shown se p a r a te ly by se x in d ica te a l l or v ir tu a lly a ll w o rk ers are m en .

Digitized for FRASER http://fraser.stlouisfed.org/ Federal Reserve Bank of St. Louis

Table 11. Occupational earnings: Detroit, M ich .1

(N um ber and a v e r a g e s tr a ig h t -t im e h o u rly earn in gs 2 of w o rk ers in se le c te d occu p ation s in paints and v a r n ish es m anufacturing e s ta b lish m e n ts , N ovem b er 1976)

NUMBER OF JfORKEBS RECEIVING S TRAIG HT-TIM E HOURLY EARNINGS ( IN DOLLARS) OF —Occupation and sex 3 of

workershourly earnings 2 UNDER

9.90a. aoAND

UNDER9. 50 9. 60 4. 70 4. 80 4.90 5. 00 5. 1C 5.20 5.30 5. 90 5.50 5.60 5.80 6. 00 6.20 6.90 6.60 6.80 7.00 7.20 7.90 7.60 7.80 8.00

AND9.50 9. 60 9.70 9.80 9.90 5.00 5.10 5.20 5.30 5.90 5.50 5.60 5.80 6.00 6.20 6.90 6. 60 6. 80 7. 00 7. 20

ALL PRODUCTION WORKERS............ 1,283 $6.38 69 3735

38 99 19MEN............................ 20 109 79 79 36 21 109 107 18 21 152 50 192 16WOMEN......................... 61 !r 32 44 19 105 79 79 36 21 101 107 18 21 152 50 192 16TO TO 12 6 “ 9 - - 3 - - - - _ _

SELECTED PRODUCTION OCCUPATIONSFILLERS, HAND..................... 68

90815753923033

FILLERS, MACHINE..... ............. 5.775.89 15

19* 6 20 12 ~ - ~ - - - 28 _ _ _

MEN.......................... 8 6 6 31 - - - - - _ _JANITORS.......................... ” 8 ~ - 6 6 31 - - - - _ _ _

MEN........................... 2 “ ~ 6 5 - 9 - • - - 22 - _ _LABELERS AND PACKERS.............. 5.70 A 8l — " 6 5 * - - 9 - - - 22 - - -

MEN........................... 10 “ ~ 2 6 - 19 - - - _ _ _LABORERS, MATERIAL HANDLING....... 6.53 _ _ _ _ “ ~ 2

106 - - - 19 - - - - - -

MAINTENANCE WORKERS, GENERAL * 19 ~ ~ 9 ~UTILITY.......................... 59

66 91 75 6 1 53 35 29 6

6. 80MIXERS............................. 19 1 1

~ 4 3 ~ 10 ~ 9 15 - - - 2 _ 16 _GRINDERS.......................... 6. 13

6.39 6.20

6 10 6 - 9 16 5 - - - - _COMBINATION MIXER-GRINDERS........ _ 6 _ 8 22 - - 99 - - - - - -TECHNICIANS....................... ~ ” 15 12 10 ~ - - 29 - _ _

MEN.......................... 2 2 1 7 19 3 2 6 - - _ 10 _TESTERS, PRODUCT.................. 5.97

6.055.55

2 2 2 1 7 19 ~ 3 2 6 - - - 10 _MEN.......................... 2 “ ~ 1 4 - 7 10 1 - 1 - _ _WOMEN......................... 2 _ _ “ “ ” 1 4 * 9 10 1 - 1 - -

TINTERS........................... 639997

8 3 - - - - - - _TRUCKDRIVERS...................... 6.30

6. 2210 16 12 9 - - 1 1 _ _ 2 _

TRUCKERS, POWER (FORKLIFT)........ 3 9 “ 13 2 - - - 7 - 9 _ 2 _“ 1 19 - * 19 - 8 - -

The D e tr o it Standard M etro p o lita n S ta tis t ic a l A rea c o n s is t s of L a p eer , L iv in g sto n , M acom b, 2O akland, St. C la ir , and W ayne C ou n ties. • ’ 3 See tab le 6, footnote 2.

Data not shown se p a r a te ly by se x in d icate a ll or v ir tu a lly a l l w o rk ers a re m en.

Digitized for FRASER http://fraser.stlouisfed.org/ Federal Reserve Bank of St. Louis

Table 12. Occupational earnings: Los Angeles—Long Beach, Calif,

(N um ber and a v era g e s tr a ig h t -t im e h ou rly earn in gs 2 o f w o rk ers in s e le c te d o ccu p ation s in paints and v a r n ish es m anufacturing e s ta b lish m e n ts , N ovem b er 1 976)

Numberof Averagehourly

NUME ER OI WORK ERS RECEIVING STR A IG H T-TIM E HOURLY EARNI NGS (IN DOLLARS) OF--O c c u p a tio n and s e x 3 2 .8 0 2 . 90 3 .0 0 3 .1 0 3 .2 0 3 .3 0 3 .9 0 3 .5 0 3 .6 0 3 .7 0 3 .8 0 9 .0 0 9 .2 0 9 .9 0 9 .6 0 9 .8 0 5 .0 0 5 .2 0 5 .9 0 5 .6 0 5 .8 0 6 .0 0 6 .2 0 6 .9 0 6 .6 0 7 .0 0

workers earnings2 UNDER2 .9 0 3 .0 0 3 . 10 3 .2 0 3 .3 0 3 . 90 3 .5 0 3 .6 0 3 .7 0 3 .8 0 9 .0 0 9 .2 0 9 .9 0 9 .6 0 9 .8 0 5 .0 0 5 .2 0 5 . 90 5 .6 0 5 .8 0 6 .0 0 6 .2 0 6 .4 0 6 .6 0 7 .0 0

ANDOVER

1 ,8 2 51 ,6 9 7

$ 5 . 98 5 .5 2

55 21 58 15 10776

7768

3635

151126

216205

191189

391389

99 190 67 39 18l-a 2-5 93 190 67 33 1 8

SELECTED PRODUCTION OCCUPATIONS

25131121106

90 29

1 16 7591

9 .6 2 5 .3 8 5 . 95 5 .5 55 .6 3 5 .1 9 5 . 10 5 .1 8 9 . 96

1919

6 “ “ “ “ - -28281512

10 55 1 ■ 310 53 “ ■ 1 **■ 3

“ 12 59 1 “” 12 55 1 “ “

?12

61310

”1819

3 n1712

“ ’ ~ “MEN........................................................................ z. 9 20 2 1 ~ “

122 1 ~

MAINTENANCE WORKERS, GENEBAL •4 5 5 3 ~ ~ “

65180

59912356961027768069

6 .1 05 .7 75 .6 5 5 .8 15 .6 5 5 . 866 .0 5 9 .9 75 . 396 .0 66 . 16 5 .7 5

3 20 22MIXERS.................................................. .......................... 122 4 1

126 5 2

50 3 85 5 4 _6 “ 5 4 3 1 " 2 ~ “ ““ 5 “ 2 1 1 1 1 4

TE C HNIC IANS............................................................ .. " ~ 4 “ 4 10 ~ "

2“ 2 9 5

WOMEN.................................................................. 6 2 8 4 5“ ~ 1 ~

6 6 ~ 4 ” 26 * 1 1 36 10 3 ~

TRUCKERS, POWER (F O R K L IF T )......................6

311 228

17 27 18 * “

1 The Los A n g eles—Long B each Standard M etropolitan S ta tis tic a l A rea c o n s is t s of L os A n g eles C ounty.

2 See tab le 6, foo tn ote 2.

Data not shown se p a r a te ly by se x in d icate a ll or v ir tu a lly a l l w ork ers a re m en. W orkers w e r e d istr ib u ted as fo llo w s: 3 at $ 7 to $ 7 .4 0 ; and 2 at $ 7 .8 0 to $ 8 .2 0 .

Digitized for FRASER http://fraser.stlouisfed.org/ Federal Reserve Bank of St. Louis

Table 13. Occupational earnings: Louisville, Ky.—Ind

(N um ber and a v e r a g e s tr a ig h t -t im e h o u r ly e a rn in g s 2 of w o rk ers in se le c te d occu p ation s in paints and v a r n ish es m anufacturing e s ta b lish m e n ts , N ovem b er 1976)

hourly earnings 2

NUKE ER OF WORK ERS ECEIVING STR AIGHT-T IME HOURLY EARNI NGS ( I N DOLLARS) OF--O c c u p a t i o n and s e x 3 of

workers2 . 7 0

ANDUNDER

2 . 80 2 . 9 0 3 . 00 3 . 1 0 3 . 2 0 3 . 3 0 3 . 9 0 3 . 5 0 3 . 6 0 3 .7 0 3. 80 3 . 9 0 9 . 0 0 9 . 1 0 9 . 2 0 9 . 9 0 9 . 6 0 9 . 8 0 5 .0 0 5 . 2 0 5 . 9 0 5 . 6 0 5 . 8 0 6 . 0 0 6 .2 0AND

2 . 8 0 2 .9 0 3 . 0 0 3. 10 3 . 2 0 3 . 3 0 3 .9 0 3 . 5 0 3 . 6 0 3 . 7 0 3 . 8 0 3 .9 0 9 . 0 0 9 . 10 9 . 2 0 4 .4 0 4 . 6 0 4. 80 6 20ALL PRODUCTION HORKEBS................................. 596

5 201 9 . 6 6

9 . 6 71313

14 1 1715

19 92 97HEN............................ .. ........................................... 6198 92 11 2 2 1 1 31 3 19 92 95 185 89 11 2 2 1 i 3

SELECTED PRODUCTION OCCUPATIONS

F IL L E R S , H A N D . . . . * ................. ........................... 38 21 16 15 9639 91

9 . 6 0 9 . 8 3 9 . 3 9 9 .3 1 9 . 69 9 . 7 5 9 . 16

16F I L L E R S , MACHINE.................................................. 3 16 - - - - - _ _JA NITOBS....................................................................... “ 2 18 - - - - _ _

~ 11

3 3 6 - - - - - - _3 * 3 3 5 - - - - - - -HEN....................* ................................................. 3 1 • “ 4 3 19 20 * - - - - - _

104 3 13 19 - - - - - _

HAINTENANCE HOSKEHS, GENERAL 7 3 16 - - - - - - -U T I L I T Y ....................................................................... 21

6627

5 . 0 79 . 8 99 . 9 0 9 . 8 9 9 .8 7 9 . 7 9 9 .3 99 .9 1 9 .6 9 5 .0 3 9 .8 1

MIXERS............................ ..................... j . . . ................ 1 * 6 10 9 - - - - -GRINDERS....................* ................................................. ~ ~ 1 9 99 12 - - - - - -S H IPPIN G CLERKS.................................................... 7 1 7 10 10 - - - - _

MEN...............................* ...................................... 6 ~ 9 2 - - - - _RECE IVING C L E R K S . . . . . .................................... 9 1 _ 9 1 - - - . _S HIPPIN G AND RECEIVING CLERKS.............. 7

22102219

- - - - - - - - - - - - 3 - - 321 2 9 “ " " - -

~ 3 ~ 3 - 7 5 - 1 1 1 i _T I N T E R S . ....................................................................... * - 9 2 - - - _TRUCKDRIVERS............................................................. “ 9 5 7 5 1 - - - -1 3 2 7 " 1 " - -

1 The L o u isv il le S tandard M etrop o litan S ta tis t ic a l A rea c o n s is ts of B u llitt, J e ffe r so n , and Oldham C o u n tie s , Ky.; and C lark and F loyd C o u n tie s , Ind. 2 S ee ta b le 6 , footnote 2.

3 Data not shown se p a r a te ly by se x in d icate a ll o r v ir tu a lly a ll w o rk ers are m en .

Digitized for FRASER http://fraser.stlouisfed.org/ Federal Reserve Bank of St. Louis

Table 14. Occupational earnings: New Brunswick—Perth Amboy—Sayreville, N.J

(N um ber and a v e r a g e s tr a ig h t-t im e hourly earn in gs 2 of w o rk ers in s e le c te d occu p ation s in paints and v a r n ish es m anufacturing e s ta b lish m e n ts , N ovem b er 1976)

1 The New B ru n sw ick —P erth Am boy—S a y r e v ille Standard M etrop o litan S ta tis t ic a l A rea 2 S ee tab le 6, footnote 2.c o n s is t s of M id d lesex County. 3 Data not shown se p a r a te ly by s e x in d icate a l l or v ir tu a lly a l l w o rk ers a re m en.

Digitized for FRASER http://fraser.stlouisfed.org/ Federal Reserve Bank of St. Louis

Table 15. Occupational earnings: New York, N .Y .—N.J.1

(N um ber and a v e r a g e s tr a ig h t -t im e h o u r ly ea rn in g s 2 of w o rk ers in se le c te d o ccu p ation s in pain ts and v a r n ish es m anufacturing e s ta b lish m e n ts , N ovem b er 1976)

NUMBER OF WORKERS RECEIVING S TRAIG HT-TIM E HOURLY EARNINGS ( IN DOLLARS) O F --

Occupation and sex3 ofworkers

hourly earnings 2 UNDER

2.602. 60 A ND

UNDER 2.80

r2T80

3.00

3.00

3. 20

3.20

3.90

3.90

3.60

3.60

3.80

3.80

9.00

9.00

9.20

9.20

9.90

9.90

9.60

9.60

9.80

9.80

5.00

5.00

5.20

5.20

5.90

5.90

5.60

5.60

5.80

5.80

6.00

6.00

6.20

6.20

6.90

6.90

6.60

6.60

6.80

6.80

7.00

7.00ANDOVER

ALL PRODUCTION WORKERS............ 1, 186 $9.56 1 1 18 1 6 100 53 31 79 56 86 66 72 80 138 91 97 87 90 36 31 25 9 2 10 13, MEN............................ 1,1 19 9.63 1 1 10 8 67 97 31 79 59 89 69 70 79 137 91 97 87 90 33 31 25 9 2 10 1 3SELECTED PRODUCTION OCCUPATIONS

FILLERS, HAND..................... 65 9.17 3 - - 6 3 2 4 5 6 9 9 7 _ 5 1 3 2 _ _ _ _FILLERS, MACHINE.................. 1 18 9.01 6 33 6 3 11 7 9 9 11 18 2 9 2 2 - - _ _ _ _ _

MEN.......................... 79 9.97 - - - 6 3 11 7 9 9 1 1 18 2 9 2 2 - - _ - _ _

LABELERS AND PACKERS.............. 125 9. 37 - - 2 - 2 25 10 17 9 15 9 23 7 2 2 2 _ _ _ . _MEN........................... 117 9.38 - - - 2 - 2 23 10 15 7 15 8 22 - 7 2 2 2 - - - _ _ _

LABORERS, MATERIAL HANDLING....... 96 3.65 - - - 8 16 9 2 1 2 - 3 3 2MAINTENANCE WORKERS, GENERALUTILITY.......................... 27 5.61 2 - 3 - 2 1 6 - 4 6 - - _ 3 _

MIXERS............................. 60 5.06 - - 1 2 - 5 3 1 9 10 5 - 10 5 - 7 2 - _ _COMBINATION MIXER-GRINDERS........ 91 9.78 - • - 2 4 6 - - 19 4 9 5 4 4 16 23 2 _ _ 3 _ _ _ _SHIPPING CLERKS................... 22 5. 93 - - ~ - - 1 - - 2 3 i 2 2 - - 3 3 5 _ - _ _RECEIVING CLERKS.................. 17 9.53 - - - 2 3 - 2 - 2 3 2 - - - - - _ 3 _ _ _ _

TECHNICIANS....................... 28 5. 09 * - - - - - - 2 - 9 6 3 - 4 3 - _ 2 _ 1 _ . I 4 3MEN.......................... 26 5.08 - - - - 2 - 9 6 1 - 4 3 - - 2 - 1 _ _ _ _ 3THINNERS........................... 10 9.19 - - 2 3 - - 2 - 2 - _ _ _ 1 _ _ _ ITINTERS............................ 97 5.36 - - 2 - 2 - 3 3 1 9 3 3 9 5 - 2 2 - 3 _TRUCKDRIVERS...................... 98 9.90 - - 3 2 3 2 6 3 - 2 - 3 1 8 3 2 - 6 2 2 _ _TRUCKERS, POWER (FORKLIFT)........ 29 9. 39 ' ‘ ‘

9 ' 5 2 * ' ' “ 5 6 4 ~ 3

1 The N ew York Standard M etrop o litan S ta tis t ic a l A rea c o n s is t s of Bronx, K in gs, N ew York, 3 Data not shown se p a r a te ly by se x in d icate a ll or v ir tu a lly a ll w o r k e r s are m en.Putnam , Q ueen s, R ichm ond, R ockland , and W e stc h e ster C ou nties, N .Y .; and B ergen County, N .J . 4 W orkers w ere at $ 8 .20 and o v e r .

2 S ee tab le 6, footn ote 2.

Digitized for FRASER http://fraser.stlouisfed.org/ Federal Reserve Bank of St. Louis

Table 16. Occupational earnings: Newark, N.J

(N um ber and a v era g e s tr a ig h t -t im e hourly earn in gs 2 of w o rk ers in se le c te d o ccu p ation s in paints and v a r n ish es m anufacturing e s ta b lish m e n ts , N ovem b er 1976)

1 The N ew ark Standard M etropolitan S ta tis t ic a l A rea c o n s is t s of E s s e x , M o r r is , S o m e rse t , 3 D ata not shown se p a r a te ly by s e x in d icate a il or v ir tu a lly a ll w o rk ers a re m en .and Union C o u n tie s . 4 W orkers w ere d istr ib u ted as fo llow s: 1 at $ 7 .2 0 to $ 7 .4 0 ; 1 at $ 7 .8 0 to $8; and 2 at2 See tab le 6, foo tn ote 2 . „ $ 8 .2 0 and o v e r .

Digitized for FRASER http://fraser.stlouisfed.org/ Federal Reserve Bank of St. Louis

Table 17. Occupational earnings: Philadelphia, Pa.—N .J .1

(N um ber and a v era g e s tr a ig h t -t im e h ou rly ea rn in g s 2 of w o rk ers in se le c te d occupations in paints and v arn ish ei m anufacturing e s ta b lish m e n ts , N ovem b er 1976)

O ccup ation and s e x 3 hourly earnings 2

NUMBER OF WORKERS RECEIVING S TRAIG HT-TIM E HOURLY EARNINGS ( IN DOLLARS) OF—

2 . 3 0AND

UNDEE2 . 4 0

2. 40

2 . 5 0 3 . 0 0

3 . 2 0 3 . 4 0 3 . 6 0 3 . 8 0 4 . 0 0 4 . 2 0 4 . 4 0 4 . 6 0 4 . 8 0 5 . 0 0

5. 20

5 . 2 0

5 . 4 0

5 . 4 0 5 . 6 0 5 . 8 0 6 . 0 0

6 . 2 0 6 . 6 0 7 . 2 0

ALL PRODUCTION WORKERS............................HEN.....................................................................

SELECTED PRODUCTION OCCUPATIONS

F IL L E R S , HAND....................................................F IL L E R S , HACHINE............................................JA N IT O R S ..................................................................

HEN..................................................................LABELERS AND PACKERS..................................LABORERS, HATERIAL HANDLING..............HAINTENANCE WORKERS, GENERAL

U T IL IT Y ..................................................................H IX E R S ........................................................................GRINDERS..................................................................COHBINATION H IXER -G RINDERS.................S H IP P IN G CLERKS...............................................S H IP P IN G AND RECEIVING C L E R K S .. . .TE C H N IC IA N S ..........................................................TESTERS, ERODUCT............................................

HEN..................................................................T IN T E R S .....................................................................TRUCKDRIVERS........................................................

1 , 1 9 41 . 1 7 7

$ 5 . 6 45 . 6 4

4 . 9 35 . 9 85 . 2 35 . 2 14 . 8 6 5 . 3 8

6 . 0 65 . 3 35 . 3 35 . 2 2 5 . 6 6 4 . 40 5 . 7 15 . 8 7 5 . 8 5 5 . 8 3 6 . 4 2

125125

121117

130129

142140

1111

1013

67

3737

1 The P h ila d elp h ia Standard M etrop o litan S ta tis t ic a l A rea c o n s is ts of B u ck s, C h este r , D ela w a re , M on tgom ery , and P h ila d elp h ia C o u n tie s , P a .; and B u rlin gton , Cam den, and G lo u cester C o u n ties, N .J .

S ee ta b le 6 , footnote 2.Data not shown se p a r a te ly by sex in d ica tes a ll o r v ir tu a lly a ll w o rk ers are m en.

Digitized for FRASER http://fraser.stlouisfed.org/ Federal Reserve Bank of St. Louis

Table 18. Occupational earnings: St. Louis, M o.—III.1

(N um ber and a v e r a g e s tr a ig h t -t im e h ou rly earn in gs 2 of w ork ers in s e le c te d occupations in paints and v a r n ish es m anufacturing e s ta b lish m e n ts , N ovem b er 1976)

1 The St. L ou is Standard M etrop o litan S ta tis t ic a l A rea c o n s is ts of the c ity of St. L o u is , the cou n ties 2 S ee tab le 6, footn ote 2.F ra n k lin , J e ffe r so n , St. C h a r le s , and St. L ou is, M o.; and the cou n ties of C linton , M adison , M onroe, 3 Data not show n se p a r a te ly by se x in d icate a l l or v ir tu a lly a l l worke'rs a re m en

and St. C la ir , 111.

Digitized for FRASER http://fraser.stlouisfed.org/ Federal Reserve Bank of St. Louis

Table 19. Occupational earnings: San Francisco—Oakland, Calif.

(N um ber and a v era g e s tr a ig h t -t im e h o u r ly ea r n in g s 2 of w o rk ers in s e le c te d occupations in paints and v a r n ish es m anufacturing e s ta b lish m e n ts , N ovem b er 1976)

NUMBER OF WORKERS BECEIVING STRAIGHT—TIM E HOURLY EARNINGS ( IN DOLLARS) OF—

Occup at ion and s e x 3Number

ofworkers

Averagehourly

earnings2

4 . 3 0AND

UNDER

4. 40 4 . 5 0 4 . 6 0 4 . 7 0 4 . 8 0 4 . 9 0 5 . 0 0 5 . 2 0 5 . 4 0 5 . 6 0 5 . 8 0 6 . 0 0 6 . 2 0 6 . 4 0 6 . 6 0 6 . 8 0 7 . 0 0 7 . 2 0 7 . 4 0 7 . 6 0 8 . 0 0 8 . 4 0 8 . 8 0 9 . 2 0 9 . 6 0ANDOVER

4 . 4 0 4 . 5 0 4 . 6 0 4 . 7 0 4 . 8 0 4 . 9 0 5 . 0 0 5 . 2 0 5 . 4 0 5 . 6 0 5 . 80 6 . 0 0 6 . 2 0 6 . 4 0 6 . 6 0 6 . 8 0 7 . 0 0 7 . 2 0 7 . 4 0 7 . 6 0 8 . 0 0 8 . 4 0 8 . 8 0 9 . 2 0 9 . 6 0

7 6 87 4 7

$ 6 . 5 06 . 5 16 . 2 4

1 1111

3331

158156

211205

2222

7271

1

2727

9386

7

1211

1

1414

3131

2828

3333

151511

21 1 1

SELECTEE PBODUCTION OCCUPATIONS

67062

5 . 9 2 5 . 9 95 . 9 3

194

r - 54 i b5 . 8 1

5 . 9 95 . 9 9

102

b40 21 11

MAINTENANCE WORKERS, GENERAL7 . 7 4 8 14 15g 14

7114 2

COMBINATION MIXER-GRINDERS...................... 837

6 . 1 46 . 6 16 . 0 0

5 - - ; 7 - * - - - - - -

2 32 2

2 1 1 5

19 6^97 2 2 2 22 1 u ~r_

311040

6 . 7 48 . 0 36 . 2 1

' 5TRUCKERS, POWER (FORKLIFT)...................... - - . - - - - - - _ - 5 27 - - _ 8 _ - _ - . - -

38 6 . 17

1 The San F r a n c isc o —O akland Standard M etrop o litan S ta tis t ic a l A rea c o n s is t s o f A lam ed a , C ontra C o sta , M arin, San F r a n c isc o , and San M ateo C o u n ties .

2 S ee tab le 6, footnote 2.3 Data not shown se p a r a te ly by s e x in d ica te a l l or v ir tu a lly a l l w o rk ers a re m en .

Digitized for FRASER http://fraser.stlouisfed.org/ Federal Reserve Bank of St. Louis

Table 20. Method of wage payment

(Percent of production workers in paints and varnishes manufacturing establishments by method of wage payment,1 United States and selected regions, November 1976)

Method of wage payment

UnitedStates*

Regions Areas

MiddleAtlantic

BorderStates Southeast Southwest Great

Lakes Middle West Pacific Atlanta Baltimore Chicago

All workers ............................................................ 100 100 100 100 100 100 100 100 100 100 100

Time-rated workers .................................................... 100 100 100 100 100 100 100 100 100 100 100Formal p la n s ............................................................ 88 89 85 66 68 96 94 94 100 84 94

Single rate .......................................................... 44 61 9 25 23 55 23 39 73 _ 49Range of rates ................................................... 43 28 75 41 45 40 71 54 27 84 45

Individual ra tes....................................................... 12 11 15 34 32 4 6 6 - 16 6

Areas

Cleveland Dallas— Fort Worth Detroit

New Brunswick- Perth Amboy-

SayervilleLos Angeles- Long Beach Louisville Newark New York Philadel­

phia St. Louis San Francisco- Oakland

All workers ............................................................ 100 100 100 100 100 100 100 100 100 100 100

Time-rated workers .................................................... 100 100 100 100 100 100 100 100 100 100 100Formal p la n s ............................................................ 96 87 100 100 92 86 66 90 92 98 99

Single rate .......................................................... 73 14 80 88 3 14 53 37 67 25 99Range of rates ................................................... 23 73 20 12 89 72 13 53 25 73 _

Individual ra tes....................................................... 4 13 (3) - 8 14 34 10 8 2 1

1 For definition of method of wage payment, see appendix C.1 Includes data for regions in addition to those shown separately. 3 Less than 0.5 percent.

NOTE: Because of rounding, sums of individual items may not equal totals.

Digitized for FRASER http://fraser.stlouisfed.org/ Federal Reserve Bank of St. Louis

Table 21. Scheduled weekly hours

(Percent of production and office workers in paints and varnishes manufacturing establishments by scheduled weekly hours,' United States and selected regions, November 1976)

r oco

Weekly hours UnitedStates*

Regions

MiddleAtlantic

BorderStates Southeast Southwest Great

Lakes Middle West Pacific

Production workersAll workers ............................................ 100 100 100 100 100 100 100 100

35 hours.................................................... 4 17 _ _ _ _36 hours.............................................. (3) 2 _ _ _ _Over 36 and under 37 hours................................... (3) 1 _ 137.5 hours......................................... 8 21 _ _ _ 7 2Over 37.5 and under 38 hours............................. 2 _ _ _ 638 hours........................................... (3) _ _ _ _ (3>Over 38 and under 39 hours................................... 3 5 _ _ 5 139 hours...................................... (3) _ _ _Over 39 and under 40 hours................................... (3) _ _ _ _ 140 hours.......................................... 81 55 100 98 93 80 94 97Over 40 hours......................... (3> - - 2 2 - 2

Office workersAll workers .............................. 100 100 100 100 100 100 100 100

35 hours................................. 2 11 _ _ _36 hours.................................... 1 2 _ _ _ _

Over 36 and under 37 hours............................... (3) 1 _ _ _ 137.5 hours............................. 9 27 _ _ _ 7 5Over 37.5 and under 38 hours................................ 3 _ _ _ _ 738 hours.................... (3) _ _ _ _ (3)Over 38 and under 39 hours............................. 3 9 _ _ _ 4 139 hours...................................... (3) _ _ _ _

Over 39 and under 40 hours................................... <3) _ _ _ _ (3) _ _40 hours.............. 81 51 100 97 98 80 98 93Over 40 hours.............................. (3) - - 3 2 - 2

' Data relate to the predominant schedule for fu ll-tim e day-shift workers in each establishment. 1 Includes data for regions in addition to those shown separately.3 Less than 0.5 percent.

NOTE: Because of rounding, sums of individual items may not equal totals.

Digitized for FRASER http://fraser.stlouisfed.org/ Federal Reserve Bank of St. Louis

Table 22. Shift differential provisions(Percent of production workers in paints and varnishes manufacturing establishments by shift differential provisions,1 United States and selected regions, November 1976)

Regions

Shift differential UnitedStates* Middle

AtlanticBorderStates Southeast Southwest Great

Lakes Middle West Pacific

Second shift

Workers in establishments withsecond-shift provisions............................. 75.0 68.6 48.3 46.8 51.1 90.4 82.2 91.0With shift d ifferential............................................ 74.3 68.6 48.3 45.6 51.1 88.7 82.2 91.0

Uniform cents per hour .................................... 71.9 63.6 48.3 41.7 51.1 86.2 82.2 91.05 cents..................................... 1.2 .9 4.4 _ _ 1.4 _9 cents ........................................... .4 1.8 _ _ _ _ _10 cents.................................. 11.1 11.2 8.1 17.4 _ 11.3 29.8 4.912 cents................................................ 2.7 2.4 4.7 _ _ 3.8 _13 cents............................................. 1.4 - 8.4 - _ 2.7 _14 cents....................................................... 2.5 4.1 _ _ 5.9 3.4 _15 cents.......................................................... 32.0 19.5 12.1 5.3 38.9 46.3 6.5 54.118 cents .......................................................... 2.7 4.1 _ _ _ 1.4 _ 10.620 cents.......................................................... 8.9 2.1 10.6 _ 6.2 8.6 45.9 14.0Over 20 and under 25 cents...................... 1.2 2.2 _ 3.3 _ _ _ 3.525 cents.......................................................... 4.0 9.6 _ 15.8 _ 1.0 _ 2.130 cents.......................................................... .3 _ - _ _ .8 _

Uniform cents per hour .................................... 2.4 5.0 _ 3.9 _ 2.5 _

4 percent......................................................... .3 _ - 3.9 _ _ _ _

5 percent......................................................... .5 - - _ _ 1.3 _ _10 percent....................................................... 1.4 4.2 - _ _ 1.1 _ _Over 10 and under

15 percent ..................................................... .2 .8 - - - - - -

Third or other late shift

Workers in establishments with third or other late shiftprovisions .................................................................. 64.8 61.4 50.6 29.7 34.4 78.5 82.2 82.1With shift d ifferential............................................ 64.8 61.4 50.6 29.7 34.4 78.5 82.2 82.1

Uniform percentage ........................................... 63.3 58.3 50.6 25.8 34.4 77.1 82.2 82.1Under 10 cents.............................................. .2 - - _ _ _ _ _10 cents.......................................................... 2.4 4.4 4.4 4.0 _ 1.7 _ _12 cents.......................................................... .6 - - _ _ _ 10.0 __

13 cents.......................................................... .4 1.2 _ _ _ .4 _ _15 cents.......................................................... 10.8 6.6 3.5 7.0 - 14.6 19.9 16.316 cents.......................................................... .8 1.8 - _ _ .8 _ _17 cents.......................................................... 1.0 2.4 8.4 _ - _ _ _18 cents.......................................................... 2.4 - - - - 3.3 _ 10.519 cents.......................................................... 1.4 - - _ - 3.4 _ 1.920 cents.......................................................... 24.1 16.7 16.6 5.3 29.8 36.6 3.2 30.222 cents.......................................................... .6 1.5 - - _ _ _ 2.023 cents .......................................................... .8 2.5 - _ - - _ 2.025 cents.......................................................... 5.0 - 7.1 - 4.6 6.5 31.2 _

Uniform percentage ........................................... 1.6 3.1 - 3.9 - 1.3 - _

5 percent......................................................... .5 - - - - 1.3 - _

10 percent....................................................... .7 3.1 “ ~ ” -

1 Refers to policies of establishments currently operating late shifts or having provisions covering late shifts. * Includes data for regions in addition to those shown separately.

NOTE: Because of rounding, sums of individual items may not equal totals.

Digitized for FRASER http://fraser.stlouisfed.org/ Federal Reserve Bank of St. Louis

Table 23. Shift differential practices(Percent of production workers in paints and varnishes manufacturing establishments employed on late shifts by amount of pay differential, United States and selected regions,November 1976)

Regions

Shift differential UnitedStates1 Middle

AtlanticBorderStates Southeast Southwest Great *

Lakes Middle West Pacific

Second shift

Workers employed on second shift ......................... 11.2 8.8 6.3 8.3 6.3 16.3 ' 10.6 10.8Receiving diffe ren tia l............................................. 111 8.8 6.3 8.2 6.3 16.0 10.6 10.8

Uniform cents per h o u r.................................... 11.0 8.8 6.3 7.7 6.3 ‘ 15.8 10.6 10.85 ce n ts ............................................................ .1 _ .8 - _ .2 _ _9 cen ts ............................................................ _ _ _ _ - _ - -10 cents.......................................................... .6 _ 1.2 2.0 - .8 1.0 _12 cents.......................................................... .3 .2 - - - .6 - -13 cents.......................................................... .1 _ 1.0 _ - .1 _ _14 cents .......................................................... .4 .3 - - .8 .8 - -15 cents .......................................................... 5.5 3.7 2.1 1.9 4.9 9.3 1.0 5.118 cents .......................................................... .7 1.2 _ _ - .7 _ 1.620 cents.......................................................... 1.6 .2 1.3 - .6 1.6 8.6 2.7Over 20 and under 25 cents...................... .3 .5 - 1.4 - - - .725 cents.......................................................... .6 1.1 _ 2.4 - .2 - .430 cents.......................................................... (*) - - - .1 - -

Uniform cents per hour .................... :.............. .1 - - .6 - .2 - -4 percent......................................................... <l ) - - .6 - - - -5 percent......................................................... .1 - - - - .2 - -10 percent....................................................... - - - - - - - -Over 10 and under

15 percent..................................................... - - - - - - - -

Third or other late shift

Workers employed on thirdor other late s h if t .................................................... 2.9 2.5 1.0 1.4 2.8 4.4 5.0 1.5

Receiving d ifferentia l............................................. 2.9 2.5 1.0 1.4 2.8 4.4 5.0 1.5Uniform percentage ........................................... 2.9 2.5 1.0 1.4 2.8 4.2 5.0 1.5

Under 10 cents.............................................. - - - - - - - -10 cents.......................................................... .1 - - - - .2 - -12 cents.......................................................... - - - - - - - -

13 cents.......................................................... - - - - - - - -15 cents.......................................................... .2 .1 - - - .3 .7 -16 cents .......................................................... (*) - - - - (2) - -17 cents.......................................................... (*) (l ) - - - - - -18 cents.......................................................... (’ ) - - - - - - .219 cents.......................................................... .1 - - - - .1 - .120 cents.......................................................... 1.2 .5 .3 .4 2.8 2.2 - .522 cents.......................................................... (*) - - - - - - .123 cents.......................................................... .1 .4 - - - - - -25 cents.......................................................... .3 - .2 - - .6 .8 -

Uniform percentage ........................................... .1 - - (’ ) - .2 - -5 percent......................................................... .1 - - .2 - -

10 percent....................................................... “ ~ ~"

~

1 Includes data for regions in addition to those shown separately. * Less than 0.05 percent.

NOTE: Because of rounding, sums of individual items may not equal totals.

Digitized for FRASER http://fraser.stlouisfed.org/ Federal Reserve Bank of St. Louis

Table 24. Paid holidays(Percent of production and office workers in paints and varnishes manufacturing establishments with formal provisions for paid holidays, United States and selected regions,November 1976)

Number of paid holidays

UnitedStates'

Regions

MiddleAtlantic

BorderStates Southeast Southwest Great

Lakes Middle West Pacific

Production workersAll workers............................................................ 100 100 100 100 100 100 100 100

Workers in establishmentsproviding paid holidays........................................... 100 100 100 100 100 100 100 100

Under 6 days.......................................................... 1 - - 17 - _ _ _6 da ys ..................................................................... 5 1 14 18 20 2 _ 16 days plus 2 half days...................................... (*) - - - 5 - _ -7 da ys ..................................................................... 4 - 12 12 3 3 14 _

7 days plus 1 or 2 half days............................. 2 - 11 6 _ 2 2 _

8 d a ys ..................................................................... 5 4 6 12 6 3 7 38 days plus 1 or 2 half days............................ 2 1 5 - - 3 _ -9 days ..................................................................... 14 5 29 19 39 11 5 189 days phis 1 or 2 half days............................ 1 1 7 - - _ _ _10 da ys ................................................................... 36 21 16 9 21 48 66 4910 days plus 1 or 2 half days.......................... (*) 2 - - - _ _ _

11 da ys ................................................................... 19 32 - 6 4 18 7 2811 days plus 1 or 2 half days.......................... (*) - - - _ 1 _ _12 da ys ................................................................... 7 19 - _ - 6 _ _

12 days plus 1 half day...................................... 1 2 - - - _ _ _

13 da ys ................................................................... • 2 5 - - - 3 _ _

14 da ys ................................................................... 1 3 - - - -

Office workersAll workers ............................................................ 100 100 100 100 100 100 100 100

Workers in establishmentsproviding paid holidays........................................... 100 100 100 100 100 100 100 100

Under 6 days .......................................................... <*) - - 5 _ _ _ _

6 days ..................................................................... 4 2 10 9 14 1 _ 36 days plus 2 half days...................................... (’ ) - - - 4 _ _ _

7 days ..................................................................... 4 1 9 10 3 2 5 47 days plus 1 or 2 half days............................ 2 - 5 6 - 4 2 _

8 da ys ..................................................................... 8 5 6 22 11 6 7 88 days plus 1 or 2 half days............................ 2 - 7 - - 3 _ _

9 d a ys ..................................................................... 18 8 29 22 42 19 1 159 days plus 1 or 2 half days............................. 2 4 4 - - _ _ _

10 da ys ................................................................... 35 24 26 14 21 41 81 3610 days plus 1 or 2 half days.......................... (*) 2 - - - _ _

11 da ys ................................................................... 17 25 3 12 2 17 3 3312 d a ys ................................................................... 4 15 - - - • 2 _

12 days plus 1 half day...................................... 1 3 - - - - _ _

13 days ................................................................... 2 6 - - - 3 _ _14 da ys................................................................... (l > 2 “ - - -

1 Includes data for regions in addition to those shown separately. 1 Less than 0.5 percent.

NOTE: Because of rounding, sums of individual items may not equal totals.

Digitized for FRASER http://fraser.stlouisfed.org/ Federal Reserve Bank of St. Louis

Table 25. Paid vacations(Percent of production and office workers in paints and varnishes manufacturing establishments with formal provisions for paid vacations after selected periods of service,United States and selected regions, November 1976)

Vacation policy UnitedStates'

Regions

MiddleAtlantic

BorderStates Southeast Southwest Great

Lakes Middle West Pacific

Production workersAll workers ............................................................. 100 100 100 100 100 100 100 100

Method of paymentWorkers in establishments

providing paid vacations ........................................ 100 100 100 100 100 100 100 100Length-of-time payment....................................... 96 97 100 93 95 97 100 87Percentage payment ............................................... 4 3 - 7 5 3 - 13

Amount of vacation pay*

After 1 year of servico:1 week...................................................................... 67 47 71 85 80 62 80 83Over 1 and under 2 weeks .................................. 1 3 _ _ - (3) _ _2 weeks.................................................................... 31 49 29 15 20 32 20 17Over 2 and under 3 weeks.................................. 2 _ - _ - 5 _ _

After 2 years of service:1 w eek...................................................................... 25 27 11 45 40 26 27 _Over 1 and under 2 weeks.................................. 2 3 4 - - 1 10 -2 weeks.................................................................... 71 70 85 55 60 66 63 100Over 2 and under 3 weeks .................................. 2 _ _ _ _ 7 _ _

After 3 years of service:1 week...................................................................... 4 1 6 22 11 (3) - -Over 1 and under 2 weeks .................................. 1 (3) 4 _ - - 10 -2 weeks.................................................................... 90 93 90 78 89 90 90 100Over 2 and under 3 weeks .................................. 3 5 _ - _ 4 _ -3 weeks.................................................................... 1 - - - - 3 - -Over 3 and under 4 weeks.................................. 1 - _ _ - 3 - -

After 5 years of service:1 week...................................................................... n - 6 - - - - -Under 2 weeks........................................................ (3) - 6 - - - - -2 weeks.................................................................... 75 70 94 90 100 68 83 64Over 2 and under 3 weeks .................................. 3 3 _ - - 6 3 -3 weeks.................................................................... 20 24 - 10 - 23 15 36Over 3 and under 4 weeks .................................. 2 3 - - - 3 - -

After 10 years of service:1 week...................................................................... (3) - 3 - - - - -2 weeks.................................................................... 14 12 15 36 21 10 16 2Over 2 and under 3 weeks .................................. (3) - - - 3 - - -3 weeks.................................................................... 73 60 82 61 76 75 69 98Over 3 and under 4 weeks .................................. 4 9 - - - 7 - -4 or 5 weeks.......................................................... 8 17 - 3 - 8 15 -

After 15 years of service:1 week...................................................................... (3) - 3 - - - - -2 weeks.................................................................... 7 4 11 28 15 3 2 23 weeks.................................................................... 54 37 72 50 75 52 75 52Over 3 and under 4 weeks .................................. 4 6 - - - 8 - -4 weeks.................................................................... 33 49 14 22 11 32 23 47Over 4 and under 5 weeks .................................. 2 3 - - - 3 - -5 weeks.................................................................... 1 - - - - 1 - -

After 20 years of service:1 week...................................................................... (3) - 3 - - - - -2 weeks.................................................................... 7 4 11 28 15 3 2 23 weeks.................................................................... 14 10 28 21 28 11 7 9

See footnotes at end of table.

Digitized for FRASER http://fraser.stlouisfed.org/ Federal Reserve Bank of St. Louis

Table 25. Paid vacations—Continued(Percent of production and office workers in paints and varnishes manufacturing establishments with formal provisions for paid vacations after selected periods of serviceUnited States and selected regions, November 1976)

Regions

Vacation policy UnitedStates' Middle

AtlanticBorderStates Southeast Southwest Great

Lakes Middle West Pacific

Production workers

A m o M t of vacation pay’ -C o n tiiu id

A fter 20 years of service: — Continued Over 3 and under 4 weeks .................................. 1 24 weeks................................................................... 62 51 58 41 57 65 77 85Over 4 and under 5 weeks .................................. 4 7 _ _ _ 65 weeks................................................................... 11 21 _ 10 _ 12 15 4Over 5 and under 6 weeks .................................. 1 3 _ _ - _ (3)

16 weeks................................................................... 1 _ _ _ _ _A fter 25 years of service:

1 week..................................................................... (3) - 3 _ _ _ _2 weeks................................................................... 7 4 11 28 15 3 2 23 weeks................................................................... 13 6 24 21 28 11 7 94 weeks................................................................... 34 38 • 40 31 25 34 32 21Over 4 and under 5 weeks .................................. 2 2 _ _ _ 55 weeks................................................................... 41 39 23 20 32 43 60 69Over 5 and under 6 weeks .................................. 2 8 _ _ _ 16 weeks................................................................... 1 1 _ _ _ 1 _

7 weeks................................................................... (3) 2 _ _ _ _A fter 30 years of service:4

1 week..................................................................... (3> - 3 _ _ _ _2 weeks................................................................... 7 4 11 28 . 15 3 2 23 weeks................................................................... 13 6 24 21 28 11 7 94 weeks................................................................... 32 38 29 31 25 33 32 21Over 4 and under 5 weeks.................................. 1 2 _ _ _ 35 weeks................................................................... 42 39 33 20 32 45 60 69Over 5 and under 6 weeks.................................. 3 8 _ _ _ 46 weeks................................................................... 1 1 _ _ _ 1 _

Over 7 weeks.......................................................... (3) 2 - - - - -

See footnotes at end of table.

Digitized for FRASER http://fraser.stlouisfed.org/ Federal Reserve Bank of St. Louis

Table 25. Paid vacations —Continued(Percent of production and office workers in paints and varnishes manufacturing establishments with formal provisions for paid vacations after selected periods of service,United States and selected regions, November 1976)

Regions

Vacation policy UnitedStates1 Middle

AtlanticBorderStates Southeast Southwest Great

Lakes Middle West Pacific

Office workersAll workers ............................................................. 100 100 100 100 100 100 100 100

Method of paymentWorkers in establishments

providing paid vacations........................................ 100 100 100 100 100 100 100 100length-of-tim e payment....................................... 100 100 100 100 100 100 100 97Percentage payment ............................................... (*) - - - - - - 3

Amount of vacation pay1

After 1 year of service:1 week...................................................................... 34 22 50 43 47 17 68 522 weeks.................................................................... 65 75 50 57 53 81 32 48Over 2 and under 3 weeks .................................. 1 4 _ _ _ 1 _ _

After 2 years of service:1 week...................................................................... 6 8 7 15 15 2 6 _Over 1 and under 2 weeks.................................. <3) (3) 3 _ - _ _ _2 weeks.................................................................... 83 86 90 85 76 74 94 100Over 2 and under 3 weeks.................................. 11 6 - _ 9 24 _ -

After 3 years of service:1 week...................................................................... 2 1 3 8 4 - - _Over 1 and under 2 weeks .................................. (3) (3) 3 - - - _ -2 weeks.................................................................... 87 92 93 92 87 76 100 100Over 2 and under 3 weeks .................................. 11 6 _ _ 9 24 _ -

After 5 years of service:1 week...................................................................... (3) - 3 - - - - -Under 2 weeks ........................................................ (3) _ 3 - - _ _ _2 weeks.................................................................... 69 73 93 81 84 56 93 56Over 2 and under 3 weeks.................................. 10 3 - - 9 25 _ -3 weeks.................................................................... 20 21 4 19 7 19 7 44Over 3 and under 4 weeks.................................. 1 4 - - - - - _

After 10 years of service:1 week...................................................................... (3) - 1 - - - - -2 weeks.................................................................... 14 16 14 24 20 10 9 7Over 2 and under 3 weeks .................................. 2 - - - 3 4 - _3 weeks.................................................................... 68 57 81 73 68 58 84 92Over 3 and under 4 weeks .................................. 10 10 - - 9 20 - -4 or 5 weeks.......................................................... 8 18 4 3 - 9 7 1

After IS years of service:1 week...................................................................... (3) - 1 - - - - -2 weeks.................................................................... 7 10 10 17 11 3 9 43 weeks.................................................................... 46 32 77 53 63 34 82 41Over 3 and under 4 weeks.................................. 13 14 - - 9 27 - -

4 weeks.................................................................... 33 43 11 31 16 36 9 555 weeks.................................................................... (3) 1 - - - - - 1

After 20 years of service:1 week...................................................................... (3) - 1 - - - - -2 weeks.................................................................... 7 10 10 17 11 3 9 43 weeks.................................................................... 13 8 19 21 28 9 2 9Over 3 and under 4 weeks .................................. 1 - - - - 4 - -4 weeks.................................................................... 54 52 65 43 45 50 82 69Over 4 and under 5 weeks.................................. 8 7 - - 9 17 - -

5 weeks.................................................................... 15 20 4 19 7 18 7 18

See footnotes at end of table.

Digitized for FRASER http://fraser.stlouisfed.org/ Federal Reserve Bank of St. Louis

Table 25. Paid vacations—Continued(Percent of production and office workers in paints and varnishes manufacturing establishments with formal provisions for paid vacations after selected periods of service.United States and selected regions, November 1976)

Regions

Vacation policy UnitedStates' Middle

AtlanticBorderStates Southeast Southwest Great

Lakes Middle West Pacific

Office workers

Amount of vacation pay*-Continued

After 20 years of service: — ContinuedOver 5 and under 6 weeks .................................. 1 4 _6 weeks................................................................... (3) 1 _ _

After 25 years of service:1 week.....................................................................2 weeks...................................................................

(3)7 10

110 17 11 3 9 4

3 weeks................................................................... 11 3 16 21 28 9 2 9Over 3 and under 4 weeks .................................. 1 _ _ _ _ 44 weeks................................................................... 32 36 39 32 34 34 11 24Over 4 and under 5 weeks .................................. 1 1 _ _ _ 15 weeks................................................................... 39 39 34 30 27 31 78 63Over 5 and under 6 weeks .................................. 8 9 _ _ __ 186 weeks................................................................... (3) 2 _ _ _

After 30 years of service:41 week ..................................................................... (3) _ 1 _ _ _ _

2 weeks ................................................................... 7 10 10 17 11 3 9 43 weeks ................................................................... 11 3 16 21 28 9 2 9Over 3 and under 4 weeks .................................. 1 - __ _ _ 44 weeks................................................................... 30 36 23 32 34 33 11 24Over 4 and under 5 weeks .................................. (3) 1 - _ _ _ _5 weeks................................................................... 40 39 49 30 27 32 78 61Over 5 and under 6 weeks .................................. 9 9 _ _ _ 206 weeks................................................................... 1 2 - - - - 2

1 Includes data for regions in addition to those shown separately.1 Vacation payments, such as percent of annual earnings, were converted to an equivalent time basis. Periods of service were chosen arbitrarily and do not necessarily

reflect individual establishment provisions for progression. For example, changes indicated at 10 years may include changes that occurred between 5 and 10 years.3 Less than 0.5 percent.4 Vacation provisions were virtually the same after longer periods of service.

NOTE: Because of rounding, sums of individual items may not equal totals.

Digitized for FRASER http://fraser.stlouisfed.org/ Federal Reserve Bank of St. Louis

Table 26. Health, insurance, and retirement plans(Percent of production and office workers in paints and varnishes manufacturing establishments with specified healtti, insurance, and retirement plans,1 United States andselected regions, November 1976)

Type of plan UnitedStates3

Regions

MiddleAtlantic

BorderStates Southeast Southwest Great

Lakes Middle West Pacific

Production workersAll workers ............................................................ roc 100 100 100 100 100 100 100

orkers in establishments providing:Life insurance......................................................... 98 99 94 97 98 97 100 97

Noncontributory p lans........................................ 83 96 74 55 72 84 87 87Accidental death and

dismemberment insurance .................................. 82 66 86 84 73 88 100 86Noncontributory p lans........................................ 68 63 66 42 56 73 87 78

Sickness and accident insuranceor sick leave or both3 ........................................ 93 89 94 82 81 98 97 100

Sickness and accidentinsurance........................................................... 64 65 77 38 31 85 90 15

Noncontributory p lan s .................................... 52 47 64 18 24 75 75 13Sick leave (full pay,

no waiting period)........................................... 38 61 64 32 38 27 22 18Sick leave (partial pay

or waiting period)............................................ 26 17 6 16 31 16 46 80Long-term disability insurance........................... 18 15 9 7 21 23 18 13

Noncontributory p lans........................................ 16 13 9 5 17 21 18 13Hospitalization insurance ...................................... 100 99 100 100 100 99 100 100

Noncontributory p lans........................................ 81 97 87 47 66 78 83 96Surgical insurance.................................................. 100 99 100 100 100 99 100 100

Noncontributory p lans........................................ 80 96 87 47 66 78 83 96Medical insurance................................................... 99 97 100 100 100 99 100 100

Noncontributory p lans........................................ 80 93 87 47 66 78 83 96Major medical insurance....................................... 86 72 96 92 100 85 84 100

Noncontributory p lans........................................ 66 61 75 36 66 67 67 96Pensions ................................................................... 91 96 88 79 85 93 95 92

Noncontributory...................................................... 84 91 74 79 78 81 95 91

Office workersAll workers ............................................................ 100 100 100 100 100 100 100 100

orkers in establishments providing:Life insurance......................................................... 96 96 95 93 97 97 100 95

Noncontributory p lans........................................ 72 88 77 57 61 73 29 83Accidental death and

dismemberment insurance .................................. 83 70 92 79 65 87 96 88Noncontributory p lans........................................ 59 55 74 32 40 65 25 79

Sickness and accident insuranceor sick leave or both3 ........................................ 88 87 95 79 83 86 85 100

Sickness and accidentinsurance........................................................... 52 55 82 16 36 62 83 17

Noncontributory p lans.................................... 37 36 69 5 26 50 19 16Sick leave (full pay,

no waiting period)........................................... 61 72 73 35 68 56 11 83Sick leave (partial pay

or waiting period)............................................ 12 11 4 31 5 13 7 16Long-term disability insurance ........................... 33 30 39 22 40 42 9 30

Noncontributory p lans........................................ 27 26 38 22 32 34 9 14Hospitalization insurance ...................................... 99 98 100 100 100 100 100 97

Noncontributory p lans........................................ 69 90 90 44 60 67 27 78Surgical insurance.................................................. 99 98 100 100 100 100 100 97

Noncontributory p lans........................................ 69 89 90 44 60 67 27 78Medical insurance................................................... 99 98 100 100 100 100 100 97

See footnotes at end of table.

Digitized for FRASER http://fraser.stlouisfed.org/ Federal Reserve Bank of St. Louis

(Percent of production and office workers in paints and varnishes manufacturing establishments with specified health, insurance, and retirement plans,1 United States and selected regions, November 1976)

Table 26. Health, insurance, and retirement plans—Continued

Type of plan UnitedStates1

Regions

MiddleAtlantic

BorderStates Southeast Southwest Great

Lakes Middle West Pacific

Office workersNoncontributory p lans........................................ 69 89 90 44 60 67 27 78

Major medical insurance....................................... 90 73 98 98 100 93 93 96Noncontributory p lans........................................ 59 • 57 87 39 60 63 20 77

Pensions.................................................................. 86 86 90 75 86 94 97 67Noncontributory...................................................... 73 77 81 75 75 77 39 66

1 Includes those plans for which the employer pays at least part of the cost and excludes legally required plans such as workers’ compensation and social security; however, plans required by State temporary disability laws are included if the employer contributes more than is legally required or the employees receive benefits in excess of legal requirements. "Noncontributory plans” include only those plans financed entirely by the employer

1 Includes data for regions in addition to those shown separately.1 Unduplicated total of workers receiving sickness and accident insurance and sick leave shown separately.

NOTE: Because of rounding, sums of individual items may not equal totals.

Digitized for FRASER http://fraser.stlouisfed.org/ Federal Reserve Bank of St. Louis

(Percent of production and office workers in paints and varnishes manufacturing establishments providing funeral leave pay, jury duty pay. supplemental unemployment benefits,cost-of-living adjustments, and clothing allowances1 United States and selected regions, November 1976)

Table 27. Other selected benefits

Regions

Type of benefit UnitedStates* Middle

AtlanticBorderStates Southeast Southwest Great

Lakes Middle West Pacific

Production workersWorkers in establishments

with provisions fo r

Funeral leave ............................................................... 91 95 95 78 79 91 100 92Jury duty leave ........................................................... 83 86 87 77 86 88 100 58Supplemental unemployment

benefits....................................................................... 4 _ 5 _ _ 10 3 5Cost of living adjustments

Based on BLS d a ta ................................................ 28 32 12 15 _ 44 3 19Other bases ............................................................. 1 _ _ 9 _ _ 7 1

Clothing allowance ..................................................... 77 92 82 57 76 76 76 67Clothing provided.................................................... 64 91 50 44 44 65 26 63Monetary allowance in lieuof clothes .............................................................. 9 2 18 8 32 4 50 3

Combination ............................................................ 4 - 14 6 - 7 - 2

Office workersWorkers in establishments

with provisions for:

Funeral leave ............................................................... 90 95 95 84 75 89 96 93Jury duty leave ........................................................... 86 90 93 88 86 88 96 70Supplemental unemployment

benefits....................................................................... 4 _ 25 _ _ 5 _ 6Cost of living adjustments

Based on BLS data ............................................... 10 21 4 3 _ 7 1 18Other bases ............................................................. 1 “ - 12 - - 3 1

For definition of items, see appendix C.1 Includes data for regions in addition to those shown separately.

NOTE: Because of rounding, sums of individual items may not equal totals.

Digitized for FRASER http://fraser.stlouisfed.org/ Federal Reserve Bank of St. Louis

Appendix A. Regression Analysis

Conventional methods of analyzing wage variations using cross tabulations (simple regression) of data typically stop short of measuring the independent influence on wage levels of such factors as size of establishment, location, and union contract status. The independent effect of unionization on earnings, for example, may be obscured by earnings differentials associated with larger establishments and metropolitan areas—two characteristics generally found more often in union than nonunion establishments.

One method of isolating the independent effect on wages of various establishment and worker character­istics is multiple regression. By this method, the estima­ted wage differential for a given variable is determined independently. The variables included in table A-l are defined, where necessary, in appendix C—Scope and Method of Survey.

In the regression equation, one category of each of the variables is not shown explicitly, but its influence is embodied in the constant term. In table A -l, therefore,

Table A-1. Regression analysis of average hourly earnings, all production workers and selected occupations, paint and varnish manufacturing, November 1976

Allproduction

workers

Selected occupations

Variable Fillers,hand

Fillersmachine

Labelersand

packers

Laborersmaterialhandling

Grinders

Constant........................................................................... .. • • ■ $3.16 $2.33 $2.95 $2.96 $2.32 $3.09(.26) (.36) (.40) (.30) (.40) (.40)

Metropolitan area....................................................................... 0.59 1.10 0.42 0.40 1.01 0.63(.24) (.34) (.35) (.26) (.37) (.31)

Larger plants (at least 100 workers) ................................... 0.60 0.57 0.83 0.62 0.49 0.23(.10) (.14) (.13) (.12) (.16) (.17)

Union p la n t................................................................................. 0.36 0.38 0.30 0.37 0.20 0.36

Region:(.11) (.15) (.16) (.14) (.18) (.18)

Middle Atlantic .................................................................. 0.77 0.73 0.78 0.74 0.87 1.21(.20) (.27) (.26) (.25) (.32) (.37)

Border States....................................................................... 0.18 0.30 0.47 0.27 0.25 .71(.26) (.30) (.36) (.30) (.40) (.43)

Southwest ............................................................................ 0.33 0.33 0.63 0.37 0.57 .96(.24) (.30) (.32) (.27) (.43) (.51)

Great Lakes......................................................................... 0.99 1.15 1.07 0.78 1.29 1.47(.18) (.21) (.25) (.23) (.30) (.35)

Middle W est......................................................................... 0.83 1.06 0.68 0.85 1.47 .43(.26) (.29) (.40) (.31) (.37) (.43)

Pacific ................................................................................... 1.43 1.58 1.70 1.46 .69 1.29

Statistical information:(.22) (.25) (.31) (.28) (.32) (.43)

Coefficient of determination (R 2) ........................................ .36 .45 .37 .35 .32 .34Standard error of estimate .................................................... $0.79 $0.76 $0.82 $0.75 $0.81 $0.72Mean (Y) ..................................................................................... $5.10 $4.88 $4.91 $4.59 $4.67 $5.22Number of establishments ( S ) ............................................... 292 163 177 184 142 96

See foo tno tes a t end o f tab le .

39

Digitized for FRASER http://fraser.stlouisfed.org/ Federal Reserve Bank of St. Louis

Table A-1. Regression analysis of average hourly earnings, all production workers and selected occupations, paint andvarnish manufacturing, November 1976—Continued

Variable MixersMixers

andgrinders

Maintenanceworkers,generalutility

Technicians TintersTruckers,

power(forklift)

Constant..................................................................................... $4.07 $2.94 $3.99 $4.01 $4.03 $3.49(.28) (.37) (.33) (.31) (.27) (.35)

Metropolitan area ..................................................................... 0.11 1.15 0.90 0.49 0.74 0.53(.25) (.36) (.31) (.30) (.27) (.32)

Larger plants (at least 100 workers) ................................... 0.42 0.83 0.40 -0.08 0.34 0.47(.13) (.12) (.12) (-) (.11) (.14)

Union p la n t................................................................................. 0.29 0.01 0.33 0.14 0.35 0.14

Region:9.15) (.16) (.13) (.15) (.12) (.17)

Middle Atlantic .................................................................. 0.62 0.66 0.31 0.96 0.47 0.78(.31) (.21) (.22) (.26) (.22) (.28)

Border States ..................................................................... -0.01 (*> -0.42 0.13 -0.06 -0.30(.33) (.37) (.29) (.39) (.29) (.34)

Southwest ............................................................................ 0.04 ( M -0.39 -0.24 0.08 0.44(.36) (.25) (.28) (.37) (.25) (.30)

Great Lakes.......................................................................... 0.86 1.10 0.44 0.75 0.63 0.96(.28) (.20) (.19) (.24) (.20) (.26)

Middle W est.......................................................................... 0.43 0.66 0.38 0.53 0.43 0.45(.35) (.29) (.29) (.33) (.30) (.44)

Pacific ................................................................................... 1.36 1.53 1.39 1.52 1.18 1.61

Statistical information:(.32) (.24) (.23) (.32) (.24) (.30)

Coefficient of determination (R2) ...................................... .35 .53 .38 .19 .29 .42Standard error of estimate...................................................... $0.71 $0.72 $0.79 $0.89 $0.74 $0.66Mean (Y) ..................................................................................... $5.26 $5.13 $5.72 $5.19 $5.62 $5.23Number of establishments ( S ) ...............................................

_________________________________________145 153 214 182 211 129

Less than $ 0 .0 5 . w ould d iffe r fro m a census-derived value by less than the standard

N O T E : Num bers in parenthesis are standard errors. Regression coeffic ients, based on a sample, m ay d iffe r fro m figures th a t w ould have been obtained from a com plete census o f th e industry. Chances are abou t 2 o u t o f 3 th a t an estim ate fro m th e sample

error, and about 19 o u t o f 2 0 th a t the d ifference w ould be less than tw ice the standard error. Y is th e mean o f the earnings (dependent) variable weighted by production workers; S is the num ber o f establishments in the sample or w ith em ployees in the occupations shown above.

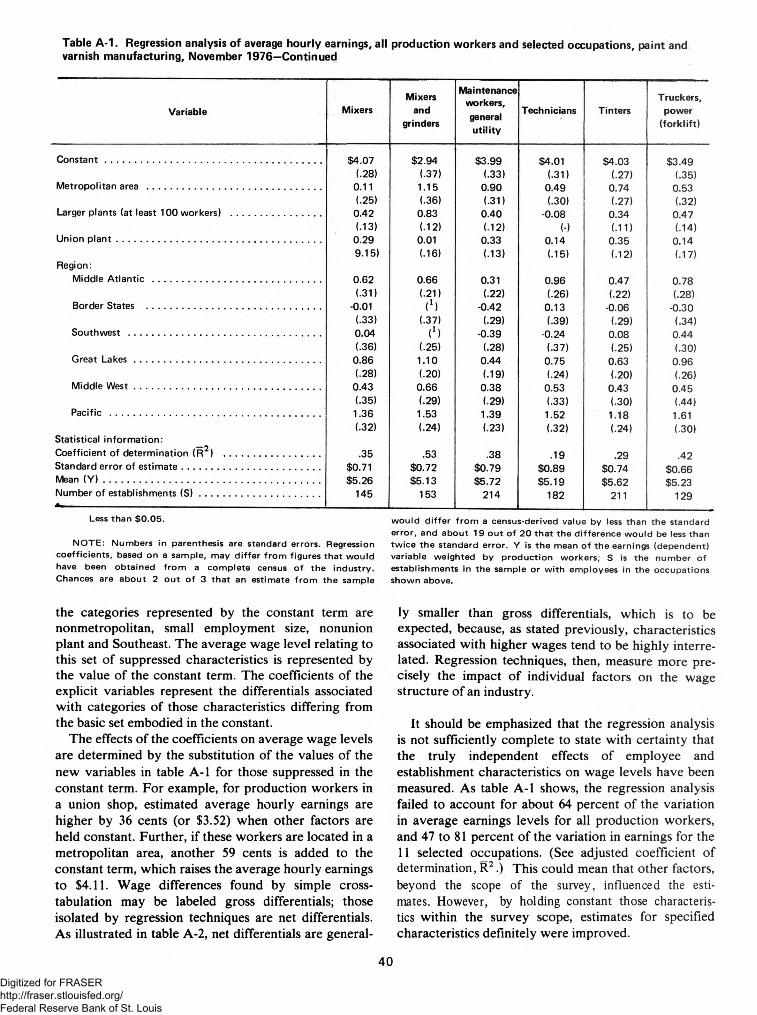
the categories represented by the constant term are nonmetropolitan, small employment size, nonunion plant and Southeast. The average wage level relating to this set of suppressed characteristics is represented by the value of the constant term. The coefficients of the explicit variables represent the differentials associated with categories of those characteristics differing from the basic set embodied in the constant.

The effects of the coefficients on average wage levels are determined by the substitution of the values of the new variables in table A-1 for those suppressed in the constant term. For example, for production workers in a union shop, estimated average hourly earnings are higher by 36 cents (or $3.52) when other factors are held constant. Further, if these workers are located in a metropolitan area, another 59 cents is added to the constant term, which raises the average hourly earnings to $4.11. Wage differences found by simple cross­tabulation may be labeled gross differentials; those isolated by regression techniques are net differentials. As illustrated in table A-2, net differentials are general­

ly smaller than gross differentials, which is to be expected, because, as stated previously, characteristics associated with higher wages tend to be highly interre­lated. Regression techniques, then, measure more pre­cisely the impact of individual factors on the wage structure of an industry.

It should be emphasized that the regression analysis is not sufficiently complete to state with certainty that the truly independent effects of employee and establishment characteristics on wage levels have been measured. As table A-1 shows, the regression analysis failed to account for about 64 percent of the variation in average earnings levels for all production workers, and 47 to 81 percent of the variation in earnings for the 11 selected occupations. (See adjusted coefficient of determination, R2 .) This could mean that other factors, beyond the scope of the survey, influenced the esti­mates. However, by holding constant those characteris­tics within the survey scope, estimates for specified characteristics definitely were improved.

40

Digitized for FRASER http://fraser.stlouisfed.org/ Federal Reserve Bank of St. Louis

Table A-2. Earnings differentials associated w ith selected characteristics, paints and varnish industry, November 1976

CharacteristicAll

productionworkers

Fillers,hand

Fillers,machine

Labelers and packers

Laborers,materialhandling

Combination mixers

and grinders

Metropolitan to nonmetropolitan area:Gross d ifferentia l................................................................ $1.10 $1.62 $0.93 $0.83 $1.24 $1.52Net differential .................................................................. .59 1.10 .42 (.40) 1.01 1.15

(.24) (.34) (.35) (-26) (.37) (.36)

Union to nonunion:Gross d ifferential................................................................ .78 .84 .76 .74 .52 .57Net differential .................................................................. .36 .38 .30 .37 .20 .01

(.11) (.15) (.16) (.14) (.18) (.16)

Larger plants (100 workers plus) to smaller plants (less than 100 workers):

Gross d ifferential................................................................ .75 .77 .93 .68 .74 .82Net differential .................................................................. .60 .57 .83 .62 .49 .83

(.10) (.14) (.13) (.12) (.16) (.12)

Great Lakes to Southeast:Gross d ifferentia l................................................................ 1.28 1.45 1.36 1.14 1.71 1.22Net differential .................................................................. .99 1.15 1.07 .78 1.29 1.10

(.18) (.21) (.25) (.23) (.30) (.20)

N O T E : Gross d ifferentia ls were derived fro m sim ple cross-tabulations;net d ifferentia ls , fro m m u ltip le regression analysis.

41

Digitized for FRASER http://fraser.stlouisfed.org/ Federal Reserve Bank of St. Louis

Appendix B. Occupational Pay Matrix

Differences between individual occupational average hourly earnings usually have been limited to compari­sons of the high to the low average or one occupation’s average to all others. The matrix analysis is an attempt to expand upon this type of comparison to more fully understand wage changes between occupational group­ings.

Occupations were arranged along the matrix axes from highest to lowest pay levels as of November 1976. Percent differences then were computed for the 91 pay relationships each in 1970 and 1976. For example, reading across the mixers’ row, table B-l, their earnings were exceeded by 9 percent for general utility mainte­nance workers, 7 percent for tinters, and less than 0.5

Table B-1. Occupational pay relationship matrix in paints and varnishes, November 1976 and November 1970 (in parenthesis)

Occupation

Maintenanceworkers,generalutility

Tinters Shippingclerks Mixers Testers Grinders Technicians

Maintenance workers, general u t i l ity ..........Tinters ..............................................................Shipping clerks ................................................M ixers ................................................................Testers ..............................................................Grinders ...........................................................Technicians.......................................................Receiving clerks...............................................Combination mixers-grinder ........................Shipping and receiving clerks .....................Truckdrivers ....................................................Janitors..............................................................Laborers, material handling ........................

2 ( 2) 9 (11) 9 (15) 9 (13)

10 (10)10 ( 7)11 (18)12 (19)13 (16)14 (14) 18 (29) 22 (26) 25 (35)

7 ( 8) 7 (12)7 (10)8 ( 9)8 ( 4)9 (15)

10 (16)11 (13)12 (11) 16 (26) 20 (23) 22 (32)

1 ( 4) 1 ( 2) 1 ( 1)2 ( -4)2 ( 7)3 ( 8)4 ( 4)5 ( 3) 9 (16)

13 (14) 15 (22)

1 ( -2) 1 (-3 )1 (-7 )2 ( 3)3 ( 4)4 ( 1)5 ( -1) 9 (12)

13 ( 9) 15 (17)

1 (-1) 1 (-6)1 ( 5)2 ( 6)3 ( 2)4 ( 1) 8 (14)

12 (11) 14 (20)

1 (-4) 1 ( 6)2 ( 7)3 ( 4)4 ( 2) 8 (15)

12 (13) 14 (21)

1 (11) 1 (12) 2 ( 8) 3 ( 7) 7 (21)

11 (18) 13 (27)

Maintenance workers, general u t i l ity ..........Tinters................................................................Shippers ...........................................................M ixers................................................................Testers................................................................Grinders ...........................................................Technicians.......................................................Receiving clerks .............................................Mixers and grinders........................................Shipping and receiving clerks .....................Truckdrivers ....................................................Janitors..............................................................Laborers, material handling..........................Labelers and packers ....................................

Receivingclerks

Combinationmixers-grinders

Shippingand

receivingclerks

Truckdrivers JanitorsLaborers,materialhandling

Labelersand

packers

1 ( 1) 2 (-2 ) 3 ( -4) 7 ( 9)

10 ( 7) 12 (14)

1 ( -3)2 (-4) 6 ( 8)

10 ( 6) 12 (13)

1 (-1) 5 (11) 9 ( 9)

10 (17)

4 (13) 8 (10)

10 (19)4 (-2 )5 ( 5) 2 ( 7)

Less than 0 .5 percent.

42Digitized for FRASER http://fraser.stlouisfed.org/ Federal Reserve Bank of St. Louis

percent for shipping clerks in 1976; but compared to the other 10 jobs shown, the mixer earnings advantage varied from 1 to 15 percent, reading down column 4. The mean occupational difference then is computed by summing the percent differences in a given year and dividing by the number of observations. The resulting mean represents the average percent difference between occupational pairings. For example, the mean occupational difference of the 14 paints and varnishes occupations studied in both 1970 and 1976 was 7 percent in 1976 and 10 percent in 1970. The difference between two mean occupational averages then ij tested for statistical significant by using the standard T-test at the 95 percent level of confidence. If the difference is significant, it becomes possible to determine if the occupational wage structure, as a whole, has remained stable (i.e., individual occupational average hourly

earnings have maintained a constant relationship to each other); expanded (i.e., earnings have moved farther apart); or contracted (i.e., earnings have moved closer together). For example, the difference between the 1970 and 1976 mean occupational differences in paints and varnishes manufacturing industry was 3 percentage points—tested for significance—representing a contraction of the overall occupational wage structure.

By using the same methods, changes in an individual occupation’s relationship to all other occupations and to other individual occupations also can be determined. The following tabulation presents the mean differences of four occupation in both 1970 and 1976. The absolute differences—all significant—represent changes in the average advantage or disadvantage held by these occupations to others studied.

43

Digitized for FRASER http://fraser.stlouisfed.org/ Federal Reserve Bank of St. Louis

Appendix C. Scope and Method of Survey

Scope o f survey

The survey included establishments engaged primari­ly in manufacturing paints (in paste and ready mixed form), varnishes, lacquers, enamels and shellac; putties and calking compounds; wood fillers and sealers; paint and varnish removers; paint brush cleaners; and allied paint products (SIC 2851 as defined in the 1967 edition of the Standard Industrial Classification Manual pre­pared by the U.S. Office of Management and Budget). Separate auxiliary units such as central offices were excluded.

Establishments studied were selected from those employing 20 workers or more at the time of reference of the data used in compiling the universe lists. Table C-l shows the number of establishments and workers estimated to be within the scope of the survey, as well as the number actually studied by the Bureau.

M ethod o f study

Data were obtained by personal visits of the Bureau’s field staff to a representative sample of establishments within the scope of the survey. To obtain appropriate accuracy at minimum cost, a greater proportion of large than of small establishments was studied. All estimates are presented, therefore, as relating to all establishments in the industry, excluding only those below the minimum size at the time of reference of the universe data.

Establishm ent defin ition

An establishment is defined for this study as a single physical location where manufacturing operations are performed. An establishment is not necessarily identical with a company, which may consist of one establishment or more.

Em ploym ent

Estimates of the number of workers within the scope of the study are intended as a general guide to the size and composition of the industry’s labor force, rather than as precise measures of employment.

Production w orkers and O ffice w orkers

The terms “production workers” and “production and related workers,” used interchangeably in this bulletin, include working supervisors and all nonsuper- visory workers engaged in nonoffice activities. Adminis­trative, executive, professional, and technical person­nel, and force-account construction employees, who are used as a separate work force on the firm’s own properties, are excluded.

The term “office workers” includes all nonsupervi- sory office workers and excludes administrative, execu­tive, professional, and technical employees.

O ccupational classification

Occupational classification was based on a uniform set of job descriptions designed to take account of interestablishment and interarea variations in duties within the same job. (See appendix D for these descriptions.) The criteria for selection of the occu­pations were: The number of workers in the occu­pation; the usefulness of the data in collective bargain­ing; and appropriate representation of the entire job scale in the industry. Working supervisors, apprentices, learners, beginners, trainees, and handicapped, part- time, temporary, and probationary workers were not reported in the data for selected occupations but were included in the data for all production workers.

W age data

Information on wages relates to straight-time hourly earnings, excluding premium pay for overtime and for work on weekends, holidays, and late shifts. Incentive payments, such as those resulting from piecework or production bonus systems, and cost-of-living bonuses were included as part of the workers’ regular pay. Nonproduction bonus payments, such as Christmas or yearend bonuses, were excluded.

Average (mean) hourly rates or earnings for each occupation or category of workers, such as production workers, were calculated by weighting each rate (or hourly earnings) by the number of workers receiving the rate, totaling, and dividing by the number of individuals. The hourly earnings of salaried workers

44

Digitized for FRASER http://fraser.stlouisfed.org/ Federal Reserve Bank of St. Louis

Table C-l. Estim ated num ber of estab lishm ents and em ployees w ithin scope of survey and num ber studied, paints and varn ishes industry, N o vem ber 1976

Region1 and area2

Number of establishments1 Workers in establishments

Within scope of study Actually studied

Within scope of studyActually studied

Total* Production workers Office workers

United States*..................................................................... 645 292 50790 27647 7715 30779Middle Atlantic6 .................................................................. 137 68 10230 5975 1439 7186

New Brunwicks, Perth Amboy,Sayerville. N.J............................................................... 8 6 1095 703 146 1015

Newark, N.J.................................................................... 19 11 1321 884 182 1019New York, N.Y-NJ ....................................................... 44 21 1889 1186 263 999Philadelphia, P a .-N J ................................................... 21 12 2205 1194 346 1902

Border States ...................................................................... 44 23 3207 1540 484 2327Baltimore, Md................................................................. 11 7 1047 526 152 883Louisville, Ky.-lnd.......................................................... 14 9 1274 546 226 1054

Southeast* ........................................................................... 54 19 3200 1807 377 1489Atlanta. Ga..................................................................... 12 8 1100 538 201 978

Southwest*........................................................................... ■37 13 2131 1157 334 834Dallas- Ft Worth, Texas................................................ 16 10 1327 797 233 1133

Great Lakes*........................................................................ 179 70 18882 10018 2814 10000Chicago. I l l ....................................... 52 23 5870 3049 772 3849Cleveland. O h io ............................................................ 26 11 2130 1253 376 1222Detroit, Mich................................................................. 20 11 2309 1283 250 1611

Middle W est*....................................................................... 34 18 2870 1566 521 2065St Louis, Mo.—Ill ......................................................... 15 10 816 471 92 651

Pacific® ................................................................................. 91 40 5977 3283 1021 3490Los Angeles-Long Beach, C a lif ................................. 43 19 3184 1825 502 1749San Francisco-Oakland, C a lif .................................... 13 10 1411 768 276 1303

1 The regions used in this study include Middle Atlantic—H e * Jersey, New York, and Pennsylvania; Border States—Delaware, District of Columbia, Kentucky, Maryland, Virginia, and West Virginia; Southeast—Alablama, Florida, Georgia, Mississippi, North Carolina, South Carolina, and Tennessee; Southwest—Arkansas, Louisiana, Oklahoma, and Texas; Great Lakes—Illinois, Indiana, Michigan, Minnesota, Ohio, and Wisconsin; Middle West—Iowa, Kansas, Missouri, North Dakota, and South Dakota; and Pacific—California, Nevada, Oregon, and Washington

* See individual area tables 7-14 for definitions of selected areas.* Includes only those establishments with 20 workers or more at the time of reference of the universe data.* Includes executive, professional, office, and other workers in addition to the production worker category shown separately.* Includes data for regions in addition to those shown separately. Alaska and Hawaii were not included in the study.* Includes data for areas in addition to those shown separately.

NOTE: Because of rounding, sums of individual items may not equal totals.

were obtained by dividing straight-time salary by normal (or standard) hours to which the salary corresponds.

The median designates position; that is, one-half of the employees surveyed received more than this rate and one-half received less. The middle range is defined by two rates of pay such that one-fourth of the employees earned less than the lower of these rates and one-fourth earned more than the higher rate.

Size o f com m unity

Tabulations by size of community pertain to metro­politan and nonmetropolitan areas. The term “metropol­itan areas,” as used in this bulletin, refers to the

Standard Metropolitan Statistical Areas as defined by the U.S. Office of Management and Budget through February 1974. Except in New England, a Standard Metropolitan Statistical Area is defined as a county or group of contiguous counties which contains at least one city of 50,000 inhabitants or more. Counties contiguous to the one containing such a city are included in a Standard Metropolitan Statistical Area if, according to certain criteria, they are essentially metro­

politan in character and are socially and economically integrated with the central city. In New England, where the city and town are administratively more important than the county, they are the units used in defining Standard Metropolitan Statistical Areas.

Labor-m anagem ent agreem ents

Separate wage data are presented, where possible, for establishments that had (1) a majority of the production workers covered by labor-management contracts, and (2) none or a minority of the production workers covered by labor-management contracts.

M ethod o f w age paym ent

Tabulations by method of wage payment relate to the number of workers paid under the various time and incentive wage systems. Formal rate structures for time-rated workers provide single rates or a range of rates for individual job categories. In the absence of a formal rate structure, pay rates are determined primari­ly by the qualifications of the individual worker. A single rate structure is one in which the same rate is

45

Digitized for FRASER http://fraser.stlouisfed.org/ Federal Reserve Bank of St. Louis

paid to all experienced workers in the same job classification. Learners, apprentices, or probationary workers may be paid according to rate schedules which start below the single rate and permit the workers to achieve the full job rate over a period of time. An experienced worker occasionally may be paid above or below the single rate for special reasons, but such payments are exceptions. Range-of-rate plans are those in which the minimum, maximum, or both of these rates paid experienced workers for the same job are specified. Specific rates of individual workers within the range may be deter­mined by merit, length of service, or a combination of these. Incentive workers are classified under piecework of bonus plans. Piecework is work for which a predetermined rate is paid for each unit of output. Production bonuses are for pro­duction in excess of a quota or for completion of a task in less than standard time.

Scheduled w eekly hours

Data on weekly hours refer to the predominant work schedule for full-time production workers (or office workers) employed on the day shift.

Shift provisions and practices

Shift provisions relate to the policies of establishments either currently operating late shifts or having formal provisions covering late-shift work. Practices relate to workers employed on late shifts at the time of the survey.

Estab lishm ent practices and supplem entary w age provisions

Supplementary benefits in an establishment were considered applicable to all production workers (office workers) if they applied to half or more of such workers in the establishment. Similarly, if fewer than half of the workers were covered, the benefit was considered nonexistent in the establishment. Because of length-of-service and other eligibility requirements, the proportion of workers receiving the benefits may be smaller than estimated.

Paid holidays. Paid holiday provisions relate to full-day and half-day holidays provided annually.

Paid vacations. The summaries of vacation plans are limited to formal arrangements and exclude informal plans whereby time off with pay is granted at the discretion of the employer or supervisor. Payments not on a time basis were converted; for example, a payment of 2 percent of annual earnings was considered the

equivalent of 1 week’s pay. The periods of service for which data are presented represent the most common practices, but they do not necessarily reflect individual establishment provisions for progression. For example, changes in proportions indicated at 10 years of service may include changes which occurred between 5 and 10 years.

Health, insurance, and retirem ent plans

Data are presented for health, insurance, pension, and retirement severance plans for which the employer pays all or a part of the cost, excluding programs required by law such as workers’ compensation and social security. Among plans included are those under­written by a commercial insurance company and those paid directly by the employer from his current opera­ting funds or from a fund set aside for this purpose.

Death benefits are included as a form of life insur­ance. Sickness and accident insurance is limited to that type of insurance under which predetermined cash payments are made directly to the insured on a weekly or monthly basis during illness or accident disability. Information is presented for all such plans to which the employer contributes at least a part of the cost. However, in New York and New Jersey, where temporary disability insurance laws require employer contributions,1 plans are included only if the employer(1) contributes more than is legally required, or (2) provides the employees with benefits which exceed the requirements of the law.

Tabulations of paid sick leave plans are limited to formal plans which provide full pay or a proportion of the worker’s pay during absence from work because of illness; informal arrangements have been omitted. Sepa­rate tabulations are provided for (1) plans which provide full pay and no waiting period, and (2) plans providing either partial pay or a waiting period.

Long-term disability insurance plans provide pay­ments to totally disabled employees upon the expiration of sick leave, sickness and accident insurance, or both, or after a specified period of disability (typically 6 months). Payments are made until the end of disability, a maximum age, or eligibility for retirement benefits. Payments may be full or partial, but are almost always reduced by social security, workers’ compensation, and private pension benefits payable to the disabled em­ployee.

Medical insurance refers to plans providing for complete or partial payment of doctors’ fees. Such plans may be underwritten by a commercial insurance company or a nonprofit organization, or they may be a form of self-insurance.

1 The temporary disability laws in California and Rhode Island do not require employer contributions.

46

Digitized for FRASER http://fraser.stlouisfed.org/ Federal Reserve Bank of St. Louis

Major medical insurance, sometimes referred to as extended medical or catastrophe insurance, includes plans designed to cover employees for sickness or injury involving an expense which exceeds the normal coverage of hospitalization, medical, and surgical plans.

Tabulations of retirement pensions are limited to plans which provide regular payments for the remain­der of the retiree’s life. Data are presented separately for retirement severance pay (one payment or several over a specified period of time) made to employees on retirement. Establishments providing both retirement severance payments and retirement pensions to em­ployees were considered as having both retirement pensions and retirement severance plans; however, establishments having optional plans providing employ­ees a choice of either retirement severance payments or pensions were considered as having only retirement pension benefits.

Paid funeral and jury-duty leave. Data for paid funeral

and jury-duty leave relate to formal plans which provide at least partial payment for time lost as a result of attending funerals of specified family members or serving as a juror.

Supplemental unemployment benefits. Data relate to formal plans designed to supplement benefits paid under State unemployment insurance systems. Cost-of-living adjustments. Data relate to formal plans providing adjustments to wage rates in keeping with changes in the BLS consumer price index or some other measure.

Clothing allowance. Data relate to formal provisions for protective garments, such as coveralls, overalls, coats, smocks, and acid-resistant clothing, worn in lieu of or over the employees’ personal clothing; provisions for boots, glasses, hats, and gloves were excluded.

47

Digitized for FRASER http://fraser.stlouisfed.org/ Federal Reserve Bank of St. Louis

Appendix D. Occupational Descriptions

The primary purpose of preparing job descriptions for the Bureau’s wage surveys is to assist its field staff in classifying into appropriate occupations workers who are employed under a variety of payroll titles and different work arrangements from establishment to establishment and from area to area. This permits the grouping of occupational wage rates representing comparable job content. Because of this emphasis on interestablishment and interarea comparability of occupational content, the Bureau’s job descriptions may differ significantly from those in use in individual establishments or those prepared for other purposes. In applying these job descriptions, the Bureau’s field staff is instructed to exclude working supervisors, apprentices, learners, beginners, trainees, and handi­capped, part-time, temporary, and probationary workers.

Drum cleaner

Cleans drums used in the production and distribution of paint products. Work involves most o f the following: Pumping residual liquid from drum; chipping and scraping caked material from interior of drums and removing scrap­ings from drum; and scrubbing interior of drums. May presoak drum with caustic solution, haul drums to burning area, and burn off residue in drums.

Filler, hand

Fills tubes, drums, or other containers with finished products. Work involves any o f the following: Fillingcontainers by hand, using a dipper or spatula; filling con­tainers to weight or volume by setting them on scales adjusted to proper weight and controlling flow of product from a filling spout. In addition, may cap filled containers or may clean equipment at end of batch or day.

Filler, machine

Fills tubes, drums, or other containers with finished products. Work involves adjusting filling machine to fill container to correct volume and feeding containers into machine. In addition, may cap filled containers or may clean equipment at end of batch or day.

Janitor

(Cleaner, porter; sweeper; charworker)

Cleans and keeps in an orderly condition factory working areas and washrooms, or premises of an office. Duties involve a combination o f the following: Sweeping, mopping, or scrubbing, and polishing floors; removing chips, trash

and other refuse; dusting equipment, furniture, or fixtures; polishing metal fixtures or trimmings; providing supplies and minor maintenance services,cleaning lavatories, showers, and restrooms. Workers who specialize in window washing are excluded.

Labeler and packer

Pastes identifying labels on cans or other containers by hand or by means of a labeling machine, and/or packs labeled containers into boxes or cartons. This is a produc­tion job and excludes shipping packers.

Laborer, material handling

(Loader and unloader; handler and stacker; shelver; trucker; stocker or stock helper; warehouse worker or warehouse helper)

A worker employed in a warehouse, manufacturing plant, store, or other establishment whose duties involve one or more o f the following: Loading and unloadingvarious materials and merchandise on or from freight cars, trucks or other transporting devices; unpacking; shelving, or placing materials or merchandise in proper storage loca­tion; transporting materials or merchandise by hand truck, car,or wheelbarrow to proper location. Longshore workers who load and unload ships, are excluded.

Maintenance workers, general utility

Keeps the machines, mechanical equipment and/or structure of an establishment (usually a small plant where specialization in maintenance work is impractical) in repair. Duties involve the performance of operations and the use

48

Digitized for FRASER http://fraser.stlouisfed.org/ Federal Reserve Bank of St. Louis

of tools and equipment of several trades, rather than specialization in one trade or one type of maintenance work only. Work involves a combination o f the following: Planning and laying out of work relating to repair of build­ings, machines, mechanical equipment; installing, aligning and balancing new equipment; repairing buildings, floors, stairs, as well as making and repairing bins, cribs, and partitions.

Mixer-grinder

Tends equipment which mixes and/or grinds liquid and solid ingredients used to make products such as paints, varnishes, lacquers, enamels, and shellacs. Workers who operate equipment to only crush, grind, or pulverize dry materials or dry pigments are excluded.

For wage survey purposes, workers are to be classified according to whether the equipment they tend does both mixing and grinding or is limited to only one operation as follows:

Mixer — Tends equipment which mixes pigments with a portion of the vehicle (which may consist of oils, alkyde resins) to form a smooth uniform paste ready for the grinding operation. (See Grinder.) Work involves the following: Selecting, weighting, and measuring outpigments and selecting quantities of vehicle required by formula or batch ticket; charging or loading ingre­dients into mixer; and operating equipment. May also clean mixer.

Grinder— Tends equipment which grinds paste received from mixing machines to insure proper dispersion of mixed paste in the vehicle. (See Mixer.) Work involves the following: Setting controls of mills, starting flow of paste, and rerunning batch when necessary. May also operate screening equipment.Combination mixer-grinder — Tends operation of equip­ment which performs a combination of the operations indicated under mixer and grinder. Equipment may perform one or more of these operations automatically.

Shipping and receiving clerk

Prepares merchandise for shipment, or receives and is responsible for incoming shipments of merchandise or other materials. Shipping work involves: A knowledge of shipping procedures, practices, routes, available means of transporta­tion and rates; and preparing records of the goods shipped, making up bills of lading, posting weight and shipping charges, and keeping a file of shipping records. May direct or assist in preparing the merchandise for shipment. Re­ceiving work involves: Verifying or directing other inverifying the correctness of shipments against bills of lading, invoices, or other records; checking for shortages and reject­ing damaged goods; routing merchandise or materials to proper departments; maintaining necessary records and files.

For wage study purposes, workers are classifed as follows:

Shipping clerkReceiving clerkShipping and receiving clerk

Technician

(Laboratory assistant)

Performs routine, predetermined chemical tests under the supervision of a chemist or plant supervisory to deter­mine whether purchased raw materials meet specifications and/or whether processing is being performed according to plant standards or specifications. In addition, may per­form some of the duties of the PRODUCT TESTER, such as conducting physical tests to determine viscosity, color, and weight. Employees performing the duties of a techni­cian as part of a training program leading to position as professional chemists are excluded.

Tester, product

(Inspector)

Conducts standard and routine simple physical tests to determine quality, viscosity, color, and weight of paint products. Tests consist of comparisons between finished products and standard samples or specifications. Workers performing chemical as well as physical tests are classified as TECHNICIANS.

Thinners

Adds vehicles as required by specifications to paste and semi-paste mixtures and agitates to the consistency designated on batch ticket or other specifications.

Tinter

Colors or tints paints; Work involves a combination o f the following: Blending basic color pigments in correctproportions to match standard color sample or according to specifications; using hand paddle or power mixer to mix ingredients thoroughly; checking weight and/or viscosity of batch against sample or specifications, and making necessary additions to mixture to meet requirements.Truckdriver

Drives a truck within a city or industrial area to transport materials,merchandise, equipment, or men between various types of establishments such as: Manufacturing plants,freight depots, warehouses, wholesale and retail establish­ments, or between retail establishments and customers’ houses or places of business. May also load or unload truck with or without helpers, make minor mechanical repairs, and keep truck in good working orders. Driver-sales personnel and over-the-road drivers are excluded.

Truckers, power (forklift)

Operates a manually controlled gasoline- or electric- powered truck or tractor to transport goods and materials of all kinds about a warehouse, manufacturing plant, or other establishment.

49

Digitized for FRASER http://fraser.stlouisfed.org/ Federal Reserve Bank of St. Louis

Industry Wage Studies

The most recent reports providing occupational wage data for industries included in the Bureau’s program of in­dustry wage surveys since 1960 are listed below. Copies are for sale from the Superintendent of Documents, U.S. Gov­ernment Printing Office, Washington, D.C. 20402, or from

Manufacturing

Basic Iron and Steel, 1972. BLS Bulletin 1839 Candy and Other Confectionery Products, 1975. BLS Bul­

letin 1939Cigar Manufacturing, 1972. BLS Bulletin 1796 Cigarette Manufacturing, 1976, BLS Bulletin 1944 Corrugated and solid fiber boxes, 1976. BLS Bulletin 1921 Fabricated Structural Steel, 1974. BLS Bulletin 1935 Fertilizer Manufacturing, 1971. BLS Bulletin 1763 Flour and Other Grain Mill Products, 1972. BLS Bulletin

1803Fluid Milk Industry, 1973. BLS Bulletin 1871 Footwear, 1975. BLS Bulletin 1946 Hosiery, 1973. BLS Bulletin 1863 Industrial Chemicals, 1971. BLS Bulletin 1768 Iron and Steel Foundries, 1973. BLS Bulletin 1894 Leather Tanning and Finishing, 1973. BLS Bulletin 1835 Machinery Manufacturing, 1974-75. BLS Bulletin 1929 Meat Products, 1974, BLS Bulletin 1896 Men’s and Boys’ Separate Trousers, 1974. BLS Bulletin

1906Men’s and Boys’ Shirts (Except Work Shirts) and Night­

wear, 1974. BLS Bulletin 1901 Men’s and Boys’ Suits and Coats, 1976. BLS Bulletin

1962Miscellaneous Plastics Products, 1974. BLS Bulletin 1914 Motor Vehicles and Parts, 1973-74. BLS Bulletin 1912 Nonferrous Foundries, 1975. BLS Bulletin 1952 Paints and Varnishes, 1975. BLS Bulletin 1973 Paperboard Containers and Boxes, 1970. BLS Bulletin 1719 Petroleum Refining, 1976. BLS Bulletin 1948 Pressed or Blown Glass and Glassware, 1975. BLS Bulletin

1923Pulp, Paper, and Paperboard Mills, 1972. BLS Bulletin 1844 Shipbuilding and Repairing, 1976. BLS Bulletin 1968 Southern Sawmills and Planing Mills, 1969. BLS Bulletin

1694Structural Clay Products, 1975. BLS Bulletin 1942Synthetic Fibers, 1976. BLS Bulletin 1975Textile Dyeing and Finishing, 1976. BLS Bulletin 1967

any of its regional sales offices, and from the regional of­fices of the Bureau of Labor Statistics shown on the inside back cover. Copies that are out of stock are available for reference purposes at leading public, college, or university libraries, or at the Bureau’s Washington or regional offices.

Manufacturing- Continued

Textiles, 1975. BLS Bulletin 1945Wages and Demographic Characteristics in Work Clothing

Manufacturing, 1972. BLS Bulletin 1858 West Coast Sawmilling, 1969. BLS Bulletin 1704 Women’s and Misses’ Coats and Suits, 1970. BLS Bulletin

1728Women’s and Misses’ Dresses, 1974. BLS Bulletin 1908 Wood Household Furniture, Except Upholstered, 1974.

BLS Bulletin 1930

Nonmanufacturing

Appliance Repair Shops, 1975. BLS Bulletin 1936 Auto Dealer Repair Shops, 1973. BLS Bulletin 1876 Banking, 1973. BLS Bulletin 1862 Bituminous Coal Mining, 1967. BLS Bulletin 1583 Communications, 1975. BLS Bulletin 1954 Contract Cleaning Services, 1974. BLS Bulletin 1916 Contract Construction, 1973. BLS Bulletin 1911 Crude Petroleum and Natural Gas Production, 1972. BLS

Bulletin 1797Department Stores, 1973. BLS Bulletin 1869 Educational Institutions: Nonteaching Employees, 1968-

69. BLS Bulletin 1671Electric and Gas Utilities, 1972. BLS Bulletin 1834 Hospitals, 1975. BLS Bulletin 1949 Hotels and Motels, 1973. BLS Bulletin 1883 Laundry and Cleaning Services, 1968. BLS Bulletin 16451 Life Insurance, 1971. BLS Bulletin 1791 Metal Mining, 1972. BLS Bulletin 1820 Motion Picture Theaters, 1966. BLS Bulletin 15421 Nursing Homes and Related Facilities 1973. BLS Bulletin

1855Scheduled Airlines, 1975. BLS Bulletin 1951 Wages and Tips in Restaurants and Hotels, 1970. BLS Bul­

letin 1712

1 Bulletin out o f stock.

■fr U.S. GOVERNMENT PRINTING OFFICE : 1977 0 —2 6 1 - 0 1 7

Digitized for FRASER http://fraser.stlouisfed.org/ Federal Reserve Bank of St. Louis

Bureau of Labor Statistics Regional Offices

Region I1603 JFK Federal Building Government Center Boston, Mass. 02203 Phone: (617) 223-6761

Region IISuite 3400 1515 Broadway New York, N Y. 10036 Phone: (212)399-5405

Region III3535 Market Street P.O. Box 13309 Philadelphia, Pa. 19101 Phone: (215) 596-1154

Region IV1371 Peachtree Street, NE. Atlanta, Ga. 30309 Phone: (404)881-4418

Region V9th FloorFederal Office Building 230 S. Dearborn Street Chicago, III. 60604 Phone: (312) 353-1880

Region VISecond Floor555 Griffin Square Building Dallas, Tex. 75202 Phone: (214) 749-3516

Regions VII and VIII*911 Walnut Street Kansas City, Mo. 64106 Phone: (816)374-2481

Regions IX and X**450 Golden Gate Avenue Box 36017San Francisco, Calif 94102 Phone: (415) 556-4678

‘ Regions VII and VIII are serviced by Kansas City

“ Regions IX and X are serviced by San Francisco

Digitized for FRASER http://fraser.stlouisfed.org/ Federal Reserve Bank of St. Louis

U. S. Department of Labor Bureau of Labor Statistics Washington, D.C. 20212Official Business Penalty for private use, $300

Postage and Fees Paid U.S. Department of Labor

Third Class MailLab-441

Digitized for FRASER http://fraser.stlouisfed.org/ Federal Reserve Bank of St. Louis


Recommended