<=>?. o ' Area Wage Survey Kansas City, Missouri-Kansas, Metropolitan Area September 1979 U.S. Department of Labor Bureau of Labor Statistics Bulletin 2050-58 ?>Y ' V Digitized for FRASER http://fraser.stlouisfed.org/ Federal Reserve Bank of St. Louis
Transcript
< = > ? . o '
Area Wage Survey
Kansas City, Missouri-Kansas, Metropolitan Area September 1979
U.S. Department of Labor Bureau of Labor Statistics
Bulletin 2050-58
?>Y' V
Digitized for FRASER http://fraser.stlouisfed.org/ Federal Reserve Bank of St. Louis
Preface
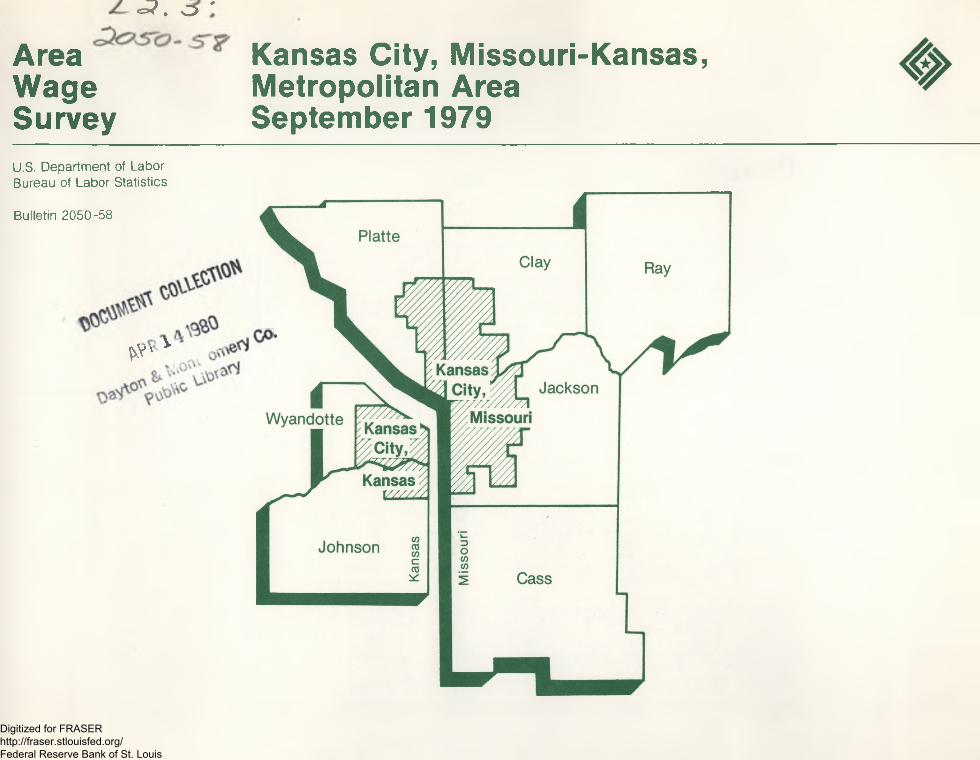
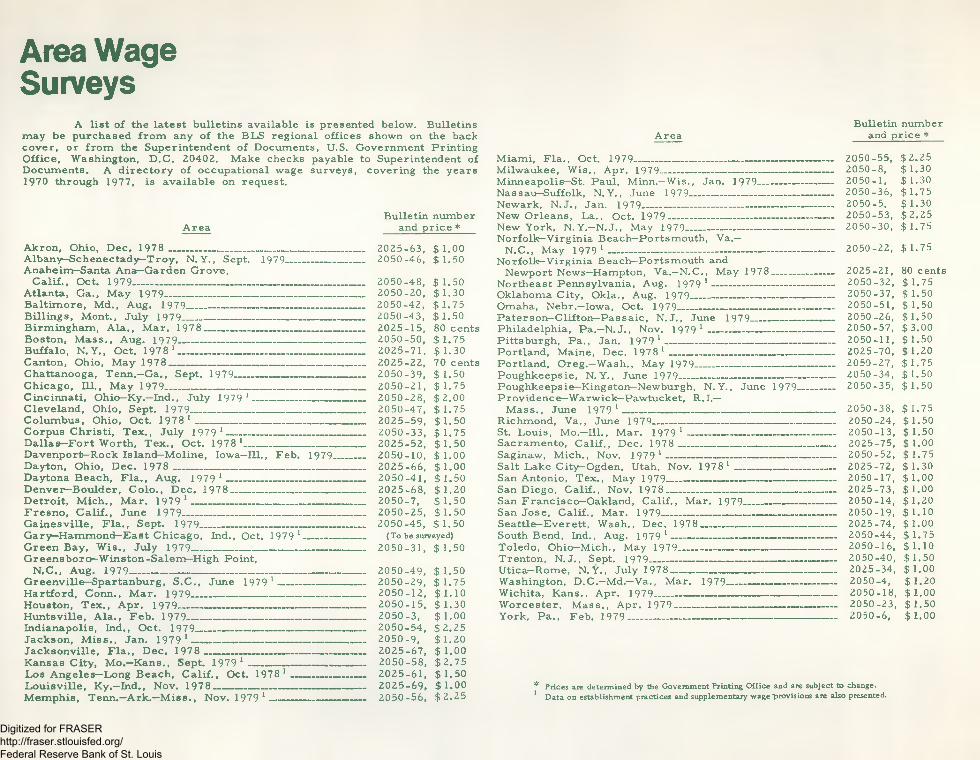
This bulletin provides results of a September 1979 survey of occupational earnings and supplementary wage benefits in the Kansas City, Missouri— Kansas, Standard Metropolitan Statistical Area. The survey was made as part of the Bureau of Labor Statistics' annual area wage survey program. It was conducted by the Bureau' s regional office in Kansas City, Mo., under the general direction of Edward Chaiken, Assistant Regional Commissioner for Operations. The survey could not have been accomplished without the cooperation of the many firms whose wage and salary data provided the basis for the statistical information in this bulletin. The Bureau wishes to express sincere appreciation for the cooperation received.
Material in this publication is in the public domain and may be reproduced without permission of the Federal Government. Please credit the Bureau of Labor Statistics and cite the name and number of this publication.
Note:Information in this bulletin relates to selected industries in the
private sector. Major exclusions from the scope of the survey are government operations, mining, construction, and certain services-related industries. (See appendix A). In this area, a test survey was conducted to include these industries (except Federal government operations). Seven additional occupational classifications— accountants, buyers, chemists, engineers, engineering technicians, personnel clerks, and purchasing clerks— were also studied. Results of the survey are available, without cost, from the Bureau's regional offices.
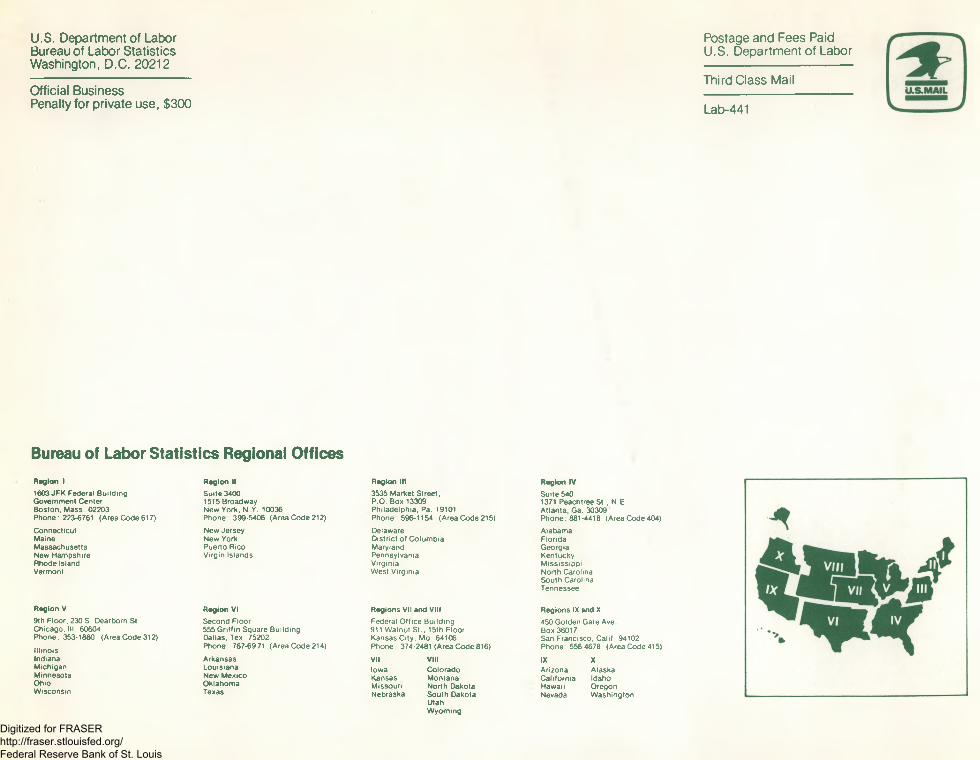
Reports on occupational earnings and supplementary wage provisions in the Kansas City area are available for the computer and data processing services (March 1978), hospitals (May 1978), hotels and motels (May 1978), nursing and personal care facilities (June 1978), and auto dealer repair shops (June 1978) industries. Listings of union wage rates are available for building trades, printing trades, local-transit operating employees, local truckdrivers and helpers, and grocery store employees. A report on occupational wages and supplementary benefits for municipal government workers in the city of Kansas City is also available. Free copies of these are available from the Bureau' s regional offices. (See back cover for addresses.)
Digitized for FRASER http://fraser.stlouisfed.org/ Federal Reserve Bank of St. Louis
Area Kansas City, Missouri-Kansas,Wage Metropolitan AreaSurvey September 1979U.S. Department of Labor Ray Marshall, SecretaryBureau of Labor Statistics Janet L. Norwood, Commissioner
March 1980
Bulletin 2050-58
For sale by the Superintendent of Documents. U.S. Government Printing Office. Washington, D.C. 20402, GPO Bookstores, or BLS Regional Offices listed on back cover. Price $2.75. Make checks payable to Superintendent of Documents.
B-6. Health, insurance, and pensionplans for full-time workers____________ 31
B-7. Life insurance plans forfull-time workers_____________________ 32
Appendix A. Scope and method of survey_________ 35Appendix B. Occupational descriptions___________ 40
Digitized for FRASER http://fraser.stlouisfed.org/ Federal Reserve Bank of St. Louis
Introduction
This area is 1 of 72 in which the U.S. Department of Labor' s Bureau of Labor Statistics conducts surveys of occupational earnings and related benefits. (See list of areas on inside back cover.) In each area, earnings data for selected occupations (A -series tables) are collected annually. Information on establishment practices and supplementary wage benefits (B -series tables) is obtained every third year.
Each year after all individual area wage surveys have been com pleted, two summary bulletins are issued. The first brings together data for each metropolitan area surveyed; the second presents national and re gional estimates, projected from individual metropolitan area data, for all Standard Metropolitan Statistical Areas in the United States, excluding Alaska and Hawaii.
A major consideration in the area wage survey program is the need to describe the level and movement of wages in a variety of labor markets, through the analysis of (1) the level and distribution of wages by occupation, and (2) the movement of wages by occupational category and skill level. The program develops information that may be used for many purposes, including wage and salary administration, collective bargaining, and a s sistance in determining plant location. Survey results also are used by the U.S. Department of Labor to make wage determinations under the Service Contract Act of 1965.
A -series tables
Tables A - l through A -6 provide estimates of straight-time weekly or hourly earnings for workers in occupations common to a variety of manufacturing and nonmanufacturing industries. The occupations are defined in appendix B. For the 31 largest survey areas, tables A -1 0 through A -15 provide similar data for establishments employing 500 workers or more.
Table A -7 provides percent changes in average hourly earnings of office clerical workers, electronic data processing workers, industrial nurses, skilled maintenance trades workers, and unskilled plant workers.
Where possible, data are presented for all industries and for manufacturing and nonmanufacturing separately. Data are not presented for skilled maintenance workers in nonmanufacturing because the number of workers em ployed in this occupational group in nonmanufacturing is too small to warrant separate presentation. This table provides a measure of wage trends after elimination of changes in average earnings caused by employment shifts among establishments as well as turnover of establishments included in survey samples. For further details, see appendix A.
Tables A -8 and A -9 provide for the first time measures of average pay relationships within establishments. These measures may differ considerably from the pay relationships of overall averages published in tables A - l through A -6 . See appendix A for details.
B -series tables
The B -series tables present information on minimum entrance salaries for inexperienced typists and clerks; late-shift pay provisions and practices for production and related workers in manufacturing; and data separately for production and related workers and office workers on scheduled weekly hours and days of first-shift workers; paid holidays; paid vacations; health, insurance, and pension plans; and more detailed information on life insurance plans.
Appendixes
Appendix A describes the methods and concepts used in the area wage survey program. It provides information on the scope of the area survey, the area's industrial composition in manufacturing, and labor- management agreement coverage.
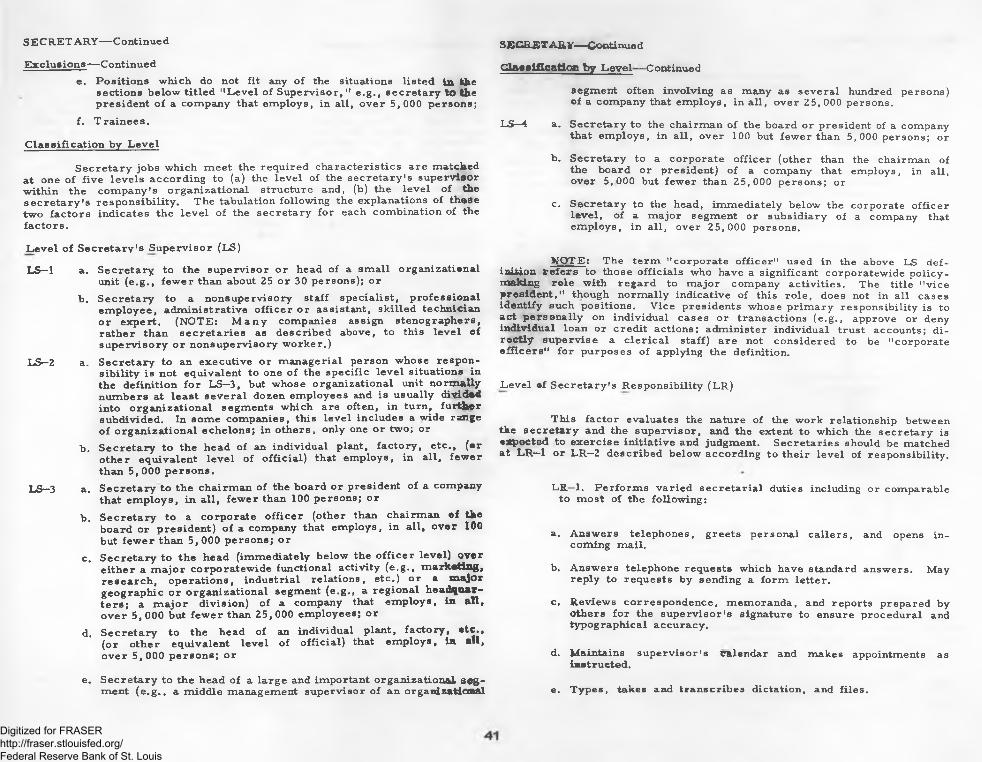
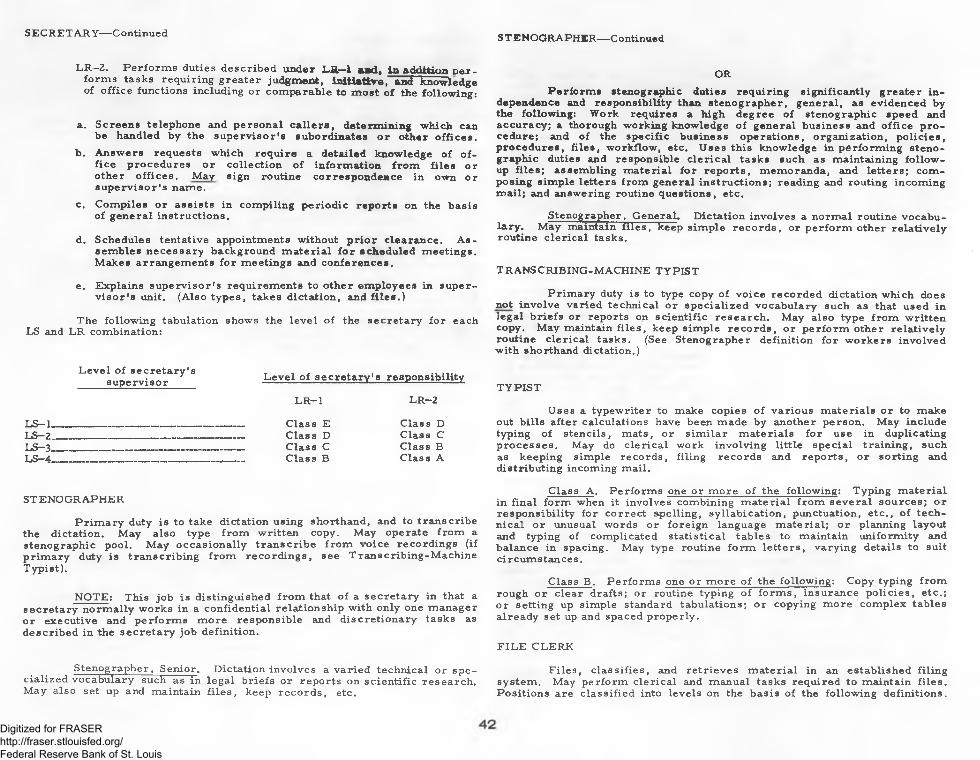
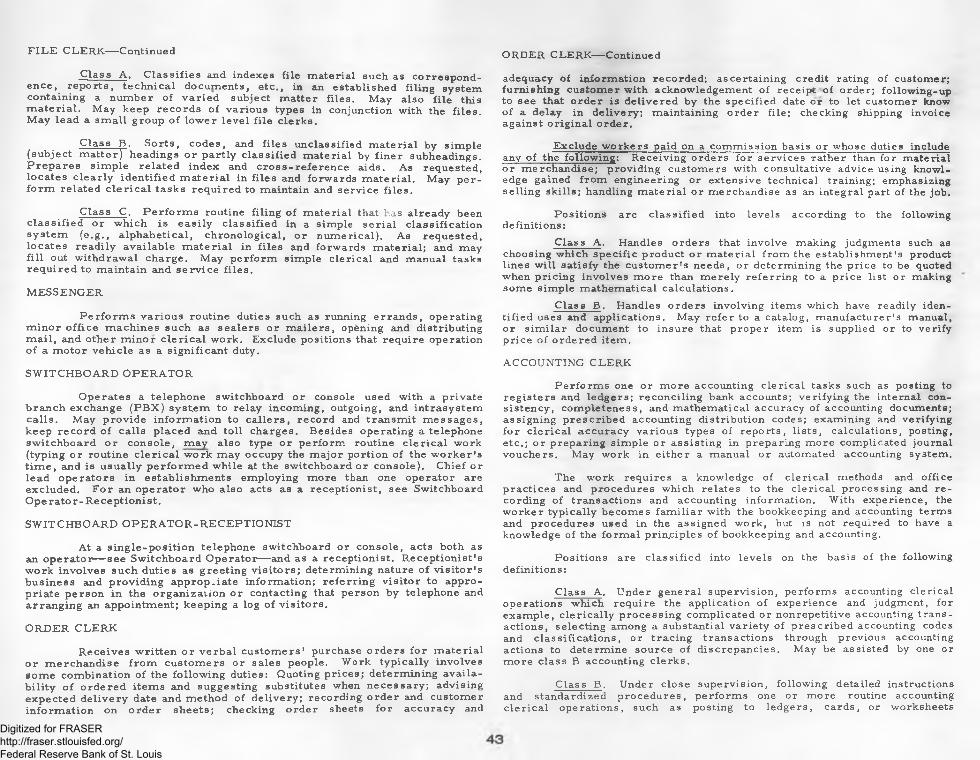
Appendix B provides job descriptions used by Bureau field representatives to classify workers by occupation.
Digitized for FRASER http://fraser.stlouisfed.org/ Federal Reserve Bank of St. Louis
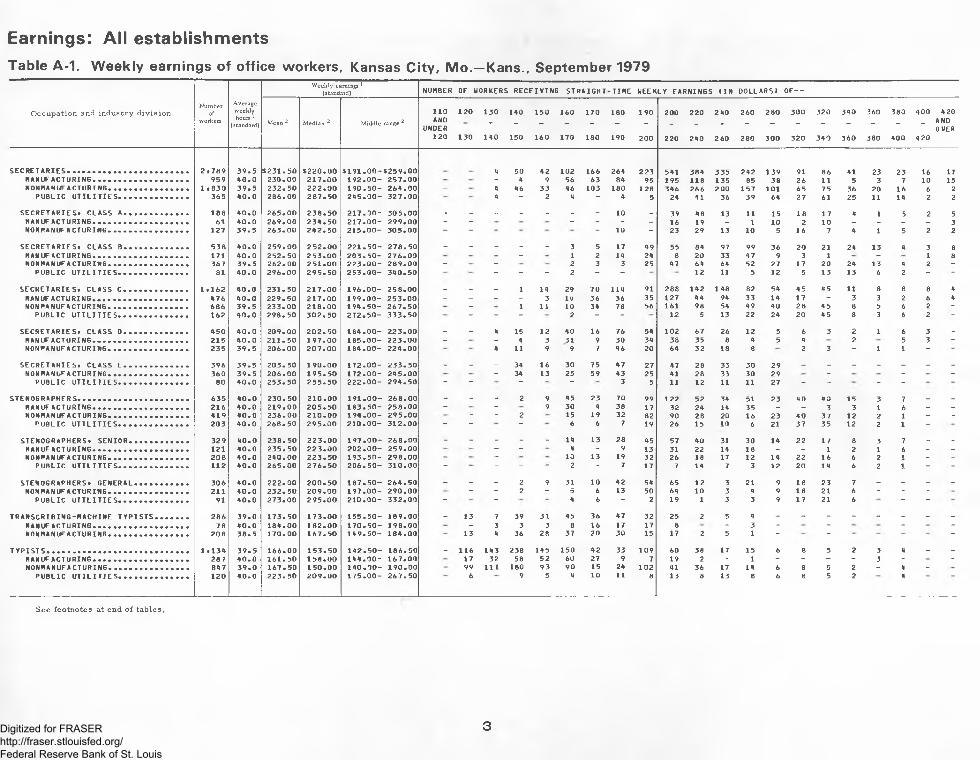
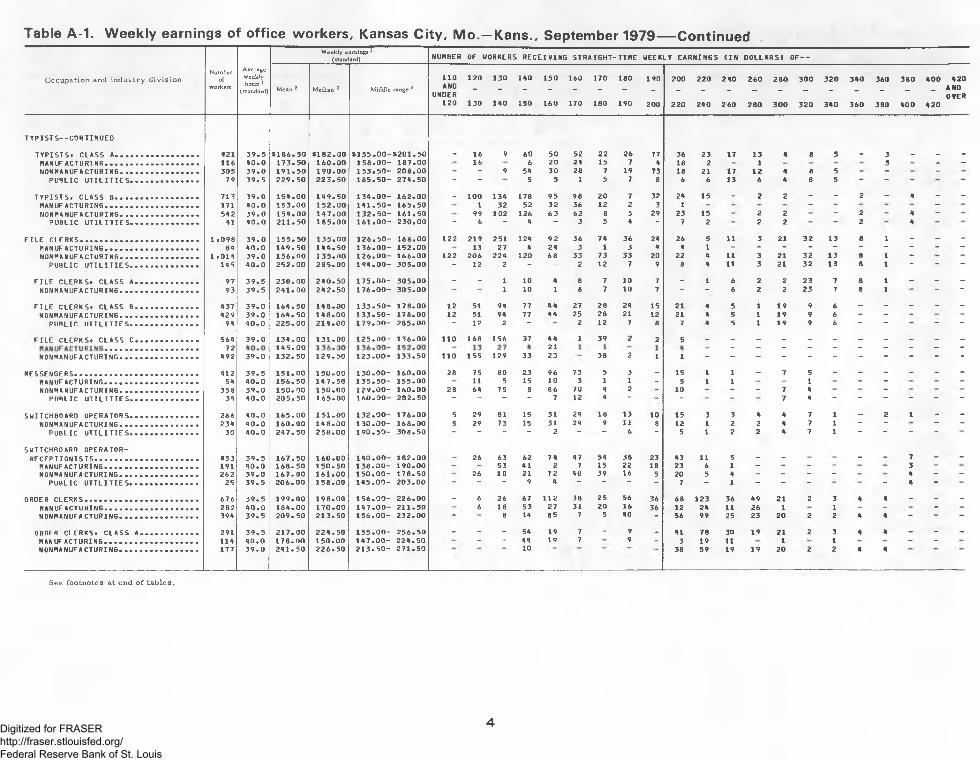
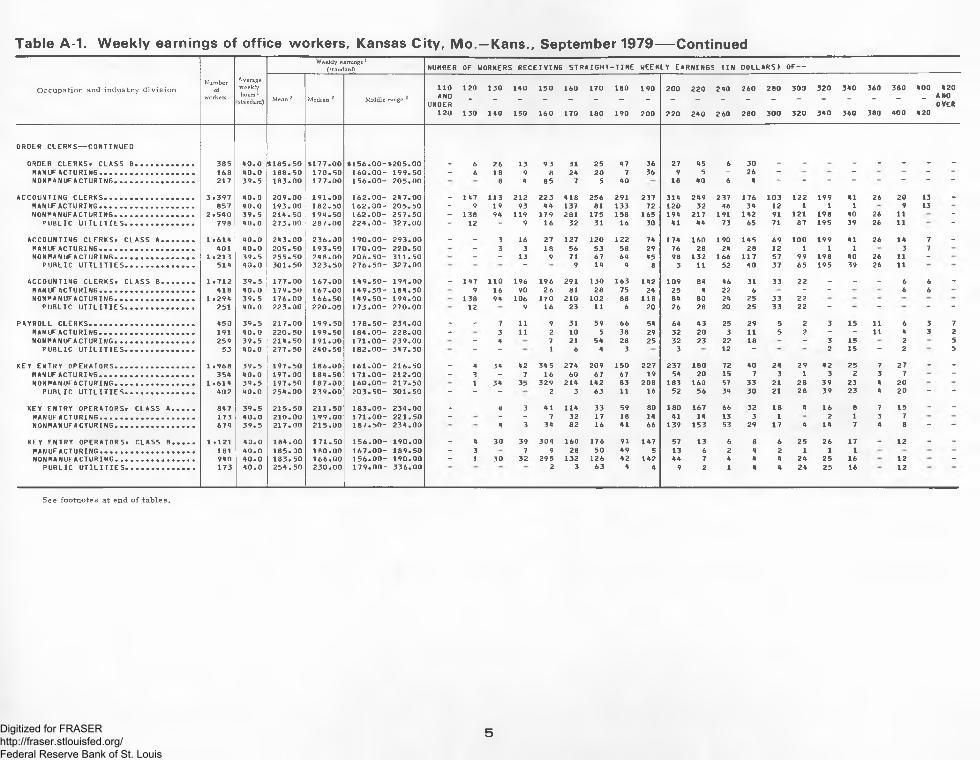
Earnings: All establishmentsTable A-1. Weekly earnings of office workers, Kansas City, Mo.—Kans., September 1979
O ccupa tion and in d u s try d iv is io nNumber
ofworkers
Average weekly hours 1
(standard)
Weekly earnings 1 (standard) NUMBER OF WORKERS RECEIVING STRAIGHT -TIME WEEKLY EARNINGS (IN DOLLARS! OF —
PUBLIC U T IL IT IE S ............................................... 54 4 0 .0 350 .00 344 .50 2 7 2 .0 0 - 397.00 * “ “ 9 6 3 4 5 1 5 8 13 “ “ “
COMPUTER OPERATORS. CLASS B ................... 612 39 .5 238 .00 232 .00 1 9 7 .5 0 - 268 .00 1 38 120 96 68 125 68 37 6 11 24 3 4 4 6 1 _ - - - -MANUFACTURING........................................................... 163 39 .5 247.50 244 .00 2 04 .0 0 - 276 .00 4 17 31 17 40 22 11 3 11 1 1 1 1 2 1 - - -n o n m a n u f a c t u r in g ..................................................... 449 39 .5 234.50 225 .50 190 .0 0 - 259.00 1 34 103 65 51 85 46 26 3 - 23 2 3 3 4 - ~
PUBLIC U T IL IT IE S ............................ 82 40 .0 270 .50 298 .00 1 94 .0 0 - 340.50 6 15 9 4 4 18 23 3
See footn otes at end o f ta b les .
6Digitized for FRASER http://fraser.stlouisfed.org/ Federal Reserve Bank of St. Louis
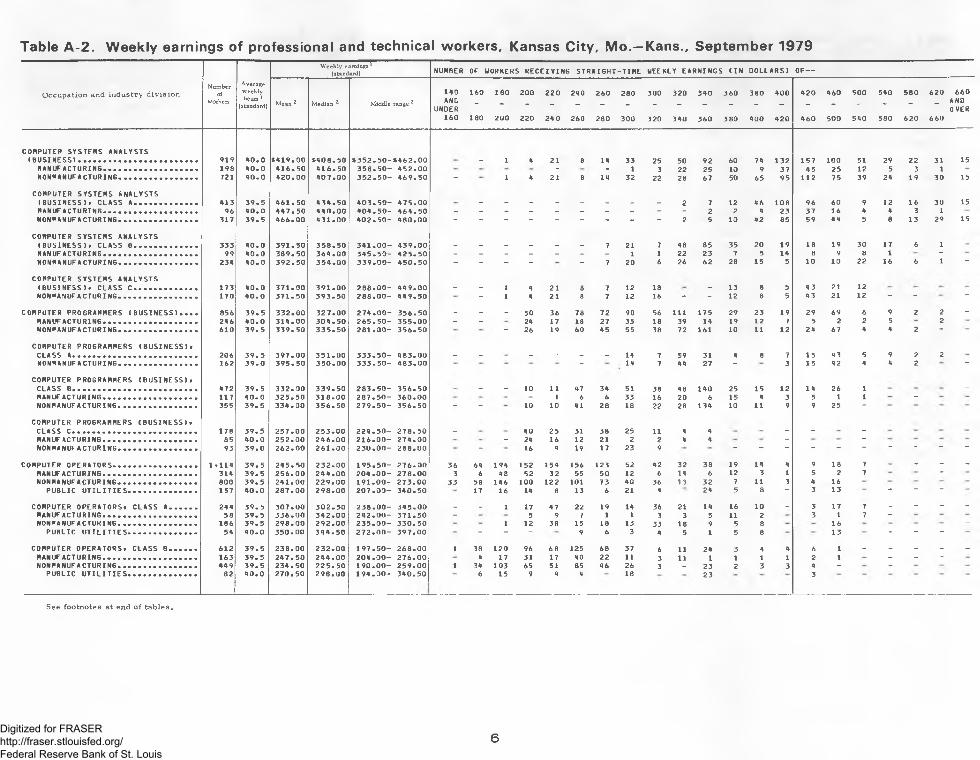
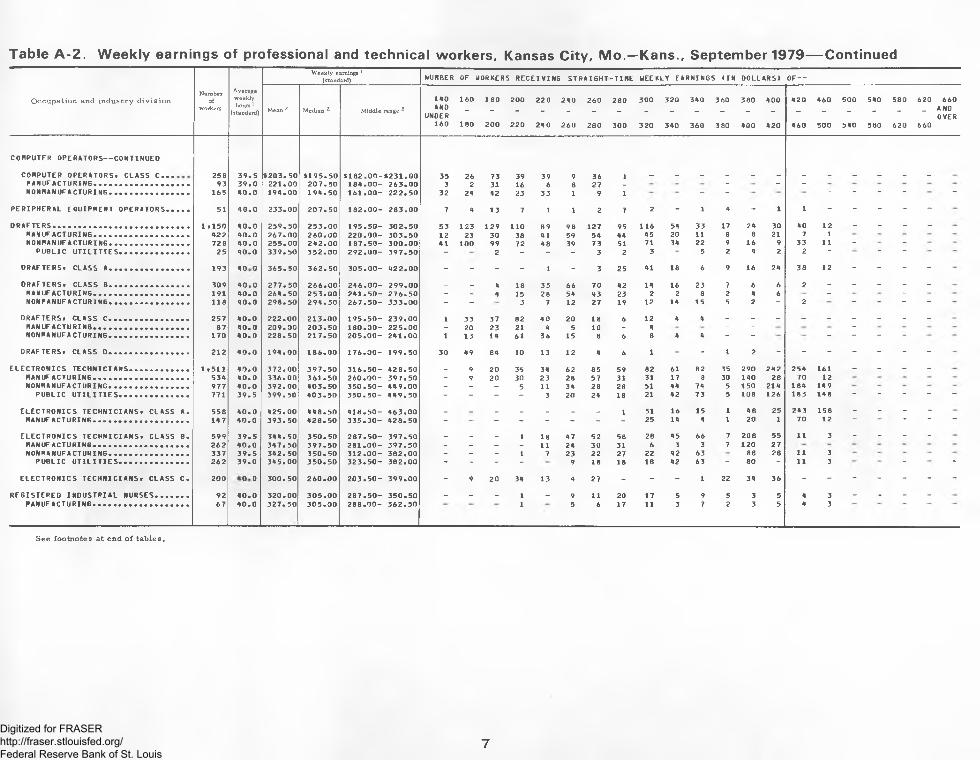
Table A-2. Weekly earnings of professional and technical workers, Kansas City, Mo.—Kans., September 1979— ContinuedW eekly earnings 1
(standard) NUMBER OF WORKERS RECEIVING STRAIGHT -TIME WEEKLY EARNIN6S (IN DOLLARS 1 OF —
O ccupation and in d u s try d iv is io nNumber
o fworkers
Average w eek ly hours 1
(standard) Mean 2 M edian 2 M iddle range 2
140ANO
UNDER160
160
180
180
200
200
220
220
240
240
260
260
280
280
300
300
3 20
320
340
340
360
360
3 80
3 80
400
400
420
420
460
460
500
500
540
540
580
580
620
620 660 AND OVER
660
COMPUTER OPERATORS— CONTINUED
COMPUTER OPERATORS* CLASS C . . . 258 39 .5 4203.50 $195.50 $182 .00 - $231.00 35 26 73 39 39 9 36 1m a n u f a c t u r in g ................................. 93 39.0 221.00 207 .50 1 84 .00 - 263.00 3 2 31 16 6 8 27 - - - -n o n h a n u f a c t u r in g ........................... 165 40 .0 194.00 194 .50 1 61 .00 - 222.50 32 24 42 23 33 1 9 1 “ “ " “ “ “ “
Digitized for FRASER http://fraser.stlouisfed.org/ Federal Reserve Bank of St. Louis
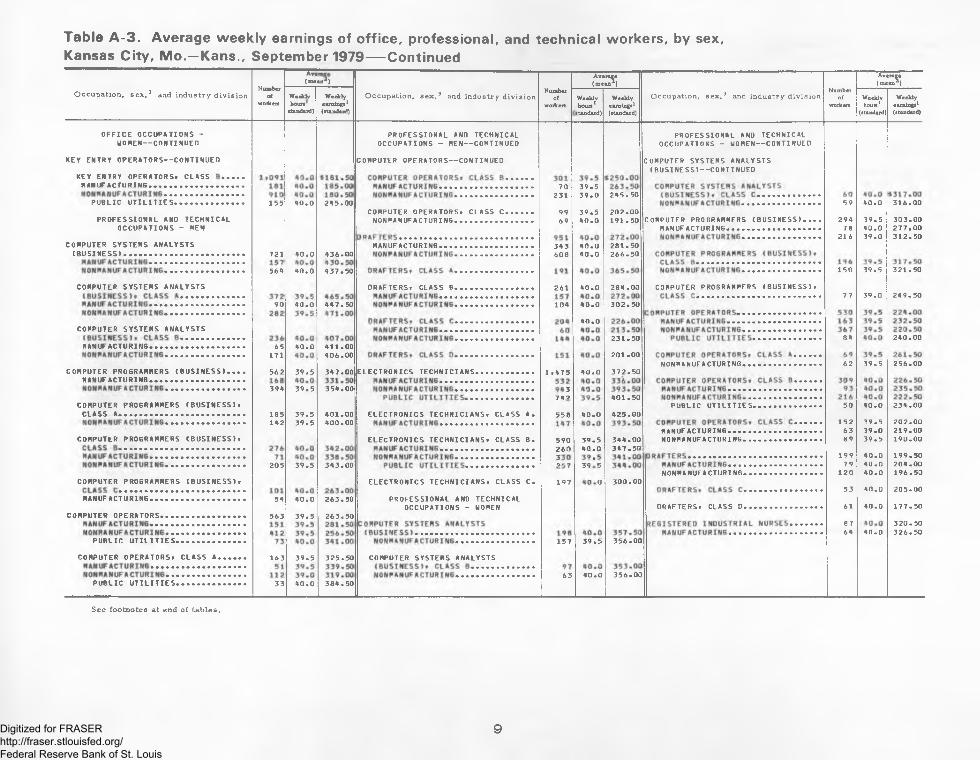
Table A-3. Average weekly earnings of office, professional, and technical workers, by sex.Kansas City, Mo.—Kans., September 1979— Continued
O ccupa tion , s e x ,3 and in d u s try d iv is io nNumber
ofworkers
Av*(me«**)
O ccupation, sex, 3 and in dustry d iv is io n
Average(mean2)
O ccupation , se x .3 and in dustry d iv is io nNumber
ofworkers
Average(mean2)
Week hr hours
[standard)
Weeklyearnings1(standard)
Numberof
workersWeeklvhours1
standard)
Weeklyearnings1(standard)
Weeklvhours1
(standard)
Weeklyearnings1(standard)
O FFICE OCCUPATIONS - PROFESSIONAL AND TECHNICAL PROFESSIONAL AND TECHNICALWOHEN— CONTINUED OCCUPATIONS - MEN— CONTINUED OCCUPATIONS - WOMEN— CONTINUED
KEY ENTRY OPERATORS— CONTINUED COMPUTER OPERATORS— CONTINUED COMPUTER SYSTEMS ANALYSTS(BUSINESS)— CONTINUED
PUBLIC U T I L I T I E S . .......................... 155 40.0 245.00 59 40.0 316.00COMPUTER OPERATORS. CLASS C ........... 99 3 9 .5 202.00
PROFESSIONAL AND TECHNICAL NONMANUFACTURING................................. 69 40 .0 191.50 COMPUTER PROGRAMMERS (B U S IN E S S ) . . . . 294 39.5 303.00OCCUPATIONS - PEN MANUFACTURING....................................... 78 40.0 277.00
21 6 39.0 312.50COMPUTER SYSTEMS ANALYSTS MANUFACTURING....................................... 343 40.0 281.50
( B U S I N E S S ) . . . . . . . . . . . . . . . . . . . . . . . . 721 40.0 436.00 608 40 .0 266.50
564 40.0 437.50 150 39.5 321.50
COMPUTER SYSTEMS ANALYSTS DRAFTERS. CLASS B................................. 261 40.0 284.00 COMPUTER PROGRAMMERS (BUSINESS).7 7 39.0 249.50
COMPUTER PROGRAMMERS (B U S IN E S S ) . . . . 562 39.5 347.00 ELECTRONICS TECHNICIANS........................ 1 .475 40.0 372.50M A N U FAC TU R IN G ..,................................
394 39.5 354.007*1^ 401.50
COMPUTER PROGRAMMERS (BU S IN E SS ) • PUBLIC U T IL IT IE S ............................ 50 40.0 234.00CLASS A...................................................... 185 39.5 401.00 ELECTRONICS TECHNICIANS* CLASS A. 558 40.0 425.00
NONMANUFACTURING................................. 120 40.0 196.50COMPUTER PROGRAMMERS (BUSINESS)* ELECTRONICS TECHNICIANS. CLASS C . 197 0 O 300.00
53 4 0 . 0 205.00MANUFACTURING..................................... 54 40.0 263.50 PROFESSIONAL AND TECHNICAL
OCCUPATIONS - WOMEN ORAFTERS. CLASS D ................................. 61 40.0 177.50COMPUTER OPERATORS................................... 563 39.5 263.50
87 320.5064 40.0 326.50
PUBLIC U T I L I T I E S . . . . . . . . . . . . . . 157 3 9 .5 356.00
COMPUTER OPERATORS. CLASS A ........... 163 39.5 325.50 COMPUTER SYSTEMS ANALYSTS
63 40 .0 356.00PUBLIC U T IL IT IE S ............................. 33 40 .0 384.50
See footn otes at end o f ta b les .
9Digitized for FRASER http://fraser.stlouisfed.org/ Federal Reserve Bank of St. Louis
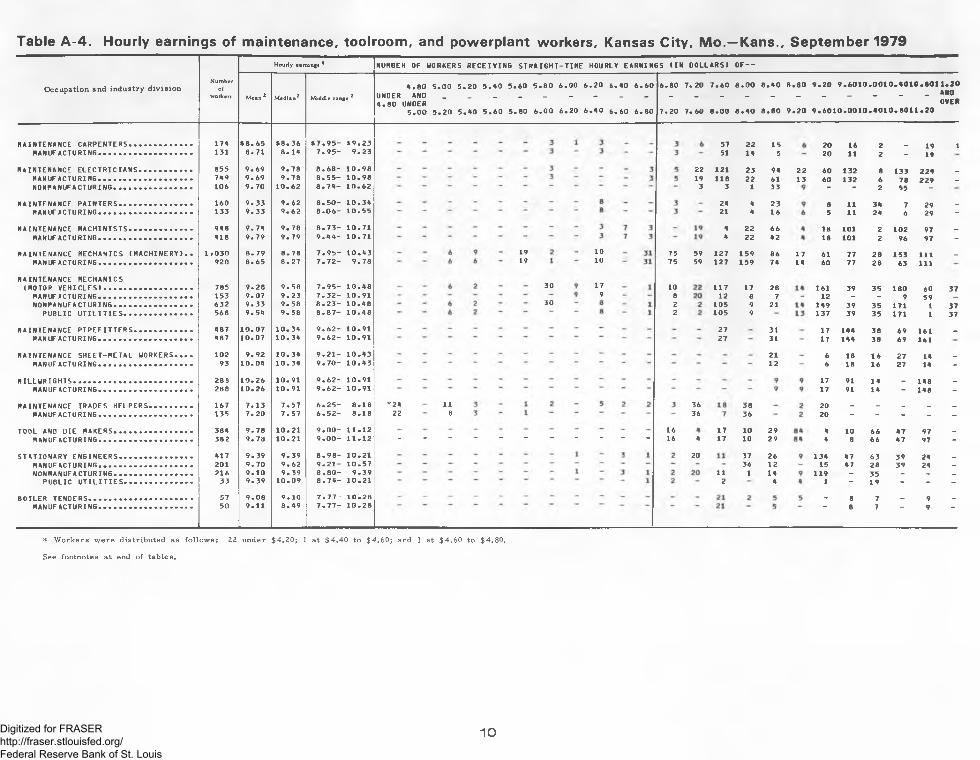
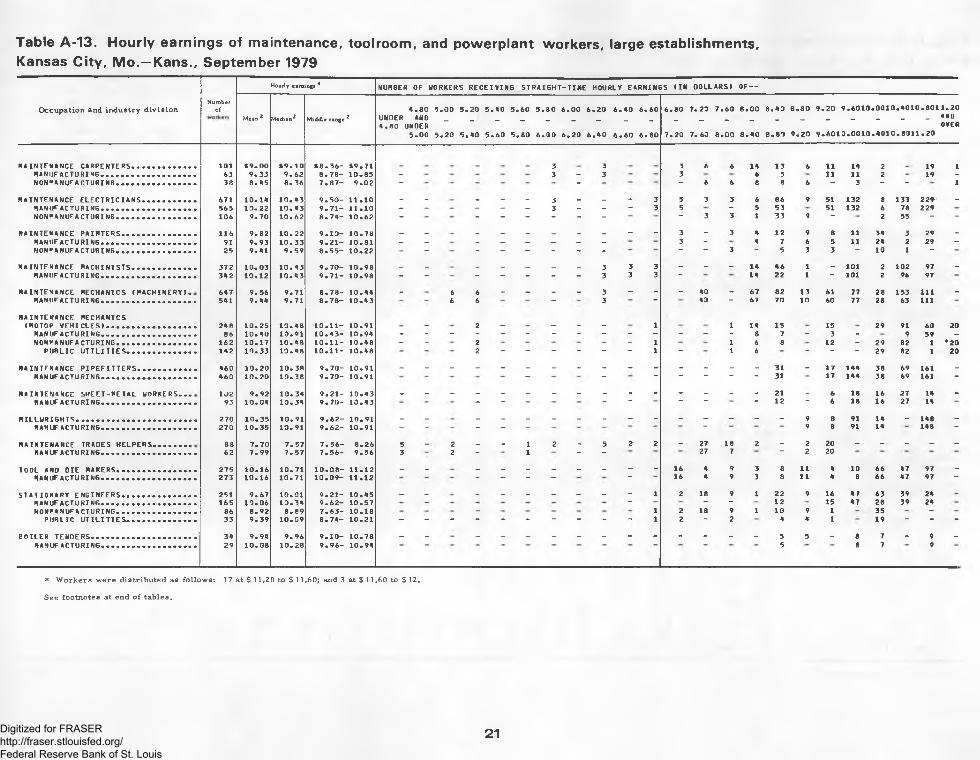
Table A-4. Hourly earnings of maintenance, toolroom, and powerplant workers, Kansas City, Mo.—Kans., September 1979
11Digitized for FRASER http://fraser.stlouisfed.org/ Federal Reserve Bank of St. Louis
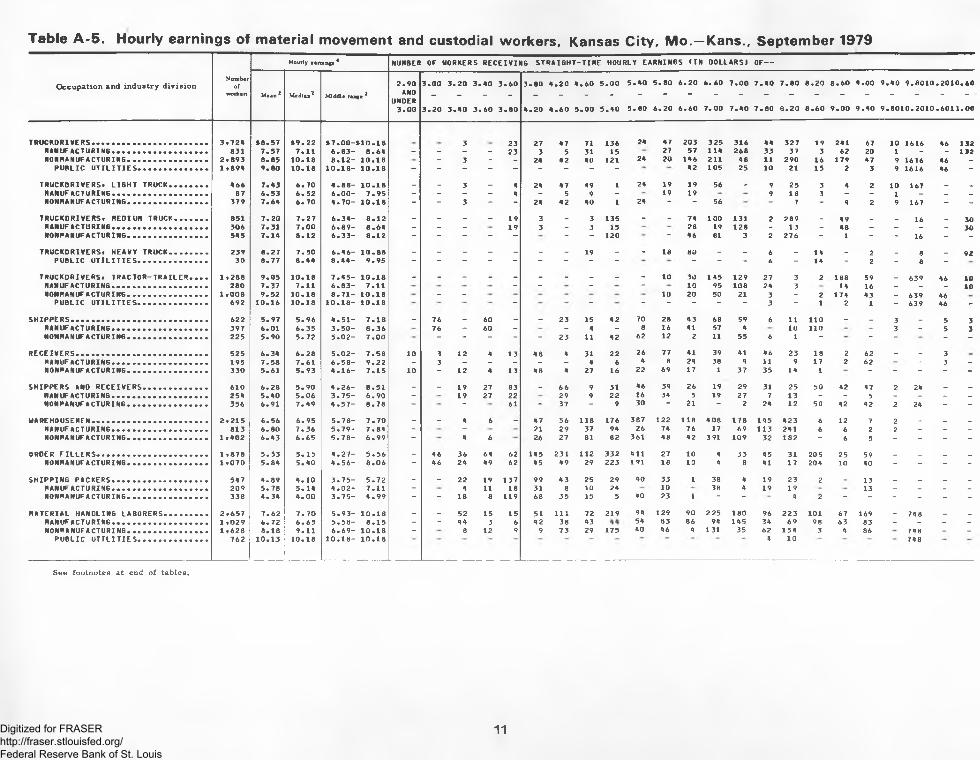
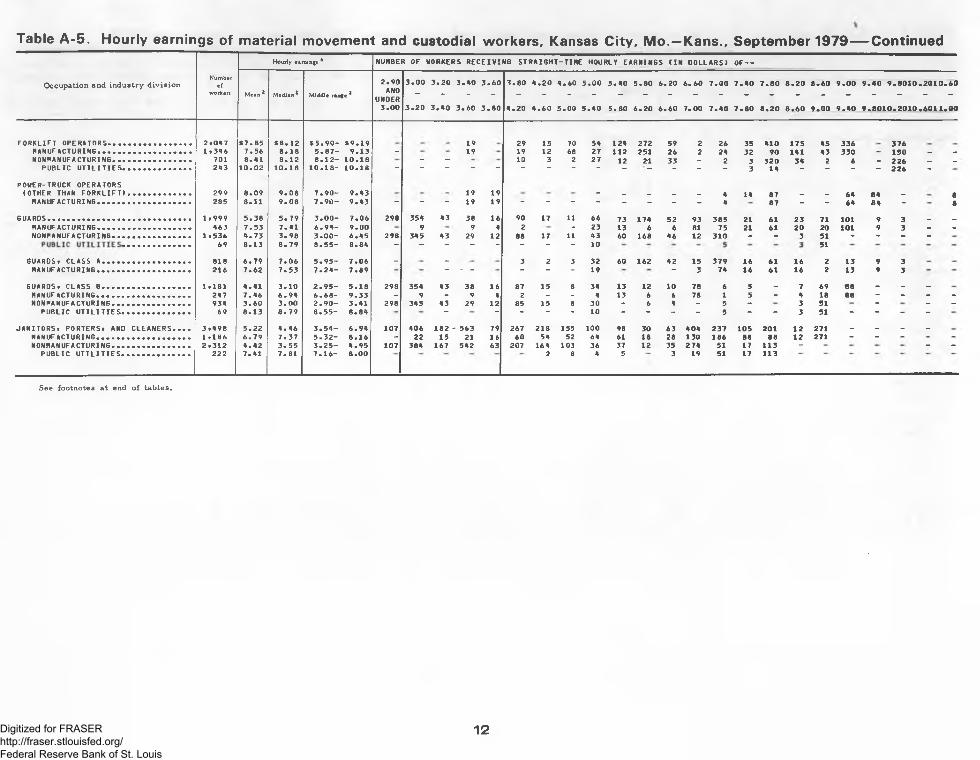
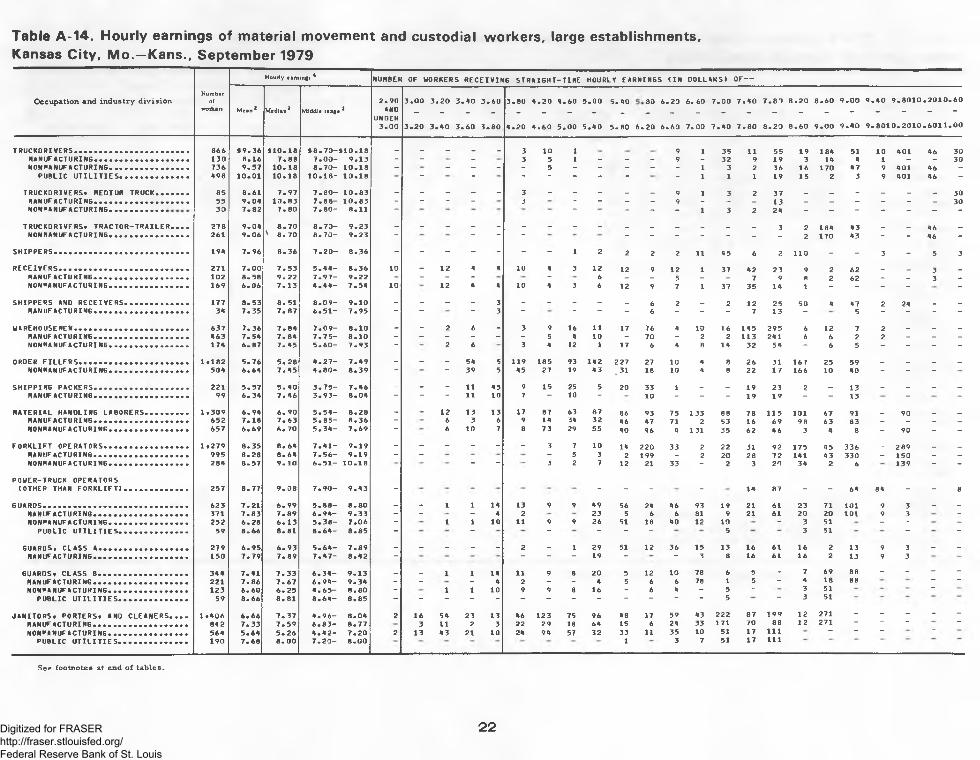
Table A-5. Hourly earnings of material movement and custodial workers, Kansas City, Mo.—Kans., September 1979— ContinuedHourly earnings 4 NUMBER OF UORKERS RECEIVING STRAI6HT-TIHE HOURLY EARNINGS (IN DOLLARS) OF—
12Digitized for FRASER http://fraser.stlouisfed.org/ Federal Reserve Bank of St. Louis
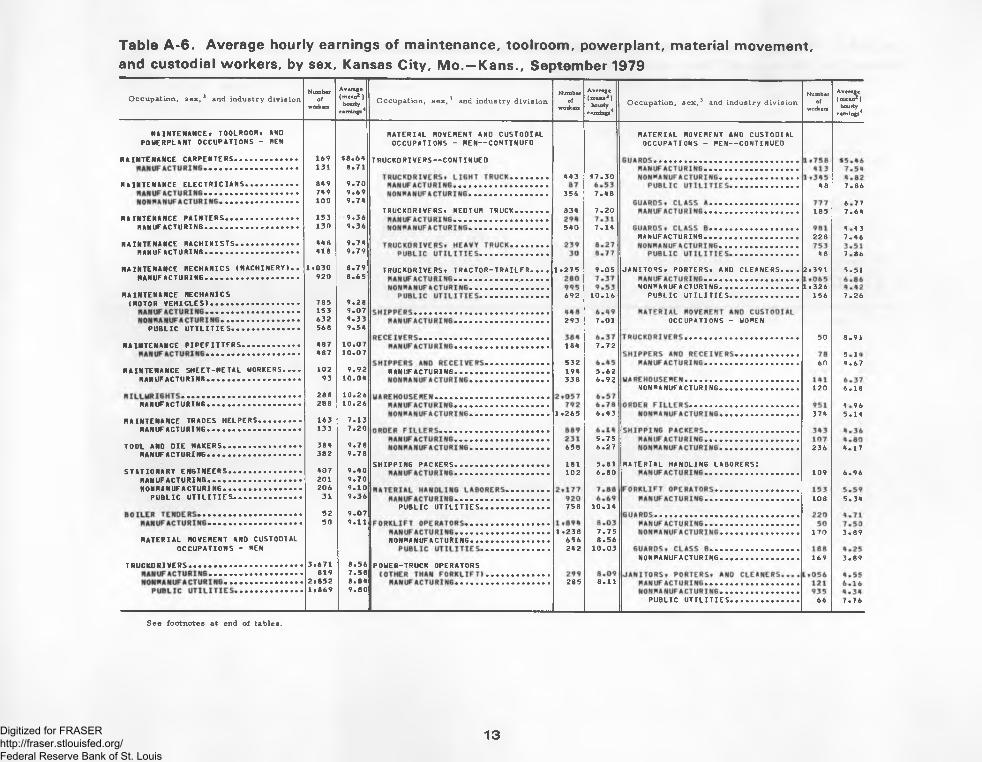
Table A-6. Average hourly earnings of maintenance, toolroom, powerplant, material movement,and custodial workers, by sex, Kansas City, Mo.—Kans., September 1979
O ccupa tion , sex, 3 and in dustry d iv is io nNumber
ofworkers
Average (mean2 ) hourly
earnings4O ccupation, s e x ,3 and in dustry d iv is io n
Numberof
wo&ers
Average(mean2)hourly
earnings4O ccupation, s e x ,3 and in dustry d iv is io n
Numberof
woikers
Average(mean2)hourly
earnings4
MAINTENANCE. TOOLROOM. AND MATERIAL MOVEMENT AND CUSTODIAL MATERIAL MOVEMENT ANO CUSTODIALPOUERPLANT OCCUPATIONS - HEN OCCUPATIONS - MEN— CONTINUED OCCUPATIONS - MEN— CONTINUED
PUBLIC UTILITIES.................................. 66 7 .76
See footn otes at end o f tab les.
13Digitized for FRASER http://fraser.stlouisfed.org/ Federal Reserve Bank of St. Louis
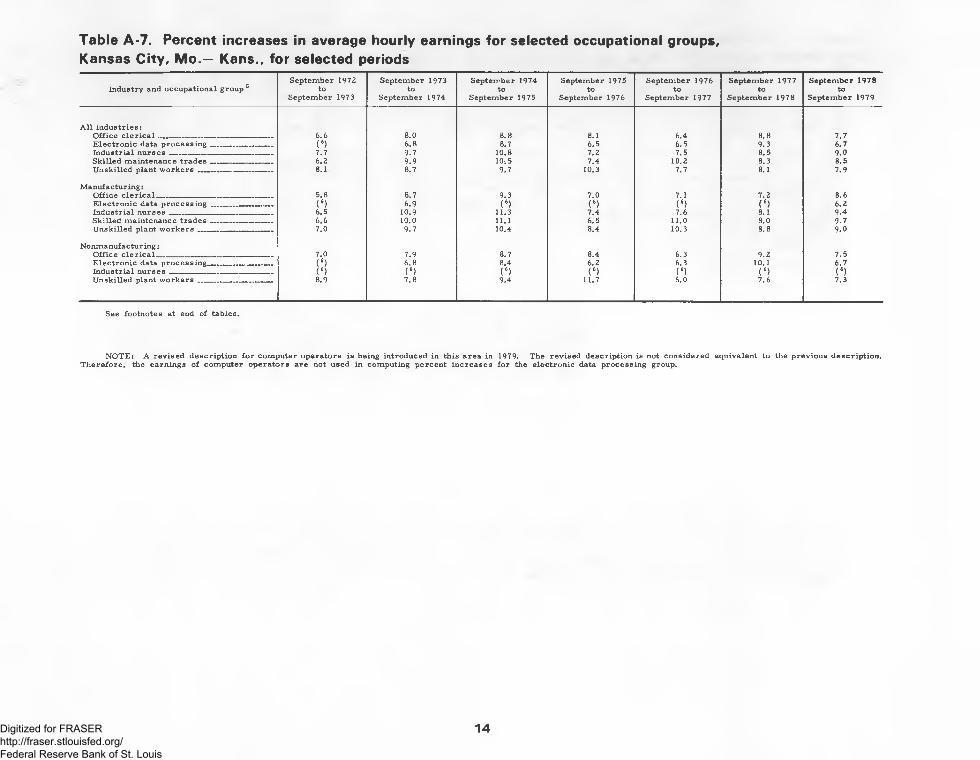
Table A-7. Percent increases in average hourly earnings for selected occupational groups.Kansas City, Mo.— Kans., for selected periods
Industry and occupa tiona l group 5Septem ber 1972
toSeptem ber 1973
Septem ber 1973 to
Septem ber 1974
Septem ber 1974 to
Septem ber 1975
September 1975 to
September 1976
Septem ber 1976 to
Septem ber 1977
Septem ber 1977 to
Septem ber 1978
Septem ber 1978 to
Septem ber 1979
A l l in du strie s:O ff ic e c le r ic a l .. __ ______ __ _______ 6.6 8.0 8.8 8.1 6.4 8.8 7.7E le c t ro n ic data p ro c e s s in g ______ ____ (6) 6.8 8.7 6.5 6.5 9.3 6.7In d u s tr ia l n u r s e s ________________________ 7.7 9.7 10.8 7.2 7.5 8.5 9.0S k ille d m aintenance t r a d e s _______________ 6.2 9.9 10:5 7.4 10.2 8.3 8.5U n sk ille d p lan t w o r k e r s _____ ______ 8.1 8.7 9.7 10.3 7.7 8.1 7.9
M an u fa c tu r in g :O ffic e c le r ic a l __ _ _ _________________ 5.8 8.7 9.3 7.0 7.1 7.2 8.6E le c t ro n ic data p r o c e s s in g _____ _ ( 6) 6.9 ( 6) ( 6) (6) ( 6) 6.2In d u s tr ia l n u r s e s ________________________ 6.5 10.9 11.3 7.4 7.6 8.1 9.4S k ille d m aintenance t r a d e s _______________ 6.6 10.0 11.1 6.5 11.0 8.0 9.7U n sk ille d p lan t w o r k e r s __________________ 7.0 9.7 10.4 8.4 10.3 8.8 9.0
Nonm anu factu ring:O ffic e c l e r ic a l____________ _ ____ ______ 7.0 7.9 8.7 8.4 6.3 9.2 7.5E le c t ro n ic data p ro ce ss in g_______________ (*) 6.8 8.4 6.2 6.3 10.1 6.7In d u s tr ia l n u r s e s __ _ .. __ . __ __ _ ( 6) ( 6) ( 6) ( 6) ( 6) ( 6) ( 6)U n sk il le d p lan t w o r k e r s __________________ 8.9 7.8 9.4 11.7 6.0 7.6 7.3
See footnotes at end of tab les.
N O TE : A rev ise d d e sc r ip t io n fo r com puter ope ra to rs is being in troduced in th is a rea in 1979. The rev ised d e sc r ip t io n is not cons idered equ iva lent to the p rev iou s d e sc r ip t io n .Th e re fo re , the earn ings o f com puter ope ra to rs a re not used in com puting pe rcen t in c re a se s fo r the e le c tron ic data p ro cess ing group.
14Digitized for FRASER http://fraser.stlouisfed.org/ Federal Reserve Bank of St. Louis
Table A-8. Average pay relationships within establishments for white-collar occupations, Kansas City, M o.—Kans., September 1979
O ff ic e c le r ic a l occupation being com pared—
O ccupa tion w h ich equals 100 Secretaries Stenographers Transcribing-
Typists File clericsMessen-
geis
Switchboard
Operators
Switchboard
operator-recep
tionists
Order cleric A ccounting cleritsPayrollc le ric
Key entry operators
Class A Class B Class C Class D Class E Senior Generalmachinetypists Class A Class B Class A Class B Class C Class A Class B Class A Class B Class A Class B
S E C R E T A R I E S , C L A S S A ............................. 1 0 0S E C R E T A R I E S , C L A S S 8 ............................. 1 1 7 1 0 0S E C R E T A R I E S , C L A S S C ............................. 1 3 3 1 1 8 1 0 0S E C R E T A R I E S , C L A S S 0 ............................. 1 5 3 1 31 1 1 6 1 0 0S E C R E T A R I E S , C L A S S E ............................. 1 6 A 1 3 9 1 2 2 1 11 1 0 0S T E N O G R A P H E R S , S E N I O R .......................... 1 4 9 1 3 2 1 1 8 1 1 3 ( 6 ) 1 0 0S T E N O G R A P H E R S , G E N E R A L ....................... 1 5 6 1 40 1 3 4 1 3 2 ( 61 1 1 2 1 0 0TRAN S C R I B I N G - M A C H I N E T Y P I S T S . . 1 6 8 1 4 5 1 3 2 1 1 7 ( 6 ) 1 6 ) ( 6 ) 1 0 0T Y P I S T S , C L A S S A .......................................... 1 6 6 1 4 4 1 3 1 1 22 1 1 3 1 1 3 1 0 2 1 0 7 1 0 0T Y P I S T S , C L A S S B .......................................... 1 8 1 16 8 1 4 4 ( 6 ) 1 3 0 1 3 6 1 1 4 1 1 3 1 1 7 t o oF I L E C L E R K S , C L A S S A ............................. 1 6 7 13 7 1 2 3 ( 6 ) 1 0 0 1 0 6 1 6 ) 9 4 8 8 7 9 1 0 0F I L E C L E R K S , C L A S S 8 ............................. 1 9 6 1 49 1 4 1 1 4 7 1 2 9 1 3 9 1 2 6 1 0 6 1 2 1 9 4 1 2 3 1 0 0F I L E C L E R K S , C L A S S C ............................. 2 2 3 1 7 9 1 7 2 1 4 8 1 3 8 ( 6 ) ( 6 ) 1 2 4 1 2 9 1 1 3 1 3 4 113 1 U 0M E S S E N G E R S ......................................... ... 1 9 6 1 7 6 1 5 1 1 3 7 1 3 5 1 5 0 1 4 1 1 2 6 1 2 6 1 0 4 1 5 2 9 o 1 0 0S W IT C H B O A R D O P E R A T O R S ........................... 1 5 8 1 4 4 1 2 3 1 2 2 1 1 2 1 0 7 9 3 9 6 9 5 9 2 9 9 9 0 0 3 8 6 1 0 0S W I T C H B O A R D O P E R A T O R -
R E C E P T I O N I S T S ................................................ 1 5 0 1 3 9 1 3 1 1 1 3 1 1 5 1 2 4 9 9 1 0 6 1 0 2 9 8 1 0 2 9 3 9 J 9 4 1 0 3 1 0 0ORDER C L E R K S , C L A S S A .......................... ( 6 1 1 1 5 1 0 7 9 8 ( 6 ) ( 6 ) ( 6 ) 8 4 9 9 7 7 1 6 ) ( 6 ) i t 8 2 ( 6 ) 82 1 0 0ORDER C L E R K S , C L A S S B .......................... 1 3 3 1 30 1 0 7 1 0 0 1 0 0 ( 6 ) ( 6 ) 1 0 6 8 9 8 6 ( 6 ) l a i 3 i ( 6 ) ( a ) 9 4 1 2 4 1 0 0A C C O U N T IN G C L E R K S , C L A S S A . . . . 1 3 2 1 1 6 1 0 4 9 9 87 9 2 8 5 8 5 7 9 7 0 9 4 I t o d 6 5 do 8 3 1 1 0 9 3 1 0 0A C C O U N T IN G C L E R K S , C L A S S 8 . . . . 1 5 9 1 4 5 1 2 9 1 2 4 1 0 8 1 0 9 9 2 1 0 6 94 9 1 1 0 7 9 2 d d 8 5 9 / 9 5 1 2 6 1 0 9 1 2 4 1 0 0P A Y R O L L C L E R K S ................................................ 1 3 6 1 20 1 0 5 9 9 87 9 7 8 2 8 6 82 7 7 9 8 8 0 7 J 75 d i 37 1 2 5 97 1 0 5 8 6 1 0 0K E Y E N T R Y O P E R A T O R S , C L A S S A . . 1 5 0 1 2 9 1 1 3 1 0 3 1 0 1 1 0 2 9 5 9 2 8 9 8 2 1 0 4 8 4 7 0 77 9 7 91 1 1 4 9 7 n o 9 2 1 0 7 1 0 0KEY EN TR Y O P E R A T O R S , C L A S S B . . 1 7 4 1 4 4 1 3 2 1 2 3 1 2 6 1 1 4 1 0 1 1 0 4 1 0 8 8 9 1 2 5 9 9 a J 91 9 5 1 0 2 1 4 3 1 0 8 1 3 3 1 0 4 1 1 8 1 1 7 1 0 0
P ro fe s s io n a l and te ch n ica l occupation being com pared—
Computer systems analysts (business) Computer programme a (business) Computer operators Peripheral Drafters Electronics technicians Registeredindustrialequipm ent
Class A CIms B Class C Class A Class B a ass C Class A Class B Class C Class A Class B Class C Class D Class A Class B Class C
C OM PU TER i Y S T E M S A N A L Y S T S( B U S I N E S S ) , C L A S S A ............................. 1 0 0
COM PU TE R S Y S T E M S A N A L Y S T S( B U S I N E S S ) , C L A S S 3 ............................. 1 2 2 1 0 0
C O M PU TER S Y S T E M S A N A L Y S T S( 3 U S I NE S S ) , C L A S S C............................. 1 4 6 1 2 1 1 0 0
COMPUTER PR OG RAM MER S( B U S I N E S S ) , C L A S S A ............................. 1 2 3 1 0 5 ( 6 ) 1 0 0
COMPU TER PR OG RAM MER S( B U S I N E S S ) , C L A S S B ............................. 1 5 3 1 3 4 ( 6) 1 2 9 1 0 0
C OM PU TER PRO GRAMMERS( B U S I N E S S ) , C L A S S C ............................. 1 6 6 1 4 7 ( 6 ) 1 3 4 1 1 2 1 0 0
COMPU TER O P E R A T O R S , C L A S S A . . . 1 6 5 1 3 8 1 2 3 1 5 5 1 1 9 9 5 1 0 0COM PUTER O P E R A T O R S , C L A S S B . . . 1 8 9 1 5 8 1 5 0 1 7 1 1 4 5 1 1 9 1 2 2 1 0 0COMPUTER O P E R A T O R S , C L A S S C . . . 2 1 3 1 8 0 1 5 9 1 6 7 1 4 4 1 3 8 1 3 9 1 2 3 n oP E R I P H E R A L E G U IP M E N T
O P E R A T O R S ............................................................ ( 6 ) ( 6 ) ( 6 ) ( 6 ) ( 6 ) 1 7 0 ( 6 ) 1 2 5 1 2 k i u uD R A F T E R S , C L A S S A ...................................... ( 6 ) 1 0 7 89 1 1 7 9 4 ( 6 ) 1 0 4 6 9 ( 6 ) ( 5 ) l o oD R A F T E R S , C L A S S B ...................................... 1 6 0 1 4 5 ( 6 ) 1 4 1 1 2 5 1 0 7 1 1 4 83 74 0 9 1 2 8 1 0 0O R A F T E R S , C L A S S C ...................................... 2 0 1 1 9 3 I 6) 1 8 1 1 5 3 1 3 2 1 3 6 1 0 9 1 0 2 k J L 1 7 1 1 2 8 1 0 0D R A F T E R S , C L A S S 0 ....................................... ( 6 ) ( 6 ) ( 6 ) ( 6 ) 1 7 4 1 5 6 ( 6 ) 1 3 5 ( b ) 9 8 ( 6 ) 1 6 0 1 3 1 1 0 0
E L E C T R O N I C S T E C H N I C I A N S ,C L A S S A .................................................................. ( 6 ) 9 6 6 9 ( 6 ) ( 61 ( 6 ) 8 0 65 4 5 ( o ) ( b ) 78 ( 6 ) ( 6 ) 1 0 0
E L E C T R O N I C S T E C H N I C I A N S ,C L A S S B .................................................................. ( 6 ) 1 2 2 ( 6 ) ( 6 ) ( 6 ) ( 6 ) 8 6 6 8 > 5 1 0 * ( 6 ) 8 4 6 3 ( 6 ) 1 1 4 1 0 0
E L E C T R O N I C S T E C H N I C I A N S ,C L A S S C .................................................................. ( 6 ) 1 3 8 ( 6 ) ( 6 ) ( 6 ) ( 6 ) 1 0 0 75 ( 6 ) 4 6 ) ( 6 ) ( 6 ) ( 6 ) ( 6 ) ( 6 ) 1 1 4 1 0 0
R E G I S T E R E D I N D U S T R I A L N U R S E S . . 1 6 5 1 4 2 ( 6 ) 1 2 9 1 0 8 9 3 1 1 1 93 81 ( 8 ) 1 2 0 1 0 1 7 8 ( 6 ) ( 6 ) 1 2 4 4 6 ) 1 0 0
See note under tab le A - 9 and footnote at end o f tab les.
15Digitized for FRASER http://fraser.stlouisfed.org/ Federal Reserve Bank of St. Louis
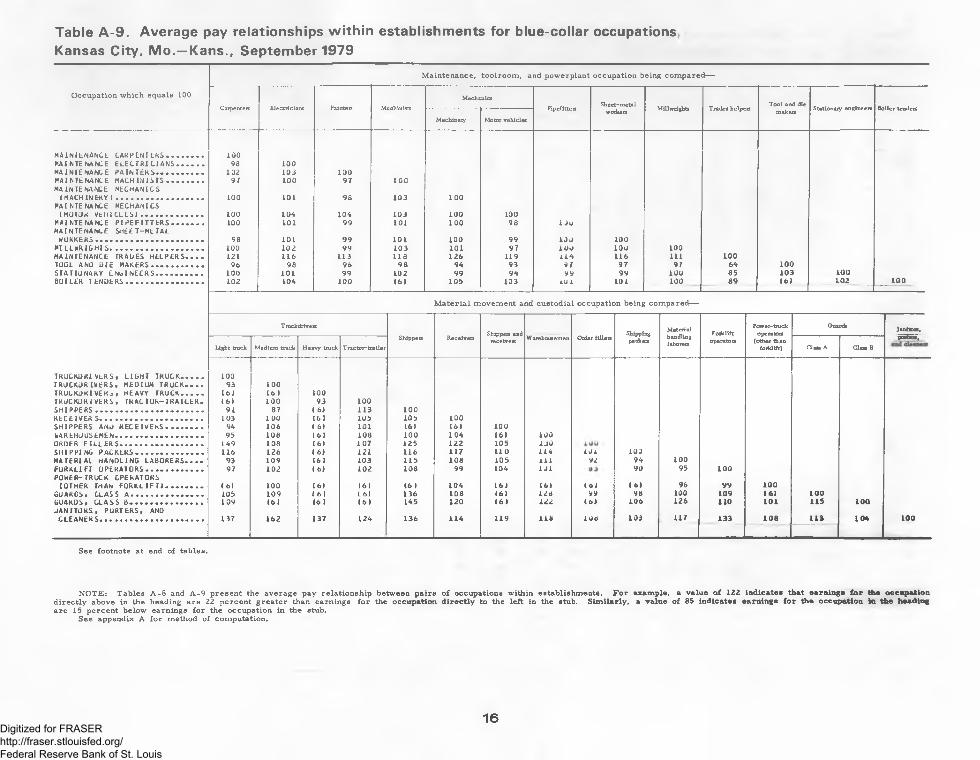
Table A-9. Average pay relationships within establishments for blue-collar occupations Kansas City, Mo.—Kans., September 1979
M aintenance, too lroom , and pow erplant occupation being com pared—
O ccupation w h ich equals 100
Carpenters Electricians Painters Machinists
M echanics
PipefitteisSheet-m etal
workers Millwrights Trades helpersT o o l and die
makers Stationary engineers Boi ler tenders
Machinery M otor vehicles
M A IN T E N A N C E C A R P E N T E R S ...................... 1 0 0M A IN T E N A N C E E L E C T R I C I A N S ................ 9B 1 0 0M A IN T E N A N C E P A I N T E R S ...................... ... 1 0 2 1 0 3 1 0 0M A IN T E N A N C E M A C H I N I S T S ....................... 9 7 1 0 0 9 7 1 0 0M A IN T E N A N C E M E C H A N IC S
( M A C H I N E R Y ) .................................................... 100 1 0 1 9 8 1 0 3 1 0 0M A IN T E N A N C E M EC H AN IC S
(MOTOR V E H I C L E S ! ..................................... 1 0 0 1 0 4 1 0 4 1 0 3 1 0 0 1 0 0M A IN T E N A N C E P I P E F I T T E R S ................... 1 00 1 0 1 9 9 1 0 1 1 0 0 9 8 U uM A IN T E N A N C E S H E E T - M E T A L
W OR KE RS................................................................. 9 8 1 0 1 9 9 1 0 1 1 0 0 9 9 1 0 0 1 0 0MI L L M R I G H I S ........................................................ 1 0 0 1 0 2 9 9 1 0 3 1 0 1 9 7 1 0 0 1 0 0 1 0 0M A IN T E N A N C E TRACES H E L P E R S . . . . 1 21 1 1 6 1 1 3 1 1 8 1 2 6 1 1 9 1 1 4 1 1 6 11 1 1 0 0TOOL AN D D I E M A K E R S . . . ....................... 9 6 9 8 9 6 9 8 9 4 9 3 9/ 9 7 9 7 6 4 1 0 0S T A T I O N A R Y E N G I N E E R S ............................ 1 0 0 1 0 1 9 9 10 2 9 9 9 4 9 9 9 9 1 0 0 8 5 1 0 3 1 0 0B O I L E R T E N D E R S ............................................... 1 0 2 1 0 4 1 0 0 ( 6 ) 1 0 5 1 0 3 L J l 1 0 1 1 0 0 8 9 1 6 ! 1 0 2 1 0 0
M a te r ia l m ovem ent and cu stod ia l occupation being com pared—
Truck drivers
Shippers ReceiversShippers and
receivers Order fillersShippingpackers
M aterialhandlinglaborers
Forkl i ftoperators
Power-truck operators
(other than forkl ift)
Guards Janitors,
Light truck M edium truck H eavy truck Tractor-trailerWarehousemen
Class A
to80
por t ta ,
T R U C K O R l V E R S , L I G H T T R U C K . . . . . 1 0 0T R U C K O R I V E R S , M E O IU M T R U C K . . . . 9 3 1 0 0T R U C K O R l V E R S , HEA V Y TR U C K ............. ( 6 ! ( 6 ) 1 0 0T R U C K O R I V E R S , T R A C T O R - T R A I L E R . ( 6 ) 1 0 0 9 3 1 0 0S H I P P E R S ................................................................. 9 1 8 7 ( 6 ! 1 1 3 1 0 0R E C E IV E R S.............................................................. 1 0 3 1 0 0 ( 6 ) 1 0 5 1 0 5 1 0 0S H IP P E R S AND R E C E I V E R S ....................... 9 4 1 0 6 ( 6 ) 1 0 1 ( 6 ) ( 6 ! 1 0 0WAREHOUSEMEN..................................................... 9 5 1 0 8 ( 6 1 1 0 8 1 0 0 1 0 4 ( 6 ) 1 0 0ORDER F I L L E R S .................................................. 1 4 9 1 0 8 ( 6 1 1 0 7 1 2 5 1 2 2 1 0 5 1 3 0S H I P P I N G P A C K E R S ......................................... 1 1 6 1 2 6 ( 61 1 2 1 1 1 6 1 1 7 1 1 0 1 1 4 i d A. 1 0 0M A T E R I A L H A N D L I N G L A B O R E R S . . . . 9 3 1 0 9 ( 6 ) 1 0 3 1 1 5 1 0 8 1 0 5 A l l 92 9 4 1 0 0F U R K L I F T O P E R A T O R S .................................. 9 7 1 0 2 ( 6 ! 1 0 2 1 0 8 9 9 1 0 4 L J L 9 0 9 5 1 0 0PO W ER -T R U C K OPERA TOR S
( O T H E R THAN F O R K L I F T ! ...................... ( 6 ) 1 0 0 ( 6 ) ( 6 ) ( 6 ) 1 0 4 ( 6 ! ( 6 1 ( 6 1 ( 61 9 6 9 9 1 0 0G U AR D S, C L A S S A ............................... ............ 1 0 5 1 0 9 I 6 ) ( 61 1 3 6 1 0 8 ( 6 1 1 2 8 9 9 9 6 1 0 0 1 0 9 ( 6 1 l O OG U A R D S , C L A S S B ............................................ 1 0 9 ( 6 ! ( 6 1 ( 6 ) 1 4 5 1 2 0 ( 6 ! 1 2 2 ( 6 ! 1 0 6 1 2 6 1 1 0 1 0 1 1 1 5 1 0 0J A N I T O R S , P U R T E R S , AND
C L E A N E R S .............................................................. 1 3 7 1 6 2 1 3 7 1 2 4 1 3 6 1 1 4 1 1 9 1 1 8 1 0 6 1 0 3 1 1 7 1 3 3 1 0 8 1 1 3 1 0 6 1 0 0
See footnote at end of tab les.
N O T E : T ab le s A -8 and A -9 p re sen t the average pay re la tion sh ip between pairs of occupations w ith in establishm ents. For example, a value of 122 indicates that earnings for the occupation d ire c t ly above in the heading a re 22 pe rcen t g re a te r than earn ings fo r the occupation directly to the le ft in the stub. Similarly, a value of 85 indicates earnings for the occupation in the headingare 15 pe rcen t be low earn ings fo r the occupation in the stub.
See appendix A fo r method o f com putation.
16Digitized for FRASER http://fraser.stlouisfed.org/ Federal Reserve Bank of St. Louis
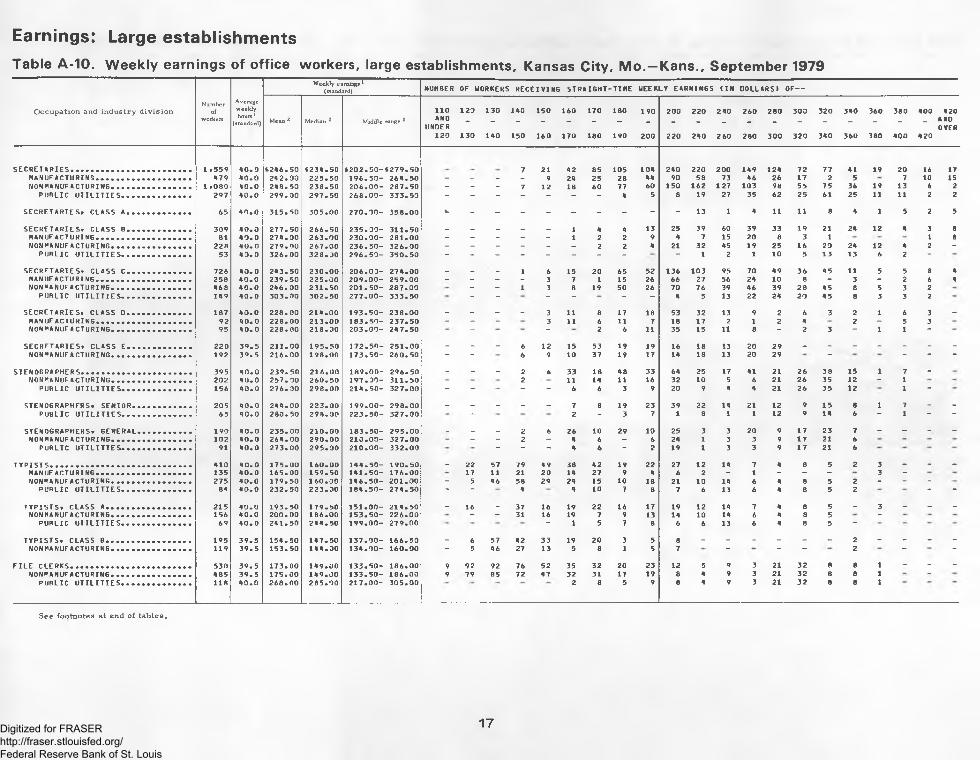
Earnings: Large establishmentsTable A-10. Weekly earnings of office workers, large establishments, Kansas City, Mo.—Kans., September 1979
O ccupa tion and in d u s try d iv is io nNumber
ofworkers
Average weekly hours *
(standard)
Weekly earnings 1 (standard) NUMBER OF WORKERS R E C E I V I N G S T R A I G H T - T I M E WEEKL Y E A R N I N G S ( I N D O L L A R S ! OF —
Mean ^ Median 2 Middle range 2
1 1 0AND
UNDER1 2 0
1 2 0
1 3 0
1 3 0
1 4 0
1 4 0
1 5 0
1 5 0
16 0
1 6 0
1 7 0
1 7 0
1 8 0
1 8 0
1 9 0
1 9 0
2 0 0
2 0 0
2 2 0
2 2 0
2 4 0
2 40
2 6 0
2 6 0
2 8 0
2 8 0
3 0 0
3 0 0
3 2 0
3 2 0
3 4 0
3 4 0
3 6 0
3 6 0
3 8 0
3 8 0
4 0 0
4 0 0
4 2 0
4 2 0 A NO OVER
S E C R E T A R I E S ........................................................................ 1 . 5 5 9 4 0 . 0 * 2 4 6 . 5 0 * 2 3 4 . 5 0 * 2 0 2 . 5 0 - * 2 7 9 . 5 0 7 2 1 4 2 8 5 1 0 5 1 0 4 2 4 0 2 2 0 2 0 0 1 4 9 1 2 4 7 2 7 7 4 1 1 9 2 0 16 17M A N U F A C T U R I N G ......................................................... 4 7 9 4 0 . 0 2 4 2 . 0 0 2 2 5 . 5 0 1 9 6 . 5 0 - 2 6 4 . 5 0 - - - - 9 2 4 2 5 2 8 4 4 9 0 5 8 7 3 4 6 2 6 1 7 2 5 7 10 15N O N M A N U F A C T U R IN G ................................................ 1 . 0 8 0 4 0 . 0 2 4 8 . 5 0 2 3 8 . 5 0 2 0 6 . 0 0 - 2 8 7 . 5 0 - - - 7 1 2 1 8 6 0 7 7 6 0 1 5 0 1 6 2 1 2 7 1 0 3 9 8 5 5 7 5 3 6 1 9 1 3 6 2
P U B L I C U T I L I T I E S .......................................... 2 9 7 4 0 . 0 2 9 9 . 0 0 2 9 7 . 5 0 2 6 8 . 0 0 - 3 3 3 . 5 0 - - - - ~ - - 4 5 8 1 9 2 7 3 5 6 2 2 5 6 1 2 5 11 11 2 2
S E C R E T A R I E S * C L A S S A ...................................... 6 5 4 0 . 0 3 1 5 . 5 0 3 0 5 . 0 0 2 7 0 . 0 0 - 3 5 8 . 0 0 - - - - - - - - - - 1 3 1 4 1 1 1 1 8 4 1 5 2 5
S E C R E T A R I E S * C L A S S B ...................................... 3 0 9 4 0 . 0 2 7 7 . 5 0 2 6 6 . 5 0 2 3 5 . 0 9 - 3 1 1 . 5 0 _ _ _ _ _ 1 4 4 1 3 2 5 3 9 6 0 3 9 3 3 1 9 2 1 24 1 2 4 3 8M A N U F A C T U R I N G . . . ................................................ 8 1 4 0 . 0 2 7 4 . 0 0 2 6 3 . 0 0 2 3 0 . 0 0 - 2 8 1 . 0 0 - - - - - 1 2 2 9 4 7 15 2 0 8 3 1 1 8N O N M A N U F A C T U R IN G ................................................ 2 2 B 4 0 . 0 2 7 9 . 0 0 2 6 7 . 0 0 2 3 6 . 5 0 - 3 2 6 . 0 0 - - - - - - 2 2 4 21 3 2 45 1 9 2 5 1 6 2 0 2 4 1 2 4 2 -
P U R L I C U T I L I T I E S .......................................... 5 3 4 0 . 0 3 2 6 . 0 0 3 2 8 . 3 0 2 9 6 . 5 0 - 3 5 0 . 5 0 - - - - - - - - “ 1 2 1 1 0 5 1 3 13 6 2 “
S E C R E T A R I E S . C L A S S C ...................................... 7 2 6 4 0 . 0 2 4 3 . 5 0 2 3 0 . 0 0 2 0 6 . 0 0 - 2 7 4 . 0 0 _ - _ 1 6 15 2 0 6 5 5 2 1 3 6 1 0 3 9 5 7 0 4 9 3 6 4 5 11 5 5 8 4M A N U F A C T U R I N G ......................................................... 2 5 8 4 0 . 0 2 3 9 . 5 0 2 2 5 . 0 0 2 0 9 . 0 0 - 2 5 9 . 0 0 - - - - 3 7 1 1 5 2 6 6 6 2 7 56 2 4 1 0 8 - 3 - 2 6 4N O N M A N U F A C T U R IN G ................................................ 4 6 8 4 0 . 0 2 4 6 . 0 0 2 3 1 . 5 0 2 0 1 . 5 0 - 2 8 7 . 0 0 - - 1 3 8 1 9 5 0 2 6 7 0 7 6 39 4 6 3 9 2 8 4 5 8 5 3 2
P U R L I C U T I L I T I E S .......................................... 1 4 9 4 0 . 0 3 0 3 . 0 0 3 0 2 . 5 0 2 7 7 . 0 0 - 3 3 3 . 5 0 - - - - “ - 4 5 13 2 2 2 4 2 0 4 5 8 3 3 2
S E C R E T A R I E S * C L A S S 0 ....................................... 1 8 7 4 0 . 0 2 2 8 . 0 0 2 1 4 . 0 0 1 9 3 . 5 0 - 2 3 8 . 0 0 - _ _ _ 3 11 8 1 7 18 5 3 3 2 13 9 2 6 3 2 1 6 3 _
M A N U F A C T U R I N G ......................................................... 9 2 4 0 . 0 2 2 8 . 0 0 2 1 3 . 0 0 1 8 3 . 5 0 - 2 3 7 . 5 0 - - - 3 11 6 11 7 1 8 1 7 2 1 2 9 2 - 5 3N O N M A N U F A C T U R I N G ................................................ 9 5 4 0 . 0 2 2 8 . 0 0 2 1 8 . 0 0 2 0 3 . 0 0 - 2 4 7 . 5 0 - “ 2 6 11 3 5 1 5 11 8 “ 2 3 “ 1 1 “
S E C R E T A R I E S . C L A S S E ....................................... 2 2 0 3 9 . 5 2 1 1 . 0 0 1 9 5 . 5 0 1 7 2 . 5 0 - 2 5 1 . 0 0 - - _ 6 1 2 15 5 3 1 9 1 9 1 6 1 8 13 2 0 2 9 _ _ - _ _ - -
N O N M A N U F A C T U R I N G ............................. ... 1 9 2 3 9 . 5 2 1 6 . 0 0 1 9 8 . 0 0 1 7 3 . 5 0 - 2 6 0 . 5 0 - - 6 9 1 0 3 7 1 9 1 7 1 4 1 8 1 3 2 0 2 9 “ “ “ *
S T E N O G R A P H E R S .................................................................. 3 9 5 4 0 . 0 2 3 9 . 5 0 2 1 6 . 0 0 1 8 9 . 0 0 - 2 9 6 . 5 0 _ _ _ 2 6 3 3 1 8 4 8 3 3 6 4 2 5 17 4 1 2 1 2 6 3 8 1 5 1 7 -
N O N M A N U F A C T U R I N G ................................................ 2 0 2 4 0 . 0 2 5 7 . 0 0 2 6 0 . 5 0 1 9 7 . 3 9 - 3 1 1 . 5 0 2 11 1 4 1 1 1 6 3 2 1 0 5 6 2 1 2 6 3 5 1 2 - 1P U R L I C U T I L I T I E S .......................................... 1 5 6 4 0 . 0 2 7 6 . 0 0 2 9 8 . 0 0 2 1 4 . 5 0 - 3 2 7 . 0 0 - - - ~ 6 6 3 9 2 0 9 9 4 2 1 2 6 3 5 12 1 “
S T E N O G R A P H E R S * S E N I O R ................................... 2 0 5 4 0 . 0 2 4 4 . 0 0 2 2 3 . 0 0 1 9 9 . 0 0 - 2 9 8 . 0 0 _ _ _ - _ 7 8 1 9 2 3 3 9 2 2 1 4 2 1 1 2 9 1 5 8 1 7 - -
P U B L I C U T I L I T I E S .......................................... 6 5 4 0 . 0 2 8 0 . 5 0 2 9 8 . 0 0 2 2 3 . 5 0 - 3 2 7 . 0 0 “ 2 - 3 7 1 8 1 1 1 2 9 1 4 6 “ 1 “ “
S T E N O G R A P H E R S * G E N E R A L ................................ 1 9 0 4 0 . 0 2 3 5 . 0 0 2 1 0 . 0 0 1 8 3 . 5 0 - 2 9 5 . 0 0 - _ _ 2 6 2 6 1 0 2 9 1 0 2 5 3 3 2 0 9 1 7 2 3 7 - - - -
N O N M A N U F A C T U R IN G ................................................ 1 0 2 4 0 . 0 2 6 4 . 0 0 2 9 0 . 0 0 2 1 0 . 0 0 - 3 2 7 . 0 0 - - 2 - 4 6 - 6 2 4 1 3 3 9 1 7 2 1 6P U B L I C U T I L I T I E S .......................................... 9 1 4 0 . 0 2 7 3 . 0 0 2 9 5 . 0 0 2 1 0 . 0 0 - 3 3 2 . 0 0 - - - 4 6 - 2 1 9 1 3 3 9 1 7 2 1 6
M A N U F A C T U R I N G ......................................................... 1 3 5 4 0 . 0 1 6 5 . 0 0 1 5 9 . 5 0 1 4 1 . 5 0 - 1 7 6 . 0 0 1 7 1 1 21 2 0 14 2 7 9 9 6 2 - 1 - ~ - 3 -N O N M A N U F A C T U R IN G ................................................ 2 7 5 4 0 . 0 1 7 9 . 5 0 1 6 0 . 0 0 1 4 6 . 5 0 - 2 0 1 . 0 0 - 5 4 6 5 8 2 9 2 4 1 5 1 0 18 2 1 1 0 1 4 6 4 8 5 2 - - -
P U R L I C U T I L I T I E S .......................................... 8 4 4 0 . 0 2 3 2 . 5 0 2 2 3 . 0 0 1 8 4 . 5 0 - 2 7 4 . 5 0 “ “ 4 4 1 0 7 8 7 6 13 6 4 8 5 2 “ “
T Y P I S T S * C L A S S A ................................... 2 1 5 4 0 . 0 1 9 3 . 5 0 1 7 9 . 5 0 1 5 1 . 0 0 - 2 1 4 . 5 0 _ 1 6 _ 3 7 1 6 1 9 2 2 1 6 1 7 1 9 1 2 14 7 4 8 5 - 3 - - _N O N M A N U F A C T U R IN G ................................. 1 5 6 4 0 . 0 2 0 0 . 0 0 1 8 6 . 0 0 1 5 3 . 5 0 - 2 2 6 . 0 0 - - 3 1 1 6 19 7 9 13 1 4 1 0 14 6 4 8 5 -
P U B L I C U T I L I T I E S ............................. 6 9 4 0 . 0 2 4 1 . 5 0 2 4 4 . 5 0 1 9 9 . 0 0 - 2 7 9 . 0 0 “ 1 5 7 8 6 6 1 3 6 4 8 5 “
T Y P I S T S . C L A S S B ................................... 1 9 5 3 9 . 5 1 5 4 . 5 0 1 4 7 . 5 0 1 3 7 . 0 0 - 1 6 6 . 5 0 - 6 5 7 4 2 3 3 19 2 0 3 5 8 _ - - _ - - 2 _ _ - -N O N M A N U F A C T U R IN G ................................................ 1 1 9 3 9 . 5 1 5 3 . 5 0 1 4 4 . 0 0 1 3 4 . 0 0 - 1 6 0 . 0 0 “ 5 4 6 2 7 1 3 5 8 1 5 7 “ “ “ 2 “ “
F I L E C L E R K S ........................................................................ 5 3 0 3 9 . 5 1 7 3 . 0 0 1 4 9 . 0 0 1 3 3 . 5 0 - 1 8 6 . 0 0 9 9 2 9 2 7 6 5 2 3 5 3 2 2 0 2 3 1 2 5 9 3 2 1 3 2 8 8 1 - - -
N O N M A N U F A C T U R IN G ................................................ 4 8 5 3 9 . 5 1 7 5 . 0 0 1 4 9 . 0 0 1 3 3 . 5 0 - 1 8 6 . 0 0 9 7 9 8 5 7 2 4 7 3 2 3 1 1 7 1 9 8 9 9 3 2 1 3 2 8 8 1 “P U B L I C U T I L I T I E S .......................................... 1 1 8 4 0 . 0 2 6 8 . 0 0 2 8 5 . 0 0 2 1 7 . 0 0 - 3 0 5 . 0 0 2 8 5 9 8 4 9 3 2 1 3 2 8 8 1
See footn otes at end o f ta b les .
17Digitized for FRASER http://fraser.stlouisfed.org/ Federal Reserve Bank of St. Louis
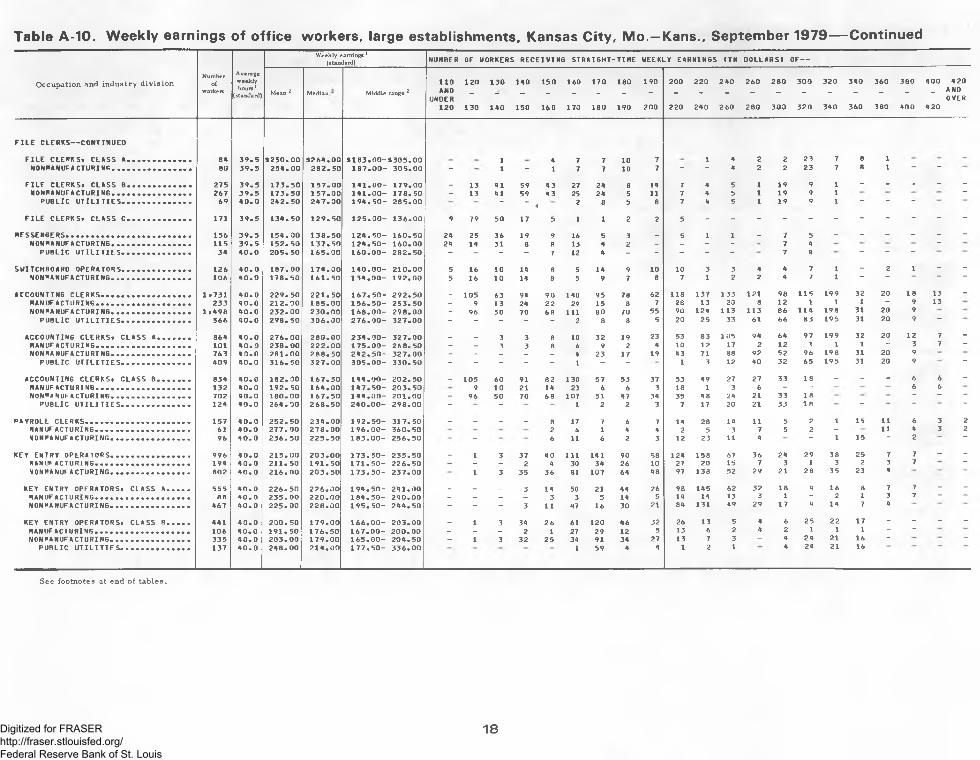
Table A-10. Weekly earnings of office workers, large establishments, Kansas City, Mo.—Kans., September 1979— ContinuedWeekly earnings 1
(standard) NUH8E R OF WORKERS R E C E I V I N G S T R A I G H T - T I H E WEEKLY E A R N I N G S ( I N D O L L A R S ) O F —
Occupation and in dustry d iv is io nNumber
ofworkers
Average weekly hours 1
(standard) Mean 2 Median Middle range 2
1 1 0ANO
UNDER1 2 0
1 2 0
1 3 0
1 3 0
1 4 0
1 4 0
1 5 0
1 5 0
1 6 0
1 6 0
1 7 0
1 7 0
1 8 0
1 8 0
1 9 0
1 9 0
2 0 0
2 0 0
2 2 0
2 2 0
2 4 0
2 4 0
2 6 0
2 6 0
2 8 0
2 8 0
3 0 0
3 0 0
3 2 0
3 2 0
3 4 0
3 4 0
3 6 0
3 6 0
3 8 0
3 8 0
4 0 0
4 0 0
4 2 0
4 2 0 AND OVER
F I L E C L E R K S — C O N T I N U E D
F I L E C L E R K S * C L A S S A ................. 8 4 3 9 . 5 $ 2 5 0 . 0 0 $ 2 6 4 . 0 0 $ 1 8 3 . 0 0 - $ 3 0 5 . 0 0 1 * 7 7 1 0 7 1 4 2 2 2 3 7 8 1N O N R A N U F A C T U R IN G .......................... 8 0 3 9 . 5 2 5 4 . 0 0 2 8 2 . 5 0 1 8 7 . 0 0 - 3 0 5 . 0 0 - 1 - 1 7 7 1 0 7 “ “ 4 2 2 2 3 7 8 1 ~ ~
F I L E C L E R K S . C L A S S B ................. 2 7 5 3 9 . 5 1 7 3 . 5 0 1 5 7 . 0 0 1 4 1 . 0 0 - 1 7 9 . 0 0 _ 1 3 4 1 5 9 4 3 27 2 4 8 14 7 4 5 1 1 9 9 1 - - - - -
N O N R A N U F A C T U R IN G .......................... 2 6 7 3 9 . 5 1 7 3 . 5 0 1 5 7 . 0 0 1 4 1 . 0 0 - 1 7 8 . 5 0 - 1 3 4 1 5 9 4 3 25 2 4 5 11 7 4 5 1 1 9 9 1 ”P U B L I C U T I L I T I E S .................... 6 9 4 0 . 0 2 4 2 . 5 0 2 4 7 . 0 0 1 9 4 . 5 0 - 2 8 5 . 0 0 - - 4 2 8 5 8 7 4 5 1 1 9 9 1 “ “ ~
F I L E C L E R K S . C L A S S C ................. 1 7 1 3 9 . 5 1 3 4 . 5 0 1 2 9 . 5 0 1 2 5 . 0 0 - 1 3 6 . 0 0 9 7 9 5 0 1 7 5 1 1 2 2 5 - - - - - - - - ~ - -
N E S S E N 6 E R S . . . . ......................................... 1 5 6 3 9 . 5 1 5 4 . 0 0 1 3 8 . 5 0 1 2 4 . 5 0 - 1 6 0 . 5 0 2 4 2 5 3 6 1 9 9 16 5 3 _ 5 1 1 _ 7 5 - - - - - -N O N R A N U F A C T U R IN G .......................... 1 1 5 3 9 . 5 1 5 2 . 5 0 1 3 7 . 5 0 1 2 4 . 5 0 - 1 6 0 . 0 0 2 4 1 4 3 1 8 8 13 4 2 - - - - 7 4 -
P U B L I C U T I L I T I E S .................... 3 4 4 0 . 0 2 0 5 . 5 0 1 6 5 . 0 0 1 6 0 . 0 0 - 2 8 2 . 5 0 - - “ 7 12 4 - - - - - 7 4 “ “ “
S W IT C H B O A R D O P E R A T O R S .................... 1 2 6 4 0 . 0 1 8 7 . 0 0 1 7 4 . 0 0 1 4 0 . 0 0 - 2 1 0 . 0 0 5 1 6 1 0 14 8 5 1 4 9 1 0 1 0 3 3 4 4 7 1 - 2 1 - -
N 0 N R A N U F A C T U R I N 6 .......................... 1 0 6 4 0 . 0 1 7 8 . 5 0 1 6 1 . 5 0 1 3 4 . 0 0 - 1 9 2 . 0 0 5 1 6 1 0 14 8 5 9 7 8 7 1 2 2 4 7 1 ~ ~ “ ” ~
A C C O U N T IN G C L E R K S ................................ 1 . 7 3 1 4 0 . 0 2 2 9 . 5 0 2 2 1 . 5 0 1 6 7 . 5 0 - 2 9 2 . 5 0 _ 1 0 5 6 3 94 9 0 1 4 0 9 5 7 8 6 2 1 1 8 1 3 7 1 3 3 1 2 1 9 8 1 1 5 1 9 9 3 2 2 0 1 8 13 -
N A N U F A C T U R I N 6 ................................... 2 3 3 4 0 . 0 2 1 2 . 0 0 1 8 5 . 0 0 1 5 6 . 5 0 - 2 5 3 . 5 0 - 9 1 3 2 4 2 2 29 1 5 8 7 28 1 3 20 8 1 2 1 i 1 “ 9 13
N O N R A N U F A C T U R IN G .......................... 1 . 4 9 8 4 0 . 0 2 3 2 . 0 0 2 3 0 . 0 0 1 6 8 . 0 0 - 2 9 8 . 0 0 - 9 6 5 0 7 0 6 8 1 11 8 0 7 0 5 5 9 0 1 2 4 1 1 3 1 1 3 8 6 1 1 4 1 9 8 3 1 2 0 9
P U B L I C U T I L I T I E S .................... 5 6 6 4 0 . 0 2 9 8 . 5 0 3 0 6 . 0 0 2 7 6 . 0 0 - 3 2 7 . 0 0 - - - - - 2 8 8 5 2 0 2 5 33 6 1 6 6 8 3 1 9 5 31 2 0 9 ~
AC C O U N T IN G C L E R K S . C L A S S A 8 6 4 4 0 . 0 2 7 6 . 0 0 2 8 0 . 0 0 2 3 4 . 0 0 - 3 2 7 . 0 0 _ _ 3 3 8 10 3 2 19 2 3 5 3 8 3 1 0 5 9 4 6 4 9 7 1 9 9 3 2 2 0 1 2 7 -
H A N U F A C T U R I N G ................................... 1 0 1 4 0 . 0 2 3 8 . 0 0 2 2 2 . 0 0 1 7 5 . 0 0 - 2 6 8 . 5 0 - - 3 3 8 6 9 2 4 1 0 1 2 17 2 1 2 1 1 1 “ 3 7 “N O N R A N U F A C T U R IN G .......................... 7 6 3 4 0 . 0 2 8 1 . 0 0 2 8 8 . 5 0 2 4 2 . 5 0 - 3 2 7 . 0 0 - - - - - 4 2 3 17 1 9 4 3 7 1 88 9 2 5 2 9 6 1 9 8 3 1 2 0 9
P U B L I C U T I L I T I E S .................... 4 0 9 4 0 . 0 3 1 6 . 5 0 3 2 7 . 0 0 3 0 5 . 0 0 - 3 3 0 . 5 0 - - - - - i - - 1 3 1 2 4 0 3 2 6 5 1 9 5 31 2 0 9“
A C C O U N T IN G C L E R K S . C L A S S B 8 3 4 4 0 . 0 1 8 2 . 3 0 1 6 7 . 5 0 1 4 4 . 0 0 - 2 0 2 . 5 0 _ 1 0 5 6 0 9 1 8 2 1 3 0 5 7 5 3 37 5 3 4 9 2 7 2 7 33 1 8 - - - 6 6 -
H A N U F A C T U R I N G ................................... 1 3 2 4 0 . 0 1 9 2 . 5 0 1 6 4 . 0 0 1 4 7 . 5 0 - 2 0 3 . 5 0 9 1 0 2 1 1 4 23 6 6 3 18 1 3 6 - - 6 6N O N R A N U F A C T U R IN G .......................... 7 0 2 4 0 . 0 1 8 0 . 0 0 1 6 7 . 5 0 1 4 4 . 0 0 - 2 0 1 . 0 0 - 9 6 5 0 7 0 6 8 1 0 7 5 1 4 7 34 3 5 4 8 24 2 1 33 1 8 - “
P U B L I C U T I L I T I E S ...................... 1 2 4 4 0 . 0 2 6 4 . 0 0 2 6 8 . 5 0 2 4 0 . 0 0 - 2 9 8 . 0 0 - - 1 2 2 3 7 1 7 20 2 1 3 3 1 8 “ — ~
P A Y R O L L C L E R K S . . . . . ............................ 1 5 7 4 0 . 0 2 5 2 . 5 0 2 3 4 . 0 0 1 9 2 . 5 0 - 3 1 7 . 5 0 _ _ _ _ 8 17 7 6 7 14 2 8 14 11 5 2 1 1 5 1 1 6 3 2H A N U F A C T U R I N G ...................................... 6 1 4 0 . 0 2 7 7 . 0 0 2 7 8 . 0 0 1 9 6 . 0 0 - 3 6 0 . 5 0 2 6 1 4 4 2 5 3 7 5 2 - 1 1 4 3 2N O N R A N U F A C T U R IN G ............................ 9 6 4 0 . 0 2 3 6 . 5 0 2 2 5 . 5 0 1 8 3 . 0 0 - 2 5 6 . 5 0 - 6 11 6 2 3 1 2 2 3 11 4 “ 1 1 5 “ 2 ~
K E Y EN TR Y O P E R A T O R S ............................ 9 9 6 4 0 . 0 2 1 5 . 0 0 2 0 3 . 0 0 1 7 3 . 5 0 - 2 3 5 . 5 0 _ 1 3 3 7 4 0 1 1 1 1 4 1 9 0 5 8 1 2 4 1 5 8 6 7 3 6 2 4 2 9 3 8 2 5 7 7 - -
H A N U F A C T U R I N G ...................................... 1 9 4 4 0 . 0 2 1 1 . 5 0 1 9 1 . 5 0 1 7 1 . 5 0 - 2 2 6 . 5 0 - - ~ 2 * 30 3 4 2 6 10 2 7 2 0 15 7 3 1 3 2 3 7 ~
N O N R A N U F A C T U R IN G ............................ 8 0 2 4 0 . 0 2 1 6 . 0 0 2 0 3 . 5 0 1 7 3 . 5 0 - 2 3 7 . 0 0 1 3 3 5 3 6 81 1 0 7 6 4 4 8 9 7 1 3 8 52 2 9 2 1 2 8 3 5 2 3 4
KE Y ENT RY O P E R A T O R S . C L A S S A ............. 5 5 5 4 0 . 0 2 2 6 . 5 0 2 2 6 . 0 0 1 9 4 . 5 0 - 2 4 1 . 0 0 - - _ 3 1 4 50 2 1 44 2 6 9 8 1 4 5 6 2 3 2 1 8 4 1 6 8 7 7 - -H A N U F A C T U R I N G . . . . . . . . ............. 8 8 4 0 . 0 2 3 5 . 0 0 2 2 0 . 0 0 1 8 * . 5 0 - 2 4 0 . 0 0 - - - - 3 3 5 14 5 14 1 4 13 3 1 - 2 1 3 7 ” “N O N R A N U F A C T U R IN G ............................. 4 6 7 4 0 . 0 2 2 5 . 0 0 2 2 8 . 0 0 1 9 5 . 5 0 - 2 4 4 . 5 0 - " - 3 i i 47 1 6 3 0 2 1 8 4 1 3 1 4 9 2 9 1 7 4 1 4 7 4
KEY EN TR Y O P E R A T O R S . C L A S S R ............. 4 4 1 4 0 . 0 2 0 0 . 5 0 1 7 9 . 0 0 1 6 6 . 0 0 - 2 0 3 . 0 0 _ 1 3 3 4 2 6 61 1 2 0 4 6 32 2 6 1 3 5 4 6 2 5 2 2 1 7 - - - -
H A N U F A C T U R I N G ...................................... 1 0 6 4 0 . 0 1 9 1 . 5 0 1 7 6 . 5 0 1 6 7 . 0 0 - 2 0 0 . 0 0 - - - 2 1 27 2 9 12 5 1 3 6 2 4 2 1 1 1 “ ~N O N R A N U F A C T U R IN G ............................. 3 3 5 4 0 . 0 2 0 3 . 0 0 1 7 9 . 0 0 1 6 5 . 0 0 - 2 0 4 . 5 0 - 1 3 3 2 2 5 34 9 1 3 4 2 7 1 3 7 3 “ 4 2 4 2 1 1 6 “ ~
P U B L I C U T I L I T I E S ...................... 1 3 7 4 0 . 0 2 4 8 . 0 0 2 1 4 . 0 0 1 7 7 . 5 0 - 3 3 6 . 0 0 1 5 9 4 4 1 2 1 4 2 4 2 1 1 6
See footnotes at end o f tab les.
18Digitized for FRASER http://fraser.stlouisfed.org/ Federal Reserve Bank of St. Louis
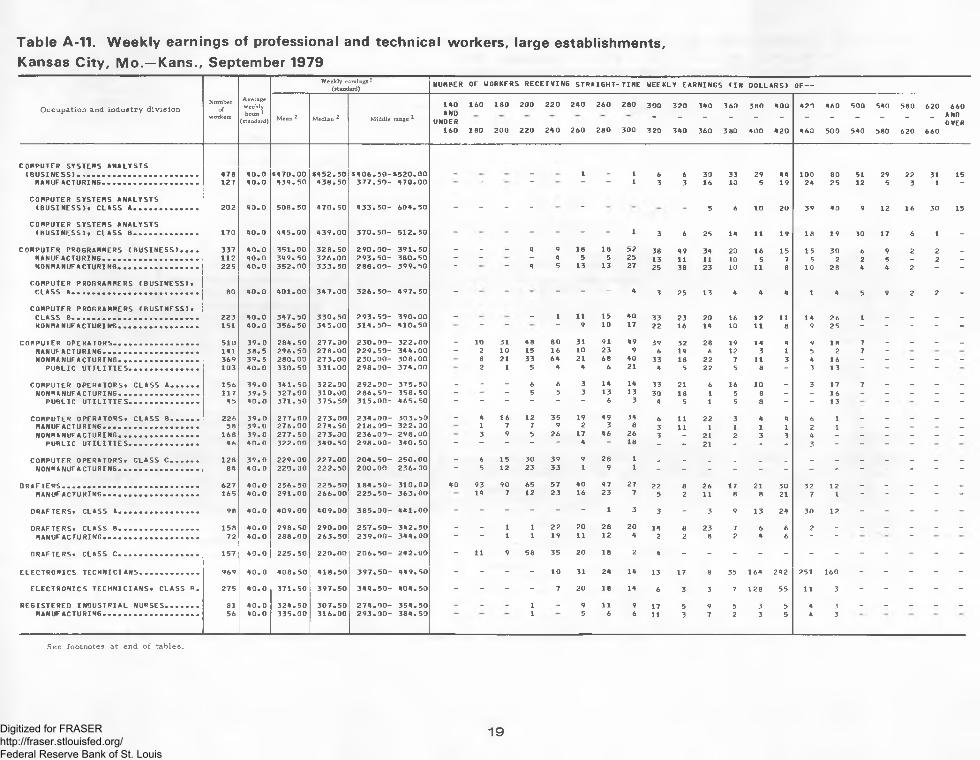
Table A-11. Weekly earnings of professional and technical workers, large establishments,Kansas City, M o.—Kans., September 1979
O ccupa tion and in d u s try d iv is io nNumber
ofworkers
Average w eekly hours 1
(standard)
W eekly earnings 1 (standard) NUMBER OF WORKERS RECEIVING STRAIGHT- TIME WEEKLY EARNINGS (IN DOLLARS) OF—
Mean ^ M edian 2 M iddle range 2
140AND
UNDER160
160
180
180
200
200
220
220
240
240
260
260
280
280
300
300
320
320
340
340
360
3 60
3 80
380
400
400
420
420
460
460
500
500
540
540
580
580
620
620
660
660ANDOVER
COMPUTER SYSTEMS ANALYSTS(B U S IN E S S ) ................................................ 478 40.0 *470.00 *452.50 * 40 6 .50 - *520.00 - ~ 1 - 1 6 6 30 33 29 44 100 80 51 29 22 31 15
N A N U F A C T U R IN B ... ............................... 127 40 .0 434 .50 438 .50 3 7 7 .5 0 - 470 .00 “ “ ~ “ 1 3 3 16 10 5 19 24 25 12 5 3 1 -
COMPUTER SYSTEMS ANALYSTS(BU S INESS)f CLASS A ........................... 202 40 .0 508. 50 470 .50 4 3 3 .5 0 - 604. 50 “ “ “ “ ~ - 5 6 10 20 39 40 9 12 16 30 15
DRAFTERS ............................................................................................. 627 40 .0 256.50 225 .50 1 8 4 .5 0 - 310 .00 40 93 90 65 57 40 47 27 22 8 26 17 21 30 32 12 _ _ _ _ _m a n u f a c t u r in g ....................... ... ...................................... 165 40 .0 291.00 266 .00 2 2 5 .5 0 - 363 .00 14 7 12 23 16 23 7 5 2 11 8 8 21 7 1 - - - - -
d r a f t e r s , c l a s s a ....................................................... 98 40 .0 409 .00 409 .00 3 8 5 .0 0 - 441 .00 - - - - - - 1 3 3 - 3 9 13 24 30 12 - - - - -
46 A 40 .0 245.50 PUBLIC U T IL IT IE S ............................ 320 40.0 313.00145 40 .0 302 .50 COMPUTER OPERATORS. CLASS A............ 117 3 9 .0 351 .00
90 40.0 272.50 MANUFACTURING............................ .. 106 40.0 191.50ELECTRONICS TEC H N IC IAN S ... . . . . . . . . . 939 4 0 .0 410 .50
377 40.0 172.00 PUBLIC U T IL IT IE S ............................ 129 40 .0 246.00135 40 .0 165.00 ELECTRONICS TECHNICIANS. CLASS B . 271 4 0 .0 371 .50242 39 .5 176.50 PERSONNEL CLERKS (EMPLOYMENT)........... 93 40.0 222.00
PUBLIC U T IL IT IE S ........................... • 142 10.33 10.48 1 0 .1 1 - 10.48 2 “ “ “ “ “ “ 1 “ 1 6 - “ “ 29 82 1 20
MAINTENANCE P IP E F IT T E R S ...................... m 460 10.20 10.38 9 .7 0 - 10.91 31 - 17 144 38 69 161 -MANUFACTURING..................................... 460 10.20 10.38 9 .7 0 - 10.91 * - “ ” “ “ “ 31 17 144 38 69 161 “
PUBLIC U T I L I T I E S . . . .................... 190 7 .68 8 .0 0 7 .2 0 - 8 .00 1 3 7 51 17 111
See footnotes at end o f tab les.
22Digitized for FRASER http://fraser.stlouisfed.org/ Federal Reserve Bank of St. Louis
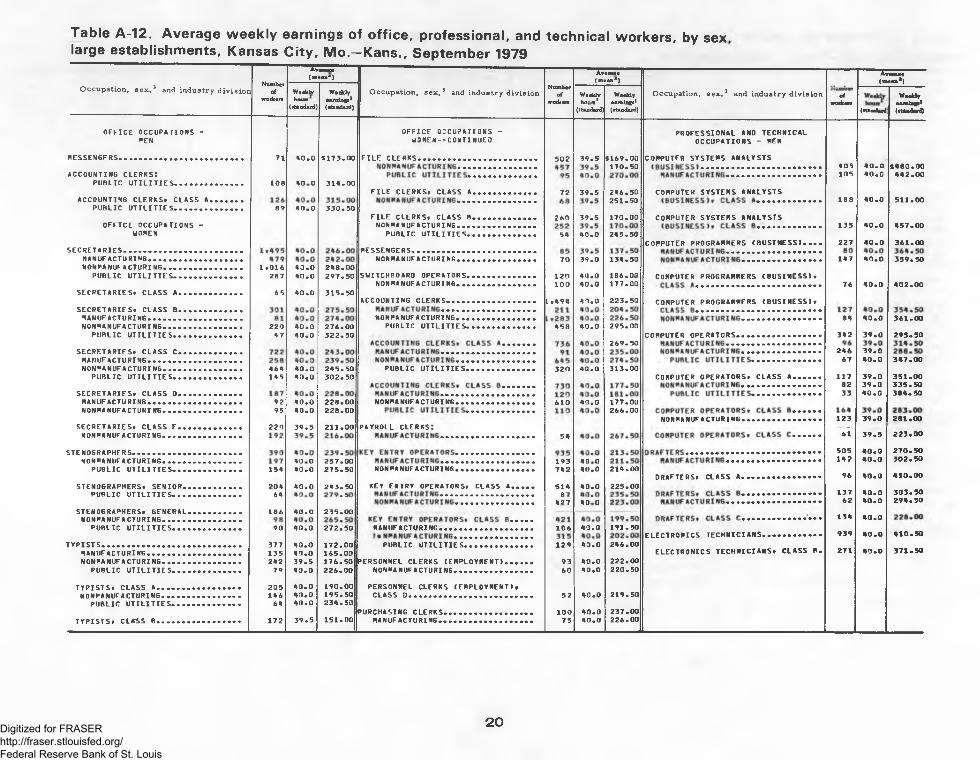
Table A-15. Average hourly earnings of maintenance, toolroom, powerplant, material movement,and custodial workers, by sex, large establishments, Kansas City, Mo.—Kans., September 1979
O ccupa tion , s e x ,3 and in dustry d iv is io nNumber
o fworkers
Average (m ean2 )
hourly earnings4
O ccupation, s e x ,3 and industry d iv is io nNumber
o fworkers
A verage(m ean 2 )
hourlyearnings4
O ccupation , s e x ,3 and in dustry d iv is io nNumber
ofworkers
A verage(m ean2 )
hourlyearnings4
MAINTENANCE. TOOLROOM. AND MAINTENANCE, t o o l r o o m . AND MATERIAL MOVEMENT AND CUSTODIALPOWERPLANT OCCUPATIONS - MEN POWERPLANT OCCUPATIONS- OCCUPATIONS - MEN— CONTINUED
MEN— CONTINUED
33 8 .35 29 10 .08PUBLIC U T IL IT IE S ............................. 38 8 .60
MAINTENANCE ELECTR IC IAN S ...................... 665 10.15
OCCUPATIONS - MEN
918 16
PUBLIC U T I L I T I E S . . . . . . . . . . . . . . 38 8 .60342 10.12 PUBLIC U T I L I T I E S . . . . . . . . . . . . . • 475 10 .01
JAN ITO RS. PORTERS. AND C LE A N E R S .. .. 1 .113 6 .80
PUBLIC U T IL IT IE S ............................ 31 9 .36 (OTHER THAN FO R K L IFT ).......................... 257 8 .77
See footnotes at end o f tab les.
2 3Digitized for FRASER http://fraser.stlouisfed.org/ Federal Reserve Bank of St. Louis
Establishment practices and supplementary wage provisionsTable B-1. Minimum entrance salaries for inexperienced typists and clerks, Kansas City, Mo.—Kans., September 1979
Inexperienced typ ists O the r inexperienced c le r ic a l w orkers*
M in im u m w eek ly s tra ig h t-t im e s a la ry 7
EST ABLISH*E NTS STUDIED
ESTABLISHMENTS HAWING A SPEC IFIED MINIMUM -----------------------------------------
*110.00 AND UNDER *115.00 -*115.00 AND UNDER *120.00 —*120.00 AND UNDER *125.00 —*125.00 AND UNDER *130.00 —*130.00 AND UNDER *135.00 -*135.00 AND UNDER *140.00 —*140.00 AND UNDER *145.00 —*145.00 AND UNDER * 1 5 0 .00V-*150.00 AND UNDER *155.00 —*155.00 AND UNDER *160 .00 —*160.00 A NO UNDER *165.00 —*165.00 AND UNDER *170.00 —*170.00 AND UNDER *175.00 —*175.00 ANO u nd er *180.00 —*180.00 AND UNDER *185.00 —*185.00 AND UNDER *190.00 —*190.00 ANO UNDER *195.00 —*195.00 AND UNDER *200.00 —*200.00 AND UNDER *205.00 —*205.00 ANO UNDER *210.00 —*210.00 AND UNDER *215.00 —*215.00 ANO u nd er *220.00 —*220.00 AND UNDER *225.00 —*225.00 AND UNDER *230.00 —*230.00 ANO UNDER *235.00 —*235.00 AND UNDER *240.00 —*240.00 AND UNDER *245.00 —*245.00 ANO UNDER *250.00 —*250.00 AND UNDER *255.00 —*255.00 ANO UNDER *260.00 —*260.00 ANO UNDER *265.00 —$265.00 ANO UNDER *270.00 —*270.00 AND UNDER *275.00 —*275.00 AND UNDER *280 .00 —*280.00 AND UNOER *285.00 —*285.00 AND UNDER *290.00 —*290.00 AND UNDER *295.00 —*295.00 AND UNOER *300.00 —*300.00*305.00
ANDANO
UNOER OVER -
*305.00 —
ESTABLISHMENTS HAVING NO SPECIFIED MINIMUM --------------------------------------------
ESTABLISHMENTS WHICH DID NOT EMPLOY WORKERS IN THIS CATEGORY ---------------
A l lin du strie s
M anu factu ring Nonm anufactu ring M an u factu r ing Nonm anu factu r ing
24Digitized for FRASER http://fraser.stlouisfed.org/ Federal Reserve Bank of St. Louis
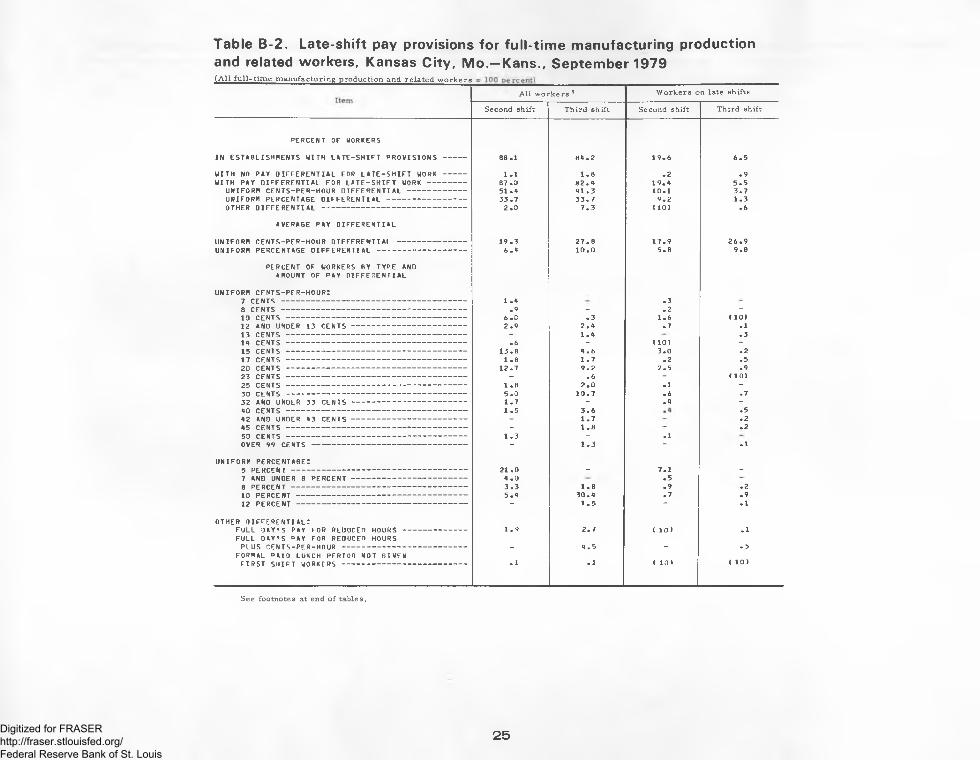
Table B-2. Late-shift pay provisions for full-time manufacturing productionand related workers, Kansas City, Mo.—Kans., September 1979{A ll_^u ll-tim e m anufacturing production and re la ted w ork ers —
A l l w o rk e rs 9 W o rke rs on la te sh ifts
Second sh ift T h ird sh ift Second sh ift T h ird sh ift
WITH NO PAY D IFFERENTIAL FOR LATE-S H IFT WORKWITH PAY D IFFERENTIAL FOR LATE-SH IFT WORK ---
UNIFORM CENTS-PER-HOUR D IFFERENTIAL ----------UNIFORM PERCENTAGE DIFFERENTIAL -----------------OTHER D IFFERENTIAL ---------------------------------------
AVERAGE PAY D IFFERENTIAL
UNIFORM CENTS-PER-HOUR DIFFERENTIAL -------------UNIFORM PERCENTAGE D IFFERENTIAL --------------------
PERCENT OF WORKERS BY TYPE AND AMOUNT OF PAY D IFFERENTIAL
UNIFORM c e n t s - p e r - h o u r :7 CENTS ----------------------------------------------------8 CENTS ----------------------------------------------------10 CENTS -------------------------------------------------12 AND UNOER 13 CENTS -----------------------------13 CENTS --------------------------------------------------14 CENTS --------------------------------------------------15 CENTS --------------------------------------------------17 CENTS --------------------------------------------------20 CENTS --------------------------------------------------23 CENTS --------------------------------------------------25 C E N T S ------------------------------------------- ------30 CENTS --------------------------------------------------32 ANO UNOER 33 CENTS -----------------------------40 CENTS --------------------------------------------------42 AND UNDER 43 CENTS -----------------------------45 CENTS --------------------------------------------------50 CENTS --------------------------------------------------OVER 99 CENTS ------------------------------------------
u n if o r m p e r c e n t a g e :5 PERCENT -----------------------------------------------7 AND UNOER 8 PERCENT -----------------------------8 PERCENT -------------------------------------------------10 PERCENT -----------------------------------------------12 PERCENT -----------------------------------------------
o t h e r d i f f e r e n t i a l :FULL DAY’ S PAY FOR REDUCED HOURS -----------FULL DAY’ S PAY FOR REDUCEn HOURS
PLUS CENTS-PER-HOUR -------------------------------FORMAL PAID LUNCH PERIOD NOT GIVEN
FIRST SHIFT WORKERS --------------------------------
See footnotes at end o f tables.
25Digitized for FRASER http://fraser.stlouisfed.org/ Federal Reserve Bank of St. Louis
Table B-3. Scheduled weekly hours and days of full-time first-shift workers, Kansas City, Mo.—Kans., September 1979P ro d u c t io n and re la ted w o rke rs O ff ic e w o rk e rs
ItemA l l in dustrie s M anu factu ring Nonm anufactu ring P u b lic u t il it ie s A l l industries M anu factu ring Nonm anufactu ring P u b lic u t il it ie s
PERCENT OF WORKERS BY SCHEDULED WEEKLY HOURS AND DAYS
ALL FU LL-TIM E WORKERS ------------------ 100 100 100 100 100 100 100 100
18 HOURS—5 DAYS --------------------------------- (11) - (11) - - - _ _20 HOURS—5 DAYS --------------------------------- (11) - (11) -30 HOURS—5 DAYS --------------------------------- (11 > (11) ~ - -35 HOURS—5 DAYS --------------------------------- 3 5 2 - 2 ~ 3 -36 HOURS—5 DAYS --------------------------------- - - 2 - 236 1 /4 HOURS—5 D A Y S -------------------------- - - - 3 4 -37 1/2 HOURS—5 DAYS --------------------------- 1 2 - - 3 (11) 4 138 HOURS—4 DAYS --------------------------------- 1 1 1 1 -38 3/4 HOURS-5 D A Y S -------------------------- - - 6 1 840 HOURS—5 DAYS --------------------------------- 91 91 91 100 84 99 79 9944 HOURS—5 1/2 DAYS -------------------------- 1 2 - ~ “ - “45 HOURS—5 DAYS --------------------------------- 2 4 - “46 HOURS—6 DAYS --------------------------------- (11 ) - ( i d - “ ~ “49 HOURS—4 1/2 DAYS --------------------------- (11) i - “ ”56 HOURS-7 DAYS --------------------------------- (11) 1 “ ~ “
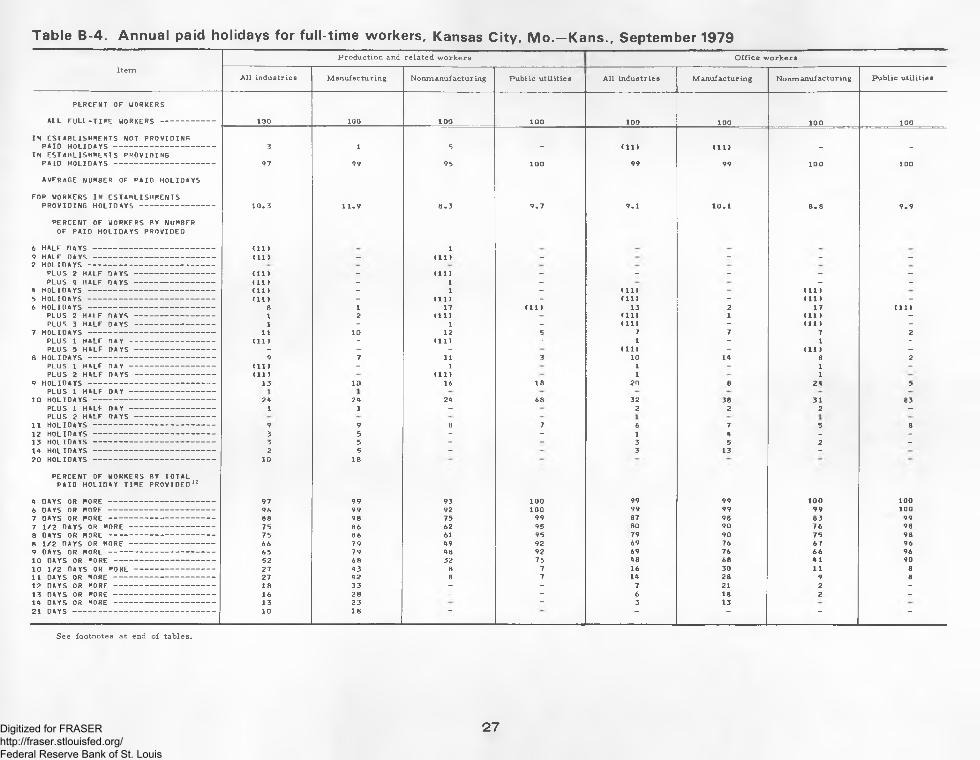
PERCENT OF WORKERS BY TOTAL PAID HOLIDAY TIME PROVIDED12
4 DAYS OR MORE ------6 DAYS OR MORE -------7 DAYS OR MORE -------7 1/2 DAYS OR MORE8 DAYS OR MORE -------8 1/2 DAYS OR MORE9 DAYS OR MORE -------10 DAYS OR MORE -----10 1/2 OAYS OR MORE11 OAYS OR MORE -----12 DAYS OR MORE -----13 DAYS OR MORE -----14 DAYS OR MORE -----21 DAYS -------------------
A l l in dustrie s M anufactu ring Nonm anufactu ring P u b lic u t il it ie s A l l in dustrie s M anu factu ring Nonm anufactu ring P u b lic u t il it ie s
6 MONTHS OF SERVICE:UNDER 1 WEEK -------------------1 WEEK -----------------------------OVER 1 AND UNDER 2 WEEKS2 WEEKS ---------------------------
1 YEAR OF SERVICE:1 WEEK -----------------------------OVER 1 AND UNDER 2 WEEKS2 WEEKS ---------------------------OVER 2 ANO UNDER 3 WEEKS3 WEEKS ---------------------------
2 YEARS OF SERVICE:1 WEEK -----------------------------OVER 1 AND UNDER 2 WEEKS2 WEEKS ---------------------------OVER 2 ANO UNDER 3 WEEKS3 WEEKS ---------------------------OVER 3 AND UNOER A WEEKS
3 YEARS OF SERVICE:1 WEEK -----------------------------OVER 1 AND UNDER 2 WEEKS2 WEEKS ---------------------------OVER 2 AND UNOER 3 WEEKS3 WEEKS ---------------------------OVER 3 AND UNDER A WEEKS A WEEKS ---------------------------
A YEARS OF SERVICE:1 WEEK -----------------------------OVER 1 AND UNDER 2 WEEKS2 WEEKS ---------------------------OVER 2 AND UNDER 3 WEEKS3 WEEKS ---------------------------OVER 3 AND UNDER A WEEKS A WEEKS ---------------------------
P rodu ction and re la ted w ork ers O ffice w ork ers
A l l in du s tr ie s M an u factu ring Nonm anufactu ring ■ P u b lic u t il it ie s A l l industrie s M an u factu ring Nonm anu factu ring P u b lic u t i l it ie s
28Digitized for FRASER http://fraser.stlouisfed.org/ Federal Reserve Bank of St. Louis
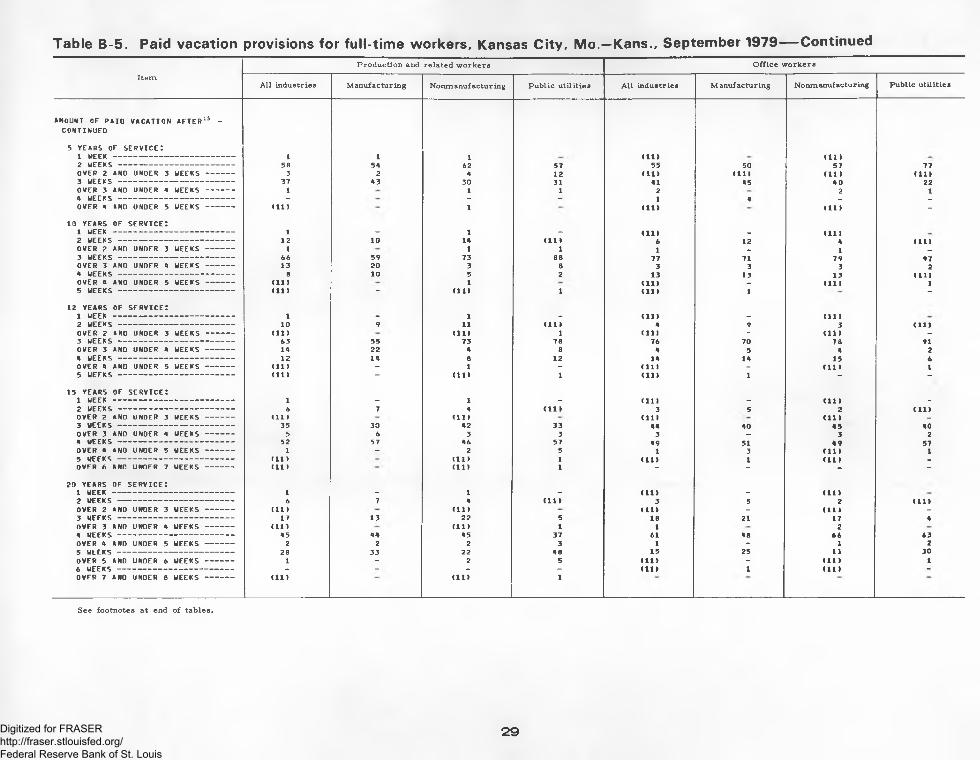
Table B-5. Paid vacation provisions for full-time workers, Kansas City, Mo.—Kans., September 1979— Continued
Item
AMOUNT OF PAIO VACATION AFTER 13 - CONTINUED
5 YEARS OF SERVICE:1 UEEK -------------------------------------2 WEEKS -----------------------------------OVER 2 AND UNDER 3 WEEKS ------3 WEEKS -----------------------------------OVER 3 ANO UNDER A WEEKS ------A WEEKS -----------------------------------OVER A AND UNDER 5 WEEKS ------
10 YEARS OF SERVICE:1 WEEK -------------------------------------2 WEEKS -----------------------------------OVER 2 AND UNDER 3 WEEKS ------3 WEEKS -----------------------------------OVER 3 AND UNDFR A WEEKS ------A WEEKS -----------------------------------OVER A ANO UNDER 5 WEEKS ------5 WEEKS -----------------------------------
12 YEARS OF SERVICE!1 WEEK -----------------------------2 WEEKS ---------------------------OVER 2 ANO UNDER 3 WEEKS3 WEEKS ---------------------------OVER 3 AND UNDER A WEEKSA WEEKS ---------------------------OVER A AND UNDER 5 WEEKS 5 WEEKS ---------------------------
15 YEARS OF SERVICE!1 WEEK -----------------------------2 WEEKS ---------------------------OVER 2 AND UNDER 3 WEEKS3 WEEKS ---------------------------OVER 3 AND UNDER A WEEKSA WEEKS ---------------------------OVER A ANO UNDER 5 WEEKS5 WEEKS ---------------------------OVER 6 ANO UNOER 7 WEEKS
20 YEARS OF SERVICE!1 WEEK -----------------------------2 WEEKS ---------------------------OVER 2 AND UNDER 3 WEEKS3 WEEKS ---------------------------OVER 3 AND UNDER A WEEKSA WEEKS ---------------------------OVER A AND UNOER 5 WEEKS5 WEEKS ---------------------------OVER 5 AND UNDER 6 WEEKS6 WEEKS ---------------------------OVER 7 AND UNDER 8 WEEKS
P ro d u c t io n and re la ted w o rke rs O ff ic e w o rke rs
A l l industrie s M anufactu ring Nonm anufactu ring P u b lic u t il it ie s A l l industrie s M anu factu ring Nonm anufacturing P u b lic u t il it ie s
1 1 1 (11) (11)58 5A 62 57 55 50 57 77
3 2 A 12 (11) (11) (11) (11)37 A3 30 31 A1 A5 AO 22
29Digitized for FRASER http://fraser.stlouisfed.org/ Federal Reserve Bank of St. Louis
Table B-5. Paid vacation provisions for full-time workers, Kansas City, Mo.—Kans., September 1979— Continued
Item
AMOUNT OF PAID VACATION AFTER13 CONTINUED
25 YEARS OF SERVICE!1 MEEK --------------------------------2 MEEKS ------------------------------OVER 2 AND UNDER 3 MEEKS -3 MEEKS ------------------------------OVER 3 AND UNDER A MEEKS -A MEEKS ------------------------------OVER A AND UNDER 5 MEEKS -5 MEEKS ------------------------------OVER 5 AND UNDER 6 MEEKS -6 MEEKS ------------------------------OVER 7 AND UNDER 8 MEEKS -
30 YEARS OF SERVICE!1 MEEK --------------------------------2 MEEKS ------------------------------OVER 2 AND UNDER 3 MEEKS -3 MEEKS ------------------------------OVER 3 AND UNDER A MEEKS ~A MEEKS -------------------------------OVER A AND UNDER 5 MEEKS -5 MEEKS ------------------------------OVER 5 AND UNDER 6 MEEKS -6 MEEKS ------------------------------OVER 7 ANO UNDER 8 MEEKS -
MAXIMUM VACATION AVA ILABLE !1 MEEK --------------------------------2 MEEKS ------------------------------OVER 2 AND UNDER 3 MEEKS -3 MEEKS ------------------------------OVER 3 AND UNDER A MEEKS -A MEEKS ------------------------------OVER A AND UNDER 5 MEEKS -5 MEEKS ------------------------------OVER 5 AND UNDER 6 MEEKS -6 MEEKS -------------------------------7 MEEKS -------------------------------OVER 7 ANO UNDER 8 MEEKS -
P ro d u c t io n and re la ted w o rke rs O ff ic e w o rk e rs
A l l in du strie s M an u factu ring Nonm anu factu ring P u b lic u t il it ie s A l l in dustrie s M an u factu ring Nonm anu factu ring P u b lic u t i l it ie s
1 1 (11) (11 )6 7 A (11 ) 3 5 2 (11)
(11) - (11) - (11) (11 ) -17 13 22 5 18 20 17 A
(11 > - (11) 1 ~ ~ ~26 27 25 A 32 32 32 6
2 2 1 - 1 1AO A7 30 5 A A2 39 A3 71
1 - 2 6 1 3 (11 ) 17 A 12 28 3 1 A 18
(11) “ (11) 1 ~ “ “~
1 1 (11) _ (11 ) _6 7 A (11) 3 5 2 (11)
(11) - (11) - (11) “ (11 )17 13 22 5 18 20 17 A
(11) - (11) 1 “ - -25 25 2A A 31 32 31 6
2 2 1 - 1 138 A5 30 5 A A1 35 A3 71
1 - 2 6 (11) - (11 ) 110 8 13 28 6 9 5 18
(11) “ (11) 1 “
1 _ 1 (11) _ (11 ) _6 7 4 (11) 3 5 2 (11 )
(11) - ( i d - (11) ~ (11 ) ~17 13 22 5 18 20 17 4
(11) - (11) 1 - -25 25 2A A 31 32 31 6
2 2 1 - 1 137 A3 30 5A AO 35 A 2 71
1 - 2 6 (11) (11 ) 111 8 1A 28 7 8 6 18
1 2 - - C 111 t i l )(11) (11) 1
See footnotes at end o f tab les.
30Digitized for FRASER http://fraser.stlouisfed.org/ Federal Reserve Bank of St. Louis
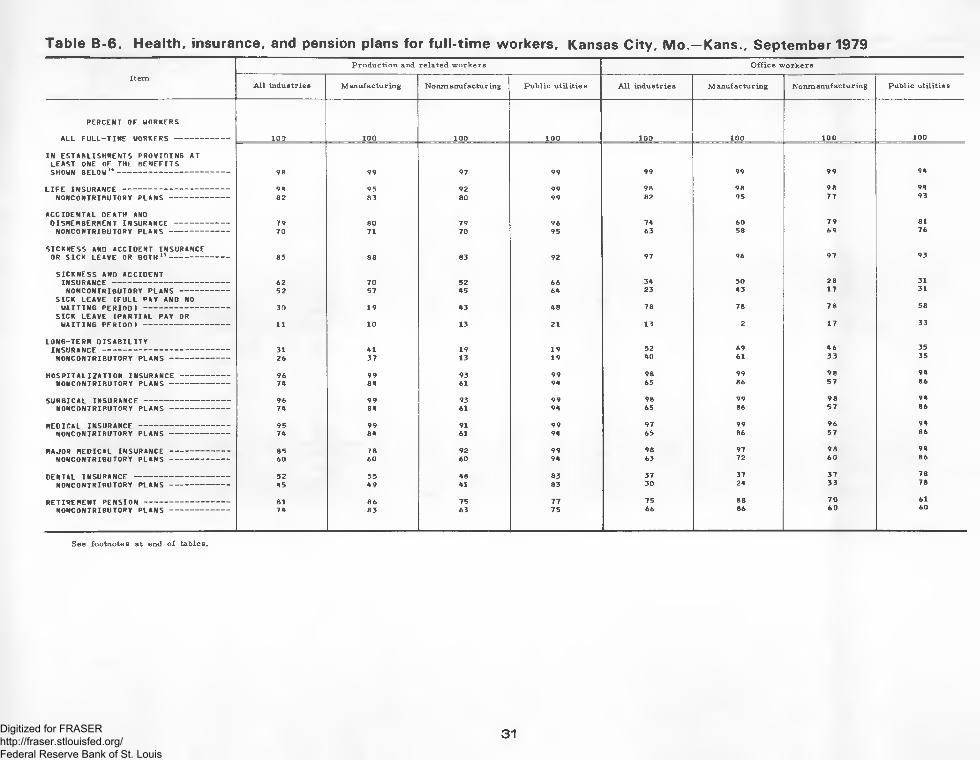
Table B-6. Health, insurance, and pension plans for full-time workers, Kansas City, Mo.—Kans., September 1979
Item
PERCENT OF WORKERS
ALL FU LL-T IN E WORKERS ---------
IN ESTABLISHNENTS PROVIDING AT LEAST ONE OF THE BENEFITS SHOWN BELOW14----------------------------
L I F E INSURANCE --------------------------NONCONTRIBUTORV PLANS ----------
ACCIDENTAL DEATH ANDD ISHEHBERNENT INSURANCE ---------
NONCONTRIBUTORY PLANS ----------
SICKNESS AND ACCIDENT INSURANCE OR SICK LEAVE OR BOTH 15------------
SICKNESS AND ACCIDENTINSURANCE -------------------------------NONCONTRIBUTORY PLANS ---------
SICK LEAVE (FU LL PAY AND NOWAITING PERIOD I ---------------------
SICK LEAVE (PARTIA L PAY OR WAITING PERIOD I ---------------------
LONG-TERN D IS A B IL IT YINSURANCE ----------------------------------
NONCONTRIBUTORY PLANS ------------
HO SPITALIZATION INSURANCE NONCONTRIBUTORY PLANS —
P ro d u c t io n and re la ted w o rke rs O ff ic e w o rke rs
A l l in du strie s M anu factu ring Nonm anufactu ring P u b lic u t il it ie s A l l in du strie s M anu factu ring Nonm anufactu ring P u b lic u t il it ie s
100 100 100 100 100 100 100 100
98 99 97 99 99 99 99 94
94 95 92 99 98 98 98 9482 83 80 99 82 95 77 93
79 80 79 96 74 60 79 8170 71 70 95 63 58 64 76
85 88 83 92 97 96 97 93
62 70 52 66 34 50 28 3152 57 45 64 23 43 17 31
30 19 43 48 78 78 78 58
11 10 13 21 13 2 17 33
31 41 19 19 52 69 46 3526 37 13 19 40 61 33 35
96 99 93 99 98 99 98 9474 84 61 94 65 86 57 86
96 99 93 99 98 99 98 9474 84 61 94 65 86 57 86
95 99 91 99 97 99 96 9474 84 61 94 65 86 57 86
85 78 92 99 98 97 98 9460 60 60 94 63 72 60 86
52 55 48 83 37 37 37 7845 49 41 83 30 24 33 78
81 66 75 77 75 88 70 6174 83 63 75 66 86 60 60
See footnotes at end o f tab les.
31Digitized for FRASER http://fraser.stlouisfed.org/ Federal Reserve Bank of St. Louis
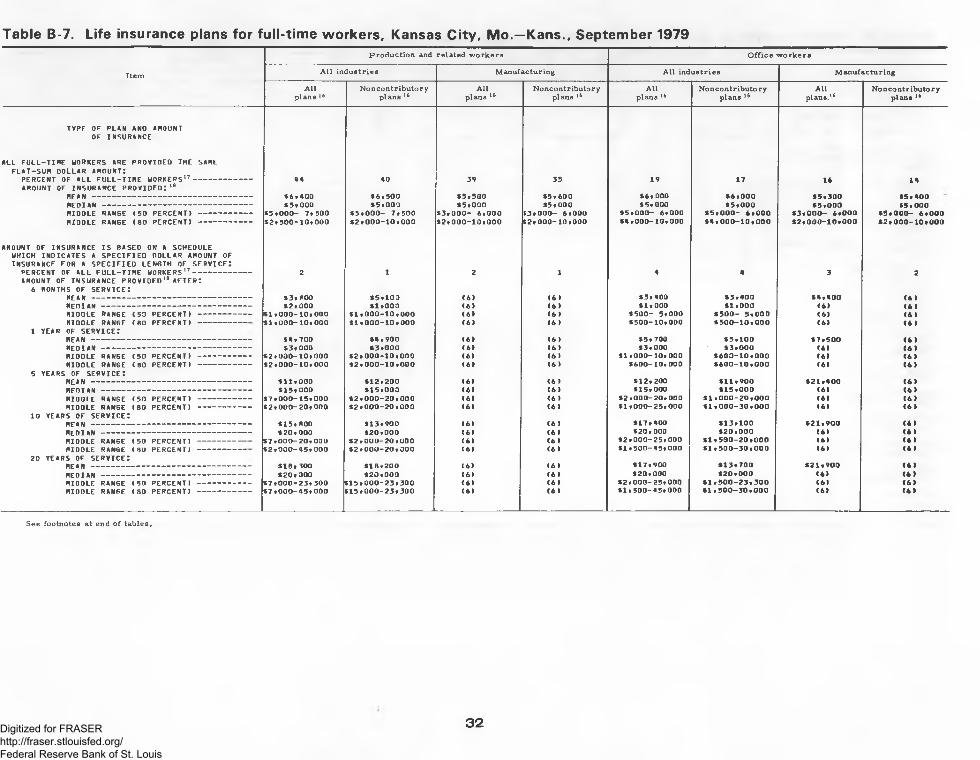
Table B-7. Life insurance plans for full-time workers, Kansas City, Mo.—Kans., September 1979
Item
TYPE OF PL*N AND AHOUNT OF INSURANCE
ALL FU LL-T IN E WORKERS ARE PROVIDED THE SANE FLAT-SUN DOLLAR AHOUNT:
PERCENT OF ALL FU LL-T IN E WORKERS17--------AHOUNT OF INSURANCE PRO VIDED:18
H E A N ------------------------------------------HEDIAN ---------------------------------------RIDDLE RANGE C50 PERCENT) ------RIDDLE RANGE (80 PERCENT) ------
AHOUNT OF INSURANCE IS BASED ON A SCHEDULE WHICH INDICATES A SPEC IFIED DOLLAR AHOUNT OF INSURANCE FOR A SPEC IFIED LENGTH OF SERVICE!
PERCENT OF ALL FU LL-T IH E WORKERS17-------------AHOUNT OF INSURANCE PROVIDED18 AFTERZ
6 HONTHS OF SERVICE!H E A N -----------------------------------------------HEDIAN --------------------------------------------RIDDLE RANGE (50 PERCENT) ------------HIOOLE RANGE (80 PERCENT) ------------
1 YEAR OF SERVICE:H E A N -----------------------------------------------HEDIAN --------------------------------------------RIDDLE RANGE (50 PERCENT) ------------HIOOLE RANGE (80 PERCENT) ------------
5 YEARS OF SERVICE!H E A N -----------------------------------------------HEOIAN --------------------------------------------RIDDLE RANGE (50 PERCENT) ------------RIDDLE RANGE (80 PERCENT) ------------
10 YEARS OF SERVICE!H E A N ------------------------------------------------HEOIAN --------------------------------------------RIDDLE RANGE (50 PERCENT) ------------RIDDLE RANGE (80 PERCENT) ------------
20 YEARS OF SERVICE:H E A N -----------------------------------------------HEDIAN --------------------------------------------RIDDLE RANGE (50 PERCENT) ------------HIOOLE RANGE (80 PERCENT) ------------
P ro d u c t io n and re la ted w o rke rs O ff ic e w o rk e rs
A l l in du str ie s M anu factu r ing A l l in du strie s M anu factu ring
32Digitized for FRASER http://fraser.stlouisfed.org/ Federal Reserve Bank of St. Louis
Table B-7. Life insurance plans for full-time workers, Kansas City, Mo.—Kans., September 1979— Continued
Item
P rodu ction and related w ork ers
A l l in du strie s M anuf actur ing A l l in dustrie s
O ffice w ork ers
M anufacturing
TYPE OF PLAN ANO AMOUNT OF INSURANCE—CONTTNUEO
AMOUNT OF INSURANCE IS BASED ON A SCHEDULE WHICH INDICATES A SPEC IFIED OOLLAR AMOUNT OF INSURANCE FOR A SPEC IFIED AMOUNT OF EARNINGS!
PERCENT OF ALL FU LL-T IM E WORKERS17---------------AMOUNT OF INSURANCE PROVIDED18 I F !
ANNUAL EARNINGS ARE * 5 .0 0 0 !M E A N -------------------------------------------------MEDIAN ---------------------------------------------MIDDLE RANGE <50 PERCENT) -------------MIDDLE RANGE <80 PERCENT) -------------
ANNUAL EARNINGS ARE * 10 .0 00 !M E A N -------------------------------------------------MEDIAN ---------------------------------------------MIOOLE RANGE <50 PERCENT) -------------MIDDLE RANGE <80 PERCENT) ------------
ANNUAL EARNINGS APE * 1 5 .0 0 0 !M E A N -------------------------------------------------MEDIAN ---------------------------------------------MIDDLE RANGE <50 PERCENT) -------------MIDDLE RANGE <80 PERCENT) -------------
ANNUAL EARNINGS ARE * 20 .0 00 !M E A N -------------------------------------------------MEDIAN ---------------------------------------------MIOOLE RANGE <50 PERCENT) ------------MIDDLE RANGE <80 PERCENT) -------------
AMOUNT OF INSURANCE IS EXPRESSED AS A FACTOR OF ANNUAL EARNINGS! 19
PERCENT OF ALL FU LL-T IM E WORKERS 17----------------FACTOR OF ANNUAL EARNINGS USED TO CALCULATE
AMOUNT OF IN SURAN CE!18M E A N --------------------------------------------------MEDIAN -----------------------------------------------MIDDLE RANGE <50 PERCENT) --------------MIOOLE RANGE <80 PERCENT) --------------
PERCENT OF ALL FU LL-T IM E WORKERS COVERED BY PLANS NOT SPEC IFYING A MAXIMUM AMOUNT OFINSURANCE ------------------------------------------------------
PERCENT OF ALL FU LL-T IM E WORKERS COVERED BY PLANS SPECIFYING A MAXIMUM AMOUNT OFINSURANCE ------------------------------------------------------
SPEC IFIED MAXIMUM AMOUNT OF INSURANCE:18M E A N --------------------------------------------------MEDIAN -----------------------------------------------MIDDLE RANGE <50 PERCENT) --------------MIOOLE RANGE <80 PERCENT) --------------
AMOUNT OF INSURANCE IS BASED ON SOME OTHER TYPE OF p l a n :
PERCENT OF ALL FU LL-T IM E WORKERS 17---------------
3 3Digitized for FRASER http://fraser.stlouisfed.org/ Federal Reserve Bank of St. Louis
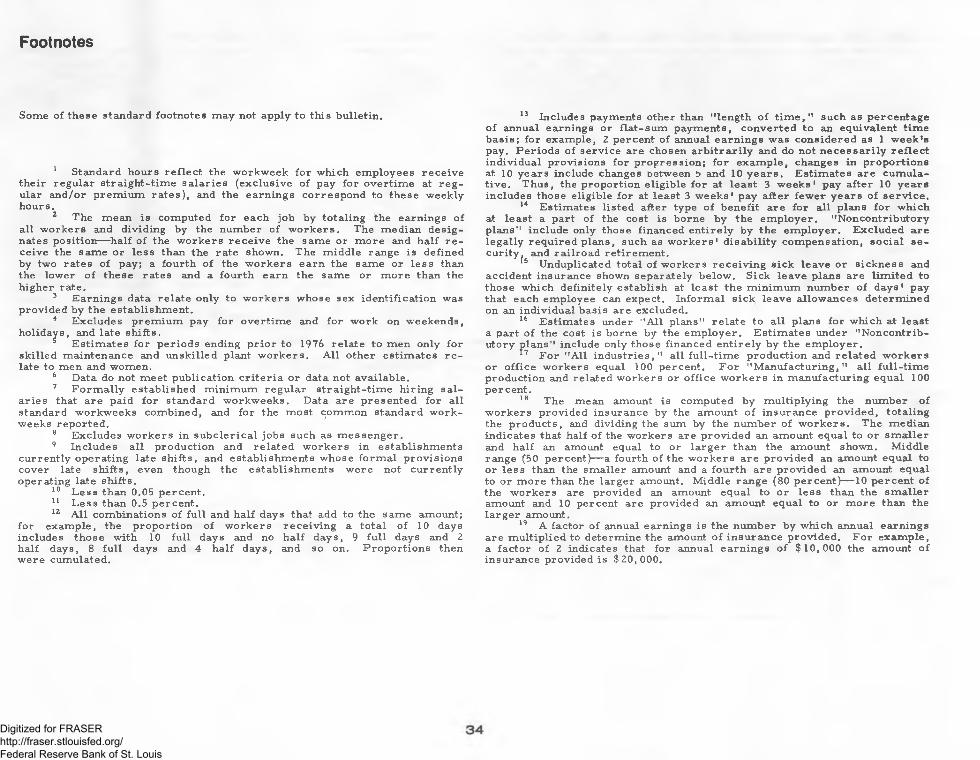
Footnotes
Some of these standard footnotes may not apply to this bulletin.
1 Standard hours reflect the workweek for which employees receive their regular straight-time salaries (exclusive of pay for overtime at regular and/or premium rates), and the earnings correspond to these weekly hours.
2 The mean is computed for each job by totaling the earnings of all workers and dividing by the number of workers. The median designates position— half of the workers receive the same or more and half re ceive the same or less than the rate shown. The middle range is defined by two rates of pay; a fourth of the workers earn the same or less than the lower of these rates and a fourth earn the same or more than the higher rate.
3 Earnings data relate only to workers whose sex identification was provided by the establishment.
4 Excludes premium pay for overtime and for work on weekends, holidays, and late shifts.
5 Estimates for periods ending prior to 1976 relate to men only for skilled maintenance and unskilled plant workers. All other estimates re late to men and women.
6 Data do not meet publication criteria or data not available.7 Formally established minimum regular straight-time hiring sal
aries that are paid for standard workweeks. Data are presented for all standard workweeks combined, and for the most common standard work-9 Jweeks reported.
8 Excludes workers in subclerical jobs such as messenger.9 Includes all production and related workers in establishments
currently operating late shifts, and establishments whose formal provisions cover late shifts, even though the establishments were not currently operating late shifts.
10 Less than 0.05 percent.11 Less than 0.5 percent.12 All combinations of full and half days that add to the same amount;
for example, the proportion of workers receiving a total of 10 days includes those with 10 full days and no half days, 9 full days and 2 half days, 8 full days and 4 half days, and so on. Proportions then were cumulated.
13 Includes payments other than "length of t im e ," such as percentage of annual earnings or flat-sum payments, converted to an equivalent time basis; for example, 2 percent of annual earnings was considered as 1 week's pay. Periods of service are chosen arbitrarily and do not necessarily reflect individual provisions for progression; for example, changes in proportions at 10 years include changes between 5 and 10 years. Estimates are cumulative. Thus, the proportion eligible for at least 3 weeks' pay after 10 years includes those eligible for at least 3 weeks' pay after fewer years of service.
14 Estimates listed after type of benefit are for all plans for which at least a part of the cost is borne by the employer. "Noncontributory plans" include only those financed entirely by the employer. Excluded are legally required plains, such as workers' disability compensation, social security, and railroad retirement.
15 Unduplicated total of workers receiving sick leave or sickness and accident insurance shown separately below. Sick leave plans are limited to those which definitely establish at least the minimum number of days' pay that each employee can expect. Informal sick leave allowances determined on an individual basis are excluded.
16 Estimates under "A ll plams" relate to all plams for which at least a part of the cost is borne by the employer. Estimates under "Noncontributory plans" include only those financed entirely by the employer.
37 For "A ll industries," all full-time production and related workers or office workers equal 100 percent. For "Manufacturing," all full-time production and related workers or office workers in manufacturing equal 100 percent.
18 The mean amount is computed by multiplying the number of workers provided insurance by the amount of insurance provided, totaling the products, and dividing the sum by the number of workers. The median indicates that half of the workers are provided an amount equal to or smaller and half an amount equal to or larger than the amount shown. Middle range (50 percent)— a fourth of the workers are provided an amount equ?d. to or less them the smaller amount and a fourth are provided an amount equal to or more them the larger amount. Middle range (80 percent)— 10 percent of the workers are provided an amount equal to or less than the smaller amount and 10 percent are provided an amount equal to or more than the larger amount.
19 A factor of annual earnings is the number by which annual earnings are multiplied to determine the amount of insurance provided. For example, a factor of 2 indicates that for annual earnings of $10 ,000 the amount of insurance provided is $20,000.
Digitized for FRASER http://fraser.stlouisfed.org/ Federal Reserve Bank of St. Louis
Appendix A.Scope and Method of Survey
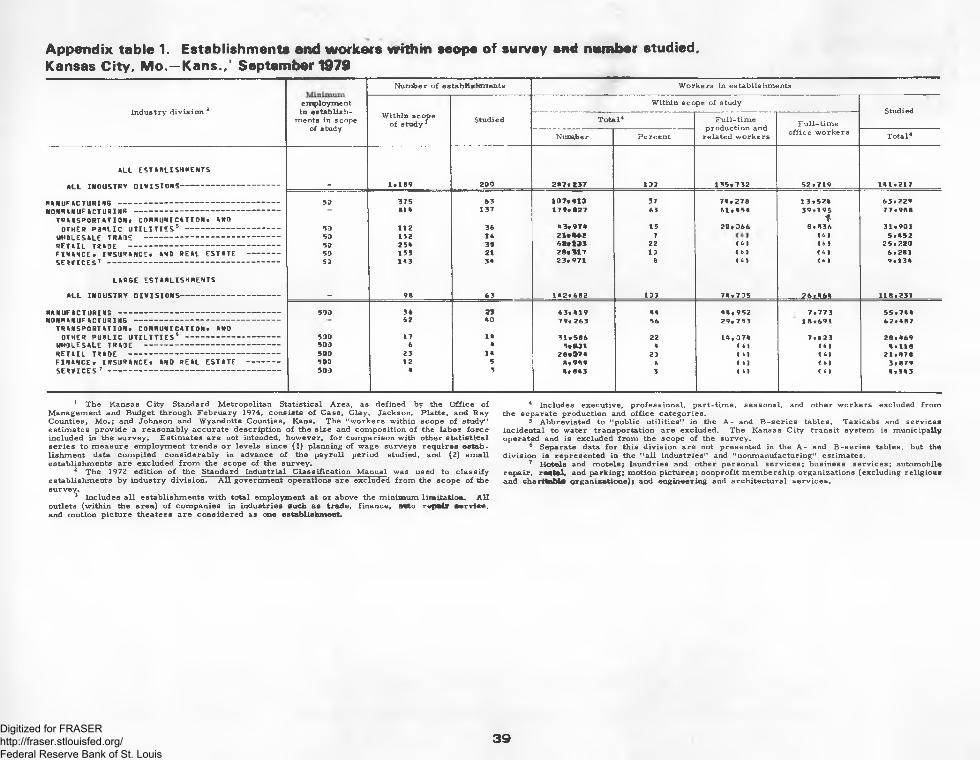
In each of the 72 1 areas currently surveyed, the Bureau obtains wages and related benefits data from representative establishments within six broad industry divisions: Manufacturing; transportation, communication,and other public utilities; wholesale trade; retail trade; finance, insurance, and real estate; and services. Government operations and the construction and extractive industries are excluded. Establishments having fewer than a prescribed number of workers are also excluded because of insufficient employment in the occupations studied. Appendix table 1 shows the number of establishments and workers estimated to be within the scope of this survey, as well as the number actually studied.
Bureau field representatives obtain data by personal visits at 3-year intervals. In each of the two intervening years, information on employment and occupational earnings only is collected by a combination of personal visit, mail questionnaire, and telephone interview from establishments participating in the previous survey.
A sample of the establishments in the scope of the survey is selected for study prior to each personal visit survey. This sample, less establishments which go out of business or are no longer within the industrial scope of the survey, is retained for the following two annual surveys. In most cases, establishments new to the area are not considered in the scope of the survey until the selection of a sample for a personal visit survey.
The sampling procedures involve detailed stratification of all establishments within the scope of an individual area survey by industry and number of employees. From this stratified universe a probability sample is selected, with each establishment having a predetermined chance of selection. To obtain optimum accuracy at minimum cost, a greater proportion of large than small establishments is selected. When data are combined, each establishment is weighted according to its probability of selection so that unbiased estimates are generated. For example, if one out of four establishments is selected, it is given a weight of 4 to represent itself plus three others. An alternate of the same original probability is chosen in the same industry-size classification if data are not available from the original sample member. If no suitable substitute is available, additional weight is assigned to a sample member that is similar to the m issing unit.
Included in the 72 areas are 2 studies conducted by the Bureau under contract. These areas are Akron, Ohio and Poughkeepsie-Kingston-Newburgh, N.Y. In addition, the Bureau conducts more limited area studies in approximately 100 areas at the request of the Employment Standards Administration of the U. S. Department of Labor.
Occupations and earningsOccupations selected for study are common to a variety of manufac
turing and nonmanufacturing industries, and are of the following types: (1)Office clerical; (2) professional and technical; (3) maintenance, toolroom, and powerplant; and (4) material movement and custodial. Occupational classification is based on a uniform set of job descriptions designed to take account of interestablishment variation in duties within the same job. Occupations selected for study are listed and described in appendix B.
Unless otherwise indicated, the earnings data following the job titles are for all industries combined. Earnings data for some of the occupations listed and described, or for some industry divisions within the scope of the survey, are not presented in the A -series tables because either (1) employment in the occupation is too small to provide enough data to merit presentation, or (2) there is possibility of disclosure of individual establishment data. Separate men's and women's earnings data are not presented when the number of workers not identified by sex is 20 percent or more of the men or women identified in an occupation. Earnings data not shown separately for industry divisions are included in data for all industries combined. Likewise, for occupations with more than one level, data are included in the overall classification when a subclassification is not shown or information to sub classify is not available.
Occupational employment and earnings data are shown for full-time workers, i .e ., those hired to work a regular weekly schedule. Earnings data exclude premium pay for overtime and for work on weekends, holidays, and late shifts. Nonproduction bonuses are excluded, but cost-of-living allowances and incentive bonuses are included. Weekly hours for office clerical and professional and technical occupations refer to the standard workweek (rounded to the nearest half hour) for which employees receive regular straight-time salaries (exclusive of pay for overtime at regular and/or premium rates). Average weekly earnings for these occupations are rounded to the nearest half dollar. Vertical lines within the distribution of workers on some A-tables indicate a change in the size of the class intervals.
These surveys measure the level of occupational earnings in an area at a particular time. Comparisons of individual occupational averages over time may not reflect expected wage changes. The averages for individual jobs are affected by changes in wages and employment patterns. For example, proportions of workers employed by high- or low-wage firms may change, or high-wage workers may advance to better jobs and be replaced by new workers at lower rates. Such shifts in employment could decrease an occupational average even though most establishments in an area increase wages during the year. Changes in earnings of occupational groups, shown in table A - 7, are better indicators of wage trends than are earnings changes for individual jobs within the groups.
Digitized for FRASER http://fraser.stlouisfed.org/ Federal Reserve Bank of St. Louis
Average earnings reflect composite, areawide estimates. Industries and establishments differ in pay level and job staffing, and thus contribute differently to the estimates for each job. Pay averages may fail to reflect accurately the wage differential among jobs in individual establishments.
Average pay levels for men and women in selected occupations should not be assumed to reflect differences in pay of the sexes within individual establishments. Factors which may contribute to differences include progression within established rate ranges (only the rates paid incumbents are collected) and performance of specific duties within the general survey job descriptions. Job descriptions used to classify employees in these surveys usually are more generalized than those used in individual establishments and allow for minor differences among establishments in specific duties performed.
Occupational employment estimates represent the total in all establishments within the scope of the study and not the number actually surveyed. Because occupational structures among establishments differ, estimates of occupational employment obtained from the sample of establishments studied serve only to indicate the relative importance of ,the jobs studied. These differences in occupational structure do not affect materially the accuracy of the earnings data.Wage trends for selected occupational groups
The percent increases presented in table A -7 are based on changes in average hourly earnings of men and women in establishments reporting the trend jobs in both the current and previous year (matched establishments). The data are adjusted to remove the effect on average earnings of employment shifts among establishments and turnover of establishments included in survey samples. The percent increases, however, are still affected by factors other than wage increases. Hirings, layoffs, and turnover may affect an establishment average for an occupation when workers are paid under plans providing a range of wage rates for individual jobs. In periods of increased hiring, for example, new employees may enter at the bottom of the range, depressing the average without a change in wage rates.
The percent changes relate to wage changes between the indicated dates. When the time span between surveys is other than 12 months, annual rates are also shown. (It is assumed that wages increase at a constant rate between surveys.)
trends are:Occupations used to compute wage Office clericalSecretaries Stenographers, senior Stenographers, general Typists, classes A and B File clerks, classes A ,
B, and C Messengers Switchboard operators Order clerks, classes
A and BAccounting clerks,
classes A and B Payroll clerks Key entry operators,
classes A and B
Electronic data processing 2Computer systems analysts,
classes A , B, and CComputer programmers,
classes A , B, and CIndustrial nursesRegistered industrial
2 The earnings of computer operators are not included in the wage trend computation for this group. A revised job description is being introduced in this survey which is not equivalent to the previous description.
Skilled maintenance— Continued
Unskilled plant
Mechanics (motor vehicle) Janitors, porters, andPipefitters cleanersTool and die makers Material handling laborersPercent changes for individual areas in the program are computed
as follows:1. Average earnings are computed for each occupation for
the 2 years being compared. The averages are derived from earnings in those establishments which are in the survey both years; it is assumed that employment remains unchanged.
2. Each occupation is assigned a weight based on its proportionate employment in the occupational group in the base year.
3. These weights are used to compute group averages.Each occupation's average earnings (computed in step 1) is multiplied by its weight. The products are totaled to obtain a group average.
4. The ratio of group averages for 2 consecutive years is computed by dividing the average for the current year by the average for the earlier year. The result— expressed as a percent— less 100 is the percent change.
For a more detailed description of the method used to compute these wage trends see "Improving Area Wage Survey Indexes," Monthly Labor Review, January 1973, pp. 52-57.Average pay relationships within establishments
Relative measures of occupational pay are presented in table A -8 for white-collar occupations and in table A -9 for blue-collar occupations. These relative values reflect differences in pay between occupations withirr individual establishments. Relative pay values are computed by dividing an establishment's average earnings for an occupation being compared by the average for another occupation (designated as 100) and multiplying the quotient by 100. For example, if janitors in a firm average $4 an hour and forklift operators $5, forklift operators have a relative pay value of 125 compared with janitors. ($5 -j- $4 = 1.25 x 100 = 125.) In combining the relatives of the individual establishments to arrive at an overall average, each establishment is considered to have as many relatives as it has weighted workers in the two jobs being compared.
Pay relationships based on overall averages may differ considerably because of the varying contribution of high- and low-wage establishments to the averages. For example, the overall average hourly earnings for forklift operators may be 50 percent more than the average for janitors because the average for forklift operators may be strongly influenced by earnings in high-wage establishments while the average for janitors may be strongly influenced by earnings in low-wage establishments. In such a case, the intra-establishment relationship will indicate a much smaller difference in earnings.Establishment practices and supplementary wage provisions
The incidence of selected establishment practices and supplementary wage provisions is studied for full-time production and related workers and office workers. Production and related workers (referred to hereafter as production workers) include working supervisors and all nonsupervisory
Digitized for FRASER http://fraser.stlouisfed.org/ Federal Reserve Bank of St. Louis
workers (including group leaders and trainees) engaged in fabricating, processing, assembling, inspection, receiving, storage, handling, packing, warehousing, shipping, maintenance, repair, janitorial and guard services, product development, auxiliary production for plant's own use (e .g ., powerplant), and recordkeeping and other services closely associated with the above production operations. (Cafeteria and route workers are excluded in manufacturing industries but included in nonmanufacturing industries.) In finance and insurance, no workers are considered to be production workers. Office workers include working supervisors and all non- supervisory workers (including lead workers and trainees) performing clerical or related office functions in such departments as accounting, advertising, purchasing, collection, credit, finance, legal, payroll, personnel, sales, industrial relations, public relations, executive, or transportation. .Administrative, executive, professional, and part-time employees as well as construction workers utilized as separate work forces are excluded from both the production and office worker categories.
Minimum entrance salaries (table B - l ) . Minimum entrance salaries for office workers relate only to the establishments visited. Because of the optimum sampling techniques used and the probability that large establishments are more likely than small establishments to have formal entrance rates above the subclerical level, the table is more representative of policies in medium and large establishments. (The "X 's " shown under standard weekly hours indicate that no meaningful totals are applicable.)
Shift differentials— manufacturing (table B -2). Data were collected on policies of manufacturing establishments regarding pay differentials for production workers on late shifts. Establishments considered as having policies are those which (1) have provisions in writing covering the operation of late shifts, or (2) have operated late shifts at any time during the 12 months preceding a survey. When establishments have several differentials which vary by job, the differential applying to the majority of the production workers is recorded. When establishments have differentials which apply only to certain hours of work, the differential applying to the majority of the shift hours is recorded.
For purposes of this study, a late shift is either a second (evening) shift which ends at or near midnight or a third (night) shift which starts at or near midnight.
Differentials for second and third shifts are summarized separately for (1) establishment policies (an establishment's differentials are weighted by all production workers in the establishment at the time of the survey) and (2) effective practices (an establishment's differentials are weighted by production workers employed on the specified shift at the time of the survey).
Scheduled weekly hours; paid holidays; paid vacations; and health, insurance] and pension plans. Provisions which apply to a majority of the production or office workers in an establishment are considered to apply to all production or office workers in the establishment; a practice or provision is considered nonexistent when it applies to less than a majority. Holidays; vacations; and health, insurance, and pension plans are considered applicable to employees currently eligible for the benefits as well as to employees who will eventually become eligible.
Scheduled weekly hours and days (table B -3). Scheduled weekly hours and days refer to the number of hours and days per week which fulltime first (day) shift workers are expected to work, whether paid for at straight-time or overtime rates.
Paid holidays (table B -4). Holidays are included if workers who are not required to work are paid for the time off and those required to work receive premium pay or compensatory time off. They are included only if they are granted annually on a formal basis (provided for in
written form or established by custom). Holidays are included even though in a particular year they fall on a nonworkday and employees are not granted another day off. Paid personal holiday plans, typically found in the automobile and related industries, are included as paid holidays.
Data are tabulated to show the percent of workers who (1) are granted specific numbers of whole and half holidays and (2) are granted specified amounts of total holiday time (whole and half holidays are aggregated).
Paid vacations (table B -5 ) . Establishments report their method of calculating vacation pay (time basis, percent of annual earnings, flat-sum payment, etc.) and the amount of vacation pay granted. Only basic formal plans are reported. Vacation bonuses, vacation-savings plans, and "extended" or "sabbatical" benefits beyond basic plans are excluded.
For tabulating vacation pay granted, all provisions are expressed on a time basis. Vacation pay calculated on other than a time basis is converted to its equivalent time period. Two percent of annual earnings, for example, is tabulated as 1 week's vacation pay.
Also, provisions after each specified length of service are related to all production or office workers in an establishment regardless of length of service. Vacation plans commonly provide for a larger amount of vacation pay as service lengthens. Counts of production or office workers by length of service were not obtained. The tabulations of vacation pay granted present, therefore, statistical measures of these provisions rather than proportions of workers actually receiving specific benefits.
Health, insurance, and pension plans (tables B -6 and B -7 ). Health, insurance, and pension plans include plans for which the employer pays either all or part of the cost. The cost may be (1) underwritten by a commercial insurance company or nonprofit organization, (2) covered by a union fund to which the employer has contributed, or (3) borne directly by the employer out of operating funds or a fund set aside to cover the cost. A plan is included even though a majority of the employees in an establishment do not choose to participate in it because they are required to bear part of its cost (provided the choice to participate is available or will eventually become available to a majority). Legally required plans such as social security, railroad retirement, workers' disability compensation, and temporary disability insurance 3 are excluded.
3 Temporary disability insurance which provides benefits to covered workers disabled by injury or illness which is not work-connected is mandatory under State laws in California, New Jersey, New York, and Rhode Island. Establishment plans which meet only the legal requirements are excluded from these data, but those under which (1) employers contribute more than is legally required or (2) benefits exceed those specified in the State law are included. In Rhode Island, benefits are paid out of a State fund to which only employees contribute. In each of the other three States, benefits are paid either from a State fund or through a private plan.
State fund financing; In California, only employees contribute to the State fund; in New Jersey, employees and employers contribute; in New York, employees contribute up to a specified maximum and employers pay the difference between the employees' share and the total contribution required.
Private plan financing: In California and New Jersey, employees cannot be required to contributemore than they would if they were covered by the State fund; in New York, employees can agree to contribute more if the State rules that the additional contribution is commensurate with the benefit provided.
Federal legislation ( Railroad Unemployment Insurance Act) provides temporary disability insurance benefits to railroad worker* for illness or injury, whether work-connected or not. The legislation requires that employers bear ih o e n tire c o s t o f th e In su ra n ce .
Digitized for FRASER http://fraser.stlouisfed.org/ Federal Reserve Bank of St. Louis
Life insurance includes formal plans providing indemnity (usually through an insurance policy) in case of death of the covered worker. Information is also provided in table B -7 on types of life insurance plans and the amount of coverage ip all industries combined and in manufacturing.
Accidental death and dismemberment insurance is limited to plans which provide benefit payments in case of death or loss of limb or sight as a direct result of an accident.
Sickness and accident insurance includes only those plans which provide that predetermined cash payments be made directly to employees who lose time from work because of illness or injury, e .g ., $ 50 a week for up to 26 weeks of disability.
Sick leave plans are limited to formal plans4 which provide for continuing an employee's pay during absence from work because of illness. Data collected distinguish between (1) plans which provide full pay with no waiting period, and (2) plans which either provide partial pay or require a waiting period.
Long-term disability insurance plans provide payments to totally disabled employees upon the expiration of their paid sick leave and/or sickness and accident insurance, or after a predetermined period of disability (typically 6 months). Payments are made until the end of the disability, a maximum age, or eligibility for retirement benefits. Full or partial payments are almost always reduced by social security, workers' disability compensation, and private pension benefits payable to the disabled employee.
Hospitalization, surgical, and medical insurance plans reported in these surveys provide full or partial payment for basic services rendered. Hospitalization insurance covers hospital room and board and may cover other hospital expenses. Surgical insurance covers surgeons' fees. Medical insurance covers doctors* fees for home, office, or hospital calls. Plans restricted to post-operative medical care or a doctor's care for minor ailments at a worker's place of employment are not considered to be medical insurance.
Major medical insurance coverage applies to services which go beyond the basic services covered under hospitalization, surgical, and medical insurance. Major medical insurance typically (1) requires that a "deductible" (e .g ., $50) be met before benefits begin, (2) has a coinsurance feature that requires the insured to pay a portion (e.g., 20 percent) of certain expenses, and (3) has a specified dollar maximum of benefits (e.g ., $ 10, 000 a year).
Dental insurance plans provide normal dental service benefits, usually for fillings, extractions, and X -ra ys. Plans which provide benefits only for oral surgery or repairing accident damage are not reported.
Retirement pension plans provide for regular payments to the retiree for life. Included are deferred profit-sharing plans which provide the option of purchasing a lifetime annuity.
4 An establishment is considered as having a formal plan if it specifies at least the minimum number of days of sick leave available to each employee. Such a plan need not be written, but informal sick leave allowances determined on an individual basis are excluded.
Labor-management agreement coverage
The following tabulation shows the percent of full-tim e production and office workers employed in establishments in the Kansas City area in which a union contract or contracts covered a majority of the workers in the respective categories, September 1979:
Production andrelated workers Office workers
All industries____________ 66Manufacturing_________ 77Nonmanufacturing____ 52
Public utilities____ 95
162
2069
An establishment is considered to have a contract covering all production or office workers if a majority of such workers is covered by a labor-management agreement. Therefore, all other production or office workers are employed in establishments that either do not have labor- management contracts in effect, or have contracts that apply to fewer than half of their production or office workers. Estimates are not necessarily representative of the extent to which all workers in the area may be covered by the provisions of labor-management agreements, because small establishments are excluded and the industrial scope of the survey is limited.
Industrial composition in manufacturing
One-third of the workers within the scope of the survey in the Kansas City area were employed in manufacturing firm s. The following presents the major industries as a percent of all manufacturing:
Electric and electronic equipment______________________________________ 16Electronic components and acce ssories_____________________________7Communication equipment____________________________________________ 6
Transportation equipment_______________________________________________ 15Motor vehicles and equipment_______________________________________15
Printing and publishing _________________________________________________ 11Greeting card publishing_______________________________________________6
Food and kindred products________________________________________________9Fabricated metal products________________________________________________8Chemicals and allied products___________________________________________ 7Machinery, except electrical____________________________________________ 7Primary metal industries________________________________________________ 6
This information is based on estimates of total employment derived from universe materials compiled before actual survey. Proportions in various industry divisions may differ from proportions based on the results of the survey as shown in appendix table 1.
Digitized for FRASER http://fraser.stlouisfed.org/ Federal Reserve Bank of St. Louis
Appendix table 1. Establishments and workers within scope of survey and number studied, Kansas City, M o.—Kans.,1 2 September 1979
Num ber o f estab lishm ents W o rke rs in estab lishm ents
Ind ustry d iv is io n 2em ploym ent in e s tab lish
ments in scope of study
W ith in scope of studyStudied
W ith in scope o f s tudy 3
Studied T o ta l4 F u l l - tim e production and
re la ted w o rke rs
F u ll- t im e
Num ber P e rc e n t o ffic e w o rke rs T o ta l4
ALL ESTABLISHPENTS
a l l in o u s t r y d i v i s i o n s --------------------------------- - 1 .189 230 247 .237 133 135 .732 52 .719 141.217
OTHER PUBLIC U T I L I T I E S 5 -------------------------------- 53 112 36 4 3 s974 15 2D, 366 8 ,836 31.901
w h o l e s a l e t r a d e --------------------------------------------- 53 152 16 219*62 7 <6 | 5 .452RETAIL TRADE -------------------------------------------------- 53 25A 30 629133 22 <6| <6| 25 .220FINAN CE . INSURANCE. ANO REAL ESTATE ----------- 53 153 21 289*17 13 < 6 | <61 6,281SERVICES7 ---------------------------------------------------------- S3 1A3 3A 23. 971 8 <61 (61 9*134
LARSE ESTABLISHNENTS
ALL INDUSTRY D IV IS IO N S--------------------------------- - 98 63 142 .682 133 74,735 26,464 118.231
1 The Kan sas C it y S tandard M e trop o lita n S ta t is t ic a l A re a , as defined by the O ffic e of M anagem ent and Budget th rough F e b ru a ry 1974, con s is ts o f C ass, C lay , Jackson, P la tte , and Ray Counties , M o .; and Johnson and W yandotte Counties, Kans. The "w o rk e rs w ith in scope o f study" e s tim ates p ro v id e a rea son ab ly a ccu ra te d e sc r ip t io n o f the s ize and com pos ition o f the la b o r fo rc e in c luded in the survey. E s t im a te s a re not intended, however, fo r com par ison w ith o ther s ta t is t ic a l s e r ie s to m easu re em p loym ent trends o r le ve ls s in ce (1) planning of wage surveys re q u ire s e s tab lish m en t data co m p ile d co n s id e ra b ly in advance of the p a y ro ll p e r io d studied, and (2) sm a ll e s tab lish m ents a re exc luded f r o m the scope of the survey.
2 The 1972 ed it io n o f the Standard Ind ustr ia l C la s s if ic a t io n M an ua l was used to c la s s ify e stab lish m ents by in d u s try d iv is io n . A l l governm ent operations a re excluded fro m the scope o f the survey.
3 Includes a l l e s tab lish m en ts w ith to ta l em ploym ent a t o r above the m in im um lim ita t io n . A l loutlets (w ith in the area) o f com pan ies in in d u s tr ie s Buch as trade, finance , M to repair service,and m o tion p ic tu re th ea te rs a re con s id e red as one establishment.
4 Includes executive, p ro fe s s io n a l, pa rt- t im e , seasonal, and o ther w o rke rs excluded fro m the separate p roduction and o ffic e ca tego rie s .
5 Ab b rev ia ted to "p u b lic u t i l it ie s " in the A - and B - s e r ie s tab les. Tax icab s and se rv ice s in c id en ta l to w a te r tran spo rta tion a re excluded. The Kansas C ity t r a n s it system is m u n ic ip a lly operated and is excluded fro m the scope o f the survey.
6 Separate data fo r th is d iv is io n a re not presen ted in the A - and B - s e r ie s tab les, but the d iv is io n is rep resen ted in the " a l l in d u s tr ie s " and "nonm anufactu ring " estim ates.
7 H o te ls and m ote ls; la u n d r ie s and o ther p e rson a l se rv ice s ; bu s iness se rv ice s; autom obile re p a ir , reqCal. and park ing; m otion p ic tu re s ; nonp ro fit m em be rsh ip o rg an iza tion s (exclud ing re lig io u s and ch a r ita b le o rgan iza tions); and eng inee ring and a r ch ite c tu ra l s e rv ic e s .
39Digitized for FRASER http://fraser.stlouisfed.org/ Federal Reserve Bank of St. Louis
Appendix B.OccupationalDescriptions
The primary purpose of preparing job descriptions for the Bureau's wage surveys is to assist its field representatives in classifying into appropriate occupations workers who are employed under a variety of payroll titles and different work arrangements from establishment to establishment and from a r e a to area. This permits grouping occupational wage rates representing comparable job content. Because of this emphasis on interestablishment and interarea comparability of occupational content, the Bureau's job descriptions may differ significantly from those in use in individual establishments or those pre- pared for other purposes. In applying these job descriptions, the Bureau's field representatives are instructed to exclude working supervisors; apprentices; and part-tim e, temporary, and probationary workers. Handicapped workers whose earnings are reduced because of their handicap are also excluded. Learners, beginners, and trainees, unless specifically included in the job description, are excluded.
OfficeSECRETARY
Assigned as a personal secretary, normally to one individual. Maintains a close and highly responsive relationship to the day-to-day activities of the supervisor. Works fairly independently receiving a minimum of detailed supervision and guidance. Performs varied clerical and secretarial duties requiring a knowledge of office routine and understanding of the organization, programs, and procedures related to the work of the supervisor.
Exclusions. Not all positions that are titled "secretary" possess the above characteristics. Examples of positions which are excluded from the definition are as follows:
SECRET ARY— Continued Exclusions— Continued
a. Positions which do not meet the "personal" secretary concept described above;
b. Stenographers not fully trained in secretarial-type duties;c. Stenographers serving as office assistants to a group of pro
fessional, technical, or managerial persons;d. Assistant-type positions which entail more difficult or more re
sponsible technical, administrative, or supervisory duties which are not typical of secretarial work, e .g ., Administrative A ssistant, or Executive Assistant;
in thisListed below are several occupations for which revised descriptions or titles are being introduced
(previously surveyed as shipping and receiving clerk)
GuardThe Bureau has discontinued collecting data for tabulating-machine operator, bookkeeping-machine
operator, and machine biller. Workers previously classified as watchmen are now classified as guards under the revised description.
40Digitized for FRASER http://fraser.stlouisfed.org/ Federal Reserve Bank of St. Louis
SE CRE TARY — Continued
Exclusions— Continuede. Positions which do not fit any of the situations listed ia the
sections below titled ''Level of Supervisor," e .g ., secretary to the president of a company that employs, in all, over 5 ,000 persons;
f. Trainees.
Classification by Level
Secretary jobs which meet the required characteristics are matched at one of five levels according to (a) the level of the secretary's supervisor within the company's organizational structure and, (b) the level of the secretary's responsibility. The tabulation following the explanations of those two factors indicates the level of the secretary for each combination of the factors.
Level of Secretary's Supervisor (LS)
LS—1 a. Secretary to the supervisor or head of a small organizational unit (e .g ., fewer than about 25 or 30 persons); or
b. Secretary to a nonsupervisory staff specialist, professional employee, administrative officer or assistant, skilled technician or expert. (NOTE: M a n y companies assign stenographers,rather than secretaries as described above, to this level of supervisory or nonsupervisory worker.)
LS—2 a. Secretary to an executive or managerial person whose responsibility is not equivalent to one of the specific level situations in the definition for LS—3, but whose organizational unit normally numbers at least several dozen employees and is usually divided into organizational segments which are often, in turn, further subdivided. In some companies, this level includes a wide range of organizational echelons; in others, only one or two; or
b. Secretary to the head of an individual plant, factory, etc., (or other equivalent level of official) that employs, in all, fewer than 5 ,000 persons.
LS—3 a. Secretary to the chairman of the board or president of a companythat employs, in all, fewer than 100 persons; or
c. Secretary to the head (immediately below the officer level) over either a major corporatewide functional activity (e .g ., marketing, research, operations, industrial relations, etc.) or a major geographic or organizational segment (e.g., a regional head^oar** ters; a major division) of a company that employs, in all, over 5 ,000 but fewer than 25,000 employees; or
d. Secretary to the head of an individual plant, factory, etc., (or other equivalent level of official) that employs, in alt, over 5 ,000 persons; or
e. Secretary to the head of a large and important organizational segment (e .g ., a middle management supervisor of an organizational
SECRETARY—Continued
Classification by L e v e l— Continued
segment often involving as many as several hundred persons) of a company that employs, in all, over 25, 000 persons.
LS—4 a. Secretary to the chairman of the board or president of a companythat employs, in all, over 100 but fewer than 5, 000 persons; or
b. Secretary to a corporate officer (other than the chairman of the board or president) of a company that employs, in all, over 5,000 but fewer than 25,000 persons; or
c. Secretary to the head, immediately below the corporate officer level, of a major segment or subsidiary of a company that employs, in all, over 25,000 persons.
NOTE: The term "corporate officer" used in the above LS definition refers to those officials who have a significant corporatewide policy- making role with regard to major company activities. The title "vice president," though normally indicative of this role, does not in all cases identify such positions. Vice presidents whose primary responsibility is to act personally on individual cases or transactions (e .g ., approve or deny individual loan or credit actions; administer individual trust accounts; directly supervise a clerical staff) are not considered to be "corporate officers" for purposes of applying the definition.
Level of Secretary's Responsibility (LR)
This factor evaluates the nature of the work relationship between the secretary and the supervisor, and the extent to which the secretary is expected to exercise initiative and judgment. Secretaries should be matched at LR—1 or LR—2 described below according to their level of responsibility.
LR—1. Performs varied secretarial duties including or comparable to most of the following:
a. Answers telephones, greets personal callers, and opens incoming mail.
b. Answers telephone requests which have standard answers. May reply to requests by sending a form letter.
c. Reviews correspondence, memoranda, and reports prepared by others for the supervisor's signature to ensure procedural and typographical accuracy.
d. Maintains supervisor's calendar and makes appointments as instructed.
e. Types, takes and transcribes dictation, and files.
Digitized for FRASER http://fraser.stlouisfed.org/ Federal Reserve Bank of St. Louis
SECRETARY— Continued
LR—2. Performs duties described under LR—1 u d , in addition per- forms tasks requiring greater judgment, initiative, and knowledge of office functions including or comparable to most of the following:
a. Screens telephone and personal callers, determining which can be handled by the supervisor's subordinates or other offices.
b. Answers requests which require a detailed knowledge of office procedures or collection of information from files or other offices. May sign routine correspondence in own or supervisor's name.
c. Compiles or assists in compiling periodic reports on the basis of general instructions.
d. Schedules tentative appointments without prior clearance. A ssembles necessary background material for scheduled meetings. Makes arrangements for meetings and conferences.
e. Explains supervisor's requirements to other employees in supervisor's unit. (Also types, takes dictation, and files.)
The following tabulation shows the level of the secretary for each LS and LR combination:
Level of secretary's _____ supervisor_____ Level of secretary's responsibility
LR—1 LR-2
LS—1___ ___________________________________ Class ELS—2______________________________________ Class DLS—3„_______________ _______________ _____ Class CLS—4______________________________________ Clas s B
Class D Class C Class B Class A
STENOGRAPHER
Primary duty is to take dictation using shorthand, and to transcribe the dictation. May also type from written copy. May operate from a stenographic pool. May occasionally transcribe from voice recordings (if primary duty is transcribing from recordings, see Tran scribing-Machine Typist).
NOTE: This job is distinguished from that of a secretary in that asecretary normally works in a confidential relationship with only one manager or executive and performs more responsible and discretionary tasks as described in the secretary job definition.
Stenographer, Senior. Dictation involves a varied technical or specialized vocabulary such as in legal briefs or reports on scientific research. May also set up and maintain files, keep records, etc.
dependence and responsibility than stenographer, general, as evidenced by the following: Work requires a high degree of stenographic speed andaccuracy; a thorough working knowledge of general business and office procedure; and of the specific business operations, organization, policies, procedures, files, workflow, etc. Uses this knowledge in performing stenographic duties and responsible clerical tasks such as maintaining followup files; assembling material for reports, memoranda, and letters; composing simple letters from general instructions; reading and routing incoming mail; and answering routine questions, etc.
Stenographer . General. Dictation involves a normal routine vocabulary. May maintain files, keep simple records, or perform other relatively routine clerical tasks.
TRANSCRIBING-MACHINE TYPIST
Primary duty is to type copy of voice recorded dictation which does not involve varied technical or specialized vocabulary such as that used in legal briefs or reports on scientific research. May also type from written copy. May maintain files, keep simple records, or perform other relatively routine clerical tasks. (See Stenographer definition for workers involved with shorthand dictation.)
TYPIST
Uses a typewriter to make copies of various materials or to make out bills after calculations have been made by another person. May include typing of stencils, mats, or similar materials for use in duplicating processes. May do clerical work involving little special training, such as keeping simple records, filing records and reports, or sorting and distributing incoming mail.
Class A . Performs one or more of the following: Typing materialin final form when it involves combining material from several sources; or responsibility for correct s-pelling, syllabication, punctuation, etc., of technical or unusual words or foreign language material; or planning layout and typing of complicated statistical tables to maintain uniformity and balance in spacing. May type routine form letters, varying details to suit circumstances.
Class B . Performs one or more of the following: Copy typing fromrough or clear drafts; or routine typing of form s, insurance policies, etc.; or setting up simple standard tabulations; or copying more complex tables already set up and spaced properly.
FILE CLERK
Files, classifies, and retrieves material in an established filing system. May perform clerical and manual tasks required to maintain files. Positions are classified into levels on the basis of the following definitions.
Digitized for FRASER http://fraser.stlouisfed.org/ Federal Reserve Bank of St. Louis
FILE CLERK— Continued
Class A . Classifies and indexes file material such as correspondence, reports, technical documents, etc,, in an established filing system containing a number of varied subject matter files. May also file this material. May keep records of various types in conjunction with the files. May lead a small group of lower level file clerks.
Class B . Sorts, codes, and files unclassified material by simple (subject matter) headings or partly classified material by finer subheadings. Prepares simple related index and cross-reference aids. As requested, locates clearly identified material in files and forwards material. May perform related clerical tasks required to maintain and service files.
Class C . Performs routine filing of material that has already been classified or which is easily classified in a simple serial classification system (e .g ., alphabetical, chronological, or numerical). As requested, locates readily available material in files and forwards material; and may fill out withdrawal charge. May perform simple clerical and manual tasks required to maintain and service files.
MESSENGER
Perform s various routine duties such as running errands, operating minor office machines such as sealers or m ailers, opening and distributing m ail, and other minor clerical work. Exclude positions that require operation of a motor vehicle as a significant duty.
SWITCHBOARD OPERATOR
Operates a telephone switchboard or console used with a private branch exchange (PBX) system to relay incoming, outgoing, and intrasystem calls. May provide information to callers, record and transmit m essages, keep record of calls placed and toll charges. Besides operating a telephone switchboard or console, may also type or perform routine clerical work (typing or routine clerical work may occupy the major portion of the worker's tim e, and is usually performed while at the switchboard or console). Chief or lead operators in establishments employing more than one operator are excluded. For an operator who also acts as a receptionist, see Switchboard Ope r ato r - Re ceptioni st.
SWITCHBOARD OPERATOR-RECEPTIONIST
At a single-position telephone switchboard or console, acts both as am operator— see Switchboard Operator— and as a receptionist. Receptionist's work involves such duties as greeting visitors; determining nature of visitor's business amd providing approp.iate information; referring visitor to appropriate person in the organization or contacting that person by telephone amd arramging am appointment; keeping a log of visitors.
ORDER CLERK
Receives written or verbal customers' purchase orders for material or merchandise from customers or sales people. Work typically involves some combination of the following duties: Quoting prices; determining availability of ordered items amd suggesting substitutes when necessary; advising expected delivery date and method of delivery; recording order and customer information on order sheets; checking order sheets for accuracy and
ORDER CLERK— Continued
adequacy of information recorded; ascertaining credit rating of customer; furnishing customer with acknowledgement of receipt of order; following-up to see that order is delivered by the specified date or to let customer know of a delay in delivery; maintaining order file; checking shipping invoice against original order.
Exclude workers paid on a commission basis or whose duties include any of the following: Receiving orders for services rather than for materialor merchandise; providing customers with consultative advice using knowledge gained from engineering or extensive technical training; emphasizing selling skills; handling material or merchandise as an integral part of the job.
Positions are classified into levels according to the following definitions:
Class A . Handles orders that involve making judgments such as choosing which specific product or material from the establishment's product lines will satisfy the customer's needs, or determining the price to be quoted when pricing involves more than merely referring to a price list or making some simple mathematical calculations.
Class B . Handles orders involving items which have readily identified uses and applications. May refer to a catalog, manufacturer's manual, or similar document to insure that proper item is supplied or to verify price of ordered item.
ACCOUNTING CLERK
Performs one or more accounting clerical tasks such as posting to registers and ledgers; reconciling bank accounts; verifying the internal consistency, completeness, and mathematical accuracy of accounting documents; assigning prescribed accounting distribution codes; examining and verifying for clerical accuracy various types of reports, lists, calculations, posting, etc.; or preparing simple or assisting in preparing more complicated journal vouchers. May work in either a manual or automated accounting system.
The work requires a knowledge of clerical methods and office practices and procedures which relates to the clerical processing and recording of transactions and accounting information. With experience, the worker typically becomes familiar with the bookkeeping and accounting terms and procedures used in the assigned work, but is not required to have a knowledge of the formal principles of bookkeeping and accounting.
Positions are classified into levels on the basis of the following definitions:
Class A . Under general supervision, performs accounting clerical operations which require the application of experience and judgment, for example, clerically processing complicated or nonrepetitive accounting transactions, selecting among a substantial variety of prescribed accounting codes and classifications, or tracing transactions through previous accounting actions to determine source of discrepancies. May be assisted by one or more class B accounting clerks.
Class B . Under close supervision, following detailed instructions and standardized procedures, performs one or more routine accounting clerical operations, such as posting to ledgers, cards, or worksheets
Digitized for FRASER http://fraser.stlouisfed.org/ Federal Reserve Bank of St. Louis
ACCOUNTING CLERK— Continuedwhere identification of items and locations of postings are clearly indicated; checking accuracy and completeness of standardized and repetitive records or accounting documents; and coding documents using a few prescribed accounting codes.PAYROLL CLERK
Performs the clerical tasks necessary to process payrolls and to maintain payroll records. Work involves most of the following: Processingworkers' time or production records; adjusting workers' records for changes in wage rates, supplementary benefits, or tax deductions; editing payroll listings against source records; tracing and correcting errors in listings; and assisting in preparation of periodic summary payroll reports. In a non- automated payroll system, computes wages. Work may require a practical knowledge of governmental regulations, company payroll policy, or the computer system for processing payrolls.KEY ENTRY OPERATOR
Operates keyboard-controlled data entry device such as keypunch machine or key-operated magnetic tape or disk encoder to transcribe data into a form suitable for computer processing. Work requires skill in operating an alphanumeric keyboard and an understanding of transcribing procedures and relevant data entry equipment.
Positions are classified into levels on the basis of the following definitions:
Class A . Work requires the application of experience and judgment in selecting procedures to be followed and in searching for, interpreting, selecting, or coding items to be entered from a variety of source documents. On occasion may also perform routine work as described for class B.
NOTE: Excluded are operators above class A using the key entry controls to access, read, and evaluate the substance of specific records to take substantive actions, or to make entries requiring a similar level of knowledge.
Class B. Work is routine and repetitive. Under close supervision or following specific procedures or detailed instructions, works from various standardized source documents which have been coded and require little or no selecting, coding, or interpreting of data to be entered. Refers to supervisor problems arising from erroneous items, codes, or missing information.
Professional and TechnicalCOMPUTER SYSTEMS ANALYST, BUSINESS
Analyzes business problems to formulate procedures for solving them by use of electronic data processing equipment. Develops a complete description of all specifications needed to enable programmers to prepare required digital computer programs. Work involves most of the following: Analyzes subject-matter operations to be automated and identifies conditions and criteria required to achieve satisfactory results; specifies number and types of records, files, and documents to be used; outlines actions to be performed by personnel and computers in sufficient detail for presentation to management and for programming (typically this involves preparation of work and data flow charts); coordinates the development of test problems and participates in trial runs of new and revised system s; and recommends equipment changes to obtain more effective overall operations. (NOTE: Workers performing both systems analysis and programming should be classified as systems analysts if this is the skill used to determine their pay.)
COM PUTER SYSTEMS ANALYST, BUSINESS— Continued
Does not include employees primarily responsible for the management or supervision of other electronic data processing employees, or systems analysts primarily concerned with scientific or engineering problems.
For wage study purposes, systems analysts are classified as follows:
Class A . Works independently or under only general direction on complex problems involving all phases of systems analysis. Problems are complex because of diverse sources of input data and multiple-use requirements of output data. (For example, develops an integrated production scheduling, inventory control, cost analysis, and sales analysis record in which every item of each type is automatically processed through the full system of records and appropriate followup actions are initiated by the computer.) Confers with persons concerned to determine the data processing problems and advises subject-matter personnel on the implications of new or revised systems of data processing operations. Makes recommendations, if needed, for approval of major systems installations or changes and for obtaining equipment.
May provide functional direction to lower level systems analysts who are assigned to assist.
Class B . Works independently or under only general direction on problems that are relatively uncomplicated to analyze, plan, program, and operate. Problems are of limited complexity because sources of input data are homogeneous and the output data are closely related. (For example, develops systems for maintaining depositor accounts in a bank, maintaining accounts receivable in a retail establishment, or maintaining inventory accounts in a manufacturing or wholesale establishment.) Confers with persons concerned to determine the data processing problems and advises subject-matter personnel on the implications of the data processing systems to be applied.
OR
Works on a segment of a complex data processing scheme or system, as described for class A. Works independently on routine assignments and receives instruction and guidance on complex assignments. Work is reviewed for accuracy of judgment, compliance with instructions, and to insure proper alignment with the overall system.
Class C. Works under immediate supervision, carrying out analyses as assigned, usually of a single activity. Assignments are designed to develop and expand practical experience in the application of procedures and skills required for systems analysis work. For example, may assist a higher level systems analyst by preparing the detailed specifications required by programmers from information developed by the higher level analyst.
COMPUTER PROGRAMMER, BUSINESS
Converts statements of business problems, typically prepared by a systems analyst, into a sequence of detailed instructions which are required to solve the problems by automatic data processing equipment. Working from charts or diagrams, the programmer develops the precise instructions which, when entered into the computer system in coded
44Digitized for FRASER http://fraser.stlouisfed.org/ Federal Reserve Bank of St. Louis
COM PUTER PRO G RAM M ER, BUSINESS— Continued
language, cause the manipulation of data to achieve desired results. Work involves most of the following: Applies knowledge of computer capabilities, mathematics, logic employed by computers, and particular subject matter involved to analyze charts and diagrams of the problem to be programmed; develops sequence of program steps; writes detailed flow charts to show order in which data will be processed; converts these charts to coded instructions for machine to follow; tests and corrects programs; prepares instructions for operating personnel during production run; analyzes, reviews, and alters programs to increase operating efficiency or adapt to new requirements; maintains records of program development and revisions. (NOTE: Workers performing both systems analysis and programming should be classified as systems analysts if this is the skill used to determine their pay.)
Does not include employees primarily responsible for the management or supervision of other electronic data processing employees, or programmers primarily concerned with scientific and/or engineering problems.
For wage study purposes, programmers are classified as follows:
Class A . Works independently or under only general direction on complex problems which require competence in all phases of programming concepts and practices. Working from diagrams and charts which identify the nature of desired results/ major processing steps to be accomplished, and the relationships between various steps of the problem solving routine; plans the full range of programming actions needed to efficiently utilize the computer system in achieving desired end products.
At this level, programming is difficult because computer equipment must be organized to produce several interrelated but diverse products from numerous and diverse data elements. A wide variety and extensive number of internal processing actions must occur. This requires such actions as development of common operations which can be reused, establishment of linkage points between operations, adjustments to data when program requirements exceed computer storage capacity, and substantial manipulation and resequencing of data elements to form a highly integrated program.
May provide functional direction to lower level programmers who are assigned to assist.
Class B . Works independently or under only general direction on relatively simple programs, or on simple segments of complex programs. Programs (or segments) usually process information to produce data in two or three varied sequences or formats. Reports and listings are produced by refining, adapting, arraying, or making minor additions to or deletions from input data which are readily available. While numerous records may be processed, the data have been refined in prior actions so that the accuracy and sequencing of data can be tested by using a few routine checks. Typically, the program deals with routine recordkeeping operations.
ORWorks on complex programs (as described for class A) under
close direction of a higher level programmer or supervisor. May assist higher level programmer by independently performing less difficult tasks assigned, and performing more difficult tasks under fairly close direction.
COM PUTER PROGRAM M ER, BUSINESS— Continued
May guide or instruct lower level programmers.Class C . Makes practical applications of programming practices
and concepts usually learned in formal training courses. Assignments are designed to develop competence in the application of standard procedures to routine problems. Receives close supervision on new aspects of assignments; and work is reviewed to verify its accuracy and conformance with required procedures.
COMPUTER OPERATORIn accordance with operating instructions, monitors and operates
the control console of a digital computer to process data. Executes runs by either serial processing (processes one program at a time) or multiprocessing (processes two or more programs simultaneously). The following duties characterize the work of a computer operator:
- Studies operating instructions to determine equipment setup needed.
- Switches necessary auxilliary equipment into system.
- Starts and operates computer.- Responds to operating and computer output instructions.- Reviews error messages and makes corrections during operation
or refers problems.- Maintains operating record.
May test-run new or modified programs. May assist in modifying systems or programs. The scope of this definition includes trainees working to become fully qualified computer operators, fully qualified computer operators, and lead operators providing technical assistance to lower level operators. It excludes workers who monitor and operate remote terminals.
Class A. In addition to work assignments described for a class B operator (see below) the work of a class A operator involves at least one of the following:
- Deviates from standard procedures to avoid the loss of information or to conserve computer time even though the procedures applied materially alter the computer unit's production plans.
- Tests new programs, applications, and procedures.- Advises programmers and subject-matter experts on se tu p
techniques.- Assists in (1) maintaining, modifying, and developing operating
systems or programs; (2) developing operating instructions and techniques to cover problem situations; and/or (3) switching to emergency backup procedures (such assistance requires a working knowledge of program language, computer features, and software system s).
An operator at this level typically guides lower level operators.
45Digitized for FRASER http://fraser.stlouisfed.org/ Federal Reserve Bank of St. Louis
COM PUTER O PERA TO R— Continued
Class B . In addition to established production runs, work assignments include runs involving new programs, applications, and procedures (i.e ., situations which require the operator to adapt to a variety of problems). At this level, the operator has the training and experience to work fairly independently in carrying out most assignments. Assignments may require the operator to select from a variety of standard setup and operating procedures. In responding to computer output instructions or error conditions, applies standard operating or corrective procedures, but may deviate from standard procedures when standard procedures fail if deviation does not materially alter the computer unit's production plans. Refers the problem or aborts the program when procedures applied do not provide a solution. May guide lower level operators.
Class C. Work assignments are limited to established production runs (i.e ., programs which present few operating problems). Assignments may consist primarily of on-the-job training (sometimes augmented by classroom instruction). When learning to run programs, the supervisor or a higher level operator provides detailed written or oral guidance to the operator before and during the run. After the operator has gained experience with a program, however, the operator works fairly independently in applying standard operating or corrective . procedures in responding to computer output instructions or error conditions, but refers problems to a higher level operator or the supervisor when standard procedures fail.
PERIPHERAL EQUIPMENT OPERATOR
Operates peripheral equipment w h ic h directly supports digital computer operations. Such equipment is uniquely and specifically designed for computer applications, but need not be physically or electronically connected to a computer. Printers, plotters, card read/punches, tape readers, tape units or drives, disk units or drives, and data display units are examples of such equipment.
The following duties characterize the work of a peripheral equipmentoperator:
- Loading printers and plotters with correct paper; adjusting controls for form s, thickness, tension, printing density, and location; and unloading hard copy.
- Labelling tape reels, disks, or card decks.- Checking labels and mounting and dismounting designated tape
reels or disks on specified units or drives.- Setting controls which regulate operation of the equipment.
- Observing panel lights for warnings and error indications and taking appropriate action.
- Examining tapes, cards, or other material for creases, tears, or other defects which could cause processing problems.
This classification excludes workers (1) who monitor and operate a control console (see computer operator) or a remote terminal, or (2) whose duties are limited to operating decollaters, bursters, separators, or similar equipment.
COM PUTER DATA LIBRARIAN
Maintains library of media (tapes, disks, cards, cassettes) used for automatic data processing applications. The following or similar duties characterize the work of a computer data librarian: Classifying, cataloging,and storing media in accordance with a standardized system; upon proper requests, releasing media for processing; maintaining records of releases and returns; inspecting returned media for damage or excessive wear to determine whether or not they need replacing. May perform minor repairs to damaged tapes.DRAFTER
Performs drafting work requiring knowledge and skill in drafting methods, procedures, and techniques. Prepares drawings of structures, mechanical and electrical equipment, piping and duct systems and other similar equipment, systems, and assemblies. Uses recognized systems of symbols, legends, shadings, and lines having specific meanings in drawings. Drawings are used to communicate engineering ideas, designs, and information in support of engineering functions.
The following are excluded when they constitute the primary purpose of the job:
- Design work requiring the technical knowledge, skill, and ability to conceive or originate designs;
- Illustrating work requiring artistic ability;- Work involving th e preparation of charts, diagrams, room
arrangements, floor plans, etc.;- Cartographic work involving the preparation of maps or plats
and related materials, and drawings of geological structures; and- Supervisory work involving the management of a drafting program
or the supervision of drafters.Positions are classified into levels on the basis of the following
definitions.Class A. Works closely with design originators, preparing drawings
of unusuaTj complex or original designs which require a high degree of precision. Performs unusually difficult assignments requiring considerable initiative, resourcefulness, and drafting expertise. Assures that anticipated problems in manufacture, assembly, installation, and operation are resolved by the drawings produced. Exercises independent judgment in selecting and interpreting data based on a knowledge of the design intent. Although working primarily as a drafter, may occasionally perform engineering design work in interpreting general designs prepared by others or in completing missing design details. May provide advice and guidance to lower level drafters or serve as coordinator and planner for large and complex drafting projects.
Class B. Prepares complete sets of complex drawings which include multiple views, detail drawings, and assembly drawings. Drawings include complex design features that require considerable drafting skill to visualize and portray. Assignments regularly require the use of mathematical formulas to compute weights, load capacities, dimensions, quantities of materials, etc. Working from sketches and verbal information supplied by an engineer or designer, determines the most appropriate views, detail drawings, and supplementary information needed to complete assignments. Selects required information from precedents, manufacturers1 catalogs, and technical guides. Independently resolves most of the problems encountered. Supervisor or designer may suggest methods of approach or provide advice on unusually difficult problems.
Digitized for FRASER http://fraser.stlouisfed.org/ Federal Reserve Bank of St. Louis
D R A FTE R — Continued
NOTE: Exclude drafters performing work of similar difficulty tothat described at this level but who provide support for a variety of organizations which have widely differing functions or requirements.
Class C. Prepares various drawings of parts and assemblies, including sectional profiles, irregular or reverse curves, hidden lines, and small or intricate details. Work requires use of most of the conventional drafting techniques and a working knowledge of the terms and procedures of the industry. Familiar or recurring work is assigned in general term s; unfamiliar assignments include information on methods, procedures, sources of information, and precedents to be followed. Simple revisions to existing drawings may be assigned with a verbal explanation of the desired results; more complex revisions are produced from sketches which clearly depict the desired product.
Class D. Prepares drawings of simple, easily visualized parts or equipment from sketches or marked-up prints. Selects appropriate templates and other equipment needed to complete assignments. Drawings fit familiar patterns and present few technical problems. Supervisor provides detailed instructions on new assignments, gives guidance when questions arise, and reviews completed work for accuracy.
Class E. Working under close supervision, traces or copies finished drawings, making clearly indicated revisions. Uses appropriate templates to draw curved lines. Assignments are designed to develop increasing skill in various drafting techniques. Work is spot-checked during progress and reviewed upon completion.
NOTE: Exclude d r a f t e r s performing elementary tasks whilereceiving training in the most basic drafting methods.
ELECTRONICS TECHNICIAN
Works on various types of electronic equipment and related devices by performing one or a combination of the following: Installing, maintaining,repairing, overhauling, troubleshooting, modifying, constructing, and testing. Work requires practical application of technical knowledge, of electronics principles, ability to determine malfunctions, and skill to put equipment in required operating condition.
The equipment— consisting of either many different kinds of circuits or multiple repetition of the same kind of circuit— includes, but is not limited to, the following: (a) Electronic transmitting and receiving equipment (e.g.,radar, radio, television, telephone, sonar, navigational aids), (b) digital and analog computers, and (c) industrial and medical measuring and controlling equipment.
This classification excludes repairers of such standard electronic equipment as common office machines and household radio and television sets; production assemblers and testers; workers whose primary duty is servicing electronic test instruments; technicians who have administrative or supervisory responsibility; and drafters, designers, and professional enginee rs .
Positions are classified into levels on the basis of the following definitions:
Class A . Applies advanced technical knowledge to solve unusually complex problems (i.e ., those that typically cannot be solved solely by reference to manufacturers' manuals or similar documents) in working on electronic equipment. Examples of such problems include location and density of circuitry, electromagnetic radiation, isolating malfunctions, and
ELECTRONICS TECHNICIAN— Continued
frequent engineering changes. Work involves: A detailed understanding ofthe interrelationships of circuits; exercising independent judgment in performing such tasks as making circuit analyses, calculating wave forms, tracing relationships in signal flow; and regularly using complex text instruments (e .g ., dual trace oscilloscopes, Q -m eters, deviation meters, pulse generators).
Work may be reviewed by supervisor (frequently an engineer or designer) for general compliance with accepted practices. May provide technical guidance to lower level technicians.
Class B. Applies comprehensive technical knowledge to solve complex problems [i.e ., those that typically can be solved solely by properly interpreting manufacturers1 manuals or similar documents) in working on electronic equipment. Work involves: A familiarity with the interrelationships of circuits; and judgment in determining work sequence and in selecting tools and testing instruments, usually less complex that those used by the class A technician.
Receives technical guidance, as required, from supervisor or higher level technician, and work is reviewed for specific compliance with accepted practices and work assignments. May provide technical guidance to lower level technicians.
Class C. Applies working technical knowledge to perform simple or routine tasks In working on electronic equipment, following detailed instructions which cover virtually all procedures. Work typically involves such tasks as: Assisting higher level technicians by performing such activities asreplacing components, wiring circuits, and taking test readings; repairing simple electronic equipment; and using tools and common test instruments (e .g ., multimeters, audio signal generators, tube testers, oscilloscopes). Is not required to be familiar with the interrelationships of circuits. This knowledge, however, may be acquired through assignments designed to increase competence (including classroom training) so that worker can advance to higher level technician.
Receives technical guidance, as required, from supervisor or higher level technician. Work is typically spot-checked, but is given detailed review when new or advanced assignments are involved.
REGISTERED INDUSTRIAL NURSE
A registered nurse gives nursing service under general medical direction to ill or injured employees or other persons who become ill or suffer an accident on the premises of a factory or other establishment. Duties involve a combination of the following: Giving first aid to the ill orinjured; attending to subsequent dressing of employees' injuries; keeping records of patients treated; preparing accident reports for compensation or other purposes; assisting in physical examinations and health evaluations of applicants and employees; and planning and carrying out programs involving
Digitized for FRASER http://fraser.stlouisfed.org/ Federal Reserve Bank of St. Louis
REGISTERED INDUSTRIAL NURSE— Continued MAINTENANCE MACHINIST— Continued
health education, accident prevention, evaluation of plant environment, or other activities affecting the health, welfare, and safety of all personnel. Nursing supervisors or head nurses in establishments employing more than one nurse are excluded.
Maintenance, Toolroom, and PowerplantMAINTENANCE CARPENTER
Performs the carpentry duties necessary to construct and maintain in good repair building woodwork and equipment such as bins, cribs, counters, benches, partitions, doors, floors, stairs, casings, and trim made of wood in an establishment. Work involves most of the following: Planning andlaying out of work from blueprints, drawings, models, or verbal instructions; using a variety of carpenter's handtools, portable power tools, and standard measuring instruments; making standard shop computations relating to dimensions of work; and selecting materials necessary for the work. In general, the work of the maintenance carpenter requires rounded training and experience usually acquired through a formal apprenticeship or equivalent training and experience.
MAINTENANCE ELECTRICIAN
Performs a variety of electrical trade functions such as the installation, maintenance, or repair of equipment for the generation, distribution, or utilization of electric energy in an establishment. Work involves most of the following: Installing or repairing any of a variety of electricalequipment such as generators, transform ers, switchboards, controllers, circuit breakers, m otors, heating units, conduit Systems, or other transmission equipment; working from blueprints, drawings, layouts, or other specifications; locating and diagnosing trouble in the electrical system or equipment; working standard computations relating to load requirements of wiring or electrical equipment; and using a variety of electrician's handtools and measuring and testing instruments. In general, the work of the maintenance electrician requires rounded training and experience usually acquired through a formal apprenticeship or equivalent training and experience.
MAINTENANCE PAINTER
Paints and redecorates walls, woodwork, and fixtures of an establishment. Work involves the following: Knowledge of surface peculiaritiesand types of paint required for different applications; preparing surface for painting by removing old finish or by placing putty or filler in nail holes and interstices; and applying paint with spray gun or brush. May mix colors, oils, white lead, and other paint ingredients to obtain proper color or consistency. In general, the work of the maintenance painter requires rounded training and experience usually acquired through a formal apprenticeship or equivalent training and experience.
MAINTENANCE MACHINISTProduces replacement parts and new parts in making repairs of
metal parts of mechanical equipment operated in an establishment. Work involves most of the following: Interpreting written instructions and specifications; planning and laying out of work; using a variety of machinist's hand- tools and precision measuring instruments; setting up and operating standard
machine tools; shaping of metal parts to close tolerances; making standard shop computations relating to dimensions of work, tooling, feeds, and speeds of machining; knowledge of the working properties of the common metals; selecting standard materials, parts, and equipment required for this work; and fitting and assembling parts into mechanical equipment. In general, the machir^st's work normally requires a rounded training in machine-shop practice usually acquired through a formal apprenticeship or equivalent training and experience.
MAINTENANCE MECHANIC (MACHINERY)
Repairs machinery or mechanical equipment of an establishment. Work involves most of the following: Examining machines and mechanicalequipment to diagnose source of trouble; dismantling or partly dismantling machines and performing repairs that mainly involve the use of handtools in scraping and fitting parts; replacing broken or defective parts with items obtained from stock; ordering the production of a replacement part by a machine shop or sending the machine to a machine shop for major repairs; preparing written specifications for major repairs or for the production of parts ordered from machine shops; reassembling machines; and making all necessary adjustments for operation. In general, the work of a machinery maintenance mechanic requires rounded training and experience usually acquired through a formal apprenticeship or equivalent training and experience. Excluded from this classification are workers whose primary duties involve setting up or adjusting machines.
MAINTENANCE MECHANIC (MOTOR VEHICLE)Repairs automobiles, buses, motortrucks, and tractors of an estab
lishment. Work involves most of the following: Examining automotiveequipment to diagnose source of trouble; disassembling equipment and performing repairs that involve the use of such handtools as wrenches, gauges, drills, or specialized equipment in disassembling or fitting parts; replacing broken or defective parts from stock; grinding and adjusting valves; re assembling and installing the various assemblies in the vehicle and making necessary adjustments; and aligning wheels, adjusting brakes and lights, or tightening body bolts. In general, the work of the motor vehicle maintenance mechainc requires rounded training and experience usually acquired through a formal apprenticeship or equivalent training and experience.
This classification d o e s not in c lu d e mechanics who repair customers' vehicles in automobile repair shops.
MAINTENANCE PIPEFITTERInstalls or repairs water, steam, gas, or other types of pipe and
pipefittings in an establishment. Work involves most of the following: Layingout work and measuring to locate position of pipe from drawings or other written specifications; cutting various sifces of pipe to correct lengths with chisel and hammer or oxyacetylene torbh or pipe-cutting machines; threading pipe with stocks and dies; bending pipe by hand-driven or power-driven machines; assembling pipe with couplings and fastening pipe to hangers; making standard shop computations relating to pressures, flow, and size of pipe required; and making standard tests to determine whether finished pipes meet specifications. In general, the work of the maintenance pipefitter requires rounded training and experience usually acquired through a formal apprenticeship or equivalent training and experience. Workers primarily engaged in installing and repairing building sanitation or~ heating systems are excluded.
48Digitized for FRASER http://fraser.stlouisfed.org/ Federal Reserve Bank of St. Louis
MAINTENANCE SHEET-M ETAL WORKER
Fabricates, installs, and maintains in good repair the sheet-metal equipment and fixtures (such as machine guards, grease pans, shelves, lockers, tanks, ventilators, chutes, ducts, metal roofing) of an establishment. Work involves most of the following: Planning and laying out all types ofsheet-metal maintenance work from blueprints, models, or other specifications; setting up and operating all available types of sheet-metal working machines; using a variety of handtools in cutting, bending, forming, shaping, fitting, and assembling; and installing sheet-metal articles as required. In general, the work of the maintenance sheet-metal worker requires rounded training and experience usually acquired through a formal apprenticeship or equivalent training and experience.
MILLWRIGHT
Installs new machines or heavy equipment, and dismantles and installs machines or heavy equipment when changes in the plant layout are required. Work involves most of the following: Planning and laying out work;interpreting blueprints or other specifications; using a variety of handtools and rigging; making standard shop computations relating to stresses, strength of m aterials, and centers of gravity; aligning and balancing equipment; selecting standard tools, equipment, and parts to be used; and installing and maintaining in good order power transmission equipment such as drives and speed reducers. In general, the millwright's work normally requires a rounded training and experience in the trade acquired through a formal apprenticeship or equivalent training and experience.
MAINTENANCE TRADES HELPER
Assists one or more workers in the skilled maintenance trades, by performing specific or general duties of lesser skill, such as keeping a worker supplied with materials and tools; cleaning working area, machine, and equipment; assisting journeyman by holding materials or tools; and performing other unskilled tasks as directed by journeyman. The kind of work the helper is permitted to perform varies from trade to trade: Insome trades the helper is confined to supplying, lifting, and holding materials and tools, and cleaning working areas; and in others he is permitted to perform specialized machine operations, or parts of a trade that are also performed by workers on a full-time basis.
MACHINE-TOOL OPERATOR (TOOLROOM)Specializes in operating one or more than one type of machine
tool (e .g ., jig borer, grinding machine, engine lathe, milling machine) to machine metal for use in making or maintaining jigs, fixtures, cutting tools, gauges, or metal dies or molds used in shaping or forming metal or nonmetallic material (e .g ., plastic, plaster, rubber, glass). Work typically involves: Planning and performing difficult machining operations whichrequire complicated setups or a high degree of accuracy; setting up machine tool or tools (e .g ., install cutting tools and adjust guides, stops, working tables, and other controls to handle the size of stock to be machined; determine proper feeds, speeds, tooling, and operation sequence or select those prescribed in drawings, blueprints, or layouts); using a variety of precision measuring instruments; making necessary adjustments during machining operation to achieve requisite dimensions to very close tolerances. May be required to select proper coolants and cutting and lubricating oils, to recognize when tools need dressing, and to dress tools. In general, the
MACHINE-TOOL OPERATOR (TOOLROOM)— Continued
work of a machine-tool operator (toolroom) at the skill level called for in this classification requires extensive knowledge of machine-shop and toolroom practice usually acquired through considerable on-the-job training and experience.
For cros s-industry wage study purposes, this classification does not include machine-tool operators (toolroom) employed in tool and die jobbing shops.
TOOL AND DIE MAKER
Constructs and repairs jigs, fixtures, cutting tools, gauges, or metal dies or molds used in shaping or forming metal or nonmetallic material (e .g ., plastic, plaster, rubber, glass). Work typically involves: Planning and laying out work according to models, blueprints, drawings, or other written or oral specifications; understanding the working properties of common metals and alloys; selecting appropriate materials, tools, and processes required to complete task; making necessary shop computations; setting up and operating various machine tools and related equipment; using various tool and die maker's handtools and precision measuring instruments; working to very close tolerances; heat-treating metal parts and finished tools and dies to achieve required qualities; fitting and assembling parts to prescribed tolerances and allowances. In general, the tool and die maker's work requires rounded training in machine-shop and toolroom practice usually acquired through formal apprenticeship or equivalent training and experience.
For cross-industry wage study purposes, this classification does not include tool and die makers who (1) are employed in tool and die jobbing shops or (2) produce forging dies (die sinkers).
STATIONARY ENGINEER
Operates and maintains one or more systems which provide an establishment with such services as heat, air-conditioning (cool, humidify, dehumidify, filter, and circulate air), refrigeration, steam or high-temperature water, or electricity. Duties involve: Observing and interpretingreadings on gauges, meters, and charts which register various aspects of the system's operation; adjusting controls to insure safe and efficient operation of the system and to meet demands for the service provided; recording in logs various aspects of the system's operation; keeping the engines, machinery, and equipment of the system in good working order. May direct and coordinate activities of other workers (not stationary engineers) in performing tasks directly related to operating and maintaining the system or systems.
The classification excludes head or chief engineers in establishments employing more than one engineer; workers required to be skilled in the repair of electronic control equipment; and workers in establishments producing electricity, steam, or heated or cooled air primarily for sale.
BOILER TENDER
Tends one or more boilers to produce steam or high-temperature water for use in an establishment. Fires boiler. Observes and interprets readings on gauges, meters, and charts which register various aspects of boiler operation. Adjusts controls to insure safe and efficient boiler operation and to meet demands for steam or high-temperature water. May also
49Digitized for FRASER http://fraser.stlouisfed.org/ Federal Reserve Bank of St. Louis
BOILER TENDER— Continued
do one or more of the following: Maintain a log in which various aspectsof boiler operation are recorded; clean, oil, make minor repairs or assist in repairs to boilerroom equipment; and, following prescribed methods, treat boiler water with chemicals and analyze boiler water for such things as acidity, causticity, and alkalinity.
The classification excludes workers in establishments producting electricity, steam, or heated or cooled air primarily for sale.
Material Movement and CustodialTRUCKDRIVER
Drives a truck within a city or industrial area to transport materials, merchandise, equipment, or workers between various types of establishments such as: Manufacturing plants, freight depots, warehouses,wholesale and retail establishments, or between retail establishments and customers' houses or places of business. May also load or unload truck with or without helpers, make minor mechanical repairs, and keep truck in good working order. Salesroute and over-the-road drivers are excluded.
For wage study purposes, truckdrivers are classified by type and rated capacity of truck, as follows:
Truckdriver, light truck(straight truck, under IV2 tons, usually 4 wheels)
Truckdriver, medium truck(straight truck, L /2 to 4 tons inclusive, usually 6 wheels)
Truckdriver, heavy truck (straight truck, over 4 tons, usually 10 wheels)
Truckdriver, tractor-trailer
SHIPPER AND RECEIVER
Performs clerical and physical tasks in connection with shipping goods of the establishment in which employed and receiving incoming shipments. In performing day-to-day, routine tasks, follows established guidelines. In handling unusual nonroutine problems, receives specific guidance from supervisor or other officials. May direct and coordinate the activities of other workers engaged in handling goods to be shipped or being received.
Shippers typically are responsible for most of the following: Verifying that orders are accurately filled by comparing items and quantities of goods gathered for shipment against documents; insuring that shipments are properly packaged, identified with shipping information, and loaded into transporting vehicles; preparing and keeping records of goods shipped, e .g ., manifests, bills of lading.
Receivers typically are responsible for most of the following: Verifying the correctness of incoming shipments by comparing items and quantities unloaded against bills of lading, invoices, manifests, storage
SHIPPER AND RECEIVER— Continued
receipts, or other records; checking for damaged goods; insuring that goods are appropriately identified for routing to departments within the establishment; preparing and keeping records of goods received.
For wage study purposes, workers are classified as follows:
ShipperReceiverShipper and receiver
WAREHOUSEMAN
As directed, performs a variety of warehousing duties which require an understanding of the establishment's storage plan. Work involves most of the following: Verifying materials (or merchandise) against receivingdocuments, noting and reporting discrepancies and obvious damages; routing materials to prescribed storage locations; storing, stacking, or palletizing materials in accordance with prescribed storage methods; rearranging and taking inventory of stored materials; examining stored materials and re porting deterioration and damage; removing material from storage and preparing it for shipment. May operate hand or power trucks in performing warehousing duties.
Exclude workers whose primary duties involve shipping and re ceiving work (see Shipper and Receiver and Shipping Packer), order filling (see Order Filler), or operating power trucks (see Power-Truck Operator).
ORDER FILLER
Fills shipping or transfer orders for finished goods from stored merchandise in accordance with specifications on sales slips, customers' orders, or other instructions. May, in addition to filling orders and indicating items filled or omitted, keep records of outgoing orders, requisition additional stock or report short supplies to supervisor, and perform other related duties.
SHIPPING PACKER
Prepares finished products for shipment or storage by placing them in shipping containers, the specific operations performed being dependent upon the type, size, and number of units to be packed, the type of container employed, and method of shipment. Work requires the placing of items in shipping containers and may involve one or more of the following: Knowledgeof various items of stock in order to verify content; selection of appropriate type and size of container; inserting enclosures in container; using excelsior or other material to prevent breakage or damage; closing and sealing container; and applying labels or entering identifying data on container. Packers who also make wooden boxes or crates are excluded.
50Digitized for FRASER http://fraser.stlouisfed.org/ Federal Reserve Bank of St. Louis
M A T E R IA L HANDLING LABO RER
A worker employed in a warehouse, manufacturing plant, store, or other establishment whose duties involve one or more of the following: Loading and unloading various rtiaterials and merchandise on or from freight cars, trucks, or other transporting devices; unpacking, shelving, or placing materials or merchandise in proper storage location; and transporting materials or merchandise by handtruck, car, or wheelbarrow. Longshore workers, who load and unload ships, are excluded.
POWER-TRUCK OPERATOR
Operates a manually controlled gasoline- or electric-powered truck or tractor to transport goods and materials of all kinds about a warehouse, manufacturing plant, or other establishment.
For wage study purposes, workers are classified by type of power- truck, as follows:
F o rklift ope rato rPower-truck operator (other than forklift)
GUARD
Protects property from theft or damage, or persons from hazards or interference. Duties involve serving at a fixed post, making rounds on foot or by motor vehicle, or escorting persons or property. May be deputized to make arrests. May also help visitors and customers by answering questions and giving directions.
GUARD— Continued
Guards employed by establishments which provide protective services on a contract basis are included in this occupation.
For wage study purposes, guards are classified as follows:Class A . Enforces regulations designed to prevent breaches of
security. Exercises judgment and uses discretion in dealing with emergencies and security violations encountered. Determines whether first response should be to intervene directly (asking for assistance when deemed necessary and time allows), to keep situation under surveillance, or to report situation so that it can be handled by appropriate authority. Duties require specialized training in methods and techniques of protecting security areas. Commonly, the guard is required to demonstrate continuing physical fitness and proficiency with firearms or other special weapons.
Class B . Carries out instructions primarily oriented toward insuring that emergencies and security violations are readily discovered and reported to appropriate authority. Intervenes directly only in situations which require minimal action to safeguard property or persons. Duties require minimal training. Commonly, the guard is not required to demonstrate physical fitness. May be armed, but generally is not required to demonstrate proficiency in the use of firearms or special weapons.
JANITOR, PORTER, OR CLEANERCleans and keeps in an orderly condition factory working areas and
washrooms, or premises of an office, apartment house, or commercial or other establishment. Duties involve a combination of the following: Sweeping, mopping or scrubbing, and polishing floors; removing chips, trash, and other refuse; dusting equipment, furniture, or fixtures; polishing metal fixtures or trimmings; providing supplies and minor maintenance services; and cleaning, lavatories, showers, and restrooms. Workers who specialize in window washing are excluded.
51Digitized for FRASER http://fraser.stlouisfed.org/ Federal Reserve Bank of St. Louis
Service Contract Act Surveys
The following areas are surveyed periodically for use in administering the Service Contract Act of 1965. Survey results are published in releases which are available, at no cost, while supplies last from any of the BLS regional offices shown on the back cover.
Alaska (statewide)Albany, Ga.Albuquerque, N. Mex.Alexandria— Leesville, La.Alpena—Standish—Tawas City, Mich. Ann Arbor, Mich.Asheville, N.C.Augusta, Ga.—S.C.Austin, Tex.Bakersfield, Calif.Baton Rouge, La.Battle Creek, Mich.Beaumont— Port Arthui^-Orange
and Lake Charles, Tex.—La. Biloxi-Gulfport and Pascagoula—
Moss Point, M iss.Binghamton, N. Y.Birmingham, Ala.Bloomington—Vincennes, Ind. Bremerton—Shelton, Wash. Brunswick, Ga.Cedar Rapids, Iowa Champaign—Urbana—Rantoul, 111. Charleston—North Charleston—
ALSO AVAILABLE—Riverside—San Bernardino— Ontario, Calif.
Salina, Kans.Salinas—Seaside—Monterey, Calif. Sandusky, Ohio Santa Barbara—Santa Maria—
Lompoc, Calif.Savannah, Ga.Selma, Ala.Sherman—Denison, Tex. Shreveport, La.South Dakota (statewide) Southeastern Massachusetts Southern Idaho Southwest Virginia Spokane, Wash.Springfield, 111.Stockton, Calif.Tacoma, Wash.Tampa—St. Petersburg, Fla. Topeka, Kans.Tucson—Douglas, Ariz.Tulsa, Okla.Upper Peninsula, Mich.Vallejo—Fairfield—Napa, Calif. Vermont (statewide)Virgin Islands of the U.S.Waco and Killeen—Temple, Tex. Waterloo—Cedar Falls, Iowa West Virginia (statewide) Western and Northern
Massachusetts Wichita Falls—Lawton—Altus,
Tex.—Okla.Yakima—Richland^Kenn ewick—
Pendleton, Wash.—Oreg.
An annual report on salaries for accountants, auditors, chief accountants, attorneys, job analysts, directors of personnel, buyers, chemists, engineers, engineering technicians, drafters, and clerical employees is available. Order as BLS Bulletin 2004, National Survey of Professional, Administrative, Technical and Clerical Pay, March 1978, $2.40 a copy, from any of the BLS regional sales offices shown on the back cover, or from the Superintendent of Documents, U.S. Government Printing Office, Washington, D.C. 20402.
Digitized for FRASER http://fraser.stlouisfed.org/ Federal Reserve Bank of St. Louis
Area Wage Surveys
A list of the latest bulletins available is presented below. Bulletins may be purchased from any of the BBS regional offices shown on the back cover, or from the Superintendent of Documents, U.S. Government Printing Office, Washington, D .C. 20402. Make checks payable to Superintendent of Documents. A directory of occupational wage surveys, covering the years 1970 through 1977, is available on request.
Bulletin numberArea and price *
Akron, Ohio, Dec. 1978 _______________________________________ 2025-63, $1.00Albany—Schenectady—Troy, N .Y ., Sept. 1979________________ 2050-46, $1.50Anaheim-Santa Ana^Garden Grove,
Calif., Oct. 1979______________________________________________ 2050-48, $1.50Atlanta, Ga., May 1979________________________________________ 2050-20, $1.30Baltimore, M d., Aug. 1979____________________________________ 2050-42, $1.75Billings, Mont., July 1979____________________________________ 2050-43, $1.50Birmingham, A la., Mar. 1978________________________________ 2025-15, 80 centsBoston, M ass., Aug. 1979_____________________________________ 2050-50, $1.75Buffalo, N .Y ., Oct. 19781_____________________________________ 2025-71, $1.30Canton, Ohio, May 1978_______________________________________ 2025-22, 70 centsChattanooga, Term.—Ga., Sept. 1979__________________________ 2050-39, $1.50Chicago, HI., May 1979________________________________________ 2050-21, $1.75Cincinnati, Ohio—Ky.—Ind., July 1979 1______________________ 2050-28, $2.00Cleveland, Ohio, Sept. 1979___________________________________ 2050-47, $1.75Columbus, Ohio, Oct. 1978 1 __________________________________ 2025-59, $1.50Corpus Christi, Tex., July 1979 1____________________________ 2050-33, $1.75D allas-Fort Worth, Tex., Oct. 1978 1______________________ 2025-52, $1.50Davenport-Rock Island—Moline, Iowa—111., Feb. 1979______ 2050-10, $1.00Dayton, Ohio, Dec. 1978 ______________________________________ 2025-66, $1.00Daytona Beach, Fla ., Aug. 1979 1____________________________ 2050-41, $1.50Denver—Boulder, Colo., Dec. 1978___________________________ 2025-68, $1.20Detroit, Mich., Mar. 1979 1___________________________________ 2050-7, $1.50Fresno, Calif., June 1979____________________________________ 2050-25, $1.50Gainesville, Fla ., Sept. 1979___________________ _____________ 2050-45, $1.50Gary—Hammond—East Chicago, Ind., Oct. 1979 1____________ (To be surveyed)Green Bay, W is ., July 1979_____________ -____________________ 2050-31, $1.50Greensboro-W inston-Salem—High Point,
N .C., Aug. 1979_______________________________________________ 2050-49, $1.50Greenville—Spartanburg, S .C ., June 1979 1 ___________________ 2050-29, $1.75Hartford, Conn., Mar. 1979___________________________________ 2050-12, $1.10Houston, Tex., Apr. 1979_____________________________________ 2050-15, $1.30Huntsville, A la., Feb. 1979____________________________________ 2050-3, $1.00Indianapolis, Ind., Oct. 1979__________________________________ 2050-54, $2.25Jackson, M iss., Jan. 1979 1___________________________________ 2050-9, $1.20Jacksonville, F la ., Dec. 1978 ________________________________ 2025-67, $ 1.00Kansas City, M o.-K an s., Sept. 1979 1 _____________________ 2050-58, $2.75Los Angeles—Long Beach, C alif., Oct. 1978 1 _______________ 2025-61, $1.50Louisville, Ky.—Ind., Nov. 1978______________________________ 2025-69, $1.00Memphis, Term.—Ark.—M iss ., Nov. 1979 1 ___________________ 2050-56, $2.25
Bulletin numberArea and price *
Miami, Fla., Oct. 1979________________________________________ 2050-55, $2.25Milwaukee, W is., Apr. 1979__________________________________ 2050-8, $1.30Minneapolis—St. Paul, Minn.—Wis., Jan. 1979_______________ 2050-1, $1.30Nassau—Suffolk, N. Y ., June 1979_____________________________ 2050-36, $1.75Newark, N.J., Jan. 1979______________________________________ 2050-5, $1.30New Orleans, La., Oct. 1979_________________________________ 2050-53, $2.25New York, N .Y .-N .J ., May 1979_____________________________ 2050-30, $1.75Norfolk—Virginia Beach—Portsmouth, Va.—
N.C., May 1979 1 _________________________________________ -— 2050-22, $1.75Norfolk—Virginia Beach—Portsmouth and
Newport News—Hampton, Va.—N.C., May 1978------------------- 2025-21, 80 centsNortheast Pennsylvania, Aug. 1979 1 ------------------------------------- 2050-32, $1.75Oklahoma City, Okla., Aug. 1979_____________________________ 2050-37, $1.50Omaha, Nebr.—Iowa, Oct. 1979_______________________________ 2050-51, $1.50Paterson—Clifton—Passaic, N.J., June 1979_____________ ___ 2050-26, $1.50Philadelphia, Pa.—N.J., Nov. 1979 1 _________________________ 2050-57, $3.00Pittsburgh, Pa., Jan. 1979 1 __________________________________ 2050-11, $1.50Portland, Maine, Dec. 19781_________________________________ 2025-70, $1.20Portland, Oreg.—Wash., May 1979____________________________ 2050-27, $1.75Poughkeepsie, N. Y ., June 1979_______________________________ 2050-34, $1.50Poughkeepsie—Kingston—Newburgh, N .Y., June 1979_______ 2050-35, $1.50Providence—Warwick—Pawtucket, R.I.—
M ass., June 1979 1 __________________________________________ 2050-38, $1.75Richmond, Va., June 1979____________________________________ 2050-24, $1.50St. Louis, Mo.—111., Mar. 1979 1 _____________________________ 2050-13, $1.50Sacramento, Calif., Dec. 1978 _______________________________ 2025-75, $1.00Saginaw, Mich., Nov. 1979 1 __________________________________ 2050-52, $1.75Salt Lake City—Ogden, Utah, Nov. 1978 1 ______ _____________ 2025-72, $1.30San Antonio, Tex., May 1979__________________________________ 2050-17, $1.00San Diego, Calif., Nov. 1978__________________________________ 2025-73, $1.00San Francisco—Oakland, Calif., Mar. 1979__________________ 2050-14, $1.20San Jose, Calif., Mar. 1979___________________________________ 2050-19, $1.10Seattle—Everett, Wash., Dec. 1978___________________________ 2025-74, $1.00South Bend, Ind., Aug. 1979 1_________________________________ 2050-44, $1.75Toledo, Ohio-Mich., May 1979_______________________________ 2050-16, $1.10Trenton, N.J., Sept. 1979_____________________________________ 2050-40, $1.50Utica—Rome, N .Y ., July 1978_________________________________ 2025-34, $1.00Washington, D .C .-M d .-V a ., Mar. 1979______________________ 2050-4, $1.20Wichita, Kans., Apr. 1979____________________________________ 2050-18, $1.00Worcester, M ass., Apr. 1979________________________________ 2050-23, $1.50York, Pa., Feb. 1979__________________________________________ 2050-6, $1.00
* Prices are determined by the Government Printing Office and are subject to change.* Data on establishment practices and supplementary wage "provisions are also presented.
Digitized for FRASER http://fraser.stlouisfed.org/ Federal Reserve Bank of St. Louis
U.S. Department of Labor Bureau of Labor Statistics Washington, D.C. 20212
Official Business Penalty for private use, $300
Bureau off Labor Statistics Regional OfficesRegion I1603 JFK Federal Building Government Center Boston, Mass 02203 Phone: 223-6761 (AreaCode617)ConnecticutMaineMassachusetts New Hampshire Rhode island Vermont
Region V9th Floor, 230 S. Dearborn St. Chicago, III. 60604 Phone:353-1880 (Area Code 312)
IllinoisIndianaMichiganMinnesotaOhioWisconsin
Region IISuite 34001515 BroadwayNew York, N Y. 10036Phone. 399-5406 (AreaCode212)New Jersey New York Puerto Rico Virgin Islands
Region VISecond Floor555 Gritfin Square BuildingDallas, Tex. 75202Phone: 767-69 71 (Area Code 214)Arkansas Louisiana New Mexico Oklahoma Texas
Region lit3535 Market Street,P.O. Box 13309Philadelphia, Pa. 19101Phone: 596-1154 (AreaCode215)DelawareDistrict of ColumbiaMarylandPennsylvaniaVirginiaWest Virginia
Regions VII and VIIIFederal Office Building 911 Walnut St., 15th Floor Kansas City, Mo. 64106 Phone 374-2481 (Area Code 816)VII VIIIIowa ColoradoKansas MontanaMissouri North DakotaNebraska South Dakota
UtahWyoming
Postage and Fees Paid U.S. Department of Labor
Third Class Mail
Lab-441
Region IVSuite 5401371 Peachtree St., N.E.Atlanta, Ga. 30309 Phone:881-4418 (Area Code 404)Alabama Florida Georgia Kentucky Mississippi North Carolina South Carolina Tennessee
Regions IX and X450 Golden Gate Ave Box 36017San Francisco, Calif 94102 Phone: 556-4678 (Area Code 415)IXArizonaCaliforniaHawaiiNevada
XAlaskaIdahoOregonWashington
Digitized for FRASER http://fraser.stlouisfed.org/ Federal Reserve Bank of St. Louis