L 2 .3 •' 2411 Industry Wage Survey: Communications October-December 1978 U.S. Department of Labor Bureau of Labor Statistics August 1980 Bulletin 2071 Digitized for FRASER http://fraser.stlouisfed.org/ Federal Reserve Bank of St. Louis
Transcript
L 2 . 3 •'
2 4 1 1
Industry Wage Survey: Communications October-December 1978U.S. Department of Labor Bureau of Labor Statistics August 1980
Bulletin 2071
Digitized for FRASER http://fraser.stlouisfed.org/ Federal Reserve Bank of St. Louis
Industry Wage Survey: Communications October-December 1978U.S. Department of Labor Ray Marshall, SecretaryBureau of Labor Statistics Janet L. Norwood, Commissioner August 1980
Bulletin 2071
For sale by the Superintendent of Documents, U.S. Government Printing Office Washington, D.C. 20402—Price $1.50
Digitized for FRASER http://fraser.stlouisfed.org/ Federal Reserve Bank of St. Louis
Digitized for FRASER http://fraser.stlouisfed.org/ Federal Reserve Bank of St. Louis
Preface
This summary of data on employment and hourly rates of pay in the communications industry in 1978 is based on annual reports filed with the Federal Communications Commission (FCC) by telephone carriers, the Western Union Telegraph Co., and international telegraph carriers, as required by the amended Communications Act of 1934. Under a cooperative arrangement with the FCC, the Bureau of Labor Statistics tabulates and publishes the data annually.
The study was conducted in the Bureau’s Office of
Wages and Industrial Relations. Harry B. Williams of the Division of Occupational Wage Structures prepared the analysis in this bulletin.
Other reports available from the Bureau’s program of industry wage studies, as well as the addresses of the Bureau’s regional offices, are listed at the end of this bulletin.
Unless specifically identified as copyright, material in this publication is in the public domain and may, with appropriate credit, be reproduced without permission.
iiiDigitized for FRASER http://fraser.stlouisfed.org/ Federal Reserve Bank of St. Louis
Digitized for FRASER http://fraser.stlouisfed.org/ Federal Reserve Bank of St. Louis
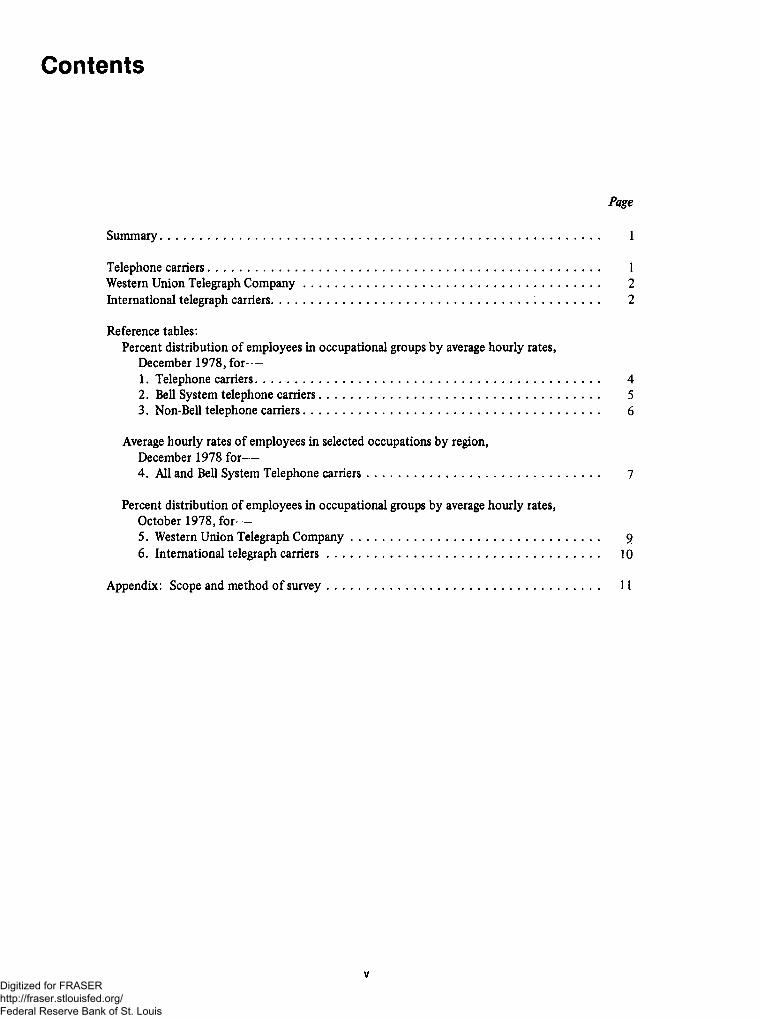
Telephone carriers............................................................................................................................. 1Western Union Telegraph Company.............................................................................................. 2International telegraph carriers........................................................................................................ 2
Reference tables:Percent distribution of employees in occupational groups by average hourly rates,
December 1978, for—1. Telephone carriers.............................................................................................................. 42. Bell System telephone carriers......................................................................................... 53. Non-Bell telephone carriers.............................................................................................. 6
Average hourly rates of employees in selected occupations by region,December 1978 for—4. All and Bell System Telephone carriers.......................................................................... 7
Percent distribution of employees in occupational groups by average hourly rates,October 1978, for—5. Western Union Telegraph Company............................................................................... 96. International telegraph carriers....................................................................................... 10
Appendix: Scope and method of survey....................................................................................... 11
vDigitized for FRASER http://fraser.stlouisfed.org/ Federal Reserve Bank of St. Louis
Digitized for FRASER http://fraser.stlouisfed.org/ Federal Reserve Bank of St. Louis
Communications, October-December 1978
SummaryThe 1978 survey covered about 870,100 workers of
major telephone carriers and nearly 16,000 telegraph workers. Combined, they accounted for approximately nine-tenths of the Nation’s nearly 1 million workers in telephone and wire-telegraph communications. Bell System carriers employed slightly over nine-tenths of the surveyed telephone workers; Western Union employees made up seven-tenths of the telegraph workers studied.
Telephone carrier employees averaged $8.43 an hour in December 1978.1 Wage rates for Bell System carriers averaged $8.55 an hour—22 percent more than for non-Bell carriers ($7.02). Wage rates for the nonmessenger work force of five international telegraph carriers averaged $9.70 an hour compared with $7.84 for similar employees of the Western Union Telegraph Company.
Between the 1977 and 1978 survey periods, wage levels for the principal telephone carriers rose 6.2 percent; for the international telegraph carriers, 5.2 percent; and for the Western Union Telegraph Company, 7.0 percent. The 1977-78 increases for telephone carriers and for the Western Union Telegraph Company were the smallest annual gains of the 1970’s. Between 1970 and 1977, yearly increases averaged 10.7 percent for telephone carriers and 9.5 percent for each type of telegraph carrier.
Highlights of the 1978 survey results and recent wage trends are presented below. A more detailed analysis of long-term patterns is available from prior reports, the most recent of which is Industry Wage Survey: Communications, October -December 1976, BLS Bulletin 1991 (1978). The 1976 report shows, for example, that the work force in these industries has changed dramatically in both occupational makeup and pay structure since the first survey of the communications industry was made by BLS in 1947. In the telephone branch, where overall employment was one-half its 1947 level, the proportion of higher paid professional and semiprofessional employees more than doubled, while the proportion of lower paid telephone operators declined by more than one-half. Similarly, in the Western Union Telegraph Company, the proportion of higher paid construction, installation, and maintenance personnel more
than doubled since 1947, while the proportion of lower paid telegraph operators fell by one-third. Unlike the telephone industry, however, Western Union’s work force in 1978 was only one-fifth as large as it was three decades earlier.
Telephone carriersIn December 1978, straight-time hourly earnings of
the 870,100 telephone workers employed by the Nation’s principal carriers averaged $8.43. Individual earnings of just over four-fifths of the workers fell within a range of $3.50 to $11.50 an hour; about one-eighth earned over $11.50 . Hourly earnings for the middle 50 percent of the work force ranged between $6.47 and $9.44 an hour. Some factors contributing to the wide dispersion of earnings were the broad range of skills required by the communications industry, differences in pay by carrier and locality, and pay rates which vary within a given occupation by length of employee service.
The occupations shown in tables 1 through 4 represent the full spectrum of activities performed by employees in the telephone industry. In December 1978, average hourly earnings among the major occupational categories ranged from $12.97 for professional and semiprofessional employees to $6.26 for telephone operators. Construction, installation, and maintenance employees were the largest employment group, with just over 316,000 workers; hourly earnings for these workers averaged $8.79. Some other numerically important job classifications and their hourly averages were: Business office and sales employees ($8.27); building, supplies, and motor vehicle employees ($7.79), and clerical employees ($7.10).
Employees of the Bell System carriers held a 22-per- cent average wage advantage over those of non-Bell carriers—$8.55 compared to $7.02 an hour. Similar pay relationships were also found among various occupational groups studied; occupational averages for non-
1 The study was limited to the 62 carriers that had annual operating revenues exceeding $1 million and were engaged in interstate or foreign communications services either through use of their own facilities or through connections with another carrier under direct or indirect common control. Officials and managerial assistants of these carriers were not included in the study.
1Digitized for FRASER http://fraser.stlouisfed.org/ Federal Reserve Bank of St. Louis
Bell workers typically ranged from 70 percent to about 85 percent of those for Bell employees. Differences between the worker groups narrowed slightly when weekly earnings were compared, reflecting, for some occupational groups, the longer average workweeks of non- Bell workers.
Telephone workers in the Middle Atlantic States recorded the highest average—$9.48 an hour. Other regional averages fell between $7.75 and $8.90 an hour in December 1978. Some 50,600 workers could not be allocated to individual regions but were included in the nationwide total. Slightly more than seven-eighths of these were employees of the American Telephone and Telegraph Company’s Long Lines and General Departments, and averaged $10.50 an hour.2
The 6.2 percent rise for 1977-78 was the smallest annual gain for telephone workers in the 1,970’s. Between 1970 and 1977, telephone workers’ wage increases averaged 10.7 percent per year; over the 31 years that BLS has conducted communications surveys, the annual average rise has been just over 6 percent.
Western Union Telegraph CompanyThe $7.84 hourly average in October 1978 for the
nearly 11,300 nonmessenger employees in the Western Union Telegraph Company3 was 7.0 percent higher than 1 year earlier. For the nearly 500 messengers, the average of $5.02 an hour was 9.4 percent higher than October 1977. Motor messengers held a 53-percent average wage advantage over those who either walk or use bicycles to perform their duties—$5.25 to $3.44. (See table 5.)
Wage rates for Western Union bargaining unit employees are determined by labor agreements with the United Telegraph Workers (UTW) in all areas except in the New York metropolitan area, where agreements are with the Communications Workers of America (CWA).4 Unlike those in prior contracts, wage adjustments for the third year differed somewhat under terms of the two agreements, dated July 1976, as follows: Workers who were in the bargaining units of the UTW received an across-the-board increase of 8.592 percent,
2 Also excluded from the regional tabulations but included in the U.S. totals were carriers operating in Alaska, Hawaii, Puerto Rico, and the Virgin Islands. These carriers, none of which was affiliated with the Bell System, employed 6,148 workers averaging $8.68 an hour.
3The Western Union Telegraph Co., a subsidairy of the Western Union Corp., is a communications common carrier engaged principally in the business of providing tariffed telecommunication systems and services to business customers, the government, and the public. Such operations include teletypewriter networks, leased private communication systems, telegram message services, money order services, mailgram services, contract maintenance service, and Response- Phone (telephone order and inquiry service).
4 In 1978, workers who were signatories to collective bargaining agreements with UTW and CWA made up nearly four-fifths of the company’s total employment.
effective July 28, 1978, with no cost-of-living adjustment; those under the CWA were provided a 3-percent general wage increase on the same date plus a 45-cent (about 6 percent) cost-of-living adjustment.5 Other wage adjustments were related to specific job classifications or types of work assignments also specified in both agreements.
In October 1978, the $11.11 hourly average recorded for the professional and semiprofessional staff was the highest among the major occupational groups studied in Western Union. Construction, installation, and maintenance employees, the most heavily populated group, with just over one-third of the total employment, averaged $8.72 an hour. Other key employee groups and their average hourly rates included: Telegraph office superintendents and managers ($7.53); sales employees ($7.39); clerical employees ($7.04); building service employees ($6.15); and telegraph operators ($6.10).
Wage rates for the highest paid workers exceeded those of the lowest paid by at least $6 an hour for most employee groups. In a few jobs, however, rates were within a narrow range. For example, individual hourly earnings fell between $3.50 and $4.50 for all operators- in-training; between $4.50 and $5.00 for nearly three- fifths of the laborers; and between $8.50 and $9.50 for over nine-tenths of the subscribers’ equipment maintained and for traffic testing and regulating employees.
Employment at Western Union Telegraph Company totaled about 11,300 in October 1978, a slight decline (200) from a year earlier. The 1978 level was 19 percent below that of 5 years earlier.
International telegraph carriersWage rates for the five international telegraph carri
ers included in the October 1978 survey averaged $9.57 an hour—up 5.2 percent from October 1977.6 The 4,400 nonmessenger employees, accounting for nearly all of the work force of the five companies, averaged $9.70 an hour in October 1978. The lowest paid employee group, messengers, averaged $3.59 an hour. Among other major employee groups, average hourly rates exceeded $12 for professional and semiprofessional employees ($12.76), and for office or station superintendents and assistants ($13.39). Wage rates for nonsupervi- sory clerical employees, operators, building service em-
5 The wage escalator clause provides for adjustments o f 1 cent for each 0.3-point change in the Bureau of Labor Statistics’ Consumer Price Index (1967=100). For a more detailed account, see Wage Chronology: Western Union Telegraph Co. and the Telegraph Workers and the Communications Workers, 1976-79, Supplement to BLS Bulletin 1927 (Bureau of Labor Statistics, 1978).
6 The study included carriers engaged in nonvocal international telegraph communication either by radio or ocean cable. Although many of the occupational categories studied are common to both operations, some are exclusive to one carrier group. For example, radio telegraph operators and cable operators were employed only in ocean cable operations.
2Digitized for FRASER http://fraser.stlouisfed.org/ Federal Reserve Bank of St. Louis
ployees, sales employees, and construction, installation, maintenance, and other technical employees averaged between $7 and $10. (See table 6.)
The 4-percent employment decline from 1977 to 1978 for the five international carriers followed a 1-percent drop from 1976 to 1977. Among the major occupational categories studied, employment declines of 20 percent or more from 1977 to 1978 were reported for messengers and for office or station superintendents and assistants. Cutbacks of between 7 and 11 percent were noted for building service employees; construction, installation, maintenance, and other technical employees;
clerical employees; and operators. Employment was up, however, in such categories as sales workers (20 percent) and professional and semiprofessional personnel (6 percent) during the 12 months ended October 1978.
Men made up nearly four-fifths of the work force in October 1978 and were predominant in nearly all occupational groups except nonsupervisory clerical employees. Three out of every five women were nonsupervisory clerical workers; of the remainder, nearly 1 out of 3 were sales workers. Hourly averages for these two job categories were $7.28 and $9.96, respectively.
3Digitized for FRASER http://fraser.stlouisfed.org/ Federal Reserve Bank of St. Louis
Table 1. Telephone carriers:1 Percent distribution of employees in occupational groups by average hourly rates,2 December 1978Pe rcent of e m p l oy ee s rece iv in g -
Number of employeesAverage
scheduledweeklyhours
Aver ag ehour lyrates
$3.50
$3.99
$4.00
$4.49
$4.50
$4.99
$5.00
$5.49
$5.50
$5.99
$6.00
$6.49
$6.50
$6.99
$7.00
$7.49
$7.50
$7.99
$8.00
$8.49
$8.50
$8.99
$9.00
$9.49
$9.50
$9.99
$10. $10. $11. •
O c c u pa ti on al gr ou p Total Men Women Under$3.50
00
$10.49
50
$10.99
00
$11 . 49
$ 50*, and over
All employees, ex cept o f f i c i a l s an d2.7 10. 1 10.0 11.0 12.4mana ge ri al a s s i s t a n t s ............................ 870,058 417,866 452,192 38.5 $8.43 0.3 2.5 3.8 3.3 2.7 9. 1 7.4 5.5 7. 1 5.5 2.5 2.0 2.1
Pa rt -t im e employees, includ in g5.42offi ci al s and m a n a ge ri al a s s i s t a n t s ........ . 12,611 1,561 11,050 23.1 ” - - - - “ - ” ~ - - “ " “ - - - -
Prof es si on al and s e m i p r of es si on al64.0100,621 69,541 31,080 38.1 12.97 . 1 . 1 . 1 .2 .3 .5 1.0 1.5 2.0 2.4 2.6 3. 1 6.6 4.6 4.6 6.2
1,656 677 979 38.5 7.36 .2 3.4 3.8 3.7 6.3 4.3 12.6 13.0 14.7 9.7 4.8 4.8 4.0 4.9 1.4 2.6 .8 4.8O t h e r s ............................................... 98,965 68,864 30,101 38.1 13.06 X X . 1 . 1 .2 .3 .8 1.3 1.9 2.3 2.6 3. 1 6.7 4.7 4.7 6.3 65.0
Bu si ne ss offi ce an d sales e m p l o y e e s ........... 90,045 24,598 65,447 37.9 8.27 .2 1.9 3.8 4.8 3.4 3.4 4.2 5.8 16.3 .13. 1 8.3 6.5 2.4 4. 1 3.3 2.7 2.8 13.1Supervi s o r s ......................................... 9,566 1,945 7,621 38.3 10.78 X - X X . 1 .2 .2 .4 .8 1.6 3.0 5. 1 10.3 17. 1 12.6 9.8 9. 1 29.5N o ns up er vi so ry e m p l o y e e s ....................... 80,479 22,653 57,826 37.9 7.97 .2 2.2 4.3 5.3 3.8 3.8 4.6 6.5 18.1 14.5 9.0 6.7 1.5 2.6 2.2 1.8 2.0 11.1
Clerical e m p l o y e e s .................................. 203, 860 30,483 173,377 38.0 7. 10 .5 4.4 4.3 5.0 3.6 4. 1 18.0 19.4 12.7 7.4 3.4 2.5 2.6 2.4 1.6 1.4 1.2 5.6Supervi s o r s ......................................... 19,524 5,227 14,297 38.2 10.60 X X X X . 1 .2 .3 1.6 3.4 5.3 7. 1 6.7 9.9 12.2 8.7 7.5 7.3 29.8Nonsupervi s o r y ..................................... 184,336 25,256 159,080 38.0 6.73 .6 4.8 4.8 5.5 3.9 4.5 19.9 21.3 13.7 7.7 3.0 2.0 1.8 1.4 .8 .7 .6 3.1
Co mm ercial d e p a r t m e n t ........................ 33,058 2,552 30,506 37.5 6.19 .5 7.0 7.3 8.6 5.0 4.8 20.5 19.6 14.8 6.8 3.0 .7 .5 .3 X . 1 X .4Traffic d e p a r t m e n t ............................ 9,456 369 9,087 37.8 6.67 1.4 1.6 1.8 3.5 3.6 2.3 27.6 28.6 17.0 6.3 1.4 1.0 1.0 1 . 0 .4 .3 .3 1.0Plant d e p a r t m e n t ............................... 35,596 3,775 31,821 38.6 6.28 .7 5.3 5.9 5.6 4.4 6.9 30.2 20.4 8.7 4.6 1.6 1.9 2.0 .7 .2 .2 .2 .6A c c o un ti ng d e p a r t m e n t ........................ 30,960 4,303 26,657 37.6 6.84 .3 4.0 3.5 5. 1 3.8 3.4 15. 1 21.4 19.5 12.2 3.7 1.7 1.0 1.0 .6 .7 .7 2.3All other d e p a r t m e n t s ........................ 75,266 14,257 61,009 38.1 7. 14 .5 4.4 4.0 4.6 3.4 4.0 15.8 21.4 12.7 7.8 3.6 2.9 2.7 2.4 1.6 1.3 . 9 6.0
Tele ph on e o p e r a t o r s ................................ 132,893 9,7 98 123,095 36.4 6.26 .8 6.3 11.1 6.7 5.3 4.5 26. 1 16.6 5.5 3.9 5.9 1.4 1.3 1.4 .8 . 6 . 5 1.4Chief o p e r a t o r s ................................... 8,353 480 7,873 38.2 10.04 X - X X . 1 .4 1.0 2.2 2.0 4.9 10.0 10.5 15. 1 11.3 9. 1 7.8 6.5 19.0Se rvice as s i s t a n t s an d i n s t r u c t o r s ......... 7,974 302 7,672 37.0 7.21 X . 1 .4 1.4 2.1 1.9 12.8 34.6 19.6 7.2 6.2 5.2 2.3 2.2 1.5 1 . 1 . 6 . 9E x pe ri en ce d s w i t ch bo ar d o p e r a t o r s ........... 10 1,290. 5,629 95,661 36. 1 6.11 1.0 5.3 7. 1 6.5 6.0 5.5 32.9 18.4 5.3 4.0 6.4 .5 . 1 .7 . 1 X X . 1Op er at or s in t r a i n i n g ........................... 14,059 3,334 10,725 37.0 4.36 .3 21.5 53.8 16.1 5.4 1. 1 .3 . 1 . 1 X X .2 .8 X - X - . 1Other s w it ch bo ar d e m p l o y e e s ................... 1,217 53 1,164 38.0 7.38 .7 . 9 .5 2.1 .7 .7 10.9 37.1 18.1 11.3 3.6 2.3 1.6 1.2 1.9 . 8 1.4 4.3
Co nstruction, installation, andma in t e n a n c e e m p l o y e e s ............................ 316, 193 264, 006 52, 187 39.8 8.79 . 1 .5 1.5 1.4 1.5 1.3 3.2 2.8 3.8 3.5 11.1 22.0 25.7 9.2 3.0 2.0 2.0 5.5S u pe rv is or s of te l e p h o n e cr aft wo rk er s. .. . 41,565 37,326 4,239 39.9 11.08 X X X X X X X .2 .4 .7 1.5 2.6 6.6 13.3 11.8 12.4 13.0 37.5Central of fi ce craf t workers'................. 125,018 83,928 41,090 39.7 8.35 .2 1.0 1.6 1.3 1.0 1.9 6.7 5.0 6.3 5.0 8.8 20.9 26.2 9.2 2.9 . 6 . 6 . 9
Test b o ar d and r e pe at er w o r k e r s ........... 21,884 18,523 3,361 39.9 9.04 X . 1 .2 .4 .6 .6 1.0 .9 1.4 2.0 6.6 25.1 39.5 .14.8 3.9 . 9 .8 1. 1Central of fi ce r e p a i r e r s .................... 50,558 46,170 4,388 39.9 9.00 X . 1 .2 .2 .3 .4 .8 .7 2. 1 3.0 9.4 25.4 37.9 12.9 4.8 . 7 . 6 . 5O t h e r s ............................................. 52,576 19,235 33,341 39.3 7.42 .4 2.2 3.5 2.8 1.9 4.0 14.8 10.9 12.3 8.2 9. 1 14.8 9.4 3.2 . 6 . 4 . 4 1.2
Inst al la ti on and e x c h a n g e repair16.3 28.2 30.7craft w o r k e r s ..................................... 98,607 93,775 4,832 40.0 8.58 X .2 1.4 1.7 2.3 .9 . 9 1.7 2.7 2.6 9.0 . 5 . 1 . 1 . 5
PBX and station i n s t a l l e r s .................. 46,902 43,675 3,227 40.0 8.44 X .2 2.0 2.3 3.7 1.2 1.2 2.6 2.7 2.0 14.3 27.3 30.6 9.2 . 2 . 1 . 1 . 4Exch an ge r e p a i r e r s ............................ 29,443 28,737 706 40.0 8.83 X X .6 .7 1.0 .5 .5 .5 2.5 1 . 1 13.5 30.2 32.9 14.3 1.0 .2 . 3 . 1
O t h e r s ............................................. 22,262 21,363 899 40.0 8.52 X .3 1.2 1.7 1.3 . 9 1.0 1.5 3.0 5.7 24.3 27.4 27.9 1.5 . 7 . 1 . 1 1.5Line, cable, and c o nd ui t craft work er s. .. . 50,873 48,861 2,012 40.0 8.42 X .4 2.6 2.4 2.5 1.2 1.3 1.7 3.0 3.5 14.7 28.3 30.2 6. 1 .8 . 5 . 3 . 3
Line w o r k e r s .................................... 27,684 26,87 1 813 40.0 8.33 X .6 3.6 2.8 2.6 1.3 1.3 1.7 2.2 2.5 16.0 30.2 28.0 6.1 . 6 . 2 . 2 .2Cable s p l i c e r s .................................. 21,592 20,597 995 40.0 8.51 X . 1 1.2 1 .8 2.3 1 . 1 1.3 1.6 3.7 5.0 14.0 27 .2 33.8 6.0 . 4 . 1 . 1 . 1
Cable splicers' h e l p e r s ...................... 417 326 91 40.0 6.21 2.2 3.8 20.1 9.8 5.3 2.9 2.9 14.4 19.4 3.6 7.9 2.9 4.3 .5 “ ” -O t h e r s ............................................. 1, 180 1,067 113 39.9 9.53 .4 .4 .7 .2 2.9 .5 .5 .6 3.4 1.2 .9 12.9 25.6 11.1 13.1 12.2 7.9 5.6
L a b o r e r s ............................................. 130 1 16 14 33.5 6. 18 - 13. 1 20.0 4.6 7.7 3. 1 19.2 .8 - 31.5 - - - - ' - - -Building, supplies, an d mo t o r ve h i c l e e m p l o y e e s ............................................. 25,489 18,946 6,543 39.2 7.79 r . 5 1.7 , 3. 1 3.1 4.5 6.3 8.9 8.1 10.3 11.6 “ 7,5 ; 8.0 9.4
■*i-; 3 . 5 1.9 1.8 4.5
Supervi s o r s ......................................... 3, 148 2,731 417 39.7 10.65 X X . 1 . 1 . 1 .2 .7 1.5 1.7 1.8 3.4 5.3 8.6 9.6 11.2 12.1 29.7Meehan i c s ....................................... 4,188 3,870 318 39.8 8.62 .2 .8 1 . 1 1.2 .8 2.9 1.8 3.7 6.4 9.5 7.7 18.4 30.2 9.0 3.0 . 6 .7 2.2Other b u il di ng se rv ic e e m p l o y e e s ............ 6,357 3,734 2,623 37.9 5.91 1.4 4.0 6.9 6.8 12.3 17.8 25.7 10.3 1 1.5 1. 1 .3 .4 . 6 .3 . 1 X . 1 . 2
Other su pplies an d m o to r ve hi cl e7.70 12.4 .9e m p l o y e e s .......................................... 11,796 8,611 3, 185 39.6 .3 1.2 2.5 2.5 2.7 3.0 4.5 10.2 13.3 20.5 9.2 7.0 4.4 3.9 1.0 . 4
All e m pl oy ee s not el s e w h e r e c l a s s i f i e d ....... 957 494 463 22.0 9.29 3.7 13.7 1 1.6 9.8 3.7 5.9 7. 1 2.5 2.6 4.1 8.4 4.1 7.9 .8 .8 1.3 1.6 10.6
‘ Covers 62 telephone carriers which have annual operating revenues exceeding $1,000,000. These carriers are engaged in interstate or 2 See appendix for definition of hours and rates used in this bulletin,foreign communications service using their own facilities or through connection with those of another carrier under direct or indirect common NOTE: Asterisk (*) indicates less than 0.05 percent. Dash (—) indicates that no data were reported. Because of rounding, sums of individualcontrol. items may not equal 100.
Digitized for FRASER http://fraser.stlouisfed.org/ Federal Reserve Bank of St. Louis
Table 2. Bell System telephone carriers:1 Percent distribution of employees in occupational groups by average hourly rates,2December 1978
Pe rcent of e m pl oy ee s receiv in g -
Number of employeesA v er ag e
sc he du le dwe ek lyhour s
Aver ag eho urlyrates
$3.50
$3.99
$4.00
$4.49
$4.50
$4.99
$8 00 $8.50
$8.99
$10. $10. $11. $11.50andover
Oc cu pa t i o n a l gr ou p Total Men Women Unde r$3.50
All em ployees, e x ce pt o f f i c i a l s and10.5m a na ge ri al a s s i s t a n t s ............................ 80 1,462 380,793 420,669 38.4 $8.55 0.1 2.2 3.6 3.0 2.0 2.2 9.4 7.3 5.3 7.0 10. 1 11.6 5.7 2.6 2.0 2.2 13. 1
Pa rt - t i m e em ployees, incl ud in go f f i ci al s an d ma na g e r i a l a s s i s t a n t s ......... 9,342 1,080 8,262 24.3 5.80 - - - - - - - - - - - - - - - - - -
P r of es si on al and s e m i p r of es si on ale m p l o y e e s ............................................ 92,787 63,704 29,083 38.0 13.27 X X X . 1 . 1 . 1 .3 .6 1.0 1.6 2.0 2.3 2.7 6.6 4.4 4.5 6.1 67.5D r a f t e r s ............................................ 1,092 390 702 37.8 7.82 - 1.6 2.4 2.6 3.0 2.8 13.1 13.7 12.2 9.0 6.0 7.1 5.8 7.4 2.2 3.9 1.2 6.0O t h e r s ............................................... 91,695 63,314 28,381 38.0 13.33 X X X X X X . 1 .4 .9 1.5 2.0 2.2 2.7 6.6 4.5 4.5 6.2 68.3
B u si ne ss o f fi ce an d sales e m p l o y e e s ........... 84,449 23,785 60,664 37.9 8.39 . 1 1.6 3.6 4.7 2.6 2.6 3. 1 5.9 17. 1 13.8 8.8 6.8 2.4 4.2 3.4 2.8 2.9 13.8Supervi s o r s ........................................ 8,801 1,621 7,180 38.1 10.92 X - - - X X . 1 .2 .5 1.0 2.3 4.5 10. 1 17.6 12.9 10.2 9.5 31.1N o n s u p e r v i s o r y e m p l o y e e s ....................... 75,648 22, 164 53,484 37.9 8.09 . 1 1.8 4.1 5.2 2.9 2.9 3.4 6.5 19.0 15.3 9.5 7.0 1.5 2.7 2.3 1.9 2.1 11.7
Cl er ic al e m p l o y e e s ................................. 190,752 28,961 16 1,791 38.0 7.22 .2 4.0 3.9 4.4 2.5 3. 1 18.6 20.6 13.4 7.8 3.6 2.5 2.7 2.5 1.6 1.4 1.3 6.0Supervi s o r s ........................................ 18,893 4,852 14,041 38. 1 10.66 X X - X X .2 1.3 3.3 5.3 7. 1 6.5 9.9 12.3 8.8 7.5 7.4 30.4Nonsupervi s o r y .................................... 171,859 24,109 147,750 37.9 6.84 .2 4.4 4.3 4.8 2.8 3.4 20.7 22.7 14.5 8.1 3.2 2. 1 1.9 1.5 .8 .8 .6 3.3
Co mm er ci al d e p a r t m e n t ........................ 30,685 2,468 28,217 37.5 6.29 .2 6.5 6.8 7.5 3.9 4. 1 21.3 21.1 15.9 7.3 3.3 .7 .6 .3 X . 1 X .5Tr af fi c d e p a r t m e n t ............................ 8,483 329 8,154 37.9 6.82 . 1 1.0 1.3 1.8 1.2 1.6 29.2 31.7 18.9 6.9 1.6 1.0 .8 .8 .4 .3 .3 1 . 1Pl ant d e p a r t m e n t ...............................Ac c o u n t i n g d e p a r t m e n t ........................
All other d e p a r t m e n t s ........................ 72,284 13,956 58,328 38.0 7.22 .3 4.2 3.7 4.3 2.7 3.2 16.0 22.2 13.2 8. 1 3.7 3.0 2.8 2.5 1.6 1.4 1.0 6.2Te le p h o n e o p e r a t o r s ................................ 121,982 9,338 112,644 36.3 6.36 . 1 5.5 11.1 6.2 3.6 3.8 28.0 17.8 5.9 4.2 6.4 1.5 1.3 1.4 .8 .6 .5 1.5
Ch ie f o p e r a t o r s ................................... 7,666 450 7,216 38.1 10.23 X X X . 1 - .2 .5 1.0 4.4 10.0 10.7 15.9 12.0 9.7 8.3 6.9 20.2S e rv ic e a s s i s t a n t s an d i n s t r u c t o r s ......... 7,464 258 7,206 36.8 7.27 X X .2 .9 1 . 1 1. 1 12.3 36.4 20.4 7.2 6.3 5.3 2.4 2.2 1.2 1. 1 .6 1.0Ex pe ri e n c e d sw it c h b o a r d o p e r a t o r s ........... 91,844 5,268 86,576 35.9 6.25 . 1 4. 1 6.5 5.6 3.9 4.7 36.0 20 .2 5.8 4.4 7.1 .6 . 1 .6 . 1 X X . 1Op e r a t o r s in t r a i n i n g ........................... 13,888 3,317 10,571 37.0 4.30 .2 21.8 54.3 16.3 5.5 1. 1 .3 . 1 . 1 . 1 X X X X - X - . 1Other sw i t c h b o a r d e m p l o y e e s ................... 1,120 45 1,075 38.0 7.45 .4 .2 .6 .5 .8 10.9 38.8 18.8 11.6 3.5 2.3 1.7 1.3 2.1 .9 1.5 4.2
Construc ti on , installation, an d m a i n t e n a n c e e m p l o y e e s ............................ 289,016 238,476 50,540 39.8 8.87 . 1 .5 1.5 1.3 1.3 1.1 _ 3.1 2.4 2.8 2.3 10-6 22 .4 27.6 9.8 3. 1 2.0 2. 1 5.8Su pe rv i s o r s of t e l e p h o n e cr aft workers.... 38, 144 34,061 4,083 39.9 11.18 X - X X X X X . 1 .2 .5 1.0 1.9 5.9 13.0 11.5 12.4 13.4 39.9Ce ntral o f fi ce cr af t w o r k e r s ................. 1 16,806 76,640 40, 166 39.7 8.39 .2 1.0 1.7 1.3 .9 1.9 7.0 5. 1 5.6 3.8 8.7 20 .2 27.6 9.8 3. 1 .7 .6 .9
Test b o ar d an d r e p e at er w o r k e r s ........... 21,026 17,849 3, 177 39.9 9. 10 X . 1 .3 .4 .4 .6 .9 .6 .6 1.0 6.0 25.8 40.9 15.4 4.1 .9 .8 1. 1Central of fi ce r e p a i r e r s .................... 46,540 42,465 4,075 39.9 9.11 - X .2 .2 .2 .2 .6 .4 .3 .8 9.5 25.8 40 .5 14. 1 5.2 .8 .7 .5O t h e r s ........................................... . 49,240 16,326 32,914 39.3 7.38 .4 2.3 3.6 2.8 1.7 4.0 15.7 1 1.5 12.7 7.9 9. 1 12.5 9.6 3.4 .6 .5 .4 1.2
I n st al la ti on an d e x c h a n g e repaircraft w o r k e r s .................................... 87,804 83,460 4,344 40.0 8.68 X .2 1.5 1.5 2.1 .7 .6 .6 .8 1.2 15.4 29.9 34.3 1 0 .1 , .6 .2 .2 .3PBX an d station i n s t a l l e r s ................. 41,299 38, 129 3, 170 40.0 8.58 X .2 2.0 2.1 3.5 .9 .7 .8 1. 1 1.6 11.9 29.4 34.5 10.4 .2 . 1 . 1 .5E x ch an ge r e p a i r e r s ............................ 27,705 27, 105 600 40.0 8.90 X X .7 .5 .8 .3 .4 .4 .5 .9 14. 1 29 .5 35.0 15.2 1. 1 .2 .3 . 1O t h e r s ............................................ 18,800 18,226 574 40.0 8.58 X .4 1.3 1.6 .8 .6 .5 .5 .7 1.0 25.3 31.5 32.9 1.8 .8 . 1 . 1 . 1
Line, cable, an d co nd ui t cr aft workers.... 46,262 44,315 1,947 40.0 8.55 X .4 2.6 2.0 2.2 .9 .9 1 . 1 1.3 2.0 14.2 30.5 33.0 6.7 .9 .5 .4 .3Line w o r k e r s .................................... 25,754 24,951 803 40.0 8.47 X .6 3.3 2.2 2. 1 .8 .8 1.0 1.2 1.7 16.4 32. 1 30. 1 6.6 .6 .3 .2 .2Ca bl e s p l i c e r s .................................. 19,027 18,048 979 40.0 8.62 X . 1 1.4 1.8 2.4 1 . 1 1 . 1 1.0 1 . 1 2.4 12.3 29 .8 37.9 6.8 .5 .2 . 1 .2Ca bl e splicers' h e l p e r s ..................... 378 292 86 40.0 6. 18 1.3 4.2 21.4 9.8 5.6 2. 1 2.4 15.9 21.4 1.3 6. 1 3.2 4.8 .5 - - - -O t h e r s ............................................ 1, 103 1,024 79 39.9 9.78 - .5 . 1 .8 .5 .4 .5 1.0 1.3 1.0 13.2 27.4 11.9 14.0 13.1 8.4 6.0
L a b o r e r s ............................................Building, supplies, an d m o t o r ve hiclee m p l o y e e s ............................................ 22,253 16,418 5,835 39.2 7.98 .2 1.0 1.5 2.3 4.1 6. 1 9.5 7.1 10.6 12.1 8.1 8.6 10.4 5.8 , 5.8 2. 1 2.0 4.8Supervi s o r s ........................................ 2,714 2,350 364 39.7 10.96 - - - - X . 1 .3 .4 .8 1.0 2.3 3.6 7.8 14.0 9.6 12.3 13.7 34.0Meehani c s . ... . T 7 7 T ............................... 3,520 3,344 176 39 .9 8.83 X . 1 .9 .7 .5 .5 1.3 2.6 5.1 6.5 7.3 21.6 36.0 10.7 3.5 .7 .8 1.3Ot her b u i l d i n g s e rv ic e e m p l o y e e s ............ 5,509 3, 132 2,377 37.9 6. 10 .3 2.0 2.5 5.6 12.7 20.3 29.2 11.6 12.9 1. 1 .3 .3 .4 .4 . 1 . 1 . 1 .2Other su pp li es a n d mo t o r v e h i cl ee m p l o y e e s .......................................... 10,510 7,592 2,918 39.6 7.87 .2 1. 1 1.5 1.7 1.8 2.1 4.2 8.0 13.8 22.5 13.9 10.0 7.8 4.9 4.3 1. 1 .4 .8
All e m p l oy ee s not el s e w h e r e c l a s s i f i e d ..... . 223 111 1 12 36.8 1 1.81 .9 .4 .9 2.2 .9 3. 1 5.4 4.0 6.3 12.6 3.6 1.3 4.5 3.6 1.3 2.2 3.6 43.0
1 Covers 25 non-Bell telephone carriers which have annual operating revenues exceeding $1,000,000. These carriers are engaged in interstate or 2See appendix for definitions of hours and rates used in this bulletin,foreign communications service using their own facilities or through connection with those of another carrier under direct or indirect common NOTE: Asterisk (*) indicates less than 0.05 percent. Dash ( - ) indicates that no data were reported. Because of rounding, sums of individualcontrol. items may not equal 100.
Digitized for FRASER http://fraser.stlouisfed.org/ Federal Reserve Bank of St. Louis
Table 3. Non-Bell telephone carriers:1 Percent distribution of employees in occupational groups by average hourly rates,2 December 1978Percent of em pl oy ee s rece iv in g -
Number of employeesAverage
scheduledweeklyhours
Averageho urlyrates
$3.50
$3.99
$4.00
$4.49
$4.50
$4.99
$5.00
$5.49
$5.50
$5.99
$6.00
$6.49
$7.00
$7.49
$7.50
$7.99
$8.00
$8.49
$8.50
$8.99
$9.00
$9.49
$9.50
$9.99
$10. $10. $11. $11.50andover
O c cu pa ti on al gr ou p Total Men Ulomen Under$3.50
$6.99
oo
$10.49
50
$10.99
0 0
$11.49
All employees, ex cept of f i c i a l s andma na ge ri al a s s i s t a n t s .............., ............. . 68,596 37,073 31,523 39.0 $7.02 2.5 5.7 5.9 7.0 10.8 8.7 6.1 5.4 8.2 8.1 8.1 8.5 3.6 2.4 2. 1 1.6 1.4 4.0
P a rt -t im e employees, incl ud in go f fi ci al s an d m a n a ge ri al a s s i s t a n t s ......... 3,269 481 2,788 19.7 4.06 - - - - - - - - - - - - - - - - - -
Pr of es si on al and semi pr of es s i o n a l7,834 5,837 1,997 40.0 9.58 . 1 .6 1.0 1.0 2. 1 2.7 3.2 5.3 6.6 6.9 6.2 7. 1 7.6 7.3 6.9 6.3 6.9 22.0
B u si ne ss o f fi ce an d sales e m p l o y e e s ........... 5,596 813 4,783 38.5 6. 45 .5 7.3 6.7 5.8 15.8 14.6 20.7 5.2 3.6 1.8 2.0 2.7 3.0 2.4 2.4 1.5 1.2 2.7Supervi s o r s ......................................... 765 324 441 40.0 9.34 .4 - . 1 .4 .7 2.4 2.2 2.9 4.8 8.8 10.6 12.3 13.6 10.3 9.9 5.5 4. 1 11.1No n s u p e r v i s o r y e m p l o y e e s ....................... 4,831 489 4,342 38.3 5.97 .5 8.5 7.7 6.7 18.2 16.6 23.6 5.6 3.4 .7 .6 1.2 1.3 1.2 1.2 . 9 .7 1.4
Clerical e m p l o y e e s .................................. 13, 108 1,522 11,586 38.9 5.42 4.7 10.2 10.7 14.4 18.7 19. 1 9.3 2.5 2.2 2.3 1.3 1 . 1 1 . 1 . 9 .4 . 4 .2 . 7Supervi s o r s ......................................... 631 375 256 40.2 8.88 - .2 .3 .6 2.5 4.3 4.3 9.7 6.7 5. 1 6.2 12.7 10.3 10.5 4.9 6.8 4.0 11.1Nonsupervi s o r y ..................................... 12,477 1,147 11,330 38.8 5.24 4.9 10.7 11.2 15. 1 19.5 19.8 . 9.5 2. 1 2.0 2.2 1.0 .6 . 6 .4 .2 . 1 X . 1
Comm er ci al d e p a r t m e n t ........................ 2,373 84 2,289 37.7 4.92 4.2 13.7 13.6 22 .9 19.3 14.0 10.6 .5 .6 . 1 . 1 X . 1 . 1 . 1 - - -Tr affic d e p a r t m e n t ............................ 973 40 933 37.6 ‘ 5.37 13.3 7. 1 5.9 17.8 24.4 9.1 13.3 1.6 .5 .3 .3 .4 2.7 2.1 .5 . 3 . 1 .4Plant d e p a r t m e n t ............................... 4,524 642 3,882 39.2 5.35 4. 1 10.4 10.5 13.5 17.7 22.0 7.9 2.0 3.3 5.2 2.0 .9 .2 . 1 X X . 1 . 1Ac c o u n t i n g d e p a r t m e n t ........................ 1,625 80 1,545 39.2 5.27 4.5 9.8 10.8 12.4 23.6 21.9 10. 1 1.4 1.2 .9 .6 .9 .4 1 . 1 .2 - - .2All other d e p a r t m e n t s ........................ 2,982 30 1 2,681 39.3 5.24 4. 1 10.5 12.5 11.8 18.7 23.6 9.6 4.0 2.0 .5 .6 .3 .9 .3 .2 . 1 . 1 .2
T e le ph on e o p e r a t o r s ................................ 10,911 460 10,451 38.0 5. 17 8.2 15.2 11.4 13.4 24.0 12.5 4.0 2.6 1.2 1.0 .9 .9 1.5 1.6 .9 .2 . 1 .4Ch ief o p e r a t o r s ................................... 687 30 657 40.0 8.06 .3 - .3 - .4 4.5 10.3 20.7 12.8 9.8 10.5 8.6 5.5 3.3 3.2 1.9 2.0 5.8Serv ic e as s i s t a n t s an d i n s t r u c t o r s ......... 510 44 466 39.9 6.51 .2 1.8 2.5 7.5 16.1 13.9 20.4 8.2 7.1 5.9 3.5 2.7 1.6 1.6 5.3 1.6 .2 -E x pe ri en ce d sw it c h b o a r d o p e r a t o r s ........... 9,446 36 1 9,085 37.7 4.80 9. 1 17.4 12.8 14.8 26.8 13.4 2.7 .9 - X - - . 1 1.5 .5 X X -Op er a t o r s in t r a i n i n g ........................... 171 17 154 39.5 8.40 9.4 - 11.7 - - - - - - - - 16.4 62.6 - - - - -Other s w i t ch bo ar d e m p l o y e e s ................... 97 8 89 37.9 6.57 8.2 6.2 4.1 19.6 2.1 - 11.3 18.6 10.3 7.2 5.2 2. 1 - - - - - 5.2
Co ns truction, installation, andma in t e n a n c e e m p l o y e e s ............................ 27,177 25,530 1,647 39.9 7.92 . 1 .3 1.4 2.6 3.7 2.8 3.5 7.0 15.4 15.7 16.5 17.2 4.7 2.1 2.0 1.5 1. 1 2.3Su pe rv i s o r s of te l e p h o n e cr aft w o r k e r s . ... 3,421 3,265 156 39.9 9.97 X . 1 - - - - . 1 .7 2.0 2.5 6.2 10.7 15.2 16.7 15.5 12. 1 8.5 9.7Central of fi ce cr aft w o r k e r s .................. 8,212 7,288 924 39.9 7.79 X 1.0 1.3 3.0 2.9 3.0 3.9 15.4 21 .9 10.2 30.2 6.6 . 1 X X . 1 X
Test b o a r d and r e pe at er w o r k e r s ........... 858 674 184 40.0 7.61 - - . 1 .7 4.2 1.7 3.1 7.0 21.6 25.6 22.0 7.0 6.6 .2 - - - -Central o f fi ce r e p a i r e r s .................... 4,018 3,705 313 40.0 7.70 X .2 .4 1.2 2.0 2.6 3.3 4.5 22.2 28.2 8.4 20.1 6.8 - - X X XO t h e r s ............................................. 3,336 2,909 427 39.9 7.96 - .7 1.9 1.5 3.8 3.7 2.5 2.5 5.5 13.4 9.4 48.5 6.2 . 1 . 1 . 1 . 1 -
In st al la ti on and e x c h a n g e repa ircraft w o r k e r s ..................................... 10,803 10,315 488 40.0 7.70 X .2 1 . 1 3.2 4.6 3.1 4.0 10.8 17.9 13.5 23.3 14.3 1.2 - - - - 2.8PBX and st ation i n s t a l l e r s .................. 5,603 5,546 57 40.0 7.41 - .2 1.7 3.6 5.0 3.2 4.6 15.7 14.5 5.7 32.1 1 1.6 2.0 - - - - -Exch an ge r e p a i r e r s ............................ 1,738 1,632 106 40.0 7.64 - .3 .2 3.6 4.3 3.3 2.8 2.5 34. 1 4.5 3.3 41.0 . 1 - - - - -O t h e r s ............................................. 3,462 3, 137 325 39.8 8.19 . 1 X .7 2.4 4.2 2.8 3.7 6.9 15.3 30.7 19.0 5.2 .4 - - - - 8.7
Line, cable, an d co nd ui t craft wo rk er s. .. . 4,6 11 4,546 65 40.0 7. 18 .2 .3 3.2 5.6 5.7 4.2 5.3 8.3 20.0 19.0 19.8 6.2 2.0 - - - - -Line w o r k e r s ..................................... 1,930 1,920 10 40.0 6.54 .6 7.0 11.5 9.7 7.8 8.6 1 1.8 16.1 12.4 10.6 3.8 . 1 - - - - -Cabl e s p l i c e r s .................................. 2,565 2,549 16 40.0 7.70 - .2 1.3 1.9 1.5 2.9 6.1 22.8 24.4 27.3 8.1 3.5 - - - - -Cable splicers' h e l p e r s ...................... 39 34 5 40.0 6.51 10.3 - 7.7 10.3 2.6 10.3 7.7 - - 25.6 25.6 - - - - - - -O t h e r s ............................................. 77 43 34 40.0 5.97 6.5 6.5 3.9 1.3 32.5 - 2.6 1.3 37.7 - - 7.8 - - * - -
L a b o r e r s ............................................. 130 116 14 33.5 6. 18 13. 1 20.0 4.6 7.7 3. 1 19.2 .8 - 31.5 - - - - - - - -Building, supplies, a n d mo t o r ve h i c l ee m p l o y e e s .............................................Supervi s o r s .........................................
Mech ani c s . .......................................... 668 526 142 39.5 7.48 1.0 4.5 1.9 3.7 2.1 15.6 4.3 9.4 13.5 25.1 9.9 1 .8 - - - - - 7.0Other b u i l di ng s e rv ic e e m p l o y e e s ............ 848 602 246 38.0 4.70 8.5 17.2 35.8 14.6 9.9 1.4 2.4 1.8 2.8 1. 1 .4 1.5 1.5 . 1 .2 - .4 .4Other supp li es an d m o t o r ve h i c l ee m p l o y e e s .......................................... 1,286 1,019 267 39.5 6.29 1.0 2.6 10.5 8.9 10. 1 11.0 7.2 28.7 9.4 4.1 .4 2.6 .2 .2 .2 .2 .4 2.1
All e m pl oy ee s not e l s e w h e r e c l a s s i f i e d ....... 734 383 351 17.5 7.68 4.5 17.7 14.9 12. 1 4.5 6.7 7.6 2.0 1.5 1.5 9.8 4.9 9.0 .7 1.0 1.0 .7
1 Covers 37 non-Bell telephone carriers which have annual operating revenues exceeding $1,000,000. These carriers are engaged in interstate or 2See appendix for definitions of hours and rates used in this bulletin,foreign communications service using their own facilities or through connection with those of another carrier under direct or indirect common NOTE: Asterisk (*) indicates less than 0.05 percent. Dash (—) indicates that no data were reported. Because of rounding, sums of individualcontrol. items may not equal 100.
Digitized for FRASER http://fraser.stlouisfed.org/ Federal Reserve Bank of St. Louis
Table 4. All and Bell system telephone carriers:1 Average hourly rates 2 of employees in selected occupations by region, December 1978
3 ID Q.
States New E ngland Midd le Atlantic Great Lakes C h es ap ea ke Southe as t No rth Central So uth Central Moun tai n P a c :ificO c cu pa ti on al gr ou p Number
ofwo rkers
Averagehourlyrates
Numberof
wo rkers
Averagehourlyrates
Numberof
w o r k er s
Av eragehourlyrates
Numberof
work er s
Aver ag ehourlyrates
Numberof
w o r k er s
Av eragehourlyrates
Numberof
w o r k er s
Av erageho urlyrates
Numberof
wo rk er s
Aver ag eho urlyrates
Numberof
wo rk er s
Aver ag eho urlyrates
Numberof
w o r k er s
Averagehourlyrates
Numberof
workers
Averagehourlyrates
A l l c a r r i e r s
All employees, ex cept of f i c i a l s andma na ge ri al a s s i s t a n t s ............................
P a rt -t im e em pl oyees, in cluding870,058 $8.43 52,857 $8.90 136,024 $9.48 137,144 $8.25 48, 108 $8.24 141,122 $7.82 28,926 $7.94 96, 123 $7.75 48, 125 $7.84 131,023 $8.24
o f f i ci al s an d m a n a ge ri al a s s i s t a n t s ......... 12,611 5.42 2,060 5.46 2,075 6.17 2,210 5.36 556 5. 18 768 4.89 491 5.99 765 4.68 1, 126 4.82 2,219 5.54P r of es si on al an d s e m i pr of es si on ale m p l o y e e s ............................................ 100,621 12.97 6,742 13.27 15,598 14.91 16,517 12.06 4,868 12.43 13,317 12.12 3, 102 1 1 .87 9, 137 1 1.68 5,074 12.18 13,599 12.63D r a f t e r s ............................................. 1,656 7.36 58 7.79 133 9.09 258 7.04 105 6.64 198 6.58 35 5. 89 266 6.48 82 7.07 195 7.63O t h e r s ............................................... 98,965 13.06 6,684 13.31 15,465 14.96 16,259 12. 14 4,763 12.57 13,119 12.21 3,067 11.93 8,87 1 1 1 .84 4,992 12.26 13,404 12.71
B u si ne ss o f fi ce an d sales e m p l o y e e s ........... 90,045 8.27 4,885 8.83 14,821 9.60 14,291 7.90 4,729 8.52 . 14,319 7.86 3,083 7.99 11,670 7.30 5,468 7.47 14,302 8.25Supervi s o r s ........................................ 9,566 10.78 457 11.38 1,591 12.50 1,419 10.53 644 10.97 1,514 9.99 354 11.10 1,350 9.87 484 9.96 1,581 10.84N o n s u p e r v i sory e m p l o y e e s ....................... 80,479 7.97 4,428 8.57 13,230 9.25 12,872 7.60 4,085 8.13 12,805 7.60 2,729 7.59 10,320 6.96 4,984 7.23 12,721 7.93
Cl erical e m p l o y e e s .................................. 203, 860 7. 10 13,188 7.49 30,442 8.08 30,329 6. 94 11,282 7. 14 29,691 6.49 7,240 6.74 21,901 6.30 13, 154 6.66 31,000 7.01Supervi s o r s ........................................ 19,524 10.60 1,169 11.35 3,463 11.88 3,034 10.49 832 10.67 2,746 9.43 784 9.92 1,940 9.84 1,358 9.97 2,80 1 10*70Nonsupervi s o r y .................................... 184,336 6.73 12,019 7.11 26,979 7.59 27,295 6.54 10,450 6.85 26,945 6. 19 6,456 6.35 19,961 5.96 11,796 6.27 28, 199 6.64
C o mm er ci al d e p a r t m e n t ........................ 33,058 6.19 2,134 6. 55 4,876 7 . 14 4,443 5.94 2,015 5.97 4,935 5.86 1, 186 5.84 4,158 5.74 2,339 5.69 5,951 6.28T r a f fi c d e p a r t m e n t ............................ 9,456 6.67 524 7.00 1,389 7.58 1,377 6.31 360 6.7 1 1,519 6.46 502 6.41 1,260 6.25 686 6.31 1,451 6.79Plant d e p a r t m e n t ............................... 35,596 6.28 2,129 6.70 5,204 7. 14 5,625 6.46 1,821 6.30 6,630 5.94 1,007 6.00 4,517 5.59 1,767 5.67 5,595 6.16A c c o u n t i n g d e p a r t m e n t ........................ 30,960 6.84 2,417 7.06 6,017 7.57 4,786 6.42 1,535 6.72 3,731 6.36 912 6.50 2,872 6.11 1,560 6.51 4,424 6.70All ot he r d e p a r t m e n t s ........................ 75,266 7.14 4,815 7.58 9,493 8.08 11,064 6.90 4,7 19 7.51 10,130 6.41 2,849 6.61 7, 154 6.20 5,444 6.64 10,778 7.05
T e le ph on e o p e r a t o r s ................................ 132,893 6.26 8,236 6.62 19,341 7.25 21,111 6.06 7,141 6.05 24,324 5.97 4,994 6.09 14,981 6.26 7,597 5.88 2 1,607 6.04Ch ief o p e r a t o r s ................................... 8,353 10.04 570 11.02 1,040 11.74 1,256 9.60 409 10. 13 1,714 9.33 294 10.63 1,0 98 9.29 472 9.75 1,308 10.15S e rv ic e a s s i s t a n t s an d i n s t r u c t o r s ......... 7,974 7.21 593 7.46 1,549 7.87 1,528 7.03 402 6.70 830 7. 14 417 6.84 753 7. 25 389 7.04 1,327 6.89Ex pe ri e n c e d s w i t ch bo ar d o p e r a t o r s ........... 101,290 6.11 6,524 6.25 15,474 7.01 16,217 5.88 6,043 5.77 19,886 5.78 3,600 5.93 1 1,414 6. 14 5,708 5.76 13,536 6 .20O p er at or s in t r a i n i n g ........................... 14,059 4.36 445 4.02 958 4.74 1,996 4.32 221 4.37 , 1,683 3.96 632 4.24 1,602 4.31 1,019 4. 17 5,231 4.37Ot her sw i t c h b o a r d e m p l o y e e s ...................
ma i n t e n a n c e e m p l o y e e s ............................ 316, 193 8.79 17,829 9.31 50,674 9.57 48,678 8.86 18,577 8.62 56,607 8.28 9,581 8.47 36,743 8.34 15,571 8.45 47,018 8.72Su pe rv i s o r s of t e l e ph on e craf t workers.... 41,565 11.08 2,315 11.88 6,725 12.11 6,325 11.20 2,358 10.86 7,402 10.25 1,277 11.00 4,555 10.64 2, 167 10.73 6,573 11.05Central of fi ce craft w o r k e r s ................. 125,018 8.35 7,6 11 8.80 19,648 8.91 18, 117 8. 34 6,786 8.14 19,846 7.78 3,371 7.94 13,318 8.03 5,857 8.01 19,225 8.29
Test bo ar d and repe at er w o r k e r s ........... 21,884 9.04 1,292 9.42 2,885 9.68 2,499 9.00 833 9. 12 3,078 8.54 423 8.87 1,984 8.83 721 8.87 3,276 9.07Central o f fi ce r e p a i r e r s .................... 50,558 9.00 2,550 9.39 8,405 9.59 7,910 8. 93 3,296 8.86 6,993 8.6 1 1,493 8.70 6,022 8.68 2,236 8.74 6,679 9 15O t h e r s ............................................
I n st al la ti on and e x ch an ge repair52,576 7.42 3,769 8.17 8,358 7.91 7,708 7.52 2,657 6.93 9,775 6.94 1,455 6.88 5,312 7.01 2,900 7.23 9,270 7.* 37
craft w o r k e r s .................................... 98,607 8.58 5,381 9.00 16,877 9.41 16,259 8.67 6,475 8.41 18,061 8.13 3, 179 8.29 12,136 8. 16 4,917 8.21 14,317 8.37PBX and station i n s t a l l e r s ................. 46,902 8.44 2,334 8. 93 7,670 9.43 7,262 8.75 3,291 8.15 9,10 1 8. 06 888 8.51 6,365 7.92 1,916 7.96 7,572 8.17Ex ch an ge r e p a i r e r s ............................ 29,443 8.83 1,650 9.06 5,703 9.52 5,283 8.73 1,570 8.96 5,709 8.29 415 8.65 3,508 8.68 998 8.55 4,514 8.81O t h e r s ............................................ 22,262 8.52 1,397 9.04 3,504 9. 17 3,7 14 8.43 1,6 14 8.41 3,251 8.06 1,876 8.11 2,263 8.02 2,003 8.28 2,231 8.14
Line, cable, an d cond ui t craf t workers.... 50,873 8.42 2,522 9. 13 7,424 9.36 7,848 8. 62 2,958 8.42 11,298 8.07 1,754 7.97 6,734 7.72 2,630 8.02 6,902 8.44Line w o r k e r s .................................... 27,684 8.33 1,459 9.08 4,212 9.33 4,245 8. 58 1,567 8.27 6,562 7.89 936 7.89 3,411 7.58 1,471 7.99 3,243 8.36Ca ble s p l i c e r s .................................. 21,592 8.51 928 9. 13 2,998 9.41 3,275 8.77 1,357 8.57 4,341 8. 35 80 1 8.04 3,272 7.88 1,092 8.02 3,307 8.37Cable s p l i c e r s 1 h e l p e r s ...................... 417 6.21 21 6.41 67 7.31 92 5.59 12 8.30 157 5.84 1 5.65 43 5.62 24 7 ! 74O t h e r s ............................................ 1, 180 9.53 1 14 10.37 147 10.27 236 8.49 22 9.76 238 9.43 16 8.83 8 8.69 67 8.40 328
110.03
L a b o r e r s ............................................Building, supplies, and m o to r v e hi cl e
130 6. 18 ” “ ‘ “129 6.20 “ ” ~ " “ 4.00
e m p l o y e e s ............................................ 25,489 7.79 1,976 8. 11 5, 129 8.25 6, 185 7.55 1,505 7.36 2,858 7.24 926 7.58 1,691 7. 10 1,259 7.66 2,896 8.28Supervi s o r s ........................................ 3, 148 10.65 245 11.41 629 11.94 779 10.41 248 9.70 337 9.51 79 10.49 182 9.78 177 10.07 378 10.82M e c h a n i c s ........................................... 4, 188 8.62 231 8.50 843 9.41 902 8.38 180 8.40 385 7.24 147 8.32 284 8.48 167 7.79 599 8.49Other b u i l d i n g serv ic e e m p l o y e e s ............Other s u pp li es an d mo to r v e hi cl e
e m p l o y e e s .......................................... 11,796 7.70 873 8. 15 1,999 8.25 2,564 7.75 720 7.40 1,743 7.28 336 8.08 1,031 6. 54 755 7.35 1,560 8.02All e m p l oy ee s not el se w h e r e c l a s s i f i e d ....... 957 9.29 1 6.32 19 9.41 33 6.39 6 11.24 6 8.06 " ~ 2 9.70 601 7.20
See fo ot n o t e s at end of table.
Digitized for FRASER http://fraser.stlouisfed.org/ Federal Reserve Bank of St. Louis
Table 4. Continued—All and Bell system telephone carriers:1 Average hourly rates,2 of employees in selected occupations by region, December 1978
’Jn i ted States New England M i d d l e At la nt ic Great Lakes Ch es ap ea ke Southe as t No rth Central So uth Central Mo un ta i n Pacific
O c cu pa ti on al group Nu mberof
wo rk er s
Averagehourlyrates3
Numberof
wo rkers
Averagehourlyrates
Numberof
wo rk er s
Av erageho urlyrates
Numberof
wo rk er s
Av eragehourlyrates
Numberof
w o rk er s
Averagehourlyrates
Numberof
w o r k er s
Av eragehourlyrates
Numberof
wo rk er s
Averagehourlyrates
Numberof
wo rk er s
Averagehourlyrates
Numberof
wo rkers
Aver ag ehour lyrates
Numberof
wo rk er s
Averagehourlyrates
B e l l s y s t e m t e l e p h o n e c a r r i e r s
All employees, except o f f i ci al s andm a na ge ri al a s s i s t a n t s ............................ 801, 46 2 $8.55 52,813 $8.90 135, 138 $9.50 1 16,214 $8.54 41,453 $8.54 128,570 $7.87 28,732 $7.95 86 ,255 $7.89 47,204 $7.86 120,625 $8.32
P a r t -t im e employees, in cludingo f f i ci al s and m a n a ge ri al a s s i s t a n t s ......... 9,342 5.80 2,057 5.46 2,030 6.21 1,364 6. 10 312 6.34 444 5.62 472 6.07 294 5.82 1, 106 4. 83 1,057 6.36
Prof es si on al and semi pr of es si on al e m p l o y e e s ............................................ 92,787 13.27 6,739 13.27 15,529 14.94 14,041 12.56 4, 1 14 13.32 12,057 12.35 3,083 11.89 7,907 12.08 4,972 12.23 12,419 12.94D r a f t e r s ............................................. 1,092 7.82 58 7.79 131 9. 15 144 8.40 75 6.90 127 6.53 29 6.21 32 6.19 82 7.07 119 7.97
No ns u p e r v i s o r y e m p l o y e e s ....................... 75,648 8.09 4,416 8.58 13, 175 9.26 11,287 7.89 3,875 8.21 11,831 7.70 2,727 7.59 9,476 7. 12 4,924 7.24 12,058 8.0 1Clerical e m p l o y e e s .................................. 190,752 7.22 13,185 7.49 30,260 8.10 25,977 7.20 10,133 7.39 27,678 6.57 7, 190 6.75 19,824 6.44 12,985 6.67 29,006 7. 10
Supervi s o r s ........................................ 18,893 10.66 1, 169 11.35 3,462 1 1 .88 2,708 10.65 816 10.72 2,700 9.46 784 9.92 1,783 9.99 1,355 9.97 2,782 10.71Nonsup er v i s o r y .................................... 171,859 6.84 12,016 7.11 26,798 7.61 23,269 6.79 9,317 7. 10 24,978 6.26 6,406 6.36 18,041 6.08 11,630 6.28 26,224 6.72
Co mm ercial d e p a r t m e n t ........................ 30,685 6.29 2, 134 6.55 4,852 7. 15 3,623 6.22 1,509 6.41 4,672 5.91 1, 160 5.87 4,049 5.77 2,316 5.70 5,396 6.38Tr affic d e p a r t m e n t ............................ 8,483 6.82 524 7.00 1,375 7.6 1 1,071 6.78 333 6.79 1,418 6.57 499 6.42 1,030 6.58 674 6.31 1,312 6.82Plant d e p a r t m e n t ............................... 31,072 6.42 2, 126 6.70 5, 141 7. 17 4,210 6.73 1,557 6.50 5,733 6.03 998 6.01 3,673 5.83 1,7 14 5.66 4,823 6.26A c c o un ti ng d e p a r t m e n t ........................ 29,335 6.93 2,417 7.06 5,972 7.59 4,277 6.62 1,4 17 6.87 3,538 6.42 912 6.50 2,603 6.22 1,550 6.51 4, 156 6.78All other d e p a r t m e n t s ........................ 72,284 7.22 4,815 7.58 9,458 8.09 10,088 7 . 10 4,50 1 7.64 9,6 17 6.47 2; 837 6.62 6,686 6.29 5,376 6.67 10,537 7.08
T e l e ph on e o p e r a t o r s ................................ 121,982 6.36 8,236 6.62 19,195 7.26 17,734 6.30 5,728 6.34 22,272 6.05 4, <153 6. 10 13,899 6.37 7,451 5.90 20,026 6.11Chief o p e r a t o r s ................................... 7,666 10.23 570 11.02 1,024 1 1.82 1,015 10. 14 370 10.38 1,547 9.47 292 10.65 1,034 9.39 464 9.79 1,221 10.30S e rv ic e a s s i st an ts an d i n s t r u c t o r s ......... 7,464 7.27 593 7.46 1,544 7.88 1,386 7.06 173 7.47 80 1 7.21 415 6.85 7 19 7.33 381 7.07 1,313 6.90E x pe ri en ce d s w i t ch bo ar d o p e r a t o r s ........... 91,844 6.25 6,524 6.25 15,349 7.03 13,228 6.20 4,899 6.07 18,083 5.87 3,600 5.93 10,430 6.27 5,592 5.78 12,058 6.35O p er at or s in t r a i n i n g ........................... 13,888 4.30 445 4.02 958 4.74 1,992 4.32 221 4.37 1,671 3.97 632 4.24 1,602 4.31 1,005 4.19 5,231 4.37Other s w it ch bo ar d e m p l o y e e s ................... 1,120 7.45 104 7.6 1 320 7.77 1 13 7.51 65 7.38 170 7.62 14 7.65 1 14 6.61 9 8.67 203 7.15
Co nstruction, installation, andma in t e n a n c e e m p l o y e e s ............................ 289,016 8.87 17,804 9.31 50,305 9.58 40,884 9. 1 1 15,871 8.85 51,127 8.26 9,512 8.48 32,595 8.51 15, 175 8.48 43,139 8.76S u pe rv is or s of te le p h o n e craft wo rk ers.... 38, 144 11.18 2,312 1 1.88 6,682 12.12 5,374 11.45 1,975 11.23 6,624 10.22 1,265 11.02 4,063 10.81 2, 128 10.75 6,115 11.11Central offi ce craft w o r k e r s .................. 1 16,806 8.39 7,603 8.80 19,536 8.92 15,638 8.46 5,954 8.25 18,093 7.74 3,352 7.94 12,207 8.13 5,700 8.00 18,283 8.30
Test bo ard and repe at er w o r k e r s ........... 21,026 9. 10 1,291 9.42 2,878 9.68 2, 192 9.24 767 9.27 2,866 8.6 1 422 8.88 1,885 8.91 7 14 8.87 3, 162 9.09Central of fi ce r e p a i r e r s .................... 46,540 9. 1 1 2,544 9.39 8,306 9.60 6,326 9.23 2,553 9.29 6,706 8.69 1,493 8.70 5,57 1 8.80 2,096 8.78 6,350 9.19O t h e r s ............................................. 49,240 7.38 3,768 8.17 8,352 7. 92 7, 120 7.53 2,634 6.94 8,521 6.69 1,437 6.87 4,751 7.03 2,890 7.22 8,771 7.35
Inst al la ti on an d e x ch an ge repaircraft w o r k e r s .................................... 87,804 8.68 5,374 9.00 16,736 9.42 13,360 8.99 5,455 8.70 15,826 8. 15 3, 152 8.30 10,548 8.38 4,783 8.26 12,553 8.42PBX and st ation i n s t a l l e r s ................. 41,299 8.58 2,334 8.93 7,548 9.45 6,488 8.95 2,526 8. 62 7,190 8.05 888 8.51 5,243 8.22 1,796 8.06 7,286 8.15Exch an ge r e p a i r e r s ............................ 27,705 8.90 1,650 9.06 5,703 9.52 4,362 9. 12 1,570 8.96 5,709 8.29 415 8.65 3,502 8.68 990 8.57 3,804 8.88O t h e r s ............................................. 18,800 8.58 1,390 9.04 3,485 9.18 2,510 8.88 1,359 8.56 2,927 8.09 1,849 8. 12 1,803 8.26 1,997 8.29 1,463 8.53
Line, cable, an d co nduit craft work er s. .. . 46,262 8.55 2,515 9. 13 7,351 9.38 6,512 8.96 2,487 8.71 10,584 8.09 1,743 7.97 5,777 7.93 2,564 8.05 6, 188 8.51L i ne w o r k e r s .............................. .... 25,754 8.47 1,455 9.08 4, 173 9.35 3,632 8.91 1,343 8.56 6,356 7.91 931 7.90 3,008 7.87 1,441 8.04 2,926 8.48Cable s p l i c e r s .................................. 19,027 8.62 925 9. 13 2,964 9.43 2,624 9.11 1,110 8.88 3,840 8.39 796 8.04 2,721 8.02 1,063 8.02 2,932 8.37Cable splicers' h e l p e r s ...................... 378 6.18 21 6.41 67 7.31 86 5.64 12 8.30 150 5.93 - - 40 5.64 - - 2 5.59O t h e r s ............................................. 1, 103 9.78 1 14 10.37 147 10.27 170 9.54 22 9.76 238 9.43 16 8.83 8 8.69 60 8.67 328 10.03
L a b o r e r s ........... ................................. - - - - - - - - - - - - - - - - - -Building, supplies, an d m o to r ve hi cl e
1,331 7.32 1,222 7.71 2,474 8.51e m p l o y e e s ............................................ 22,253 7.98 1,976 8. 1 1 5,073 8.27 5,030 7.88 1, 193 7.88 2,268 7.44 915 7.61Supervi s o r s ........................................ 2,7 14 10.96 245 11.41 623 11.96 587 10.95 173 10.77 289 9.57 79 10.49 131 10.07 169 10. 14 349 10.93Mechani c s ....................................... 3,520 8.83 231 8.50 836 9.42 756 8.81 17 1 8.49 133 7.98 147 8.32 269 8.60 164 7. 83 455 8.93
Other bu il d i n g se rv ic e e m p l o y e e s ............ 5,509 6. 10 627 6.54 1,634 6. 22 1,619 5.83 209 5.70 288 5.49 360 6.14 139 5.66 145 6.31 298 6.50Other su pp li es an d m o to r ve hi cl e
7.37 1,372 8.19e m p l o y e e s .......................................... 10,510 7.87 873 8. 15 1,980 8.27 2,068 8.19 640 7.61 1,558 7.35 329 8. 13 792 6.69 744All e m pl oy ee s not e l s e wh er e c l a s s i f i e d ....... 223 11.81 1 6.32 19 9.41 3 7.26 6 11.24 6 8. 06 26 8.36
1 Covers telephone carriers which have operating revenues exceeding $1,000,000. These carriers are engaged in interstate or foreign communications service using their own facilities or through connection with those of another carrier under direct or indirect common control.
2 See appendix for definition of hours and rates used in the bulletin.3 Includes data for employees in Alaska, Hawaii, Puerto Rico, and the Virgin Islands, and employees of the American Telephone and Telegraph
Company, which are excluded from the regional tabulations. (For scope of survey, see appendix.)
NOTE: For purposes of this study, the regions for which separate data are presented include: New England-Connecticut, Maine, Massachusetts,
New Hampshire, Rhode Island, and Vermont; Middle At/anf/c-Delaware, New Jersey, New York, and Pennsylvania; Great Lakes— Illinois, Indiana, Michigan, Ohio, and Wisconsin; Chesapeake— District of Columbia, Maryland, Virginia, and West Virginia; Southeast— Alabama, Florida.Georgia, Kentucky, Louisiana, Mississippi, North Carolina, South Carolina, and Tennessee; North Central-Iowa, Minnesota, Nebraska, North Dakota, and South Dakota; South Central-Arkansas, Kansas, Missouri, Oklahoma, and Texas (except El Paso County); Mountain-Ariiona, Colorado, Idaho (south of the Salmon River), Montana, Nevada, New Mexico, Texas (El Paso County), Utah, and Wyoming; and Pacific—California, Idaho (north of the Salmon River), Oregon, and Washington.
Dash (—) indicates that no data were reported.
Digitized for FRASER http://fraser.stlouisfed.org/ Federal Reserve Bank of St. Louis
Table 5. Western Union Telegraph Company: Percent distribution of employees1 in occupational groups by average hourly rates, October 1978
Percent of employeei receiving -
O c c u pa ti on al gr oupNumber of employees Aver ag e
Total Men Women we ek lyhours 3.99 $4.49 $4.99 $5.49 $5.99 $6.49 $6.99 $7.49 $7.99 $8.49 $8.99 $9.49 $9.99
$10 . 49
$10.99
$11.49
50ANDOVER
All e m p l oy ee s ex ce pt officials, ma nagerial assistants, and m e s s e n g e r s ....................... 11,283 6,788 4,495 38.6 $7.84 0.2 0.9 1.4 2. 1 8.6 9.4 10.4 7.3 7.8 6.0 4.8 19.8 7.7 2.5 1.9 1.6 1 . 1 6.6
Prof es si on al an d semi prof es si on al e m p l o y e e s .............................................. 1,092 901 191 37. 1 11.11 _ . 1 . 1 .3 .2 1.5 1.4 5.6 4.5 6.0 2.0 4. 1 3.8 5.5 5.9 6.5 6.4 46.2Engine er s and e n g i n e e r i n g a s s i s t a n t s ........ 282 269 13 37.0 11.28 - .4 .4 1. 1 - .7 .4 .7 4.3 4.6 2.8 5.3 3.5 7.4 7.8 6.4 8.2 46. 1O t h e r s ................................................ 810 632 178 37.2 11.05 - - - - .2 1.7 1.7 7.3 4.6 6.5 1.7 3.7 4.0 4.8 5.2 6.5 5.8 46.2
T e le gr ap h o f fi ce su p e r i n t e n d e n t s and m a n a g e r s ................................... ........... 430 264 166 39.8 7.53 _ .2 _ .5 2. 1 5.3 8.6 17.9 17.0 22.8 11.9 4.0 1.4 1.4 2.1 .9 1.4 2.6
Sales e m p l o y e e s ....................................... 508 397 1 1 1 36.6 7.39 - 1.0 7.3 11.2 6.5 5.5 8.3 10.2 9. 1 7.9 4. 1 9. 1 2.6 3.0 3. 1 2.0 1.2 8. 1Cl erical e m p l o y e e s ................................... 2,394 7 13 1,681 36.6 7.04 1.0 1.7 .9 2.4 5. 1 8.6 15.3 16.9 16.4 15. 1 6.5 2.3 2.3 2.2 1. 1 .7 .3 1 . 1
Supervi s o r s ........................................ 513 289 224 37.3 8.46 - - 1.0 .2 .6 - 2.1 6.8 19.3 14.2 15.8 9.6 8.4 8.2 4.7 3.3 1.2 4.7No n s u p e r v i s o r y e m p l o y e e s ....................... 1,881 424 1,457 36.5 6.64 1.3 2.2 .9 3.0 6.4 11.0 18.9 19.6 15.6 15.4 4.0 .3 .6 .5 . 1 .2
Co mm ercial d e p a r t m e n t ........................ 831 145 686 36.5 6.72 - - - .7 7 . 1 11.0 25.8 22.7 18.9 6.3 6.7 . 1 . 1 .4 . 1 _ . 1Tr affic d e p a r t m e n t ............................ 35 6 29 40.0 5.71 - - - 11.4 5.7 80.0 2.9 - - - - - - - - _ _All other d e p a r t m e n t s ........................ 1,014 272 742 36.3 6.61 2.4 4.0 1.7 4.6 5.7 8.7 13.9 17.8 13.4 23.4 1.9 .5 1.0 .7 . 1 - . 1 .2
Route a i d e s ........................................ 1 1 - 40.0 5. 17 - - - - 100.0 - - - - - - - - - - -T e le gr ap h o p e r a t o r s ................................. 2,643 507 2, 136 39.3 6. 10 X 1.9 3.5 3.4 26. 1 27.4 22 .9 6.4 2.6 1.2 .4 1.0 1 . 1 .2 X .2 . 1 1.6
Tr affic ma nagers, ch ief operators, supervisors, and i n s t r u c t o r s ................ 435 223 212 39.6 7.82 _ _.2 1.6 24 .4 29.0 12.4 5.5 2. 1 6.2 6.4 1. 1 .2 .9 .5 9.4
E x pe ri en ce d te le g r a p h oper at or s (except M o r s e o p e r a t o r s ) ..................... 2,070 276 1,794 39. 1 5.86 X _ .2 4.3 33.3 34.6 24. 1 2. 1 .8 .4 . 1
Co mm ercial d e p a r t m e n t ....................... 519 120 399 39.9 5.82 .2 - .8 13. 1 7.3 52.4 18.3 4.6 2.7 .4 .2 - - - - _ _ _Traffic d e p a r t m e n t ........................... 1,551 156 1,395 38.9 5.88 - - . 1 1.4 42.0 28.7 26.0 1.2 . 1 .4 . 1 - - - - _ _ _
O p e r a t o r s - i n - t r a i n i n g ........................... 138 8 130 40.0 4. 16 - 37.0 63.0 - - - - - - - - - - - - _ _ _Construction, installation, and ma in te n a n c e e m p l o y e e s ............................. 4,073 3,898 175 39.8 8.72 __ X .5 1.3 1.2 2.2 1.5 5.5 1.7 6.5 50. 1 17.7 3.7 2.5 1.8 . 9 2.9Traffic test in g and r e gu la ti ng empl oyees... 1,0 18 1,000 18 40.0 8.69 - - - .2 .3 .3 1.2 .8 2.4 .7 1.4 70.7 22.0 . 1Co nstruction, installation, and ma in t e n a n c e e m p l o y e e s ........................... 3,031 2,874 157 39.7 8.76 _ X . 1 1.7 1.4 2.4 1.7 6.6 2.1 8.2 43.5 16.4 4.9 3.4 2.4 1.2 3.9Supervi s o r s ....................................... 762 743 19 39.0 10. 13 - - - . 1 - .5 . 1 1.3 .4 1.3 2.6 9.8 24.9 16.7 12.7 8.9 4.9 15.6S u b s c r i b e r s 1 eq ui pm en t m a i n t a i n e r s ........ 1,419 1,412 7 40.0 8.55 - - - - .4 .8 1.7 1.3 1.7 3.0 .4 70.5 20 .2 - -Line and ca ble w o r k e r s ........................ 1 10 110 - 40.0 8.52 - - - - - 1 .8 8.2 1.8 4.5 2.7 5.5 52.7 6.4 13.6 2.7 - _ _O t h e r s .............................................. 740 609 131 40.0 7.82 - - . 1 .4 6. 1 3.2 5. 1 3. 1 22.7 1 . 1 29.5 25. 1 1.8 .8 .3 .7 _ _
L a b o r e r s .............................................. 24 24 - 40.0 5.41 - - - 58.3 - 16.7 20 .8 4.2 - - - - _ _Buil di ng serv ic e e m p l o y e e s ........................ 143 108 35 39.9 6 . 15 .7 - - 7.7 42.7 7.7 9.8 - 14.7 4.2 9.8 2.8 - - - - _ _
Meeh ani c s ............................................ 65 6 1 4 40.0 7.23 - - - - 4.6 7.7 18.5 - 32.3 9.2 21.5 6.2 - - - _ _ _O t h e r s ................................................ 78 47 31 39.9 5.24 1.3 - - 14. 1 74.4 7.7 2.6 - - - - - - - _ _ _
M e s s e n g e r s ............................................. 471 453 18 38.8 5.02 10.6 6.6 6.2 16 . 1 42.7 17.6 .2 - - - - - - - _ _ _ _Full~t i m e ............................................ 451 434 17 39.8 5.05 - - - - - - - - - - - - - - _ _ _Part-t i m e ............................................ 20 19 1 16.2 3.37 - - - - - - - - - - - - - _ _ j _ _Wa l k i n g and bi c y c l e m e s s e n g e r s ................ 58 50 8 39.5 3.44 75.9 22.4 1.7 - - - - - - - - - - - - _ _ _Mo tor m e s s e n g e r s ................................... 413 403 10 38.7 5.25 1.5. 4.4 6.8 18.4 48.7 20. 1 .2 " " ' ' “ ~ ” ~ ~ “
1 Includes employees working in the conterminous 48 States and the District of Columbia; the company does not operate in Alaska and NOTE: Asterisk (*) indicates less than 0.05 percent. Dash ( - ) indicates that no data were reported. Because of rounding, sums of individualHawaii. items may not equal 100.
2 Excludes premium pay for overtime and for work on weekends, holidays, and late shifts.
Digitized for FRASER http://fraser.stlouisfed.org/ Federal Reserve Bank of St. Louis
Table 6. International telegraph carriers:1 Percent distribution of employees in occupational groups by average hourly rates,2 October 1978
Percent of e m pl oy ee s receiv in g -
O c cu pa ti on al gr oupNumber of employees Av erage
Total Men Nomen3.99 $4.49 $4.99 $5.49 $5.99 $6.49 $6.99 $7.49 $7.99 $8.49 $8.99 $9.49 $9.99
$10.49
$10.99
$11.49
All e m pl oy ee s ex cept o f f i ce rs an d as sistants... 4,518 3,643 875 37. 1 $9.57 1.4 0.7 0.6 1.3 2.9 4.0 4.2 4.3 5.7 5.6 7.6 1 1.8 5.3 5.3 10.9 3.3 3.4 21.8All empl oy ee s except of f i c e r s and
5.8 12. 1 11.1 22.3a s si st an ts and m e s s e n g e r s .......................Profes si on al and semi p r o f e s si on al employees....
Engine er s an d en gi ne e r i n g a s s i s t a n t s ......... 357 350 7 36.9 13.77 - - - - - - - - - - 1.4 1.4 3. 1 3. 1 5.9 5.0 7.3 72.8O t h e r s .................................................. 434 382 52 37.3 11.94 - - - - .2 .2 2.3 .9 1.4 4.4 3.7 4. 1 4.8 5.5 6.2 3.7 3.9 58.5
Of fice or station su pe r i n t e n d e n t s and53.8 38.5assi s t a n t s ........................................... 13 13 37. 1 13.39 - - - - 7.7
Sales e m p l o y e e s .......................................... 487 375 112 36.5 9.96 - .4 - .8 2. 1 4.9 3.3 2.9 10.7 6.4 4.5 6.8 10.7 4.9 6.2 5. 1 4.5 25.9Clerical e m p l o y e e s ...................................... 1, 044 521 523 36.7 7.92 . 1 - 1.7 4.8 7.6 7.7 9.4 7.4 7.8 10.2 12.8 9.7 3.4 3.5 2.0 2.0 . 6 9.5
Superv i s o r s ........................................... 136 120 16 36.4 12.22 - - - - - - - - 2.2 4.4 1.5 4.4 4.4 6.6 8. 1 5. 1 3.7 59.6No ns u p e r v i s o r y e m p l o y e e s .......................... 908 401 507 36.7 7.28 . 1 - 2.0 5.5 8.7 8.8 10.8 8.5 8.6 11.0 14.5 10.5 3.2 3. 1 1 . 1 1.5 . 1 2.0
O p e r at in g d e p a r t m e n t ............................ 26 1 151 110 37. 1 7.6 1 - - 2.3 3.8 8.8 6.5 8.0 4.2 5.0 10.7 19.2 23.8 5.0 1 . 1 1 . 1 .4 _Co mm ercial d e p a r t m e n t ........................... 36 2 34 37.5 7.26 - - - 5.6 5.6 8.3 8.3 8.3 27.8 19.4 2.8 5.6 5.6 2.8 - - _Ac co u n t i n g d e p a r t m e n t ........................... 288 1 1 1 177 37.0 7.07 - - .3 4.9 6.6 7.6 12.5 1 1.8 9.7 10.4 22.2 6.9 1.4 5.2 .3 - _E n gi ne er in g d e p a r t m e n t .......................... 40 15 25 37.8 7.26 - - - - 7.5 10.0 15.0 22.5 10.0 7.5 10.0 - 7.5 2.5 2.5 2.5 " 2.5All other d e p a r t m e n t s ........................... 283 122 16 1 35.9 7. 19 .4 - 3.9 8.5 11.3 12.0 11.3 7. 1 8.1 11.3 4.6 3.9 2.5 2.8 1.8 4.2 .4 6.0
O p e r a t o r s .................................................. 938 790 148 37.4 9.04 - - - - 2.5 5.0 3.5 5.8 4.9 4.4 6.8 32. 1 6.2 8.4 5.3 1.7 1.6 11.8Tr affic chiefs, di sp atchers, supervisors,
65.3instructors, and a s s i s t a n t s ...................... 170 163 7 37.3 12.68 - - - - - - - .6 - - 1.2 1.2 2.9 6.5 4.1 9.4 8.8N o n s u p e r v i s o r y o p e r a t o r s ........................... 768 627 141 37.5 8.24 - - - - 3.0 6. 1 4.3 6.9 6.0 5.3 8. 1 38.9 6.9 8.9 5.6 - - -
Radio o p e r a t o r s .................................... 14 13 1 36.7 7.90 - - - - - 7. 1 7. 1 14.3 14.3 7. 1 21.4 - 14.3 14.3 - - -Ma ri ne coastal station o p e r a t o r s ............. 108 107 1 37.5 8. 58 - - - - - - - 25 .9 10.2 4.6 4.6 2.8 7.4 22.2 22.2 - - -Cable o p e r a t o r s .................................... 110 87 23 37.5 7.86 - - - - . 9 21.8 9. 1 . 9 .9 . 9 .9 42.7 21.8 - - - - -Te l e t y p e - m u l t i p l e x o p e r a t o r s ................... 440 350 90 37.5 8. 13 - - - - 5.0 4.8 4.3 4.8 7.3 6. 1 10.7 47.3 1.8 3.9 4. 1 - - -T e l e ph on e o p e r a t o r s ............................... 51 35 16 37.5 8.51 - - - - - 2.0 5.9 - - 9.8 2.0 78.4 - - 2.0 - ■ -All ot her o p e r a t o r s ............................... 45 35 10 37.5 9.29 - - - - - - - 2.2 - 4.4 11.1 2.2 24.4 55.6 - - “
M e s s e n g e r s ................................ ................ 102 97 5 35.0 3.59 61.8 30.4 2.9 - 2.0 1.0 1.0 1.0Foot and b i c y c l e ...................................... 98 93 5 34.9 3.53 64.3 30.6 3. 1 - - - 1.0 1.0M o t o r ..................................................... 4 4 - 37.5 4.95 - 25.0 - - 50.0 25.0
Construction, installation, ma in te na nc e,6.6 12.2and other techni ca l e m p l o y e e s ...................... 1,053 1,026 27 37.5 9.76 - - - .4 1. 1 1.9 2.8 2.7 4.7 4.5 9. 1 7.2 5.5 6. 1 31.2 4.1
Supervi s o r s ............................................. 138 138 - 37.3 13. 13 - - - - - - - - - - - - - 2.9 3.6 5.1 4.3 84.1Me ch a n i c s and m a i n t e n a n c etechni ci a n s ........................................... 542 521 21 37.6 8.95 - - - .4 2.2 3. 1 2.2 3.5 5.9 6.5 10.5 9.8 3.5 9.0 39.3 3.5 . 6 “
Radio op er a t i n g t e c h n i c i a n s ....................... 77 75 2 37.5 9.38 - - - - - - - - - 3.9 28.6 5.2 7.8 10.4 44.2 - - “Radio t e l e gr ap h r i g g e r s ............................ 4 4 - 37.5 9.42 - - - - - - - - - 25.0 - 25.0 - 50.0 - - “O t h e r s ................................................... 292 288 4 37.5 9.77 - - - .7 - 1. 0 5.8 3. 1 6.2 3. 1 5.5 6.5 11.0 1.0 25.7 5.8 20.5 4. 1
Bu il di ng serv ic e e m p l o y e e s ........................... 82 81 1 37.5 7.31 - - 4.9 2.4 6. 1 8.5 3.7 18.3 25.6 4.9 4.9 1.2 2.4 - 15.9 1.2 - “All employees, not el se w h e r e c l a s s i f i e d ......... 8 8
'37.5 8.25 ~ “ ~ ' " '
25.0 37.5" "
25.0 12.5
1 Covers employees of international telegraph carriers which have annual operating revenues exceeding $50,000; excludes employees working 2 See appendix for definitions of hours and rates used in this bulletin,for international telegraph carriers outside the conterminous 48 States and the District of Columbia. NOTE: Dash ( - ) indicates that no data were reported. Because of rounding, sums of individual items may not equal 100.
Digitized for FRASER http://fraser.stlouisfed.org/ Federal Reserve Bank of St. Louis
Appendix: Scope and Method of Survey
Data presented in this study are based on annual reports filed with the Federal Communications Commission (FCC) by communication carriers, as required by the amended Communications Act of 1934. All carriers engaged in interstate or foreign communications service by means of their own facilities or through connection with the facilities of another carrier under direct or indirect common control are subject to the full jurisdiction of the Commission. Telephone carriers engaged in interstate or foreign service only by connection with the facilities of another unaffiliated carrier are not subject to the full jurisdiction of the Commission and are not required to file annual reports of hours and earnings of employees.
Tabulations for telephone carriers relate to those having annual operating revenues over $1 million, and which are subject to the full jurisdiction of the FCC. Included are 25 Bell System companies and 37 companies not affiliated with the Bell System.
Tabulations for wire-telegraph and international telegraph carriers are confined to companies with annual revenues exceeding $50,000 which are engaged in interstate or foreign commerce. Western Union Telegraph Company is the only wire-telegraph company included. Five companies engaged in nonvocal radio or cable communications are included in the international telegraph tabulations.
Employees and occupational groups covered by the study
Officials and managerial assistants are not included in the tabulations. Also excluded are employees working outside the 50 States and the District of Columbia, except telephone carrier employees in Puerto Rico and the Virgin Islands. All other employees, both full-time and part-time, are included. Part-time employees are defined as those regularly assigned shorter hours than a full-time schedule.
Occupational groups for which separate data are presented are defined in the FCC’s Rules and Regulations, volume X, part 51, applying to telephone carriers; and part 52, applying to'telegraph companies. Copies of this volume are for sale by the Superintendent of Documents, U.S. Government Printing Office, Washington, D.C. 20402.
Hours and ratesAverage hourly rates presented in this bulletin were
computed by dividing total “scheduled weekly compensation” by total “scheduled weekly hours.” Average scheduled weekly hours were obtained by dividing the total scheduled weekly hours by the number of employees. The terms “scheduled weekly hours” and “scheduled weekly compensation” for the three carrier groups covered by the study are defined, according to the FCC’s Rules and Regulations, as follows:
Telephone carriers51. 12 (b). “Scheduled weekly hours” means the num
ber of regular hours, excluding overtime hours, in the duty tours which the employee is scheduled to work during the week in which December 31 occurs, whether or not excused because of a holiday, vacation, leave of absence, or other reason.
51. 13 (b). “Scheduled weekly compensation” means compensation to the employee at the rate of pay in effect on December 31 for the “scheduled weekly hours.” It includes the basic weekly pay rate plus any regularly scheduled supplementary compensation, such as differentials for evening and night tours, equivalent value of board and lodging for unlocated employees, equivalent value of meals furnished dining service employees, and equivalent value of living quarters and maintenance furnished for managers of agency offices. It excludes pay for overtime work and pay in excess of weekday rates for Sunday and holiday work.
Western Union Telegraph Company52. 21 (b). “Scheduled weekly hours” are defined as
an employee’s regular daily tour of duty multiplied by the number of days, or fraction of days, scheduled to be worked during a week.
52. 22 (b). “Scheduled weekly compensation” is defined as wages scheduled to be paid for scheduled weekly hours as defined in 52.21 (b). This should include employee contributions for old-age benefits, unemployment insurance, and similar deductions, paid vacation and holiday hours, the regularly scheduled weekly compensation for employees temporarily on leave due to disability or sickness, and the
11Digitized for FRASER http://fraser.stlouisfed.org/ Federal Reserve Bank of St. Louis
scheduled weekly compensation of both full and part-time employees.
The company reports that “scheduled weekly compensation” excludes premium pay for overtime and for work on weekends, holidays, and late shifts.
International telegraph carriersInternational telegraph carriers are instructed to re
port scheduled weekly hours and compensation for their employees as defined for the Western Union Telegraph
Company, except that scheduled weekly compensation should include regularly scheduled maintenance, travel, or other allowances.
Distribution of workers by earnings classesIn the tables, workers are distributed according to
the percentage having stipulated hourly rates of pay. Because of rounding, sums of individual items may not equal 100.
12Digitized for FRASER http://fraser.stlouisfed.org/ Federal Reserve Bank of St. Louis
Industry Wage Studies
The most recent reports providing occupational wage data for industries included in the Bureau’s program of industry wage surveys are listed below. Copies are for sale from the Superintendent of Documents, U.S. Government Printing Office, Washington, D.C. 20402, or from any of its regional
Manufacturing
Basic Iron and Steel, 1978-79. BLS Bulletin 2064 Candy and Other Confectionery Products, 1975. BLS
sales offices, and from the regional offices of the Bureau of Labor Statistics shown on the inside back cover. Copies that are out of stock are available for reference purposes at leading public, college, or university libraries, or at the Bureau’s Washington or regional offices.
Textile Dyeing and Finishing, 1976. BLS Bulletin 1967 Textiles, 1975. BLS Bulletin 1945Wages and Demographic Characteristics in Work Clothing
Manufacturing, 1972. BLS Bulletin 1858 West Coast Sawmilling, 1969. BLS Bulletin 17041 Women’s and Misses’ Coats and Suits, 1970. BLS Bulletin