Socio-Economic Baseline Report Blue Gold Program Technical Report 14 Embassy of the Kingdom of the Netherlands Dhaka Bangladesh Bangladesh Water Development Board (BWDB) Department of Agricultural Extension (DAE) February 2015
Transcript
Socio-Economic Baseline Report
Blue Gold Program
Technical Report 14
Embassy of the Kingdom of the Netherlands Dhaka Bangladesh
Bangladesh Water Development Board (BWDB) Department of Agricultural Extension (DAE)
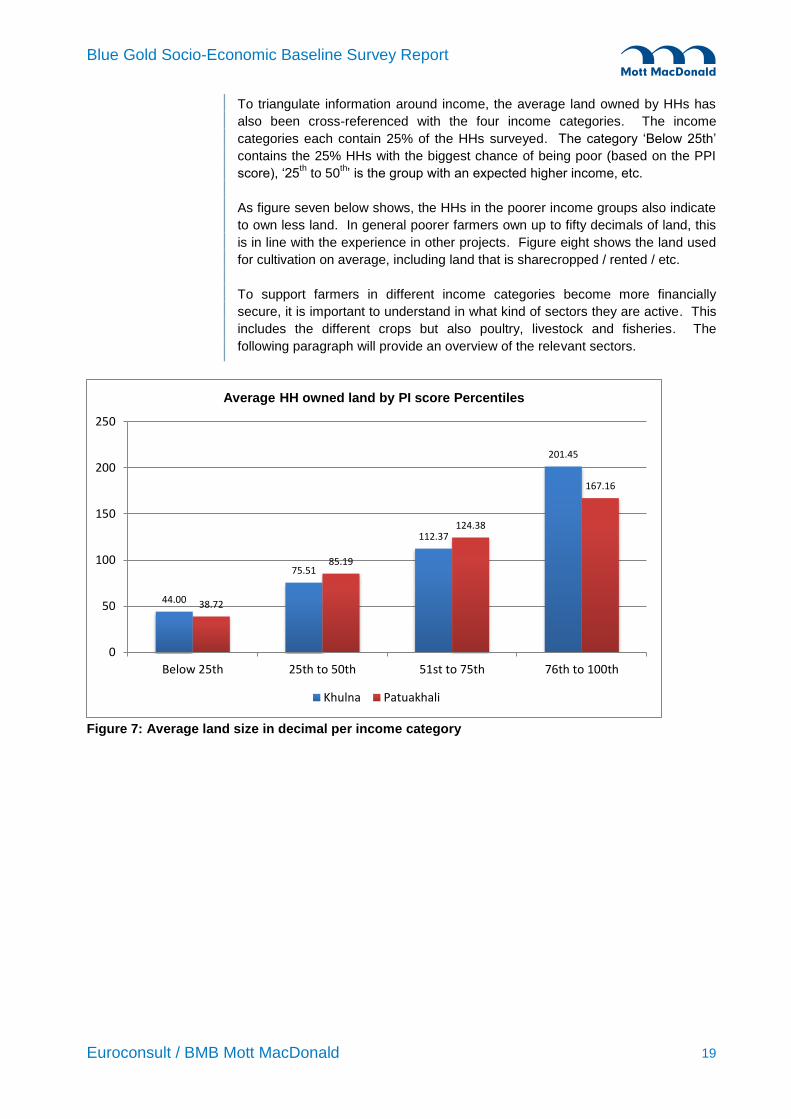
February 2015
Mott MacDonald, Amsterdamseweg 15, 6814 CM Arnhem, PO Box 441, 6800 AK, Arnhem, Netherlands T +31 (0)26 3577 111 F +31 (0)26 3577 577 W www.mottmac.com
Blue Gold Socio-Economic Baseline Survey Report
Survey Implementation Plan, Methodology & Work plan and Data Analysis
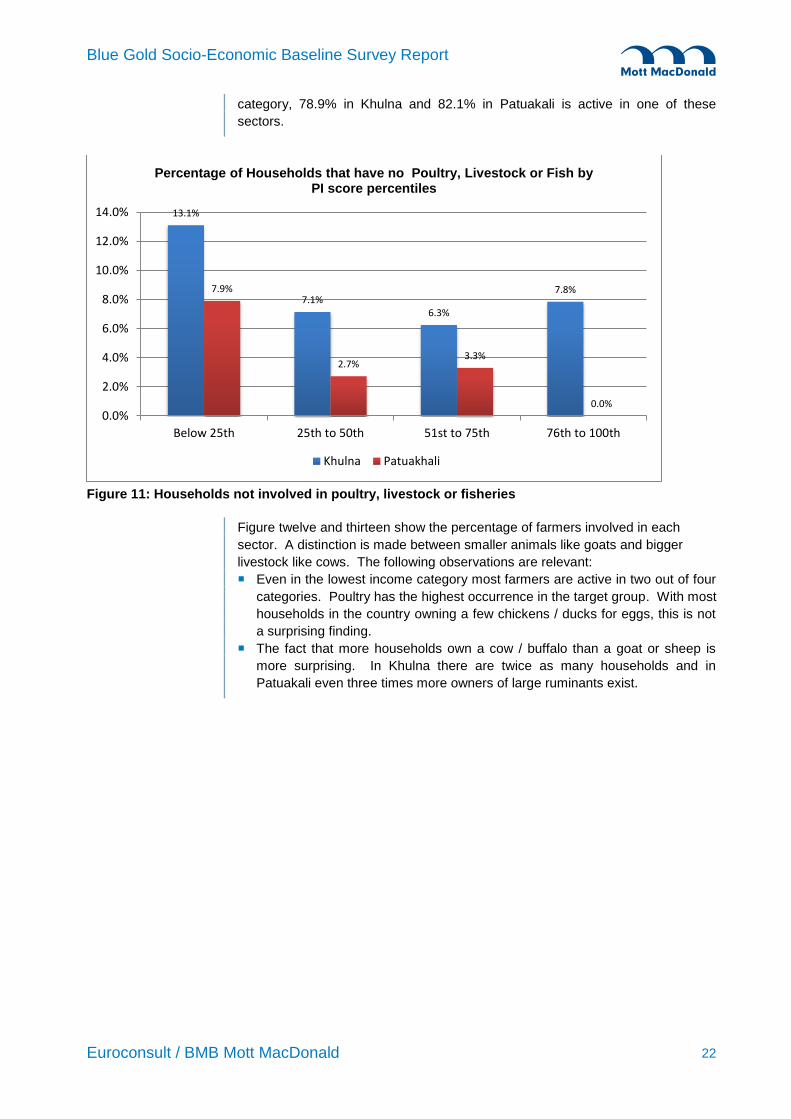
Date: February 2015
Blue Gold Program
Green corner – Save a tree today!
Mott MacDonald is committed to integrating sustainability into our operational practices and culture. As a
world leading consultancy business we are always seeking to improve our own performance and reduce
the environmental impact of our business. Meanwhile, many of our staff are committed to living sustainably
in their personal lives – as an employee-owned company Mott MacDonald shares their concerns. We feel
an ethical obligation to reduce our emissions and resource use and have committed to reducing our per
capita carbon footprint by a minimum of 5% year on year.
We print our reports and client submissions using recycled, double-sided paper. Compared to printing
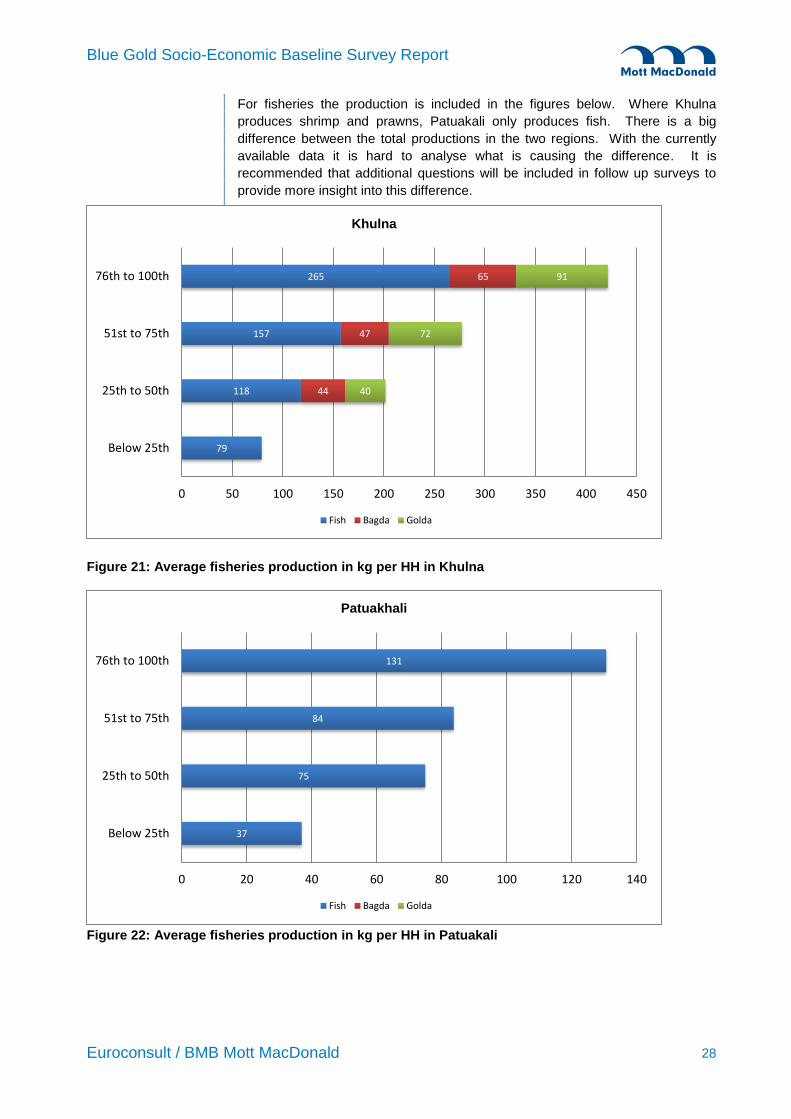
single sided on A4 virgin paper, double sided printing on recycled paper saves the equivalent of two trees,
over a ton of CO2 and a cubic metre of landfill space for every 100 reams. By choosing the greener path
we have been able to achieve efficiencies benefiting both Mott MacDonald and our customers.
We would like to share some of the principles of our own „Going Green‟ initiative:
• When possible we scan rather than print and consider what really needs to be on paper
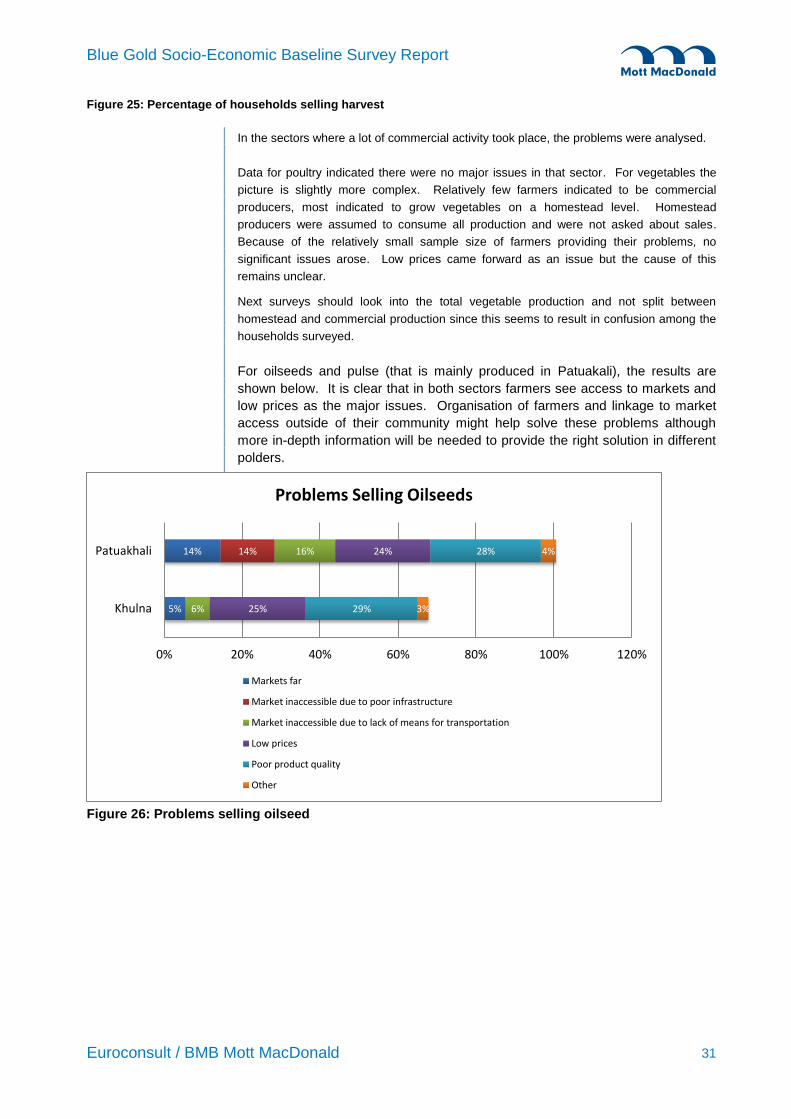
• We use electronic faxing when practicable
• We work on e-forms
• We use recycled paper when possible
• Reducing paper in the office creates a better working environment for our staff and our clients
We believe that you, as one of our esteemed clients, will share our concern to conserve precious
resources for the benefit of our planet and its inhabitants.
Blue Gold Socio-economic Baseline Survey Report
T +31 (0)26 3577 111 F +31 (0)26 3577 577 W www.mottmac.com
Figure 29: Number of businesses owned per HH ........................................................................................ 33
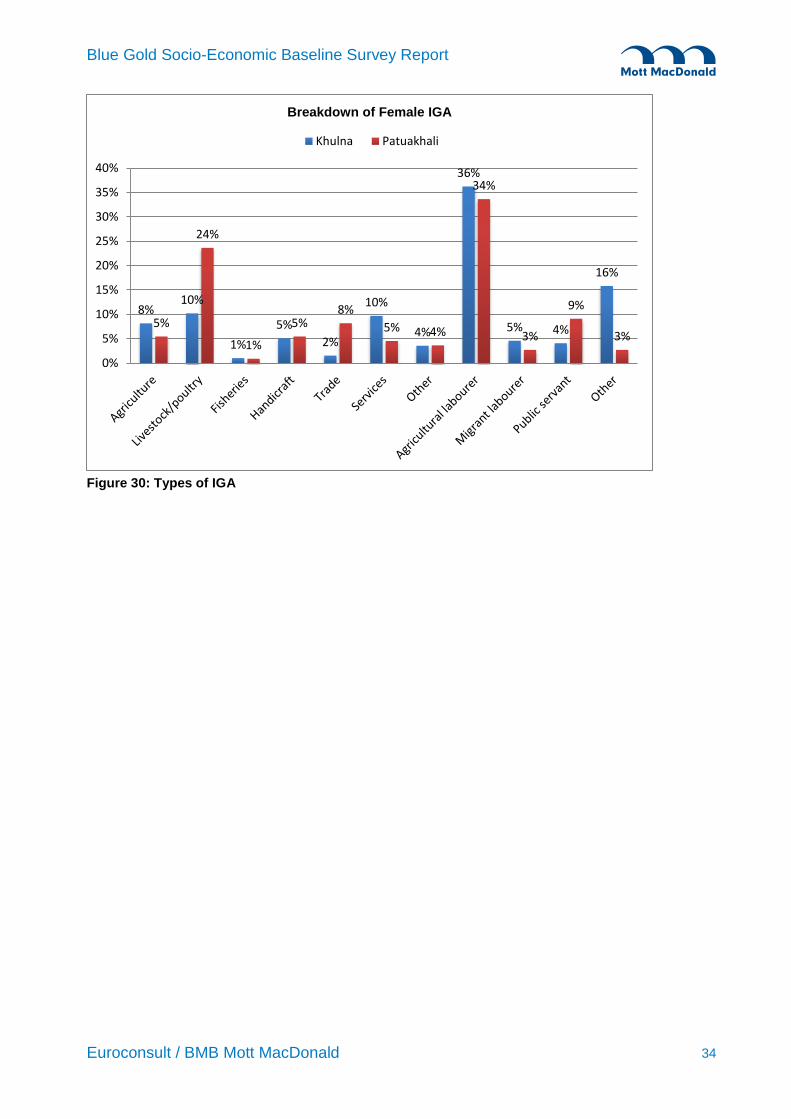
Figure 30: Types of IGA ............................................................................................................................... 34
Blue Gold Socio-Economic Baseline Survey Report
Euroconsult / BMB Mott MacDonald iii
List of Abbreviations
MMB Mott MacDonald Bangladesh
BGP Blue Gold Program
BGBS Blue Gold Baseline Survey
BGBS-CT Blue Gold Baseline Survey- Core Team
ODK Open Data Kit
PSU Primary Sampling Unit
HH Households
HHH Household Head
BBS Bangladesh Bureau of Statistics
Blue Gold Socio-Economic Baseline Survey Report
Euroconsult / BMB Mott MacDonald iv
Executive summary
Since around 1975 the Bangladesh and Netherlands Governments have been
working closely together in the coastal zone of Bangladesh to create an
environment conducive for sustainable economic growth, closely involving local
communities. The Blue Gold Program has been designed taking into account the
lessons learnt over the past ten years, and new insights in how to deal with
challenges created in the environment.
The Blue Gold Program became operational in March 2013 and extends over a 6
year period, until March 2019. Its operations concentrate on the polders of three
districts: Patuakhali, Khulna and Satkhira. The overall objective of the Blue Gold
Program is to “reduce poverty for 150,000 households living on 160,000 ha of
selected coastal polders by creating a healthy living environment and a
sustainable socio-economic development.”
The Socioeconomic Baseline Survey was conducted to be able to measure the
impact of the project and to develop recommendations for further implementation
of interventions. Over 1400 households have been surveyed in the nine IPSWAM
polders in Khulna and Patuakali. The enumerators have collected data between
March and June 2014 on tablets. Data was analysed afterwards in several
iterations that led to the following major findings:
25% of the households in the target area experience one or more months of
food shortage, this is mainly caused by a lack of cash during the months June
to October. A major part of these households belongs to the poorest 25% and
only has access to small areas of cultivable land.
Rice, vegetables, pulse and oilseed are the crops cultivated by most farmers.
Richer farmers tend to diversify more across different crops, this happens
more in Khulna than Patuakhali.
Besides crops, almost every household is active in either poultry, ruminants or
fish. More than 50% of the households, even in the poorest category own a
large ruminant.
Reported yields are quite diverse and are sometimes significantly different
between the districts. Multi cropping is widespread and most farmers identify
water management as a major challenge.
Most households have not received technical training in the sector they are
active in. Business related training around organizing, financial management,
etc. was even less common. Slightly more people have been trained in
Khulna than in Patuakhali.
Many households are selling their products but relatively few report problems.
The issues they do mention are related to low prices and hard to reach
markets.
Most households are not involved in other business. Thirty percent of the
Khulna women are involved in income generating activities, compared to only
Blue Gold Socio-Economic Baseline Survey Report
Euroconsult / BMB Mott MacDonald v
14% in Patuakhali. Most of their IGAs are farm related like homestead
cultivation, poultry or providing labour.
Based on the results above the following recommendations are made to Blue
Gold:
The food shortage appears simultaneously with a cash shortage in the most
vulnerable HHs. Identifying opportunities to create additional income during
those months will be essential in reducing food insecurity.
To provide a more nuanced picture of the food security situation within
households, it is recommended to use the Household Food Insecurity Access
Scale in future surveys. This looks at more dimensions than just shortage of
food.
More detailed information on the use of inputs and production practices will be
useful in determining focus areas for the Farmer Field Schools and Market
Development Component.
Large ruminants might offer an interesting opportunity since even the poorest
households often own one. More insight in the objective of this investment
might allow it to be leveraged to generate additional income during periods of
cash crunch.
There are crops that are currently not popular among the farmers but do offer
opportunities. The development of clear business cases will allow to build on
these possibilities.
Training will be an essential part to increase production and ensure farmer
groups have the necessary skills to function as a market actor. The training
should focus on technical skills and business skills like organizational
management, networking, etc.
The combined WMG membership of husband and wife provides interesting
opportunities to increase participation of women in these groups. Additional
information on the group dynamics when this happens would allow a clear
strategy to be developed.
Problems indicated on the output side (price, physical access to the market)
can be solved by a better coordination by the WMG. Ensuring these groups
can function as effective market actors will be essential.
Clearly identify, based on the baseline and further research, which products /
services need to be introduced for the selected value chains to be more
efficient and effective.
Blue Gold Socio-Economic Baseline Survey Report
Euroconsult / BMB Mott MacDonald 1
1. Introduction
1.1 Report Structure
This report covers the following topics:
1 Introduction: covers the background and rationale
2 Blue Gold Baseline Survey Methodology: which covers
a Sample Frame: a brief outline of the actual data sources of the sample frame used in the BGBS
sampling and whom to contact to obtain this data resource.
b Sampling Methodology: Report by Mr. Jose Vila (Statistical Expert) attached as Sampling
Methodology
3 Computer assisted personal Interviewing(CAPI)
a Questionnaire Design and comments
b Lessons learned
c ODK Software Suite
d Methodologies applied for data validation and checking
4 Team Structure: of the BGBS, lessons and best practices
5 Training: Lessons learned and comments
6 Survey Implementation Phase: this will cover:
a Data Collection and validation methodologies
b Data analysis and comments
7 Survey Results: presentation of the BGBS 2014 results
8 Recommendations
9 Appendixes
1.2 Background
Since around 1975 the Bangladesh and Netherlands Governments have been
working closely together in the coastal zone of Bangladesh to create an
environment conducive for sustainable economic growth closely involving local
communities. This current Blue Gold Program has been designed taking into
account the lessons learnt over the past ten years, and the new insights in how
to deal with the challenges created in the environment.
The Blue Gold Program became operational in March 2013 and extends over a 6
years period, until March 2019. Its operations concentrate on the polders of
three districts: Patuakhali, Khulna and Satkhira. The overall objective of the Blue
Gold Program is to “reduce poverty for 150,000 households living on 160,000 ha
of selected coastal polders by creating a healthy living environment and a
sustainable socio-economic development.”
Blue Gold Socio-Economic Baseline Survey Report
Euroconsult / BMB Mott MacDonald 2
1.3 Rationale for Baseline Survey (2014)
The Blue Gold Baseline Survey is a vital part of the Blue Gold Program to
understand its interventions, to assess its contributions towards poverty
reduction, to assess the existing conditions and issues affecting targeted
households and finally to understand the current socio-economic situation of
households in the selected polders. It aims to take a snapshot of the prevailing
socio-economic situation with a special emphasis on agricultural production and
will serve as both a valuable information source for the program as well as a
method for tracking the progress and outcomes of the Blue Gold Program.
Blue Gold Socio-Economic Baseline Survey Report
Euroconsult / BMB Mott MacDonald 3
2. Blue Gold Baseline Survey Methodology
Quantitative surveys, such as this baseline survey, aim at making statistical
inferences about the population being studied. In the context of the Blue Gold
Program‟s objectives, this means that the Blue Gold Baseline Survey (BGBS)
needs to conform to contemporary survey methodology to provide an empirical
basis for assessing both the current situation in the Program Areas of Activity as
well as provide a way to track and assess the actual impact of the Blue Gold
Program in line with the logical frame and established performance indicators.
The initial work that goes into preparing for fieldwork is an important aspect of
any survey that is undertaken. Implementation, logistics planning are important
in their own right, but if the conceptual/theoretical framework is not properly
prepared then the relevance of the primary data obtained, regardless of its
quality, is questionable (if not useless). The survey methodology of the BGBS is
as follows:
Defining and building the sample frame (i.e. the source from which a sample
is drawn)
Defining what data is to be collected (i.e. developing the questionnaire)
Specifying a sampling method (for selection of the primary sampling units
from the sampling frame)
Determining the sample size (i.e. balancing the needs of accuracy and
financial feasibility of the number of interviews to be done)
Survey Implementation: involves preplanning and data quality control issues
Field work and data collection
Analysis of the Data
2.1 Sample Frame
A sample frame is the list of the entire population of the entity from which data
are obtained. In the BGBS the Primary Sampling Units (PSUs) are the
households (HH). The primary respondent, i.e. the person answering the
questions, is the household head.
The BGBS sampling frame had to be created using secondary data sources.
Primary data would have been ideal but time and financial constraints made that
impossible.
It is to be noted that in the case of the BGBS the sampling frame would be the
same as a census of the areas/polders that the BGP is covering.
It is also to be noted that the BGP, as part of its implementation plan, conducted
a census of a subset of polders (Khulna Polders 22 and 30 and Patuakhali
Polders 43/2D and 43/2F. This census covers 52 and 39 villages in Khulna and
Patuakhali, respectively). Hence some primary, recent data was available for
incorporation into the sample frame.
Blue Gold Socio-Economic Baseline Survey Report
Euroconsult / BMB Mott MacDonald 4
The BGBS in its first phase was conducted in 9 Polders (3 in Khulna and 6 in
Patuakhali). As the BG-Census was not carried out in all the selected polders it
was necessary to use the Bangladesh Bureau of Statistics‟ (BBS) Census 2011
data as the main resource in developing the sample frame. The BG-Census data
was to be used as an additional resource for crosschecking with the BBS-Census
2011 data.
Note: Population demographics are not exactly volatile. Even though the BBS-
Census 2011 is approximately 4 years old, it was assumed that it would still be a
good approximation of the actual situation in 2014 in the areas of interest.
The actual development of the sample frame, from the BBS-Census 2011 raw
data involved first compiling a comprehensive list of villages in the 9 selected
polders. As that was not readily available it was decided to use the list of Water
Management Groups as a proxy for the village names and then matching the
names against the names of the villages from the BBS-Census 2011 raw data.
Where there was a mismatch the BBS-Census 2011 naming convention took
precedence.
Once that initial draft was completed, it was finalized in conjunction with the BG
M&E team who checked for accuracy and acceptability.
2.2 Implications for future extensions of the Baseline
Considering the fact that the Baseline Survey will be repeated for every new
polder selected it would be very helpful if the list of WMGs/Villages be verified
when created i.e. the spelling and the name should be matched to the official
BBS Census 2011 data. It was noted that multiple WMGs may exist for a
particular village so a one-to-one correspondence is impossible, however the
BBS methodology of naming can be used as an index variable while creating a
comprehensive village list. This linked list should be easy to compile during the
initial selection process. This would not only simplify the future additions to the
Sample Frame but also allow the rapid integration of other official
databases/sources that use the BBS methodology of village naming. (This can
be delved into at greater detail with the M&E team in later discussions.)
The sample frame was then passed on to the Statistics Expert, Mr. Jose Vila for
designing the sampling methodology.
Blue Gold Socio-Economic Baseline Survey Report
Euroconsult / BMB Mott MacDonald 5
3. Computer-assisted personal interviewing
It was decided early in the process that the BGBS would be conducted digitally;
paper based questionnaires would be eschewed in favour of using tablets that
would enable digital data collection. The advantages of switching to a digital
survey are numerous;
data collection has built in validation checks that reduce enumerator error
labour intensive data entry and checking is avoided altogether
the time lag between data collection and data aggregation is reduced to the
point where for all intents and purposes data is being collected in real-time
changes and tweaks to the questionnaire can be pushed on the fly and
centrally to all teams
Exact latitude/longitude (geopoints) can be taken for each of the HHs
surveyed and a whole host of others.
The preceding list is hardly exhaustive; it just highlights some of the major
advantages.
After background research it was decided that the most suitable software
package would be the Google based Open Data Kit (ODK) suite of mobile data
collection apps. This meant that tablets running the Android OS would be
required. After some market research the Walton 8b tablet was chosen as for its
large battery and the presence of Walton Service centres in the BGBS areas of
operation.
Further information on ODK can be provided as required by the BGBS-CT.
3.1 Questionnaire Design & Finalization
The BGBS-CT provided additional input into the finalization of the Questionnaire.
This was one aspect of the BGBS implementation that would have benefited from
greater collaboration. It was initially expected that the BGBS-CT would
essentially take the finalized questionnaire and create a digital version of it and
then conduct the training. The first versions of the digital questionnaire were built
and tested well before the training but it transpired that major fine-tuning and
restructuring of the questionnaire was required when it was examined closely by
the Survey Manager just prior to the start of the training. Given the tight deadline
imposed by the necessity of starting the Survey Implementation on schedule
(hence the need to complete the enumerator training within this schedule) the
final revisions that were needed were conducted by the BGBS-CT and the
Survey Manager along with the BG M&E team during the training sessions. This
made maintaining the training schedule challenging as it required that the training
on the paper based questionnaire be completed section by section as each
Blue Gold Socio-Economic Baseline Survey Report
Euroconsult / BMB Mott MacDonald 6
section was finalized in conjunction with the BG M&E Team. There were
significant changes to how the questions were structured during this period as
input was received from the various experts who were present during the
training.
It is also to be noted that the digital questionnaire was modified as and when the
changes to the final version were agreed upon.
As is to be expected, during the field testing more changes/improvements to the
questionnaire became necessary.
Note: The present finalized version of the digital questionnaire has significant
scope for streamlining and fine-tuning. Debriefings with the enumerators and
supervisors indicated that a number of sections could very easily be restructured
and questions could be rephrased to be much clearer while garnering the same
information.
3.2 Comments on the Digital Questionnaire
The biggest lesson learned in moving from a paper based questionnaire to a
digital questionnaire format was that the questionnaire design itself needs
adherence to a particular set of practices:
As the digital questionnaire is coded in MS Xls format (i.e. MS Excel format)
before conversion to xml (i.e. tablet readable format) it is highly recommended
that the questionnaire be designed from the start in Excel. It is also important
that all characters/fonts used be Unicode to ensure maximum computability.
This is probably the easiest change to make but would make the digitalization
process much simpler. If the ODK (xforms) software is to be used, the xforms
template can be applied (for smaller questionnaires ODK build can be used);
however this template is very easy to understand and actually makes the
organization and restructuring process much simpler and streamlined.
Another major lesson learned is that the way that paper based questions‟ answer
choices are structured does not lend itself to the kind of validation checks that
need to be built into the digital questionnaires. To explain; whereas in paper
based questionnaires there can be complex tabular answers, digital
questionnaires, if they are to be kept simple and easy to use (a major
requirement for successful deployment in the field), often will require a particular
answer to be split into a few component questions. Digital questionnaires have a
few standardized types of questions that are available for use. Questions
(variables) have to be either pure text, integer, decimal, binary (select one; i.e.
yes/no, male/female type questions), or multiple response (select multiple; i.e.
multiple answers are permissible). All the types aside from the multiple response
type questions are very simple to use. Multiple response type questions depend
on a specific set of choices/answers; however great care needs to be taken when
constructing the answer choices it is vital to ensure that we do not include a
particular answer in the choice list that invalidates the rest of the choices; e.g. if
the question is “What type of training have you received” and the answers
choices range from “agricultural” “livestock rearing” and others and includes the
answers “don‟t know” and “have not taken any training” this question becomes
very difficult to code for automatic validation. It is better, and perhaps more
logical, to ask “have you received any training?” and if the respondent answers
Blue Gold Socio-Economic Baseline Survey Report
Euroconsult / BMB Mott MacDonald 7
“yes” then proceed to ask about the types of training taken. This sort of logical
breakdown works very well in the digital questionnaire format because it makes
dividing sections and skipping sections much more easy to manage. Constraints
(i.e. validation checks) are also much easier to code and can then be used to
dynamically display only the relevant questions. This is also in line with good
questionnaire design practices. This means that it would be best to work closely
with the digital questionnaire design team (i.e. those team members who are
actually coding the digital questionnaire) when formulating the basic questions.
3.3 Lessons learned in developing the Digital Form using XLS Forms
Discussing the development of the entire questionnaire would be duplication of
the many resources already available online; however our learning through trial
and error must be shared so one can easily keep these tips in mind while
developing one‟s own questionnaire using XLS forms. However these tips are
only applicable once a user is already familiar with setting up the forms, which
again is thoroughly explained in Form hub resources.
The „name‟ column must be within 32 characters, cannot begin with a number
or any special character and cannot contain any spaces in between;
otherwise ODK Validate will issue an error.
All „begin group‟ types must have a corresponding „end group‟. It is advised to
name each of the begin group and end group „name‟ as well as „label‟
columns for easy identification of where a group starts and ends, e.g. „type –
begin group. Name – grp_agri_aman. Label – Aman Rice. Type – end
group. Name – endgrp_agri_aman. Label – no labels are required as this
won‟t show up in the form. There can be a mother group with several child
groups within, however each group essentially works like brackets which
open, can remain open, close or close at the end. It can get rather
complicated once several questions within a group are to be skipped.
DO NOT LEAVE A SPACE AFTER your „type‟ or „name‟ variables, e.g. „end
group ‟. It is an invisible error that will cause the form to malfunction.
It is a good practice to keep naming the questions „label‟ as “A1. Name of
Household Head… A2. Age of Respondent…A3.0.1 Please specify what you
mean by „Other‟…and so on”. The same can be done for „name‟ variables but
one must remember that they cannot start with an uppercase letter, e.g.
“a1_name_hhh” is allowed.
The „note‟ and „calculate‟ type of questions can be really handy and must be
used whenever there is a reason to check back with data entered previously.
E.g. „type – calculate, name – calc_loan, calculation -
${loan_1}+{loan_2}+{loan_3}‟ with „type – note, name – chk_total_loan, label
– Your breakdown of total loans ${loan_1} and ${loan_2} and ${loan_3} add
up to ${calc_loan}. Please make sure they are equal to the amount entered
before as total loan ${total loan}.
It is possible to separate different sections of the questionnaire using different
cell colours. It does not make a difference for ODK, but makes the form much
more navigable.
If the questions need to be translated into a local language, the input must be
in Unicode. Also it is imperative to make sure that questions in the base
Blue Gold Socio-Economic Baseline Survey Report
Euroconsult / BMB Mott MacDonald 8
language (e.g. English) are translated with the meaning intact. Difference in
interpretation can cause severe errors in the quality of the data.
In the choices sheet, a gap or (blank row) can be left after each set of
answers. Again, it does not make a difference for ODK but makes it much
easier for navigation.
By the end of the coding sessions, there will be several versions of the .MS
Xls files. It is crucial to separate each according to versions and also to make
sure the names do not include any spaces or begin with numbers or special
characters.
The best types of constraint and relevance are usually the simplest. When
typing the binding guidelines (http://opendatakit.org/help/form-design/binding/)
can simplify the entire line of code. Also this is the most interesting and
perhaps challenging part of writing questionnaires. Users are free to develop
their own lines of code and put them to the test. For any help the Google
ODK groups are more than sufficient.
Note for field deployment: if possible, users must try and keep a copy/image
of the entire „ODK‟ folder inside the memory of the tablet and save it
elsewhere for later reference. If planning requires users to clear out „ODK‟
and re insert a questionnaire for easy tracking, then this step becomes very a
vital safe guard.
3.4 ODK Collect
The ODK software is very flexible; the capabilities of it are constantly being
upgraded by a very vibrant community. It is important, thus, to keep tabs on the
development and release of the new versions; e.g. when we started working with
the software package (in late October 2013), version 1.4.0 was the most current
package. By the time the BGBS field team deployment started version 1.4.3 was
already released. It is expected that by mid June 2014 version 1.4.4 will be
released a large number of bug fixes and additional features have been
added. Perhaps the best thing about this large open Google community that
uses and supports the development of this software package is that technical
problems with the use of this software can be posted in this group and the ODK
community tends to provide as much support as they can.
3.5 Questionnaire Checking
The initial plan called for the Supervisors to pull the data off the Tablets and then
export it into an Excel sheet and check for errors. They were to note down the
errors and sit down with the Enumerators at a later time to correct the data on the
tablets and then do a final pull/push of the corrected finalized data to the
Aggregate Server. However this method proved to be quite cumbersome once
the survey implementation started in two major ways.
The data exported into Excel was not only in a difficult to read format, (variable
names instead of labels) which resulted in Supervisors finding it difficult to
efficiently check the completed questionnaires.
The exigencies of the field meant that the enumerators were often unavailable for
regular error correcting which would in turn lead to unacceptable delays in
pushing the finalized data to the Aggregate Server.
Blue Gold Socio-Economic Baseline Survey Report
Euroconsult / BMB Mott MacDonald 9
Thus this method of checking was supplemented by a simple workaround.
Firstly, as nearly all of the respondents had a cell phone (or had access to one)
inconsistencies/errors could be corrected directly by the Supervisors contacting
the respondents. Secondly by copying a snapshot of the files on the root ODK
folder in the Enumerator tablet to their own tablet, the Supervisors could correct
the mistakes on the Tablets themselves or via phone consultations with the
Enumerators and then upload the data onto the Aggregate Server at their
convenience.
3.6 ODK Aggregate Server
The Aggregate server was based in the Blue Gold Dhaka office and only
accessible via a VPN. This meant that the server was not directly accessible by
the Enumerators or hosted publically. One of the biggest advantages of ODK is
that if the ODK Aggregate Server is hosted publically (i.e. can be accessed
through a website not requiring a VPN) then it is a very simple matter to set up
the tablets running ODK Collect to directly push the completed surveys to the
ODK Aggregate Sever in real-time (contingent on access to mobile network data
connections, which to be frank, is surprisingly ubiquitous in Bangladesh). This is
the recommended policy for small scale, less technical surveys as it will mean
that the data is instantly available to relevant experts as soon as it is filled in.
3.7 Hardware and Infrastructure
There are a few points related to the operation of the hardware that need to be
considered when planning further activities
The Tablets: the Walton tablets performed adequately; however they were prone
to significant slowdowns, malfunctions and required more than anticipated
tweaks and troubleshooting. Around four of the twenty seven tablets acquired
malfunctioned catastrophically (fortunately no data was lost – the backup
systems in place for such eventualities performed more than adequately); this is
a 15% failure rate in two months; granted that these tablets were good value for
money and were used almost constantly however the advisability of scaling up
with these tablets is questionable and, in fact, strongly recommended against.
To put it simply, it would the opinion of the Survey Team that while the Walton
tablets performed within acceptable tolerances, alternate models/brands should
be examined if further procurement is to be made. However it is to be noted that
for intermittent use, the Walton 8B would still be the best value for money.
The Battery packs: rated at 20,000mah, (compare to the 5,000mah battery of
the tablets) these battery packs proved to be the wisest investment by far. They
were invaluable in providing backup power innumerable times during the Survey
Implementation period.
Access to Internet in the field: The Supervisors reported multiple times that it
was terribly difficult to access the VPN from the field. This is an unfortunate
logistical issue that we could do very little to mitigate.
Blue Gold Socio-Economic Baseline Survey Report
Euroconsult / BMB Mott MacDonald 10
4. Team Structure
Please refer to Work-plan details for full breakdown on team structure and team
profiles. A brief outline of the general team structure is presented below:
The plan was as follows: The BGBS-CT would consist of a Survey Manager, a
Senior Survey Coordinator and two Survey Coordinators. The Field
Implementation (BGBS-FIT) team consists of five Supervisors heading up teams
of four Enumerators each (i.e. twenty enumerators total). Two teams would be
deployed in Khulna and three teams in Patuakhali.
Figure 1: BGBS Team Organization
Blue Gold Socio-Economic Baseline Survey Report
Euroconsult / BMB Mott MacDonald 11
5. Training
Training of the Enumerators was planned to be both exhaustive and intensive.
The rationale for an extended training phase was based on the fact that not only
was the questionnaire rather large and complicated (with a large amount of
technical knowledge that needed to be learnt) but also it was assumed that the
Enumerators would require extensive practice with the tablet so when they start
their field work they would already be reasonably comfortable with using the
technology.
Phase One:
Was a rigorous study of the paper version of the questionnaire so that the
enumerators would become familiar with the questions and reduce the effort that
they would need when they switched to the digital format? One of our major
recommendations for future training would be to involve the Experts who were
associated with the development of the questions (depending on their area of
specialization) in the training in those sections. This, of course, has to be
balanced by the Survey Team‟s focus on realistic, field level practices.
Phase Two:
Was extensive practice with the digital questionnaire on the tablet. One of the
more interesting things about this phase of the training was how quickly the
enumerators actually picked up using the tablets and the software. They found it
to be quite intuitive and appreciated the validation checks that were built into the
questionnaire. The transition was actually far smoother than we anticipated; this
allowed more detailed training on the questionnaire itself. Due to the proliferation
of smartphones/touch phones the enumerators were familiar with both the
interface and the hardware (i.e. care of the tablets etc.).
Phase Three:
It was a field test (i.e. piloting) of the digital questionnaire. There were only two
field visits but they proved to be very helpful in both testing the enumerators and
the hardware in an in-field situation while also piloting the questionnaire. Our
main recommendation would be to increase the number of field visits and space
them out in the training period. This would give more field context to the
questionnaire and be a better test of the questionnaire more streamlining can
be achieved pre-deployment.
Blue Gold Socio-Economic Baseline Survey Report
Euroconsult / BMB Mott MacDonald 12
6. Survey Implementation Phase
6.1 Data Acquisition and Checking
The acquisition of high quality data is the overriding factor determining all
implementation phase decisions. Data quality control and the associated
checking systems, ranging from logical validation checks on data being entered
into the tablet (e.g. age of respondent cannot be greater than 150, the sum of the
breakdown of the house hold members must equal the total number of house
members first reported etc.) to a first level of questionnaire checking by the
supervisors, a second level of data checking by the BGBS-CT and a final
automated outlier checking (using the modified STATA do-files) are going to be
implemented. The overall goal of this is to reduce human error to as great a
degree as possible. It is also to be noted that the use of tablets and the way the
methodology calls for a two stage HH selection approach ensures that geopoints
of the HHs are not optional but required. Furthermore the BGBS-CT will be
conducting real-time monitoring of the Enumerators as they move in the field.
This is being done both to ensure data quality and to ensure the security of the
tablets (which represent a significant investment).
6.2 Data Analysis Phase
The primary thing to keep in mind is that the ODK Aggregate Server has built in
visualizations (bar charts/pie charts/maps) that make it possible to very quickly
make sense of the data as it is being uploaded. However the formats (csv) that
the data is exported in using the ODK AS or the ODK B is not really statistical
software analysis ready. This was something that was specifically problematic
for the BGBS questionnaire for one major reason. To explain; one of the most
common types of questions in the BGBS was the “multiple select” question i.e.
the multiple response questions. The way that the ODK AS stores the data is as
follows: say a particular question has 15 possible responses and the respondent
selects 11 of them, all 11 answers will be stored in the same field with spaces in
between them. However for analysis each of these different responses needs to
be stored in a different sub-variable of the main question (i.e. they have to be
converted into dummy variables). This gets extremely complicated when one
considers that this would mean that the variable count for an analysis ready
dataset would jump from 383 to 1068. Fortunately this process was automated
using a STATA do-file that extracts all the variable choices and creates a coded
dataset with the labels
Blue Gold Socio-Economic Baseline Survey Report
Euroconsult / BMB Mott MacDonald 13
7. Results & Analysis
7.1 Introduction
The structure of this chapter is based on the logical framework developed for
Blue Gold to ensure recommendations feed into different components of the
project. It starts with an overview of the current status of indicators included in
the logical framework to present a full picture of the project baseline.
The paragraphs following this overview provide an in-depth analysis of the key
indicators. First the household characteristics and food insecurity are analysed,
determining the major causes for food shortage and possible solutions. Based
on this analysis, the next part of the chapter looks into different agricultural
sectors and productivity within those. The next paragraph looks into the farmer‟s
organisation and their access to agricultural output markets. The final paragraph
looks into the business environment and the role women play in creating
additional income.
The analysis of the Blue Gold Baseline Survey was conducted in consultation
with the Blue Gold Monitoring and Evaluation Team. The M&E Team
recommended that the tables and charts being created were disaggregated
according to the main geographic strata, i.e. Khulna and Patuakhali to be able to
see geographical differences.
A combination of STATA and Microsoft Excel was used to conduct the analysis.
The initial data was imported into to STATA and following cleaning and
processing, the data was exported to Excel in order to facilitate the creation of
the necessary tables and charts.
7.2 Logical Framework Indicators
In the table below, the indicators of the Blue Gold logical framework that measure
the final impact of the project are included. These include both final impact
indicators and outcome related indicators. The table provides a full overview of
these indicators and their baseline measured during the survey. All indicators
are discussed in more detail in the paragraphs that follow.
Blue Gold Socio-Economic Baseline Survey Report
Euroconsult / BMB Mott MacDonald 14
Table 1: Logical Framework Indicators
No. Indicator Project Khulna Patuakhali
1.1 % increase in the Progress out of Poverty Index (PPI)
25 % 23.86 % 25.67 %
1.2 >85% of the households do not experience food shortages in any month of the year
75 % 73 % 77 %
1.3 Average household expenditure on housing and education increased by > 20%
BDT 12,828 BDT 13,773 BDT 12,118
1.11.1 >25% of women move outside of the village on their own
83 % 89 % 78 %
1.12.1 20% increase of women earning own cash income by the end of the project through FFS and IGA
21 % 30 % 14 %
3.2.1 Productivity of FFS participants increased: 1. Rice 8% (in ton/ha)
3.27 2.96 3.50
2. High value crops 15% (ton/ha)
Oilseeds
Vegetables
Pulse
0.464
9.877
.65
0.205
11.380
0.899
0.659
8.747
0.455
3. Eggs 50% (per household) 11.32 12.34 10.55
4. Fish 10% (in kg/ha) 4395 5069 3888
5. Homestead vegetables and fruits 15% (in ton/ha)
11.291 8.408 13.457
6. At 2 years after rehabilitation the production intensity in new Blue Gold polders is increased by 20%
15 % 24.0% 8.8%
7. Male and female famers are more market oriented by selling a larger proportion of their production
80 % 87 % 74 %
3.5.5 Number of businesses has increased with 10%
26 % 23 % 28 %
3.6.1 10% increase in employment by household members
13 % 12 % 13 %
3.6.2 30% of employment increase attributable to women
19 % 26.46 % 14.25 %
Notes for interpretation 1.1 Defined as the chance of falling below the $1, 25 / day poverty line.
1.3 Recommended to be taken out of the logical framework. This could still be
measured as an unintended side effect of the project but does not fit the core
objective of increased incomes and reduced food shortages.
3.2.1.2 Defined as oilseeds, vegetables and pulse based on the number of
farmers involved.
3.2.1.6 Households that only use single cropping.
3.2.1.7 Defined as % of households selling at least 25% of their production in
commercial crops / fisheries / poultry.
3.5.5 Defined as households with at least one business. There is no information
available on the number of businesses in the target areas.
3.6.1 % of HHs that report that employment is a main source of income)
3.6.2 Women in the HH having an income generating activity
Blue Gold Socio-Economic Baseline Survey Report
Euroconsult / BMB Mott MacDonald 15
7.3 Household Composition & Food Security
7.3.1 Food shortages
The households in the polders surveyed have an average of 4.5 and 5 household
members in Khulna and Patuakali respectively. There is a difference in illiteracy
of the household head between the more developed district of Khulna (28%) and
Patuakali (38%). Twenty five percent of the households currently indicate at
least one month where food shortage is an issue. The detailed breakdown is
shown in figure two. It is important to note that this particular question asked the
respondents to indicate in which months they had a food shortage; it does not
necessarily mean that the food shortage lasted the entire month.
Figure 2: Food Shortage
To understand the dynamics around food shortages, it is important to understand
when it is experienced. Figure threeError! Reference source not found. shows
he percentage of HHs that report food shortages in a particular month among all
HHs that report food shortages.
The results show that Khulna, by and large, suffers from food shortages most
acutely in September and October whereas Patuakhali has a wider range starting
in July and continuing through to October.
No Shortage, 75%
One Month, 8% Two Months, 12%
Three or more months, 5%
0%
10%
20%
30%
40%
50%
60%
70%
80%
No Shortage One Month Two Months Three or more months
Food Shortage
Blue Gold Socio-Economic Baseline Survey Report
Euroconsult / BMB Mott MacDonald 16
Figure 3: Food Shortage patterns
The households all indicate that being short of money is the main reason for the
food shortage (71% in Khulna, 88% in Patuakali). The months where
households indicate a cash shortage shows a very similar trend as the chart for
food shortage above, see figure five. Natural disasters, water management
problems and other issues are of very little concern. A detailed breakdown of the
rationale given during the baseline survey is included in figure five.
0% 2%
5% 6% 7% 6% 7%
17%
47%
72%
7%
2% 3% 2% 5% 6% 5%
35% 34%
23%
46% 46%
2% 4%
0%
10%
20%
30%
40%
50%
60%
70%
80%
Food Shortage months of HH's reporting Food Shortages
Khulna Patuakhali
Blue Gold Socio-Economic Baseline Survey Report
Euroconsult / BMB Mott MacDonald 17
Figure 4: Cash shortage
Both the timing of the shortage and the rational given indicate a cash flow
problem for the households before the harvest of the winter cash crops. To
confirm whether there is indeed a link between the food shortage and income,
the next session analysis the Progress out of Poverty Index scores and links
those to the households reporting food shortages.
Figure 5: Reasons for Food Shortages
5%
7% 6% 6% 6% 5% 5%
9%
16%
24%
6%
3% 2%
3%
5%
3% 4%
16%
13%
8%
18% 19%
3% 3%
0%
5%
10%
15%
20%
25%
30%
Cash Shortage
Khulna Patuakhali
3% 5%
71%
21% 22%
3%
88%
16%
0%
10%
20%
30%
40%
50%
60%
70%
80%
90%
100%
Flooding and Cyclones Water ManagementProblems
Finanicial Issues Others
Reasons for Food Shortages
Khulna Patuakhali
Blue Gold Socio-Economic Baseline Survey Report
Euroconsult / BMB Mott MacDonald 18
7.3.2 Poverty Index Results
The Poverty Index1 shows the chance that a HH earns less than a certain
income. For the Blue Gold baseline the results are summarized in table 2. This
means the lowest category should be the most food insecure. To confirm this,
further analysis has been done based on different income categories. Based on
the PI score, HHs have been divided in four equal categories. Higher scores
mean a higher chance of a HH earning more income, e.g. the first group has the
highest chance of being poor.
Table 2: Poverty Index results Average Probability of a HH being below the:
Khulna Patuakhali
$1.25/day PPP 23.86% 25.67%
$1.75/day PPP 54.49% 57.33%
$2/day PPP 65.24% 68.27%
$2.5/day PPP 79.18% 81.76%
Based on the division into four categories as discussed above, the HHs
indicating food shortages have been divided into different categories. It is clear
that there is a correlation between the PI score and the chance on experiencing
food shortage. Food shortages in the higher income categories are probably not
financial but related to flooding or other natural disasters.
Figure 6: Food Insecure HHs per income category
1 The PPI determines the chance of a household belonging into a certain income category based on ten simple questions. The PPI is
used as a replacement for measuring income since estimations from HHs are not reliable enough. For more information on the
questions and calculations, please see: http://www.progressoutofpoverty.org/.
48.3%
33.6%
21.3%
7.8%
44.7%
22.3%
14.8%
7.8%
0.0%
10.0%
20.0%
30.0%
40.0%
50.0%
60.0%
Below 25th 25th to 50th 51st to 75th 76th to 100th
Percentage of HH reporting Food Shortages by PI score Percentile
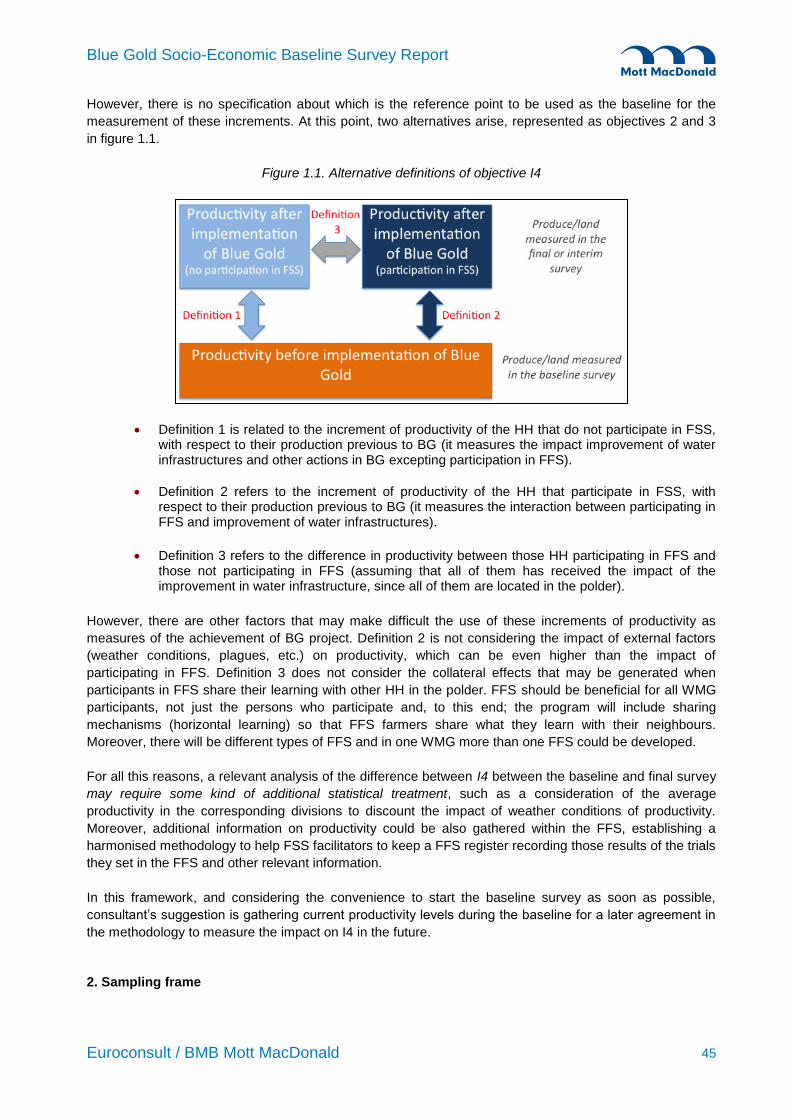
However, there is no specification about which is the reference point to be used as the baseline for the
measurement of these increments. At this point, two alternatives arise, represented as objectives 2 and 3
in figure 1.1.
Figure 1.1. Alternative definitions of objective I4
Definition 1 is related to the increment of productivity of the HH that do not participate in FSS, with respect to their production previous to BG (it measures the impact improvement of water infrastructures and other actions in BG excepting participation in FFS).
Definition 2 refers to the increment of productivity of the HH that participate in FSS, with respect to their production previous to BG (it measures the interaction between participating in FFS and improvement of water infrastructures).
Definition 3 refers to the difference in productivity between those HH participating in FFS and those not participating in FFS (assuming that all of them has received the impact of the improvement in water infrastructure, since all of them are located in the polder).
However, there are other factors that may make difficult the use of these increments of productivity as
measures of the achievement of BG project. Definition 2 is not considering the impact of external factors
(weather conditions, plagues, etc.) on productivity, which can be even higher than the impact of
participating in FFS. Definition 3 does not consider the collateral effects that may be generated when
participants in FFS share their learning with other HH in the polder. FFS should be beneficial for all WMG
participants, not just the persons who participate and, to this end; the program will include sharing
mechanisms (horizontal learning) so that FFS farmers share what they learn with their neighbours.
Moreover, there will be different types of FFS and in one WMG more than one FFS could be developed.
For all this reasons, a relevant analysis of the difference between I4 between the baseline and final survey
may require some kind of additional statistical treatment, such as a consideration of the average
productivity in the corresponding divisions to discount the impact of weather conditions of productivity.
Moreover, additional information on productivity could be also gathered within the FFS, establishing a
harmonised methodology to help FSS facilitators to keep a FFS register recording those results of the trials
they set in the FFS and other relevant information.
In this framework, and considering the convenience to start the baseline survey as soon as possible,
consultant‟s suggestion is gathering current productivity levels during the baseline for a later agreement in
the methodology to measure the impact on I4 in the future.
2. Sampling frame
Blue Gold Socio-Economic Baseline Survey Report
Euroconsult / BMB Mott MacDonald 46
The sampling frame has been obtained matching data on the WMG groups in the nine polders – provided
by BG project – with official data on the number of households and populations of these geographic units
where each WMG is located. The Bangladeshi Bureau of Statistics (BBS) provided the latter information.
The main challenge to generate the sampling frame was given by the lack of harmonisation between BG
and BBS databases as regards with the definition of the smallest geographical unit and the names used to
identify then. A mix of automatic matching and manual editing was required to optimize the quality of the
sampling frame.
The final sampling frame consists of 177 geographical units (Mauzas/ Villages) in the nine polders,
including 62,719 households and covering a total population of 272,208 persons. The sheet
„SampligFrame‟ in the companion excel file „BG_SAMPLING_ERRORS.XLS’ includes the exhaustive list of
polders and geographical units included in the frame.
To avoid ambiguities, each geographical unit (GU) is identified by a 10-digit geocode defined from BBS
geographical codes. The structure of the geocode is as follows:
Zila Upazila Ward Mauza Village
2-digit 2-digit 2-digit 3-digit 1-digit
xx xx xx xxx x
If the last digit – that corresponding to the village – is 0, the geographical unit considered in the sampling
frame is the whole mauza. For the sake of simplicity will refer to geographical units as „villages‟ even in
those cases where the whole mauza is considered.
As an instance of the structure of a gecode, the geographical unit Sambhunagar, with geocode
4712838520, corresponds to zila 47, upazila 12, ward 83, mauza 852 and village 0 – i.e. the whole mauza
is included - according to BBS codification.
Notice that not all the villages in a very same mauza need to be included in the sampling frame, but only
these villages with a WMG. There could be more than one WMG in a geographical unit.
The distribution of villages and households in the sampling frame is presented in tables 2.1. and 2.2.
Table 2.1. Distribution of the sampling frame by division and polder
DIVISION POLDER VILLAGES HOUSEHOLDS
Khulna Polder 22 12 2,768
Polder 29 47 13,395
Polder 30 31 6,511
Patuakhali Polder 43/1A 11 4,542
Polder 43/2A 14 8,133
Polder 43/2B 25 8,575
Polder 43/2D 21 9,593
Polder 43/2E 4 2,745
Polder 43/2F 12 6,457
Total 177 62,719
Table 2.1. Distribution of the sampling frame by division
DIVISION VILLAGES HOUSEHOLDS
Khulna 90 22,647
Patuakhali 87 40,045
Blue Gold Socio-Economic Baseline Survey Report
Euroconsult / BMB Mott MacDonald 47
Total 177 62,719
3. Criteria for sample design
Households are the sampling units in this survey. Households are allocated into two strata, the divisions of
Khulna and Patuakhali. Given the geographical dispersion of the households in the sampling frame, the
utilisation of a Simple Random Sampling (SRS) would consume a large amount of resources and time,
since the households in a SRS sample will be very disperse in the nine polders.
As an alternative to optimise the resources to be allocated in the survey, a two-stage cluster sampling is
applied for each of the two strata: villages are selected at stage 1 and a sample of households on each of
the selected villages is drawn at stage 2.
The main challenge in the design of a two-stage cluster samples is the impossibility of computing the
variance of the estimators, and then the sampling errors, in those cases when the variance of the
indicators between clusters is unknown. The general practice in the design of two-stage cluster samples
for households is the measurement of sampling errors for variables that are related to those in the
questionnaire as a proxy of the actual sampling errors to be obtained in the survey itself. It is important to
highlight that actual sampling errors could be larger than this estimation, specifically if the between-group
variance in the final sample is large.
In the case of the BG baseline survey, there is fortunately a reliable source of information that can be used
for (an approximate) estimate of between-cluster variances: the household censuses carried out in Khulna
(polders 22 and 30) and Patuakhali (polders 43/2D and 43/2F) in Component 1 of BG project. This census
covers 52 and 39 villages in Khulna and Patuakhali, respectively. Moreover, the census questionnaire
includes some questions, namely Q8 (sources of household income) and Q20 (food security), that are
related to some of the indicators to be measured in the baseline survey.
The strategy to estimate the sampling errors is as follows. Let us consider that a sample of n villages is
drawn uniformly at random from the 52 and 39 available villages for each division in the census. We will
assume that between-group variance estimated in this case is a reliable approximation to the between-
group variance that would be obtained if the sample were actually drawn from the sampling frame
described in section 22. Since different samples of n villages may generate different between-cluster
variances and sampling errors, as simple bootstrap procedure is implemented. Variances and sampling
errors are estimated as an average of 10 different random samples for each potential sample size.
Since most of the indicators are defined in terms of a percentage of households, we will focus in the
estimation of the sampling errors for proportions, which is a special case of the computation of the
sampling errors for averages3. From the variables provided by the census, two proportions that are closely
related to the BG indicators will be considered:
Percentage of household where agriculture is a primary source of income (Answer 1 to item Q8 in the census survey), denotes as variable AGRO.
Percentage of household that have a food deficit sometimes of always (Answer 3 and 4 to item Q20 in the census survey), denoted as variable FOOD.
2For the shake of coherence, the size of the villages in the census will be corrected in such a way that the average corrected size
in the census corresponds with the actual average size in the sampling frame. 3 A proportion is just the average of a dichotomous variable that can only take values 1 and 0.
Blue Gold Socio-Economic Baseline Survey Report
Euroconsult / BMB Mott MacDonald 48
Sampling errors are computed by actually drawing 10 random samples of villages and households from the
census, as presented in the companion excel file „BG_SAMPLING_ERRORS.XLS’. Following a
conservative approach, sampling errors for proportion are estimated by considering (1) the highest
between-group variance of AGRO and FOOD and (2) as the maximum feasible within-group variance.
Notice that, as in any two-stage cluster sampling, the definitive sampling error cannot be computed
until the data from the baseline survey were available.
4. Computation of sampling errors: Two-stage cluster sampling of villages and households
4.1. Sampling error for a stratified two-stage cluster sample
In the first stage, a sample of n villages will be selected. In the second stage a sample of mihouseholds will
be selected in each of these villages. Denoting as Mi the number of households in village i, an estimator of
the average/proportion of a variable y is given by:
where is the average of y in village i. Assuming that there are a total of N=177 villages, an unbiased
estimator of the variance of a proportion in stratum h is given by4:
(5.1)
wheres2rand s
2i are estimations of the between-group variance in the stratum and the within-group variance
in village i of the variable y, given by:
Let Rh be number of primary sampling units (villages) in stratum h=1,2 (where 1= Khulna and
2=Patuakhali). The total variance of for the whole population is given by
(5.2)
where H=2 represents the number of strata and the variances in each stratum are computed according to
expression (5.1).
4Lohr, S. L. (1999) ‘Sampling: design and analysis’. Duxubury press.
ˆ y r
M iy ii1
n
M i
i1
n
y i
ˆ V h ( ˆ y r) 1
M 21
n
N
sr
2
n
1
Nn1
mi
Mi
i1
n
Mi
2 si
2
mi
sr
2
(M iy i M iˆ y r )
2
i1
n
n 1
si
2
(y ij y i)2
j1
mi
mi 1
ˆ y r
ˆ V ( ˆ y r)
Rh
2 ˆ V h ( ˆ y r )h1
H
Rh
h1
H
2
Blue Gold Socio-Economic Baseline Survey Report
Euroconsult / BMB Mott MacDonald 49
At a confidence level of 95%, the sampling errors of for stratum h (denoted by eh) and for the whole
population (denoted by e) are given by:
where z0.25 =1.96 is the critical value for a normal distribution for a probability of 0.025 the positive tail.
4.2. Results of the computation of the sampling error
Sampling errors for each random sample in Khulna and Patuakhali have been computed using the sheet
„sampling error‟ in the companion excel book „BG_SAMPLING ERRORS.xls‟. This spread sheet includes
as an input the percentage of households from variables (AGRO) and (FOOD), as well as the variances of
these variables in each village. These values have been previously computed using SPSS from the census
survey database provided by BG Team.
Table 4.1 and Figure 4.1.present the estimation of the sampling error in each stratum, keeping fixed the
number of households per village (mi=20 in this case). Each estimation has been obtained as the average
of the sampling errors for 10 different samples for each pair of n=5, 10 ,15 ,20, 25, 30, 35 and 40 villages
for stratum and 20 households per village.
Figure 4.1. Estimate sampling error per stratum (mi=20, confidence level=95%)
Table 4.1. Estimate sampling error per stratum and their variance: 10 simulated samples and average
As presented in Figure 4.1, for the same values of n and mi, sampling error is higher in Patuakhali than in
Khulna, suggesting the use of a non-proportional stratification with a larger sample allocation in Patuakhali.
Sampling theory establishes that the main component of the variance in a two-stage sampling is provided
by the first stage (village selection in this case). This general principle also applies in the case of BG
baseline survey. As an example, if the number of villages is fixed at n=30 in Khulna and n=35 in
Patuakhali, Figure 4.2 presents the small reduction in the sampling errors when the number of households
per villages is increased 50% and 100% respectively. In other words, when allocated to increase the
number of households per villages instead of the number of villages per stratum, a large increment of the
sampling size (and the corresponding fieldworks costs) has very little impact on the accuracy of the
survey6.
Figure 4.2. Estimate sampling error per stratum
(n=30 for Khulna and n=35 for Patuakhali, confidence level=95%)
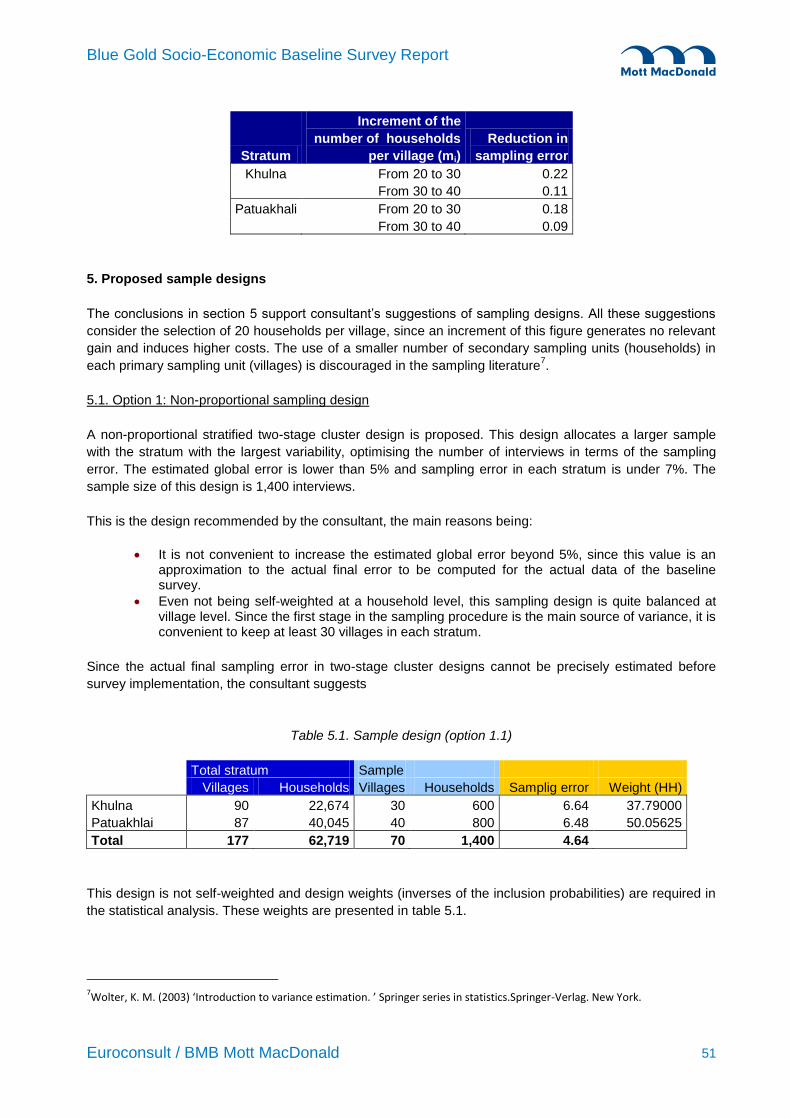
Table 4.2. Estimate reduction of the sampling error per stratum induced by an increment of m i
(n=30 for Khulna and n=35 for Patuakhali, confidence level=95%)
5 The average value for n=40 in Patuakhali is the sampling error corresponding to the only sample of size 39 that can be obtained
in this division, when all the villages in the census are selected. 6 A duplication of the sample size in Khulna (600 extra interviews) or Patuakhali (700 extra interviews) without increasing the
number of villages reduces the sampling error in only a 0.33% and 0.28%,respectively.
Blue Gold Socio-Economic Baseline Survey Report
Euroconsult / BMB Mott MacDonald 51
Stratum
Increment of the
number of households
per village (mi)
Reduction in
sampling error
Khulna From 20 to 30 0.22
From 30 to 40 0.11
Patuakhali From 20 to 30 0.18
From 30 to 40 0.09
5. Proposed sample designs
The conclusions in section 5 support consultant‟s suggestions of sampling designs. All these suggestions
consider the selection of 20 households per village, since an increment of this figure generates no relevant
gain and induces higher costs. The use of a smaller number of secondary sampling units (households) in
each primary sampling unit (villages) is discouraged in the sampling literature7.
5.1. Option 1: Non-proportional sampling design
A non-proportional stratified two-stage cluster design is proposed. This design allocates a larger sample
with the stratum with the largest variability, optimising the number of interviews in terms of the sampling
error. The estimated global error is lower than 5% and sampling error in each stratum is under 7%. The
sample size of this design is 1,400 interviews.
This is the design recommended by the consultant, the main reasons being:
It is not convenient to increase the estimated global error beyond 5%, since this value is an approximation to the actual final error to be computed for the actual data of the baseline survey.
Even not being self-weighted at a household level, this sampling design is quite balanced at village level. Since the first stage in the sampling procedure is the main source of variance, it is convenient to keep at least 30 villages in each stratum.
Since the actual final sampling error in two-stage cluster designs cannot be precisely estimated before
In the first stage, a sample of polders within each stratum will be drawn. In stages two and three samples
of villages and households will be selected as described in subsection 5.1. The formula for the estimator of
the variance in each stratum becomes quite complex in the case of three simultaneous selections of
samples. In the case of multi-stage cluster sampling, the variance generated by the sampling in the last
stages (households in each village, in this case) is very small compared to those generated by the two first
sampling stages and can be ignored8 for practical purposes. In this case, the variance within each stratum
can be estimated as:
where Mi, mi refer now to the number of villages in polder i and N, n refer to the polders in stratum h. In this
case, the between-polder and within-polder variance are given by the formulas in section 4.1, but referred
to polder and villages instead of to villages and households as they were in the two-stage case. The
between-polder and with-in polder variances are given by the same expression than in section 4.1.
From the data available in the census, it is only possible to estimate the sampling error for a sample that
selects two polders in Khulna and two polders in Patuakhali. Even assuming that all the villages in the
selected polders are selected in the sample, sampling errors in Patuakhali are very high (around 21%).
This fact is a consequence of the general properties of sampling error in small populations: when
populations are quite small (3 and 6 polders in the first stage) almost all the units in the sampling frame
need to be included in the sample to have „reasonable‟ errors.
For these reasons, the consultant does not recommend using a three-stage cluster sampling design when
the number of units in stage 1 is as small as 3 and 6. An alternative strategy might be (1) a two-stage
design for the current survey and those to be implemented when new polders are selected to participate in
the BG project -sampling all the polders in the baselines surveys and (2) considering the use of a three-
stage cluster sampling (with polder selection as stage 1) for the interim / final surveys, once all the 26
polders are included in BG project.
6. Remarks for survey implementation
6.1. Sampling and fieldwork
The n villages to be selected in each stratum should be chosen uniformly at random from the list of villages provided by the sampling frame.
The selection of the mi households per village should also be done uniformly at random. However, to reduce the resources and time required to complete the fieldwork, the use of random routes is recommended. The 20 households to be chosen can be distributed in 4 random routes of 5 households per route. The consultant suggests the following procedure to implement random routes.
1. Selection of the four initial points.
8Wolter, K. M. (2003) ‘Introduction to variance estimation. ’ Springer series in statistics.Springer-Verlag. New York.
ˆ V h( ˆ y r) 1
M 21
n
N
sr
2
n
1
Nn1
mi
Mi
i1
n
Mi
2 si
2
mi
Blue Gold Socio-Economic Baseline Survey Report
Euroconsult / BMB Mott MacDonald 54
o Case 1: Villages in polders 22, 30, 43/2D and 43/2F. Since a census for the villages in these
polders is available, the four initial households could be selected with a random or systematic process.
o Case 2: Villages with available map. A grid of 5 horizontal and 5 vertical lines could be plot on the map and the cross-lines of the grid numbered from 1 to 25 (see figure 6.1). Four point of the grid could be chosen at random or systematically. The closest household to each of the selected cross-lines will be considered as the four initial points.
o Case 3: Other Villages. An ordered list of landmarks (i. e. 1. mosque, 2. primary school, 3. bridges, etc.) will be specified by the BG team. When arriving to a village, the enumerators will ask for these landmarks and will choose the first four landmarks according to the order in the list. The closest household to each of these landmarks will be considered as the four initial points.
Figure 6.1. Selection of the four initial household (case 2)
2. Enumeration phase.
The purpose of this enumeration is to ensure that the sample selection is completely random so as to
meet the standards of random probability sampling whereby each household has a known, non-zero
chance of inclusion. It is for this reason that enumeration is separate from the fieldwork and is
suggested to be conducted by enumerators who were specifically trained for the task. The
enumeration and interviewing will be done by different people to ensure the enumeration process is
methodologically sound. For each of the four random route, the enumerators will provide
5 eligible households for the main sample
15 additional back-up households addresses
A random route will be defined where the route continues north, south, east or west with equal
probability at each path/road/street intersection. Households are selected along the route by
applying a random step (every nth household: the step 4 is suggested). From the starting point,
enumerators walk in one of the four compass orientations using the following rule: at the first starting
point they go north, at the second they go east, at the third they go south, at the forth they go west
Blue Gold Socio-Economic Baseline Survey Report
Euroconsult / BMB Mott MacDonald 55
and at the fifth they go north again, and so on. At the first intersection they turn left, at the second
they go straight, at the third they turn right and at the forth they turn left again. This process will go
on until 20 eligible households are selected.
These 20 households will be organized at random according to the following table, to be sent to the
interviewers.
Table 6.1. Selected households
Main sample Back-up 1 Back-up 2 Back-up 3
HH1 HH11 HH12 HH13
HH2 HH21 HH22 HH23
HH3 HH31 HH32 HH33
HH4 HH41 HH42 HH43
HH5 HH51 HH52 HH53
3. Interview phase.
Interviewers will contact households HH1, HH2, HH3, HH4 and HH5 in each route. If HHi (i =1,…,5)
cannot be interviewed due to non-contact or refusal in a specified time, interviewers will contact
HHi1. In case of non-response by HHi1, they will try to contact the back-up household HHi2 and so
on. If all the back-up households for HHi are non-responses, interviewers will proceed with the other
back-up households, always from to tobotto and left to right of the table 6.1.
6.2. Data analysis
The design of the sample needs to be considered to generate accurate estimations of the indicators. Specifically:
- Averages and proportions need to be computed according to
and not by the formula of averages or proportions to be used with Simple Random Sampling. - Is the recommended design described in 5.1 is finally implemented, all the computation should
consider the fact that the sample is not self-weighted and that the final weights need to be considered: o Tables 5.1. to 5.3 provide with the design weights for different sampling sizes. Once
completed the sampling, such weights need to be recalibrated to cope with non-response issues and other potential deviations from the sample design.
o For that information referring to population instead of number of HH (such as indicator I9) additional weight to calibrate with the specified population (able adult women) need to be computed. The information for this computation will be available after data collection.
Actual final sampling errors for all the relevant variables, at least to all the indicators, should be computed according to the formulas presented in subsection 4.1.
Blue Gold Socio-Economic Baseline Survey Report
Euroconsult / BMB Mott MacDonald 56
Appendix 3 Google Open Data Kit Open Data Kit (ODK) (http://opendatakit.org/) is a free and open source CAPI software for Android
phones that was developed by the Computer Science and Engineering Department of the University of
Washington. Although relatively new, it boosts a powerful data collection platform ODK
Collect(http://opendatakit.org/use/collect/ and available for Android users with Google account at the
Google Play Store (https://play.google.com/store/apps/details?id=org.odk.collect.android); for data
management ODK uploads and stores all data in a convenient portable format and transfers it through a
dedicated server application, the ODK Aggregate (http://opendatakit.org/use/aggregate/) which is hosted
by Google Inc and also made available free of cost for development practitioners; and lastly a simple drag
and drop questionnaire development platform called ODK Build(http://opendatakit.org/use/build/ for
general information and http://build.opendatakit.org/ for users who need to sign in). ODK is extremely user-
friendly for field users with built in touch-friendly interfaces - touch selects answers, touch changes the
questionnaire language, and touch navigates the questionnaire (Shaw, A., et.al. 2011).
Another virtue of this application is the ease with which it handles media intensive data by capturing it
as an answer or displaying media in selecting an answer with equal ease. Unlike more traditional CAPI
packages, “ODK treats media capture as a logical adjunct of, rather than an add-on to, pre-scripted survey
questions and the consequence is that media capture is effortless for developers to program and as easy
as the click of a button for interviewers to perform” (Shaw, A., et.al. 2011). It treats GPS coordinate data in
much the same way. ODK's other strength is the vibrant open source community of users (Google groups
for ODK) who play a crucial role in providing feedback adding further modifications to the core software.
The Google group for ODK is open to not only programmers but also general users and practitioners from
the development community who can combine their shared experiences to create something truly
quintessential for the purposes of M&E (https://groups.google.com/forum/#!forum/opendatakit).
For questionnaire development ODK programming involves one web based tool ODK Build,
(http://opendatakit.org/use/build/ for general information and http://build.opendatakit.org/ for users who
need to sign in) which is a simple drag and drop questionnaire developing platform requiring minimum
amount of complex coding skills. Organizations with high levels of programming capacity with languages
such as XML and JavaRosa can also make use of available writing softwares such as Notepad++ or
WordPad which comes bundled with any version of windows 7 and above. Another variation to the coding
is the XLS Forms(http://opendatakit.org/use/xlsform/) which boasts its own community of users in
(https://formhub.org/). Forms created using the .xls extension are outputs of Microsoft Excel or any other
spreadsheet tool, such as Google Spreadsheets which is also made available for free by Google Inc. They
are easily convertible into the XML format which is native to Google ODK using an online or offline
converter (https://github.com/UW-ICTD/xlsform.exe/blob/master/README.md). Each of them follow a
specific language for coding which is compatible with the ODK Collect software and reads the forms as
finished survey instruments. There are various help tutorials and „step by step guides‟ available for both
styles of coding. Usability depends on the level of familiarity the user has with each format. Generally the
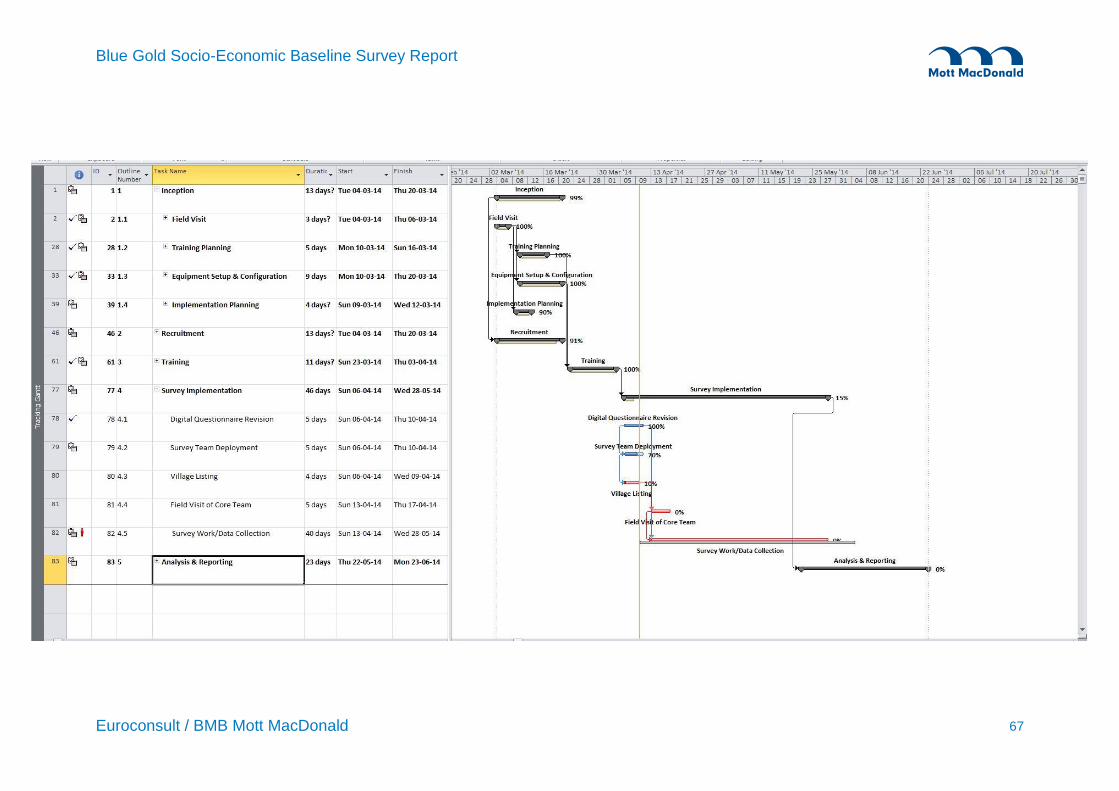
The following table contains the detailed task breakdown and workplan details for the BGBS. It may serve as a template for future iterations of the baseline/endline surveys.
Outline Number
Task Name Start Finish
1 Inception Tue 04-03-14 Thu 20-03-14
1.1 Field Visit Tue 04-03-14 Thu 06-03-14
1.1.1 Logistics: Training (Khulna) Tue 04-03-14 Tue 04-03-14
2.3 Procurement and Provision of Work Package Thu 13-03-14 Mon 17-03-14
Blue Gold Socio-Economic Baseline Survey Report
Euroconsult / BMB Mott MacDonald 66
2.3.1 IDs Thu 13-03-14 Mon 17-03-14 2.3.2 Bags Thu 13-03-14 Mon 17-03-14 2.3.3 Supervisors Cards Thu 13-03-14 Mon 17-03-14 2.3.4 Other Misc. Stationary Sun 16-03-14 Sun 16-03-14
3 Training Sun 23-03-14 Thu 03-04-14
3.1 Set up training Sun 23-03-14 Sun 23-03-14
3.1.1 Stationary Procurement Sun 23-03-14 Sun 23-03-14 3.1.2 Questionnaire printing etc. Sun 23-03-14 Sun 23-03-14
3.2 Paper based Training Mon 24-03-14 Wed 26-03-14
3.2.1 General BGBS guidelines Mon 24-03-14 Mon 24-03-14 3.2.2 Questionnaire Training Tue 25-03-14 Tue 25-03-14 3.2.3 Questionnaire Training Cont. Wed 26-03-14 Wed 26-03-14
3.3 Tablet Training Thu 27-03-14 Mon 31-03-14
3.3.1 Introduction to ODK Thu 27-03-14 Thu 27-03-14 3.3.2 Tablet Training Day 1 Fri 28-03-14 Fri 28-03-14 3.3.3 Tablet Training Day 2 Sat 29-03-14 Sat 29-03-14 3.3.4 Tablet Training Day 3 Sun 30-03-14 Sun 30-03-14 3.3.5 Saftey and Logistical Training Mon 31-03-14 Mon 31-03-14
3.4 Field Test & Piloting Tue 01-04-14 Wed 02-04-14 3.5 Debriefing Thu 03-04-14 Thu 03-04-14
4 Survey Implementation Thu 03-04-14 Wed 28-05-14
4.1 Digital Questionnaire Revision Sun 06-04-14 Thu 10-04-14 4.2 Survey Team Deployment Thu 03-04-14 Thu 10-04-14 4.3 Village Listing Sun 06-04-14 Wed 09-04-14 4.4 Field Visit of Core Team Sun 13-04-14 Thu 17-04-14 4.5 Survey Work/Data Collection Sun 13-04-14 Wed 28-05-14