BLUE OCEAN PLANNING & EXECUTION 8 Tools for Redesigning Business Models & Making Better Decisions Dr. Rod King [email protected]& http://businessmodels.ning.com http://twitter.com/RodKuhnKing
Transcript
BLUE OCEAN PLANNING & EXECUTION8 Tools for Redesigning Business Models & Making Better Decisions
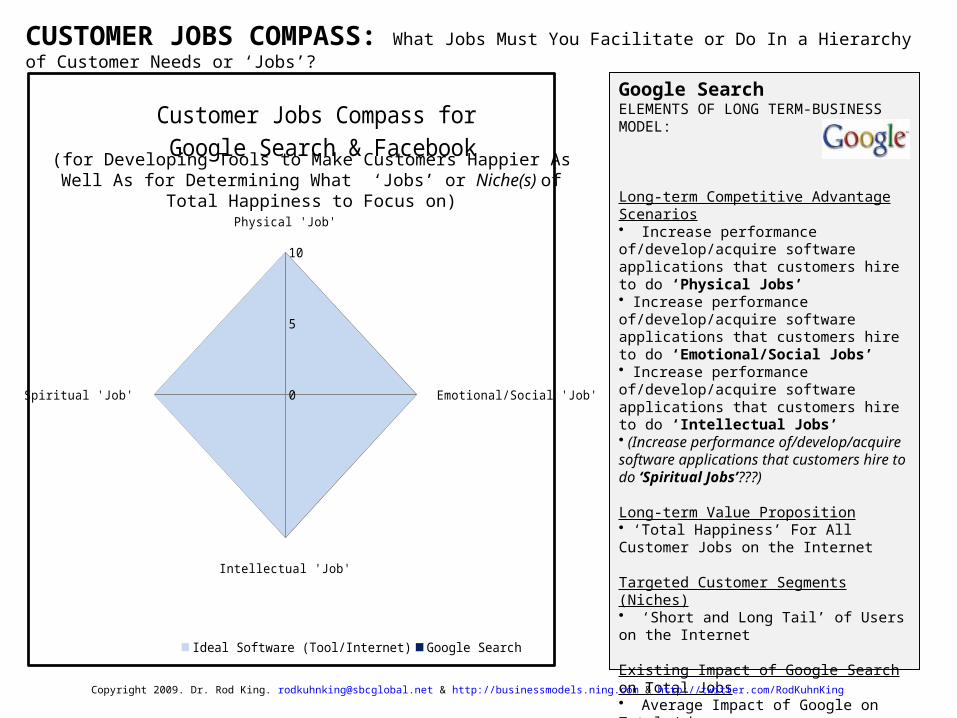
Customer Jobs Compass for Google Search & Facebook
Ideal Software (Tool/Internet) Google Search Facebook
Google SearchELEMENTS OF LONG TERM-BUSINESS MODEL:
Long-term Competitive Advantage Scenarios• Increase performance of/develop/acquire software applications that customers hire to do ‘Physical Jobs’• Increase performance of/develop/acquire software applications that customers hire to do ‘Emotional/Social Jobs’• Increase performance of/develop/acquire software applications that customers hire to do ‘Intellectual Jobs’• (Increase performance of/develop/acquire software applications that customers hire to do ‘Spiritual Jobs’???)
Long-term Value Proposition• ‘Total Happiness’ For All Customer Jobs on the Internet
Targeted Customer Segments (Niches)• ‘Short and Long Tail’ of Users on the Internet
Existing Impact of Google Search on Total Jobs• Average Impact of Google on Total Jobs = (6 + 2 + 5.5 + 2)/4 = 4.3
Impact of Ideal Software on Total JobsImpact of Ideal Software on Total Jobs =‘Perfect 10’
CUSTOMER JOBS COMPASS: What Jobs Must You Facilitate or Do In a Hierarchy of Customer Needs or ‘Jobs’?
Copyright 2009. Dr. Rod King. [email protected] & http://businessmodels.ning.com & http://twitter.com/RodKuhnKing
(for Developing Tools to Make Customers Happier As Well As for Determining What ‘Jobs’ or Niche(s) of Total Happiness to Focus on)
• Visualization of Shape as well as Trends of Competing, Desired, and Ideal Business Results (Models)
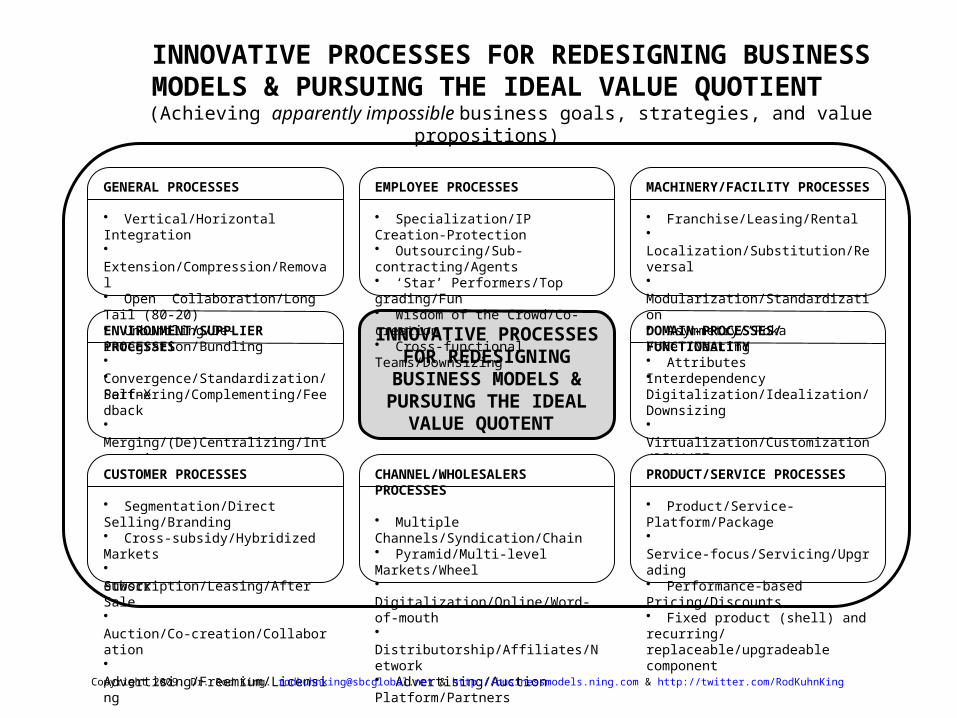
TOOLS FOR REDESIGNING BUSINESS MODELS &
MAKING BETTER DECSIONS
STRATEGY RADAR: 40,000ft
• Illustration of Detailed Shape of Competing, Desired, and Ideal Business Results (Models)• Design of Value Proposition
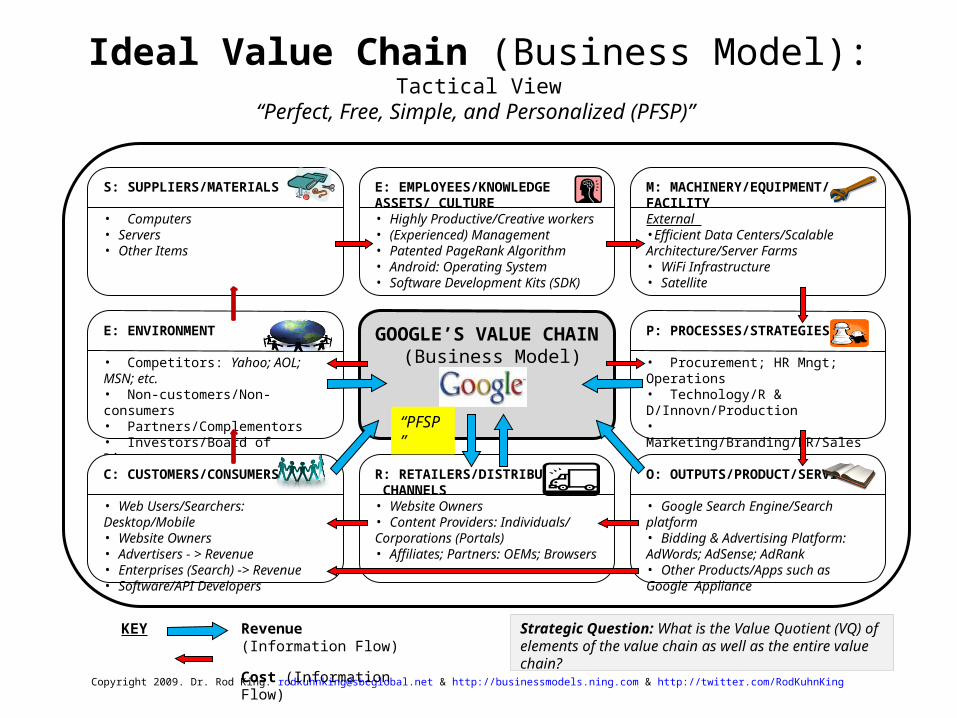
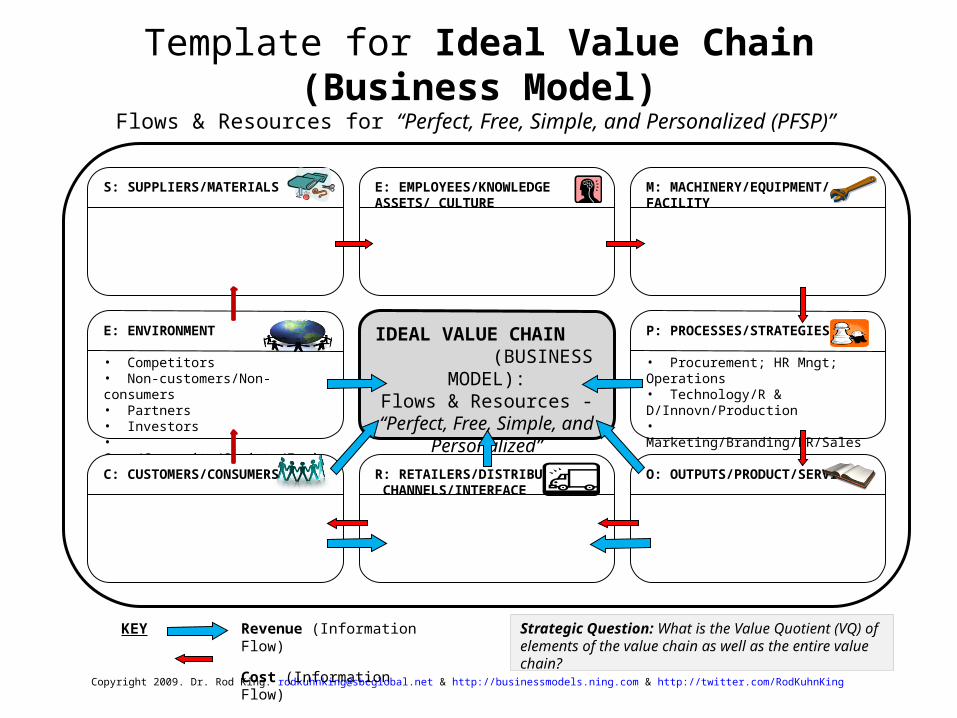
IDEAL VALUE CHAIN: Tactical View
• Visualization of Ideal Value Chain (Business Model) for IVQ Strategy• Flows of Information (Cost and Revenue) & Resources Within a Value Chain or Business Model
BLUE OCEAN RADAR: 200,000ft
• Illustration of Ideal Business Result• Illustration of “Cost vs. Benefit” Trade-offs (Contradictions) & Trends• Basic Elements of Value Quotient
BLUE OCEAN STRATEGIC PLAN
• Elements and Resources for Pursuing Goal of Ideal Value Quotient (Blue Ocean), Achieving Blue Ocean Plan, and Totally Engaging Employees and Other Stakeholders
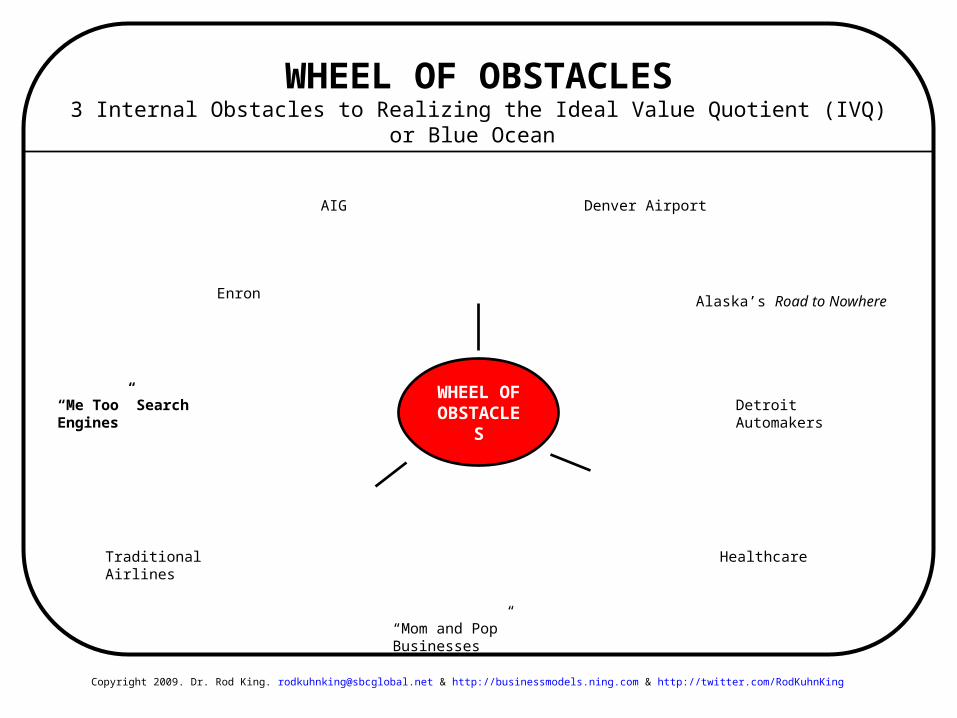
WHEEL OF OBSTACLES
• Illustration of Internal Obstacles and Constraints to Achieving the Ideal Value Quotient for the Value Chain or Business Model
BLUE OCEAN MAP: Global View
• Illustration of Current and Desired Positions of You & Your Competitors• Illustration of IVQ and Market Seg-ments Including Red and Blue Oceans
BOND: 100,000ft
Ways to Reduce Obstacles to Goal:• Facilitation of Decision-making• Visualization of Strategy• Modeling and Testing of Strategy
Copyright 2009. Dr. Rod King. [email protected] & http://businessmodels.ning.com & http://twitter.com/RodKuhnKing
8 Tools for Redesigning Business Models & Making Better Decisions
BLUE OCEAN RADAR: 200,000ft View of the Value Quotientfor Comparing, Evaluating, and Redesigning Business Models As Well As Products and Services
0 2 4 6 8 100
2
4
6
8
10
Blue Ocean Radar Showing “Cost vs. Benefit” Trade-offsBENEFIT (Revenue)
COST
Desired VQ = 8/2= 4
Existing VQ = 2/6= 0.33 < 1
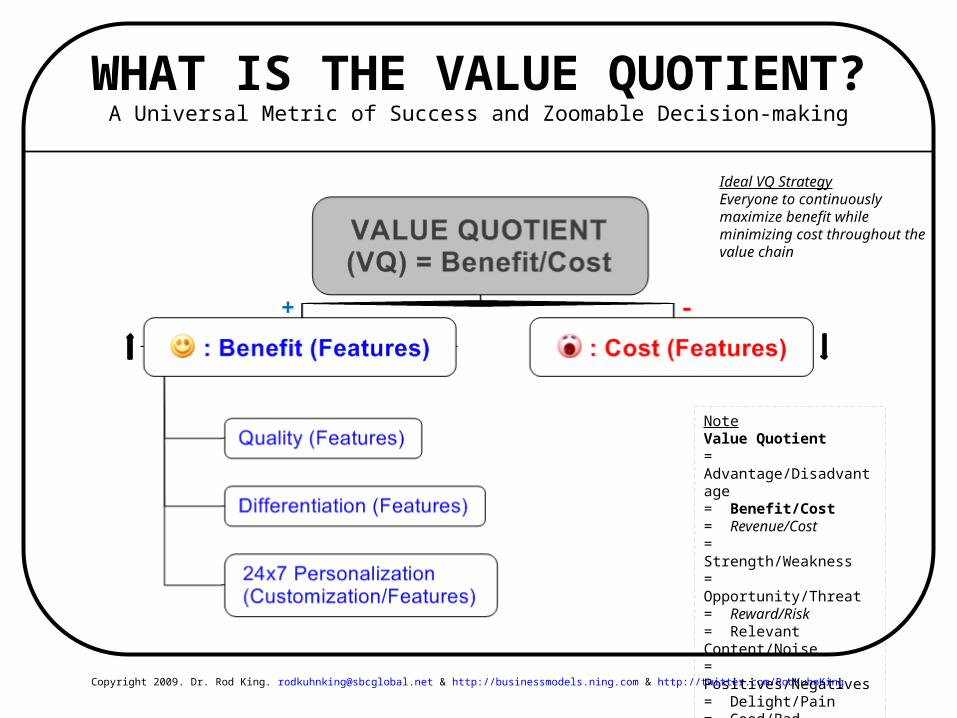
Value Quotient (VQ) = Benefit/Cost = Revenue/Cost = Revenue to Cost Ratio = Slope of Value Quotient Line
Copyright 2009. Dr. Rod King. [email protected] & http://businessmodels.ning.com & http://twitter.com/RodKuhnKing
Ideal Value Quotient(Blue Ocean)
Ideal Value Quotient (Blue Ocean) Ideal Final Result of Continuously Implementing IVQ Decisions Job To Be Done (JBTD) at No Cost & With No Negative Effect
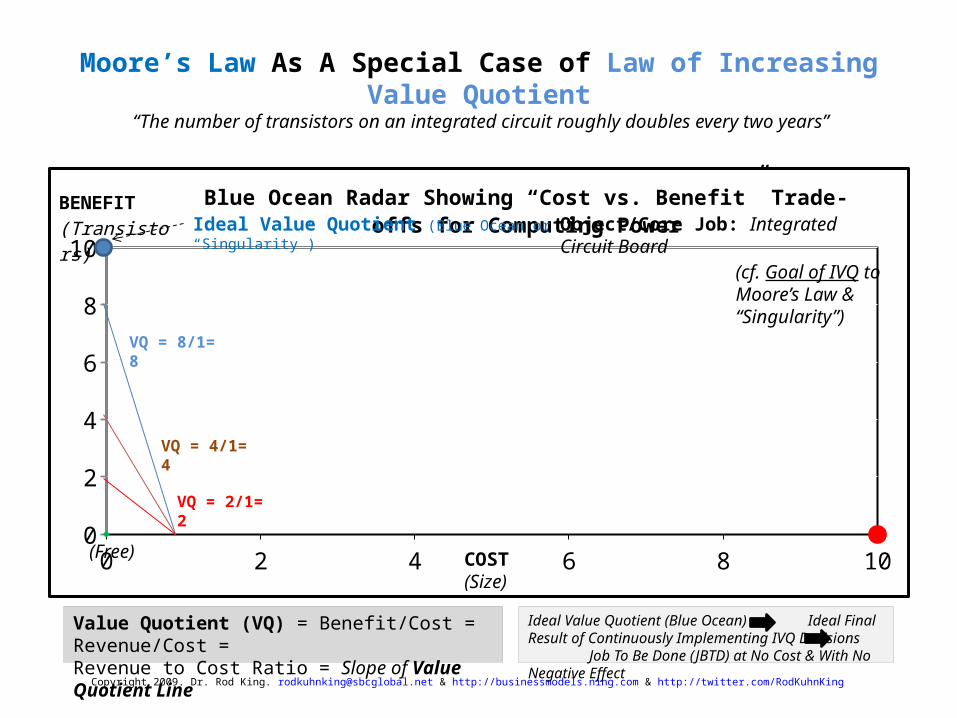
Moore’s Law As A Special Case of Law of Increasing Value Quotient “The number of transistors on an integrated circuit roughly doubles every two years”
0 2 4 6 8 100
2
4
6
8
10
Blue Ocean Radar Showing “Cost vs. Benefit” Trade-offs for Computing PowerBENEFIT (Transistors)
COST(Size)
VQ = 8/1= 8
Value Quotient (VQ) = Benefit/Cost = Revenue/Cost = Revenue to Cost Ratio = Slope of Value Quotient Line
Copyright 2009. Dr. Rod King. [email protected] & http://businessmodels.ning.com & http://twitter.com/RodKuhnKing
Ideal Value Quotient (Blue Ocean or “Singularity”)
(Free)
Object/Core Job: Integrated Circuit Board
(cf. Goal of IVQ to Moore’s Law & “Singularity”)
Ideal Value Quotient (Blue Ocean) Ideal Final Result of Continuously Implementing IVQ Decisions Job To Be Done (JBTD) at No Cost & With No Negative Effect
Blue Ocean Radar Showing “Cost vs. Benefit” Trade-offs in ComputingBENEFIT (Performance)
COST(Size)
Value Quotient (VQ) = Benefit/Cost = Revenue/Cost = Revenue to Cost Ratio = Slope of Value Quotient Line
Copyright 2009. Dr. Rod King. [email protected] & http://businessmodels.ning.com & http://twitter.com/RodKuhnKing
Ideal Value Quotient (INTERNET or “Singularity”)
(Free)
Object/Core Job: Computer/Storage Devices
Ideal Value Quotient (Blue Ocean) Ideal Final Result of Continuously Implementing IVQ Decisions Job To Be Done (JBTD) at No Cost & With No Negative Effect
Using the Blue Ocean Radar to Illustrate Trends in the Evolution of Technology
“The Ideal Object Uses Its Internal and “Free” Resources to Instantly Do Its Job at No Cost and Without Any Negative Effect”
IVQ –Problem Solving Look within and across industries as well as in nature for similar or analogous resolution of trade-off
Blue Ocean Radar Showing “Cost vs. Benefit” Trade-offs in TransportationBENEFIT (Speed)
COST(Size)
Value Quotient (VQ) = Benefit/Cost = Revenue/Cost = Revenue to Cost Ratio = Slope of Value Quotient Line
Copyright 2009. Dr. Rod King. [email protected] & http://businessmodels.ning.com & http://twitter.com/RodKuhnKing
Ideal Value Quotient (LIGHT or Blue Ocean)
(Free)
Ideal Value Quotient (Blue Ocean) Ideal Final Result of Continuously Implementing IVQ Decisions Job To Be Done (JBTD) at No Cost & With No Negative Effect
Using the Blue Ocean Radar to Illustrate Trends in the Evolution of Technology
“The Ideal Object Uses Its Internal and “Free” Resources to Instantly Do Its Job at No Cost and Without Any Negative Effect”
IVQ –Problem Solving Look within and across industries as well as in nature for similar or analogous resolution of trade-offRocket
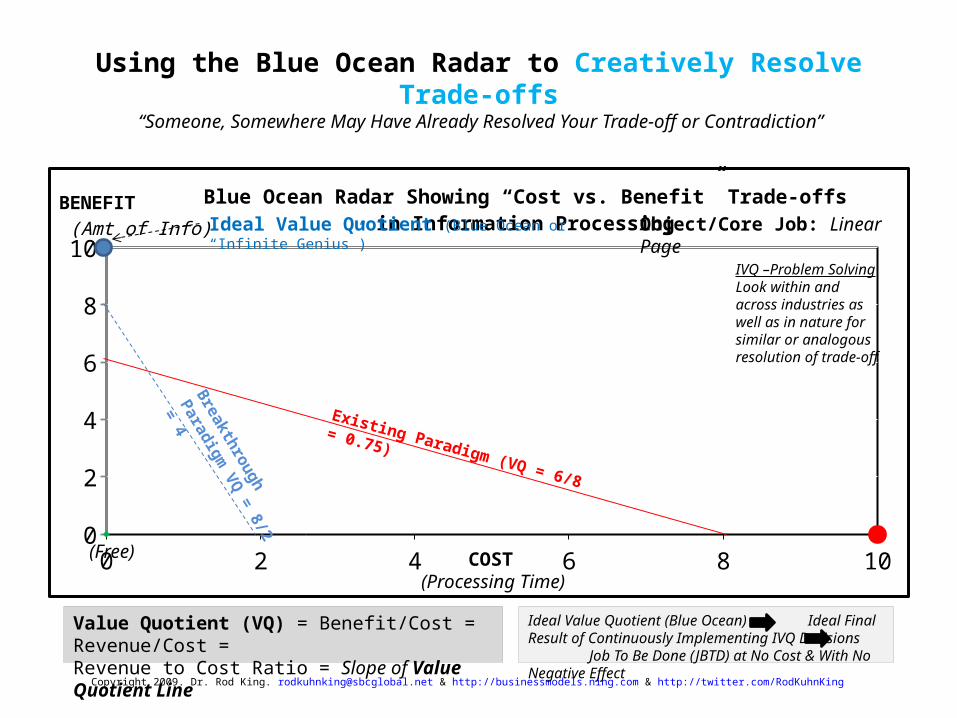
Using the Blue Ocean Radar to Creatively Resolve Trade-offs “Someone, Somewhere May Have Already Resolved Your Trade-off or Contradiction”
0 2 4 6 8 100
2
4
6
8
10
Blue Ocean Radar Showing “Cost vs. Benefit” Trade-offs in Information Process-ingBENEFIT
(Amt of Info)
COST (Processing Time)
Existing Paradigm (VQ = 6/8 = 0.75)
Value Quotient (VQ) = Benefit/Cost = Revenue/Cost = Revenue to Cost Ratio = Slope of Value Quotient Line
Copyright 2009. Dr. Rod King. [email protected] & http://businessmodels.ning.com & http://twitter.com/RodKuhnKing
Ideal Value Quotient (Blue Ocean or “Infinite Genius”)
(Free)
Ideal Value Quotient (Blue Ocean) Ideal Final Result of Continuously Implementing IVQ Decisions Job To Be Done (JBTD) at No Cost & With No Negative Effect
Breakthrough Paradigm
VQ = 8/2 = 4
IVQ –Problem Solving Look within and across industries as well as in nature for similar or analogous resolution of trade-off
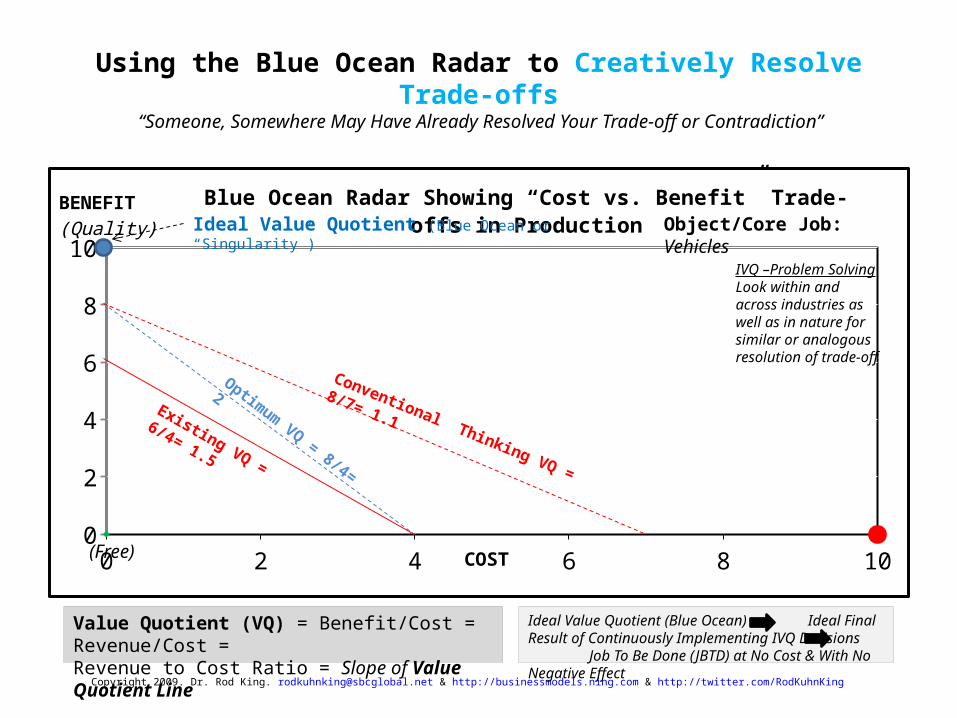
Using the Blue Ocean Radar to Creatively Resolve Trade-offs “Someone, Somewhere May Have Already Resolved Your Trade-off or Contradiction”
0 2 4 6 8 100
2
4
6
8
10
Blue Ocean Radar Showing “Cost vs. Benefit” Trade-offs in ProductionBENEFIT (Quality)
COST
Existing VQ = 6/4= 1.5
Value Quotient (VQ) = Benefit/Cost = Revenue/Cost = Revenue to Cost Ratio = Slope of Value Quotient Line
Copyright 2009. Dr. Rod King. [email protected] & http://businessmodels.ning.com & http://twitter.com/RodKuhnKing
Ideal Value Quotient (Blue Ocean or “Singularity”)
(Free)
Ideal Value Quotient (Blue Ocean) Ideal Final Result of Continuously Implementing IVQ Decisions Job To Be Done (JBTD) at No Cost & With No Negative Effect
Optimum VQ = 8/4= 2
Conventional Thinking VQ = 8/7= 1.1
IVQ –Problem Solving Look within and across industries as well as in nature for similar or analogous resolution of trade-off
Copyright 2009. Dr. Rod King. [email protected] & http://businessmodels.ning.com & http://twitter.com/RodKuhnKing
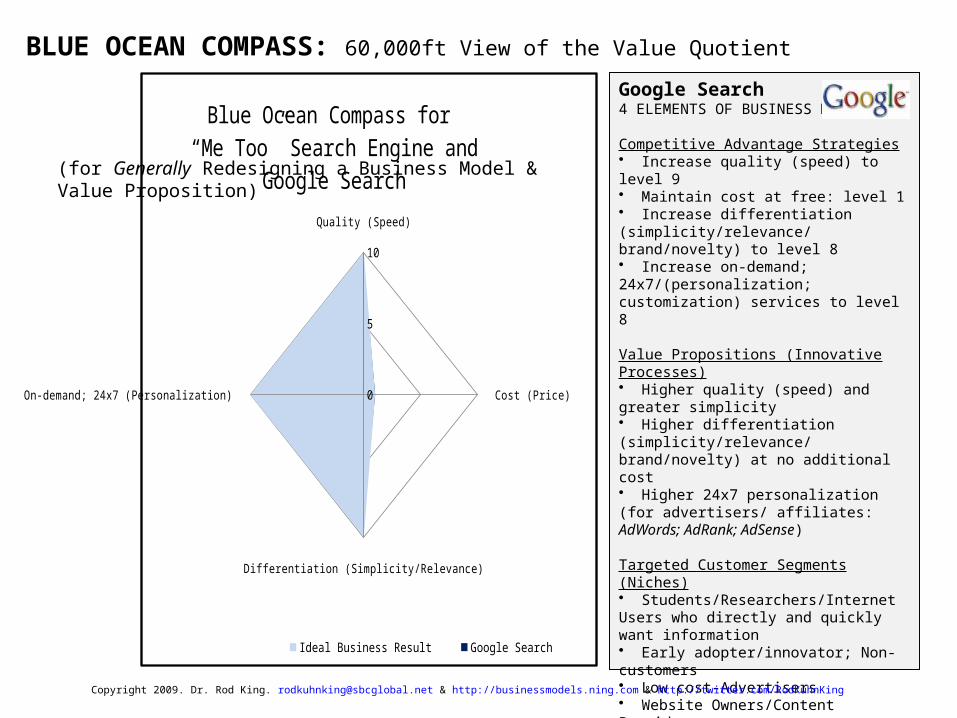
1. Obtain, from customer interviews or questionnaires, scores for the existing performance of each element or “value quotient factor” on the Blue Ocean Network Diagram (BOND) and for the surveyed or “Red Ocean” company.
Score each element of Value Quotient using a scale from 1 (low) to 10 (high):• Quality: (1-10)• Cost: (1-10)• Differentiation: (1-10)• Personalization (Customization): (1-10)
2. Plot, on a Blue Ocean Compass, the average score for each element. Then, draw the profile or radar chart for the existing performance of the surveyed company.
3. Explore scenarios for desired or future profiles that are strongly differentiated from “Red Ocean” profiles as well as lie closer to the “ideal” Blue Ocean.
4. Choose the Blue Ocean profile with the highest Value Quotient (VQ). Then, derive corresponding IVQ (Blue Ocean) strategies for competitive advantage and value propositions for segments (“niches”) of customers.
How to Quickly Develop an IVQ Strategy and Value Quotient
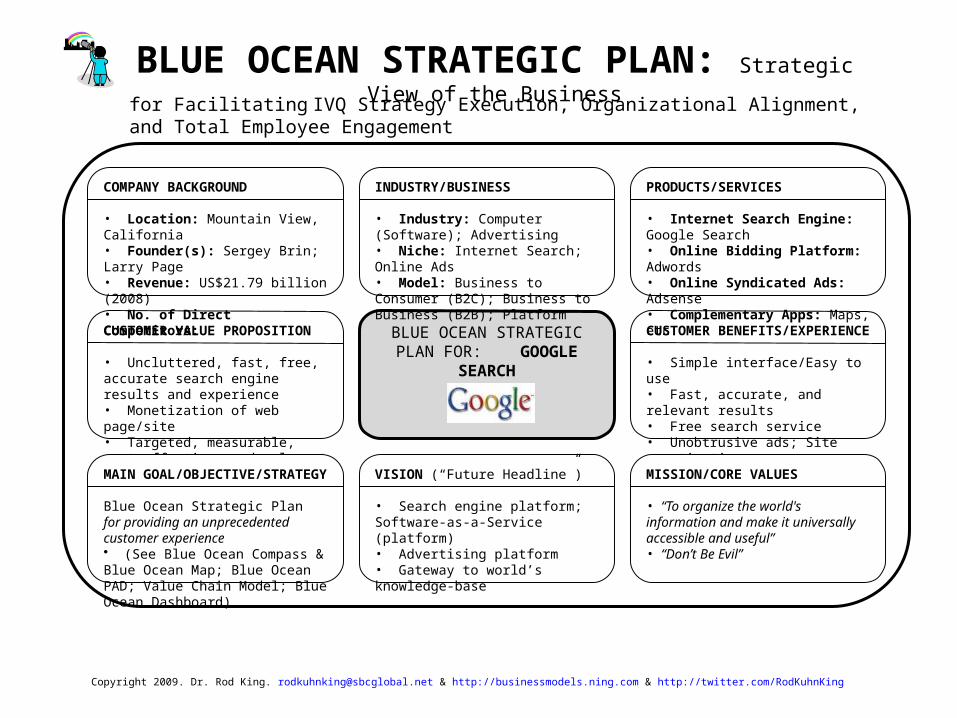
• Uncluttered, fast, free, accurate search engine results and experience• Monetization of web page/site• Targeted, measurable, cost-effective, and relevant online advertising
BLUE OCEAN STRATEGIC PLAN FOR: GOOGLE SEARCH
CUSTOMER BENEFITS/EXPERIENCE
• Simple interface/Easy to use• Fast, accurate, and relevant results• Free search service• Unobtrusive ads; Site monetization• Targeted ads based on page’s content
INDUSTRY/BUSINESS • Industry: Computer (Software); Advertising• Niche: Internet Search; Online Ads• Model: Business to Consumer (B2C); Business to Business (B2B); Platform
MAIN GOAL/OBJECTIVE/STRATEGY
Blue Ocean Strategic Plan for providing an unprecedented customer experience• (See Blue Ocean Compass & Blue Ocean Map; Blue Ocean PAD; Value Chain Model; Blue Ocean Dashboard)
MISSION/CORE VALUES
• “To organize the world's information and make it universally accessible and useful”• “Don’t Be Evil”
COMPANY BACKGROUND
• Location: Mountain View, California• Founder(s): Sergey Brin; Larry Page• Revenue: US$21.79 billion (2008)• No. of Direct Competitors:
PRODUCTS/SERVICES
• Internet Search Engine: Google Search• Online Bidding Platform: Adwords• Online Syndicated Ads: Adsense• Complementary Apps: Maps, etc.
Copyright 2009. Dr. Rod King. [email protected] & http://businessmodels.ning.com & http://twitter.com/RodKuhnKing
BLUE OCEAN STRATEGIC PLAN: Strategic View of the Businessfor Facilitating IVQ Strategy Execution, Organizational Alignment, and Total Employee Engagement
Copyright 2009. Dr. Rod King. [email protected] & http://businessmodels.ning.com & http://twitter.com/RodKuhnKing
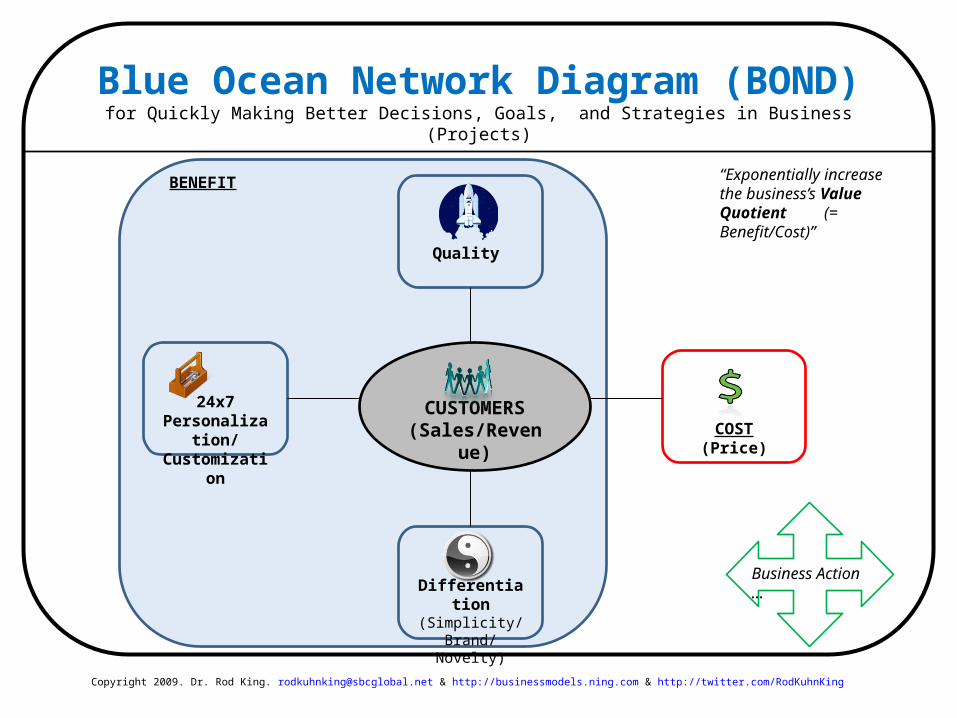
BLUE OCEAN NETWORK DIAGRAM (BOND)What and Why?
What is the Blue Ocean Network Diagram (BOND)?• A tool for redesigning business models, pursuing the Ideal Value Quotient (IVQ), and making better decisions • Universal tool and visual framework for quickly and systematically eliminating 3 critical obstacles to the Ideal Value Quotient (IVQ): poor business decisions; uninspiring business goals and targets; Red Ocean (“Me Too”) strategies & models• Global view of “What customers want” or “Voice of the Customer”
Why Blue Ocean Network Diagram (BOND)?• Facilitates decision-making for management and employees as well as board of directors• Facilitates organizational alignment and engagement especially for employees; everyone is on the same page and using the same metrics• Provides simple framework for visualizing Blue Ocean Strategy and IVQ• Provides simple visual framework for modeling as well as reviewing business strategies, objectives, models, assumptions, trade-offs, and decisions• Provides transparency in the selection and weighting of “value quotient factors” or decision-making criteria for evaluating possible business choices• Facilitates calculation of the value quotient for a business
Copyright 2009. Dr. Rod King. [email protected] & http://businessmodels.ning.com & http://twitter.com/RodKuhnKing
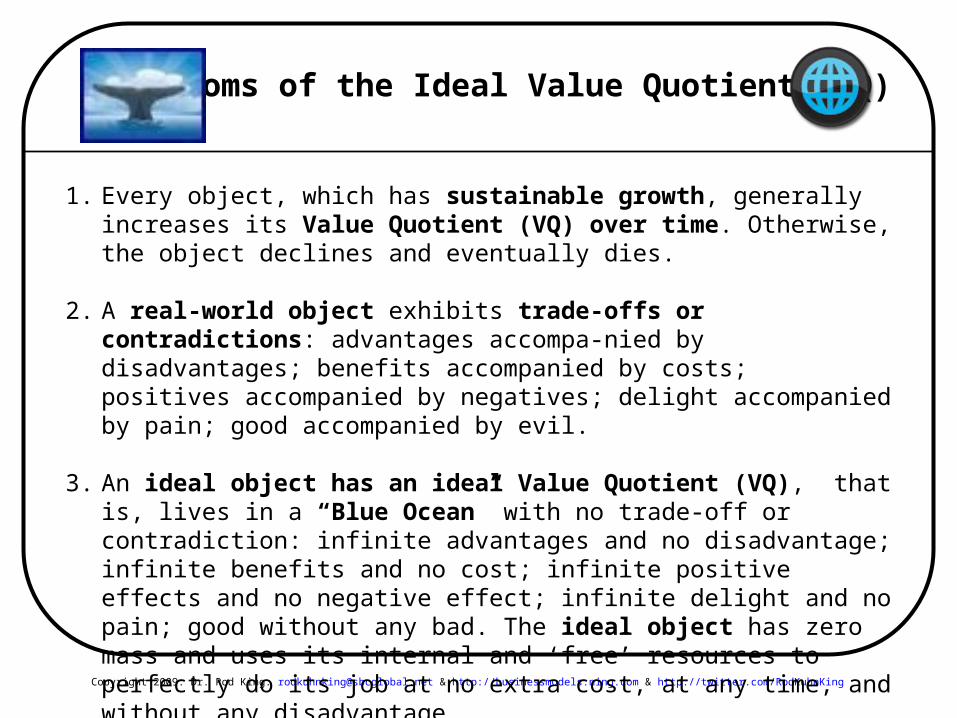
1. Every object, which has sustainable growth, generally increases its Value Quotient (VQ) over time. Otherwise, the object declines and eventually dies.
2. A real-world object exhibits trade-offs or contradictions: advantages accompa-nied by disadvantages; benefits accompanied by costs; positives accompanied by negatives; delight accompanied by pain; good accompanied by evil.
3. An ideal object has an ideal Value Quotient (VQ), that is, lives in a “Blue Ocean” with no trade-off or contradiction: infinite advantages and no disadvantage; infinite benefits and no cost; infinite positive effects and no negative effect; infinite delight and no pain; good without any bad. The ideal object has zero mass and uses its internal and ‘free’ resources to perfectly do its job at no extra cost, at any time, and without any disadvantage.
4. Over time, a species or an ecosystem of real-world objects evolves towards the ideal object. Otherwise, the species declines and becomes extinct.
Copyright 2009. Dr. Rod King. [email protected] & http://businessmodels.ning.com & http://twitter.com/RodKuhnKing
The Value Quotient (VQ) of a technological device as well as living system tends to follow the shape of an envelope of S-Curves that progresses towards a point of infinite Value Quotient. Otherwise, the technological device or living system declines and dies.
1. Battelle, J. (2005) The Search. New York: Portfolio. 2. Chesbrough, H. (2006) Open Business Models. Boston: Harvard Business School (HBS) Press. 3. Christensen, C.; Raynor, M.E. (2003) The Innovator’s Solution. Boston: Harvard Business School
(HBS) Press.4. Jarvis, J. (2009) What Would Google Do?. New York: HarperCollins.5. Kim, W.C.; Mauborgne, R. (2005) Blue Ocean Strategy. Boston: Harvard Business School (HBS)
Press.6. King, R. (2009) The Zoomable Page for Innovative Thinking in Space and Time: How Geniuses
and World-class Innovators Really Think … And How Anyone Can Do So in 1 Minute or Less.Fresno: Ideal-Solution Management.
7. Shuen, A. (2008) Web 2.0. California: O’Reilly.
Dr. Rod King
Speaker, Consultant, and Trainer on Business Model Analysis, Design, and Innovation