Open AcceMethodology articleMethylation Linear Discriminant Analysis (MLDA) for identifying differentially methylated CpG islandsWei Dai1, Jens M Teodoridis1, Janet Graham1, Constanze Zeller1, Tim HM Huang2, Pearlly Yan2, J Keith Vass3, Robert Brown*1 and Jim Paul4
Address: 1Ovarian Cancer Action Centre and Section of Epigenetics, Department of Oncology, Imperial College, Hammersmith Hospital, London, UK, 2Centre for Integrative Cancer Biology, Ohio State University, Columbus, USA, 3Translational Medicine Research Centre, University of Dundee, UK and 4The Beatson West of Scotland Cancer Centre, Cancer Research UK Clinical Trial Unit, Glasgow, UK
AbstractBackground: Hypermethylation of promoter CpG islands is strongly correlated to transcriptionalgene silencing and epigenetic maintenance of the silenced state. As well as its role in tumordevelopment, CpG island methylation contributes to the acquisition of resistance tochemotherapy. Differential Methylation Hybridisation (DMH) is one technique used for genome-wide DNA methylation analysis. The study of such microarray data sets should ideally account forthe specific biological features of DNA methylation and the non-symmetrical distribution of theratios of unmethylated and methylated sequences hybridised on the array. We have thereforedeveloped a novel algorithm tailored to this type of data, Methylation Linear Discriminant Analysis(MLDA).
Results: MLDA was programmed in R (version 2.7.0) and the package is available at CRAN [1].This approach utilizes linear regression models of non-normalised hybridisation data to definemethylation status. Log-transformed signal intensities of unmethylated controls on the microarrayare used as a reference. The signal intensities of DNA samples digested with methylation sensitiverestriction enzymes and mock digested are then transformed to the likelihood of a locus beingmethylated using this reference. We tested the ability of MLDA to identify loci differentiallymethylated as analysed by DMH between cisplatin sensitive and resistant ovarian cancer cell lines.MLDA identified 115 differentially methylated loci and 23 out of 26 of these loci have beenindependently validated by Methylation Specific PCR and/or bisulphite pyrosequencing.
Conclusion: MLDA has advantages for analyzing methylation data from CpG island microarrays,since there is a clear rational for the definition of methylation status, it uses DMH data withoutbetween-group normalisation and is less influenced by cross-hybridisation of loci. The MLDAalgorithm successfully identified differentially methylated loci between two classes of samplesanalysed by DMH using CpG island microarrays.
BackgroundDNA methylation frequently occurs in mammalian DNAat the 5 position of cytosine in CpG dinucleotides. It hasbeen estimated that over 70% of cytosines of CpG dinu-cleotides are methylated in the human genome. CpGdinucleotides are under-represented in the genome andmethylated CpG dinucleotides predominantly occurwithin repetitive elements [2]. However, there are CpGrich regions of the genome which generally remainunmethylated [3]. These CpG rich regions are known asCpG islands and are frequently located in the promoter orthe first exon regions of approximately 60% of all genes[4]. The unmethylated status of CpG islands is thought tobe a prerequisite state to maintain the linked gene in anactive transcribed and transcriptional permissive state.
Differential Methylation Hybridisation (DMH) is one ofseveral techniques for examining CpG island methylationat a genome-wide scale that has been applied to the iden-tification of aberrantly methylated gene promoters in var-ious cancers [5-12]. Nouzova et al[13] modified theoriginal method by using digestion with a methylation-dependent enzyme, McrBC. This enzyme only cleavesmethylated CpG DNA sequences. Within-sample compar-ison is applied after competitive hybridisation withMcrBC digested DNA and undigested (mock digested)DNA labelled with Cy3 and Cy5. If a locus is unmethyl-ated the signal intensities of Cy3 and Cy5 are equivalent,while if methylated the Cy5/Cy3 (undigested/digested)ratio is greater than one. However, no common referenceis generally used in the modified DMH method, and theunequal representation of methylated and unmethylatedsequences due to competitive hybridisation may reducesensitivity and specificity to detect differential methyla-tion.
Currently, Significance Analysis of Microarrays (SAM)[14] and Prediction Analysis for Microarrays (PAM) [15]are commonly applied in DNA methylation analysis.Based on the change in hybridisation relative to the stand-ard deviation of repeated measurements, SAM assignseach gene a score that is an extension of the t-statistic. Forsignificant genes with a score over a certain threshold,SAM uses permutations to estimate the false discovery rate(FDR). It has been implemented in many studies of geneexpression data [16-21] as well as DMH data, e.g. Wei etal. [22] applied SAM to find the differential methylationof CpG island loci between ovarian caner patient groupswith short and long progression-free survival (PFS). How-ever, SAM assumes that the microarray data conform toapproximate normality and symmetry, leading to the lossof power in the analysis of DMH data that are inherentlyskewed due to the biological features of DNA methylationin cancer and competitive hybridisation on DMH arrays(Figure 1).
In the modified DMH method, the ratios of raw signalintensities (undigested/digested) greater than 1 reflect thevarious methylation levels [13]. A ratio cut-off is generallyused to identify the hypermethylated loci [7]. However,this is an arbitrary value and does not necessarily accu-rately reflect the various sources of variation in the exper-iment. It is therefore desirable to develop an algorithm tomore objectively assess the methylation status of loci fromDMH data.
PAM is a nearest centroid shrinkage method that identifiesthose genes that discriminate best between classes. Thistechnique shrinks the class gene centroid towards theoverall centroid by a "threshold" amount after standardiz-ing each gene by its within class standard deviation. The"threshold" is identified by cross-validation. Thisapproach was applied in the study by Wei et al. [22] andshowed certain power in the identification of differen-tially methylated loci, but PAM is designed for class pre-diction rather than class comparison. Although the classpredictor used in PAM can reflect the difference betweenclasses, a large number of loci actually differentially meth-ylated between the classes are excluded to improve theaccuracy of prediction.
Although normalisation has become a standard proce-dure for the study of microarray data and is necessary forSAM and PAM analysis, unbalanced shifts in methylationstatus between class samples in DMH limit the use ofbetween-class normalisation which assumes the changesare roughly symmetric. Thus, the differential methylationcan be masked by the over-correction of normalisation
Distribution of log-transformed ratio of gene expression data in breast cancer and DMH data in A2780 cell lineFigure 1Distribution of log-transformed ratio of gene expres-sion data in breast cancer and DMH data in A2780 cell line. The left histogram shows the distribution of log-transformed ratios (cy3/cy5) in gene expression profiling data from a previous study of breast cancer 36] which is symmet-ric, while the right histogram shows the log-transformed ratios (undigested/digested) of DMH data from the present study which is skewed.
Page 2 of 12(page number not for citation purposes)
and it would be preferable to use a method of analysis thatdoes not require normalisation of the data.
Since PAM and SAM may have limitations for analysingDMH data, we have developed an alternative approachbased on the specific features and known biological prop-erties of the arrays used for DMH analysis. The algorithmis named as Methylation Linear Discriminant Analysis(MLDA) and has been applied to identify a set of loci dif-ferentially methylated between ovarian cisplatin sensitiveand resistant cancer cell lines.
ResultsOutline of MLDAIn this study, we have developed a novel approach, namedMLDA, for analysing CpG island microarray hybridisationdata that allows the identification of differentially methyl-ated loci. MLDA was programmed in R (version 2.7.0)and the package is available at CRAN [1]. This approachuses three relatively simple linear regression models. Thefirst one is constructed by the log-transformed signalintensities of unmethylated features and used as the refer-ence for unmethylation (Figure 2b). The second one is theintermediate model constructed through the point corre-sponding to the 97.5-quantiles residual below the first lin-ear regression line (Figure 2c). The features with astandardised residual less than 2 from this intermediatemodel are used to generate the third model which is usedas the reference for methylation (Figure 2d). The log like-lihood ratio of a locus being methylated is then propor-tional to the difference between the squared standardisedresidual from the methylated line and that from theunmethylated line. The log likelihood threshold of zerothen provides a more rational basis for distinguishingbetween methylated and unmethylated loci than a robustundigested/digested ratio of 1.5, as it takes into accountthe observed variability in the experiment.
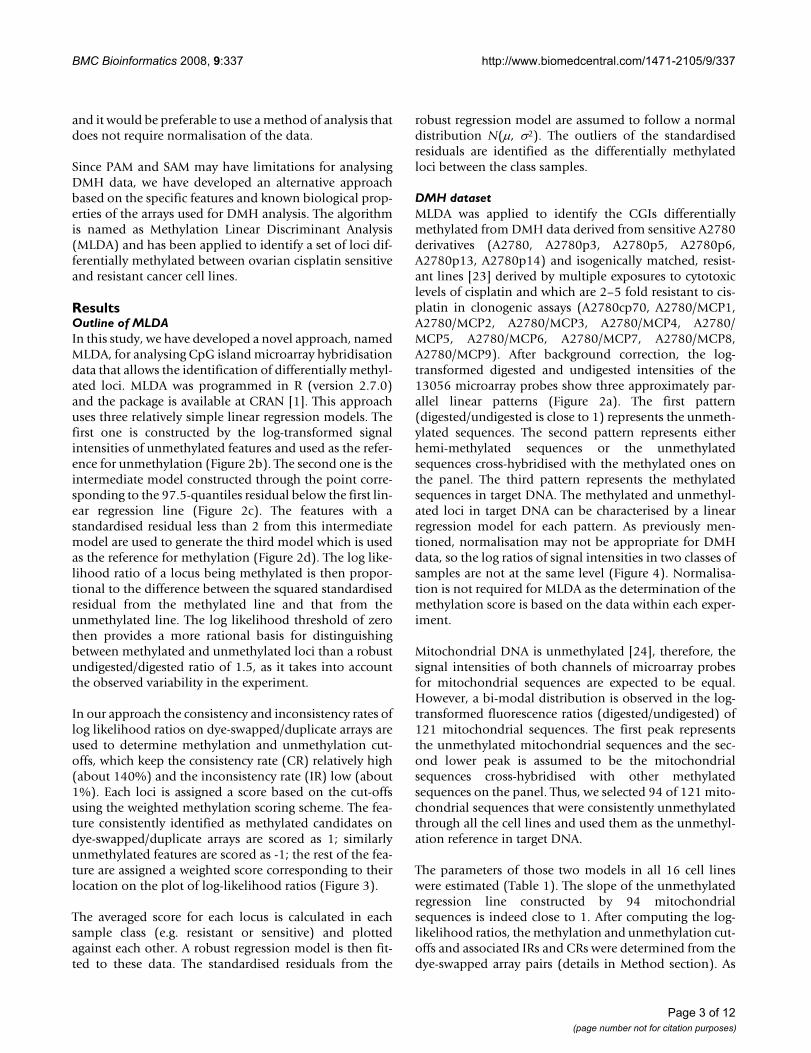
In our approach the consistency and inconsistency rates oflog likelihood ratios on dye-swapped/duplicate arrays areused to determine methylation and unmethylation cut-offs, which keep the consistency rate (CR) relatively high(about 140%) and the inconsistency rate (IR) low (about1%). Each loci is assigned a score based on the cut-offsusing the weighted methylation scoring scheme. The fea-ture consistently identified as methylated candidates ondye-swapped/duplicate arrays are scored as 1; similarlyunmethylated features are scored as -1; the rest of the fea-ture are assigned a weighted score corresponding to theirlocation on the plot of log-likelihood ratios (Figure 3).
The averaged score for each locus is calculated in eachsample class (e.g. resistant or sensitive) and plottedagainst each other. A robust regression model is then fit-ted to these data. The standardised residuals from the
robust regression model are assumed to follow a normaldistribution N(μ, σ2). The outliers of the standardisedresiduals are identified as the differentially methylatedloci between the class samples.
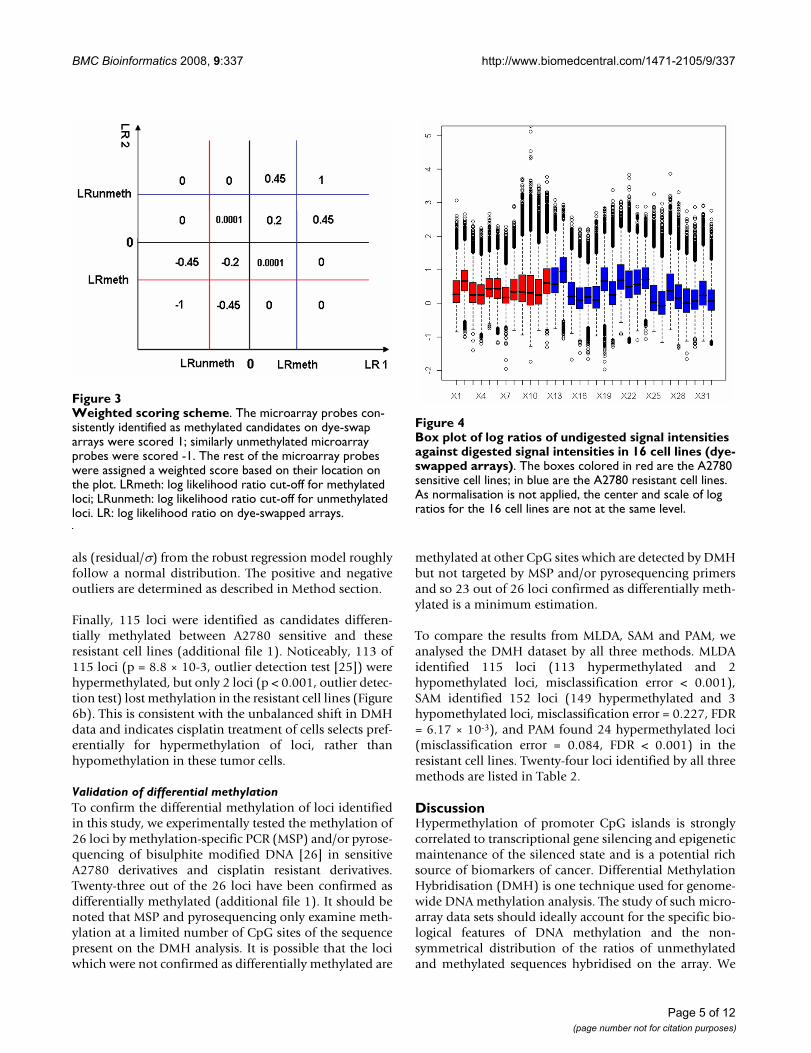
DMH datasetMLDA was applied to identify the CGIs differentiallymethylated from DMH data derived from sensitive A2780derivatives (A2780, A2780p3, A2780p5, A2780p6,A2780p13, A2780p14) and isogenically matched, resist-ant lines [23] derived by multiple exposures to cytotoxiclevels of cisplatin and which are 2–5 fold resistant to cis-platin in clonogenic assays (A2780cp70, A2780/MCP1,A2780/MCP2, A2780/MCP3, A2780/MCP4, A2780/MCP5, A2780/MCP6, A2780/MCP7, A2780/MCP8,A2780/MCP9). After background correction, the log-transformed digested and undigested intensities of the13056 microarray probes show three approximately par-allel linear patterns (Figure 2a). The first pattern(digested/undigested is close to 1) represents the unmeth-ylated sequences. The second pattern represents eitherhemi-methylated sequences or the unmethylatedsequences cross-hybridised with the methylated ones onthe panel. The third pattern represents the methylatedsequences in target DNA. The methylated and unmethyl-ated loci in target DNA can be characterised by a linearregression model for each pattern. As previously men-tioned, normalisation may not be appropriate for DMHdata, so the log ratios of signal intensities in two classes ofsamples are not at the same level (Figure 4). Normalisa-tion is not required for MLDA as the determination of themethylation score is based on the data within each exper-iment.
Mitochondrial DNA is unmethylated [24], therefore, thesignal intensities of both channels of microarray probesfor mitochondrial sequences are expected to be equal.However, a bi-modal distribution is observed in the log-transformed fluorescence ratios (digested/undigested) of121 mitochondrial sequences. The first peak representsthe unmethylated mitochondrial sequences and the sec-ond lower peak is assumed to be the mitochondrialsequences cross-hybridised with other methylatedsequences on the panel. Thus, we selected 94 of 121 mito-chondrial sequences that were consistently unmethylatedthrough all the cell lines and used them as the unmethyl-ation reference in target DNA.
The parameters of those two models in all 16 cell lineswere estimated (Table 1). The slope of the unmethylatedregression line constructed by 94 mitochondrialsequences is indeed close to 1. After computing the log-likelihood ratios, the methylation and unmethylation cut-offs and associated IRs and CRs were determined from thedye-swapped array pairs (details in Method section). As
Page 3 of 12(page number not for citation purposes)
shown in Figure 5, IR tends to rise with the increase of CRslowly, but starts to increase dramatically when the CRgoes above 140%, at which point IR is generally about1%. We have therefore used CR > 140% and IR < 1% asthe criteria for determining the methylation and unmeth-
ylation cut-offs. Each locus was scored using the weightedscoring scheme based on those cut-offs. The averagedscores in 6 cisplatin-sensitive cell lines and 10 cisplatin-resistant cell lines were used to construct a robust regres-sion model. Figure 6a shows that the standardised residu-
An illustration of unmethylated and methylated model construction in MLDA in A2780 cell lineFigure 2An illustration of unmethylated and methylated model construction in MLDA in A2780 cell line. a: Three pat-terns can be observed on the scatter plot of log-transformed Cy3 (undigested) against log-transformed Cy5 (digested) intensi-ties. b: The unmethylated model constructed using 94 mitochondrial sequences as a unmethylation reference. c: The intermediate model constructed through the 97.5 quantile residual. The point X is the 97.5 quantile residual. The microarray probes colored in blue (standardised residual to the intermediate model is less than 2) are selected to construct the methyl-ated model. d: Methylated (in blue) and unmethylated (in red) models in A2780 cell line.
a b
dc
X(R.975,G.975)
Page 4 of 12(page number not for citation purposes)
als (residual/σ) from the robust regression model roughlyfollow a normal distribution. The positive and negativeoutliers are determined as described in Method section.
Finally, 115 loci were identified as candidates differen-tially methylated between A2780 sensitive and theseresistant cell lines (additional file 1). Noticeably, 113 of115 loci (p = 8.8 × 10⁻³, outlier detection test [25]) werehypermethylated, but only 2 loci (p < 0.001, outlier detec-tion test) lost methylation in the resistant cell lines (Figure6b). This is consistent with the unbalanced shift in DMHdata and indicates cisplatin treatment of cells selects pref-erentially for hypermethylation of loci, rather thanhypomethylation in these tumor cells.
Validation of differential methylationTo confirm the differential methylation of loci identifiedin this study, we experimentally tested the methylation of26 loci by methylation-specific PCR (MSP) and/or pyrose-quencing of bisulphite modified DNA [26] in sensitiveA2780 derivatives and cisplatin resistant derivatives.Twenty-three out of the 26 loci have been confirmed asdifferentially methylated (additional file 1). It should benoted that MSP and pyrosequencing only examine meth-ylation at a limited number of CpG sites of the sequencepresent on the DMH analysis. It is possible that the lociwhich were not confirmed as differentially methylated are
methylated at other CpG sites which are detected by DMHbut not targeted by MSP and/or pyrosequencing primersand so 23 out of 26 loci confirmed as differentially meth-ylated is a minimum estimation.
To compare the results from MLDA, SAM and PAM, weanalysed the DMH dataset by all three methods. MLDAidentified 115 loci (113 hypermethylated and 2hypomethylated loci, misclassification error < 0.001),SAM identified 152 loci (149 hypermethylated and 3hypomethylated loci, misclassification error = 0.227, FDR= 6.17 × 10⁻³), and PAM found 24 hypermethylated loci(misclassification error = 0.084, FDR < 0.001) in theresistant cell lines. Twenty-four loci identified by all threemethods are listed in Table 2.
DiscussionHypermethylation of promoter CpG islands is stronglycorrelated to transcriptional gene silencing and epigeneticmaintenance of the silenced state and is a potential richsource of biomarkers of cancer. Differential MethylationHybridisation (DMH) is one technique used for genome-wide DNA methylation analysis. The study of such micro-array data sets should ideally account for the specific bio-logical features of DNA methylation and the non-symmetrical distribution of the ratios of unmethylatedand methylated sequences hybridised on the array. We
Weighted scoring schemeFigure 3Weighted scoring scheme. The microarray probes con-sistently identified as methylated candidates on dye-swap arrays were scored 1; similarly unmethylated microarray probes were scored -1. The rest of the microarray probes were assigned a weighted score based on their location on the plot. LRmeth: log likelihood ratio cut-off for methylated loci; LRunmeth: log likelihood ratio cut-off for unmethylated loci. LR: log likelihood ratio on dye-swapped arrays.
Box plot of log ratios of undigested signal intensities against digested signal intensities in 16 cell lines (dye-swapped arrays)Figure 4Box plot of log ratios of undigested signal intensities against digested signal intensities in 16 cell lines (dye-swapped arrays). The boxes colored in red are the A2780 sensitive cell lines; in blue are the A2780 resistant cell lines. As normalisation is not applied, the center and scale of log ratios for the 16 cell lines are not at the same level.
Page 5 of 12(page number not for citation purposes)
have therefore developed a novel algorithm tailored tothis type of data, Methylation Linear Discriminant Analy-sis (MLDA). MLDA utilises log likelihood ratios represent-ing the relative probability that loci are methylatedinstead of log ratios of signal intensities used in previousstudies [6-10,27]. Validation of 23/26 identified lociusing independent methods of methylation analysis
shows that MLDA can robustly identify differential meth-ylated loci between ovarian cancer sensitive and resistantcell lines without requiring the data to be normalised.
Although a log likelihood ratio above zero means that thelocus tends to be methylated, we did not use zero as thecut-off to determine the number of methylated and
CR against IR in 16 cell linesFigure 5CR against IR in 16 cell lines. X axis is the consistency rate (CR) and y axis is the inconsistency rate (IR). IR tends to rise with the increase of CR slowly, but starts to increase dramatically when the CR goes above 140%, at which point the inconsist-ency rate is generally about 1%. Not all cell lines could reach this point e.g. MCP3.
Page 6 of 12(page number not for citation purposes)
unmethylated sequences, as the existence of cross-hybrid-isation and measurement errors in the DMH assay makesthis unreliable. To increase the precision of the methyla-tion classification, we used the inconsistency (IR) andconsistency (CR) rates between the dye-swap arrays todetermine likelihood ratio cut-offs for methylation andunmethylation and assigned each locus a methylationscore based on the position relative to these cut-offs. Asshown in Figure 5, not all cell lines can reach the pointthat CR is around 140% and IR is about 1%. IR and CRneed to be carefully selected as the methylation scores ofloci are consequently influenced by the change of IR andCR. We also observed a lower CR (about 120%) and ahigher IR (about 2%) in another CpG island array usingDMH (data not shown), therefore, further examination ofwhat factors influence the achievable CR and IR rates mayimprove the utility of the MLDA approach.
Data on methylation status for 121 mitochondrial derivedsequences were available in this study. Mitochondrialsequences would be expected to be unmethylated. Weused 94 mitochondrial sequences to construct unmethyl-ated linear model at the beginning of the study, andindeed, 93 of 121 mitochondrial loci were defined asunmethylated and 25 loci being of uncertain methylationstatus by MLDA. However, three mitochondrial loci wereidentified as hypermethylated candidates in the resistantovarian carcinoma cell lines by both MLDA and SAM.One explanation of this discrepancy is that all these threeloci have more than one BLAT hit indicating the existenceof homology with nuclear DNA sequences, raising thepossibility of hybridisation with these nuclear DNAsequences which may be differentially methylated. As
shown in Figure 2a, the loci in the middle pattern repre-sent either hemi-methylated sequences or the unmethyl-ated sequences cross-hybridised with the methylated oneson the panel. No specific allowance is made for theseintermediate points in analysis by SAM and PAM, whereasMLDA attempts specifically to down-weight these pointsin the identification of the methylation regression line. Bygiving a lower weighted score (close to 0) (Figure 3) tothose loci, MLDA reduces the influence of cross-hybridisa-tion among this group of sequences. Of course cross-hybridisation may also occur in the loci in the other twopatterns (methylated and unmethylated patterns), but it isnot possible for any mathematical approach to identifythis.
The misclassification error of MLDA based on the methyl-ation score is much lower than that for either SAM or PAMbased on the log ratios, indicating the potential of MLDAmethylation scores to be used as a reliable discriminatorbetween classes of samples.
ConclusionWe have developed a novel method, named MLDA, forgenome-wide DNA methylation studies. MLDA can trans-form the signal intensities to log-likelihood ratios throughthree linear regression models. Using this approachMLDA allows determination of the methylation status ofa locus based on dye-swapped/duplicate arrays. Themethod has been applied to assess the methylation statusof each locus and identified 115 loci that exhibit differen-tial methylation between A2780 sensitive and resistantcell lines. A minimum of 23 out of 26 loci have been con-firmed by independent methods as differentially methyl-ated.
MethodsFirst, all intensity values were log transformed. A multipli-cative background correction was applied to correct signalintensities for the background noise in each array. Afterbackground correction, the log-transformed digested andundigested intensities show three approximately parallellinear patterns (Figure 2a). The first pattern (digested/undigested is close to 1) represents the unmethylatedsequences. The second pattern represents either hemi-methylated sequences or the unmethylated sequencescross-hybridised with the methylated ones on the panel.The third pattern represents the methylated sequences intarget DNA. The methylated and unmethylated loci in tar-get DNA can be characterised by a linear regression modelfor each pattern. The distance of each spot to the methyl-ated and unmethylated lines respectively can then be esti-mated by standardised residuals. The log likelihood ratioof a locus being methylated is then proportional to thedifference between the squared standardised residualfrom the methylated line and that from the unmethylated
Outliers identificationsFigure 6Outliers identifications. a: Distribution of the observed (histogram) standardised residuals and the theoretical distri-bution based on the fitted model (dashed smooth line in red). The red and blue solid line are the positive and negative cut-offs, respectively. b: Scatter plot of sensitive scores against resistant scores in A2780 series cell lines. The hypermethyl-ated loci are colored in red and hypomethylated loci are in blue. The robust regression model is Y = 0.9956X + 0.0019.
a b
Page 7 of 12(page number not for citation purposes)
one. The algorithm based around this regression approachis named Methylation Linear Discriminant Analysis(MLDA) and was programmed in R version 2.7.0.
Log-likelihood ratio transformationa An univariate linear regression model was constructedfor the unmethylated probes (e.g. mitochondrial derivedfeatures) using formula (1) where α is the intercept, β isthe slope of the model, and ξ is the error representing theunpredicted or unexplained variation in the model (Fig-ure 2b). The parameters of regression line were estimatedby the method of least squares (formula 2 and 3).
Gi = α + βRi + ξi i = 1,2,3.......k (1)
k is the number of unmethylated controls on DMH array.Gi and Ri are the logarithmic-transformed digested and
undigested intensities of microarray probes for mitochon-
drial sequences, respectively. and are the averagedlogarithmic-transformed undigested and digested intensi-ties of the k unmethylated controls.
ˆ ( )( )
( ), , .......b = − −∑
−∑=Ri R Gi G
Ri Ri k
21 2 3 (2)
ˆ ˆa b= −R G (3)
G R
Table 1: Parameters of linear models in MLDA for 16 cell lines in DMH dataset I
Unmethylation linear regression modelcell line intercetp (α) slope (β) σ R2 interceptds (α) slopeds (β) σds R2ds
b. The scale estimate σmito associated with the error termin the linear regression model was estimated from theresiduals from the observed k points to the fitted line. Themost extreme 10% of residuals was omitted from eitherend of the distribution to minimise the impact of extremeresiduals on this estimate.
c. The standardised residuals of all the microarray probesto the unmethylation regression line were calculated asformula (4).
d. The point corresponding to the 97.5-quantiles residualbelow the unmethylation line is represented as X (R.975,G.975). The intermediate linear model (Figure 2c) wasconstructed through point X with a slope assumed to be 1and the intercept estimated as formula (5).
e. The standardised residuals of all the microarray probesto the line with slope 1 and intercept estimated from (5)were calculated as formula (6). The variance of the resid-uals to the intermediate model was assumed to be similaras that in the mitochondrial model.
f. The microarray probes with standardised residuals lessthan 2 were included for later robust regression analysis.The line estimated from this regression analysis representsthe methylation regression line (Figure 2d).
g. The scale estimate σmeth of the methylation regressionline was estimated using only those microarray probesbelow the line, with the most extreme 5% removed.
h. The standardised residuals of all the microarray probesto the methylated regression line were calculated as for-mula (7). The log likelihood ratio (LR) of all the microar-ray probes was estimated by formula (8) for furtheranalysis.
SRresidualsmito
mitomito =
s(4)
ˆ .. .a s= − +G R mito975 975 1 96 (5)
SRresiduals
mito.
.975
975=s
(6)
Table 2: 24 loci identified by MLDA, PAM and SAM as differentially methylated candidates in the comparison between A2780 cisplatin sensitive and cisplatin multiple-selected resistant cell lines.
ND: not done. Yes: validated. No: not validatedMLDA rank*: the rank of standardised residuals to the robust regression line constructed by the averaged sensitive scores against averaged resistant scoresGene symbol**: only the gene of which transcription start site (TSS) is within 5 kb span of the lociCGI***: CpG island defined by Gardiner-Garden and Frommer [31].
Page 9 of 12(page number not for citation purposes)
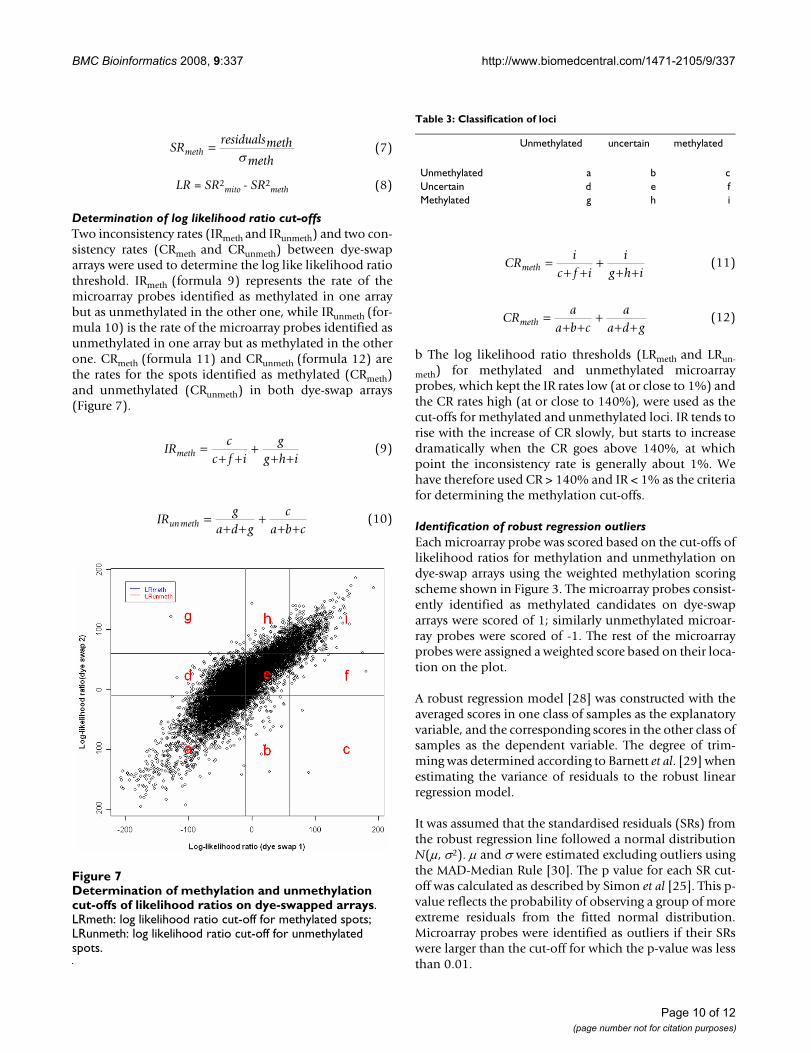
Determination of log likelihood ratio cut-offsTwo inconsistency rates (IRmeth and IRunmeth) and two con-sistency rates (CRmeth and CRunmeth) between dye-swaparrays were used to determine the log like likelihood ratiothreshold. IRmeth (formula 9) represents the rate of themicroarray probes identified as methylated in one arraybut as unmethylated in the other one, while IRunmeth (for-mula 10) is the rate of the microarray probes identified asunmethylated in one array but as methylated in the otherone. CRmeth (formula 11) and CRunmeth (formula 12) arethe rates for the spots identified as methylated (CRmeth)and unmethylated (CRunmeth) in both dye-swap arrays(Figure 7).
b The log likelihood ratio thresholds (LRmeth and LRun-
meth) for methylated and unmethylated microarrayprobes, which kept the IR rates low (at or close to 1%) andthe CR rates high (at or close to 140%), were used as thecut-offs for methylated and unmethylated loci. IR tends torise with the increase of CR slowly, but starts to increasedramatically when the CR goes above 140%, at whichpoint the inconsistency rate is generally about 1%. Wehave therefore used CR > 140% and IR < 1% as the criteriafor determining the methylation cut-offs.
Identification of robust regression outliersEach microarray probe was scored based on the cut-offs oflikelihood ratios for methylation and unmethylation ondye-swap arrays using the weighted methylation scoringscheme shown in Figure 3. The microarray probes consist-ently identified as methylated candidates on dye-swaparrays were scored of 1; similarly unmethylated microar-ray probes were scored of -1. The rest of the microarrayprobes were assigned a weighted score based on their loca-tion on the plot.
A robust regression model [28] was constructed with theaveraged scores in one class of samples as the explanatoryvariable, and the corresponding scores in the other class ofsamples as the dependent variable. The degree of trim-ming was determined according to Barnett et al. [29] whenestimating the variance of residuals to the robust linearregression model.
It was assumed that the standardised residuals (SRs) fromthe robust regression line followed a normal distributionN(μ, σ2). μ and σ were estimated excluding outliers usingthe MAD-Median Rule [30]. The p value for each SR cut-off was calculated as described by Simon et al [25]. This p-value reflects the probability of observing a group of moreextreme residuals from the fitted normal distribution.Microarray probes were identified as outliers if their SRswere larger than the cut-off for which the p-value was lessthan 0.01.
SRresidualsmeth
methmeth =
s(7)
IRc
c f ig
g h imeth =+ +
++ +
(9)
IRg
a d gc
a b cunmeth =+ +
++ +
(10)
CRi
c f ii
g h imeth =+ +
++ +
(11)
CRa
a b ca
a d gmeth =+ +
++ +
(12)
Determination of methylation and unmethylation cut-offs of likelihood ratios on dye-swapped arraysFigure 7Determination of methylation and unmethylation cut-offs of likelihood ratios on dye-swapped arrays. LRmeth: log likelihood ratio cut-off for methylated spots; LRunmeth: log likelihood ratio cut-off for unmethylated spots.
Table 3: Classification of loci
Unmethylated uncertain methylated
Unmethylated a b cUncertain d e fMethylated g h i
Page 10 of 12(page number not for citation purposes)
Estimation of misclassification rateThe misclassification rate was estimated by drawing boot-strap samples 500 times with replacement from the twoclasses (sensitive and resistant) and carrying out hierarchi-cal clustering based on the loci identified as differentiallymethylated using weighted scores for MLDA and log ratioswithout between-group normalisation for SAM and PAM,respectively. Clustering was carried out using Euclideandistance as the distance metric, and clusters were agglom-erated using the average linkage criterion. The clusteringtree was cut into two groups and the number of misclassi-fied cell lines was counted. The misclassification rate wasobtained from the averaged number of misclassified sam-ples in 500 bootstraps divided by the total number ofsamples.
SAM and PAM analysisThe raw signal intensities of each channel were subtractedby the median signal intensities of corresponding channelof controls on HCGI12K array. After this correction, SAMin samr package and PAM in pamr package were appliedusing log ratios (digested/undigested) in R version 2.7.0.Between-group normalisation was not used in SAM andPAM to avoid over-correction masking the differentialmethylation.
Authors' contributionsWD conducted the statistical analysis and algorithmdevelopment supervised by JP and RB. The DMH data wasproduced by JMT in collaboration with TH and PY. RB, JPand KV conceived the study. JMT, JG and CZ conductedvalidation by MSP or pyrosequencing in RB's lab. WD, JPand RB prepared the manuscript with review by allauthors. Funding was obtained by RB and TH.
Additional material
AcknowledgementsThis work was supported by a CR-UK programme grant to RB, NIH R21 grant CA110475 to RB and TH, and an Ovarian Cancer Action project grant to RB, JMT and JG.
References1. [http://cran.r-project.org/].2. Cooper DN, Krawczak M: Cytosine methylation and the fate of
CpG dinucleotides in vertebrate genomes. Hum Genet 1989,83(2):181-188.
3. Bird AP: CpG-rich islands and the function of DNA methyla-tion. Nature 1986, 321(6067):209-213.
4. Antequera F, Bird A: Number of CpG islands and genes inhuman and mouse. Proc Natl Acad Sci U S A 1993,90(24):11995-11999.
5. Huang TH, Perry MR, Laux DE: Methylation profiling of CpGislands in human breast cancer cells. Hum Mol Genet 1999,8(3):459-470.
6. Yan PS, Chen CM, Shi H, Rahmatpanah F, Wei SH, Caldwell CW,Huang TH: Dissecting complex epigenetic alterations inbreast cancer using CpG island microarrays. Cancer Res 2001,61(23):8375-8380.
7. Wei SH, Chen CM, Strathdee G, Harnsomburana J, Shyu CR, Rahmat-panah F, Shi H, Ng SW, Yan PS, Nephew KP, Brown R, Huang TH:Methylation microarray analysis of late-stage ovarian carci-nomas distinguishes progression-free survival in patients andidentifies candidate epigenetic markers. Clin Cancer Res 2002,8(7):2246-2252.
8. Yan PS, Chen CM, Shi H, Rahmatpanah F, Wei SH, Huang TH: Appli-cations of CpG island microarrays for high-throughput anal-ysis of DNA methylation. J Nutr 2002, 132(8Suppl):2430S-2434S.
9. Yan PS, Efferth T, Chen HL, Lin J, Rodel F, Fuzesi L, Huang TH: Useof CpG island microarrays to identify colorectal tumors witha high degree of concurrent methylation. Methods 2002,27(2):162-169.
10. Yan PS, Wei SH, Huang TH: Differential methylation hybridiza-tion using CpG island arrays. Methods Mol Biol 2002, 200:87-100.
11. Rahmatpanah FB, Carstens S, Guo J, Sjahputera O, Taylor KH, DuffD, Shi H, Davis JW, Hooshmand SI, Chitma-Matsiga R, Caldwell CW:Differential DNA methylation patterns of small B-cell lym-phoma subclasses with different clinical behavior. Leukemia2006, 20(10):1855-1862.
12. Zighelboim I, Goodfellow PJ, Schmidt AP, Walls KC, Mallon MA,Mutch DG, Yan PS, Huang TH, Powell MA: Differential methyla-tion hybridization array of endometrial cancers reveals twonovel cancer-specific methylation markers. Clin Cancer Res2007, 13(10):2882-2889.
13. Nouzova M, Holtan N, Oshiro MM, Isett RB, Munoz-Rodriguez JL,List AF, Narro ML, Miller SJ, Merchant NC, Futscher BW: Epige-nomic changes during leukemia cell differentiation: analysisof histone acetylation and cytosine methylation using CpGisland microarrays. J Pharmacol Exp Ther 2004, 311(3):968-981.
14. Tusher VG, Tibshirani R, Chu G: Significance analysis of micro-arrays applied to the ionizing radiation response. Proc NatlAcad Sci U S A 2001, 98(9):5116-5121.
15. Tibshirani R, Hastie T, Narasimhan B, Chu G: Diagnosis of multiplecancer types by shrunken centroids of gene expression. ProcNatl Acad Sci U S A 2002, 99(10):6567-6572.
16. Leamey CA, Glendining KA, Kreiman G, Kang ND, Wang KH, FasslerR, Sawatari A, Tonegawa S, Sur M: Differential gene expressionbetween sensory neocortical areas: potential roles forTen_m3 and Bcl6 in patterning visual and somatosensorypathways. Cereb Cortex 2008, 18(1):53-66.
17. Flavell JR, Baumforth KR, Wood VH, Davies GL, Wei W, ReynoldsGM, Morgan S, Boyce A, Kelly GL, Young LS, Murray PG: Down-reg-ulation of the TGF-beta target gene, PTPRK, by the Epstein-Barr virus encoded EBNA1 contributes to the growth andsurvival of Hodgkin lymphoma cells. Blood 2008,111(1):292-301.
18. Lau SK, Boutros PC, Pintilie M, Blackhall FH, Zhu CQ, Strumpf D,Johnston MR, Darling G, Keshavjee S, Waddell TK, Liu N, Lau D, PennLZ, Shepherd FA, Jurisica I, Der SD, Tsao MS: Three-gene prog-nostic classifier for early-stage non small-cell lung cancer. JClin Oncol 2007, 25(35):5562-5569.
19. Lapointe J, Li C, Giacomini CP, Salari K, Huang S, Wang P, Ferrari M,Hernandez-Boussard T, Brooks JD, Pollack JR: Genomic profilingreveals alternative genetic pathways of prostate tumorigen-esis. Cancer Res 2007, 67(18):8504-8510.
20. Goold R, Hubank M, Hunt A, Holton J, Menon RP, Revesz T, PandolfoM, Matilla-Duenas A: Down-regulation of the dopamine recep-tor D2 in mice lacking ataxin 1. Hum Mol Genet 2007,16(17):2122-2134.
21. Cheishvili D, Maayan C, Smith Y, Ast G, Razin A: IKAP/hELP1 defi-ciency in the cerebrum of familial dysautonomia patientsresults in down regulation of genes involved in oligodendro-
Additional file 1115 differential methylated candidates identified by MLDA in A2780 series cell lines.Click here for file[http://www.biomedcentral.com/content/supplementary/1471-2105-9-337-S1.xls]
Page 11 of 12(page number not for citation purposes)
Publish with BioMed Central and every scientist can read your work free of charge
"BioMed Central will be the most significant development for disseminating the results of biomedical research in our lifetime."
Sir Paul Nurse, Cancer Research UK
Your research papers will be:
available free of charge to the entire biomedical community
peer reviewed and published immediately upon acceptance
cited in PubMed and archived on PubMed Central
yours — you keep the copyright
Submit your manuscript here:http://www.biomedcentral.com/info/publishing_adv.asp
BioMedcentral
cyte differentiation and in myelination. Hum Mol Genet 2007,16(17):2097-2104.
22. Wei SH, Balch C, Paik HH, Kim YS, Baldwin RL, Liyanarachchi S, Li L,Wang Z, Wan JC, Davuluri RV, Karlan BY, Gifford G, Brown R, KimS, Huang TH, Nephew KP: Prognostic DNA methylationbiomarkers in ovarian cancer. Clin Cancer Res 2006,12(9):2788-2794.
23. Anthoney DA, McIlwrath AJ, Gallagher WM, Edlin AR, Brown R: Mic-rosatellite instability, apoptosis, and loss of p53 function indrug-resistant tumor cells. Cancer Res 1996, 56(6):1374-1381.
24. Maekawa M, Taniguchi T, Higashi H, Sugimura H, Sugano K, Kanno T:Methylation of mitochondrial DNA is not a useful marker forcancer detection. Clin Chem 2004, 50(8):1480-1481.
25. Simon RM, Korn EL, McShane LM, Radmacher MD, Wright GW,Zhao Y: Design and Analysis of DNA Microarray Investiga-tions. In Statistics for Biology and Health New York , Springer; 2003.
26. Herman JG, Graff JR, Myohanen S, Nelkin BD, Baylin SB: Methyla-tion-specific PCR: a novel PCR assay for methylation statusof CpG islands. Proc Natl Acad Sci U S A 1996, 93(18):9821-9826.
27. Wei SH, Brown R, Huang TH: Aberrant DNA methylation inovarian cancer: is there an epigenetic predisposition to drugresponse? Ann N Y Acad Sci 2003, 983:243-250.
28. Tukey JW: Exploratory Data Analysis. Rading Massachusetts ,Addison-Wesley; 1977.
29. Wilcox RR: Robust Regression. In Robust Esitmation and HypothesisTesting Edited by: Holland BA. London , Elsevier Academic Press;2005.
30. Wilcox RR: Estimating Measures of Location and Scale. InRobust Esitmation and Hypothesis Testing Edited by: Holland BA. Lon-don , Elsevier Academic Press; 2005.
31. Gardiner-Garden M, Frommer M: CpG islands in vertebrategenomes. J Mol Biol 1987, 196(2):261-282.
Page 12 of 12(page number not for citation purposes)