71
BMC Performance Manager Express for HP EVA STORAGE MONITORING USER DOCUMENTATION Version 1.2.00 February 2015

BMC Performance Manager Expressfor HP EVA
STORAGE MONITORING
USER DOCUMENTATION
Version 1.2.00
February 2015

Contacting BMC Software
You can access the BMC Software Web site at http://www.bmc.com. From this Web site, you canobtain information about the company, its products, corporate offices, special events, and careeropportunities.
United States and Canada
Address BMC Software, Inc.2101 CityWest Blvd. Houston TX77042-2827
Telephone 1 (713) 918 8800 or 1 (800) 841 2031 (Toll Free)
Copyright 2006 BMC Software, Inc. or licensors, as an unpublished work. All rights reserved.
BMC Software, the BMC Software logos, and all other BMC Software product or service names areregistered trademarks or trademarks of BMC Software, Inc.
All other trademarks belong to their respective companies.
BMC Software considers information included in this documentation to be proprietary andconfidential. Your use of this information is subject to the terms and conditions of the applicableEnd User License Agreement for the product and the proprietary and restricted rights noticesincluded in this documentation.
Restricted Rights Legend
U.S. Government Restricted Rights to Computer Software. UNPUBLISHED -- RIGHTS RESERVEDUNDER THE COPYRIGHT LAWS OF THE UNITED STATES. Use, duplication, or disclosure of any dataand computer software by the U.S. Government is subject to restrictions, as applicable, set forthin FAR Section 52.227-14, DFARS 252.227-7013, DFARS 252.227-7014, DFARS 252.227-7015, andDFARS 252.227-7025, as amended from time to time. Contractor/Manufacturer is BMC Software,Inc., 2101 CityWest Blvd., Houston, TX 77042-2827, USA. Any contract notices should be sent to thisaddress.
2
BM
C P
erfo
rman
ce M
anag
er
Exp
ress
fo
r H
P E
VA
Ver
sion
1.2
.00

Customer Support
You can obtain technical support by using the Support page on the BMC Software Web site or bycontacting Customer Support by telephone or e-mail. To expedite your inquiry, please see"Before Contacting BMC Software."
Support Web Site
You can obtain technical support from BMC Software 24 hours a day, 7 days a week at http://www.bmc.com/support_home. From this Web site, you can
Read overviews about support services and programs that BMC Software offers:
Find the most current information about BMC Software products
Search a database for problems similar to yours and possible solutions
Order or download product documentation
Report a problem or ask a question
Subscribe to receive e-mail notices when new product versions are released
Find worldwide BMC Software support center locations and contact information, including e-mail addresses, fax numbers, and telephone numbers
You can also access product documents and search the Knowledge Base for help with an issue athttp://www.sentrysoftware.com
Support by Telephone or E-mail
In the United States and Canada, if you need technical support and do not have access to the Web,call 800 537 1813. Outside the United States and Canada, please contact your local support centerfor assistance. To find telephone and email contact information for the BMC Software supportcenter that services your location, refer to the Contact Customer Support section of the Supportpage on the BMC Software Web site at http://www.bmc.com/support_home.
Before Contacting BMC Software
Before you contact BMC Software, have the following information available so that CustomerSupport can begin working on your problem immediately:
3
BM
C P
erfo
rman
ce M
anag
er
Exp
ress
fo
r H
P E
VA
Ver
sion
1.2
.00
4
BM
C P
erfo
rman
ce M
anag
er
Exp
ress
fo
r H
P E
VA
Ver
sion
1.2
.00
Table of Contents.....................................................................................................................................................................................11The Product
.....................................................................................................................................................................................12Synergy with BMC Performance Manager Express for Hardware
.....................................................................................................................................................................................15HP Command View EVA
.....................................................................................................................................................................................16Installing BMC Performance Manager Express for HP EVA
.....................................................................................................................................................................................18Adding BMC Performance Manager Express for HP EVA to an Element Profile
.....................................................................................................................................................................................22Adding BMC Performance Manager Express for HP EVA to an Existing Element
.....................................................................................................................................................................................25Integrating with BMC ProactiveNet Performance Management
.......................................................................................................................................................................................25Automatically Enabling the Application Classes
.......................................................................................................................................................................................26Creating and Importing an Adapter for a BMC Portal Solution
.......................................................................................................................................................................................33Managing Baselines and Key Performance Indicators
.....................................................................................................................................................................................37Deleting Application Classes from an Element
.....................................................................................................................................................................................37Deleting Application Classes from an Element Profile
.....................................................................................................................................................................................38Removing BMC Performance Manager Express for HP EVA from the Portal
.....................................................................................................................................................................................42Viewing the Overall Activity of a Disk Array
.....................................................................................................................................................................................43Detecting High Processor Utilization
.....................................................................................................................................................................................45Detecting Unbalanced Workload Distribution on Controllers
.....................................................................................................................................................................................46Diagnosing Fiber Performance Issues
.....................................................................................................................................................................................47Diagnosing a Bad Disk Layout
.....................................................................................................................................................................................49Diagnosing Slow Fiber Performance
.....................................................................................................................................................................................50Protection Level Issues
.....................................................................................................................................................................................50Verifying the Activity Generated by a LUN
.....................................................................................................................................................................................52Setting Thresholds
.....................................................................................................................................................................................54Enabling the Debug Mode
.....................................................................................................................................................................................54Disabling Virtual Disks Monitoring
.....................................................................................................................................................................................57Classes and Parameters
.......................................................................................................................................................................................57Controllers
.......................................................................................................................................................................................58Data Replication Tunnels
.......................................................................................................................................................................................59Host Connections
.......................................................................................................................................................................................59Host Port Statistics
.......................................................................................................................................................................................60Nodes
.......................................................................................................................................................................................61Physical Disk Groups
.......................................................................................................................................................................................63Physical Disks

5
BM
C P
erfo
rman
ce M
anag
er
Exp
ress
fo
r H
P E
VA
Ver
sion
1.2
.00
.......................................................................................................................................................................................64Port Status
.......................................................................................................................................................................................65Virtual Disk Groups
.......................................................................................................................................................................................66Virtual Disks
.......................................................................................................................................................................................67Special Note on Application Collection Status

Release Notes for v1.2.00

7
BM
C P
erfo
rman
ce M
anag
er
Exp
ress
fo
r H
P E
VA
Ver
sion
1.2
.00
What's New
Disable Virtual Disks Monitoring: This new feature allows administrators to disable themonitoring of all the virtual disks of a system in order to limit the number of instancescreated and therefore reduce the system resource consumption.
New parameters:
The Write Retries Byte Rate parameter is now available for the Data Replication Tunnelsapplication class, to report on the write actions that had to be retransmitted during thesample interval in response to a failed write transaction.
The Time Since Last Activity parameter has been added to the Virtual Disks applicationclass to report on the number of days since any activity occurred on the virtual disk.
Port Count: this parameter has been added to the Nodes application class to report on thenumber of fiber and Ethernet ports available in the node.
Changes and Improvements
Better integration with BMC ProactiveNet Performance Management: Application Classesand Key Performance Indicators are now automatically enabled and set when importing aBMC Portal adapter into BMC ProactiveNet.
Fixed Issues
A syntax error prevented the upgrade from the previous version to be processed.
The product could not access the file content generated by the process "evapref.exe"running on Windows 2008 server since this file was already handled by another process. As aresult, the product could not collect information and the parameter "Application CollectionStatus" displayed the following error message: "Problem: SSSU.exe not responding:SentrySoftware-SEN_EVA_Main".

Overview

9
BM
C P
erfo
rman
ce M
anag
er
Exp
ress
fo
r H
P E
VA
Ver
sion
1.2
.00
BMC Performance Manager Express for HP EVA is an agent-less Performance Manager for theBMC Portal environment. It allows you to automatically discover and monitor every aspect of HPEVA disk arrays, from the general health of the array to the performance of each layer of the diskarray: controllers, disk groups, physical and virtual disks; and to consolidate diverse monitoringneeds within the Portal framework through a single solution.
To setup a complete monitoring of the disk array, we strongly recommend you to also use BMCPerformance Manager Express for Hardware that covers all the physical aspect of the disk array (status ofthe disks, ports, temperature, power supplies, power consumption, etc).
Being a Performance Manager specifically designed for BMC Portal, BMC Performance ManagerExpress for HP EVA uses the Portal’s web-based interface and features for installing, managingand monitoring your infrastructure.

Getting Started

11
BM
C P
erfo
rman
ce M
anag
er
Exp
ress
fo
r H
P E
VA
Ver
sion
1.2
.00
This chapter describes the prerequisites and the procedures you must perform before you installBMC Performance Manager Express for HP EVA. Please follow the given instructions carefully inorder to ensure a successful integration of the solution within the Portal environment.
Minimum Requirements
The computer on which you install BMC Performance Manager Express for HP EVA should alreadyhave:
1. BMC Performance Manager Portal version 2.5.00
2. Access to an RSM i.e. Remote Service Monitor
The RSM program must be installed on a Windows platform. This can either be same as the serverwhere the Portal is installed or, any other Windows computer on the network.
Once you install BMC Performance Manager Express for HP EVA, you can add as many elementsas you require in your monitoring environment.
The ProductThe BMC Performance Manager Express for HP EVA package
The file required for the installation of BMC Performance Manager Express for HP EVA is:
SentrySoftware-HPEVA-solution-<version>.par
The above-mentioned file is valid for installation on Windows, UNIX and Linux.
Please contact your BMC sales representative to purchase the license to use product. The productpackage is to be downloaded from the Sentry Software website on the BMC PerformanceManager Express for HP EVA product page.
How it works
Once BMC Performance Manager Express for HP EVA is installed in your Portal environment:

12The Product
BM
C P
erfo
rman
ce M
anag
er
Exp
ress
fo
r H
P E
VA
Ver
sion
1.2
.00
1. To start up the monitoring, add its corresponding application class to an element or elementprofile. The BMC Performance Manager Express for HP EVA application classes are listedunder the Storage category.
2. Fill in Properties and Credentials information and click Next
3. Set the threshold parameters
4. Click Finish to validate.
Portal level
BMC Performance Manager Express for HP EVA is an agent-less solution designed specifically forBMC Portal. Therefore, it uses/shares/offers all the procedures, features and capabilities offeredin the Portal, like Element Profile, Shared credentials, Adding/Editing/Deleting classes etc.
HP EVA level
As described above, you need to enter certain information:
Collection interval
Configuration details depending on the version.
Synergy with BMC PerformanceManager Express for HardwareTo benefit from a complete monitoring of HP EVA disk arrays, BMC Performance Manager Expressfor HP EVA needs to be used in conjunction with BMC Performance Manager Express forHardware.
BMC Performance Manager Express for Hardware discovers all the physical components adisk array, that is: controllers, disks, power supplies, fans, network and fiber ports, andreports hardware failures on these components. Additionally, it monitors the traffic on eachnetwork and fiber port.
BMC Performance Manager Express for HP EVA monitors all of the performance metrics andusage statistics of your HP EVA environment, such as file disk space usage, storage controllerutilization, I/Os on the disks/controllers/volumes, etc. It continuously monitors the activityof each filer and is also able to build reports on past utilization statistics.
The complete storage monitoring solution architecture is composed of the elementsrepresented in the illustration below.

13 Synergy with BMC Performance Manager Expressfor Hardware
BM
C P
erfo
rman
ce M
anag
er
Exp
ress
fo
r H
P E
VA
Ver
sion
1.2
.00
Monitoring solution architecture

Installation Guide

15
BM
C P
erfo
rman
ce M
anag
er
Exp
ress
fo
r H
P E
VA
Ver
sion
1.2
.00
This chapter explains how to install and run BMC Performance Manager Express for HP EVA forBMC® Portal.
As BMC Performance Manager Express for HP EVA is a performance manager specificallydesigned for the BMC© Portal environment, it uses the Portal’s web-based interface and featuresfor installing, managing and monitoring your Information Technology (IT) infrastructure. The fullintegration with BMC® Portal provides a single customizable entry point for data from multiplesources and a single view that enables you to monitor the health and performance of yourinfrastructure.
HP Command View EVASpecific information, such as virtual disk size, node name, RAID array, etc are collected via the evaperf utility and Storage System Scripting Utility (SSSU.EXE) which are command line interfacesprovided by HP that allows administrators to control EVA disk arrays. HP Command View EVAvalid account credentials (username and password) are required to activate SSSU.
Prior to install BMC Performance Manager Express for HP EVA:
1. First, note that BMC Performance Manager Express for HP EVA must be installed on the HPStorage Server provided with the HP EVA disk array. The HP Storage Server usually comesbundled with the HP EVA disk array and is fully pre-installed by HP.
2. Make sure the HP Storage Server is properly configured to interact with the HP EVA diskarray.

16HP Command View EVA
BM
C P
erfo
rman
ce M
anag
er
Exp
ress
fo
r H
P E
VA
Ver
sion
1.2
.00
3. Make sure that HP StorageWorks Command View 9.1 or higher is properly installed on theStorage Server. All the provided features must be installed:
Choosing Product Features
4. Since some information such as virtual disk size, node name, RAID array, etc. is collected viathe Storage System Scripting Utility (SSSU.EXE). Valid account credentials (username andpassword) are required to run SSSU.
Installing BMC Performance Managerfor HP EVAUploading BMC Performance Manager Express for HP EVA1. Place the SentrySoftware-HPEVA-solution-<version>.par file in a known location on your file
system. Log in to the Portal with the admin credentials.

17 Installing BMC Performance Manager Express forHP EVA
BM
C P
erfo
rman
ce M
anag
er
Exp
ress
fo
r H
P E
VA
Ver
sion
1.2
.00
Logon to BMC Portal
2. Click on Portal, then under Tasks click Performance Managers.
3. Click Upload and then click Browse to open a file selection dialogue box.
4. Select Sentry Software-HP EVA-solution-<version>.par and click Upload.
Selecting the Performance Manager
5. The Portal uploads the PAR file to the database, and PM now appears as BMC PM Express forHPEVA by Sentry Software in the list of Performance Managers.
6. The word Published next to BMC Performance Manager Express for HP EVA in thePerformance Manager list indicates that the product is successfully installed. You are nowready to begin using BMC Performance Manager Express for HP EVA.
7. Connect to Portal with user credentials. In the Portal Configure tab, verify each monitoredarray's properties and thresholds values to make sure all the necessary settings are properlyconfigured.
18Adding BMC Performance Manager Express for HPEVA to an Element Profile
BM
C P
erfo
rman
ce M
anag
er
Exp
ress
fo
r H
P E
VA
Ver
sion
1.2
.00
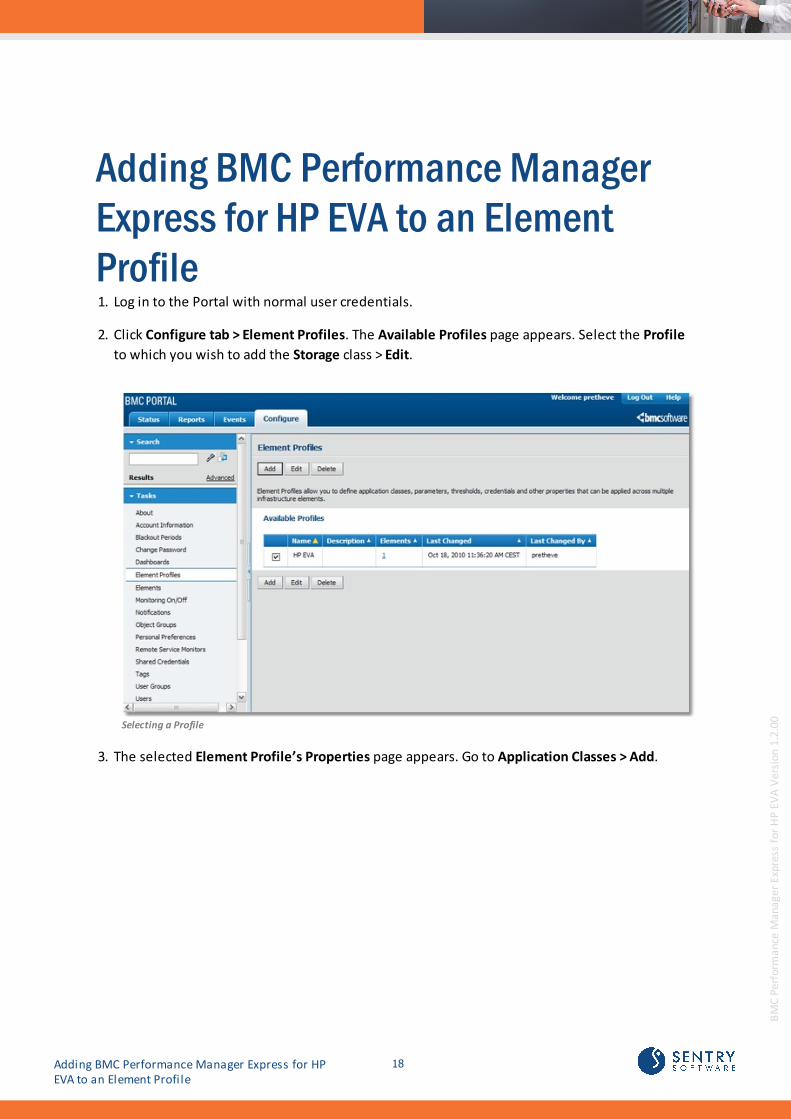
Adding BMC Performance ManagerExpress for HP EVA to an ElementProfile1. Log in to the Portal with normal user credentials.
2. Click Configure tab > Element Profiles. The Available Profiles page appears. Select the Profile
to which you wish to add the Storage class > Edit.
Selecting a Profile
3. The selected Element Profile’s Properties page appears. Go to Application Classes > Add.

19 Adding BMC Performance Manager Express for HPEVA to an Element Profile
BM
C P
erfo
rman
ce M
anag
er
Exp
ress
fo
r H
P E
VA
Ver
sion
1.2
.00
Adding Application Classes
4. The Element Profile Properties – Add Application Classes page appears. Choose Storage fromthe Select Category drop-down list.
Selecting the Storage Applicable Class

20Adding BMC Performance Manager Express for HPEVA to an Element Profile
BM
C P
erfo
rman
ce M
anag
er
Exp
ress
fo
r H
P E
VA
Ver
sion
1.2
.00
5. Select the HP EVA application class applicable to your system and click Next.
The HP EVA application class can only be added to element of type "Storage"
6. On the Properties and Credentials page, enter the information required for monitoring thedisk array.
Information required to monitor Windows systems
Input Properties Description
Collection interval Select the polling interval from the drop-down list. Default: 5. Unit:Minutes.
Credentials (WMI) Enter the login and password used to connect to the remote elementthrough WMI.
Credentials (SSSU) Enter the login and password used to connect to the remote elementthrough SSSU.
Hostname Enter the Hostname or IP address of the remote machine
Disable Virtual DisksMonitoring
"Yes" disables the monitoring of virtual disks. Discovery and collectrequests and operations are no longer performed.
Debug Mode "Yes" enables the debug mode. The debug output produced is stored on theRSM server in a file located at "%RSM_HOME%/RSM(xx)/SEN_HPEVA/sen_eva_debug_hostname.log". Please do not leave the debug modeenabled for too long as the debug file may grow indefinitely.

21 Adding BMC Performance Manager Express for HPEVA to an Element Profile
BM
C P
erfo
rman
ce M
anag
er
Exp
ress
fo
r H
P E
VA
Ver
sion
1.2
.00
7. After entering the element properties and credentials, you arrive at the final step for addingthe BMC Performance Manager Express for HP EVA application class: Thresholds, Propertiesand Credentials.
8. Thresholds are automatically set by BMC Performance Manager Express for HP EVA . It isrecommended to keep the default thresholds (or see the Thresholds section). Click Finish.
Element Profile Properties
9. Click Done to save the changes made. The BMC Performance Manager Express for HP EVAapplication class is now added to all the elements in the selected Element Profile.

22Adding BMC Performance Manager Express for HPEVA to an Existing Element
BM
C P
erfo
rman
ce M
anag
er
Exp
ress
fo
r H
P E
VA
Ver
sion
1.2
.00
Adding the HP EVA Application Classto an Existing Element1. In the Configure tab: Click the Element to which you wish to add the HP EVA Performance
Manager and the Element Properties page appears. Scroll down to Application Classes > Add.Make sure that the element's platform is defined as Storage.
Adding an Application Class
2. On the Properties – <Element> – Add Application Classes page > Select Category > Storage.
3. In the available Application Class list, select the HP EVA application class applicable to theelement and click Next.
Application Class Properties
The HP EVA application class can only be added to element of type "Storage"

23 Adding BMC Performance Manager Express for HPEVA to an Existing Element
BM
C P
erfo
rman
ce M
anag
er
Exp
ress
fo
r H
P E
VA
Ver
sion
1.2
.00
4. The Properties and Credentials page appears asking for the information required formonitoring the disk array.
5. Thresholds are automatically set by BMC Performance Manager Express for HP EVA. It isrecommended that you leave the default thresholds as they are. Click Finish. Details on howto modify thresholds are given in the User Guide.
You can now return to the Status tab to view the monitoring of the element by BMC PerformanceManager Express for HP EVA .

Integration Guide

25 Integrating with BMC ProactiveNet PerformanceManagement
BM
C P
erfo
rman
ce M
anag
er
Exp
ress
fo
r H
P E
VA
Ver
sion
1.2
.00
Integrating with BMC ProactiveNetPerformance ManagementOverview
To integrate a Performance Manager into BMC ProactiveNet, you need to first install andconfigure the solution in BMC Portal, automatically enable the application classes and create aspecific adapter. An adapter for BMC Portal facilitates pulling of performance data from existingBMC Portal solutions into BMC ProactiveNet. Using an Adapter, you can import BMC Portalapplication classes (provided in a Performance Manager – PM) into BMC ProactiveNet. TheAdapter periodically synchronizes the performance data collected by these application classesinto BMC ProactiveNet.
Adapter for BMC PATROL Architecture
Automatically Enabling the ApplicationClassesTo automatically enable application classes:
1. Uncompress the BPM-Express-for-HPEVA-<version>-PM2BPPM.zip file
2. Copy all the BPM_SENTRYSOFTWARE_HPEVA_SOLUTIONSEN_HPEVA_MAIN xml files into:<BPPM install dir>\ProactiveNet\pw\pronto\systdata\adapter-defaults
3. Restart the BMC ProactiveNet server
You will then have to create and import an adapter for a BMC Portal PM

26Integrating with BMC ProactiveNet PerformanceManagement
BM
C P
erfo
rman
ce M
anag
er
Exp
ress
fo
r H
P E
VA
Ver
sion
1.2
.00
Creating and Importing an Adapter for a BMCPortal Solution
Creating an Adapter for a BMC Portal Solution
1. Open the BMC ProactiveNet Administration Console. The BMC ProactiveNet Administration Console is
displayed as shown in the following figure:
Accessing the Administration tab in the Administration Console

27 Integrating with BMC ProactiveNet PerformanceManagement
BM
C P
erfo
rman
ce M
anag
er
Exp
ress
fo
r H
P E
VA
Ver
sion
1.2
.00
2. Right-click the Adapters folder and select Import Monitor Types and Add Adapter > BMCPortal.
Importing Monitor Types and Adding Adapter

28Integrating with BMC ProactiveNet PerformanceManagement
BM
C P
erfo
rman
ce M
anag
er
Exp
ress
fo
r H
P E
VA
Ver
sion
1.2
.00
3. In the Configuration tab, enter the required information:
Setting the connection parameters
In the Instance Name field, enter a name for this instance of the Adapter that will performthe integration of the ‘targeted PM’ into BMC ProactiveNet.
Select the Agent where this instance of the Adapter will be executed
Enter the required information to connect to BMC Portal: BMC Portal Host Name or IPaddress, Port, BMC Portal User Name and Password
To successfully integrate the PM with BMC Proactivenet, the BMC Portal User Account specified musthave at least been used once to log in to BMC Portal and have the HP EVA Disk Arrays Application Classadded to an existing element.
Enter the required information to connect to BMC Portal Datastore: BMC Portal Datastore

29 Integrating with BMC ProactiveNet PerformanceManagement
BM
C P
erfo
rman
ce M
anag
er
Exp
ress
fo
r H
P E
VA
Ver
sion
1.2
.00
Host Name or IP address, Port, and credentials
4. Click Next to continue
Selecting the Application Classes to import

30Integrating with BMC ProactiveNet PerformanceManagement
BM
C P
erfo
rman
ce M
anag
er
Exp
ress
fo
r H
P E
VA
Ver
sion
1.2
.00
5. Select the application class to import and click Next
6. Set the Filter details if needed.
Setting filter details

31 Integrating with BMC ProactiveNet PerformanceManagement
BM
C P
erfo
rman
ce M
anag
er
Exp
ress
fo
r H
P E
VA
Ver
sion
1.2
.00
7. Click Next to Continue.
8. Set the Auto-sync poll scheduling, if needed.
Scheduling Auto-sync polls

32Integrating with BMC ProactiveNet PerformanceManagement
BM
C P
erfo
rman
ce M
anag
er
Exp
ress
fo
r H
P E
VA
Ver
sion
1.2
.00
9. Click Next to continue. The system displays a summary of your settings, click Finish toconfirm. The Adapter has been added to the Adapters folder of the Administration Console.
Adapter added to the Adapters folder
10. To see the class instances that have been imported by the Adapter, expand the Adaptersfolder, right-click the Adapter and select Details.
We strongly recommend that you create a specific adapter for each PM you need to integrate into BMCProactiveNet to enable the update of a single PM independently.
Once created and imported, the Adapter will be displayed in the Devices folder of the BMCProactiveNet Operations Console.

33 Integrating with BMC ProactiveNet PerformanceManagement
BM
C P
erfo
rman
ce M
anag
er
Exp
ress
fo
r H
P E
VA
Ver
sion
1.2
.00
Managing Baselines and Key PerformanceIndicatorsIn order to facilitate the detection of abnormalities on your monitored environment, BMCProactiveNet calculates baselines per parameter (metrics or attributes) based on valuescollected over a specified period of time to determine a normal operating range. When thecollected values for these parameters are out of range, an alert is triggered.
Some parameters are identified by default as Key Performance Indicators and thereforeautomatically included in the base lining calculation.
Managing baselines
The baseline is the expected normal operating range for a metric or attribute of a monitor.
The baseline is calculated by collecting the values for a monitor’s attributes and metrics over aspecified time period and establishing a low baseline value (consisting of the 10th percentile ofall the values for a given time period) and a high baseline value (consisting of the 90th percentileof all the values for a given time period), taking a weighted average of these values over time. Ahigher weight is given to the latest data being factored into the baseline average. The accuracy ofthe baseline improves over time.
Requirements for baseline generation
For baselines to be generated for an attribute, that abnormality threshold means that thethreshold exists and is not suppressed. Additionally, if the Key Performance Indicator (KPI) mode is active, only those attributes thathave an active abnormality threshold and are also KPI attributes will have baselines generatedfor them.
Absolute thresholds (with "outside baseline") or signature thresholds do not satisfy these requirements.
Managing Key Performance Indicators
The KPI attribute of a parameter can be activated or deactivated manually through the BMCProactiveNet Administration Console. In this PM, some parameters or attributes have beendesignated as important indicators of performance (KPIs). We do not recommend that thesedefault settings are modified.
However, advanced users may activate or deactivate KPIs from the BMC ProactiveNet

34Integrating with BMC ProactiveNet PerformanceManagement
BM
C P
erfo
rman
ce M
anag
er
Exp
ress
fo
r H
P E
VA
Ver
sion
1.2
.00
Administration Console.
To add or remove Key Performance Indicator (KPI) attributes for a monitor type
1. In the Administration Console, from the menu bar, choose Tools > KPI Administration. TheKPI Administration dialog box is displayed.
2. From the Monitor Type list, choose the monitor type for which you want to add or removeKPI attributes. A list of attributes for the selected monitor type is displayed.
3. In the KPI column for the attributes that you want to add or remove as Key PerformanceIndicators:
select the KPI check box to add the corresponding attribute as a KPI
deselect the KPI check box to remove the corresponding attribute from the KPIs for thatmonitor type
For complete and detailed information on this procedure, please refer to the BMC ProactiveNetdocumentation available f rom BMC Web site.
Parameters for which the system by default calculates baselines as well as parametersconsidered as KPIs are respectively identified by the following icons:
Baselining
KPI

Un-installing


37
BM
C P
erfo
rman
ce M
anag
er
Exp
ress
fo
r H
P E
VA
Ver
sion
1.2
.00
The procedure is the same as for any other Performance Manager on the Portal:
1. Delete all BMC Performance Manager Express for HP EVA application classes from allelements and element profiles
2. Remove BMC Performance Manager Express for HP EVA from the Performance Manager listof the Portal.
The BMC Performance Manager Express for HP EVA cannot be un-installed unless all its application classesare removed from each element.
Deleting Application Classes from anElementAn application class can be deleted from an element in two ways, just as it could be addedthrough two routes: through Elements or through Element Profile.
If the element was created directly through Elements:
1. Click in the Configure tab > Properties > click on the element.
2. In the Application classes section > click Delete.
3. The Available Application Classes for Removal page appears.
4. Select the BMC Performance Manager Express for HP EVA application classes and click Next.It is possible to select more than one at a time.
5. A Changes Saved message appears, confirming that the deletion has been done.
Repeat this procedure on all elements to which BMC Performance Manager Express for HP EVA applicationclasses are added.
Deleting Application Classes from anElement ProfileAn application class can be deleted from an element in two ways, just as it could be addedthrough two routes: through Elements or through Element Profile.
If the Element Profile route was used click on Configure tab > Element Profile > select Profile >Edit.

38Deleting Application Classes from an ElementProfile
BM
C P
erfo
rman
ce M
anag
er
Exp
ress
fo
r H
P E
VA
Ver
sion
1.2
.00
1. Once in the Element Profile Properties page, scroll down to the Application Classes sectionand click on Delete.
2. On the Available Application Classes for Removal page, select all the BMC PerformanceManager Express for HP EVA classes and click Next.
3. Confirm the deletion of the selected classes by clicking on Delete.
4. A Changes Saved message pops up confirming the deletion of the application classes fromthis element profile.
The selected application classes will be deleted from all elements that were created using this elementprof ile
Removing BMC Performance Managerfor HP EVA from the PortalTo un-install or remove BMC Performance Manager Express for HP EVA from the Portal, youfollow the same steps as for any PM on the Portal.
1. Login with super-administrator credentials and click on Portal > Performance Managers.
2. Ensure the Performance Managers list shows “0” Elements next to the name: BMCPerformance Manager Express for HP EVA.
3. Select BMC Performance Manager Express for HP EVA and click Delete.
4. Confirm deletion of the selected Performance Manager by clicking on Delete.
5. A message displaying successful deletion appears.
The BMC Performance Manager Express for HP EVA is then completely removed from your BMCPortal environment.

User Guide

41
BM
C P
erfo
rman
ce M
anag
er
Exp
ress
fo
r H
P E
VA
Ver
sion
1.2
.00
BMC Performance Manager Express for HP EVA monitors all of the performance metrics andusage statistics of your HP EVA disk arrays, such as file disk space usage, storage controllerutilization, I/Os on the disks/controllers/volumes, etc. It continuously monitors the activity ofeach array and is also able to build reports on past utilization statistics.
To setup a complete monitoring of the array, we strongly recommend you to also use BMCPerformance Manager Express for Hardware that covers all the physical aspect of the HP EVAhardware (status of the disks, ports, temperature, power supplies, power consumption, etc).
This chapter explains how to use each monitoring tool i.e. a separate application class within theBMC Performance Manager Express for HP EVA by Sentry Software solution.
BMC Performance Manager Express for HP EVA is a Performance Manager specifically designed for BMCPortal; consequently, it uses the same common features and procedures of BMC® Portal. This documentassumes that the user knows how to use the Portal and therefore explains procedures only related toBMC Performance Manager Express for HP EVA, and not on how to add Elements, Element Profiles etc.Please refer to the BMC Portal documentation for details on how to use the Portal.

42Viewing the Overall Activity of a Disk Array
BM
C P
erfo
rman
ce M
anag
er
Exp
ress
fo
r H
P E
VA
Ver
sion
1.2
.00
Viewing the Overall Activity of a DiskArrayEach disk array connected to and managed by the Storage Server is represented by a node objectwith two parameters which provide an overall view of the activity of the corresponding array: Request Rate and Byte Rate.
Selecting Disk Arrays' Parameters
In case of slow response times experienced by the hosts, these parameters are the first ones tocheck to verify if the bottleneck is at the level of the disk array (instead of the HBA, the fiberswitch, etc.).
43 Viewing the Overall Activity of a Disk Array
BM
C P
erfo
rman
ce M
anag
er
Exp
ress
fo
r H
P E
VA
Ver
sion
1.2
.00
Disk Array Request Rate Graph Disk Array Byte Rate Graph
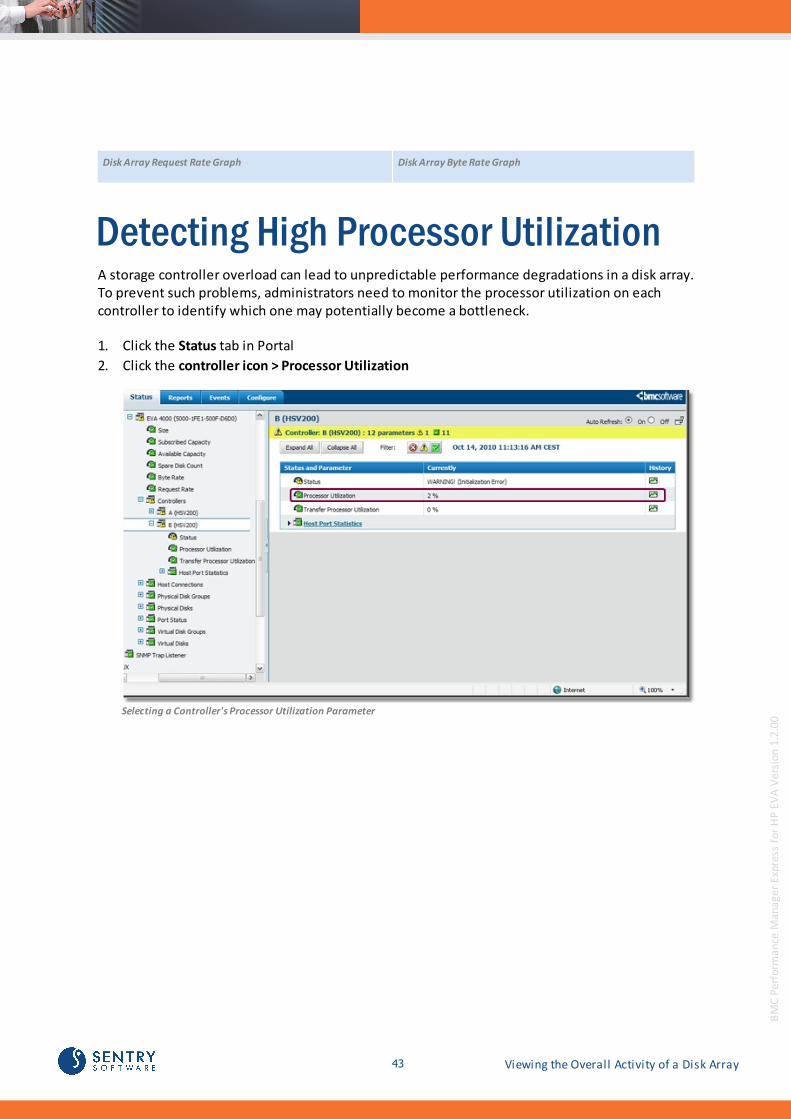
Detecting High Processor UtilizationA storage controller overload can lead to unpredictable performance degradations in a disk array.To prevent such problems, administrators need to monitor the processor utilization on eachcontroller to identify which one may potentially become a bottleneck.
1. Click the Status tab in Portal
2. Click the controller icon > Processor Utilization
Selecting a Controller's Processor Utilization Parameter

44Detecting High Processor Utilization
BM
C P
erfo
rman
ce M
anag
er
Exp
ress
fo
r H
P E
VA
Ver
sion
1.2
.00
3. Click the History icon. A graph is automatically displayed in the console's graph pane
Viewing a Controller's Processor Utilization as a Graph
A processor utilization over 80% means that this controller is overloaded and that the controllerconstitutes a bottleneck for the disk array. Also, it is also usually considered that a processoraverage utilization above 50% on both controllers constitutes an important risk as one singlecontroller wouldn't be able to handle the entire load of the disk array in case of a controller failover. That's why a warning threshold is set at 50%.

45 Detecting Unbalanced Workload Distribution onControllers
BM
C P
erfo
rman
ce M
anag
er
Exp
ress
fo
r H
P E
VA
Ver
sion
1.2
.00
Detecting Unbalanced WorkloadDistribution on ControllersA storage controller manages the flow of information between the server and the data, assigningtwo paths, in case one of the paths fails or is overloaded. For the best levels of performance andavailability, every layer of technology must be balanced.
Compare the Processor Utilization of your Controllers
1. In the console, double-click the Processor Utilization parameter of the first controller forwhich you need to compare the activity. A graph is automatically displayed in the graphpane.
2. Select the Processor Utilization parameter of the second controller and drag it from the treeview of the Operator tab to the graph. The second parameter is automatically added to thefirst one to facilitate the comparison. Compare the values to evaluate the workloaddistribution.
Comparing Controllers Processor Utilization
For example, if the processor utilization on one controller goes above 80% while the othercontroller stays almost idle, it indicates that one on the controllers constitutes a bottleneck forthe disk array that could be alleviated by better sharing the load between the controllers.

46Detecting Unbalanced Workload Distribution onControllers
BM
C P
erfo
rman
ce M
anag
er
Exp
ress
fo
r H
P E
VA
Ver
sion
1.2
.00
Administrators should pay close attention to which logical drive is handled by which controller,depending on the activity of this logical drives to be able to reallocate controller to drive I/Oactivity so that neither controller is overloaded. The activity of logical drives is monitored withthe Virtual Disk application class.
Diagnosing Fiber Performance IssuesEach external data port is represented by a Host Port Statistics instance. The parameters of thisclass provide an accurate picture of the traffic on each fiber link. This will notably helpadministrators identify which port constitutes a bottleneck or diagnose 'multi-pathing' issues.
1. Create a graph with the Read Byte Rate and Write Byte Rate parameters to visualize thetraffic on each fiber port (host ports only). In the console, double-click a Controller's icon >Host Port Statistics > Fiber Ports > Read Byte Rate to create a graph with the Read Byte Ratevalue.
Selecting a Fiber Port's Read Byte Rate and Write Byte Rate Parameters
47 Diagnosing Fiber Performance Issues
BM
C P
erfo
rman
ce M
anag
er
Exp
ress
fo
r H
P E
VA
Ver
sion
1.2
.00
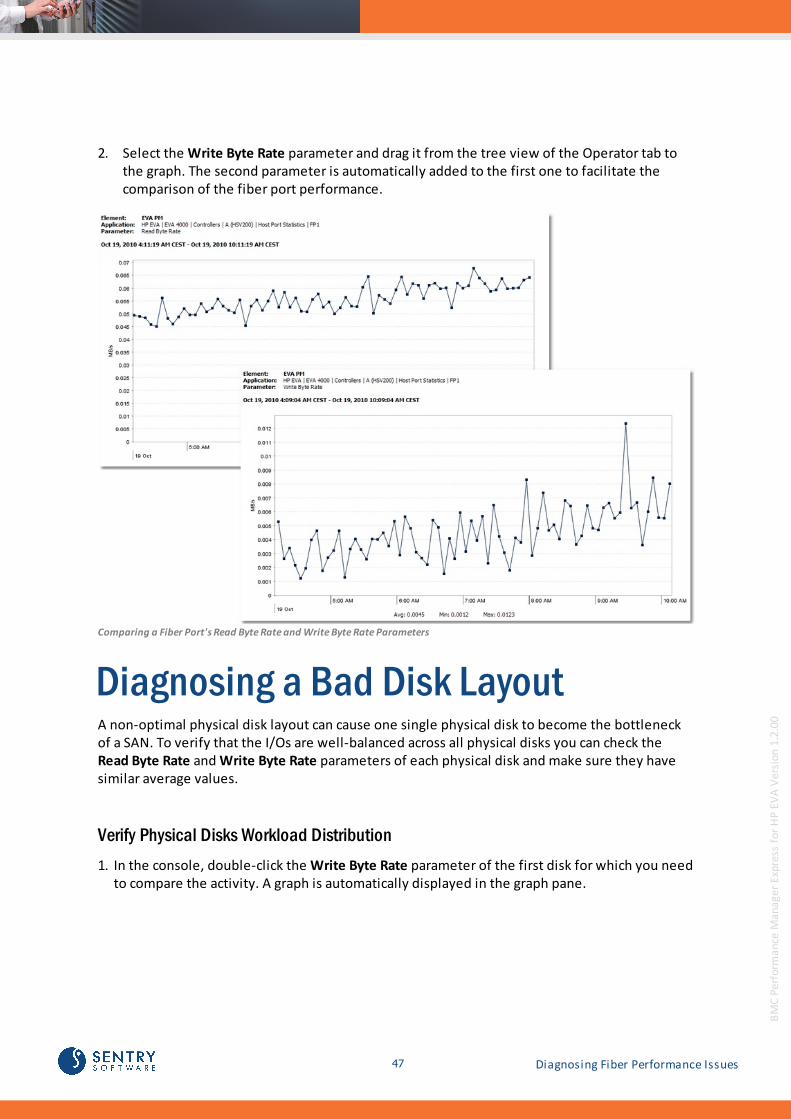
2. Select the Write Byte Rate parameter and drag it from the tree view of the Operator tab tothe graph. The second parameter is automatically added to the first one to facilitate thecomparison of the fiber port performance.
Comparing a Fiber Port's Read Byte Rate and Write Byte Rate Parameters
Diagnosing a Bad Disk LayoutA non-optimal physical disk layout can cause one single physical disk to become the bottleneckof a SAN. To verify that the I/Os are well-balanced across all physical disks you can check the Read Byte Rate and Write Byte Rate parameters of each physical disk and make sure they havesimilar average values.
Verify Physical Disks Workload Distribution
1. In the console, double-click the Write Byte Rate parameter of the first disk for which you needto compare the activity. A graph is automatically displayed in the graph pane.

48Diagnosing a Bad Disk Layout
BM
C P
erfo
rman
ce M
anag
er
Exp
ress
fo
r H
P E
VA
Ver
sion
1.2
.00
Selecting Write Data Rate Parameters
2. Select the Write Byte Rate parameter of the second disk and drag it from the tree view of theOperator tab to the graph. The second parameter is automatically added to the first one tofacilitate the comparison. Repeat this operation for any other disk.
Comparing Several Physical Disks' Write Byte Rate Parameters

49 Diagnosing Slow Fiber Performance
BM
C P
erfo
rman
ce M
anag
er
Exp
ress
fo
r H
P E
VA
Ver
sion
1.2
.00
Diagnosing Slow Fiber PerformanceBad link configuration can severely degrade the performance of a SAN. A misconfigured fiber linkcan force the ports (typically for disk array and switches) to repeatedly re-emit the signal in orderto properly perform the data transmission.
The Port Status class reports on the various types of errors encountered by each port allowingSAN administrators to identify the exact symptoms of a slow fiber link, and thus figure out theroot cause leading to the array slow performance.
Slow Fiber Performance
Look carefully at each of the Port Status class parameters. Any growing value needs to bereported to the SAN administrator in charge of the configuration of the fiber switches.

50Protection Level Issues
BM
C P
erfo
rman
ce M
anag
er
Exp
ress
fo
r H
P E
VA
Ver
sion
1.2
.00
Protection Level IssuesA physical disk group is configured with a certain level of protection against disk failures. This iscalled the Requested Protection Level and can be set to the following values:
None
Single
Double
When a physical disk group lacks storage space to provide the requested protection level, theactual protection level will be lower. SAN administrators will want to ensure the actualprotection level matches their internal policy.
The Protection Level parameter of the Physical Disk Groups class displays the actual andrequested protection levels. This parameter will trigger a warning when the actual protectionlevel is lower than the requested protection level. In case of a warning, SAN administrators willneed to add disks to the physical disk group to restore the data protection level.
A VRAID0 virtual disk hosted on a physical disk group with a protection level set to None will lose all ofits data upon a disk failure.
Verifying the Activity Generated by aLUNIn order to understand the high activity of a disk array, it is important to identify the LUNs (orvirtual disks in HP EVA terminology) generating the heaviest I/Os. The array administrator canthen check with the system administrator whether the reported activity may be considered anormal behavior.
The Read Byte Rate and Write Byte Rate parameters of the Virtual Disk instances expose the datathroughput for each LUN, while parameters such as Cache Read Data Rate, Flush Byte Rate, MirrorByte Rate, and Prefetch Byte Rate provide more in-depth details about the data traffic associatedwith each LUN.

51 Verifying the Activity Generated by a LUN
BM
C P
erfo
rman
ce M
anag
er
Exp
ress
fo
r H
P E
VA
Ver
sion
1.2
.00
LUN Activity
When the system or application that relies on a LUN experiences slow response times, it maybecome interesting to compare the Read Response Time and Write Response Time parametersof the LUN with different instances of the Virtual Disk class to see whether the LUN actuallydelivers slower performance than the other LUNs.

52Setting Thresholds
BM
C P
erfo
rman
ce M
anag
er
Exp
ress
fo
r H
P E
VA
Ver
sion
1.2
.00
Setting ThresholdsWhenever relevant, BMC Performance Manager Express for HP EVA automatically sets thresholdsfor parameters. If you prefer a more fault-tolerant monitoring, you can modify the thresholds ofeach parameter through the Configure tab > Edit Thresholds.
1. To modify the parameter thresholds of several storage objects of an element, click on the Storage (<platform>) icon in the Configure tab > Thresholds, Properties and Credentials .
or
To modify the thresholds of a particular instance, click on the instance icon > Thresholds,Properties and Credentials .
Thresholds, Properties and Credentials
Click Edit to modify the thresholds.
Any modification to the thresholds or any other properties of elements created using the"Element Profile" mode is to be done using the Element Profile route or by clicking "OverrideProfile"

53 Setting Thresholds
BM
C P
erfo
rman
ce M
anag
er
Exp
ress
fo
r H
P E
VA
Ver
sion
1.2
.00
2. Disable the alert conditions in the Size parameter, i.e. un-check the boxes for Warning andAlarm.
Disabling the default alert thresholds on Status
Disable the alerts on the Size parameter by un-checking the boxes
3. Enable the alert conditions on the parameter ('Response Time' in the image below) bychecking the boxes, and manually enter the threshold values and then click on Save.
Modifying threshold values

54Setting Thresholds
BM
C P
erfo
rman
ce M
anag
er
Exp
ress
fo
r H
P E
VA
Ver
sion
1.2
.00
Manually modify the thresholds on the parameter and activate the alerts
4. The Success, changes have been saved message indicates that the modifications have beenregistered.
Alerts are displayed by the parameter whose thresholds are modified.
Enabling the Debug ModeBy default, BMC Performance Manager Express for HP EVA sends only the most criticalinformation, warning and error messages to the Application Collection Status parameter. Mostoften, this information is accurate enough to ensure that BMC Performance Manager Express forHP EVA is functioning properly. If you encounter an issue and wish to report it to customersupport, you will be asked to enable the Debug Mode and provide the debug output to thesupport team.
1. In the Configure tab > click the Element whose debug output you require.
2. Scroll down to Application Classes > click the Application class for which you want to enablethe debug mode > click Edit.
3. Select Yes from the drop-down Debug Mode list > Save.By default, BMC Performance Manager Express for HP EVA sends its debug output to: %RSM_HOME%/RSM(xx)/SEN_EVA/sen_eva_debug_hostname.log".
4. Wait for 15 minutes and then disable the debug mode by selecting No.
5. Send the debug file to the support team.
Pay attention to the f ile size -the debug output of BMC Performance Manager Express for HP EVA could bevery large if enabled for several days
Disabling Virtual Disks MonitoringBy default, the solution discovers and monitors all virtual disks in the HP EVA storage systems.Discovering and collecting disks metrics are resource-intensive actions that can create extraworkload on the targeted system. To limit the number of instances created and therefore reducethe system resource consumption, administrators can disable the monitoring of all the virtualdisks of a system.

55 Disabling Virtual Disks Monitoring
BM
C P
erfo
rman
ce M
anag
er
Exp
ress
fo
r H
P E
VA
Ver
sion
1.2
.00
To disable virtual disks monitoring1. Open the Configure tab
2. Under Tasks, click Elements
3. Select the Element for which you wish to disable volumes monitoring and click Edit.
4. Scroll down to Application Classes > click the Application class for which you want to enablethe debug mode > click Edit.
5. Click Thresholds, Properties and Credentials > Edit.
6. Select Yes from the Disable Virtual Disks Monitoring drop-down list.
HP EVA - Disabling Virtual Disks Monitoring
7. Click Save. The Success, changes have been saved message indicates that the modificationshave been registered.

Reference Guide

57
BM
C P
erfo
rman
ce M
anag
er
Exp
ress
fo
r H
P E
VA
Ver
sion
1.2
.00
Introduction
This chapter provides detailed information regarding BMC Performance Manager Express for HPEVA Application Classes.
Baselines and Key Performance Indicators
Some parameters are identified by default as Key Performance Indicators (KPIs) and thereforeautomatically included in the base lining calculation. To learn more about auto baselining andKPIs, please refer to the Managing Baselines and Key Performance Indicators chapter.
In this guide, parameters flagged as KPIs and included by default in the baseline calculationprocess are respectively identified by the following icons:
Baselining
KPI
Classes and ParametersControllersParameters
Name Description Unit Default AlertConditions
ProcessorUtilization
Utilization of the processor Percent (%) Warning ≥ 50 %Alarm ≥ 90 %
Status Status of the controller n/a Warning = 1Alarm = 2
Transfer ProcessorUtilization
Amount of processor time specifically spent onactual transfer operations
Percent (%) None
For detailed information about Baselining and KPI, see Managing Baselines and Key Performance Indicators.

58Classes and Parameters
BM
C P
erfo
rman
ce M
anag
er
Exp
ress
fo
r H
P E
VA
Ver
sion
1.2
.00
Data Replication Tunnels
Parameters
Name Description Unit Default Alert Conditions
Copy In Byte Rate Rate at which data is copiedto an array to populate themembers of a DR group withdata when an initial copy orfull copy is requested.
Megabytes per seconds(MB/s)
None
Copy Out ByteRate
Rate at which data is copiedfrom an array to populate themembers of a DR group withdata when an initial copy orfull copy is requested.
Megabytes per seconds(MB/s)
None
Copy Retries ByteRate
Copy actions that had to beretransmitted during thesample interval in responseto a failed copy transaction.
Retries/s None
Free CommandResources
Minimum number of freeresources available for DRcommand operations.
Resources None
Free CopyResources
Minimum number of freeresources available for DRcopy operations.
Resources None
Free WriteResources
Minimum number of freeresources available for DRwrite operations.
Resources None
Round Trip Delay Average time in millisecondsduring the measurementinterval for a signal (ping) totravel from source todestination and back again.
Milliseconds (ms) None
Write In Byte Rate Rate at which data is written to anarray.
Megabytes per seconds(MB/s)
None
Write Out ByteRate
Rate at which data is written froman array.
Megabytes per seconds(MB/s)
None

59 Classes and Parameters
BM
C P
erfo
rman
ce M
anag
er
Exp
ress
fo
r H
P E
VA
Ver
sion
1.2
.00
Name Description Unit Default Alert Conditions
Write Retries ByteRate
Write actions that had to beretransmitted during thesample interval in responseto a failed write transaction.
Retries None
Host ConnectionsParameters
Name Description Unit Default AlertConditions
Busy Responses Number of busy responses sent to a specific hostduring the sample interval. Busies represent arequest from the controller to the host to cease I/Otraffic until some internal job queue is reduced.
Responses None
Request Queue* Average number of outstanding requests from eachof the corresponding host adapters.
Requests None
* Parameters marked with an asterisk are used by default when visualizing the corresponding monitor instance inBPPM
Host Port StatisticsParameters
Name Description Unit Default AlertConditions
Read Byte Rate* This counter tabulates the read data rate of hostinitiated requests that were sent through each hostport for read commands.
Megabytesper seconds(MB/s)
None
Read Bytes Cumulative count of read bytes Gigabyte (GB) None
Read Request Rate Read request rate from host-initiated requests thatwere sent through each host port for readcommands.
Requests/s None
Read ResponseTime
Elapsed time from when the EVA receives a readrequest until it returns completion of that requestto the host client over the EVA host port. This timeis an average of the read request latency for allvirtual disks accessed through this port andincludes both cache hits and misses
Milliseconds(ms)
Warning ≥ 10ms Alarm ≥ 100
Request Queue Average number of outstanding host requestsagainst all virtual disks accessed through this EVAhost port and over the sample interval. This metricincludes all host-initiated commands, includingnon-data transfer commands.
Requests None
60Classes and Parameters
BM
C P
erfo
rman
ce M
anag
er
Exp
ress
fo
r H
P E
VA
Ver
sion
1.2
.00
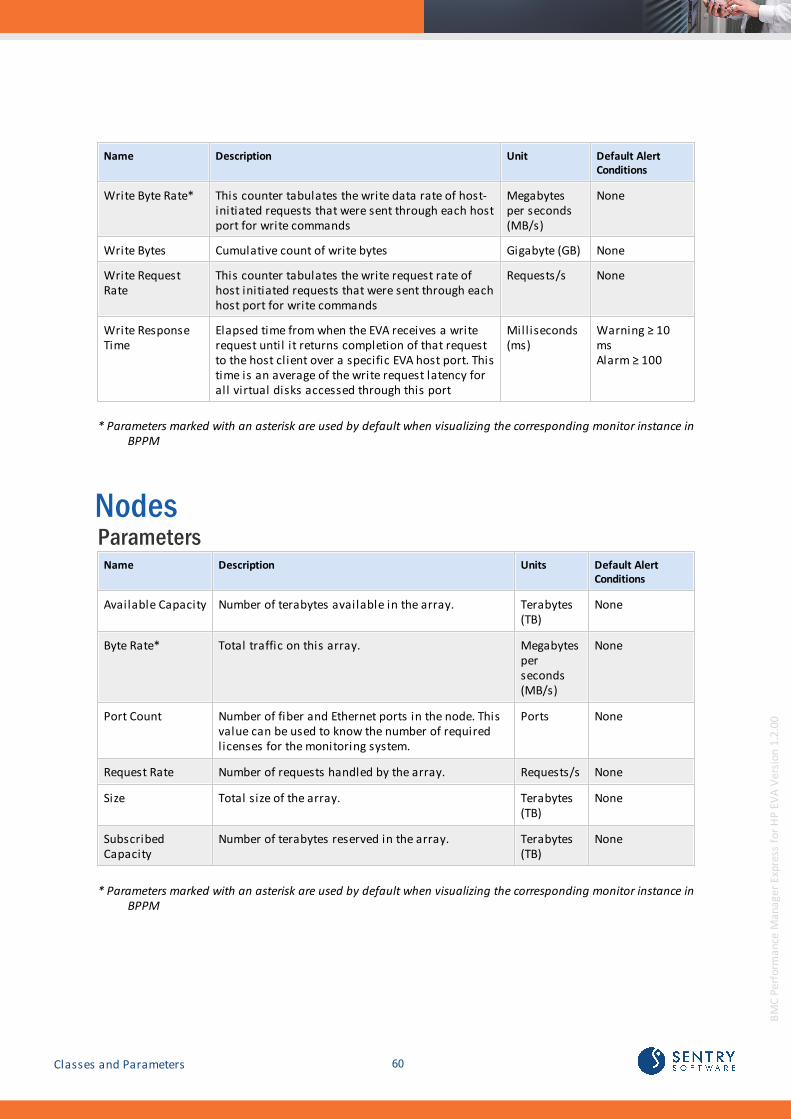
Name Description Unit Default AlertConditions
Write Byte Rate* This counter tabulates the write data rate of host-initiated requests that were sent through each hostport for write commands
Megabytesper seconds(MB/s)
None
Write Bytes Cumulative count of write bytes Gigabyte (GB) None
Write RequestRate
This counter tabulates the write request rate ofhost initiated requests that were sent through eachhost port for write commands
Requests/s None
Write ResponseTime
Elapsed time from when the EVA receives a writerequest until it returns completion of that requestto the host client over a specific EVA host port. Thistime is an average of the write request latency forall virtual disks accessed through this port
Milliseconds(ms)
Warning ≥ 10ms Alarm ≥ 100
* Parameters marked with an asterisk are used by default when visualizing the corresponding monitor instance inBPPM
NodesParameters
Name Description Units Default AlertConditions
Available Capacity Number of terabytes available in the array. Terabytes(TB)
None
Byte Rate* Total traffic on this array. Megabytesperseconds(MB/s)
None
Port Count Number of fiber and Ethernet ports in the node. Thisvalue can be used to know the number of requiredlicenses for the monitoring system.
Ports None
Request Rate Number of requests handled by the array. Requests/s None
Size Total size of the array. Terabytes(TB)
None
SubscribedCapacity
Number of terabytes reserved in the array. Terabytes(TB)
None
* Parameters marked with an asterisk are used by default when visualizing the corresponding monitor instance inBPPM

61 Classes and Parameters
BM
C P
erfo
rman
ce M
anag
er
Exp
ress
fo
r H
P E
VA
Ver
sion
1.2
.00
Physical Disk GroupsParameters
Name Description Units Default AlertConditions
ConsumedCapacity
Space used in the physical disk group. Gigabytes(GB)
If thresholds setin SSSU: warning= as set, andalarm = 80%.If nothing is setin the SSSU,warning + 90 %and alarm = 99%
ConsumedCapacityPercentage
Percentage of space used in the physical diskgroup.
Percent (%) None
Read Byte Rate Rate at which data is read to the physical disk byall hosts.
Megabytesper seconds(MB/s)
None
Read Bytes Cumulative count of read bytes. Gigabytes(GB)
None
Read RequestRate
Rate at which read requests are sent to the diskdrive from each controller.
Requests/s None
Read Response
Time Average time to complete the read requests. Milliseconds
(ms)None
Request Queue Average number of requests, both read and write, inprocess from the physical disk group.
Requests None
Response Time Average time to complete the requests. Milliseconds(ms)
None
Size Overall physical size of the disk group. Gigabytes(GB)
None
Protection Level Actual level of protection on the physical diskgroup.
NoneSingleDouble
The warningthreshold is setbased on therequestedprotection level.A warning istriggered whenthe actualprotection levelis lower than therequested one.! = warning
Write Byte Rate Rate at which data is written to the physical disk byall hosts.
Megabytesper seconds(MB/s)
None

62Classes and Parameters
BM
C P
erfo
rman
ce M
anag
er
Exp
ress
fo
r H
P E
VA
Ver
sion
1.2
.00
Name Description Units Default AlertConditions
Write Bytes Cumulative count of write bytes. Gigabytes(GB)
None
Write RequestRate
Rate at which write requests are sent to the diskdrive from each controller
Requests/s None
Write ResponseTime
Average time to complete the write requests. Milliseconds(ms)
None
For detailed information about Baselining and KPI, see Managing Baselines and Key Performance Indicators.

63 Classes and Parameters
BM
C P
erfo
rman
ce M
anag
er
Exp
ress
fo
r H
P E
VA
Ver
sion
1.2
.00
Physical DisksParameters
Name Description Units Default AlertConditions
Read Byte Rate* Rate at which data is read from a drive for eachcontroller.
Megabytesper seconds(MB/s)
None
Read Bytes Cumulative count of read bytes. Gigabytes(GB)
None
Read Request Rate Rate at which read requests are sent to the diskdrive for each controller.
Requests/s None
Read ResponseTime
Average time for a physical disk to complete a readrequest from each controller.
Milliseconds(ms)
None
Request Queue Average number of requests, both read and write,in process from each controller.
Requests None
Response Time Average time to complete the requests. Milliseconds(ms)
None
Write Byte Rate* Rate at which data is written to the virtual disk byall hosts and includes transfers from an HPContinuous Access EVA source system to thissystem for data replication.
Megabytesper seconds(MB/s)
None
Write Bytes Cumulative count of write bytes. Gigabytes(GB)
None
Write RequestRate
Rate at which write requests are sent to the diskdrive from each controller.
Requests/s None
Write ResponseTime
Average time for a physical disk to complete awrite request from each controller.
Milliseconds(ms)
None
* Parameters marked with an asterisk are used by default when visualizing the corresponding monitor instance inBPPM

64Classes and Parameters
BM
C P
erfo
rman
ce M
anag
er
Exp
ress
fo
r H
P E
VA
Ver
sion
1.2
.00
Port StatusParameters
Name Description Unit Default AlertConditions
Abnormal EOF Number of abnormal EOF encountered on this port. Errors Warning ≥ 1
Bad CharacterReceived
Number of bad characters received by this port. Characters Warning ≥ 1
Bad CRC Number of bad CRC encountered on this port Errors Warning ≥ 1
Discarded Frames Number of discarded frames by this port Frames Warning ≥ 1
Link Failures Number of link failures encountered by this port Failures Warning ≥ 1
Loss Of Signal Number of loss of signal encountered by this port Losses Warning ≥ 1
Loss Of Synch Number of loss of synchronization encountered onthis port
Losses Warning ≥ 1
Protocol Errors Number of protocol errors encountered on thisport.
Errors Warning ≥ 1
Status Overall status of this port PluggedUnplugged
Warning = 1

65 Classes and Parameters
BM
C P
erfo
rman
ce M
anag
er
Exp
ress
fo
r H
P E
VA
Ver
sion
1.2
.00
Virtual Disk GroupsParameters
Name Description Units Default AlertConditions
Cache Hit Ratio Percentage of requests that are successfully servedby a cache.
Percent (%) None
Cache Read ByteRate
Amount of data read off the cache. Megabytesper seconds(MB/s)
None
Cache ReadResponse Time
Average time taken to complete read operationsthat are served by the cache.
Milliseconds(ms)
None
Disk Read ByteRate
Amount of data read off the disk. Megabytesper seconds(MB/s)
None
Read Bytes Cumulative count of read bytes. Gigabytes(GB)
None
Disk Read RequestRate
Amount of read requests processed by the virtualdisk group.
Requests/s None
Disk ReadResponse Time
Average time taken to complete read operationsthat are served by the disks.
Milliseconds(ms)
None
Flush Byte Rate Amount of data eventually written to the disk. Megabytesper seconds(MB/s)
None
Mirror Byte Rate Mirroring traffic. Megabytesper seconds(MB/s)
None
Prefetch Byte Rate Amount of data that is proactively loaded into thecache.
Megabytesper seconds(MB/s)
None
Total Read ByteRate
Total amount of data read from the virtual diskgroup (Cache Read Byte Rate + Disk Read Byte Rate).
Megabytesper seconds(MB/s)
None
Write Byte Rate Amount of data written to the virtual disk group. Megabytesper seconds(MB/s)
None
Write Bytes Cumulative count of write bytes. Gigabytes(GB)
None
Write RequestRate
Amount of write request processed by the virtualdisk group.
Requests/s None
Write ResponseTime
Average time taken to complete write requests. Milliseconds(ms)
None

66Classes and Parameters
BM
C P
erfo
rman
ce M
anag
er
Exp
ress
fo
r H
P E
VA
Ver
sion
1.2
.00
* Parameters marked with an asterisk are used by default when visualizing the corresponding monitor instance inBPPM
Virtual DisksParameters
Name Description Units Default AlertConditions
Cache Hit Ratio Percentage of requests that are successfully servedby a cache.
Percent (%) None
Cache Read ByteRate
Amount of data read off the cache. Megabytesper seconds(MB/s)
None
Cache ReadResponse Time
Average time taken to complete read operationsthat are served by the cache.
Milliseconds(ms)
None
Disk Read ByteRate
Amount of data read off the disk. Megabytesper seconds(MB/s)
None
Disk Read RequestRate
Amount of read requests processed by the disk. Requests/s None
Flush Byte Rate Amount of data eventually written to the disk. Megabytesper seconds(MB/s)
None
Mirror Byte Rate Mirroring traffic. Megabytesper seconds(MB/s)
None
Prefetch Byte Rate Amount of data that is proactively loaded into thecache.
Megabytes/seconds(MB/s)
None
Read Bytes Cumulative count of read bytes. Gigabytes(GB)
None
Time Since LastActivity
Number of days since any activity occurred on thedisk.
Days None
Total Read ByteRate*
Total amount of data read from the disk (CacheRead Byte Rate + Disk Read Byte Rate).
Megabytesper seconds(MB/s)
None
Write Byte Rate Amount of data written to the disk. Megabytesper seconds(MB/s)
None
Write Bytes* Cumulative count of write bytes. Gigabytes(GB)
None
Write RequestRate
Amount of write request processed by the disk. Requests/seconds(Requests/s)
None

67 Classes and Parameters
BM
C P
erfo
rman
ce M
anag
er
Exp
ress
fo
r H
P E
VA
Ver
sion
1.2
.00
Name Description Units Default AlertConditions
Write ResponseTime
Average time taken to complete write requests. Milliseconds(ms)
None
* Parameters marked with an asterisk are used by default when visualizing the corresponding monitor instance inBPPM
Special Note on Application Collection StatusThis Boolean parameter shows the status of the application and its ability to collect data. A valueof False means that the RSM cannot communicate with or collect information for the applicationclass on the element.

69
BM
C P
erfo
rman
ce M
anag
er
Exp
ress
fo
r H
P E
VA
Ver
sion
1.2
.00
Index
- A -Abnormalities 33
Action
Comparison 45, 47
Detection 43, 45
Diagnostics 46, 47, 49
Verification 50
View 42Adapter
Add 26
Create 26Alarm 52
Application Classes 18, 22, 37, 38
Controllers 57
Data Replication Tunnels 58
Host Connections 59
Host Port Statistics 59
Nodes 60
Physical Disk Groups 50, 61
Physical Disks 63
Port Status 49, 64
Virtual Disk Groups 65
Virtual Disks 66Architecture 12
- B -Baselines
BMC ProactiveNet Performance Management 33
Generation 33
Manage 33
Requirements 33BMC
ProactiveNet Performance Management 26BMC ProactiveNet Performance Management
Abnormalities 33
Baselines 33
Key Performance Indicators 33
KPI 33
- C -Cache 65, 66
Category 18, 22
Command View 15
CRC 64
Credentials 15
- D -Debug Mode
Enable 54Devices
Array 60
Controller 12, 43, 45, 57, 63
Disk 12
Disk array 15, 42, 45
Drive 63
Fan 12
Fiber port 12
Logical drive 45
Network port 12
Physical disk 50, 63
Power Supply 12
Processor 43, 57
Virtual disk 63Disable
Virtual Disks Monitoring 54Disk
Layout 47
Physical 47, 50, 63
Virtual 63, 65, 66
- E -Element Properties 22
EMC
EMC Disk Arrays level 11EOF 64
EVA
EVA disk array 15
- F -Fiber
Performance 46, 49
70
BM
C P
erfo
rman
ce M
anag
er
Exp
ress
fo
r H
P E
VA
Ver
sion
1.2
.00
Files
.par 11, 16
PAR 16Fixed Issues 7
Frames
Discarded 64
- G -Generate
Baselines 33Getting Started 11
- H -How it works 11
HP
HP Command View EVA 15
HP Storage Server 15
HP StorageWorks Command View 15
- I -Install / Un-install 15, 18, 22
Delete 37, 38
Element 37
Element Profile 37
Prerequisites 15
Removal 37
Remove 37
Upload 16Integration Service Agent 26
Introduction 41
Issues
Bad Disk Layout 47
Bottleneck 43, 45, 46, 47, 49
Fiber Performance 46
LUN activity 50
'multi-pathing' issues 46
Overload 43, 45
Protection Level 50
Slow Fiber Performance 49
Unbalanced Workload Distribution 45
- K -Key Performance Indicators
BMC ProactiveNet Performance Management 33
Manage 33KPI
BMC ProactiveNet Performance Management 33
Manage 33
- M -Manage
Baselines 33
Key Performance Indicators 33
KPI 33Metrics
Activity 42
Disk space usage 12
High Processor Utilization 43
I/Os 12
Overall Activity 42
Storage controller utilization 12
Unbalanced Workload Distribution 45Monitor Type 26
Monitoring 12
- O -Overview 9
- P -Package 11
Parameter
Application Collection Status 54Parameters
Abnormal EOF 64
Application Collection Status 67
Available Capacity 60
Bad Character Received 64
Bad CRC 64
Busy Responses 59
Byte Rate 42, 60
CacheHitRatio 65, 66
CacheReadByteRate 65, 66
CacheReadDataRate 50
CacheReadResponseTime 65, 66
Capacity 61
Consumed Capacity 61

71
BM
C P
erfo
rman
ce M
anag
er
Exp
ress
fo
r H
P E
VA
Ver
sion
1.2
.00
Parameters
Consumed Capacity Percentage 61
CopyInByRate 58
CopyOutByRate 58
CopyRetriesRate 58
Discarded Frames 64
DiskReadByteRate 65, 66
DiskReadRequestRate 65, 66
DiskReadResponseTime 65, 66
FlushByteRate 50, 65, 66
FreeCommandResources 58
FreeCopyResources 58
FreeWriteResources 58
Link Failures 64
Loss Of Signal 64
Loss Of Synch 64
MirrorByteRate 50, 65, 66
PrefetchByteRate 50, 65, 66
Processor Utilization 57
Protection Level 61
Protocol Errors 64
Read Byte Rate 59, 61, 63
Read Bytes 59, 61, 63
Read Request Rate 59, 61, 63
Read Response Time 59, 61, 63
ReadByteRate 50
ReadBytes 66
ReadResponseTime 50
Request Queue 59, 61, 63
Request Rate 42, 60
Round Trip Delay 58
Size 60, 61
Status 57, 64
Subscribed Capacity 60
Time Since Last Activity 66
TotalReadByteRate 65, 66
Transfer Processor Utilization 57
Write Byte Rate 47, 59, 61, 63
Write Bytes 59, 61, 63
Write Request Rate 59, 61, 63
Write Response Time 59, 61, 63
Write Retries Byte Rate 58
WriteByteRate 50, 65, 66
WriteBytes 65, 66
WriteInByRate 58
WriteOutByRate 58
WriteRequestRate 65, 66
WriteResponseTime 50, 65, 66
WriteRetriesRate 58
Performance
Degradations 43
Fiber 46, 49
Slow 49Performance Managers 38
Port 18
Fiber port 64Portal 11
Portal level 11
Prerequisites 11
Profile 18
Properties
Collection interval 18
Credentials 18
Debug Mode 18
Disable Virtual Disks Monitoring 18
Element Profile 18
Hostname 18
- R -Reference Guide 57
Release Notes 7
Remote Service Monitor 11
Requirements 11
RSM 11
- S -SAN 47
Status
Published 16Storage 18, 22
Storage Server 15
Support 54
- T -Tasks 16
Threshold 11, 18, 43
Edit 52
Setting 52
- U -Utility
evaperf 15

72
BM
C P
erfo
rman
ce M
anag
er
Exp
ress
fo
r H
P E
VA
Ver
sion
1.2
.00
Utility
SSSU.EXE 15
Storage System Scripting 15
- V -Virtual Disks
disable monitoring 54
- W -Warning 52

About Sentry Software™Sentry Software, a strategic Technology Alliance Partner of BMC Software, providescomprehensive multi-platform monitoring solutions that enable management of thehardware and software aspects of all servers and SANs and covering up to 100 % ofcustom applications within the BMC ProactiveNet Performance Managementenvironment. Sentry Software also develops adapters for BMC Atrium Orchestrator thatenables IT administrators to automate the execution of common requests and tasks thatoccur in the daily course of IT operations. Combined with BMC’s servers and networkautomation tools, the adapters allow IT administrators to implement provisioning anddecommissioning workflows that cover all layers of their IT infrastructure. Finally, SentrySoftware designs connectors that bring storage capacity metrics into BMC TrueSightCapacity Optimization to ensure IT administrators that their storage infrastructure isproperly sized for their current and future needs.
Like us on Facebook:facebook.com/sentrysoftware
Follow us on Twitter:
twitter.com/sentrysoftware
LEARN MORE
To learn more about our solutions, please visit :www.sentrysoftware.com/solutions
© BMC Software, Inc. All rights reserved.
ABOUT MARKETZONE DIRECT PRODUCTS
The BMC MarketZone Directprogram sells and supportsthird-party products thatcomplement and/or augment BMCsolutions. MarketZone Directproducts are available under BMClicense and support terms.
About BMC Software™BMC Software helps leading companies around the world put technology at the forefrontof business transformation, improving the delivery and consumption of digital services.From mainframe to cloud to mobile, BMC delivers innovative IT management solutionsthat have enabled more than 20,000 customers to leverage complex technology intoextraordinary business performance—increasing their agility and exceeding anythingthey previously thought possible. For more information about BMC Software, visit
www.bmc.com.
Bus ines s thrives when IT runs s marter,fas ter and s tronger. That’s why the mos tdemanding IT organizations in the worldrely on BMC Software acros s dis tributed,mainframe, virtual and cloudenvironments . Recognized as the leader inBus ines s Service Management, BMC offersa comprehens ive approach and unifiedplatform that helps IT organizations cutcos t , reduce ris k and drive bus ines sprofit . For the four fis cal quarters endedSeptember 30,2011, BMC revenue wasapproximately $2.2 billion.
BUSINESS RUNS ON I.T .
I.T . RUNS ON BMC SOFT WARE


