21
© 2017 BMC. All Rights Reserved. BMC STOCK HOLDINGS, INC. 2017 Jefferies Industrials Conference August 9, 2017 Jim Major, Executive Vice President, CFO and Treasurer

© 2017 BMC. All Rights Reserved.
BMC STOCK HOLDINGS, INC.2017 Jefferies Industrials Conference
August 9, 2017
Jim Major, Executive Vice President, CFO and Treasurer
CLICK TO EDIT TITLEDISCLAIMER
2
Forward-Looking StatementsThis document contains "forward-looking statements" within the meaning of the Private Securities Litigation Reform Act of 1995. Forward-looking statements in thisdocument may include, without limitation, statements regarding sales growth, price changes, earnings performance, strategic direction and the demand for our products.Forward-looking statements are typically identified by words or phrases such as "may," "might," "predict," "future," "seek to," "assume," "goal," "objective," "continue," "will,""could," "should," "would," "anticipate," "estimate," "expect," "project," "intend," "plan," "believe," "target," "prospects," "guidance," "possible," "predict," "propose," "potential"and "forecast," or the negative of such terms and other words, terms and phrases of similar meaning. Forward-looking statements involve estimates, expectations,projections, goals, forecasts, assumptions, risks and uncertainties, many of which are outside BMC Stock Holdings, Inc.’s (“BMC” or the “Company”) control. BMC cautionsreaders that any forward-looking statement is not a guarantee of future performance and that actual results could differ materially from those contained in the forward-looking statement; therefore, investors and shareholders should not place undue reliance on such statement. Such forward-looking statements include, but are not limitedto, statements about the benefits of the recently completed merger (the “Merger”) of Stock Building Supply Holdings, Inc. (“SBS” or “Legacy SBS”) with Building MaterialsHolding Corporation (“Legacy BMC”), including future financial and operating results, plans, objectives, expectations and intentions, and other statements that are nothistorical facts. There are a number of risks and uncertainties that could cause actual results to differ materially from the forward-looking statements included in thiscommunication. Important factors that could cause actual results to differ materially from those indicated by such forward-looking statements include risks and uncertaintiesrelating to: the risk that the Legacy SBS and Legacy BMC businesses will not be integrated successfully or that such integration will take longer, be more difficult, time-consuming or costly to accomplish than expected; the risk that the cost savings and any other synergies from the Merger may not be fully realized or may take longer torealize than expected; disruption from the Merger may make it more difficult to maintain relationships with customers, employees or suppliers; the diversion of managementtime on Merger-related issues; general worldwide economic conditions and related uncertainties; changes in the markets for BMC's business segments; unanticipateddownturns in business relationships with customers; competitive pressures on the Company's sales and pricing; increases in the cost of material, energy and otherproduction costs, or unexpected costs that cannot be recouped in product pricing; the introduction of competing technologies; unexpected technical or marketing difficulties;unexpected claims, charges, litigation or dispute resolutions; the effect of changes in governmental regulations and/or tariffs; and other factors discussed or referred to inthe "Risk Factors" section of BMC’s most recent Annual Report on Form 10-K filed on March 1, 2017. All such factors are difficult to predict and are beyond BMC's control.All forward-looking statements attributable to BMC or persons acting on BMC's behalf are expressly qualified in their entirety by the foregoing cautionary statements. Allsuch statements speak only as of the date made, and BMC undertakes no obligation to update or revise publicly any forward-looking statements, whether as a result of newinformation, future events or otherwise.
Basis of PresentationThe Merger was accounted for as a “reverse acquisition” under the acquisition method of accounting, with Legacy SBS treated as the legal acquirer and Legacy BMCtreated as the acquirer for accounting purposes. As such, the Company has accounted for the Merger by using Legacy BMC historical information and accounting policiesand adding the assets and liabilities of Legacy SBS as of the completion date of the Merger at their estimated fair values. As a result, current year results reported pursuantto U.S. generally accepted accounting principles (“GAAP”) are not comparable to prior periods.
CLICK TO EDIT TITLENON-GAAP (ADJUSTED) FINANCIAL MEASURES
3
Adjusted net sales, Adjusted gross profit, Adjusted EBITDA, Adjusted EBITDA margin, Adjusted net income and Adjusted net income per diluted share are intended as
supplemental measures of the Company’s performance that are not required by, or presented in accordance with, GAAP. The Company believes that Adjusted net sales,
Adjusted gross profit, Adjusted EBITDA, Adjusted EBITDA margin, Adjusted net income and Adjusted net income per diluted share provide useful information to
management and investors regarding certain financial and business trends relating to the Company’s financial condition and operating results.
• Adjusted net sales is defined as BMC net sales plus pre-Merger SBS net sales.
• Adjusted gross profit is defined as BMC gross profit plus pre-Merger SBS gross profit and inventory step-up charges.
• Adjusted EBITDA is defined as BMC net (loss) income plus pre-Merger SBS income (loss) from continuing operations, interest expense, income tax (benefit) expense,
depreciation and amortization, Merger and integration costs, restructuring expense, inventory step-up charges, non-cash stock compensation expense, loss on debt
extinguishment, headquarters relocation expense, insurance deductible reserve adjustment and fire casualty loss, loss on portfolio transfer, acquisition costs and other
items and impairment of assets.
• Adjusted EBITDA margin is defined as Adjusted EBITDA divided by net sales or Adjusted net sales.
• Adjusted net income is defined as BMC net income plus merger and integration costs, non-cash stock compensation expense, acquisition costs, impairment of assets,
inventory step-up charges and after-tax effecting those items.
• Adjusted net income per diluted share is defined as Adjusted net income divided by diluted weighted average shares.
Company management uses Adjusted net sales, Adjusted gross profit, Adjusted EBITDA, Adjusted EBITDA margin, Adjusted net income and Adjusted net income per
diluted share for trend analyses, for purposes of determining management incentive compensation and for budgeting and planning purposes. Adjusted net sales, Adjusted
gross profit and Adjusted EBITDA are used in monthly financial reports prepared for management and the board of directors. The Company believes that the use of
Adjusted net sales, Adjusted gross profit, Adjusted EBITDA, Adjusted EBITDA margin, Adjusted net income and Adjusted net income per diluted share provide additional
tools for investors to use in evaluating ongoing operating results and trends and in comparing the Company’s financial measures with other distribution and retail
companies, which may present similar non-GAAP financial measures to investors. However, the Company’s calculation of Adjusted net sales, Adjusted gross profit,
Adjusted EBITDA, Adjusted EBITDA margin, Adjusted net income and Adjusted net income per diluted share are not necessarily comparable to similarly titled measures
reported by other companies. Company management does not consider Adjusted net sales, Adjusted gross profit, Adjusted EBITDA, Adjusted EBITDA margin, Adjusted
net income and Adjusted net income per diluted share in isolation or as alternatives to financial measures determined in accordance with GAAP. The principal limitation of
Adjusted EBITDA and Adjusted net income is that they exclude significant expenses and income that are required by GAAP to be recorded in the Company’s financial
statements. Some of these limitations are: (i) Adjusted EBITDA and Adjusted net income do not reflect changes in, or cash requirements for, working capital needs;
(ii) Adjusted EBITDA does not reflect interest expense, or the requirements necessary to service interest or principal payments on debt; (iii) Adjusted EBITDA does not
reflect income tax expenses or the cash requirements to pay taxes; (iv) Adjusted net income and Adjusted EBITDA do not reflect historical cash expenditures or future
requirements for capital expenditures or contractual commitments; (v) although depreciation and amortization charges are non-cash charges, the assets being depreciated
and amortized will often have to be replaced in the future and Adjusted EBITDA and Adjusted net income do not reflect any cash requirements for such replacements and
(vi) Adjusted net income and Adjusted EBITDA do not consider the potentially dilutive impact of issuing non-cash stock-based compensation. In order to compensate for
these limitations, management presents Adjusted net sales, Adjusted gross profit, Adjusted EBITDA and Adjusted net income in conjunction with GAAP results. Readers
should review the reconciliations of net sales to Adjusted net sales, gross profit to Adjusted gross profit, net income (loss) to Adjusted EBITDA and Adjusted net income,
included in the Appendix, and should not rely on any single financial measure to evaluate the Company’s business.

CLICK TO EDIT TITLEBMC COMPANY SNAPSHOTNASDAQ LISTED: BMCH
4
2016 Product & Service Mix A leading national building solutions provider with $3.1
billion of net sales and $193.9 million of Adjusted EBITDA(1)
for 2016
Locations in 18 states representing 64% of 2016 single-
family building permits
Significant market presence in 43 attractive metropolitan
areas
Focus on differentiated, value-added products and services
that meet critical industry needs
Proven growth track record (~28% Adjusted EBITDA CAGR
since 2013) with significant future opportunities as housing
market expands
Design
Services
Component
Manufacturing
Millwork
ManufacturingTurnkey
Solutions
93 Distribution Yards 53 Ready-Frame,
EWP, Truss & Panel
Manufacturing
52 Millwork
Operations
Installation
Services
Design Centers &
Showrooms
eBusiness
Platform
Logistics, Services
& eCommerce
Distribution
Services
Structural Components,
15%
Lumber & Sheet Goods,
30%Millwork, Windows & Doors,
29%
Other Bldg. Products & Services,
26%
1. See Non-GAAP (Adjusted) Financial Measures page of this presentation for definition of Adjusted EBITDA.
Product categories are shown a % of 2016 net sales
CLICK TO EDIT TITLE
-
1,000
2,000
3,000
4,000
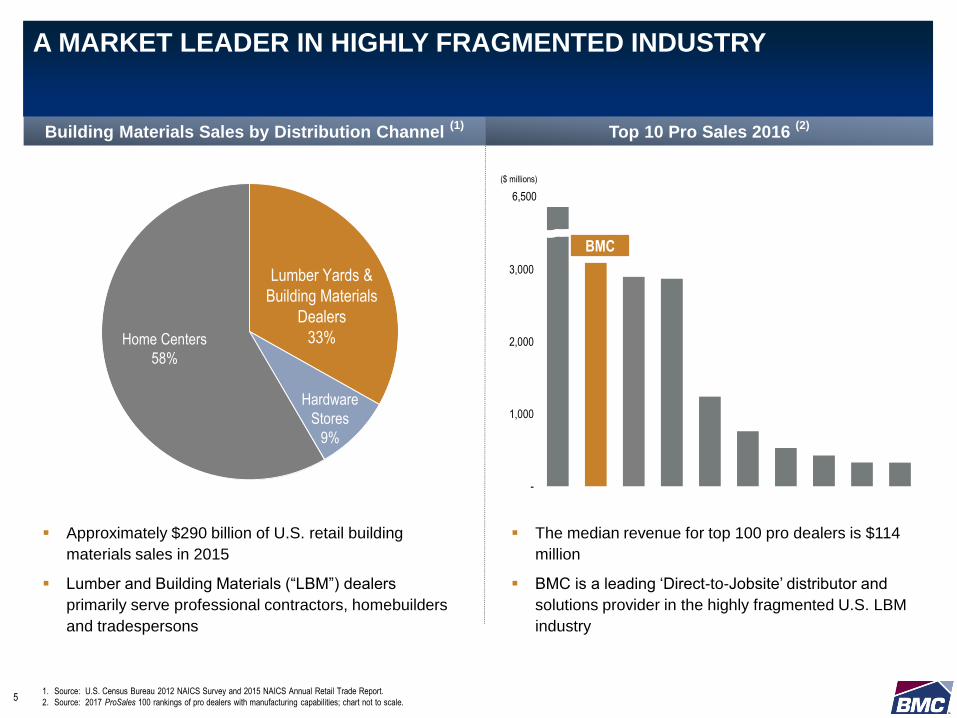
A MARKET LEADER IN HIGHLY FRAGMENTED INDUSTRY
Lumber Yards &
Building Materials
Dealers
33%Home Centers
58%
Hardware
Stores
9%
($ millions)
BMC
Top 10 Pro Sales 2016 (2)
Building Materials Sales by Distribution Channel (1)
Approximately $290 billion of U.S. retail building
materials sales in 2015
Lumber and Building Materials (“LBM”) dealers
primarily serve professional contractors, homebuilders
and tradespersons
The median revenue for top 100 pro dealers is $114
million
BMC is a leading ‘Direct-to-Jobsite’ distributor and
solutions provider in the highly fragmented U.S. LBM
industry
6,500
1. Source: U.S. Census Bureau 2012 NAICS Survey and 2015 NAICS Annual Retail Trade Report.
2. Source: 2017 ProSales 100 rankings of pro dealers with manufacturing capabilities; chart not to scale.5
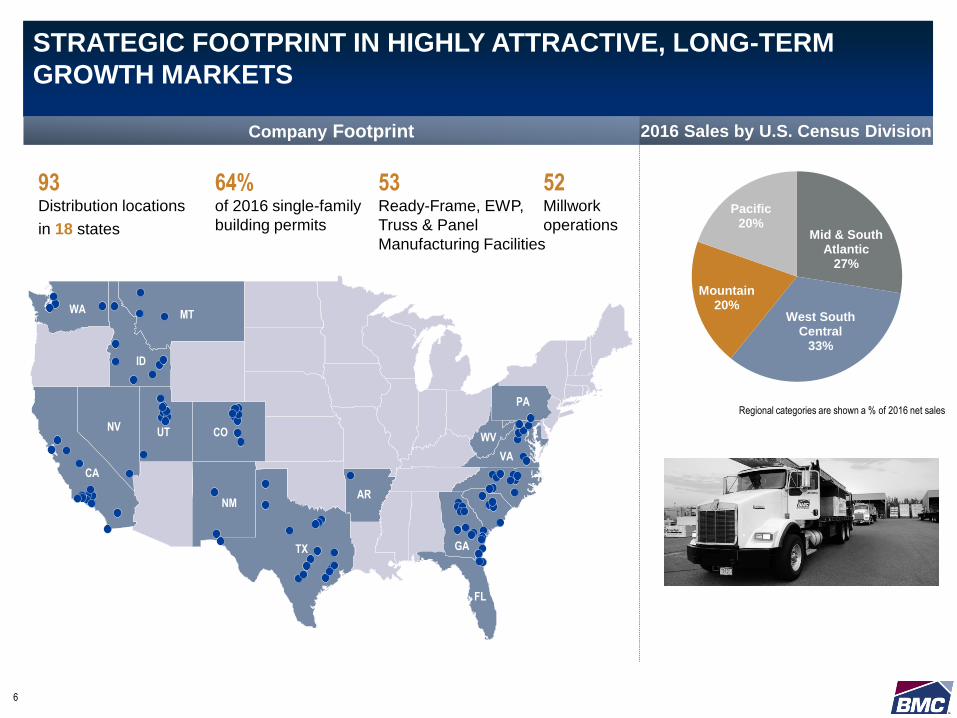
CLICK TO EDIT TITLESTRATEGIC FOOTPRINT IN HIGHLY ATTRACTIVE, LONG-TERM
GROWTH MARKETS
6
Mid & South Atlantic
27%
West South Central
33%
Mountain20%
Pacific20%
2016 Sales by U.S. Census DivisionCompany Footprint
FL
NM
TX
MT
COUT
ID
NV
WA
CA
PA
VA
AR
GA
93 Distribution locations
in 18 states
53Ready-Frame, EWP,
Truss & Panel
Manufacturing Facilities
52Millwork
operations
64% of 2016 single-family
building permits
Regional categories are shown a % of 2016 net sales
WV

CLICK TO EDIT TITLE
Select Customers
Multi-Family & Commercial
Contractors
13%
Repair & Remodel Contractors
12%
Single-Family Homebuilders
75%
National Homebuilders Regional Homebuilders Multi-family (millwork)
Highly Diversified and Growing Customer Base
HIGHLY DIVERSIFIED CUSTOMER & SUPPLIER BASES
2016 Customer Mix
No single customer greater than 5% of total net sales
Diversified Supplier Base
Diverse Base of Customers Ranging from Well-Known
National Builders to Small Regional and Local Players
BMC Provides Strategic Go-to-Market Options for
Suppliers
One-step value-added distributor providing direct
access to thousands of customers
Strategic agreements in place with leading building
products suppliers
7
CLICK TO EDIT TITLE
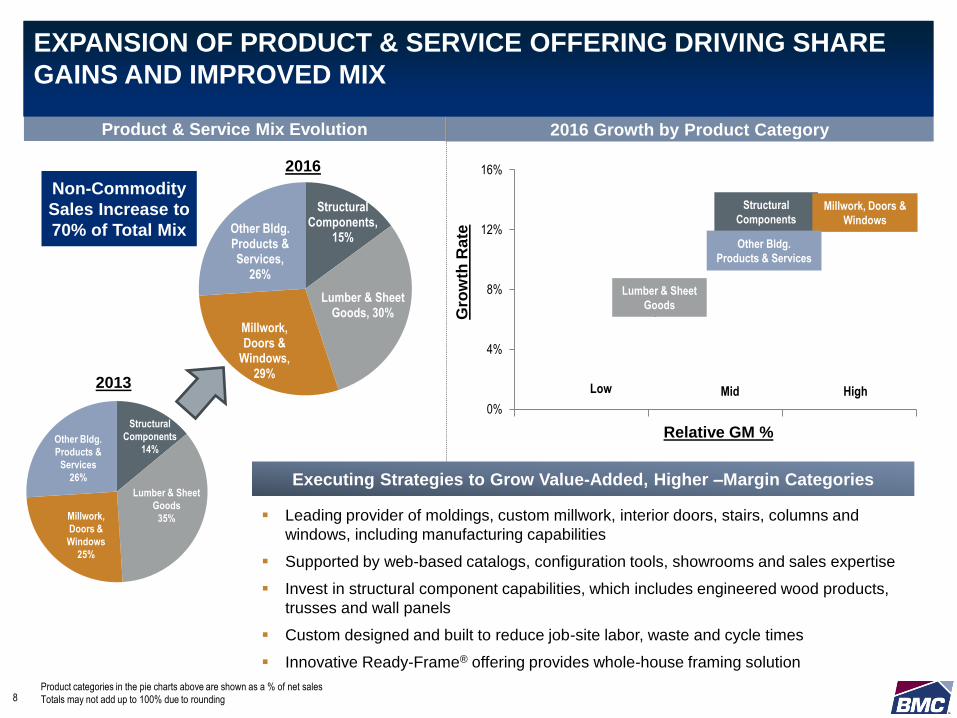
Other Bldg.
Products &
Services
26%
Lumber & Sheet
Goods
35%Millwork,
Doors &
Windows
25%
Structural
Components
14%
Structural Components,
15%
Lumber & Sheet Goods, 30%
Millwork, Doors &
Windows, 29%
Other Bldg. Products & Services,
26%
Leading provider of moldings, custom millwork, interior doors, stairs, columns and
windows, including manufacturing capabilities
Supported by web-based catalogs, configuration tools, showrooms and sales expertise
Invest in structural component capabilities, which includes engineered wood products,
trusses and wall panels
Custom designed and built to reduce job-site labor, waste and cycle times
Innovative Ready-Frame® offering provides whole-house framing solution
Executing Strategies to Grow Value-Added, Higher –Margin Categories
Product & Service Mix Evolution 2016 Growth by Product Category
Relative GM %
Gro
wth
Rate
Low High
0%
4%
8%
12%
16%
Structural
ComponentsMillwork, Doors &
Windows
Lumber & Sheet
Goods
Other Bldg.
Products & Services
2013
2016
EXPANSION OF PRODUCT & SERVICE OFFERING DRIVING SHARE
GAINS AND IMPROVED MIX
8Product categories in the pie charts above are shown as a % of net sales
Totals may not add up to 100% due to rounding
Mid
Non-Commodity
Sales Increase to
70% of Total Mix

CLICK TO EDIT TITLEREADY-FRAME®
MEETING INDUSTRY NEEDS; FIRST-MOVER POSITION FOR FUTURE OF FRAMING
9
Designed to reduce builder cycle time, labor
requirement and material waste
Applicable to single-family, custom, multi-family,
and commercial construction
Enables customers to frame 20-30% more
houses in same time period as stick framing
Whole house, precision pre-cut package
One price per package
Smart bundled (top piece off delivery is first
used for framing)
No cutting lumber, no last minute orders, no
errors and no punch lists
Take off guaranteed to the 1/16”
Greener solution with minimal to no on-site waste
and disposal costs
Opportunity to transition commodity lumber sales
to value-added solutions and grow share
Less Risk. Less Labor. Less Cost.
READY-FRAME video:
https://www.youtube.com/watch?v=REv665u2QRI
CLICK TO EDIT TITLEREADY-FRAME®
PROVEN TRACK RECORD OF SHARE GAINS; POISED TO DRIVE FUTURE GROWTH
10
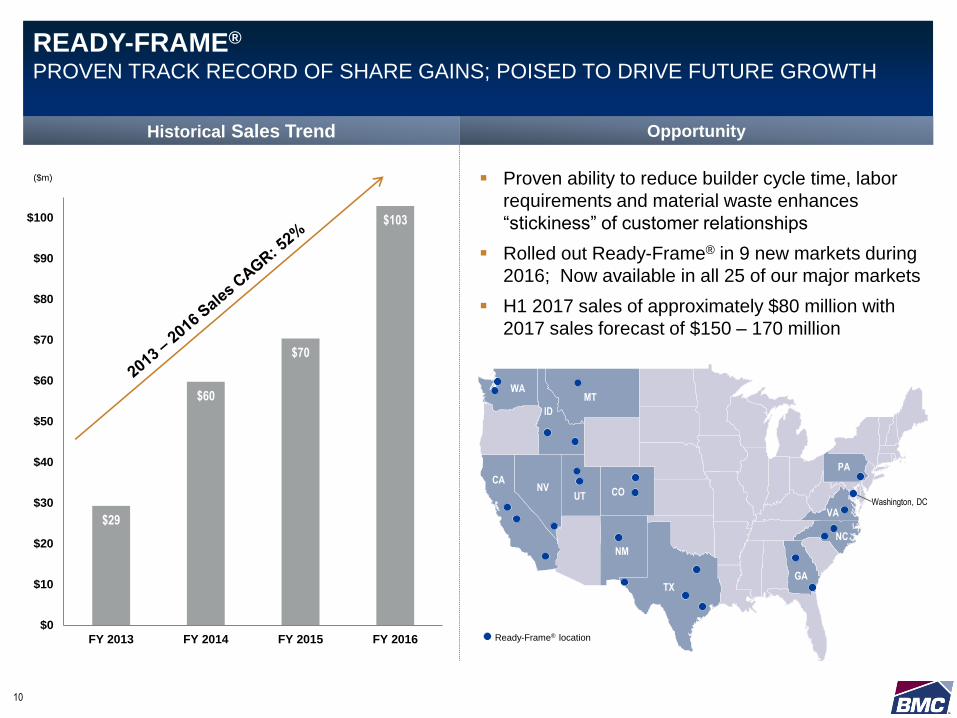
OpportunityHistorical Sales Trend
Proven ability to reduce builder cycle time, labor
requirements and material waste enhances
“stickiness” of customer relationships
Rolled out Ready-Frame® in 9 new markets during
2016; Now available in all 25 of our major markets
H1 2017 sales of approximately $80 million with
2017 sales forecast of $150 – 170 million
Ready-Frame® location
$29
$60
$70
$103
$0
$10
$20
$30
$40
$50
$60
$70
$80
$90
$100
FY 2013 FY 2014 FY 2015 FY 2016
($m)
COUTNV
WA
CA
Washington, DC
MT
ID
NM
TXGA
NC
PA
VA
CLICK TO EDIT TITLEBMC’S LEAN EBUSINESS EVOLUTIONBUILDING A TECHNOLOGY PLATFORM TO ENABLE AND LEVERAGE PROFITABLE
GROWTH
11
>92%
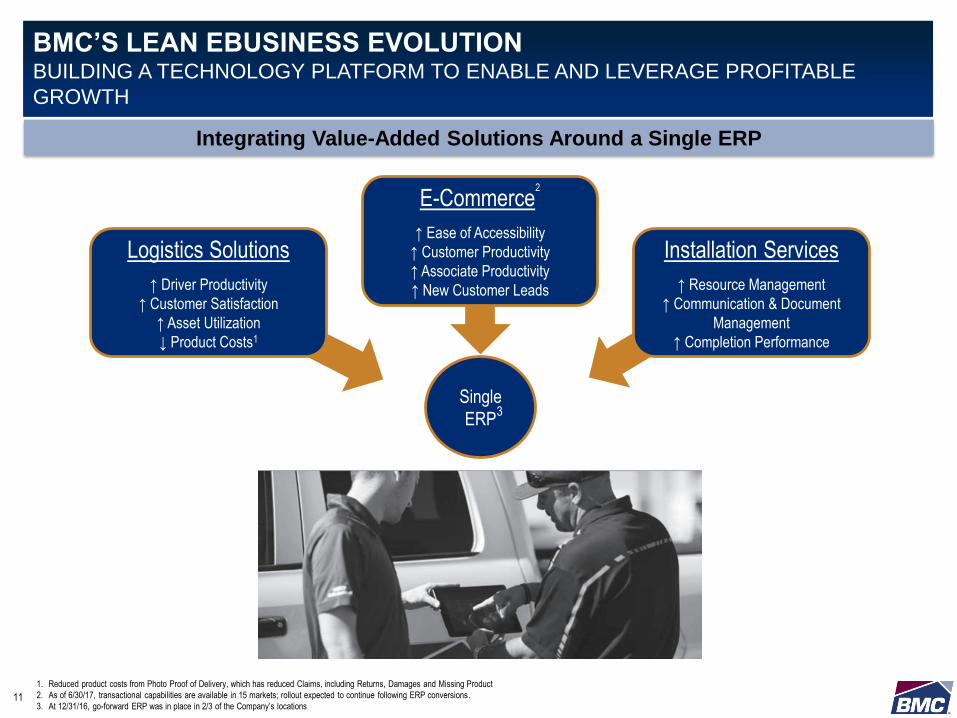
1. Reduced product costs from Photo Proof of Delivery, which has reduced Claims, including Returns, Damages and Missing Product
2. As of 6/30/17, transactional capabilities are available in 15 markets; rollout expected to continue following ERP conversions.
3. At 12/31/16, go-forward ERP was in place in 2/3 of the Company’s locations
Single
ERP
Logistics Solutions
↑ Driver Productivity
↑ Customer Satisfaction
↑ Asset Utilization
↓ Product Costs1
E-Commerce2
↑ Ease of Accessibility
↑ Customer Productivity
↑ Associate Productivity
↑ New Customer Leads
Installation Services
↑ Resource Management
↑ Communication & Document
Management
↑ Completion Performance
Integrating Value-Added Solutions Around a Single ERP
3
CLICK TO EDIT TITLE
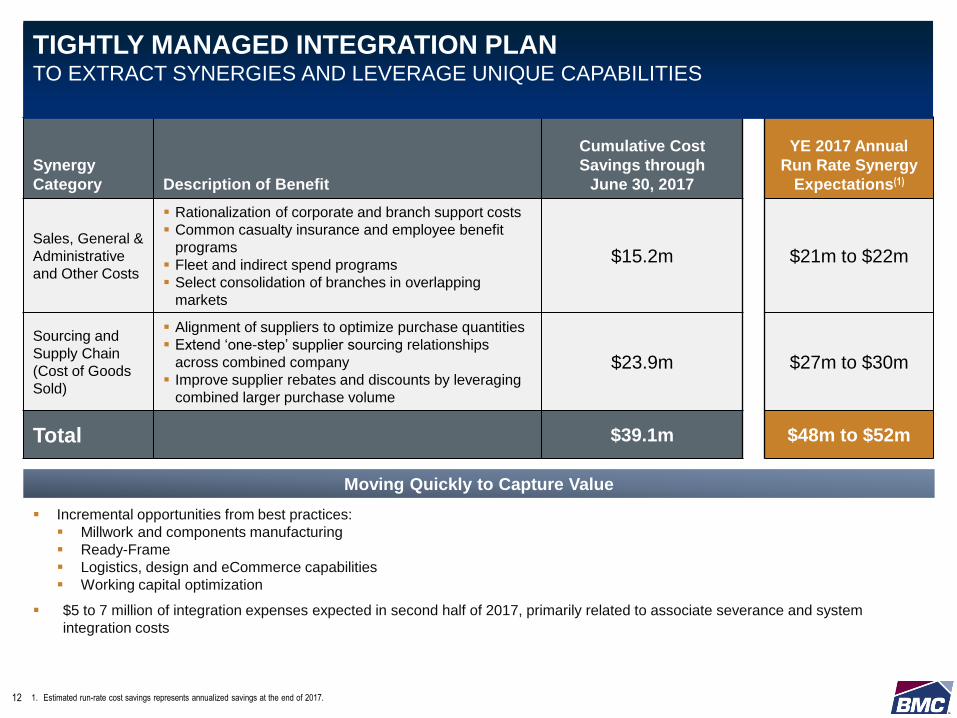
Incremental opportunities from best practices:
Millwork and components manufacturing
Ready-Frame
Logistics, design and eCommerce capabilities
Working capital optimization
$5 to 7 million of integration expenses expected in second half of 2017, primarily related to associate severance and system
integration costs
Synergy
Category Description of Benefit
Cumulative Cost
Savings through
June 30, 2017
YE 2017 Annual
Run Rate Synergy
Expectations(1)
Sales, General &
Administrative
and Other Costs
Rationalization of corporate and branch support costs
Common casualty insurance and employee benefit
programs
Fleet and indirect spend programs
Select consolidation of branches in overlapping
markets
$15.2m $21m to $22m
Sourcing and
Supply Chain
(Cost of Goods
Sold)
Alignment of suppliers to optimize purchase quantities
Extend ‘one-step’ supplier sourcing relationships
across combined company
Improve supplier rebates and discounts by leveraging
combined larger purchase volume
$23.9m $27m to $30m
Total $39.1m $48m to $52m
Moving Quickly to Capture Value
1. Estimated run-rate cost savings represents annualized savings at the end of 2017.
TIGHTLY MANAGED INTEGRATION PLAN TO EXTRACT SYNERGIES AND LEVERAGE UNIQUE CAPABILITIES
12
CLICK TO EDIT TITLE
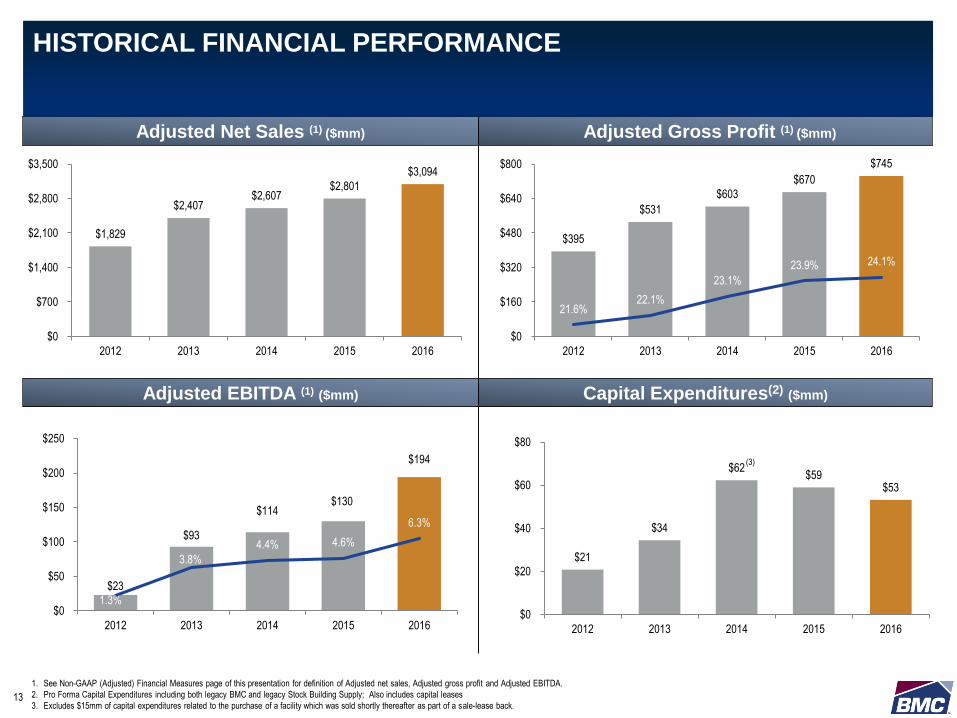
$23
$93
$114 $130
$194
1.3%
3.8%
4.4% 4.6%
6.3%
$0
$50
$100
$150
$200
$250
2012 2013 2014 2015 2016
$395
$531
$603
$670
$745
21.6%22.1%
23.1%
23.9% 24.1%
$0
$160
$320
$480
$640
$800
2012 2013 2014 2015 2016
$21
$34
$62 $59
$53
$0
$20
$40
$60
$80
2012 2013 2014 2015 2016
$1,829
$2,407 $2,607
$2,801
$3,094
$0
$700
$1,400
$2,100
$2,800
$3,500
2012 2013 2014 2015 2016
Adjusted Net Sales (1) ($mm) Adjusted Gross Profit (1) ($mm)
Adjusted EBITDA (1) ($mm)
1. See Non-GAAP (Adjusted) Financial Measures page of this presentation for definition of Adjusted net sales, Adjusted gross profit and Adjusted EBITDA.
2. Pro Forma Capital Expenditures including both legacy BMC and legacy Stock Building Supply; Also includes capital leases
3. Excludes $15mm of capital expenditures related to the purchase of a facility which was sold shortly thereafter as part of a sale-lease back.
Capital Expenditures(2) ($mm)
(3)
HISTORICAL FINANCIAL PERFORMANCE
13
CLICK TO EDIT TITLEQ2 2017 FINANCIAL RESULTS
14
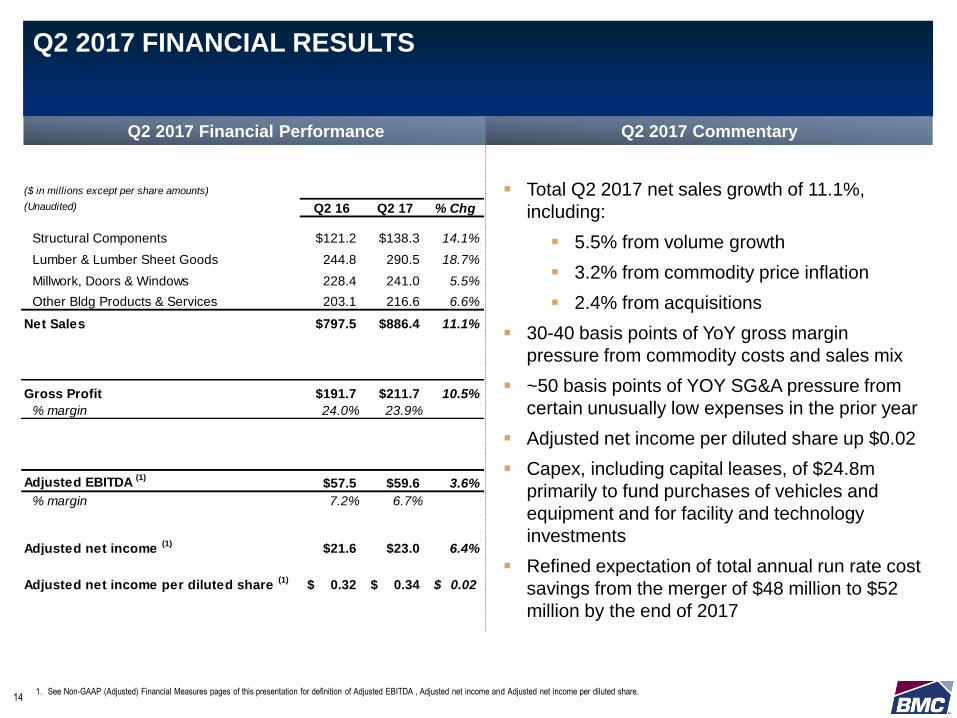
Q2 2017 Financial Performance Q2 2017 Commentary
1. See Non-GAAP (Adjusted) Financial Measures pages of this presentation for definition of Adjusted EBITDA , Adjusted net income and Adjusted net income per diluted share.
Total Q2 2017 net sales growth of 11.1%,
including:
5.5% from volume growth
3.2% from commodity price inflation
2.4% from acquisitions
30-40 basis points of YoY gross margin
pressure from commodity costs and sales mix
~50 basis points of YOY SG&A pressure from
certain unusually low expenses in the prior year
Adjusted net income per diluted share up $0.02
Capex, including capital leases, of $24.8m
primarily to fund purchases of vehicles and
equipment and for facility and technology
investments
Refined expectation of total annual run rate cost
savings from the merger of $48 million to $52
million by the end of 2017
($ in millions except per share amounts)
(Unaudited) Q2 16 Q2 17 % Chg
Structural Components $121.2 $138.3 14.1%
Lumber & Lumber Sheet Goods 244.8 290.5 18.7%
Millwork, Doors & Windows 228.4 241.0 5.5%
Other Bldg Products & Services 203.1 216.6 6.6%
Net Sales $797.5 $886.4 11.1%
Gross Profit $191.7 $211.7 10.5%
% margin 24.0% 23.9%
Adjusted EBITDA (1)
$57.5 $59.6 3.6%
% margin 7.2% 6.7%
Adjusted net income (1)
$21.6 $23.0 6.4%
Adjusted net income per diluted share (1)
0.32$ 0.34$ 0.02$
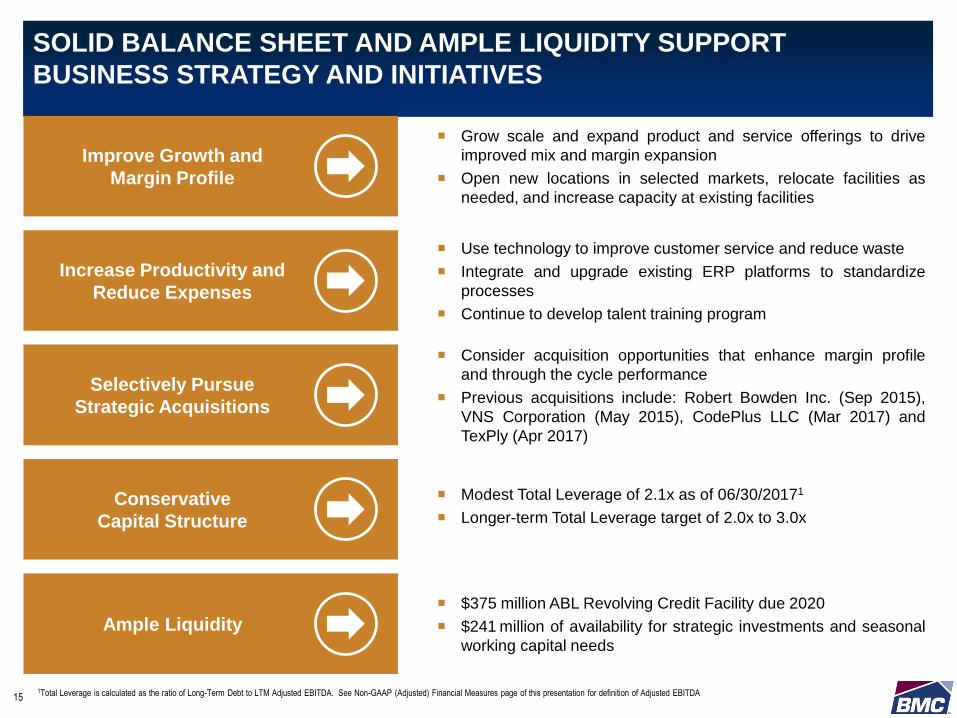
CLICK TO EDIT TITLESOLID BALANCE SHEET AND AMPLE LIQUIDITY SUPPORT
BUSINESS STRATEGY AND INITIATIVES
15
Selectively Pursue
Strategic Acquisitions
Ample Liquidity
Improve Growth and
Margin Profile
Increase Productivity and
Reduce Expenses
Conservative
Capital Structure
Grow scale and expand product and service offerings to drive
improved mix and margin expansion
Open new locations in selected markets, relocate facilities as
needed, and increase capacity at existing facilities
Use technology to improve customer service and reduce waste
Integrate and upgrade existing ERP platforms to standardize
processes
Continue to develop talent training program
Modest Total Leverage of 2.1x as of 06/30/20171
Longer-term Total Leverage target of 2.0x to 3.0x
Consider acquisition opportunities that enhance margin profile
and through the cycle performance
Previous acquisitions include: Robert Bowden Inc. (Sep 2015),
VNS Corporation (May 2015), CodePlus LLC (Mar 2017) and
TexPly (Apr 2017)
$375 million ABL Revolving Credit Facility due 2020
$241 million of availability for strategic investments and seasonal
working capital needs
1Total Leverage is calculated as the ratio of Long-Term Debt to LTM Adjusted EBITDA. See Non-GAAP (Adjusted) Financial Measures page of this presentation for definition of Adjusted EBITDA

CLICK TO EDIT TITLEDRIVING LONG-TERM SHAREHOLDER VALUE --LEVERAGING STRONG FOUNDATION AND CORE CAPABILITIES TO ACCELERATE
GROWTH IN EBITDA MARGIN
16
Favorable
Macro Trends
Differentiated Value-
Added Solutions
Growth Strategies
Drive Profitable
Growth
Job & Wage Growth
Consumer Confidence
Low Interest Rates
Low Levels of Inventory
Favorable demographics
Wide Breadth of Value-
Added Offerings:
Structural Components,
including EWP, trusses,
wall panels, etc.
Millwork, Doors &
Windows
Ready-Frame®
E-Business Suite
Expand Value-Added
Categories
Strategic Tuck-In
Acquisitions
Gain Market Share in
Professional Remodeling
Solid Balance Sheet Provides Foundation for Growth
(1) Source: United States Census Bureau.
(1)

© 2017 BMC. All Rights Reserved.
APPENDIX
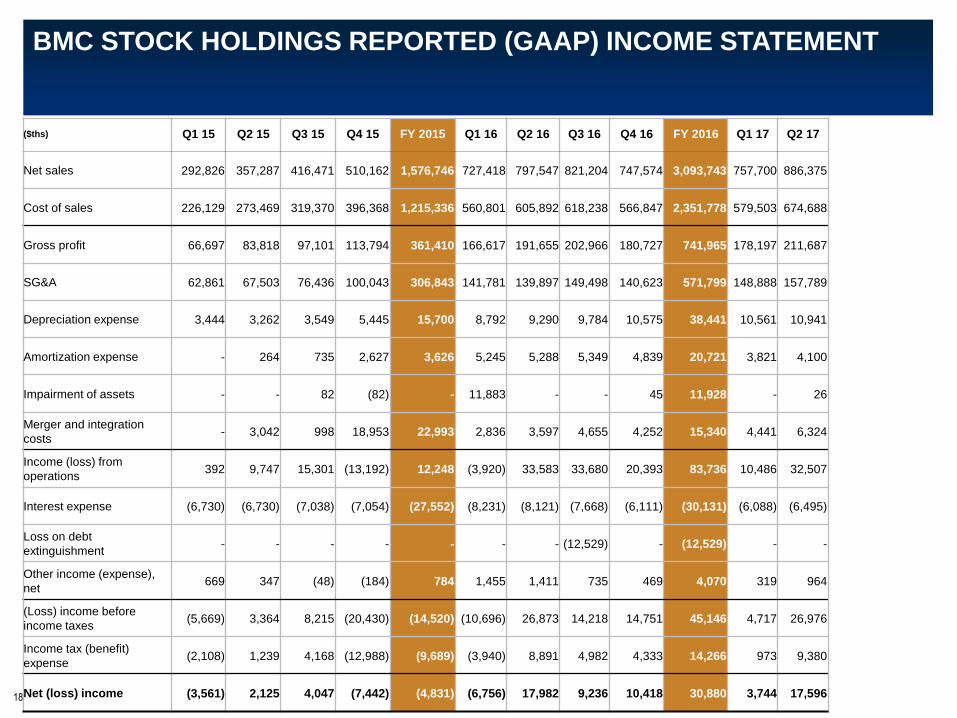
BMC STOCK HOLDINGS REPORTED (GAAP) INCOME STATEMENT
($ths) Q1 15 Q2 15 Q3 15 Q4 15 FY 2015 Q1 16 Q2 16 Q3 16 Q4 16 FY 2016 Q1 17 Q2 17
Net sales 292,826 357,287 416,471 510,162 1,576,746 727,418 797,547 821,204 747,574 3,093,743 757,700 886,375
Cost of sales 226,129 273,469 319,370 396,368 1,215,336 560,801 605,892 618,238 566,847 2,351,778 579,503 674,688
Gross profit 66,697 83,818 97,101 113,794 361,410 166,617 191,655 202,966 180,727 741,965 178,197 211,687
SG&A 62,861 67,503 76,436 100,043 306,843 141,781 139,897 149,498 140,623 571,799 148,888 157,789
Depreciation expense 3,444 3,262 3,549 5,445 15,700 8,792 9,290 9,784 10,575 38,441 10,561 10,941
Amortization expense - 264 735 2,627 3,626 5,245 5,288 5,349 4,839 20,721 3,821 4,100
Impairment of assets - - 82 (82) - 11,883 - - 45 11,928 - 26
Merger and integration
costs- 3,042 998 18,953 22,993 2,836 3,597 4,655 4,252 15,340 4,441 6,324
Income (loss) from
operations392 9,747 15,301 (13,192) 12,248 (3,920) 33,583 33,680 20,393 83,736 10,486 32,507
Interest expense (6,730) (6,730) (7,038) (7,054) (27,552) (8,231) (8,121) (7,668) (6,111) (30,131) (6,088) (6,495)
Loss on debt
extinguishment- - - - - - - (12,529) - (12,529) - -
Other income (expense),
net669 347 (48) (184) 784 1,455 1,411 735 469 4,070 319 964
(Loss) income before
income taxes(5,669) 3,364 8,215 (20,430) (14,520) (10,696) 26,873 14,218 14,751 45,146 4,717 26,976
Income tax (benefit)
expense(2,108) 1,239 4,168 (12,988) (9,689) (3,940) 8,891 4,982 4,333 14,266 973 9,380
Net (loss) income (3,561) 2,125 4,047 (7,442) (4,831) (6,756) 17,982 9,236 10,418 30,880 3,744 17,59618
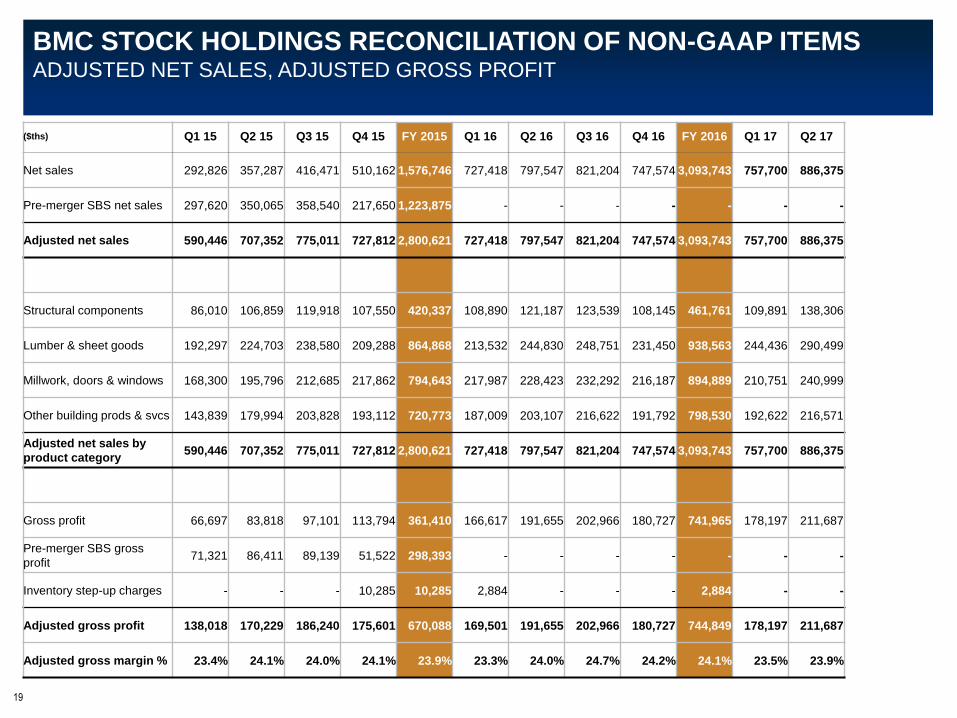
BMC STOCK HOLDINGS RECONCILIATION OF NON-GAAP ITEMSADJUSTED NET SALES, ADJUSTED GROSS PROFIT
($ths) Q1 15 Q2 15 Q3 15 Q4 15 FY 2015 Q1 16 Q2 16 Q3 16 Q4 16 FY 2016 Q1 17 Q2 17
Net sales 292,826 357,287 416,471 510,162 1,576,746 727,418 797,547 821,204 747,574 3,093,743 757,700 886,375
Pre-merger SBS net sales 297,620 350,065 358,540 217,650 1,223,875 - - - - - - -
Adjusted net sales 590,446 707,352 775,011 727,812 2,800,621 727,418 797,547 821,204 747,574 3,093,743 757,700 886,375
Structural components 86,010 106,859 119,918 107,550 420,337 108,890 121,187 123,539 108,145 461,761 109,891 138,306
Lumber & sheet goods 192,297 224,703 238,580 209,288 864,868 213,532 244,830 248,751 231,450 938,563 244,436 290,499
Millwork, doors & windows 168,300 195,796 212,685 217,862 794,643 217,987 228,423 232,292 216,187 894,889 210,751 240,999
Other building prods & svcs 143,839 179,994 203,828 193,112 720,773 187,009 203,107 216,622 191,792 798,530 192,622 216,571
Adjusted net sales by
product category590,446 707,352 775,011 727,812 2,800,621 727,418 797,547 821,204 747,574 3,093,743 757,700 886,375
Gross profit 66,697 83,818 97,101 113,794 361,410 166,617 191,655 202,966 180,727 741,965 178,197 211,687
Pre-merger SBS gross
profit71,321 86,411 89,139 51,522 298,393 - - - - - - -
Inventory step-up charges - - - 10,285 10,285 2,884 - - - 2,884 - -
Adjusted gross profit 138,018 170,229 186,240 175,601 670,088 169,501 191,655 202,966 180,727 744,849 178,197 211,687
Adjusted gross margin % 23.4% 24.1% 24.0% 24.1% 23.9% 23.3% 24.0% 24.7% 24.2% 24.1% 23.5% 23.9%
19
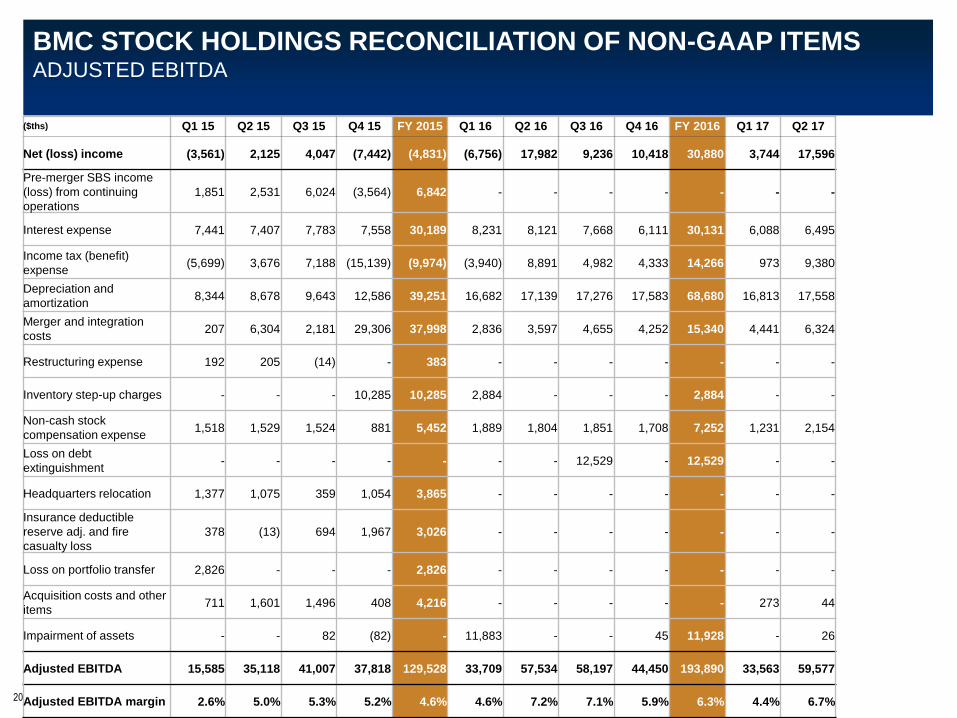
BMC STOCK HOLDINGS RECONCILIATION OF NON-GAAP ITEMSADJUSTED EBITDA
($ths) Q1 15 Q2 15 Q3 15 Q4 15 FY 2015 Q1 16 Q2 16 Q3 16 Q4 16 FY 2016 Q1 17 Q2 17
Net (loss) income (3,561) 2,125 4,047 (7,442) (4,831) (6,756) 17,982 9,236 10,418 30,880 3,744 17,596
Pre-merger SBS income
(loss) from continuing
operations
1,851 2,531 6,024 (3,564) 6,842 - - - - - - -
Interest expense 7,441 7,407 7,783 7,558 30,189 8,231 8,121 7,668 6,111 30,131 6,088 6,495
Income tax (benefit)
expense(5,699) 3,676 7,188 (15,139) (9,974) (3,940) 8,891 4,982 4,333 14,266 973 9,380
Depreciation and
amortization8,344 8,678 9,643 12,586 39,251 16,682 17,139 17,276 17,583 68,680 16,813 17,558
Merger and integration
costs207 6,304 2,181 29,306 37,998 2,836 3,597 4,655 4,252 15,340 4,441 6,324
Restructuring expense 192 205 (14) - 383 - - - - - - -
Inventory step-up charges - - - 10,285 10,285 2,884 - - - 2,884 - -
Non-cash stock
compensation expense1,518 1,529 1,524 881 5,452 1,889 1,804 1,851 1,708 7,252 1,231 2,154
Loss on debt
extinguishment- - - - - - - 12,529 - 12,529 - -
Headquarters relocation 1,377 1,075 359 1,054 3,865 - - - - - - -
Insurance deductible
reserve adj. and fire
casualty loss
378 (13) 694 1,967 3,026 - - - - - - -
Loss on portfolio transfer 2,826 - - - 2,826 - - - - - - -
Acquisition costs and other
items711 1,601 1,496 408 4,216 - - - - - 273 44
Impairment of assets - - 82 (82) - 11,883 - - 45 11,928 - 26
Adjusted EBITDA 15,585 35,118 41,007 37,818 129,528 33,709 57,534 58,197 44,450 193,890 33,563 59,577
Adjusted EBITDA margin 2.6% 5.0% 5.3% 5.2% 4.6% 4.6% 7.2% 7.1% 5.9% 6.3% 4.4% 6.7%20
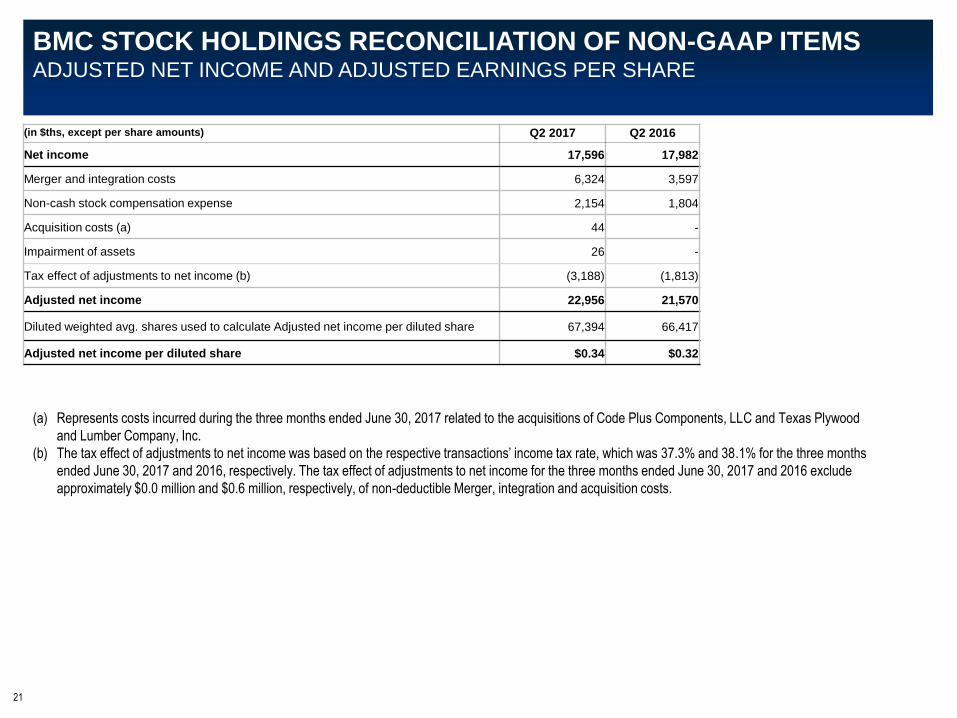
BMC STOCK HOLDINGS RECONCILIATION OF NON-GAAP ITEMS ADJUSTED NET INCOME AND ADJUSTED EARNINGS PER SHARE
(in $ths, except per share amounts) Q2 2017 Q2 2016
Net income 17,596 17,982
Merger and integration costs 6,324 3,597
Non-cash stock compensation expense 2,154 1,804
Acquisition costs (a) 44 -
Impairment of assets 26 -
Tax effect of adjustments to net income (b) (3,188) (1,813)
Adjusted net income 22,956 21,570
Diluted weighted avg. shares used to calculate Adjusted net income per diluted share 67,394 66,417
Adjusted net income per diluted share $0.34 $0.32
21
(a) Represents costs incurred during the three months ended June 30, 2017 related to the acquisitions of Code Plus Components, LLC and Texas Plywood
and Lumber Company, Inc.
(b) The tax effect of adjustments to net income was based on the respective transactions’ income tax rate, which was 37.3% and 38.1% for the three months
ended June 30, 2017 and 2016, respectively. The tax effect of adjustments to net income for the three months ended June 30, 2017 and 2016 exclude
approximately $0.0 million and $0.6 million, respectively, of non-deductible Merger, integration and acquisition costs.


