21
BMO Capital Markets Non-Deal Roadshow January 28 - 29, 2013
BMO Capital Markets
Non-Deal Roadshow
January 28 - 29, 2013
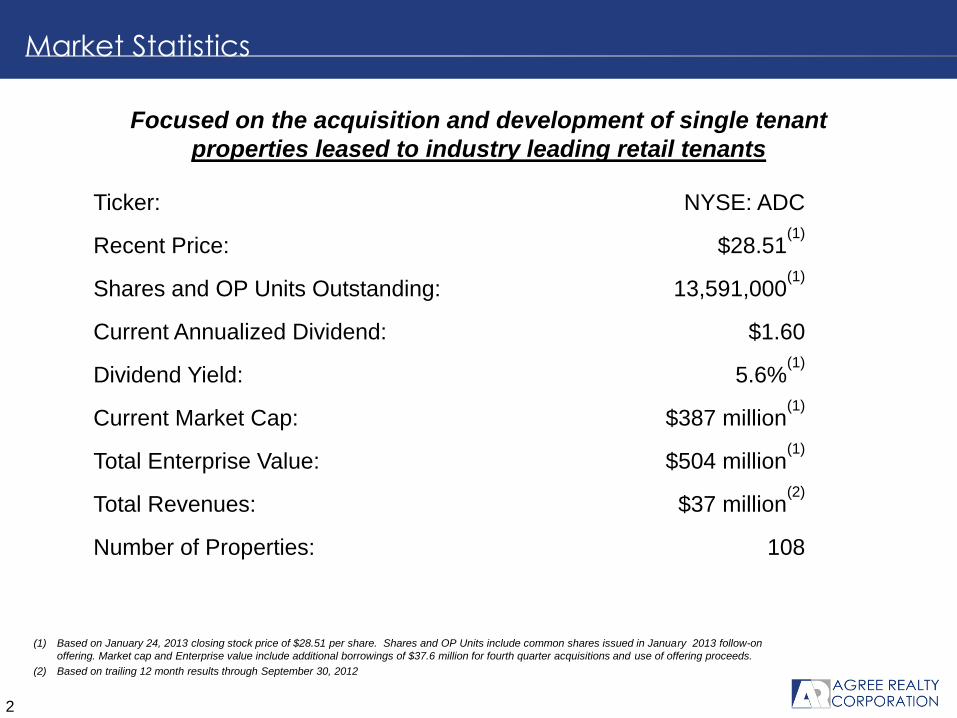
Ticker: NYSE: ADC
Recent Price: $28.51(1)
Shares and OP Units Outstanding: 13,591,000(1)
Current Annualized Dividend: $1.60
Dividend Yield: 5.6%(1)
Current Market Cap: $387 million(1)
Total Enterprise Value: $504 million(1)
Total Revenues: $37 million(2)
Number of Properties: 108
Market Statistics
2
(1) Based on January 24, 2013 closing stock price of $28.51 per share. Shares and OP Units include common shares issued in January 2013 follow-on
offering. Market cap and Enterprise value include additional borrowings of $37.6 million for fourth quarter acquisitions and use of offering proceeds.
(2) Based on trailing 12 month results through September 30, 2012
Focused on the acquisition and development of single tenant
properties leased to industry leading retail tenants
3
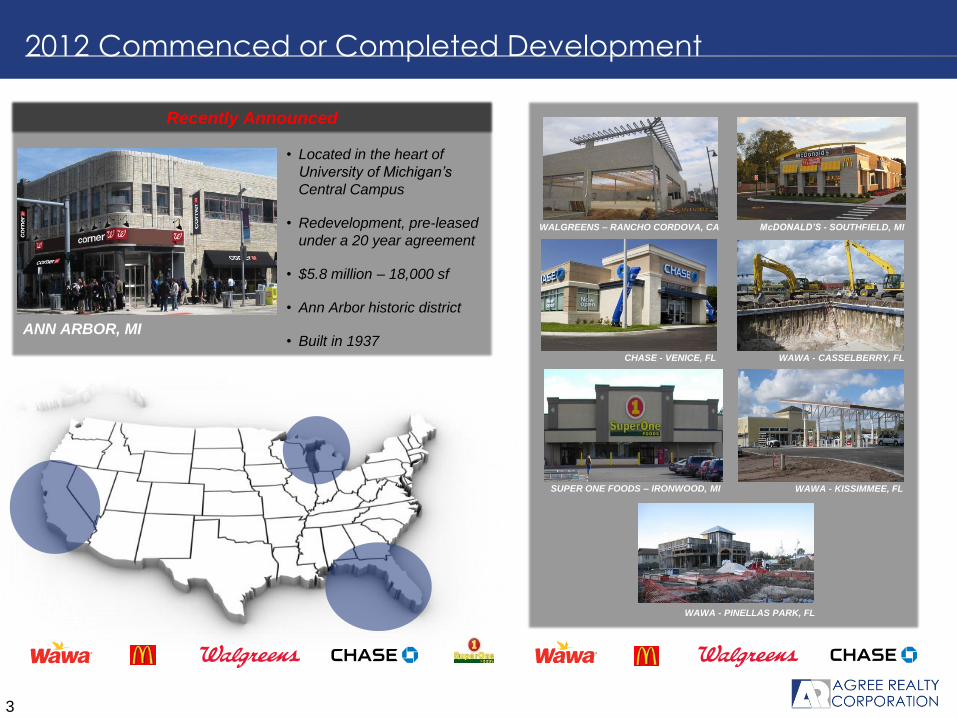
2012 Commenced or Completed Development
• Located in the heart of
University of Michigan’s
Central Campus
• Redevelopment, pre-leased
under a 20 year agreement
• $5.8 million – 18,000 sf
• Ann Arbor historic district
• Built in 1937
McDONALD’S - SOUTHFIELD, MI
CHASE - VENICE, FL
Recently Announced
ANN ARBOR, MI
WAWA - KISSIMMEE, FL
WAWA - CASSELBERRY, FL
WAWA - PINELLAS PARK, FL
SUPER ONE FOODS – IRONWOOD, MI
WALGREENS – RANCHO CORDOVA, CA
4
Investment Highlights
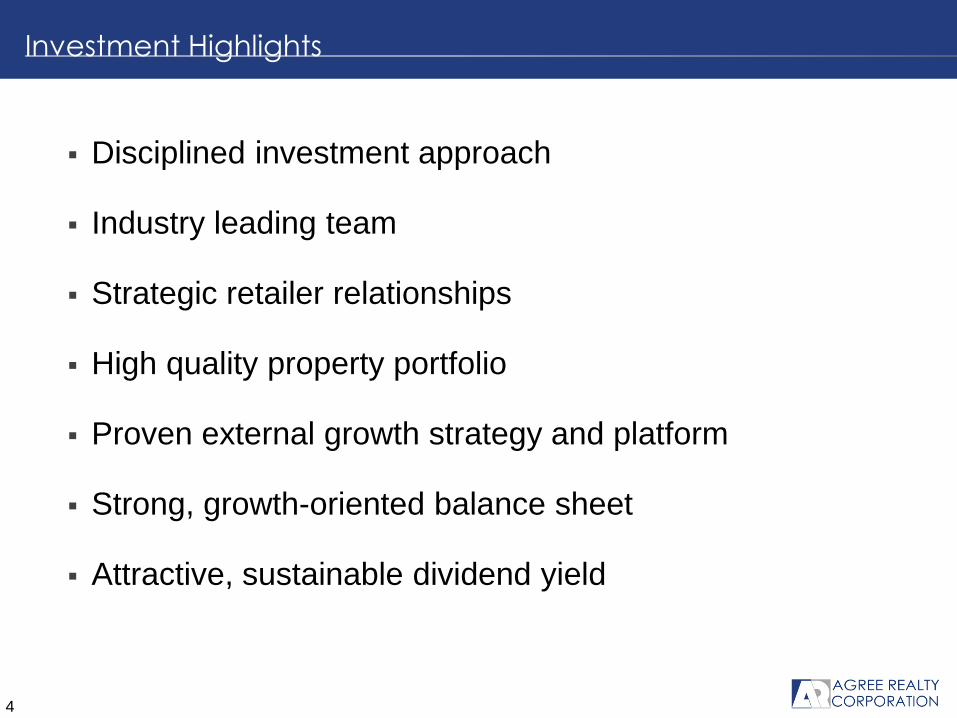
Disciplined investment approach
Industry leading team
Strategic retailer relationships
High quality property portfolio
Proven external growth strategy and platform
Strong, growth-oriented balance sheet
Attractive, sustainable dividend yield
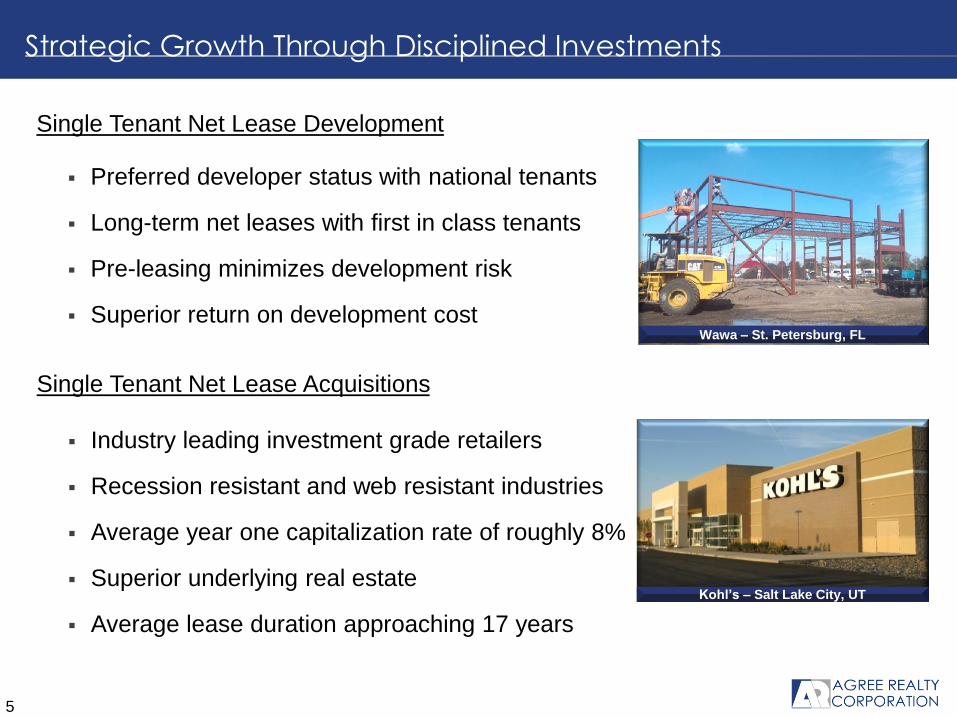
Single Tenant Net Lease Development
Preferred developer status with national tenants
Long-term net leases with first in class tenants
Pre-leasing minimizes development risk
Superior return on development cost
5
Strategic Growth Through Disciplined Investments
Wawa – St. Petersburg, FL
Kohl’s – Salt Lake City, UT
Single Tenant Net Lease Acquisitions
Industry leading investment grade retailers
Recession resistant and web resistant industries
Average year one capitalization rate of roughly 8%
Superior underlying real estate
Average lease duration approaching 17 years
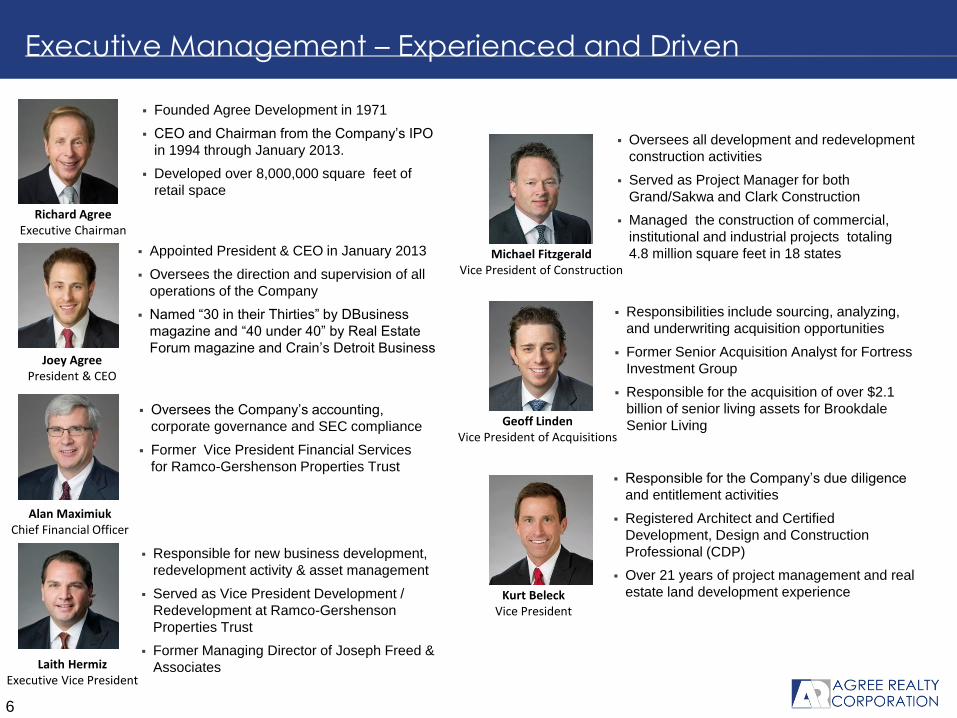
Richard Agree Executive Chairman
Joey Agree President & CEO
Founded Agree Development in 1971
CEO and Chairman from the Company’s IPO
in 1994 through January 2013.
Developed over 8,000,000 square feet of
retail space
Appointed President & CEO in January 2013
Oversees the direction and supervision of all
operations of the Company
Named “30 in their Thirties” by DBusiness
magazine and “40 under 40” by Real Estate
Forum magazine and Crain’s Detroit Business
Alan Maximiuk Chief Financial Officer
Laith Hermiz Executive Vice President
Oversees the Company’s accounting,
corporate governance and SEC compliance
Former Vice President Financial Services
for Ramco-Gershenson Properties Trust
Responsible for new business development,
redevelopment activity & asset management
Served as Vice President Development /
Redevelopment at Ramco-Gershenson
Properties Trust
Former Managing Director of Joseph Freed &
Associates
Executive Management – Experienced and Driven
Geoff Linden Vice President of Acquisitions
Responsibilities include sourcing, analyzing,
and underwriting acquisition opportunities
Former Senior Acquisition Analyst for Fortress
Investment Group
Responsible for the acquisition of over $2.1
billion of senior living assets for Brookdale
Senior Living
Kurt Beleck Vice President
Responsible for the Company’s due diligence
and entitlement activities
Registered Architect and Certified
Development, Design and Construction
Professional (CDP)
Over 21 years of project management and real
estate land development experience
Michael Fitzgerald Vice President of Construction
Oversees all development and redevelopment
construction activities
Served as Project Manager for both
Grand/Sakwa and Clark Construction
Managed the construction of commercial,
institutional and industrial projects totaling
4.8 million square feet in 18 states
6
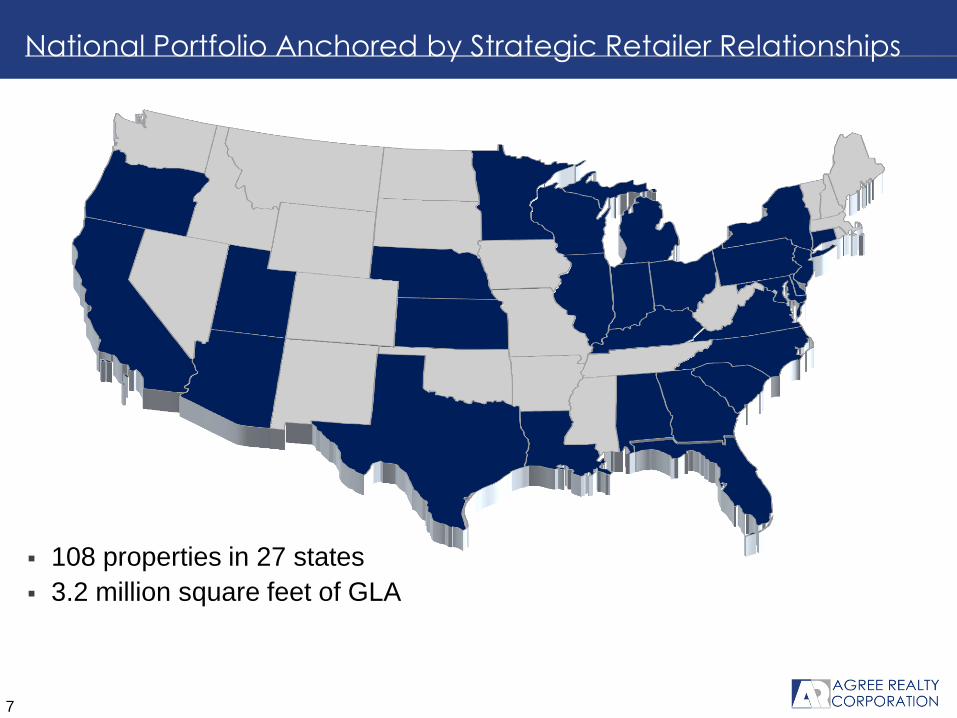
108 properties in 27 states
3.2 million square feet of GLA
7
National Portfolio Anchored by Strategic Retailer Relationships
(% of annualized base rents)
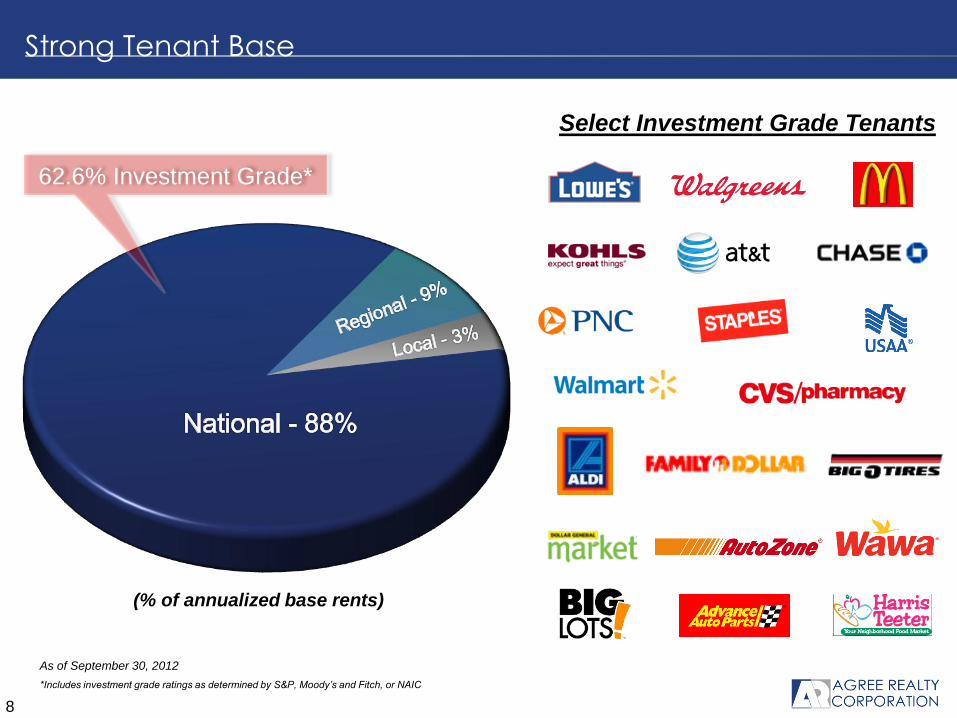
As of September 30, 2012
*Includes investment grade ratings as determined by S&P, Moody’s and Fitch, or NAIC
8
Strong Tenant Base
62.6% Investment Grade*
Select Investment Grade Tenants
9
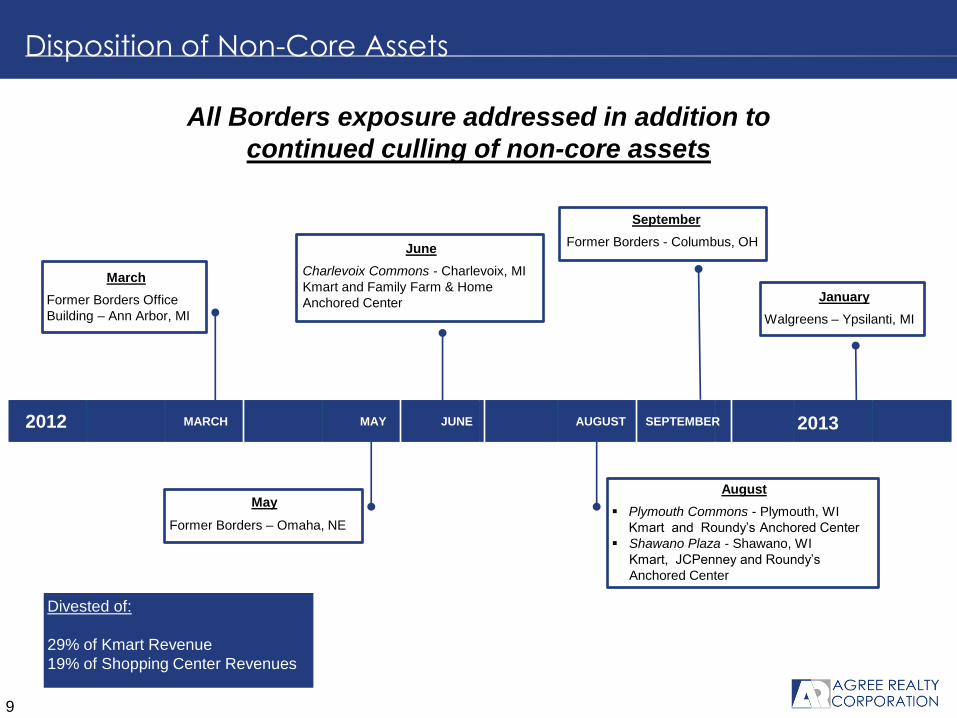
Disposition of Non-Core Assets
MARCH SEPTEMBER MAY JUNE AUGUST
All Borders exposure addressed in addition to
continued culling of non-core assets
March
Former Borders Office
Building – Ann Arbor, MI
June
Charlevoix Commons - Charlevoix, MI
Kmart and Family Farm & Home
Anchored Center
September
Former Borders - Columbus, OH
May
Former Borders – Omaha, NE
August
Plymouth Commons - Plymouth, WI
Kmart and Roundy’s Anchored Center
Shawano Plaza - Shawano, WI
Kmart, JCPenney and Roundy’s
Anchored Center
Divested of:
29% of Kmart Revenue
19% of Shopping Center Revenues
2012 2013
January
Walgreens – Ypsilanti, MI
10
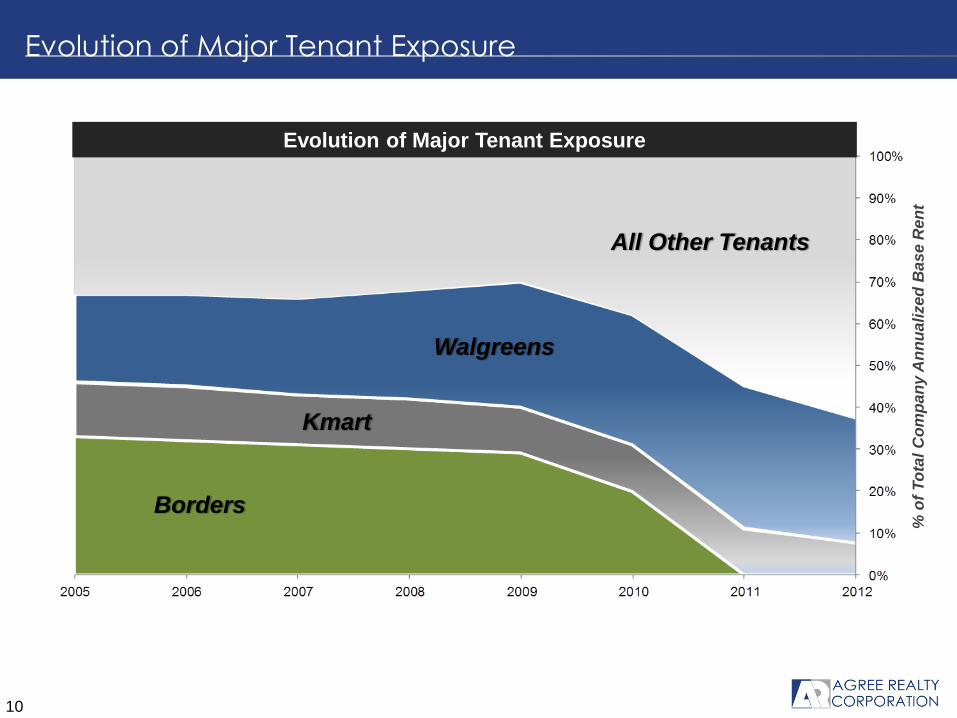
Evolution of Major Tenant Exposure
% o
f T
ota
l C
om
pa
ny
An
nu
ali
ze
d B
as
e R
en
t
All Other Tenants
Walgreens
Borders
Kmart
Evolution of Major Tenant Exposure
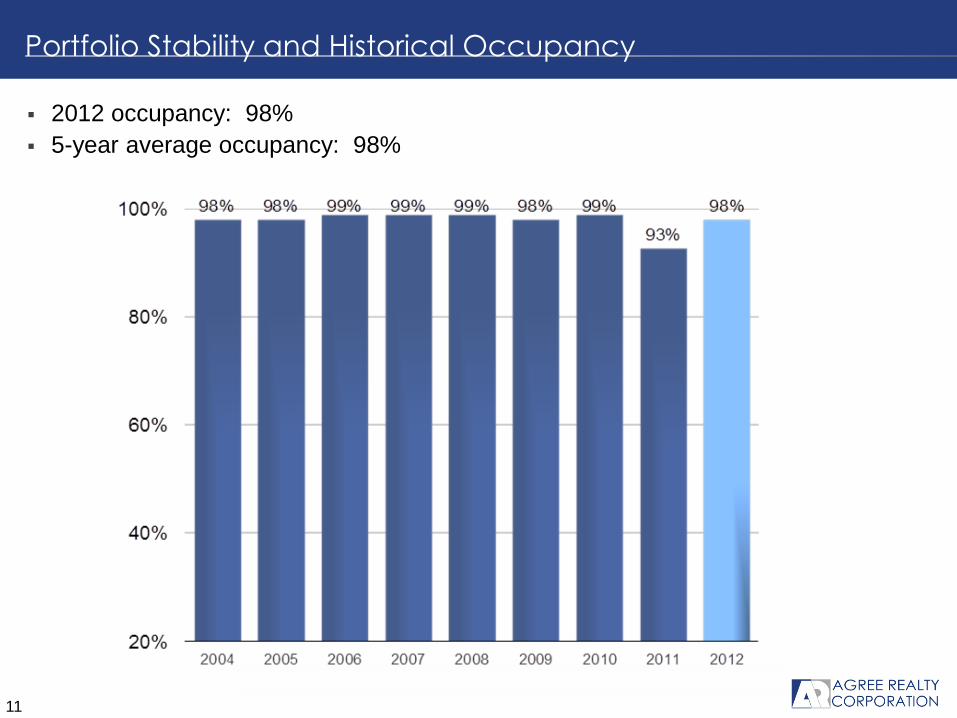
2012 occupancy: 98%
5-year average occupancy: 98%
11
Portfolio Stability and Historical Occupancy

Lease Expirations
As of September 30, 2012
12
Well Staggered Expirations Mitigate Rollover Risk
$0.0$1.0 $1.5
$2.5$1.0
$29.3
$0.0
$5.0
$10.0
$15.0
$20.0
$25.0
$30.0
$35.0
2012 2013 2014 2015 2016 Thereafter
(Annualized base rent in millions)
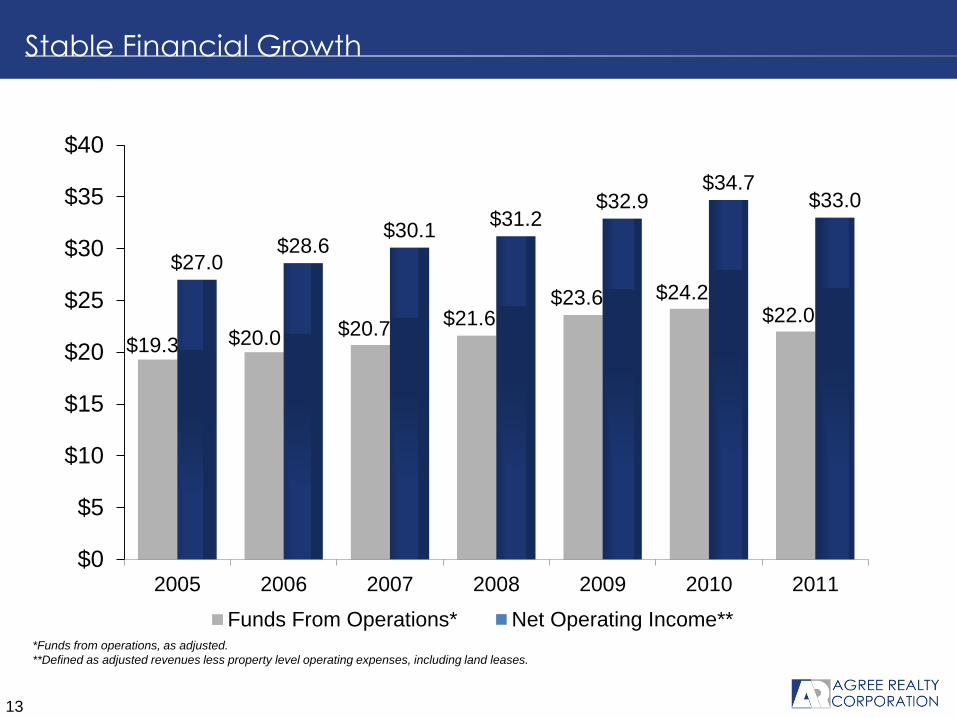
*Funds from operations, as adjusted.
**Defined as adjusted revenues less property level operating expenses, including land leases.
13
Stable Financial Growth
$19.3 $20.0 $20.7 $21.6
$23.6 $24.2 $22.0
$27.0 $28.6
$30.1 $31.2
$32.9 $34.7
$33.0
$0
$5
$10
$15
$20
$25
$30
$35
$40
2005 2006 2007 2008 2009 2010 2011
Funds From Operations* Net Operating Income**
14
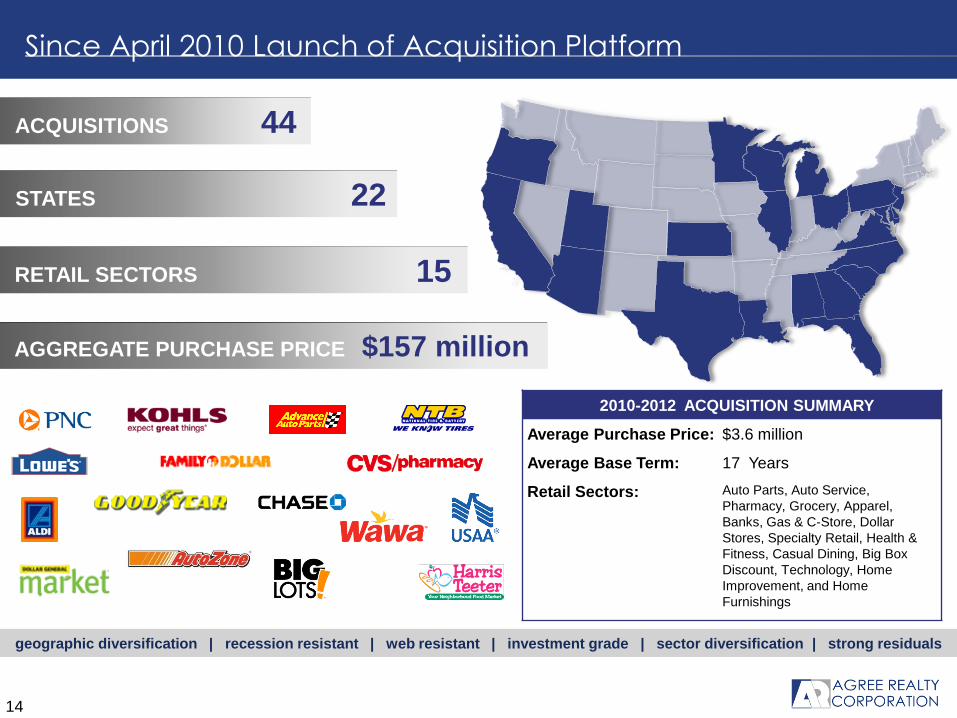
STATES 22
ACQUISITIONS 44
RETAIL SECTORS 15
2010-2012 ACQUISITION SUMMARY
Average Purchase Price: $3.6 million
Average Base Term: 17 Years
Retail Sectors: Auto Parts, Auto Service,
Pharmacy, Grocery, Apparel,
Banks, Gas & C-Store, Dollar
Stores, Specialty Retail, Health &
Fitness, Casual Dining, Big Box
Discount, Technology, Home
Improvement, and Home
Furnishings
AGGREGATE PURCHASE PRICE $157 million
Since April 2010 Launch of Acquisition Platform
geographic diversification | recession resistant | web resistant | investment grade | sector diversification | strong residuals
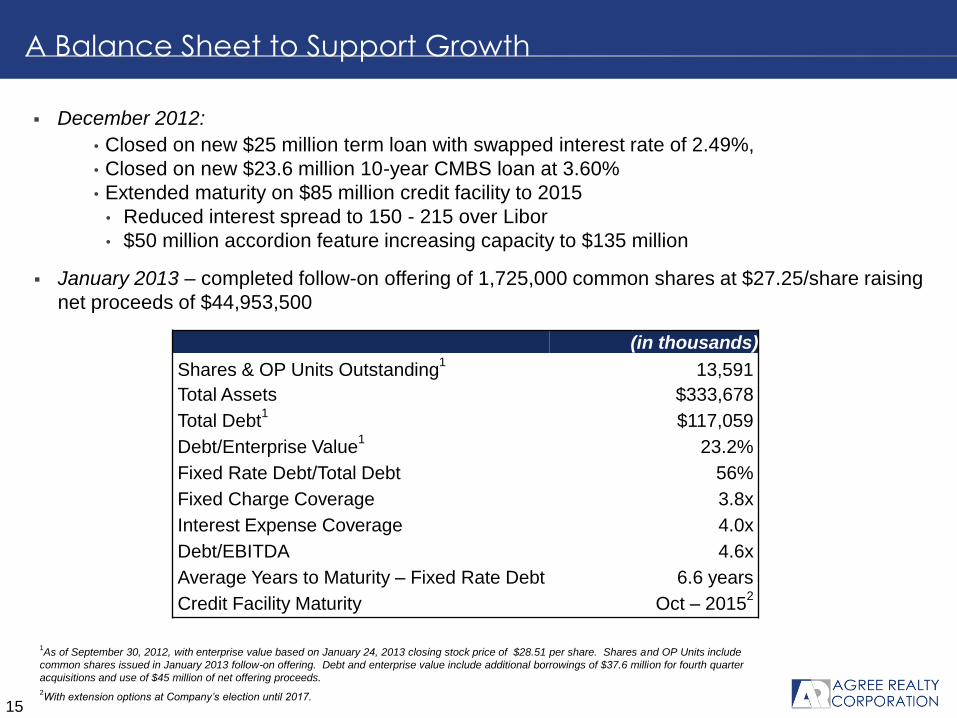
(in thousands)
Shares & OP Units Outstanding1 13,591
Total Assets $333,678
Total Debt1 $117,059
Debt/Enterprise Value1 23.2%
Fixed Rate Debt/Total Debt 56%
Fixed Charge Coverage 3.8x
Interest Expense Coverage 4.0x
Debt/EBITDA 4.6x
Average Years to Maturity – Fixed Rate Debt 6.6 years
Credit Facility Maturity Oct – 20152
1As of September 30, 2012, with enterprise value based on January 24, 2013 closing stock price of $28.51 per share. Shares and OP Units include
common shares issued in January 2013 follow-on offering. Debt and enterprise value include additional borrowings of $37.6 million for fourth quarter
acquisitions and use of $45 million of net offering proceeds.
2With extension options at Company’s election until 2017.
15
A Balance Sheet to Support Growth
December 2012:
• Closed on new $25 million term loan with swapped interest rate of 2.49%,
• Closed on new $23.6 million 10-year CMBS loan at 3.60%
• Extended maturity on $85 million credit facility to 2015
• Reduced interest spread to 150 - 215 over Libor
• $50 million accordion feature increasing capacity to $135 million
January 2013 – completed follow-on offering of 1,725,000 common shares at $27.25/share raising
net proceeds of $44,953,500
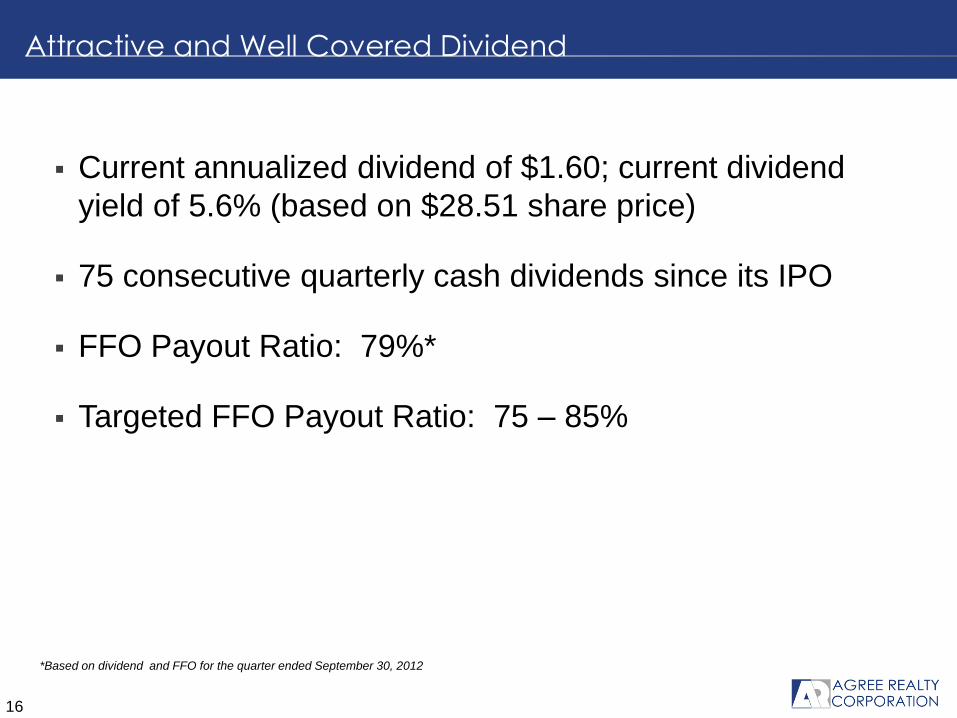
Current annualized dividend of $1.60; current dividend
yield of 5.6% (based on $28.51 share price)
75 consecutive quarterly cash dividends since its IPO
FFO Payout Ratio: 79%*
Targeted FFO Payout Ratio: 75 – 85%
16
Attractive and Well Covered Dividend
*Based on dividend and FFO for the quarter ended September 30, 2012
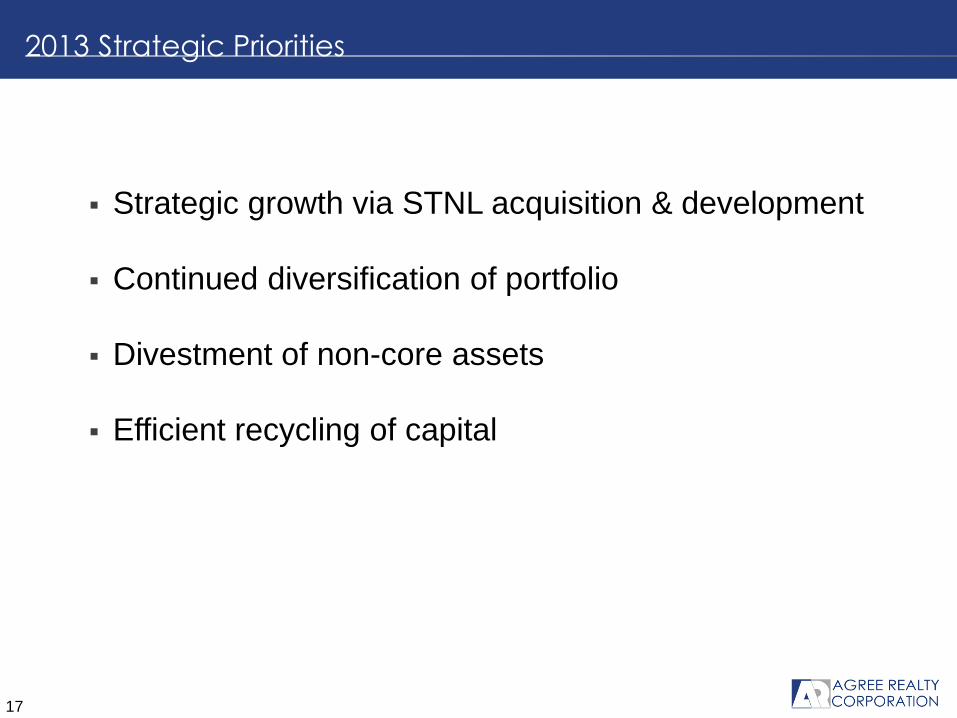
Strategic growth via STNL acquisition & development
Continued diversification of portfolio
Divestment of non-core assets
Efficient recycling of capital
17
2013 Strategic Priorities
This presentation may include certain “forward-looking statements” within the
meaning of the Private Securities Litigation Reform Act of 1995. These forward-
looking statements include, but are not limited to, our plans, objectives, expectations
and intentions and other statements contained in this document that are not historical
facts and statements identified by words such as “expects, “anticipates,” “intends,”
“plans,” “believes,” “seeks,” “estimates” or words of similar meaning. These
statements are based on our current beliefs or expectations and are inherently subject
to significant uncertainties and changes in circumstances, many of which are beyond
our control. Actual results may differ materially from these expectations due to
changes in global political, economic, business, competitive, market and regulatory
risk factors. Information concerning risk factors that could affect Agree Realty
Corporation’s actual results is contained in the Company’s reports filed from time to
time with the Securities and Exchange Commission. Agree Realty Corporation does
not undertake any obligation to update any forward-looking statements contained in
this document, as a result of new information, future events or otherwise.
18
Forward Looking Statement

Appendix: Case Studies
20
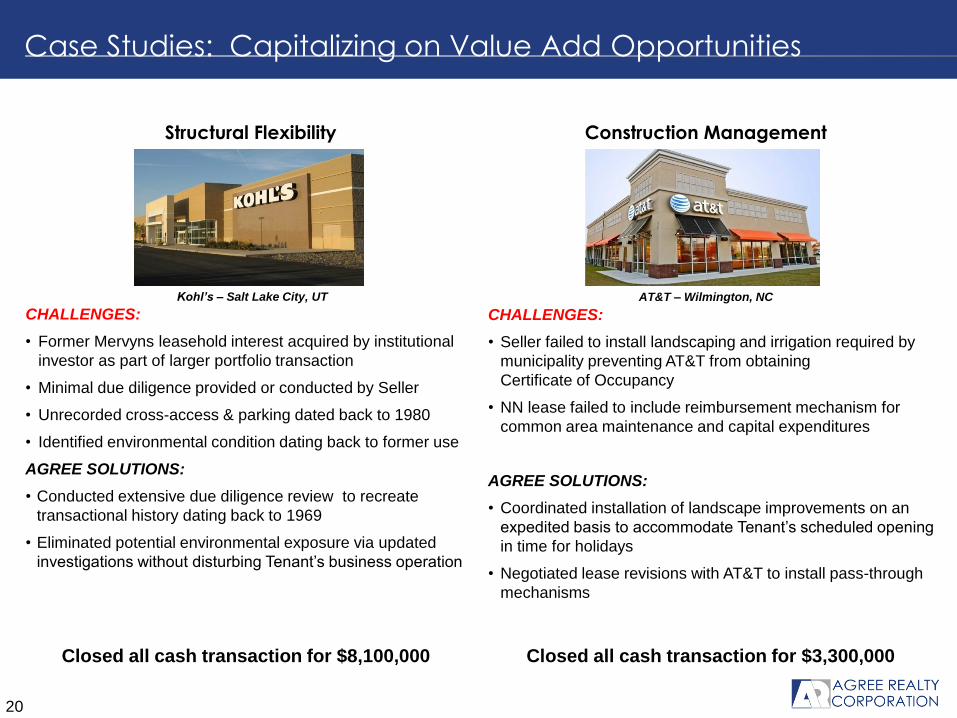
Case Studies: Capitalizing on Value Add Opportunities
CHALLENGES:
• Former Mervyns leasehold interest acquired by institutional
investor as part of larger portfolio transaction
• Minimal due diligence provided or conducted by Seller
• Unrecorded cross-access & parking dated back to 1980
• Identified environmental condition dating back to former use
AGREE SOLUTIONS:
• Conducted extensive due diligence review to recreate
transactional history dating back to 1969
• Eliminated potential environmental exposure via updated
investigations without disturbing Tenant’s business operation
Kohl’s – Salt Lake City, UT AT&T – Wilmington, NC
Construction Management Structural Flexibility
CHALLENGES:
• Seller failed to install landscaping and irrigation required by
municipality preventing AT&T from obtaining
Certificate of Occupancy
• NN lease failed to include reimbursement mechanism for
common area maintenance and capital expenditures
AGREE SOLUTIONS:
• Coordinated installation of landscape improvements on an
expedited basis to accommodate Tenant’s scheduled opening
in time for holidays
• Negotiated lease revisions with AT&T to install pass-through
mechanisms
Closed all cash transaction for $8,100,000 Closed all cash transaction for $3,300,000
21
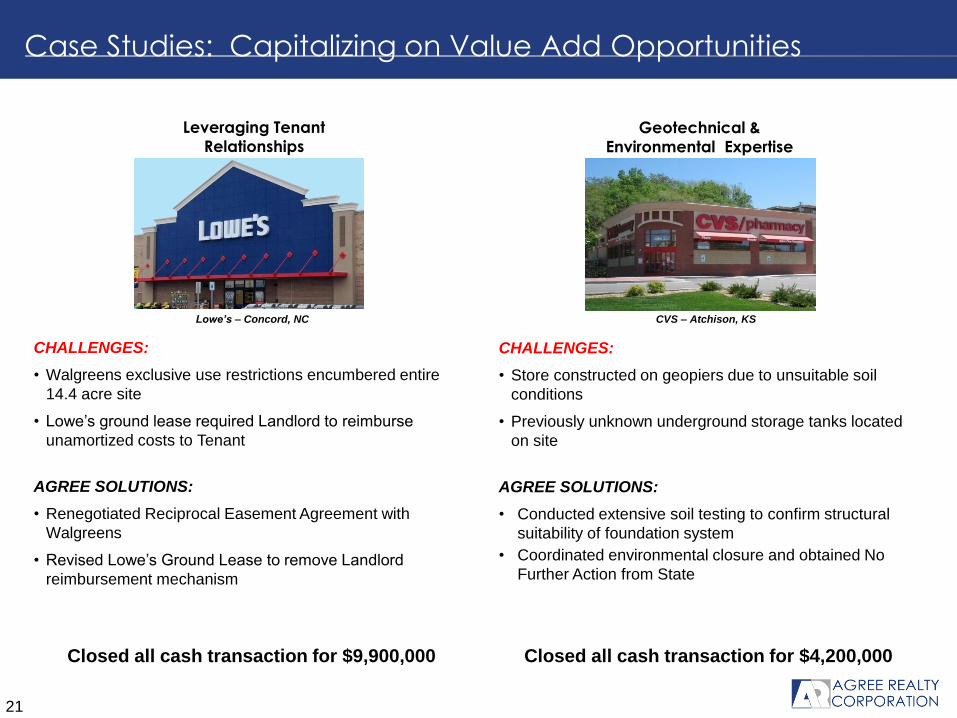
Case Studies: Capitalizing on Value Add Opportunities
CHALLENGES:
• Store constructed on geopiers due to unsuitable soil
conditions
• Previously unknown underground storage tanks located
on site
AGREE SOLUTIONS:
• Conducted extensive soil testing to confirm structural
suitability of foundation system
• Coordinated environmental closure and obtained No
Further Action from State
CHALLENGES:
• Walgreens exclusive use restrictions encumbered entire
14.4 acre site
• Lowe’s ground lease required Landlord to reimburse
unamortized costs to Tenant
AGREE SOLUTIONS:
• Renegotiated Reciprocal Easement Agreement with
Walgreens
• Revised Lowe’s Ground Lease to remove Landlord
reimbursement mechanism
Lowe’s – Concord, NC CVS – Atchison, KS
Geotechnical &
Environmental Expertise
Leveraging Tenant
Relationships
Closed all cash transaction for $9,900,000 Closed all cash transaction for $4,200,000


