229
BOARD OF DIRECTORS MEETING AGENDA JUNE 18, 2015 12:00 - 1:30 PM OTO CONFERENCE ROOM, SUITE 212 HOLLAND BUILDING, 205 PARK CENTRAL EAST
BOARD OF DIRECTORSMEETING AGENDA
JUNE 18, 201512:00 - 1:30 PM
OTO CONFERENCE ROOM, SUITE 212
HOLLAND BUILDING, 205 PARK CENTRAL EAST
OZARKS TRANSPORTATION ORGANIZATION
A METROPOLITAN PLANNING ORGANIZATION
Board of Directors Meeting Agenda
June 18, 2015 OTO Conference Room
205 Park Central Square, Suite 212 Call to Order ................................................................................................................................ NOON
I. Administration
A. Introductions
B. Approval of Board of Directors Meeting Agenda (2 minutes/Cirtin) BOARD OF DIRECTORS ACTION REQUESTED TO APPROVE THE AGENDA
C. Approval of the April 16, 2015 Meeting Minutes ......................................................... Tab 1 (2 minutes/Cirtin) BOARD OF DIRECTORS ACTION REQUESTED TO APPROVE THE APRIL 16 MEETING MINUTES.
D. Public Comment Period .............................................................................................. Tab 2 (15 minutes/Cirtin) Individuals requesting to speak are asked to state their name and organization or address before making comments. Individuals and organizations have a combined 15 minutes which will be divided among those requesting to address the Board of Directors (not to exceed five minutes per individual). Any public comment received since the last meeting has been distributed to the Board of Directors.
E. Executive Director’s Report (5 minutes/Fields) A review of staff activities since the last Board of Directors meeting will be given.
F. MoDOT Update (5 minutes/Baltz) The MoDOT Southwest District Engineer, Becky Baltz, will give an update of any pertinent information.
G. Legislative Reports (5 minutes/ Cirtin) Representatives from the OTO area congressional delegation will have an opportunity to give updates on current items of interest.
II. New Business
A. OTO Chairman Appointment ....................................................................................... Tab 3 (2 minutes/Cirtin) Pursuant to the adopted chair rotation, the City of Springfield will fill the chairman position for calendar year 2015. This seat has been left vacant by the departure of Mr. Jerry Compton. The City of Springfield is proposing Mr. Ken McClure fill the chairman position for 2015. BOARD OF DIRECTORS ACTION REQUESTED TO APPOINT MR. KEN MCCLURE AS OTO CHAIRMAN FOR CALENDAR YEAR 2015.
B. Administrative Modification 5 to the FY 2015‐2018 TIP ................................................ Tab 4 (2 minutes/Longpine) There are ten items that have been administratively approved by staff. Please see the attached materials for more information. NO ACTION REQUESTED ‐ INFORMATIONAL ONLY
C. Amendment Number Five to the FY 2015‐2018 TIP ...................................................... Tab 5 (5 minutes/Longpine) There are twenty‐eight changes requested from MoDOT which are included for member review. BOARD OF DIRECTORS ACTION REQUESTED TO APPROVE AMENDMENT NUMBER FIVE TO THE FY 2015‐2018 TIP.
D. Federal Functional Classification Map Change Request ................................................ Tab 6 (5 minutes/Longpine) There are five changes to the Federal Functional Classification Map requested and outlined in the attached materials. BOARD OF DIRECTORS ACTION REQUESTED TO APPROVE THE PROPOSED FEDERAL FUNCTIONAL CLASS CHANGE.
E. Federal Funds Balance Report ..................................................................................... Tab 7 (5 minutes/Fields) An updated federal funds balance report is included. Members are requested to review the report and advise staff of any discrepancies. NO ACTION REQUIRED – INFORMATIONAL ONLY
F. Performance Measures Report .................................................................................... Tab 8 (10 minutes/Longpine) Staff will provide an overview of the most recent Performance Measures Report. NO ACTION REQUIRED – INFORMATIONAL ONLY
G. Financial Statements for 3rd Quarter 2014‐2015 Budget Year ...................................... Tab 9 (5 minutes/Krischke) OTO Board Treasurer, Jim Krischke, will present the third quarter financial report. BOARD OF DIRECTORS ACTION REQUESTED TO ACCEPT THE THIRD QUARTER FINANCIAL REPORT.
III. Other Business A. Board of Directors Member Announcements
(5 minutes/Board of Directors Members) Members are encouraged to announce transportation events being scheduled that may be of interest to OTO Board of Directors members.
B. Transportation Issues For Board of Directors Member Review
(5 minutes/Board of Directors Members) Members are encouraged to raise transportation issues or concerns that they have for future agenda items or later in‐depth discussion by the OTO Board of Directors.
C. Articles for Board of Directors Member Information .................................................. Tab 10 (Articles attached)
IV. Adjourn open meeting and call to order closed meeting. A motion is requested to adjourn the open meeting and call the closed meeting to order. Anyone not considered a voting member or appointed alternate is requested to leave.
V. Closed Meeting (20 minutes/Board of Directors Members) Pursuant to RSMo 610.021(13), closed meetings are permitted for individually identifiable personnel records, performance ratings or records pertaining to employees or applicants for employment. Information pertaining to the closed meeting has been sent under separate cover.
VI. Adjourn meeting. A motion is requested to adjourn the meeting.
Targeted for 1:30 P.M. The next Board of Directors regular meeting is scheduled for Thursday, August 20, 2015 at 12:00 P.M. in OTO Offices at 205 Park Central East, Suite 212.
Attachments Pc: Ken McClure, Missouri State University
Matt Morrow, President, Springfield Area Chamber of Commerce Stacy Burks, Senator Blunt’s Office Dan Wadlington, Senator Blunt’s Office David Stokely, Senator McCaskill’s Office
Matt Hough, Congressman Long’s Office
Area News Media
Si usted necesita la ayuda de un traductor del idioma español, por favor comuníquese con la Debbie Parks al teléfono (417) 865‐3042, cuando menos 48 horas antes de la junta. Persons who require special accommodations under the Americans with Disabilities Act or persons who require interpreter services (free of charge) should contact Debbie Parks at (417) 865‐3042 at least 24 hours ahead of the meeting. If you need relay services please call the following numbers: 711 ‐ Nationwide relay service; 1‐800‐735‐2966 ‐ Missouri TTY service; 1‐800‐735‐0135 ‐ Missouri voice carry‐over service. OTO fully complies with Title VI of the Civil Rights Act of 1964 and related statutes and regulations in all programs and activities. For more information or to obtain a Title VI Complaint Form, see www.ozarkstransportation.org or call (417) 865‐3042.

TAB 1
BOARD OF DIRECTORS AGENDA 6/18/2015; ITEM I.C.
April 16, 2015 Meeting Minutes
Ozarks Transportation Organization (Springfield, MO Area MPO)
AGENDA DESCRIPTION: Attached for Board of Directors member review are the minutes from the April 16, 2015 Board of Directors meeting. Please review these minutes prior to the meeting and note any changes that need to be made. The Chair will ask during the meeting if any Board of Directors member has any amendments to the attached minutes. BOARD OF DIRECTORS ACTION REQUESTED: That a member of the Board of Directors makes the following motion:
“Move to approve the April 16, 2015 Board of Directors meeting minutes.” OR “Move to approve the April 16, 2015 Board of Directors meeting minutes with the following corrections…”
1 Draft Board of Directors Meeting Minutes – April 16, 2015
OZARKS TRANSPORTATION ORGANIZATION BOARD OF DIRECTORS MEETING MINUTES
April 16, 2015 The Board of Directors of the Ozarks Transportation Organization met at its scheduled time of 12:00 p.m. in the Ozarks Transportation Organization Large Conference Room in Springfield, Missouri. The following members were present: Ms. Becky Baltz, MoDOT Mr. Ken McClure, City of Springfield Mr. Harold Bengsch, Greene County Mr. Andy Mueller, MoDOT (a) Mr. Brian Bingle, City of Nixa (a) Mr. James O’Neal, Citizen‐at‐Large Mr. Steve Bodenhamer, City of Strafford (a) Mr. Dan Smith, City of Springfield Mr. Bob Cirtin, Greene County Mr. Steve Stewart, City Utilities Mr. Warren Griffith, City of Willard Mr. Richard Walker, Citizen‐at‐Large Mr. Jim Krischke, City of Republic (a) Mr. Ray Weter, Christian County Mr. J. Everett Mitchell, City of Willard (a) Denotes alternate given voting privileges as a substitute for voting member not present
The following members were not present: Mr. Mokhtee Ahmad, FTA Ms. Susan Krieger, City of Strafford Mr. Mark Bechtel, FTA (a) Mr. Bradley McMahon, FHWA Mr. Shawn Billings, City of Battlefield (a) Mr. Steve Meyer, City of Springfield (a) Mr. Brian Buckner, City of Republic Mr. Shane Nelson, City of Ozark Mr. Steve Childers, City of Ozark (a) Mr. Dan Salisbury, MoDOT (a) Mr. John Elkins, Citizen‐at‐Large (a) Mr. Mark Schenkelberg, FAA Mr. Craig Fishel, City of Springfield Mr. Brian Steele, City of Nixa Mr. J. Howard Fisk, Citizen‐at‐Large Mr. Bob Stephens, City of Springfield Mr. Wendell Forshee, City of Willard Mr. Brian Weiler, Airport Board (a) Others Present: Mr. Joshua Boley, Ms. Sara Fields, Ms. Natasha Longpine, Mr. Curtis Owens, and Ms. Debbie Parks, Ozarks Transportation Organization; Mr. Rick Artman, Greene County; Mr. Jacob Capeder and Mr. Frank Miller, MoDOT; Mr. Matt Hough, Congressman Long’s Office; Mr. Kirk Juranas, City of Springfield; Mr. David Rauch, Senator McCaskill’s Office; Mr. Dan Wadlington, Senator Blunt’s Office; Mr. Jerry Compton, Citizen.
Mr. Cirtin called the meeting to order at 12:00 p.m.
2 Draft Board of Directors Meeting Minutes – April 16, 2015
I. Administration
A. Introductions Mr. Cirtin announced that Mr. Jerry Compton had not won the last election. He complimented Mr. Compton for being a public servant and his service for the OTO and the City of Springfield. Ms. Fields presented an engraved clock to Mr. Compton in honor of his time serving on the OTO Board and as the OTO Chairman. Mr. Compton stated it had been an honor to serve on the OTO Board and as the OTO Chairman. He thanked the Board of Directors. Mr. Ciritn introduced Ken McClure, Jerry Compton’s replacement on the Board of Directors. Mr. McClure gave a brief introduction of himself. He thanked Mr. Compton for his service.
B. Approval of Board of Directors Meeting Agenda Mr. Bengsch made the motion to approve the April 16, 2015 Board of Directors Agenda. Mr. Fisk seconded and the motion was carried unanimously.
C. Approval of the February 19, 2015 Meeting Minutes Mr. Krischke made the motion to approve the February 19, 2015 Board of Directors Meeting Minutes. Mr. O’Neal seconded and the motion was carried unanimously.
D. Public Comment Period Ms. Fields stated that the OTO had received one public comment via the giveusyourinput.org website. The giveusyourinput.org site is set up to post all the different items that require public comment. This public comment is from David Riddle. He requested that City Utilities Transit service changes also go through the OTO’s public input process. He is specifically commenting on the Public Participation Plan amendment in the agenda. The details are not all worked out, but City Utilities is amenable and the OTO is amenable to City Utilities using the site to obtain the public comment that the public might have. It is in the research stage.
E. Executive Director’s Report Ms. Fields stated that Ms. Baltz would make a Senate Bill 540 presentation later in that agenda. The OTO sent a letter asking for support. Letters were sent to every Senator and Representative in the State of Missouri. The OTO also requested that the other jurisdictions send a letter and offered to mail the letters. The City of Republic accepted the offer and the Representatives letter were mailed yesterday. Email addresses were provided to the Board members to contact the Senators directly. Greene County and the City of Springfield sent letters directly. Mr. Weter stated that Christian County also sent a letter. Mr. O’Neal inquired if it was still okay to send out a letter. Ms. Fields stated that there was still time. Mr. O’Neal stated he would send out a letter. Ms. Fields stated that the OTO staff had been working with the Long Range Transportation Plan update. Staff had been busy with public meetings and materials.
3 Draft Board of Directors Meeting Minutes – April 16, 2015
Ms. Fields stated that she had been working on the Springfield Greene County Community Focus Report, in which she was the Chair of the Transportation Section. The draft is now complete and the full report would be coming out in the fall. The Executive Committee has met twice. The committee has been specifically looking at the OTO Budget and the Bylaw amendment that is on the agenda. There has also been meetings regarding data collection for the Congestion Management Process and the best way to coordinate the effort. A lot depends on the Travel Time Run Units, which will either be Bluetooth or wireless technology. MoDOT is the project manager on the acquisition and the RFP has been issued with a closing date of May 21. Staff members have taken a class on Effective Public Involvement from the National Highway Institute. Mr. Boley received a certificate for completing the course. This is part of the effort to keep in touch with the best way to involve the public. There have also been multi state conference calls with MoDOT and other DOTs talking about the best way to implement Performance Measures that are coming out of the USDOT in regards to the MAP 21 Transportation Bill. The OTO will be required to report in on the performance of the road and transit systems in the OTO area. Ms. Fields stated that there was also a new member orientation prior to the February Board meeting. Staff issued a call for FTA 5310 projects for Human Service vehicles. The FY 2014 funding was not all awarded and there is now FY 2015 funds available. The goal is to award the funds so the agencies can get new vans to transport passengers to the different services that are needed.
F. MoDOT Update Ms. Baltz gave an brief history on the MoDOT funding situation. MoDOT has 34,000 miles of road and 10,000 bridges to maintain. She gave a comparison of Missouri to the rest of the Midwest Region. The fuel tax rate has remained the same for 20 years. And now Missouri is faced with only a $325 million budget to maintain the 34,000 mile transportation system, which would require a minimum of $485 million a year to maintain. The Missouri road system has been divided into a primary and supplementary systems. The primary system would retain the best connectivity across the state. The supplemental roads in the OTO region like Kearney, Glenstone, and Kansas would not have funding for anything but the most basic maintenance. Senate Bill 540 was originally proposed at 2+2+2 with indexing to keep up with inflation. It was a 2 cent fuel tax increase for the next 3 years. The Bill has since been changed to be just a onetime 2 cent proposal, because of concern over the Hancock Amendment. She described how the original proposal would have restored the full maintenance budget for both the Primary and Supplemental System. It would not solve the complete transportation funding problem but it would be a big step. She described where to find further information on the MoDOT website and encouraged the members to subscribe to Commissioner Millers emails. Mr. O’Neal inquired if the revised Senate Bill with the 2 cent funding contained indexing. Ms. Baltz stated it does not have the indexing. Mr. O’Neal inquired if there was a chance
4 Draft Board of Directors Meeting Minutes – April 16, 2015
that the indexing would be reinstated or if the 2 cent proposal was the final proposal. Ms. Baltz stated that 2 cent bill was the final bill. Mr. Weter inquired how much the total revenue generated would be from the 2 cent proposal. Ms. Baltz stated it would total $78 million, with part going to the Highway Patrol, Department of Revenue, cities, and counties. MoDOT would receive approximately $55 million. Mr. Smith inquired if the 2 cents passed, would that allow the bridges that had closed to be reopened. Ms. Baltz stated a few of the bridges would reopen, she was unsure if all could be reopened. She stated that the largest concern is not being able to match federal funds. In 2017, MoDOT will no longer be able to match $70 million in federal funds. In 2018, MoDOT would lose $400 million in federal funds. The 2 cent proposal would delay the returning of federal funds 2018 and 2019 respectively. It does not solve all the problems but is a step in the right direction. Ms. Baltz stated that overall the Senators were generally supportive. Senator Burlison is a no tax individual so he would not support any tax increase.
G. Legislative Reports Mr. Rauch stated that Ms. Baltz had brought up the challenges that the State of Missouri may have in matching federal dollars. As of right now there is a question on whether there will be federal dollars. The federal funding mechanism for transportation will expire next month. The Extension is going to run to May 2015. It will expire and most likely there will be another extension. There is no consensus on how to fund this funding challenge. At the federal level there is a 17 cent federal gas tax that has been in place for 20 years with no indexing for inflation. There are few options that have been brought up for additional funding. The gas tax itself seems to be the only option. There has been a discussion of a 12 cent per gallon increase with an inflationary adjuster, but there is no consensus yet. There will probably be extensions for a longer period. Mr. Wadlington stated that there had been a proposal for repatriating some corporate profits. Senator McCaskill and Senator Blunt both support repatriating corporate profits since there is a $20 billion a year deficit in the Federal Highway Fund. If the funds are repatriated at 7 or 8 percent then it would raise the $20 billion a year deficit and then with the gas tax there could be a $450 billion six year Highway Bill. There is bipartisan support in the Senate, but not in the House. Mr. Rauch added that a couple of the challenges coming forefront with the discussion on Transportation funding is the larger infrastructure issue.
II. New Business
A. Administrative Modifications 3 and 4 to the FY 2015‐2018 TIP Ms. Longpine stated that the OTO Public Involvement Program allows the OTO to make simple modifications to the TIP that are small in scope. There are two Administrative Modifications. The City of Willard’s cost estimate was higher for the Jackson and Main sidewalks than originally estimated. The second modification was for the Chestnut Railroad overpass. BNSF helped fund some of the expense so the funding sources have been adjusted.
5 Draft Board of Directors Meeting Minutes – April 16, 2015
B. Amendment Number Four to the FY 2015‐2018 TIP
Ms. Longpine stated that there are seven items. The last item indicates that it had been through an e‐meeting of the Technical Planning Committee. The TPC recommended approval to the Board of Directors for the MoDOT maintenance project in the e‐meeting. She described the seven TIP Amendments. The City of Springfield projects called for the removal of the Jordan Creek Trail at West Meadows and replacing it with the College Street Phase II. This is a pedestrian plaza at College and Broadway. The Jordan Creek Trail was originally awarded Transportation Alternatives Funding. Due to some unresolved liability concerns on the railroad tracks, the City of Springfield requested the funding move to the next awarded project, which is the College Street Phase II. Mr. Griffith made the motion to approve amendment Number Four to the FY 2015‐2018 TIP. Mr. Weter seconded and the motion was carried unanimously.
C. Public Participation Plan Amendment Mr. Boley stated that wording was being added to the Public Participation Plan to satisfy the requirements for Public Participation for City Utilities Transit and all FTA programs. The amendment adds required language from FTA to fulfill the grant requirements on public participation for transit projects. This does not change what the OTO already does. It just reiterates it in a legal way, what the OTO has already been doing. He described the amendment changes. Mr. O’Neal made the motion to approve the Amendment to the Public Participation Plan. Mr. Krischke seconded and the motion was carried unanimously.
D. OTO Growth Trends Report Mr. Guthrie presented a PowerPoint on some of the highlights of the Growth Trends Report. The Growth Trends Report is the annual report that shows the growth between the OTO’s member jurisdictions in the five county MSA which includes Christian, Dallas, Greene, Polk, and Webster Counties. This report is compiled from the use of permit data provided to staff by the municipalities in the OTO along with some US Census data. He thanked the jurisdictions for providing data and stated that the full report was available on the OTO website.
E. Briefing on the Long Range Plan Update Ms. Fields gave an update on the Long Range Plan Update that staff had been working on. The Update is titled “Transportation Plan 2040”. She stated that Ms. Longpine would be the project manager. The OTO is required by federal law to update the plan every five years. The last plan was adopted at the end of 2011, so the update is due by the end of 2016. There are requirements on what goes into the transportation plan and that includes the facilities the OTO have, how those facilities are performing, and looking at the environment. There will need to be a forecast of funding. The plan also looks at the operational improvements that can be made to the signal system or the system as a whole. Finally where funds should be invested and if there should be transportation enhancements made.
6 Draft Board of Directors Meeting Minutes – April 16, 2015
If the OTO’s members want to spend federal dollars on a project it has to appear in the Long Range Transportation Plan before it can go into the Transportation Improvement Plan. That is laid out in federal law. The current plan, Journey 2035, shows projected revenue of $600 million and identified projects over $1.5 billion. There is a lot of population growth projected. She showed a presentation that showed the growth of Greene County roads from 1985 to the present. The OTO started the Major Thoroughfare Plan update process in November with subcommittee meetings. The subcommittee looked at the current plan as proposed and what changes needed to be made. The decision was made to meet with each individual jurisdiction to look over the specifics for their area. The subcommittee is paying special attention to the projected traffic, to make sure the roads are not being overestimated. There has also been discussions with Christian County on how to apply urban standards to a county that is developing in 3, 5, and 10 acre tracks. Ms. Fields stated that staff had been out receiving public input. There is a survey entitled “what transportation projects matter to you.” This survey is on the giveusyourinput.org site. Staff have been passing out giveaways at community events. She outlined the public events and giveaways. She stated that 350 surveys had been received so far. One of the survey questions is “what is one of the top transportation problems?” The answers were 23% traffic congestion, 19% not enough bicycle accommodations, 17% pavement conditions, 15% safety and accidents. She highlighted a few of the top priority projects, but reminded the Board that the surveys were predominately from the south at this point. She stated staff hoped to have the Major Thoroughfare Plan changes completed and up to the subcommittee and then reviewed by the Board. Then the plan is for the cities and counties to adopt the changes to get the required public input. When that is complete the changes would come back for adoption. The Long Range Transportation Plan subcommittee meetings will start next month and the projected draft is will be completed in early 2016 with the adoption in the summer of 2016. She let the member jurisdictions know that there were giveusyourinput.org promotional materials if the jurisdictions would like to help promote the public input process.
F. Bylaw Amendment Ms. Fields stated the Executive Committee had met to consider a request from the nominating committee. The request was that the OTO look at adding additional representation from Christian County. The proposal is to change the three Citizen‐at‐Large Representatives to four Representatives. This would add a bullet that preference be given to all Citizen‐at‐Large Representatives with transportation knowledge. Another bullet would be added that states that one member nominated by the Christian County Commission, appointed by the MPO, with the City of Ozark and City of Nixa being able to submit candidates to the Christian County Commission. Mr. Weter stated he had not discussed the position with Mr. Childers or Mr. Bingle, but would if the Bylaw changes were approved.
Mr. Bengsch made the motion to approve the proposed Bylaw Amendment. Mr. Bingle seconded and the motion was carried unanimously.
7 Draft Board of Directors Meeting Minutes – April 16, 2015
G. GIS Specialist Job Description
Ms. Fields stated that the OTO staff job descriptions were established when the OTO first became independent. After review, it was realized that the old planning technician description was being used. So there is a new job description proposal for the GIS Specialist position. This is in line with the City of Springfield’s GIS Specialist position. The Executive Committee reviewed this request and also looked at other openings posted around the state. It is similar to those positions. This description is more appropriate for someone with a GIS degree and doing GIS work. Mr. Krischke made the motion to approve the proposed GIS Specialist job description. Mr. Griffith seconded and the motion was carried unanimously.
H. FY 2016 Unified Planning Work Program Ms. Fields stated that the UPWP is a federal program required by law. The UPWP outlines the OTO’s work for the year and will be attached to the federal contract to receive funds. It basically outlines what the OTO will do in exchange for federal funds. She outline the various tasks in the UPWP. In addition to the normal tasks, the OTO plans to complete the Major Thoroughfare Plan Update, complete a Roadways Design Guidelines Brochure, and to continue and improve the giveusyourinput.org site. The Travel Time Collection Units will not be purchased in this fiscal year so those are being brought forward. There will be amendments to the current Transportation Improvement Program this year. There was no call for projects, since there is no funds there will be no new projects. In the case that transit funding becomes available, a call for projects will be made and an amendment to the Transportation Improvement Plan will be made. Work on the FY 2017‐2020 Transportation Improvement Plan will begin at the end of the budget year. There is also the Long Range Transportation Plan Update, work with the OTO’s committees, and the cooperative purchase of aerial photography. The OTO pays $40,000 into the cooperative purchase of aerial photography which the City of Springfield leads. The $40,000 offsets the member jurisdictions cost. There is a credit because the OTO pays the money and then receives the use of the photography that is needed for the OTO planning activity. The UPWP Budget Appendix was handed out before the meeting. It is largely the same as the OTO Operational Budget. The difference is the UPWP Budget shows some the City Utilities Planning funds and the OTO’s in‐kind activities from MoDOT and member attendance at OTO meetings. The individual line items are mostly the same figures. Mr. McClure made the motion to approve the FY 2016 Unified Planning Work Program. Mr. Smith seconded and the motion was carried unanimously.
I. FY 2016 OTO Operational Budget Ms. Fields stated that the OTO developed a separate budget for auditing purposes because of the in‐kind. The auditor, in the past, had inquired where the City Utilities funds were, but the OTO does not receive those funds. Those funds are reflected as required by federal law. There are two items not in the UPWP budget, one for bank fees and OTO promotional items that cannot be billed to the grant. There is a decrease in the salary line due to the
8 Draft Board of Directors Meeting Minutes – April 16, 2015
elimination of a position. The need for transit planning had declined. City Utilities have installed automated passenger counters that report directly to the National Transit Database, eliminated the surveying of ridership levels. Ozarkscommute.com the OTO Rideshare Program was declared ineligible for federal funding so it was transferred to the City of Springfield. MoDOT has also agreed to administer the purchase of the FTA 5310 Vehicle Program. Staff had also been working hard on getting the Civil Rights Documents up to compliance and that work had been completed. Lastly, the TIP will not be produced this year due to the MoDOT funding crisis and no new projects being added. It is not a huge deduction in the salary line overall because there are actually 27 instead of the normal 26 payrolls in this fiscal year. There is a proposed Merit Raise and COLA included for consideration. Mr. Bingle made the motion to approve the FY 2016 OTO Operational Budget. Mr. Krischke seconded and the motion was carried unanimously.
III. Other Business A. Board of Directors Member Announcements
Mr. Weter stated that the vacant Eastern Commissioner Seat in Christian County had been filled by appointment of the Governor. Ms. Sue Ann Childers was the new Commissioner.
B. Transportation Issues For Board of Directors Member Review
None.
C. Articles for Board of Directors Member Information
IV. Adjourn meeting. Mr. O’Neal made the motion to adjourn the meeting. Mr. Krischke seconded and the meeting was adjourned at 1:02 p.m.

TAB 2

TAB 3
BOARD OF DIRECTORS AGENDA 6/18/2015; II.A.
OTO Chairman Appointment
Ozarks Transportation Organization (Springfield, MO Area MPO)
AGENDA DESCRIPTION: Jerry Compton was appointed as the OTO Chairman for calendar year 2015. Mr. Compton no longer holds a seat on the Springfield City Council and has therefore left the chairmanship vacant. The City of Springfield has requested that Mr. Ken McClure be appointed as Chairman for the remainder of 2015. 2015 Current Officers
Position 2015 Officers Affiliation
Chairman ______________ Springfield City Council
Vice‐Chairman Bob Cirtin Greene County
Secretary J. Howard Fisk OTO At‐Large
Treasurer Jim Krischke City of Republic Bylaws Section 6.4: Officers A. The Board of Directors shall elect a representative from their membership to serve as Chairman at their initial meeting. The Chairman shall serve a one (1) year term to expire the first meeting of the calendar year following the first full‐year of the position. Thereafter, each one (1) year term shall commence at the first meeting of the calendar year and end at the first meeting of the following calendar year. There must be a majority of the voting members present to vote on the Chairman position. The Chairman shall follow the adopted rotation schedule between Springfield, Greene County and Christian County as approved by the Board of Directors on December 18, 2003. B. The Board of Directors shall elect a Vice Chairman. The Vice Chairman shall assume the responsibilities of the Chairman in his or her absence. C. The Board of Directors shall elect a Treasurer. The Treasurer shall be in charge of funds of the corporation and approve payments and expenses as authorized by the Board of Directors. The treasurer shall be responsible for an annual audit of the finances of the corporation as well as other financial reports as may be desirable. D. The Board of Directors shall elect a Secretary. The secretary shall be responsible for all permanent records of the corporation, its minutes, contracts and other documents and for official notifications and correspondence as may be required. D. Any appointed positions on the Board of Directors shall commence and/or conclude at the first
meeting of the calendar year after the term expiration. E. A modification of the Board of Directors members may occur mid‐year if there are elections, resignations or changes in representative board memberships. F. Authorized Signatures. All the officers may be authorized to sign or attest documents, checks, or other legal instruments of the corporation. G. Executive Committee. All five (5) officers plus two (2) appointed Board members shall act as the Executive Committee for the Board of Directors. In the event an officer is unable or unwilling to serve on the Executive Committee, the Board of Directors can appoint another member to fill the vacancy. H. Powers. The Executive Committee shall have limited powers, duties, and responsibilities of the Board to address administrative and organizational issues to carry out the functions and purposes of Ozarks Transportation Organization. All actions of the Executive Committee would be considered for ratification by the Board of Directors. The Executive Committee may act on behalf the Board on administrative and organizational items as follows:
Administrative TIP Amendments (e.g. Items currently programmed in the TIP)
Budget adjustments of $2,500 or less for items not shown in the adopted UPWP
Act as the OTO Audit Committee. The Audit Committee shall be responsible for monitoring the financial reporting process, overseeing the internal control system, overseeing the external audit and independent public accounting functions and reporting findings to the Board of Directors.
I. The Executive Committee may make recommendations to the Board on the following issues:
Human Resource Issues
Employee Handbook Amendments (e.g. Leave Policy and Benefits)
J. A quorum shall constitute four (4) members and all actions approved by the Executive Committee shall require at least four (4) affirmative votes.
BOARD OF DIRECTORS ACTION REQUESTED: That a member of the Board of Directors makes the following motion: “Move to appoint Mr. Ken McClure as the OTO Chairman for the remainder of calendar year 2015.”

TAB 4
BOARD OF DIRECTORS AGENDA 6/18/2015; ITEM II.B.
Administrative Modification Number Five to the FY 2015‐2018 Transportation Improvement Program
Ozarks Transportation Organization (Springfield, MO Area MPO)
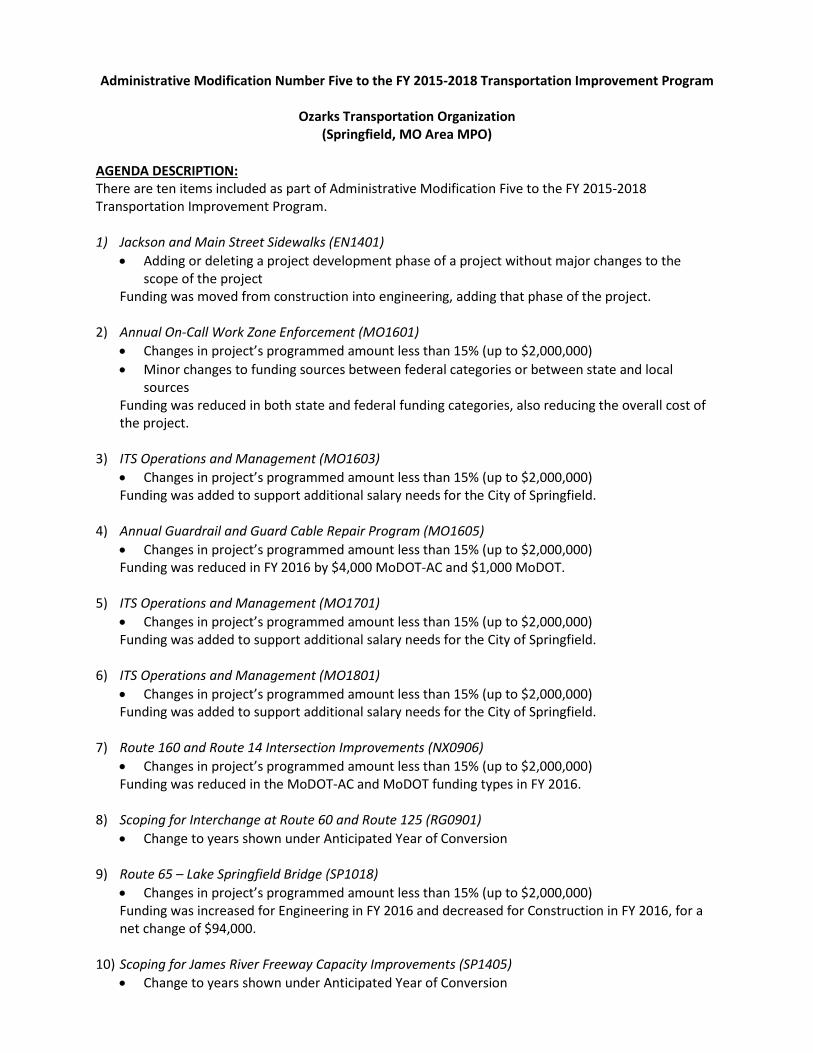
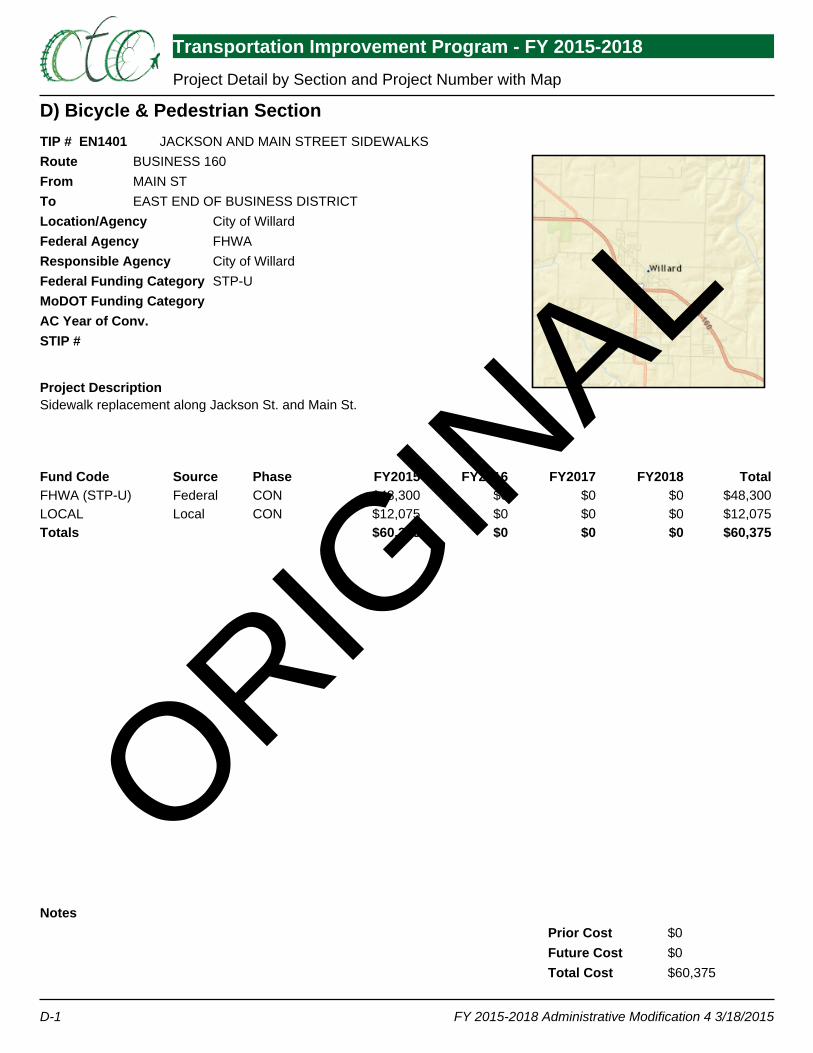
AGENDA DESCRIPTION: There are ten total items included as part of Administrative Modification Five to the FY 2015‐2018 Transportation Improvement Program. Administrative Modification 5 1) Jackson and Main Street Sidewalks (EN1401)
Adding or deleting a project development phase of a project without major changes to the scope of the project
Funding was moved from construction into engineering, adding that phase of the project.
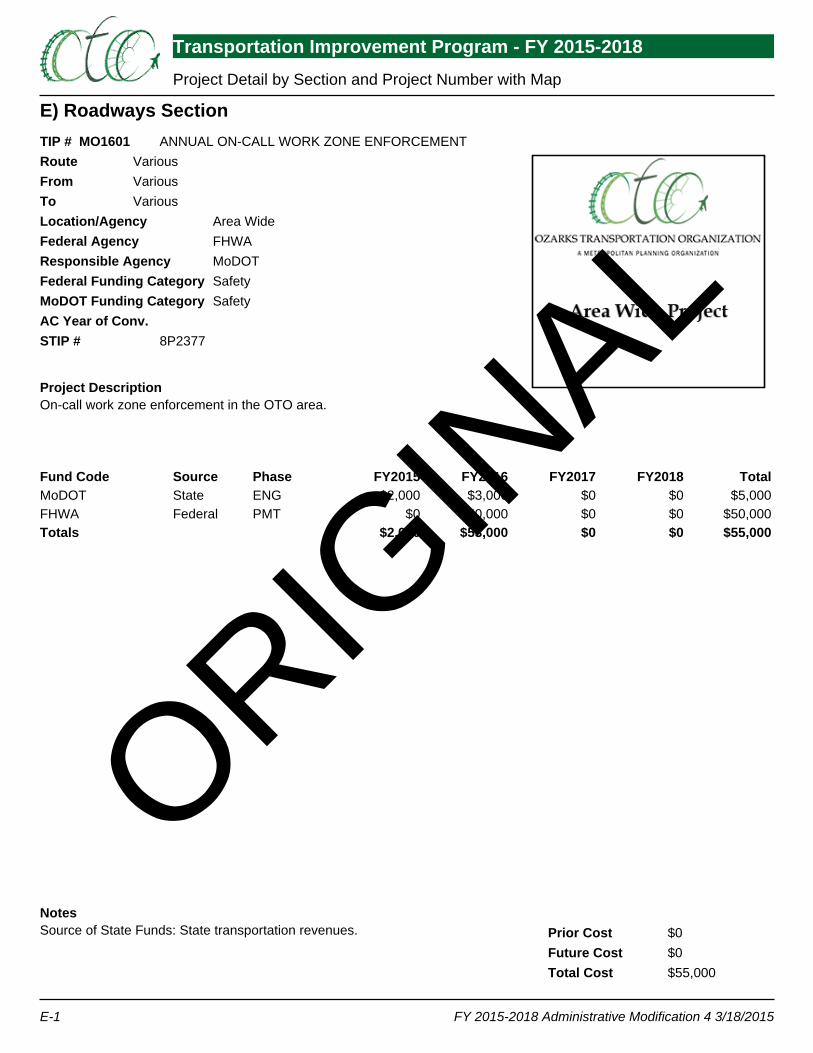
2) Annual On‐Call Work Zone Enforcement (MO1601)
Changes in project’s programmed amount less than 15% (up to $2,000,000)
Minor changes to funding sources between federal categories or between state and local sources
Funding was reduced in both state and federal funding categories, also reducing the overall cost of the project.
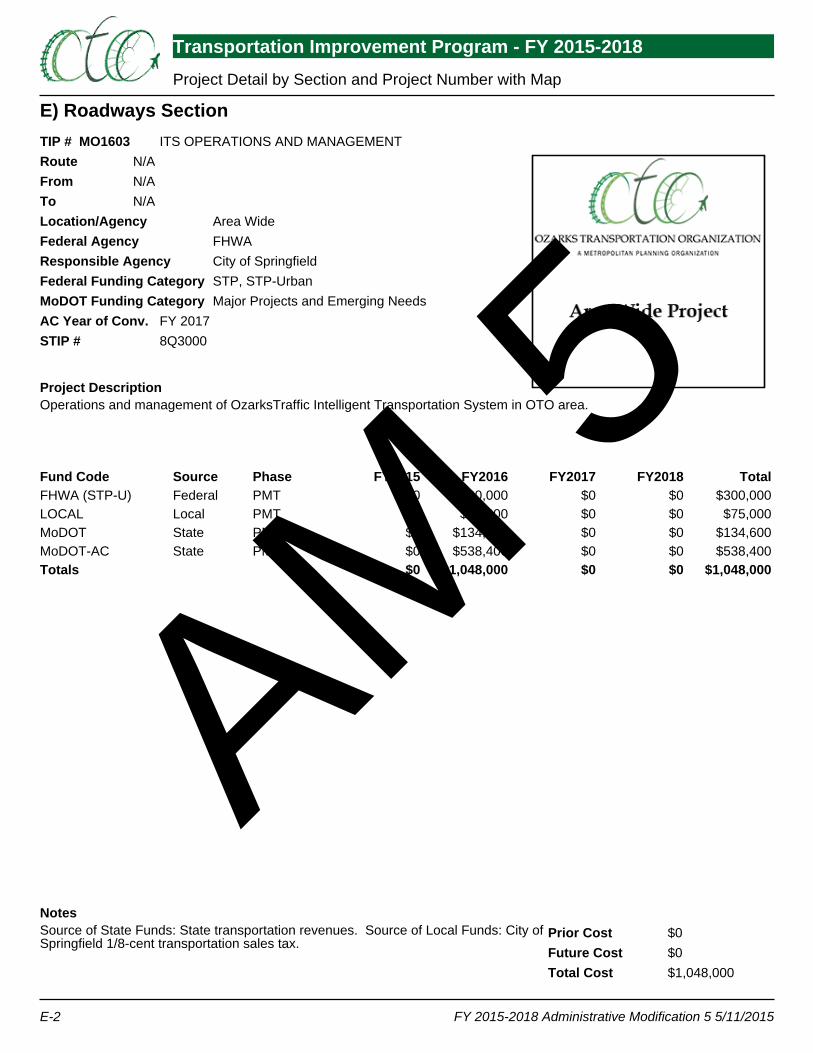
3) ITS Operations and Management (MO1603)
Changes in project’s programmed amount less than 15% (up to $2,000,000) Funding was added to support additional salary needs for the City of Springfield.
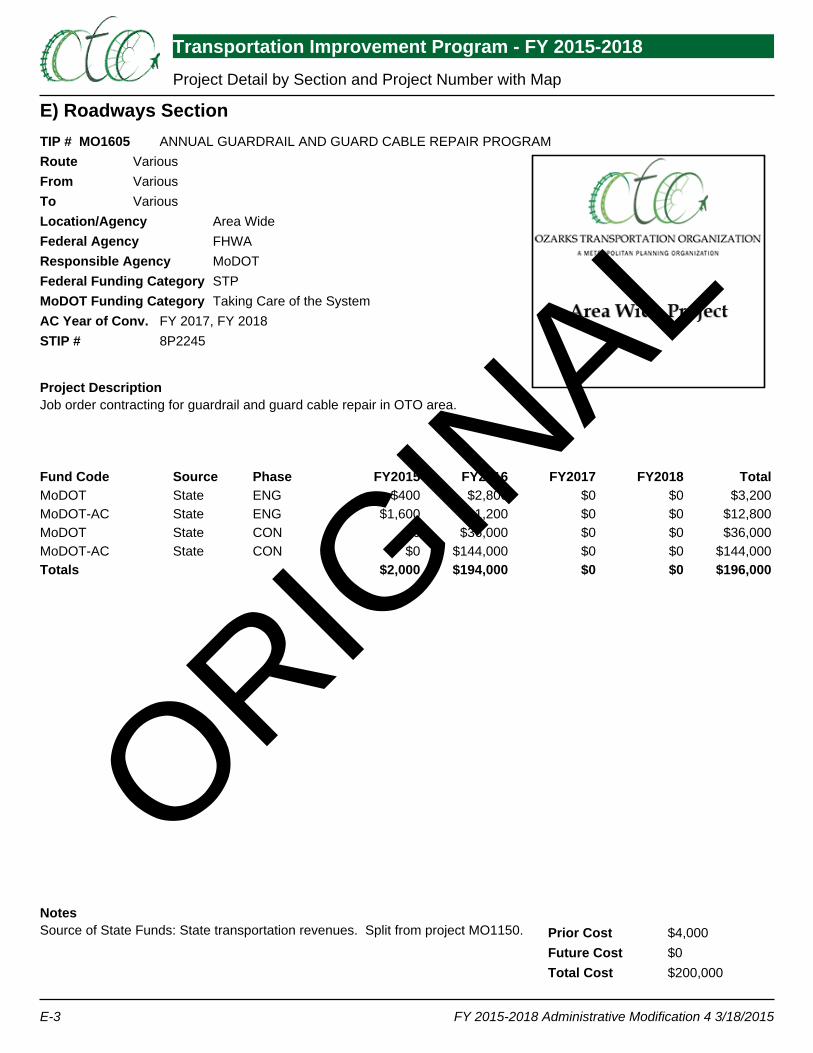
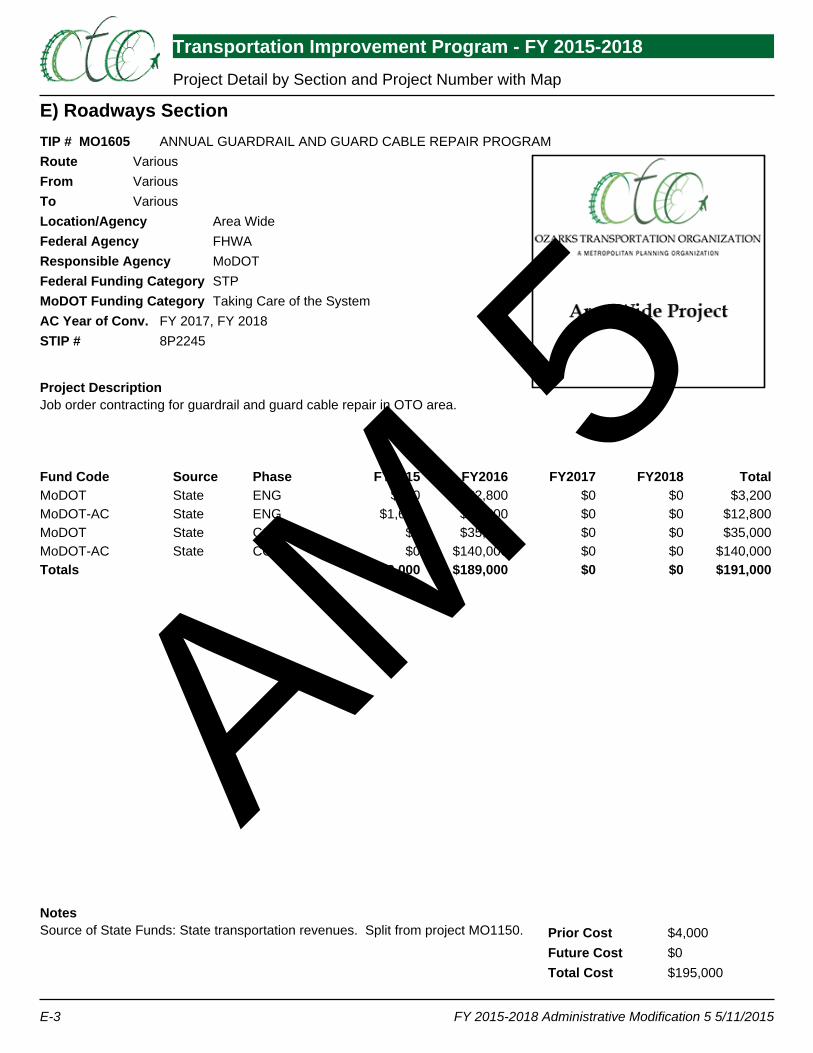
4) Annual Guardrail and Guard Cable Repair Program (MO1605)
Changes in project’s programmed amount less than 15% (up to $2,000,000) Funding was reduced in FY 2016 by $4,000 MoDOT‐AC and $1,000 MoDOT.
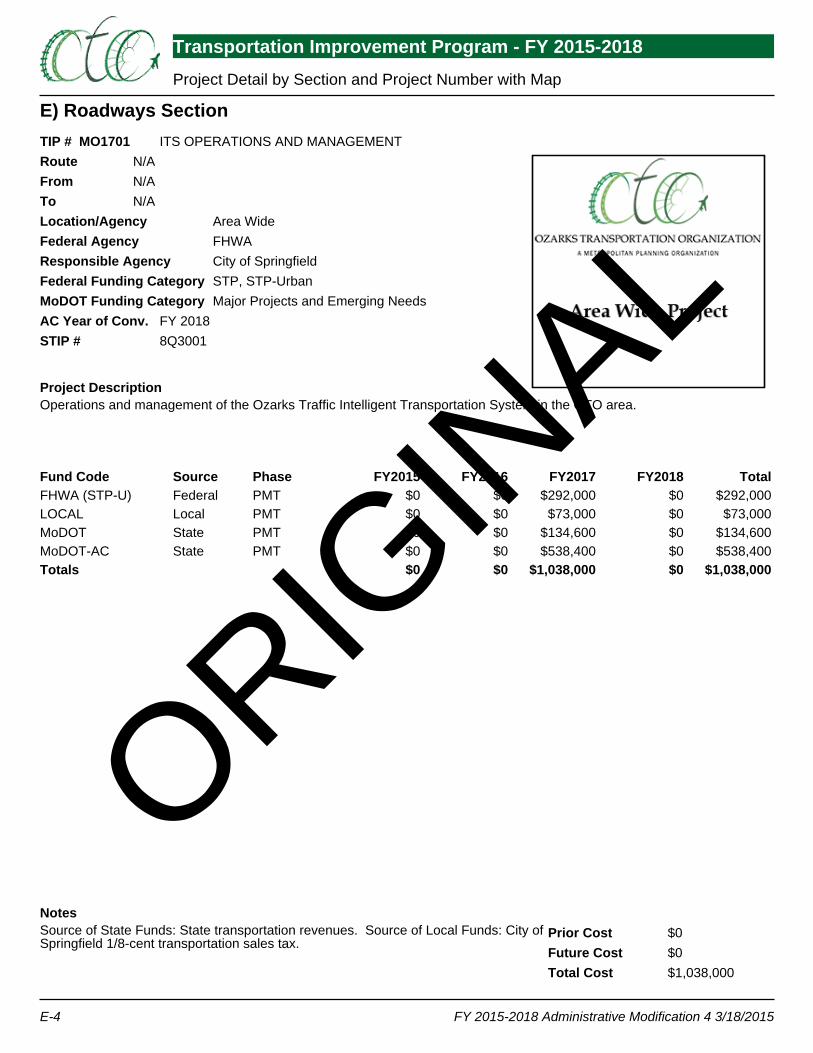
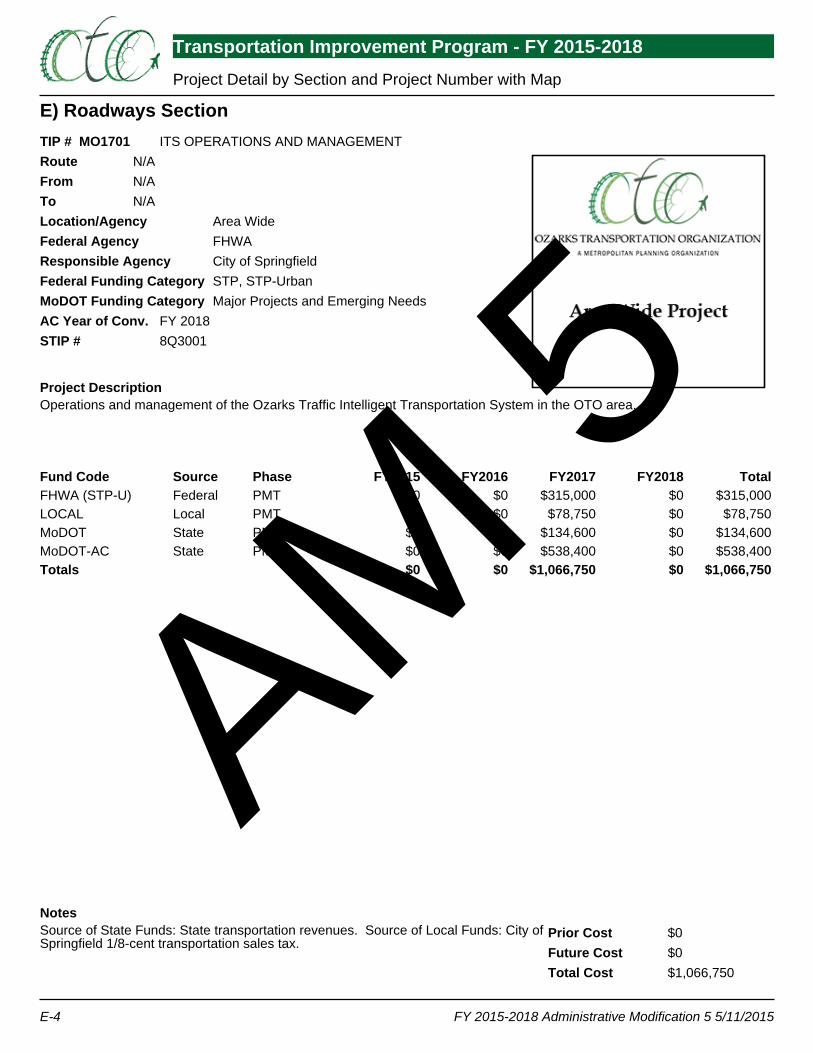
5) ITS Operations and Management (MO1701)
Changes in project’s programmed amount less than 15% (up to $2,000,000) Funding was added to support additional salary needs for the City of Springfield.
6) ITS Operations and Management (MO1801)
Changes in project’s programmed amount less than 15% (up to $2,000,000) Funding was added to support additional salary needs for the City of Springfield.
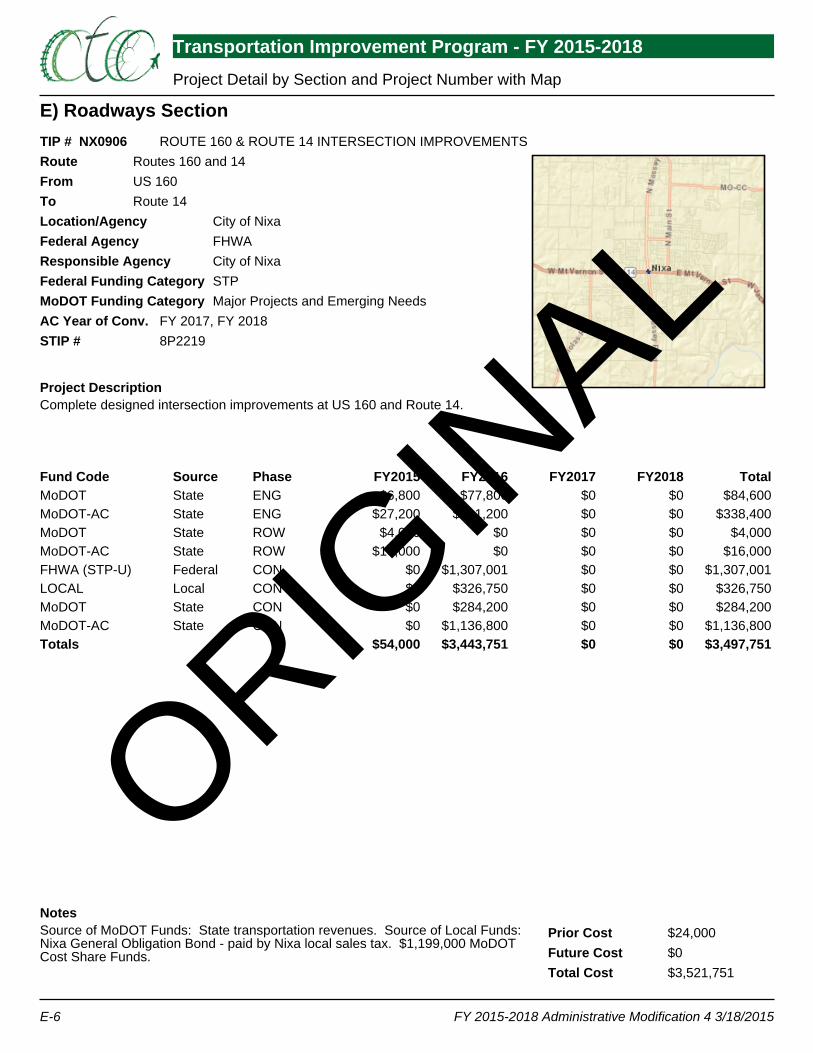
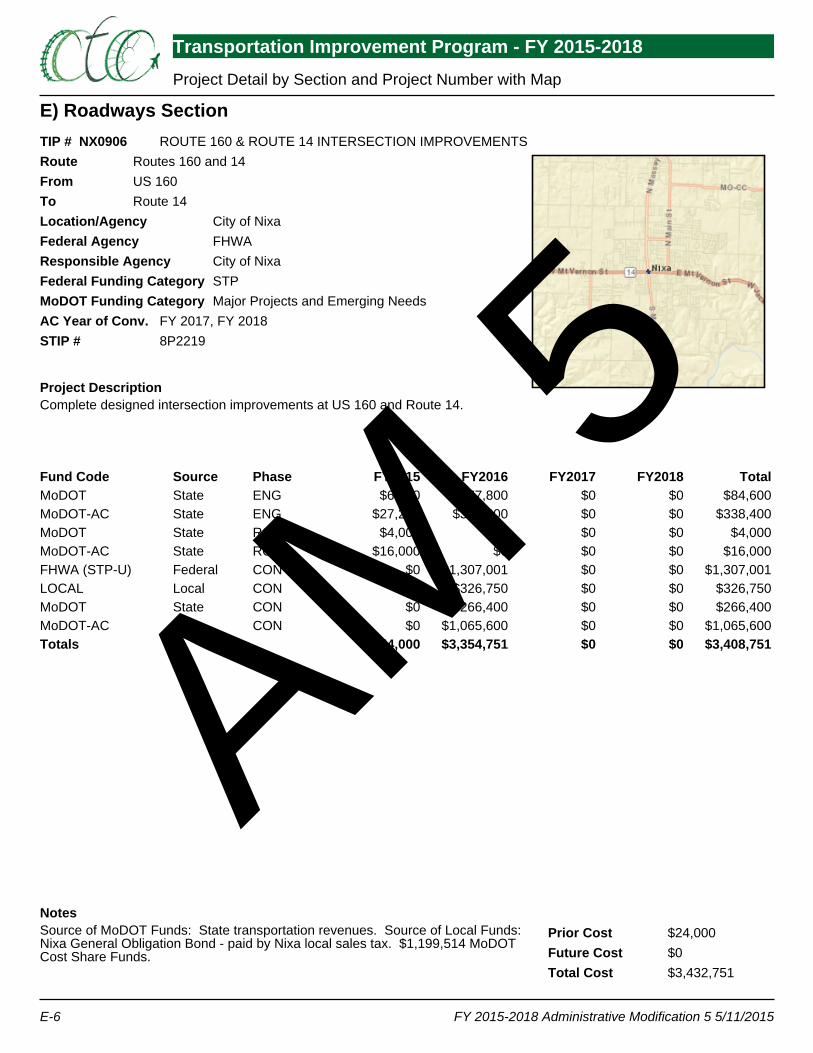
7) Route 160 and Route 14 Intersection Improvements (NX0906)
Changes in project’s programmed amount less than 15% (up to $2,000,000) Funding was reduced in the MoDOT‐AC and MoDOT funding types in FY 2016.
8) Scoping for Interchange at Route 60 and Route 125 (RG0901)
Change to years shown under Anticipated Year of Conversion
9) Route 65 – Lake Springfield Bridge (SP1018)
Changes in project’s programmed amount less than 15% (up to $2,000,000) Funding was increased for Engineering in FY 2016 and decreased for Construction in FY 2016, for a net change of $94,000.
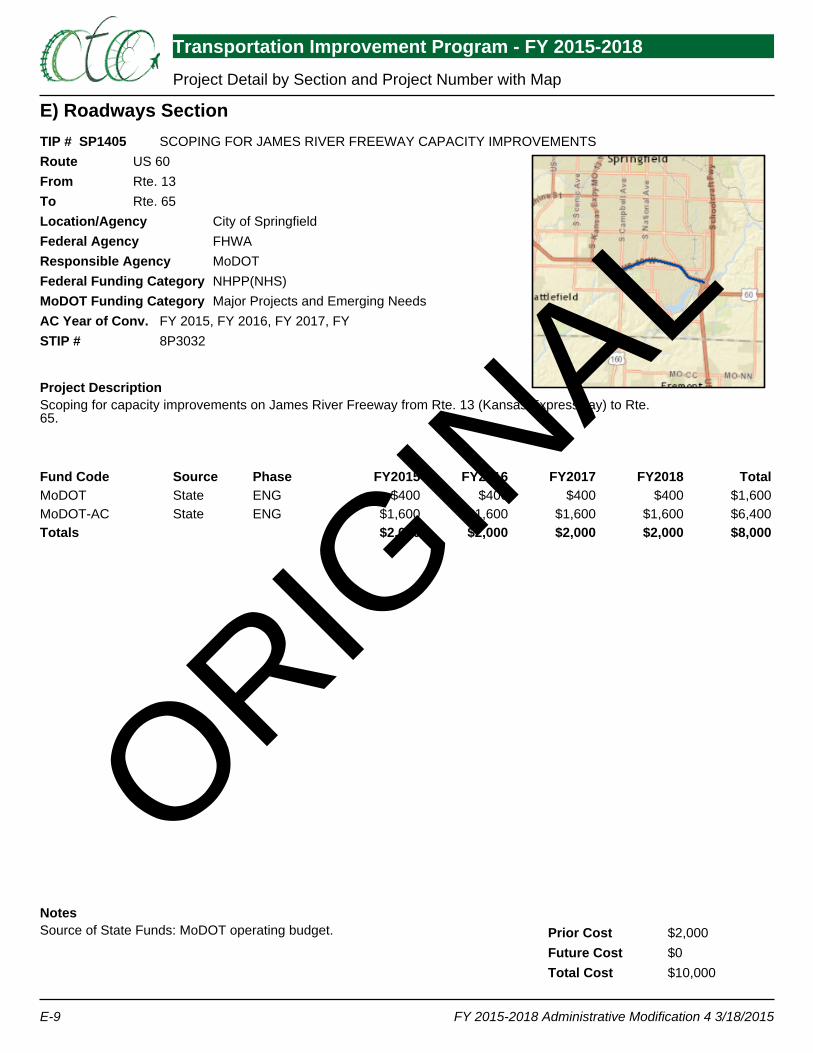
10) Scoping for James River Freeway Capacity Improvements (SP1405)
Change to years shown under Anticipated Year of Conversion
BOARD OF DIRECTORS ACTION REQUESTED: No action required. Informational only.
11 May 2015 Ms. Eva Voss Transportation Planning Missouri Department of Transportation P. O. Box 270 Jefferson City, Missouri 65102 Dear Ms. Voss: I am writing to advise you that the Ozarks Transportation Organization approved Administrative Modification Number Five to the OTO FY 2015-2018 Transportation Improvement Program (TIP) on May 11, 2015. The adoption included demonstration of fiscal constraint as required by federal regulations. Please find enclosed the administrative modification, which is detailed on the following page.
Please let me know if you have any questions or need any other information.
Sincerely, Natasha L. Longpine, AICP Principal Planner
Administrative Modification Number Five to the FY 2015-2018 Transportation Improvement Program
Ozarks Transportation Organization (Springfield, MO Area MPO)
AGENDA DESCRIPTION: There are ten items included as part of Administrative Modification Five to the FY 2015-2018 Transportation Improvement Program. 1) Jackson and Main Street Sidewalks (EN1401)
• Adding or deleting a project development phase of a project without major changes to the scope of the project
Funding was moved from construction into engineering, adding that phase of the project.
2) Annual On-Call Work Zone Enforcement (MO1601) • Changes in project’s programmed amount less than 15% (up to $2,000,000) • Minor changes to funding sources between federal categories or between state and local
sources Funding was reduced in both state and federal funding categories, also reducing the overall cost of the project.
3) ITS Operations and Management (MO1603) • Changes in project’s programmed amount less than 15% (up to $2,000,000) Funding was added to support additional salary needs for the City of Springfield.
4) Annual Guardrail and Guard Cable Repair Program (MO1605) • Changes in project’s programmed amount less than 15% (up to $2,000,000) Funding was reduced in FY 2016 by $4,000 MoDOT-AC and $1,000 MoDOT.
5) ITS Operations and Management (MO1701)
• Changes in project’s programmed amount less than 15% (up to $2,000,000) Funding was added to support additional salary needs for the City of Springfield.
6) ITS Operations and Management (MO1801) • Changes in project’s programmed amount less than 15% (up to $2,000,000) Funding was added to support additional salary needs for the City of Springfield.
7) Route 160 and Route 14 Intersection Improvements (NX0906)
• Changes in project’s programmed amount less than 15% (up to $2,000,000) Funding was reduced in the MoDOT-AC and MoDOT funding types in FY 2016.
8) Scoping for Interchange at Route 60 and Route 125 (RG0901)
• Change to years shown under Anticipated Year of Conversion 9) Route 65 – Lake Springfield Bridge (SP1018)
• Changes in project’s programmed amount less than 15% (up to $2,000,000) Funding was increased for Engineering in FY 2016 and decreased for Construction in FY 2016, for a net change of $94,000.
10) Scoping for James River Freeway Capacity Improvements (SP1405)
• Change to years shown under Anticipated Year of Conversion
D) Bicycle & Pedestrian Section
Transportation Improvement Program - FY 2015-2018 Project Detail by Section and Project Number with Map
FY 2015-2018 Administrative Modification 4 3/18/2015D-1
TIP # EN1401RouteFromToLocation/AgencyFederal AgencyResponsible AgencyFederal Funding CategoryMoDOT Funding CategoryAC Year of Conv.STIP #
Project Description
NotesPrior CostFuture CostTotal Cost
JACKSON AND MAIN STREET SIDEWALKSBUSINESS 160MAIN ST EAST END OF BUSINESS DISTRICT
City of WillardFHWACity of WillardSTP-U
Sidewalk replacement along Jackson St. and Main St.
$0$0$60,375
Fund Code Source Phase FY2015 FY2016 FY2017 FY2018 TotalFHWA (STP-U) Federal CON $48,300 $0 $0 $0 $48,300LOCAL Local CON $12,075 $0 $0 $0 $12,075Totals $60,375 $0 $0 $0 $60,375
ORIGIN
AL
D) Bicycle & Pedestrian Section
Transportation Improvement Program - FY 2015-2018 Project Detail by Section and Project Number with Map
FY 2015-2018 Administrative Modification 5 5/11/2015D-1
TIP # EN1401RouteFromToLocation/AgencyFederal AgencyResponsible AgencyFederal Funding CategoryMoDOT Funding CategoryAC Year of Conv.STIP #
Project Description
NotesPrior CostFuture CostTotal Cost
JACKSON AND MAIN STREET SIDEWALKSBUSINESS 160MAIN ST EAST END OF BUSINESS DISTRICT
City of WillardFHWACity of WillardSTP-U
Sidewalk replacement along Jackson St. and Main St.
$0$0$60,000
Fund Code Source Phase FY2015 FY2016 FY2017 FY2018 TotalFHWA (STP-U) Federal ENG $16,926 $0 $0 $0 $16,926LOCAL Local ENG $4,231 $0 $0 $0 $4,231FHWA (STP-U) Federal CON $31,074 $0 $0 $0 $31,074LOCAL Local CON $7,769 $0 $0 $0 $7,769Totals $60,000 $0 $0 $0 $60,000
AM 5
E) Roadways Section
Transportation Improvement Program - FY 2015-2018 Project Detail by Section and Project Number with Map
FY 2015-2018 Administrative Modification 4 3/18/2015E-1
TIP # MO1601RouteFromToLocation/AgencyFederal AgencyResponsible AgencyFederal Funding CategoryMoDOT Funding CategoryAC Year of Conv.STIP #
Project Description
NotesPrior CostFuture CostTotal Cost
ANNUAL ON-CALL WORK ZONE ENFORCEMENTVariousVariousVarious
Area WideFHWAMoDOTSafetySafety
8P2377
On-call work zone enforcement in the OTO area.
Source of State Funds: State transportation revenues. $0$0$55,000
Fund Code Source Phase FY2015 FY2016 FY2017 FY2018 TotalMoDOT State ENG $2,000 $3,000 $0 $0 $5,000FHWA Federal PMT $0 $50,000 $0 $0 $50,000Totals $2,000 $53,000 $0 $0 $55,000
ORIGIN
AL

E) Roadways Section
Transportation Improvement Program - FY 2015-2018 Project Detail by Section and Project Number with Map
FY 2015-2018 Administrative Modification 5 5/11/2015E-1
TIP # MO1601RouteFromToLocation/AgencyFederal AgencyResponsible AgencyFederal Funding CategoryMoDOT Funding CategoryAC Year of Conv.STIP #
Project Description
NotesPrior CostFuture CostTotal Cost
ANNUAL ON-CALL WORK ZONE ENFORCEMENTVariousVariousVarious
Area WideFHWAMoDOTSafetySafety
8P2377
On-call work zone enforcement in the OTO area.
Source of State Funds: State transportation revenues. $0$0$53,000
Fund Code Source Phase FY2015 FY2016 FY2017 FY2018 TotalFHWA Federal ENG $0 $900 $0 $0 $900MoDOT State ENG $2,000 $100 $0 $0 $2,100FHWA Federal PMT $0 $46,000 $0 $0 $46,000MoDOT State CON $0 $4,000 $0 $0 $4,000Totals $2,000 $51,000 $0 $0 $53,000
AM 5

E) Roadways Section
Transportation Improvement Program - FY 2015-2018 Project Detail by Section and Project Number with Map
FY 2015-2018 Administrative Modification 4 3/18/2015E-2
TIP # MO1603RouteFromToLocation/AgencyFederal AgencyResponsible AgencyFederal Funding CategoryMoDOT Funding CategoryAC Year of Conv.STIP #
Project Description
NotesPrior CostFuture CostTotal Cost
ITS OPERATIONS AND MANAGEMENTN/AN/AN/A
Area WideFHWACity of SpringfieldSTP, STP-UrbanMajor Projects and Emerging Needs
FY 20178Q3000
Operations and management of OzarksTraffic Intelligent Transportation System in OTO area.
Source of State Funds: State transportation revenues. Source of Local Funds: City ofSpringfield 1/8-cent transportation sales tax.
$0$0$1,028,000
Fund Code Source Phase FY2015 FY2016 FY2017 FY2018 TotalFHWA (STP-U) Federal PMT $0 $284,000 $0 $0 $284,000LOCAL Local PMT $0 $71,000 $0 $0 $71,000MoDOT State PMT $0 $134,600 $0 $0 $134,600MoDOT-AC State PMT $0 $538,400 $0 $0 $538,400Totals $0 $1,028,000 $0 $0 $1,028,000
ORIGIN
AL
E) Roadways Section
Transportation Improvement Program - FY 2015-2018 Project Detail by Section and Project Number with Map
FY 2015-2018 Administrative Modification 5 5/11/2015E-2
TIP # MO1603RouteFromToLocation/AgencyFederal AgencyResponsible AgencyFederal Funding CategoryMoDOT Funding CategoryAC Year of Conv.STIP #
Project Description
NotesPrior CostFuture CostTotal Cost
ITS OPERATIONS AND MANAGEMENTN/AN/AN/A
Area WideFHWACity of SpringfieldSTP, STP-UrbanMajor Projects and Emerging Needs
FY 20178Q3000
Operations and management of OzarksTraffic Intelligent Transportation System in OTO area.
Source of State Funds: State transportation revenues. Source of Local Funds: City ofSpringfield 1/8-cent transportation sales tax.
$0$0$1,048,000
Fund Code Source Phase FY2015 FY2016 FY2017 FY2018 TotalFHWA (STP-U) Federal PMT $0 $300,000 $0 $0 $300,000LOCAL Local PMT $0 $75,000 $0 $0 $75,000MoDOT State PMT $0 $134,600 $0 $0 $134,600MoDOT-AC State PMT $0 $538,400 $0 $0 $538,400Totals $0 $1,048,000 $0 $0 $1,048,000
AM 5
E) Roadways Section
Transportation Improvement Program - FY 2015-2018 Project Detail by Section and Project Number with Map
FY 2015-2018 Administrative Modification 4 3/18/2015E-3
TIP # MO1605RouteFromToLocation/AgencyFederal AgencyResponsible AgencyFederal Funding CategoryMoDOT Funding CategoryAC Year of Conv.STIP #
Project Description
NotesPrior CostFuture CostTotal Cost
ANNUAL GUARDRAIL AND GUARD CABLE REPAIR PROGRAMVariousVariousVarious
Area WideFHWAMoDOTSTPTaking Care of the System
FY 2017, FY 20188P2245
Job order contracting for guardrail and guard cable repair in OTO area.
Source of State Funds: State transportation revenues. Split from project MO1150. $4,000$0$200,000
Fund Code Source Phase FY2015 FY2016 FY2017 FY2018 TotalMoDOT State ENG $400 $2,800 $0 $0 $3,200MoDOT-AC State ENG $1,600 $11,200 $0 $0 $12,800MoDOT State CON $0 $36,000 $0 $0 $36,000MoDOT-AC State CON $0 $144,000 $0 $0 $144,000Totals $2,000 $194,000 $0 $0 $196,000
ORIGIN
AL
E) Roadways Section
Transportation Improvement Program - FY 2015-2018 Project Detail by Section and Project Number with Map
FY 2015-2018 Administrative Modification 5 5/11/2015E-3
TIP # MO1605RouteFromToLocation/AgencyFederal AgencyResponsible AgencyFederal Funding CategoryMoDOT Funding CategoryAC Year of Conv.STIP #
Project Description
NotesPrior CostFuture CostTotal Cost
ANNUAL GUARDRAIL AND GUARD CABLE REPAIR PROGRAMVariousVariousVarious
Area WideFHWAMoDOTSTPTaking Care of the System
FY 2017, FY 20188P2245
Job order contracting for guardrail and guard cable repair in OTO area.
Source of State Funds: State transportation revenues. Split from project MO1150. $4,000$0$195,000
Fund Code Source Phase FY2015 FY2016 FY2017 FY2018 TotalMoDOT State ENG $400 $2,800 $0 $0 $3,200MoDOT-AC State ENG $1,600 $11,200 $0 $0 $12,800MoDOT State CON $0 $35,000 $0 $0 $35,000MoDOT-AC State CON $0 $140,000 $0 $0 $140,000Totals $2,000 $189,000 $0 $0 $191,000
AM 5
E) Roadways Section
Transportation Improvement Program - FY 2015-2018 Project Detail by Section and Project Number with Map
FY 2015-2018 Administrative Modification 4 3/18/2015E-4
TIP # MO1701RouteFromToLocation/AgencyFederal AgencyResponsible AgencyFederal Funding CategoryMoDOT Funding CategoryAC Year of Conv.STIP #
Project Description
NotesPrior CostFuture CostTotal Cost
ITS OPERATIONS AND MANAGEMENTN/AN/AN/A
Area WideFHWACity of SpringfieldSTP, STP-UrbanMajor Projects and Emerging Needs
FY 20188Q3001
Operations and management of the Ozarks Traffic Intelligent Transportation System in the OTO area.
Source of State Funds: State transportation revenues. Source of Local Funds: City ofSpringfield 1/8-cent transportation sales tax.
$0$0$1,038,000
Fund Code Source Phase FY2015 FY2016 FY2017 FY2018 TotalFHWA (STP-U) Federal PMT $0 $0 $292,000 $0 $292,000LOCAL Local PMT $0 $0 $73,000 $0 $73,000MoDOT State PMT $0 $0 $134,600 $0 $134,600MoDOT-AC State PMT $0 $0 $538,400 $0 $538,400Totals $0 $0 $1,038,000 $0 $1,038,000
ORIGIN
AL
E) Roadways Section
Transportation Improvement Program - FY 2015-2018 Project Detail by Section and Project Number with Map
FY 2015-2018 Administrative Modification 5 5/11/2015E-4
TIP # MO1701RouteFromToLocation/AgencyFederal AgencyResponsible AgencyFederal Funding CategoryMoDOT Funding CategoryAC Year of Conv.STIP #
Project Description
NotesPrior CostFuture CostTotal Cost
ITS OPERATIONS AND MANAGEMENTN/AN/AN/A
Area WideFHWACity of SpringfieldSTP, STP-UrbanMajor Projects and Emerging Needs
FY 20188Q3001
Operations and management of the Ozarks Traffic Intelligent Transportation System in the OTO area.
Source of State Funds: State transportation revenues. Source of Local Funds: City ofSpringfield 1/8-cent transportation sales tax.
$0$0$1,066,750
Fund Code Source Phase FY2015 FY2016 FY2017 FY2018 TotalFHWA (STP-U) Federal PMT $0 $0 $315,000 $0 $315,000LOCAL Local PMT $0 $0 $78,750 $0 $78,750MoDOT State PMT $0 $0 $134,600 $0 $134,600MoDOT-AC State PMT $0 $0 $538,400 $0 $538,400Totals $0 $0 $1,066,750 $0 $1,066,750
AM 5

E) Roadways Section
Transportation Improvement Program - FY 2015-2018 Project Detail by Section and Project Number with Map
FY 2015-2018 Administrative Modification 4 3/18/2015E-5
TIP # MO1801RouteFromToLocation/AgencyFederal AgencyResponsible AgencyFederal Funding CategoryMoDOT Funding CategoryAC Year of Conv.STIP #
Project Description
NotesPrior CostFuture CostTotal Cost
ITS OPERATIONS AND MANAGEMENTN/AN/AN/A
Area WideFHWACity of SpringfieldSTP-UMajor Projects and Emerging Needs
FY 20188Q3001
Operations and management of the Ozarks Traffic Intelligent Transportation System in the OTO area.
Source of State Funds: State transportation revenues. Source of Local Funds: City ofSpringfield 1/8-cent transportation sales tax.
$0$0$1,048,000
Fund Code Source Phase FY2015 FY2016 FY2017 FY2018 TotalFHWA (STP-U) Federal PMT $0 $0 $0 $300,000 $300,000LOCAL Local PMT $0 $0 $0 $75,000 $75,000MoDOT State PMT $0 $0 $0 $134,600 $134,600MoDOT-AC State PMT $0 $0 $0 $538,400 $538,400Totals $0 $0 $0 $1,048,000 $1,048,000
ORIGIN
AL

E) Roadways Section
Transportation Improvement Program - FY 2015-2018 Project Detail by Section and Project Number with Map
FY 2015-2018 Administrative Modification 5 5/11/2015E-5
TIP # MO1801RouteFromToLocation/AgencyFederal AgencyResponsible AgencyFederal Funding CategoryMoDOT Funding CategoryAC Year of Conv.STIP #
Project Description
NotesPrior CostFuture CostTotal Cost
ITS OPERATIONS AND MANAGEMENTN/AN/AN/A
Area WideFHWACity of SpringfieldSTP-UMajor Projects and Emerging Needs
FY 20188Q3001
Operations and management of the Ozarks Traffic Intelligent Transportation System in the OTO area.
Source of State Funds: State transportation revenues. Source of Local Funds: City ofSpringfield 1/8-cent transportation sales tax.
$0$0$1,086,750
Fund Code Source Phase FY2015 FY2016 FY2017 FY2018 TotalFHWA (STP-U) Federal PMT $0 $0 $0 $331,000 $331,000LOCAL Local PMT $0 $0 $0 $82,750 $82,750MoDOT State PMT $0 $0 $0 $134,600 $134,600MoDOT-AC State PMT $0 $0 $0 $538,400 $538,400Totals $0 $0 $0 $1,086,750 $1,086,750
AM 5
E) Roadways Section
Transportation Improvement Program - FY 2015-2018 Project Detail by Section and Project Number with Map
FY 2015-2018 Administrative Modification 4 3/18/2015E-6
TIP # NX0906RouteFromToLocation/AgencyFederal AgencyResponsible AgencyFederal Funding CategoryMoDOT Funding CategoryAC Year of Conv.STIP #
Project Description
NotesPrior CostFuture CostTotal Cost
ROUTE 160 & ROUTE 14 INTERSECTION IMPROVEMENTSRoutes 160 and 14US 160Route 14
City of NixaFHWACity of NixaSTPMajor Projects and Emerging Needs
FY 2017, FY 20188P2219
Complete designed intersection improvements at US 160 and Route 14.
Source of MoDOT Funds: State transportation revenues. Source of Local Funds:Nixa General Obligation Bond - paid by Nixa local sales tax. $1,199,000 MoDOTCost Share Funds.
$24,000$0$3,521,751
Fund Code Source Phase FY2015 FY2016 FY2017 FY2018 TotalMoDOT State ENG $6,800 $77,800 $0 $0 $84,600MoDOT-AC State ENG $27,200 $311,200 $0 $0 $338,400MoDOT State ROW $4,000 $0 $0 $0 $4,000MoDOT-AC State ROW $16,000 $0 $0 $0 $16,000FHWA (STP-U) Federal CON $0 $1,307,001 $0 $0 $1,307,001LOCAL Local CON $0 $326,750 $0 $0 $326,750MoDOT State CON $0 $284,200 $0 $0 $284,200MoDOT-AC State CON $0 $1,136,800 $0 $0 $1,136,800Totals $54,000 $3,443,751 $0 $0 $3,497,751
ORIGIN
AL
E) Roadways Section
Transportation Improvement Program - FY 2015-2018 Project Detail by Section and Project Number with Map
FY 2015-2018 Administrative Modification 5 5/11/2015E-6
TIP # NX0906RouteFromToLocation/AgencyFederal AgencyResponsible AgencyFederal Funding CategoryMoDOT Funding CategoryAC Year of Conv.STIP #
Project Description
NotesPrior CostFuture CostTotal Cost
ROUTE 160 & ROUTE 14 INTERSECTION IMPROVEMENTSRoutes 160 and 14US 160Route 14
City of NixaFHWACity of NixaSTPMajor Projects and Emerging Needs
FY 2017, FY 20188P2219
Complete designed intersection improvements at US 160 and Route 14.
Source of MoDOT Funds: State transportation revenues. Source of Local Funds:Nixa General Obligation Bond - paid by Nixa local sales tax. $1,199,514 MoDOTCost Share Funds.
$24,000$0$3,432,751
Fund Code Source Phase FY2015 FY2016 FY2017 FY2018 TotalMoDOT State ENG $6,800 $77,800 $0 $0 $84,600MoDOT-AC State ENG $27,200 $311,200 $0 $0 $338,400MoDOT State ROW $4,000 $0 $0 $0 $4,000MoDOT-AC State ROW $16,000 $0 $0 $0 $16,000FHWA (STP-U) Federal CON $0 $1,307,001 $0 $0 $1,307,001LOCAL Local CON $0 $326,750 $0 $0 $326,750MoDOT State CON $0 $266,400 $0 $0 $266,400MoDOT-AC State CON $0 $1,065,600 $0 $0 $1,065,600Totals $54,000 $3,354,751 $0 $0 $3,408,751AM 5
E) Roadways Section
Transportation Improvement Program - FY 2015-2018 Project Detail by Section and Project Number with Map
FY 2015-2018 Administrative Modification 4 3/18/2015E-7
TIP # RG0901RouteFromToLocation/AgencyFederal AgencyResponsible AgencyFederal Funding CategoryMoDOT Funding CategoryAC Year of Conv.STIP #
Project Description
NotesPrior CostFuture CostTotal Cost
SCOPING FOR INTERCHANGE AT ROUTE 60 & ROUTE 125US 60 and Route 125Farm Road 213 Farm Road 247
City of RogersvilleFHWAMoDOTNHPP(NHS)Major Projects and Emerging Needs
FY 2015, FY 2016, FY 2017, FY8P0683E
Scoping for interchange improvements at Rte. 125 and outer roads from Farm Road 213 to Farm Road247.
Source of State Funds: State transportation revenues. $294,000$0$302,000
Fund Code Source Phase FY2015 FY2016 FY2017 FY2018 TotalMoDOT State ENG $400 $400 $400 $400 $1,600MoDOT-AC State ENG $1,600 $1,600 $1,600 $1,600 $6,400Totals $2,000 $2,000 $2,000 $2,000 $8,000
ORIGIN
AL
E) Roadways Section
Transportation Improvement Program - FY 2015-2018 Project Detail by Section and Project Number with Map
FY 2015-2018 Administrative Modification 5 5/11/2015E-7
TIP # RG0901RouteFromToLocation/AgencyFederal AgencyResponsible AgencyFederal Funding CategoryMoDOT Funding CategoryAC Year of Conv.STIP #
Project Description
NotesPrior CostFuture CostTotal Cost
SCOPING FOR INTERCHANGE AT ROUTE 60 & ROUTE 125US 60 and Route 125Farm Road 213 Farm Road 247
City of RogersvilleFHWAMoDOTNHPP(NHS)Major Projects and Emerging Needs
FY 2017, FY 2018, FY 20198P0683E
Scoping for interchange improvements at Rte. 125 and outer roads from Farm Road 213 to Farm Road247.
Source of State Funds: State transportation revenues. $294,000$0$302,000
Fund Code Source Phase FY2015 FY2016 FY2017 FY2018 TotalMoDOT State ENG $400 $400 $400 $400 $1,600MoDOT-AC State ENG $1,600 $1,600 $1,600 $1,600 $6,400Totals $2,000 $2,000 $2,000 $2,000 $8,000
AM 5
E) Roadways Section
Transportation Improvement Program - FY 2015-2018 Project Detail by Section and Project Number with Map
FY 2015-2018 Administrative Modification 4 3/18/2015E-8
TIP # SP1018RouteFromToLocation/AgencyFederal AgencyResponsible AgencyFederal Funding CategoryMoDOT Funding CategoryAC Year of Conv.STIP #
Project Description
NotesPrior CostFuture CostTotal Cost
ROUTE 65 - LAKE SPRINGFIELD BRIDGEUS 650.6 mile south of Route 60Lake Springfield
City of SpringfieldFHWAMoDOTNHPP(Bridge)Taking Care of the System
8P2158
Bridge improvements on northbound bridge over Lake Springfield, 0.6 miles south of Route 60.
Source of State Funds: State transportation revenues. $628,000$0$6,752,000
Fund Code Source Phase FY2015 FY2016 FY2017 FY2018 TotalFHWA Federal ENG $248,000 $440,800 $0 $0 $688,800MoDOT State ENG $62,000 $110,200 $0 $0 $172,200FHWA Federal CON $0 $4,210,400 $0 $0 $4,210,400MoDOT State CON $0 $1,052,600 $0 $0 $1,052,600Totals $310,000 $5,814,000 $0 $0 $6,124,000
ORIGIN
AL
E) Roadways Section
Transportation Improvement Program - FY 2015-2018 Project Detail by Section and Project Number with Map
FY 2015-2018 Administrative Modification 5 5/11/2015E-8
TIP # SP1018RouteFromToLocation/AgencyFederal AgencyResponsible AgencyFederal Funding CategoryMoDOT Funding CategoryAC Year of Conv.STIP #
Project Description
NotesPrior CostFuture CostTotal Cost
ROUTE 65 - LAKE SPRINGFIELD BRIDGEUS 650.6 mile south of Route 60Lake Springfield
City of SpringfieldFHWAMoDOTNHPP(Bridge)Taking Care of the System
8P2158
Bridge improvements on northbound bridge over Lake Springfield, 0.6 miles south of Route 60.
Source of State Funds: State transportation revenues. $628,000$0$6,846,000
Fund Code Source Phase FY2015 FY2016 FY2017 FY2018 TotalFHWA Federal ENG $248,000 $578,400 $0 $0 $826,400MoDOT State ENG $62,000 $144,600 $0 $0 $206,600FHWA Federal CON $0 $4,148,000 $0 $0 $4,148,000MoDOT State CON $0 $1,037,000 $0 $0 $1,037,000Totals $310,000 $5,908,000 $0 $0 $6,218,000
AM 5
E) Roadways Section
Transportation Improvement Program - FY 2015-2018 Project Detail by Section and Project Number with Map
FY 2015-2018 Administrative Modification 4 3/18/2015E-9
TIP # SP1405RouteFromToLocation/AgencyFederal AgencyResponsible AgencyFederal Funding CategoryMoDOT Funding CategoryAC Year of Conv.STIP #
Project Description
NotesPrior CostFuture CostTotal Cost
SCOPING FOR JAMES RIVER FREEWAY CAPACITY IMPROVEMENTSUS 60Rte. 13Rte. 65
City of SpringfieldFHWAMoDOTNHPP(NHS)Major Projects and Emerging Needs
FY 2015, FY 2016, FY 2017, FY8P3032
Scoping for capacity improvements on James River Freeway from Rte. 13 (Kansas Expressway) to Rte.65.
Source of State Funds: MoDOT operating budget. $2,000$0$10,000
Fund Code Source Phase FY2015 FY2016 FY2017 FY2018 TotalMoDOT State ENG $400 $400 $400 $400 $1,600MoDOT-AC State ENG $1,600 $1,600 $1,600 $1,600 $6,400Totals $2,000 $2,000 $2,000 $2,000 $8,000
ORIGIN
AL
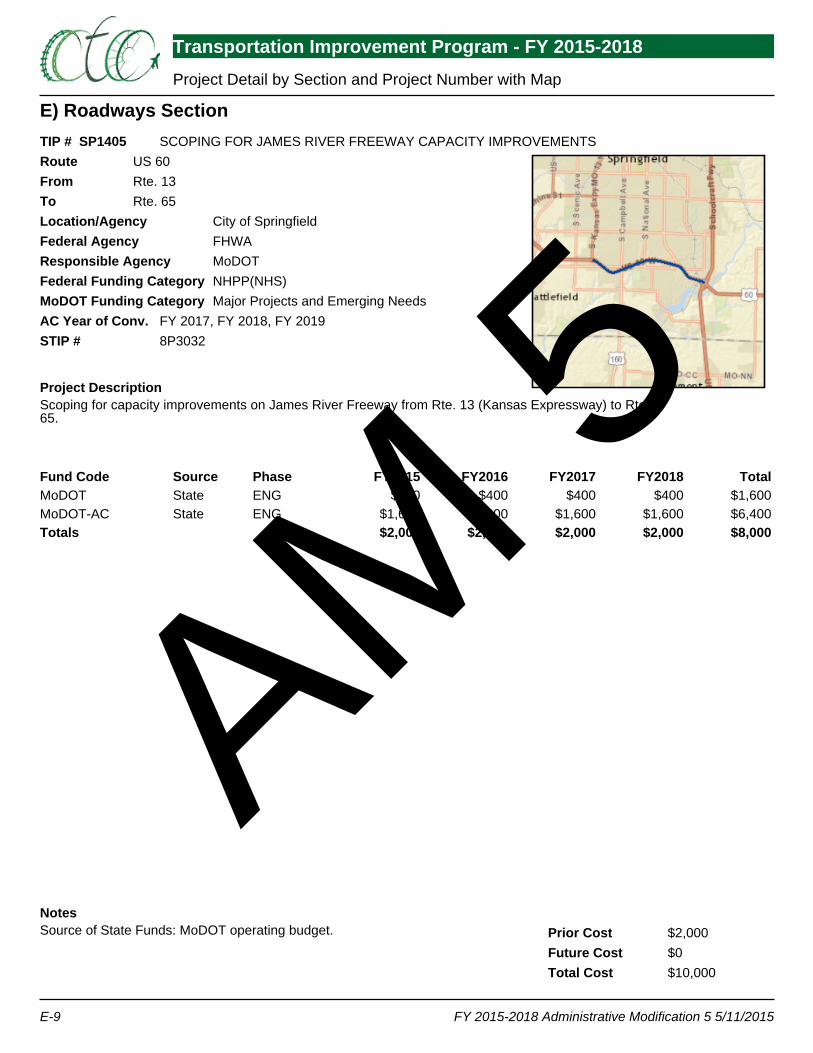
E) Roadways Section
Transportation Improvement Program - FY 2015-2018 Project Detail by Section and Project Number with Map
FY 2015-2018 Administrative Modification 5 5/11/2015E-9
TIP # SP1405RouteFromToLocation/AgencyFederal AgencyResponsible AgencyFederal Funding CategoryMoDOT Funding CategoryAC Year of Conv.STIP #
Project Description
NotesPrior CostFuture CostTotal Cost
SCOPING FOR JAMES RIVER FREEWAY CAPACITY IMPROVEMENTSUS 60Rte. 13Rte. 65
City of SpringfieldFHWAMoDOTNHPP(NHS)Major Projects and Emerging Needs
FY 2017, FY 2018, FY 20198P3032
Scoping for capacity improvements on James River Freeway from Rte. 13 (Kansas Expressway) to Rte.65.
Source of State Funds: MoDOT operating budget. $2,000$0$10,000
Fund Code Source Phase FY2015 FY2016 FY2017 FY2018 TotalMoDOT State ENG $400 $400 $400 $400 $1,600MoDOT-AC State ENG $1,600 $1,600 $1,600 $1,600 $6,400Totals $2,000 $2,000 $2,000 $2,000 $8,000
AM 5

Oza
rks
Tra
nspo
rtat
ion
Org
aniz
atio
nG
-120
15-2
018
Tra
nspo
rtat
ion
Impr
ovem
ent P
rogr
am
YE
AR
LY
SU
MM
AR
YL
oc
al
PR
OJ
EC
TF
HW
A (
ST
P)
FH
WA
(S
TP
-U)
FH
WA
(T
E)
FH
WA
(T
AP
)L
OC
AL
Mo
DO
TM
oD
OT
-AC
TO
TA
L
EN
13
02
$0
$0
$0
$2
40
,00
0$
60
,00
0$
0$
0$
30
0,0
00
EN
13
05
$0
$0
$2
20
,41
3$
0$
17
9,5
87
$0
$0
$4
00
,00
0E
N1
30
6$
0$
0$
32
0,0
00
$0
$8
0,0
00
$0
$0
$4
00
,00
0E
N1
30
7$
0$
0$
20
0,0
00
$0
$5
0,0
00
$0
$0
$2
50
,00
0E
N1
40
1$
0$
48
,00
0$
0$
0$
12
,00
0$
0$
0$
60
,00
0E
N1
50
2$
0$
0$
0$
0$
0$
19
4,8
00
$7
79
,20
0$
97
4,0
00
EN
15
03
$0
$0
$0
$1
22
,96
6$
30
,74
2$
0$
0$
15
3,7
08
EN
15
04
$0
$0
$0
$1
41
,63
5$
35
,40
9$
0$
0$
17
7,0
44
EN
15
05
$0
$0
$0
$4
0,0
34
$1
0,0
09
$0
$0
$5
0,0
43
EN
15
06
$0
$0
$0
$2
50
,00
0$
14
1,1
76
$0
$0
$3
91
,17
6E
N1
50
7$
0$
0$
0$
19
2,6
80
$4
8,1
70
$0
$0
$2
40
,85
0E
N1
50
8$
0$
0$
0$
25
0,0
00
$1
79
,00
0$
0$
0$
42
9,0
00
EN
15
09
$0
$0
$0
$2
50
,00
0$
28
0,0
00
$0
$0
$5
30
,00
0E
N1
51
0$
0$
0$
0$
25
0,0
00
$6
2,5
00
$0
$0
$3
12
,50
0E
N1
51
1$
0$
0$
0$
16
0,0
00
$4
0,0
00
$0
$0
$2
00
,00
0E
N1
51
2$
0$
0$
0$
13
3,0
80
$3
3,2
70
$0
$0
$1
66
,35
0M
O1
30
9$
0$
0$
0$
0$
0$
5,0
00
$2
0,0
00
$2
5,0
00
SP
14
12
$0
$0
$0
$0
$0
$1
18
,60
0$
47
4,4
00
$5
93
,00
0S
P1
41
4$
69
,00
0$
0$
17
5,0
00
$0
$3
0,0
00
$3
1,0
00
$0
$3
05
,00
0S
UB
TO
TA
L$
69
,00
0$
48
,00
0$
91
5,4
13
$2
,03
0,3
95
$1
,27
1,8
63
$3
49
,40
0$
1,2
73
,60
0$
5,9
57
,67
1
EN
16
01
$0
$0
$1
92
,00
0$
0$
0$
48
,00
0$
0$
24
0,0
00
MO
13
09
$0
$0
$0
$0
$0
$5
,00
0$
20
,00
0$
25
,00
0S
UB
TO
TA
L$
0$
0$
19
2,0
00
$0
$0
$5
3,0
00
$2
0,0
00
$2
65
,00
0
MO
13
09
$0
$0
$0
$0
$0
$5
,00
0$
20
,00
0$
25
,00
0S
UB
TO
TA
L$
0$
0$
0$
0$
0$
5,0
00
$2
0,0
00
$2
5,0
00
MO
13
09
$0
$0
$0
$0
$0
$5
,00
0$
20
,00
0$
25
,00
0S
UB
TO
TA
L$
0$
0$
0$
0$
0$
5,0
00
$2
0,0
00
$2
5,0
00
GR
AN
D T
OT
AL
$6
9,0
00
$4
8,0
00
$1
,10
7,4
13
$2
,03
0,3
95
$1
,27
1,8
63
$4
12
,40
0$
1,3
33
,60
0$
6,2
72
,67
1
FY
20
16
FY
20
17
FY
20
18
FIN
AN
CIA
L S
UM
MA
RY
Bic
ycle
& P
edes
tria
n
Sta
te
FY
20
15
Oza
rks
Tra
nspo
rtat
ion
Org
aniz
atio
nG
-220
15-2
018
Tra
nspo
rtat
ion
Impr
ovem
ent P
rogr
am
ST
PS
TP
-UT
ET
AP
Lo
ca
lM
oD
OT
Mo
DO
T-A
CT
OT
AL
PR
IOR
YE
AR
Ba
lan
ce
-$
-$
-$
$
83
7,8
63
-$
-
$
-$
$
83
7,8
63
FY
20
15
Fu
nd
s A
ntic
ipa
ted
$6
9,0
00
$4
8,0
00
$9
15
,41
3$
1,1
99
,37
6$
1,2
71
,86
3$
34
9,4
00
$1
,27
3,6
00
$5
,12
6,6
52
Fu
nd
s P
rogr
am
me
d($
69
,00
0.0
0)
($4
8,0
00
.00
)($
91
5,4
13
.00
)($
2,0
30
,39
5.0
0)
($1
,27
1,8
63
.00
)($
34
9,4
00
.00
)($
1,2
73
,60
0.0
0)
($5
,95
7,6
71
.00
)R
un
nin
g B
ala
nc
e$
0$
0$
6,8
44
$0
$0
$0
$6
,84
4F
Y 2
01
6F
un
ds
An
ticip
ate
d-
$
$
19
2,0
00
$0
-$
$
53
,00
0$
20
,00
0$
26
5,0
00
Fu
nd
s P
rogr
am
me
d-
$
($
19
2,0
00
.00
)-
$
-$
($
53
,00
0.0
0)
($2
0,0
00
.00
)($
26
5,0
00
.00
)R
un
nin
g B
ala
nc
e$
0$
0$
6,8
44
$0
$0
$0
$6
,84
4F
Y 2
01
7F
un
ds
An
ticip
ate
d-
$
-
$
$6
12
,82
6-
$
$5
,00
0$
20
,00
0$
63
7,8
26
Fu
nd
s P
rogr
am
me
d-
$
-
$
-$
-
$
($5
,00
0.0
0)
($2
0,0
00
.00
)($
25
,00
0.0
0)
Ru
nn
ing
Ba
lan
ce
$0
$0
$6
19
,67
0$
0$
0$
0$
61
9,6
70
FY
20
18
Fu
nd
s A
ntic
ipa
ted
-$
-$
$
61
2,8
26
-$
$
5,0
00
$2
0,0
00
$6
37
,82
6F
un
ds
Pro
gra
mm
ed
-$
-$
-
$
-$
($
5,0
00
.00
)($
20
,00
0.0
0)
($2
5,0
00
.00
)R
un
nin
g B
ala
nc
e$
0$
0$
1,2
32
,49
6$
0$
0$
0$
1,2
32
,49
6
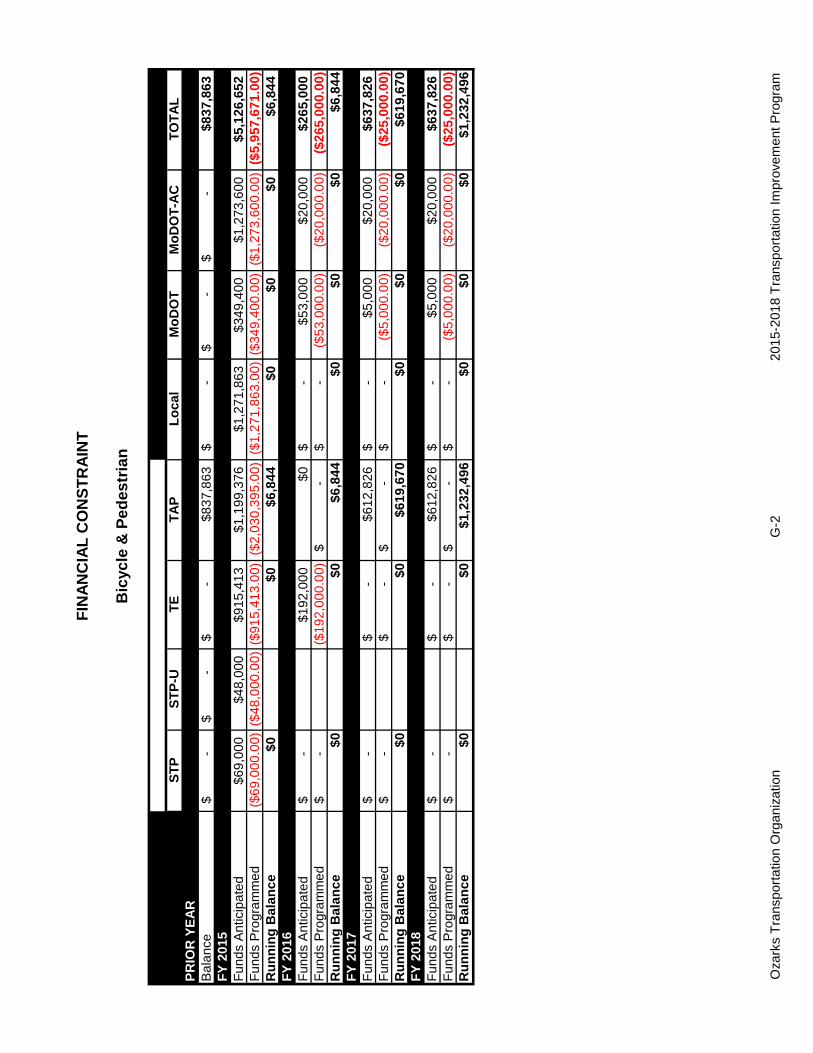
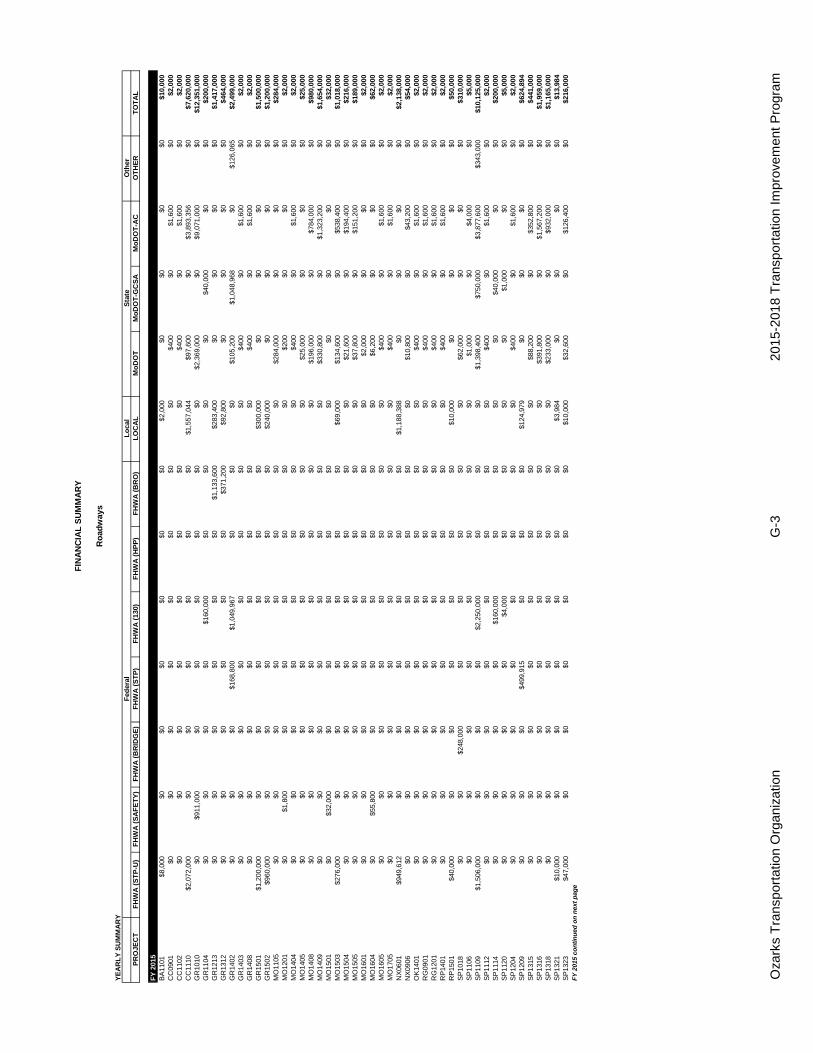
FIN
AN
CIA
L C
ON
ST
RA
INT
Bic
ycle
& P
ed
es
tria
n
Oza
rks
Tra
nspo
rtat
ion
Org
aniz
atio
nG
-320
15-2
018
Tra
nspo
rtat
ion
Impr
ovem
ent P
rogr
am
YE
AR
LY
SU
MM
AR
YL
oca
lO
ther
PR
OJE
CT
FH
WA
(S
TP
-U)
FH
WA
(S
AF
ET
Y)
FH
WA
(B
RID
GE
)F
HW
A (
ST
P)
FH
WA
(13
0)F
HW
A (
HP
P)
FH
WA
(B
RO
)L
OC
AL
Mo
DO
TM
oD
OT
-GC
SA
Mo
DO
T-A
CO
TH
ER
TO
TA
L
BA
1101
$8,0
00$0
$0$0
$0$0
$0$2
,000
$0$0
$0$0
$10,
000
CC
0901
$0$0
$0$0
$0$0
$0$0
$400
$0$1
,600
$0$2
,000
CC
1102
$0$0
$0$0
$0$0
$0$0
$400
$0$1
,600
$0$2
,000
CC
1110
$2,0
72,0
00$0
$0$0
$0$0
$0$1
,557
,044
$97,
600
$0$3
,893
,356
$0$7
,620
,000
GR
1010
$0$9
11,0
00$0
$0$0
$0$0
$0$2
,369
,000
$0$9
,071
,000
$0$1
2,35
1,00
0G
R11
04$0
$0$0
$0$1
60,0
00$0
$0$0
$0$4
0,00
0$0
$0$2
00,0
00G
R12
13$0
$0$0
$0$0
$0$1
,133
,600
$283
,400
$0$0
$0$0
$1,4
17,0
00G
R13
12$0
$0$0
$0$0
$0$3
71,2
00$9
2,80
0$0
$0$0
$0$4
64,0
00G
R14
02$0
$0$0
$168
,800
$1,0
49,9
67$0
$0$0
$105
,200
$1,0
48,9
68$0
$126
,065
$2,4
99,0
00G
R14
03$0
$0$0
$0$0
$0$0
$0$4
00$0
$1,6
00$0
$2,0
00G
R14
08$0
$0$0
$0$0
$0$0
$0$4
00$0
$1,6
00$0
$2,0
00G
R15
01$1
,200
,000
$0$0
$0$0
$0$0
$300
,000
$0$0
$0$0
$1,5
00,0
00G
R15
02$9
60,0
00$0
$0$0
$0$0
$0$2
40,0
00$0
$0$0
$0$1
,200
,000
MO
1105
$0$0
$0$0
$0$0
$0$0
$284
,000
$0$0
$0$2
84,0
00M
O12
01$0
$1,8
00$0
$0$0
$0$0
$0$2
00$0
$0$0
$2,0
00M
O14
04$0
$0$0
$0$0
$0$0
$0$4
00$0
$1,6
00$0
$2,0
00M
O14
05$0
$0$0
$0$0
$0$0
$0$2
5,00
0$0
$0$0
$25,
000
MO
1408
$0$0
$0$0
$0$0
$0$0
$196
,000
$0$7
84,0
00$0
$980
,000
MO
1409
$0$0
$0$0
$0$0
$0$0
$330
,800
$0$1
,323
,200
$0$1
,654
,000
MO
1501
$0$3
2,00
0$0
$0$0
$0$0
$0$0
$0$0
$0$3
2,00
0M
O15
03$2
76,0
00$0
$0$0
$0$0
$0$6
9,00
0$1
34,6
00$0
$538
,400
$0$1
,018
,000
MO
1504
$0$0
$0$0
$0$0
$0$0
$21,
600
$0$1
94,4
00$0
$216
,000
MO
1505
$0$0
$0$0
$0$0
$0$0
$37,
800
$0$1
51,2
00$0
$189
,000
MO
1601
$0$0
$0$0
$0$0
$0$0
$2,0
00$0
$0$0
$2,0
00M
O16
04$0
$55,
800
$0$0
$0$0
$0$0
$6,2
00$0
$0$0
$62,
000
MO
1605
$0$0
$0$0
$0$0
$0$0
$400
$0$1
,600
$0$2
,000
MO
1705
$0$0
$0$0
$0$0
$0$0
$400
$0$1
,600
$0$2
,000
NX
0601
$949
,612
$0$0
$0$0
$0$0
$1,1
88,3
88$0
$0$0
$0$2
,138
,000
NX
0906
$0$0
$0$0
$0$0
$0$0
$10,
800
$0$4
3,20
0$0
$54,
000
OK
1401
$0$0
$0$0
$0$0
$0$0
$400
$0$1
,600
$0$2
,000
RG
0901
$0$0
$0$0
$0$0
$0$0
$400
$0$1
,600
$0$2
,000
RG
1201
$0$0
$0$0
$0$0
$0$0
$400
$0$1
,600
$0$2
,000
RP
1401
$0$0
$0$0
$0$0
$0$0
$400
$0$1
,600
$0$2
,000
RP
1501
$40,
000
$0$0
$0$0
$0$0
$10,
000
$0$0
$0$0
$50,
000
SP
1018
$0$0
$248
,000
$0$0
$0$0
$0$6
2,00
0$0
$0$0
$310
,000
SP
1106
$0$0
$0$0
$0$0
$0$0
$1,0
00$0
$4,0
00$0
$5,0
00S
P11
09$1
,506
,000
$0$0
$0$2
,250
,000
$0$0
$0$1
,398
,400
$750
,000
$3,8
77,6
00$3
43,0
00$1
0,12
5,00
0S
P11
12$0
$0$0
$0$0
$0$0
$0$4
00$0
$1,6
00$0
$2,0
00S
P11
14$0
$0$0
$0$1
60,0
00$0
$0$0
$0$4
0,00
0$0
$0$2
00,0
00S
P11
20$0
$0$0
$0$4
,000
$0$0
$0$0
$1,0
00$0
$0$5
,000
SP
1204
$0$0
$0$0
$0$0
$0$0
$400
$0$1
,600
$0$2
,000
SP
1209
$0$0
$0$4
99,9
15$0
$0$0
$124
,979
$0$0
$0$0
$624
,894
SP
1315
$0$0
$0$0
$0$0
$0$0
$88,
200
$0$3
52,8
00$0
$441
,000
SP
1316
$0$0
$0$0
$0$0
$0$0
$391
,800
$0$1
,567
,200
$0$1
,959
,000
SP
1318
$0$0
$0$0
$0$0
$0$0
$233
,000
$0$9
32,0
00$0
$1,1
65,0
00S
P13
21$1
0,00
0$0
$0$0
$0$0
$0$3
,984
$0$0
$0$0
$13,
984
SP
1323
$47,
000
$0$0
$0$0
$0$0
$10,
000
$32,
600
$0$1
26,4
00$0
$216
,000
FY
201
5
FIN
AN
CIA
L S
UM
MA
RY
Ro
adw
ays
Fed
eral
Sta
te
FY 2
015
cont
inue
d on
nex
t pag
e
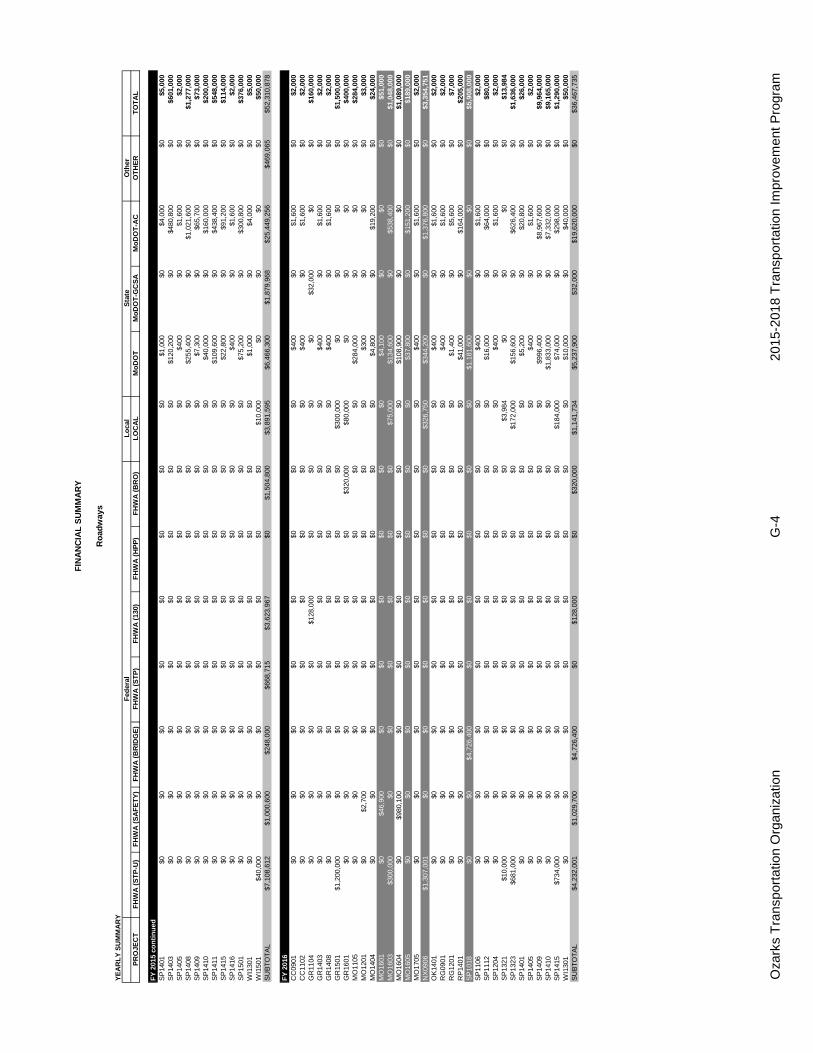
Oza
rks
Tra
nspo
rtat
ion
Org
aniz
atio
nG
-420
15-2
018
Tra
nspo
rtat
ion
Impr
ovem
ent P
rogr
am
YE
AR
LY
SU
MM
AR
YL
oca
lO
ther
PR
OJE
CT
FH
WA
(S
TP
-U)
FH
WA
(S
AF
ET
Y)
FH
WA
(B
RID
GE
)F
HW
A (
ST
P)
FH
WA
(13
0)F
HW
A (
HP
P)
FH
WA
(B
RO
)L
OC
AL
Mo
DO
TM
oD
OT
-GC
SA
Mo
DO
T-A
CO
TH
ER
TO
TA
L
FIN
AN
CIA
L S
UM
MA
RY
Ro
adw
ays
Fed
eral
Sta
te
SP
1401
$0$0
$0$0
$0$0
$0$0
$1,0
00$0
$4,0
00$0
$5,0
00S
P14
03$0
$0$0
$0$0
$0$0
$0$1
20,2
00$0
$480
,800
$0$6
01,0
00S
P14
05$0
$0$0
$0$0
$0$0
$0$4
00$0
$1,6
00$0
$2,0
00S
P14
08$0
$0$0
$0$0
$0$0
$0$2
55,4
00$0
$1,0
21,6
00$0
$1,2
77,0
00S
P14
09$0
$0$0
$0$0
$0$0
$0$7
,300
$0$6
5,70
0$0
$73,
000
SP
1410
$0$0
$0$0
$0$0
$0$0
$40,
000
$0$1
60,0
00$0
$200
,000
SP
1411
$0$0
$0$0
$0$0
$0$0
$109
,600
$0$4
38,4
00$0
$548
,000
SP
1415
$0$0
$0$0
$0$0
$0$0
$22,
800
$0$9
1,20
0$0
$114
,000
SP
1416
$0$0
$0$0
$0$0
$0$0
$400
$0$1
,600
$0$2
,000
SP
1501
$0$0
$0$0
$0$0
$0$0
$75,
200
$0$3
00,8
00$0
$376
,000
WI1
301
$0$0
$0$0
$0$0
$0$0
$1,0
00$0
$4,0
00$0
$5,0
00W
I150
1$4
0,00
0$0
$0$0
$0$0
$0$1
0,00
0$0
$0$0
$0$5
0,00
0S
UB
TO
TA
L$7
,108
,612
$1,0
00,6
00$2
48,0
00$6
68,7
15$3
,623
,967
$0$1
,504
,800
$3,8
91,5
95$6
,466
,300
$1,8
79,9
68$2
5,44
9,25
6$4
69,0
65$5
2,31
0,87
8
CC
0901
$0$0
$0$0
$0$0
$0$0
$400
$0$1
,600
$0$2
,000
CC
1102
$0$0
$0$0
$0$0
$0$0
$400
$0$1
,600
$0$2
,000
GR
1104
$0$0
$0$0
$128
,000
$0$0
$0$0
$32,
000
$0$0
$160
,000
GR
1403
$0$0
$0$0
$0$0
$0$0
$400
$0$1
,600
$0$2
,000
GR
1408
$0$0
$0$0
$0$0
$0$0
$400
$0$1
,600
$0$2
,000
GR
1501
$1,2
00,0
00$0
$0$0
$0$0
$0$3
00,0
00$0
$0$0
$0$1
,500
,000
GR
1601
$0$0
$0$0
$0$0
$320
,000
$80,
000
$0$0
$0$0
$400
,000
MO
1105
$0$0
$0$0
$0$0
$0$0
$284
,000
$0$0
$0$2
84,0
00M
O12
01$0
$2,7
00$0
$0$0
$0$0
$0$3
00$0
$0$0
$3,0
00M
O14
04$0
$0$0
$0$0
$0$0
$0$4
,800
$0$1
9,20
0$0
$24,
000
MO
1601
$0$4
6,90
0$0
$0$0
$0$0
$0$4
,100
$0$0
$0$5
1,00
0M
O16
03$3
00,0
00$0
$0$0
$0$0
$0$7
5,00
0$1
34,6
00$0
$538
,400
$0$1
,048
,000
MO
1604
$0$9
80,1
00$0
$0$0
$0$0
$0$1
08,9
00$0
$0$0
$1,0
89,0
00M
O16
05$0
$0$0
$0$0
$0$0
$0$3
7,80
0$0
$151
,200
$0$1
89,0
00M
O17
05$0
$0$0
$0$0
$0$0
$0$4
00$0
$1,6
00$0
$2,0
00N
X09
06$1
,307
,001
$0$0
$0$0
$0$0
$326
,750
$344
,200
$0$1
,376
,800
$0$3
,354
,751
OK
1401
$0$0
$0$0
$0$0
$0$0
$400
$0$1
,600
$0$2
,000
RG
0901
$0$0
$0$0
$0$0
$0$0
$400
$0$1
,600
$0$2
,000
RG
1201
$0$0
$0$0
$0$0
$0$0
$1,4
00$0
$5,6
00$0
$7,0
00R
P14
01$0
$0$0
$0$0
$0$0
$0$4
1,00
0$0
$164
,000
$0$2
05,0
00S
P10
18$0
$0$4
,726
,400
$0$0
$0$0
$0$1
,181
,600
$0$0
$0$5
,908
,000
SP
1106
$0$0
$0$0
$0$0
$0$0
$400
$0$1
,600
$0$2
,000
SP
1112
$0$0
$0$0
$0$0
$0$0
$16,
000
$0$6
4,00
0$0
$80,
000
SP
1204
$0$0
$0$0
$0$0
$0$0
$400
$0$1
,600
$0$2
,000
SP
1321
$10,
000
$0$0
$0$0
$0$0
$3,9
84$0
$0$0
$0$1
3,98
4S
P13
23$6
81,0
00$0
$0$0
$0$0
$0$1
72,0
00$1
56,6
00$0
$626
,400
$0$1
,636
,000
SP
1401
$0$0
$0$0
$0$0
$0$0
$5,2
00$0
$20,
800
$0$2
6,00
0S
P14
05$0
$0$0
$0$0
$0$0
$0$4
00$0
$1,6
00$0
$2,0
00S
P14
09$0
$0$0
$0$0
$0$0
$0$9
96,4
00$0
$8,9
67,6
00$0
$9,9
64,0
00S
P14
10$0
$0$0
$0$0
$0$0
$0$1
,833
,000
$0$7
,332
,000
$0$9
,165
,000
SP
1415
$734
,000
$0$0
$0$0
$0$0
$184
,000
$74,
000
$0$2
98,0
00$0
$1,2
90,0
00W
I130
1$0
$0$0
$0$0
$0$0
$0$1
0,00
0$0
$40,
000
$0$5
0,00
0S
UB
TO
TA
L$4
,232
,001
$1,0
29,7
00$4
,726
,400
$0$1
28,0
00$0
$320
,000
$1,1
41,7
34$5
,237
,900
$32,
000
$19,
620,
000
$0$3
6,46
7,73
5
FY
201
5 co
nti
nu
ed
FY
201
6
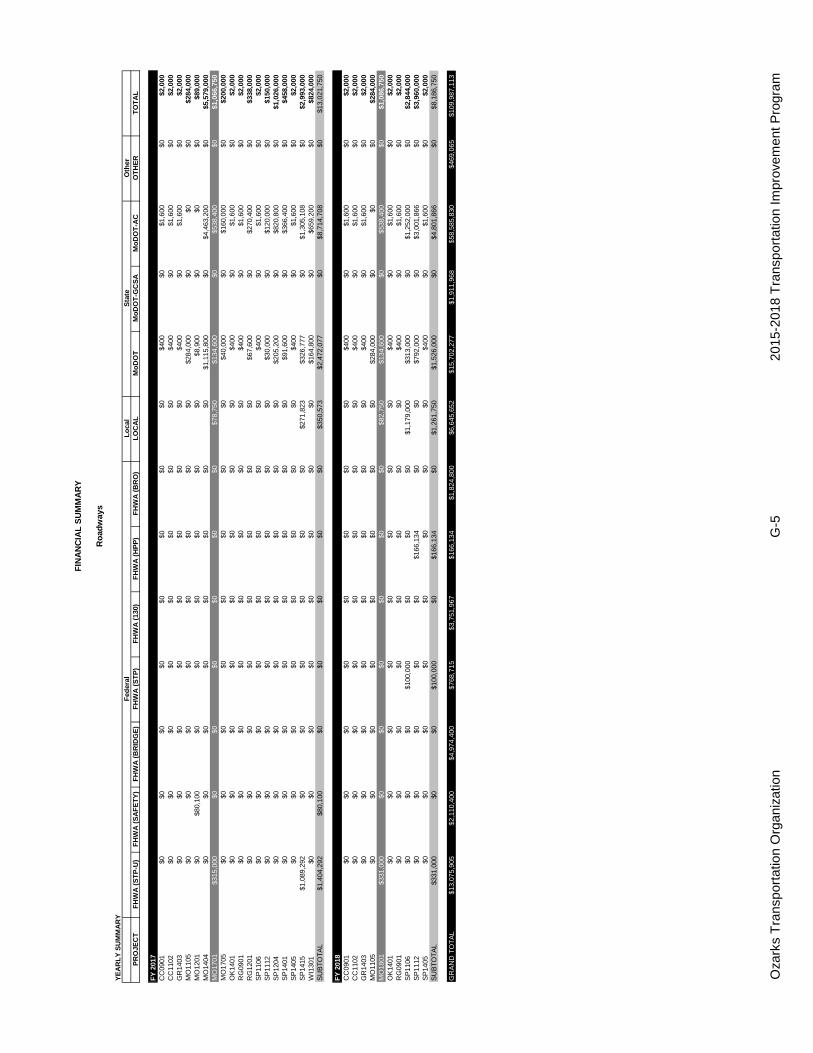
Oza
rks
Tra
nspo
rtat
ion
Org
aniz
atio
nG
-520
15-2
018
Tra
nspo
rtat
ion
Impr
ovem
ent P
rogr
am
YE
AR
LY
SU
MM
AR
YL
oca
lO
ther
PR
OJE
CT
FH
WA
(S
TP
-U)
FH
WA
(S
AF
ET
Y)
FH
WA
(B
RID
GE
)F
HW
A (
ST
P)
FH
WA
(13
0)F
HW
A (
HP
P)
FH
WA
(B
RO
)L
OC
AL
Mo
DO
TM
oD
OT
-GC
SA
Mo
DO
T-A
CO
TH
ER
TO
TA
L
FIN
AN
CIA
L S
UM
MA
RY
Ro
adw
ays
Fed
eral
Sta
te
CC
0901
$0$0
$0$0
$0$0
$0$0
$400
$0$1
,600
$0$2
,000
CC
1102
$0$0
$0$0
$0$0
$0$0
$400
$0$1
,600
$0$2
,000
GR
1403
$0$0
$0$0
$0$0
$0$0
$400
$0$1
,600
$0$2
,000
MO
1105
$0$0
$0$0
$0$0
$0$0
$284
,000
$0$0
$0$2
84,0
00M
O12
01$0
$80,
100
$0$0
$0$0
$0$0
$8,9
00$0
$0$0
$89,
000
MO
1404
$0$0
$0$0
$0$0
$0$0
$1,1
15,8
00$0
$4,4
63,2
00$0
$5,5
79,0
00M
O17
01$3
15,0
00$0
$0$0
$0$0
$0$7
8,75
0$1
34,6
00$0
$538
,400
$0$1
,066
,750
MO
1705
$0$0
$0$0
$0$0
$0$0
$40,
000
$0$1
60,0
00$0
$200
,000
OK
1401
$0$0
$0$0
$0$0
$0$0
$400
$0$1
,600
$0$2
,000
RG
0901
$0$0
$0$0
$0$0
$0$0
$400
$0$1
,600
$0$2
,000
RG
1201
$0$0
$0$0
$0$0
$0$0
$67,
600
$0$2
70,4
00$0
$338
,000
SP
1106
$0$0
$0$0
$0$0
$0$0
$400
$0$1
,600
$0$2
,000
SP
1112
$0$0
$0$0
$0$0
$0$0
$30,
000
$0$1
20,0
00$0
$150
,000
SP
1204
$0$0
$0$0
$0$0
$0$0
$205
,200
$0$8
20,8
00$0
$1,0
26,0
00S
P14
01$0
$0$0
$0$0
$0$0
$0$9
1,60
0$0
$366
,400
$0$4
58,0
00S
P14
05$0
$0$0
$0$0
$0$0
$0$4
00$0
$1,6
00$0
$2,0
00S
P14
15$1
,089
,292
$0$0
$0$0
$0$0
$271
,823
$326
,777
$0$1
,305
,108
$0$2
,993
,000
WI1
301
$0$0
$0$0
$0$0
$0$0
$164
,800
$0$6
59,2
00$0
$824
,000
SU
BT
OT
AL
$1,4
04,2
92$8
0,10
0$0
$0$0
$0$0
$350
,573
$2,4
72,0
77$0
$8,7
14,7
08$0
$13,
021,
750
CC
0901
$0$0
$0$0
$0$0
$0$0
$400
$0$1
,600
$0$2
,000
CC
1102
$0$0
$0$0
$0$0
$0$0
$400
$0$1
,600
$0$2
,000
GR
1403
$0$0
$0$0
$0$0
$0$0
$400
$0$1
,600
$0$2
,000
MO
1105
$0$0
$0$0
$0$0
$0$0
$284
,000
$0$0
$0$2
84,0
00M
O18
01$3
31,0
00$0
$0$0
$0$0
$0$8
2,75
0$1
34,6
00$0
$538
,400
$0$1
,086
,750
OK
1401
$0$0
$0$0
$0$0
$0$0
$400
$0$1
,600
$0$2
,000
RG
0901
$0$0
$0$0
$0$0
$0$0
$400
$0$1
,600
$0$2
,000
SP
1106
$0$0
$0$1
00,0
00$0
$0$0
$1,1
79,0
00$3
13,0
00$0
$1,2
52,0
00$0
$2,8
44,0
00S
P11
12$0
$0$0
$0$0
$166
,134
$0$0
$792
,000
$0$3
,001
,866
$0$3
,960
,000
SP
1405
$0$0
$0$0
$0$0
$0$0
$400
$0$1
,600
$0$2
,000
SU
BT
OT
AL
$331
,000
$0$0
$100
,000
$0$1
66,1
34$0
$1,2
61,7
50$1
,526
,000
$0$4
,801
,866
$0$8
,186
,750
GR
AN
D T
OT
AL
$13,
075,
905
$2,1
10,4
00$4
,974
,400
$768
,715
$3,7
51,9
67$1
66,1
34$1
,824
,800
$6,6
45,6
52$1
5,70
2,27
7$1
,911
,968
$58,
585,
830
$469
,065
$109
,987
,113
FY
201
7
FY
201
8
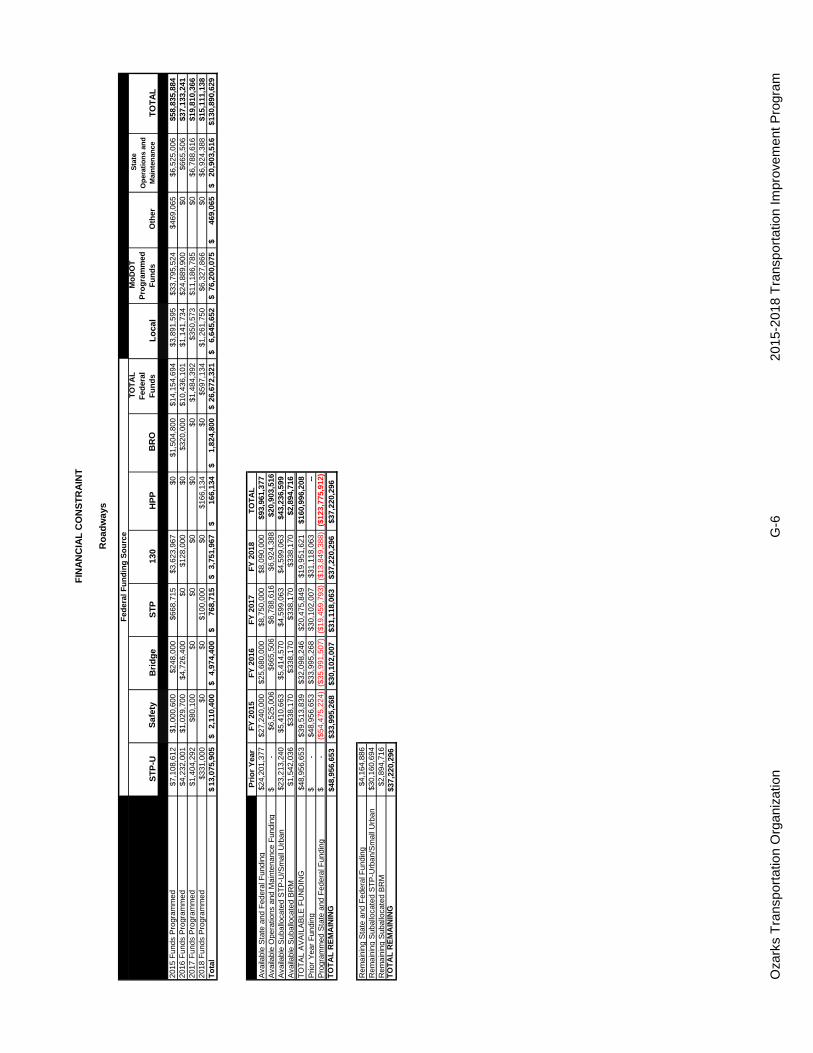
Oza
rks
Tra
nspo
rtat
ion
Org
aniz
atio
nG
-620
15-2
018
Tra
nspo
rtat
ion
Impr
ovem
ent P
rogr
am
ST
P-U
Saf
ety
Bri
dg
eS
TP
130
HP
P B
RO
TO
TA
L
Fed
eral
F
un
ds
Lo
cal
Mo
DO
T
Pro
gra
mm
ed
Fu
nd
s O
ther
Sta
te
Op
erat
ion
s an
d
Mai
nte
nan
ce
TO
TA
L20
0920
15 F
unds
Pro
gram
med
$7,1
08,6
12$1
,000
,600
$248
,000
$668
,715
$3,6
23,9
67$0
$1,5
04,8
00$1
4,15
4,69
4$3
,891
,595
$33,
795,
524
$469
,065
$6,5
25,0
06$5
8,83
5,88
420
16 F
unds
Pro
gram
med
$4,2
32,0
01$1
,029
,700
$4,7
26,4
00$0
$128
,000
$0$3
20,0
00$1
0,43
6,10
1$1
,141
,734
$24,
889,
900
$0$6
65,5
06$3
7,13
3,24
120
17 F
unds
Pro
gram
med
$1,4
04,2
92$8
0,10
0$0
$0$0
$0$0
$1,4
84,3
92$3
50,5
73$1
1,18
6,78
5$0
$6,7
88,6
16$1
9,81
0,36
620
18 F
unds
Pro
gram
med
$331
,000
$0$0
$100
,000
$0$1
66,1
34$0
$597
,134
$1,2
61,7
50$6
,327
,866
$0$6
,924
,388
$15,
111,
138
To
tal
13,0
75,9
05$
2,11
0,40
0$
4,
974,
400
$
768,
715
$
3,75
1,96
7$
16
6,13
4$
1,82
4,80
0$
26,6
72,3
21$
6,
645,
652
$
76
,200
,075
$
469,
065
$
20,9
03,5
16$
$130
,890
, 629
Pri
or
Yea
rF
Y 2
015
FY
201
6F
Y 2
017
FY
201
8T
OT
AL
Ava
ilabl
e S
tate
and
Fed
eral
Fun
ding
$24,
201,
377
$27,
240,
000
$25,
680,
000
$8,7
50,0
00$8
,090
,000
$93,
961,
377
Ava
ilabl
e O
pera
tions
and
Mai
nten
ance
Fun
ding
-$
$6
,525
,006
$665
,506
$6,7
88,6
16$6
,924
,388
$20,
903,
516
Ava
ilabl
e S
ubal
loca
ted
ST
P-U
/Sm
all U
rban
$23,
213,
240
$5,4
10,6
63$5
,414
,570
$4,5
99,0
63$4
,599
,063
$43,
236,
599
Ava
ilabl
e S
ubal
loca
ted
BR
M$1
,542
,036
$338
,170
$338
,170
$338
,170
$338
,170
$2,8
94,7
16T
OT
AL
AV
AIL
AB
LE F
UN
DIN
G$4
8,95
6,65
3$3
9,51
3,83
9$3
2,09
8,24
6$2
0,47
5,84
9$1
9,95
1,62
1$1
60,9
96,2
08P
rior
Yea
r F
undi
ng-
$
$48,
956,
653
$33,
995,
268
$30,
102,
007
$31,
118,
063
--P
rogr
amm
ed S
tate
and
Fed
eral
Fun
ding
-$
($
54,4
75,2
24)
($35
,991
,507
)($
19,4
59,7
93)
($13
,849
,388
)($
123,
775,
912)
TO
TA
L R
EM
AIN
ING
$48,
956,
653
$33,
995,
268
$30,
102,
007
$31,
118,
063
$37,
220,
296
$37,
220,
296
Rem
aini
ng S
tate
and
Fed
eral
Fun
ding
$4,1
64,8
86R
emai
ning
Sub
allo
cate
d S
TP
-Urb
an/S
mal
l Urb
an$3
0,16
0,69
4R
emai
ning
Sub
allo
cate
d B
RM
$2,8
94,7
16T
OT
AL
RE
MA
ININ
G$3
7,22
0,29
6
Fed
eral
Fu
nd
ing
So
urc
e
FIN
AN
CIA
L C
ON
ST
RA
INT
Ro
ad
wa
ys

TAB 5
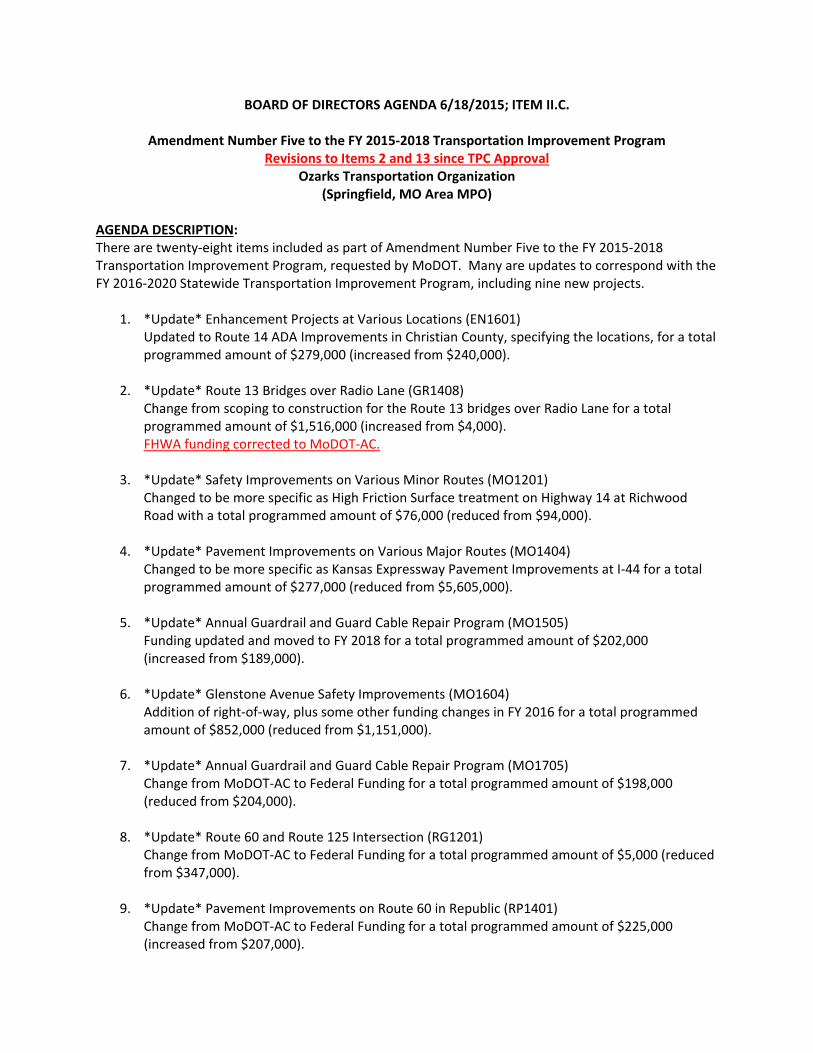
BOARD OF DIRECTORS AGENDA 6/18/2015; ITEM II.C.
Amendment Number Five to the FY 2015‐2018 Transportation Improvement Program Revisions to Items 2 and 13 since TPC Approval
Ozarks Transportation Organization (Springfield, MO Area MPO)
AGENDA DESCRIPTION: There are twenty‐eight items included as part of Amendment Number Five to the FY 2015‐2018 Transportation Improvement Program, requested by MoDOT. Many are updates to correspond with the FY 2016‐2020 Statewide Transportation Improvement Program, including nine new projects.
1. *Update* Enhancement Projects at Various Locations (EN1601) Updated to Route 14 ADA Improvements in Christian County, specifying the locations, for a total programmed amount of $279,000 (increased from $240,000).
2. *Update* Route 13 Bridges over Radio Lane (GR1408) Change from scoping to construction for the Route 13 bridges over Radio Lane for a total programmed amount of $1,516,000 (increased from $4,000). FHWA funding corrected to MoDOT‐AC.
3. *Update* Safety Improvements on Various Minor Routes (MO1201) Changed to be more specific as High Friction Surface treatment on Highway 14 at Richwood Road with a total programmed amount of $76,000 (reduced from $94,000).
4. *Update* Pavement Improvements on Various Major Routes (MO1404)
Changed to be more specific as Kansas Expressway Pavement Improvements at I‐44 for a total programmed amount of $277,000 (reduced from $5,605,000).
5. *Update* Annual Guardrail and Guard Cable Repair Program (MO1505)
Funding updated and moved to FY 2018 for a total programmed amount of $202,000 (increased from $189,000).
6. *Update* Glenstone Avenue Safety Improvements (MO1604)
Addition of right‐of‐way, plus some other funding changes in FY 2016 for a total programmed amount of $852,000 (reduced from $1,151,000).
7. *Update* Annual Guardrail and Guard Cable Repair Program (MO1705)
Change from MoDOT‐AC to Federal Funding for a total programmed amount of $198,000 (reduced from $204,000).
8. *Update* Route 60 and Route 125 Intersection (RG1201)
Change from MoDOT‐AC to Federal Funding for a total programmed amount of $5,000 (reduced from $347,000).
9. *Update* Pavement Improvements on Route 60 in Republic (RP1401)
Change from MoDOT‐AC to Federal Funding for a total programmed amount of $225,000 (increased from $207,000).
10. *Update* Eastgate Avenue Relocation (SP1106) Change in funding categories and funding amounts for a total programmed amount of $2,775,800 (reduced from $2,853,000).
11. *Update* Route 65 Southbound Bridge over I‐44 (SP1112)
Change in funding categories and a reduction in total estimated cost for a programmed amount of $3,971,000 (reduced from $4,192,000).
12. *Update* Evans Road Bridge over Route 65 (SP1204) Change from MoDOT‐AC to Federal Funding for a total programmed amount of $941,800 (reduced from $1,030,000).
13. *Update* Intersection Improvements at Kearney Street and Packer Avenue (SP1323)
Change in funding categories and a reduction in total estimated cost for a programmed amount of $2,547,096 (reduced from 1,852,000). Funding corrected from FHWA to MoDOT‐AC.
14. *Update* Signal Replacement Program 0 Kansas Expressway (SP1401)
Change from MoDOT‐AC to Federal Funding for a total programmed amount of $537,000 (increased from $489,000).
15. *Update* Payment for Traffic Sensing Equipment at Various Locations (SP1403)
Change from MoDOT‐AC to Federal Funding for a total programmed amount of $602,000 (increased from $601,000).
16. *Update* I‐44 Pavement Improvements (SP1409)
Change from MoDOT‐AC to Federal Funding for a total programmed amount of $8,423,000 (decreased from $10,037,000).
17. *Update* Route 65 Improvements (SP1410)
Update in cost estimates for a total programmed amount of $14,716,000 (increased from $9,365,000).
18. *Update* Route 65 and Division Street Interchange (SP1415)
Change in funding categories and an increase in total estimated cost for a programmed amount of $4,483,000 (reduced from $4,397,000).
19. *Update* Willard Intersection Improvements (WI1301)
Change in funding categories and a reduction in total estimated cost for a programmed amount of $859,000 (reduced from $879,000).
20. *New* I‐44 Pavement Improvements East of Strafford (GR1602)
Pavement improvements on disconnected sections of I‐44 from 0.5 mile east of Rte. 125 to the Webster County line for a total programmed amount of $575,000.
21. *New* I‐44 Pavement Repair (MO1606)
Job Order Contracting for I‐44 pavement repair in the Ozarks Transportation Organization area for a total programmed amount of $216,000.
22. *New* Resurfacing on Various Primary Routes (MO1607) Pavement improvements on primary routes in the OTO area for a total programmed amount of $51,000.
23. *New* Annual On‐Call Work Zone Enforcement Program (MO1608)
On‐call work zone enforcement in the OTO area for a total programmed amount of $45,000.
24. *New* Scoping for Bridge Improvements (MO1609) Scoping for bridge improvements in the OTO area for a total programmed amount of $30,000.
25. *New* Scoping for Various Safety Improvements (MO1610) Scoping for safety improvements at various locations in the OTO area for a total programmed amount of $30,000.
26. *New* Scoping for Resurfacing on Various Primary Routes (MO1611) Scoping for pavement improvements on primary routes in the OTO area for a total programmed amount of $30,000.
27. *New* James River Freeway Pavement Improvements (SP1601)
Pavement improvements from Route 13 to 0.7 miles west of Route 65 on Springfield for a total programmed amount of $352,000.
28. *New* Route 65 Pavement Improvements in Springfield (SP1602)
Route 65 pavement improvements from north of Valley Water Mill to Route 60 for a total programmed amount of $8,673,000.
TECHNICAL PLANNING COMMITTEE ACTION TAKEN:
At its May 20, 2015 meeting, the Technical Planning Committee unanimously approved the following motion: “Move to recommend that the Board of Directors approve Amendment 5 to the FY 2015‐2018 Transportation Improvement Program.”
BOARD OF DIRECTORS ACTION REQUESTED:
That a member of the Board of Directors make one of the following motions: “Move to approve Amendment 5 to the FY 2015‐2018 Transportation Improvement Program.” OR “Move to return Amendment 5 to the FY 2015‐2018 Transportation Improvement Program to the Technical Planning Committee to consider…”

D) Bicycle & Pedestrian Section
Transportation Improvement Program - FY 2015-2018 Project Detail by Section and Project Number with Map
FY 2015-2018 Administrative Modification 5 5/11/2015D-1
TIP # EN1601RouteFromToLocation/AgencyFederal AgencyResponsible AgencyFederal Funding CategoryMoDOT Funding CategoryAC Year of Conv.STIP #
Project Description
NotesPrior CostFuture CostTotal Cost
ENHANCEMENT PROJECTS AT VARIOUS LOCATIONSVarious
MoDOTSTP/TETaking Care of the System
0P3011I
Enhancement projects at various locations in the OTO area.
$240,000 Statewide Transportation Enhancement funds. $0$0$240,000
Fund Code Source Phase FY2015 FY2016 FY2017 FY2018 TotalFHWA (TE) Federal CON $0 $192,000 $0 $0 $192,000MoDOT State CON $0 $48,000 $0 $0 $48,000Totals $0 $240,000 $0 $0 $240,000
ORIGIN
AL
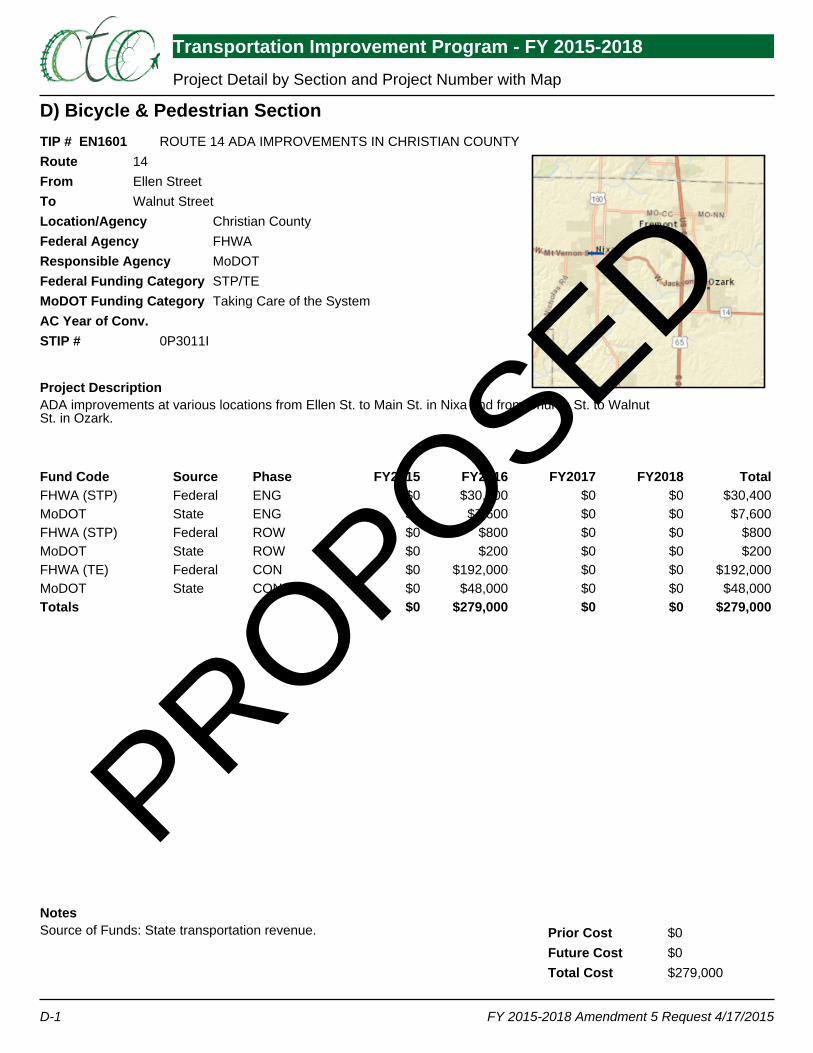
D) Bicycle & Pedestrian Section
Transportation Improvement Program - FY 2015-2018 Project Detail by Section and Project Number with Map
FY 2015-2018 Amendment 5 Request 4/17/2015D-1
TIP # EN1601RouteFromToLocation/AgencyFederal AgencyResponsible AgencyFederal Funding CategoryMoDOT Funding CategoryAC Year of Conv.STIP #
Project Description
NotesPrior CostFuture CostTotal Cost
ROUTE 14 ADA IMPROVEMENTS IN CHRISTIAN COUNTY14Ellen StreetWalnut Street
Christian CountyFHWAMoDOTSTP/TETaking Care of the System
0P3011I
ADA improvements at various locations from Ellen St. to Main St. in Nixa and from Church St. to WalnutSt. in Ozark.
Source of Funds: State transportation revenue. $0$0$279,000
Fund Code Source Phase FY2015 FY2016 FY2017 FY2018 TotalFHWA (STP) Federal ENG $0 $30,400 $0 $0 $30,400MoDOT State ENG $0 $7,600 $0 $0 $7,600FHWA (STP) Federal ROW $0 $800 $0 $0 $800MoDOT State ROW $0 $200 $0 $0 $200FHWA (TE) Federal CON $0 $192,000 $0 $0 $192,000MoDOT State CON $0 $48,000 $0 $0 $48,000Totals $0 $279,000 $0 $0 $279,000
PROPOSED
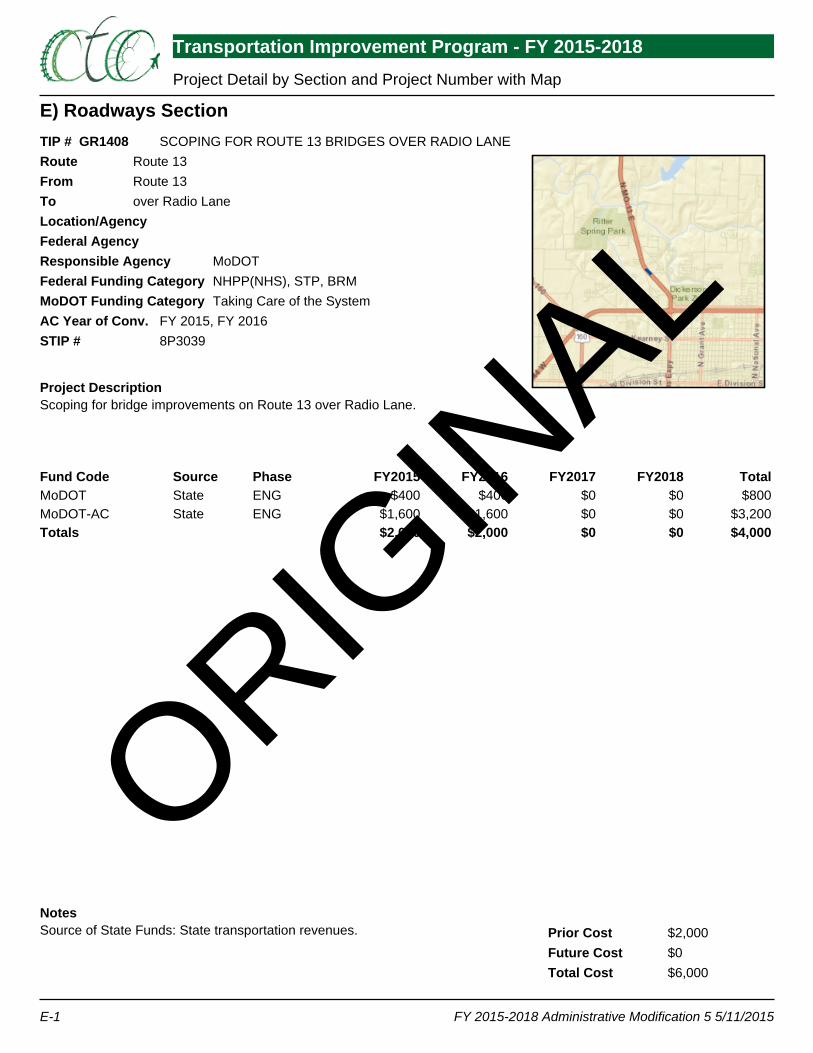
E) Roadways Section
Transportation Improvement Program - FY 2015-2018 Project Detail by Section and Project Number with Map
FY 2015-2018 Administrative Modification 5 5/11/2015E-1
TIP # GR1408RouteFromToLocation/AgencyFederal AgencyResponsible AgencyFederal Funding CategoryMoDOT Funding CategoryAC Year of Conv.STIP #
Project Description
NotesPrior CostFuture CostTotal Cost
SCOPING FOR ROUTE 13 BRIDGES OVER RADIO LANERoute 13Route 13over Radio Lane
MoDOTNHPP(NHS), STP, BRMTaking Care of the System
FY 2015, FY 20168P3039
Scoping for bridge improvements on Route 13 over Radio Lane.
Source of State Funds: State transportation revenues. $2,000$0$6,000
Fund Code Source Phase FY2015 FY2016 FY2017 FY2018 TotalMoDOT State ENG $400 $400 $0 $0 $800MoDOT-AC State ENG $1,600 $1,600 $0 $0 $3,200Totals $2,000 $2,000 $0 $0 $4,000
ORIGIN
AL

E) Roadways Section
Transportation Improvement Program - FY 2015-2018 Project Detail by Section and Project Number with Map
FY 2015-2018 Amendment 5 Request 4/17/2015E-1
TIP # GR1408RouteFromToLocation/AgencyFederal AgencyResponsible AgencyFederal Funding CategoryMoDOT Funding CategoryAC Year of Conv.STIP #
Project Description
NotesPrior CostFuture CostTotal Cost
ROUTE 13 BRIDGES OVER RADIO LANERoute 13Route 13over Radio Lane
Greene CountyFHWAMoDOTNHPP(Bridge)Taking Care of the System
FY 2015, FY 2016, FY 20178P3039
Bridge improvements on Route 13 over Radio Lane.
Source of State Funds: State transportation revenues. $2,000$0$1,518,000
Fund Code Source Phase FY2015 FY2016 FY2017 FY2018 TotalFHWA Federal ENG $0 $150,400 $0 $0 $150,400MoDOT State ENG $400 $37,600 $0 $0 $38,000MoDOT-AC State ENG $1,600 $0 $0 $0 $1,600MoDOT State CON $0 $265,200 $0 $0 $265,200MoDOT-AC State CON $0 $1,060,800 $0 $0 $1,060,800Totals $2,000 $1,514,000 $0 $0 $1,516,000
PROPOSED
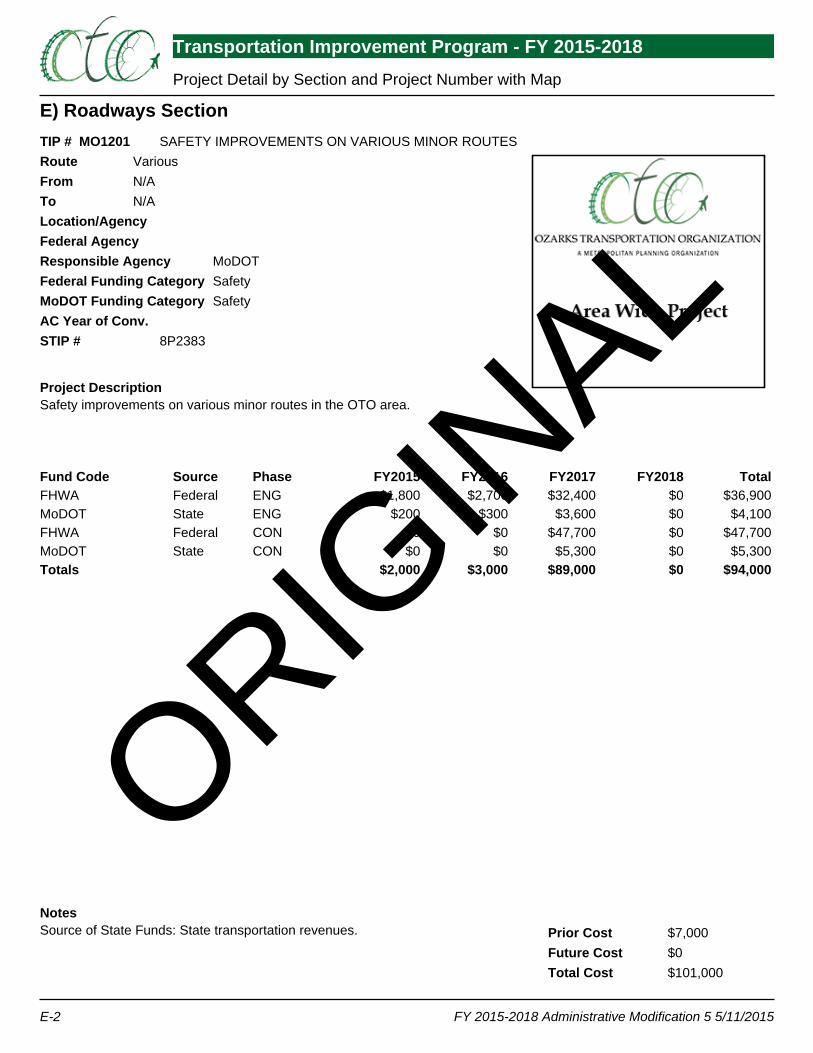
E) Roadways Section
Transportation Improvement Program - FY 2015-2018 Project Detail by Section and Project Number with Map
FY 2015-2018 Administrative Modification 5 5/11/2015E-2
TIP # MO1201RouteFromToLocation/AgencyFederal AgencyResponsible AgencyFederal Funding CategoryMoDOT Funding CategoryAC Year of Conv.STIP #
Project Description
NotesPrior CostFuture CostTotal Cost
SAFETY IMPROVEMENTS ON VARIOUS MINOR ROUTESVariousN/AN/A
MoDOTSafetySafety
8P2383
Safety improvements on various minor routes in the OTO area.
Source of State Funds: State transportation revenues. $7,000$0$101,000
Fund Code Source Phase FY2015 FY2016 FY2017 FY2018 TotalFHWA Federal ENG $1,800 $2,700 $32,400 $0 $36,900MoDOT State ENG $200 $300 $3,600 $0 $4,100FHWA Federal CON $0 $0 $47,700 $0 $47,700MoDOT State CON $0 $0 $5,300 $0 $5,300Totals $2,000 $3,000 $89,000 $0 $94,000
ORIGIN
AL
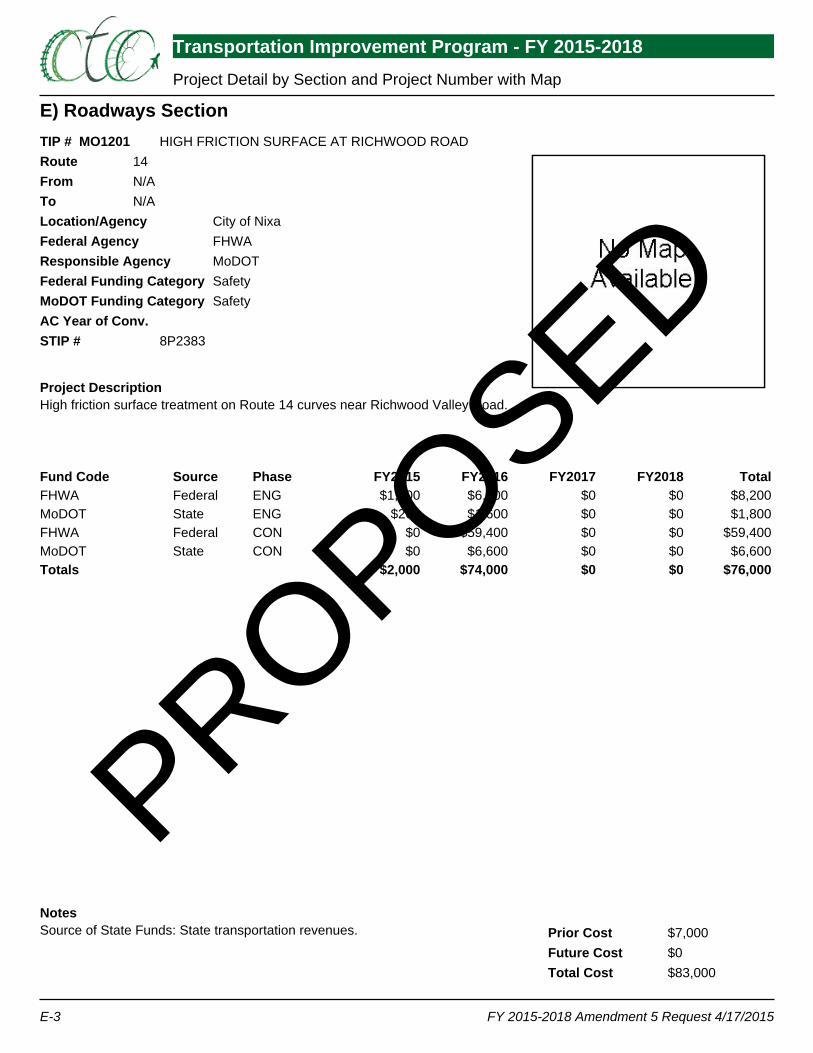
E) Roadways Section
Transportation Improvement Program - FY 2015-2018 Project Detail by Section and Project Number with Map
FY 2015-2018 Amendment 5 Request 4/17/2015E-3
TIP # MO1201RouteFromToLocation/AgencyFederal AgencyResponsible AgencyFederal Funding CategoryMoDOT Funding CategoryAC Year of Conv.STIP #
Project Description
NotesPrior CostFuture CostTotal Cost
HIGH FRICTION SURFACE AT RICHWOOD ROAD14N/AN/A
City of NixaFHWAMoDOTSafetySafety
8P2383
High friction surface treatment on Route 14 curves near Richwood Valley Road.
Source of State Funds: State transportation revenues. $7,000$0$83,000
Fund Code Source Phase FY2015 FY2016 FY2017 FY2018 TotalFHWA Federal ENG $1,800 $6,400 $0 $0 $8,200MoDOT State ENG $200 $1,600 $0 $0 $1,800FHWA Federal CON $0 $59,400 $0 $0 $59,400MoDOT State CON $0 $6,600 $0 $0 $6,600Totals $2,000 $74,000 $0 $0 $76,000
PROPOSED

E) Roadways Section
Transportation Improvement Program - FY 2015-2018 Project Detail by Section and Project Number with Map
FY 2015-2018 Administrative Modification 5 5/11/2015E-3
TIP # MO1404RouteFromToLocation/AgencyFederal AgencyResponsible AgencyFederal Funding CategoryMoDOT Funding CategoryAC Year of Conv.STIP #
Project Description
NotesPrior CostFuture CostTotal Cost
PAVEMENT IMPROVEMENTS ON VARIOUS MAJOR ROUTESVariousN/AN/A
MoDOTNHPP(NHS)Taking Care of the System
FY 2017, 20188P3035
Pavement improvements on various major routes in the OTO area.
Source of State Funds: State transportation revenues. $2,000$0$5,607,000
Fund Code Source Phase FY2015 FY2016 FY2017 FY2018 TotalMoDOT State ENG $400 $4,800 $44,600 $0 $49,800MoDOT-AC State ENG $1,600 $19,200 $178,400 $0 $199,200MoDOT State CON $0 $0 $1,071,200 $0 $1,071,200MoDOT-AC State CON $0 $0 $4,284,800 $0 $4,284,800Totals $2,000 $24,000 $5,579,000 $0 $5,605,000
ORIGIN
AL
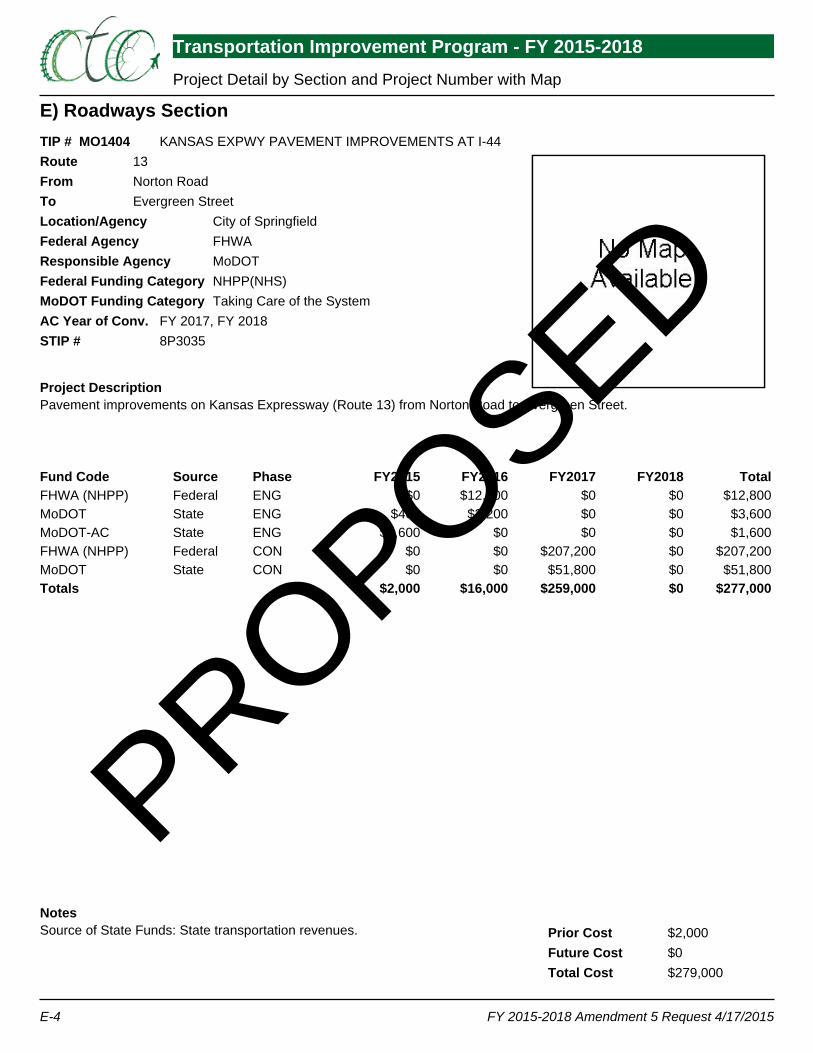
E) Roadways Section
Transportation Improvement Program - FY 2015-2018 Project Detail by Section and Project Number with Map
FY 2015-2018 Amendment 5 Request 4/17/2015E-4
TIP # MO1404RouteFromToLocation/AgencyFederal AgencyResponsible AgencyFederal Funding CategoryMoDOT Funding CategoryAC Year of Conv.STIP #
Project Description
NotesPrior CostFuture CostTotal Cost
KANSAS EXPWY PAVEMENT IMPROVEMENTS AT I-4413Norton RoadEvergreen Street
City of SpringfieldFHWAMoDOTNHPP(NHS)Taking Care of the System
FY 2017, FY 20188P3035
Pavement improvements on Kansas Expressway (Route 13) from Norton Road to Evergreen Street.
Source of State Funds: State transportation revenues. $2,000$0$279,000
Fund Code Source Phase FY2015 FY2016 FY2017 FY2018 TotalFHWA (NHPP) Federal ENG $0 $12,800 $0 $0 $12,800MoDOT State ENG $400 $3,200 $0 $0 $3,600MoDOT-AC State ENG $1,600 $0 $0 $0 $1,600FHWA (NHPP) Federal CON $0 $0 $207,200 $0 $207,200MoDOT State CON $0 $0 $51,800 $0 $51,800Totals $2,000 $16,000 $259,000 $0 $277,000
PROPOSED

E) Roadways Section
Transportation Improvement Program - FY 2015-2018 Project Detail by Section and Project Number with Map
FY 2015-2018 Administrative Modification 5 5/11/2015E-4
TIP # MO1505RouteFromToLocation/AgencyFederal AgencyResponsible AgencyFederal Funding CategoryMoDOT Funding CategoryAC Year of Conv.STIP #
Project Description
NotesPrior CostFuture CostTotal Cost
ANNUAL GUARDRAIL AND GUARD CABLE REPAIR PROGRAMVariousVariousVarious
MoDOTSTPTaking Care of the System
FY 20178P2243
Job order contracting for guardrail and guard cable repair in OTO area.
Source of State Funds: State transportation revenues. Split from MO1150. $4,000$0$193,000
Fund Code Source Phase FY2015 FY2016 FY2017 FY2018 TotalMoDOT State ENG $2,800 $0 $0 $0 $2,800MoDOT-AC State ENG $11,200 $0 $0 $0 $11,200MoDOT State CON $35,000 $0 $0 $0 $35,000MoDOT-AC State CON $140,000 $0 $0 $0 $140,000Totals $189,000 $0 $0 $0 $189,000
ORIGIN
AL
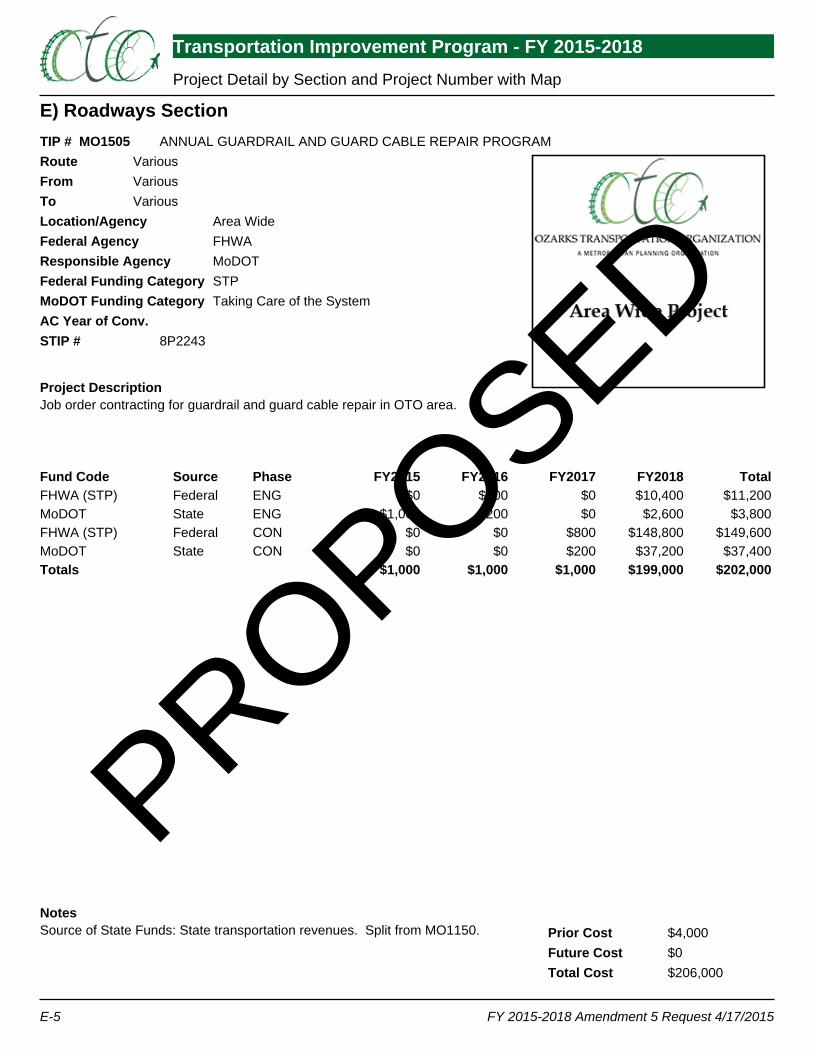
E) Roadways Section
Transportation Improvement Program - FY 2015-2018 Project Detail by Section and Project Number with Map
FY 2015-2018 Amendment 5 Request 4/17/2015E-5
TIP # MO1505RouteFromToLocation/AgencyFederal AgencyResponsible AgencyFederal Funding CategoryMoDOT Funding CategoryAC Year of Conv.STIP #
Project Description
NotesPrior CostFuture CostTotal Cost
ANNUAL GUARDRAIL AND GUARD CABLE REPAIR PROGRAMVariousVariousVarious
Area WideFHWAMoDOTSTPTaking Care of the System
8P2243
Job order contracting for guardrail and guard cable repair in OTO area.
Source of State Funds: State transportation revenues. Split from MO1150. $4,000$0$206,000
Fund Code Source Phase FY2015 FY2016 FY2017 FY2018 TotalFHWA (STP) Federal ENG $0 $800 $0 $10,400 $11,200MoDOT State ENG $1,000 $200 $0 $2,600 $3,800FHWA (STP) Federal CON $0 $0 $800 $148,800 $149,600MoDOT State CON $0 $0 $200 $37,200 $37,400Totals $1,000 $1,000 $1,000 $199,000 $202,000
PROPOSED
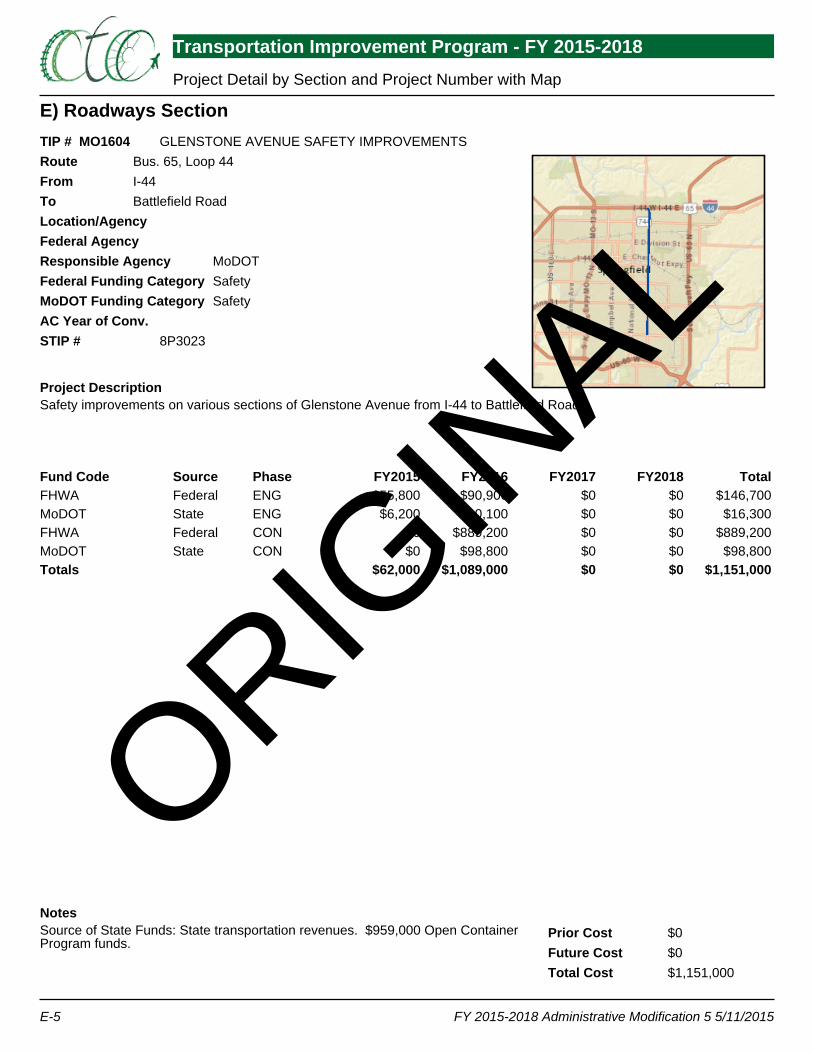
E) Roadways Section
Transportation Improvement Program - FY 2015-2018 Project Detail by Section and Project Number with Map
FY 2015-2018 Administrative Modification 5 5/11/2015E-5
TIP # MO1604RouteFromToLocation/AgencyFederal AgencyResponsible AgencyFederal Funding CategoryMoDOT Funding CategoryAC Year of Conv.STIP #
Project Description
NotesPrior CostFuture CostTotal Cost
GLENSTONE AVENUE SAFETY IMPROVEMENTSBus. 65, Loop 44I-44Battlefield Road
MoDOTSafetySafety
8P3023
Safety improvements on various sections of Glenstone Avenue from I-44 to Battlefield Road.
Source of State Funds: State transportation revenues. $959,000 Open ContainerProgram funds.
$0$0$1,151,000
Fund Code Source Phase FY2015 FY2016 FY2017 FY2018 TotalFHWA Federal ENG $55,800 $90,900 $0 $0 $146,700MoDOT State ENG $6,200 $10,100 $0 $0 $16,300FHWA Federal CON $0 $889,200 $0 $0 $889,200MoDOT State CON $0 $98,800 $0 $0 $98,800Totals $62,000 $1,089,000 $0 $0 $1,151,000
ORIGIN
AL
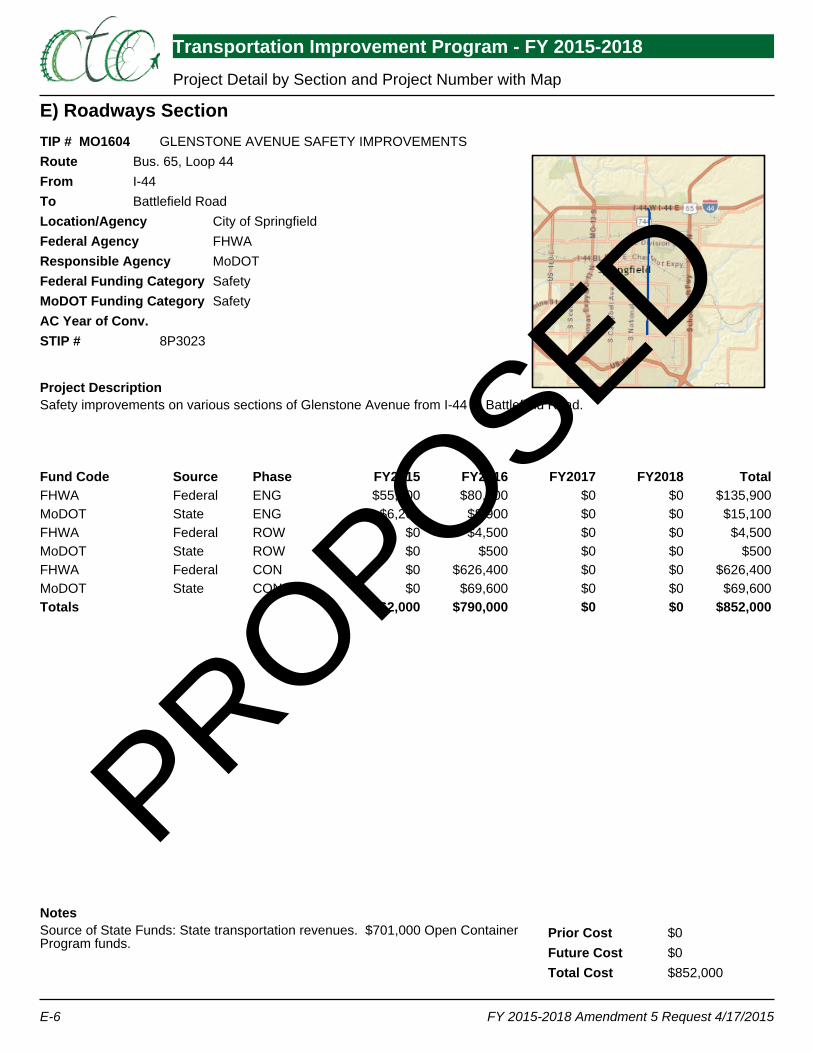
E) Roadways Section
Transportation Improvement Program - FY 2015-2018 Project Detail by Section and Project Number with Map
FY 2015-2018 Amendment 5 Request 4/17/2015E-6
TIP # MO1604RouteFromToLocation/AgencyFederal AgencyResponsible AgencyFederal Funding CategoryMoDOT Funding CategoryAC Year of Conv.STIP #
Project Description
NotesPrior CostFuture CostTotal Cost
GLENSTONE AVENUE SAFETY IMPROVEMENTSBus. 65, Loop 44I-44Battlefield Road
City of SpringfieldFHWAMoDOTSafetySafety
8P3023
Safety improvements on various sections of Glenstone Avenue from I-44 to Battlefield Road.
Source of State Funds: State transportation revenues. $701,000 Open ContainerProgram funds.
$0$0$852,000
Fund Code Source Phase FY2015 FY2016 FY2017 FY2018 TotalFHWA Federal ENG $55,800 $80,100 $0 $0 $135,900MoDOT State ENG $6,200 $8,900 $0 $0 $15,100FHWA Federal ROW $0 $4,500 $0 $0 $4,500MoDOT State ROW $0 $500 $0 $0 $500FHWA Federal CON $0 $626,400 $0 $0 $626,400MoDOT State CON $0 $69,600 $0 $0 $69,600Totals $62,000 $790,000 $0 $0 $852,000
PROPOSED
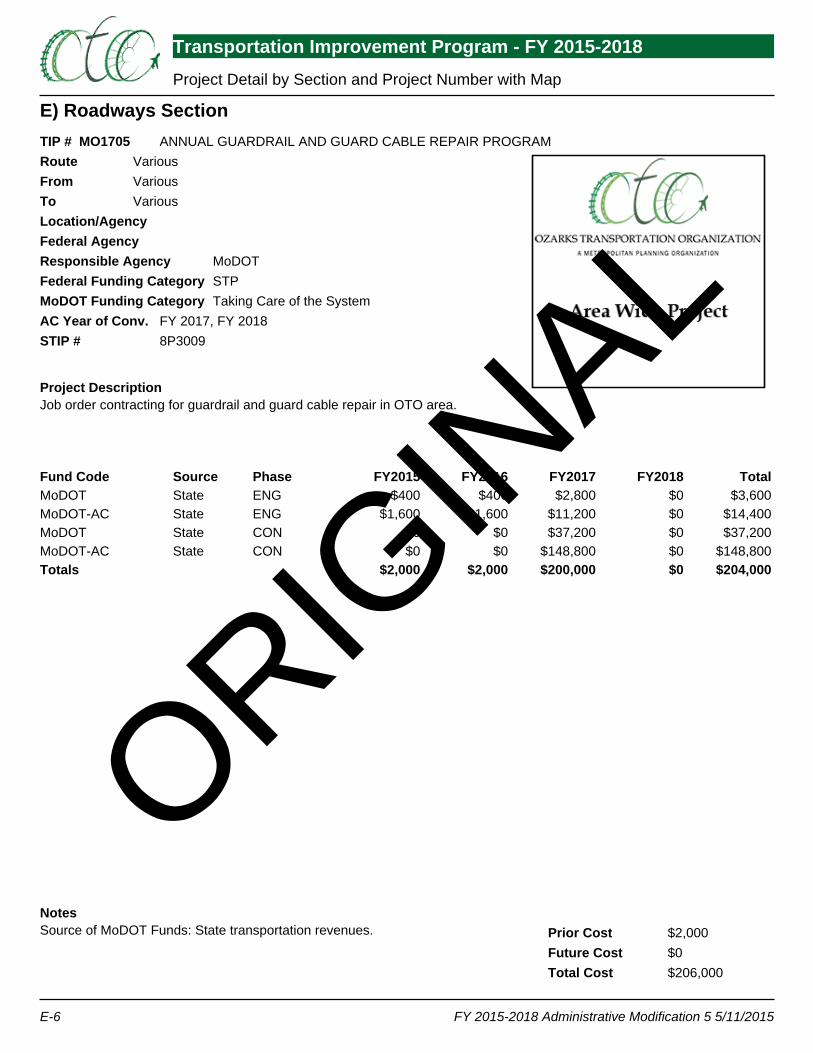
E) Roadways Section
Transportation Improvement Program - FY 2015-2018 Project Detail by Section and Project Number with Map
FY 2015-2018 Administrative Modification 5 5/11/2015E-6
TIP # MO1705RouteFromToLocation/AgencyFederal AgencyResponsible AgencyFederal Funding CategoryMoDOT Funding CategoryAC Year of Conv.STIP #
Project Description
NotesPrior CostFuture CostTotal Cost
ANNUAL GUARDRAIL AND GUARD CABLE REPAIR PROGRAMVariousVariousVarious
MoDOTSTPTaking Care of the System
FY 2017, FY 20188P3009
Job order contracting for guardrail and guard cable repair in OTO area.
Source of MoDOT Funds: State transportation revenues. $2,000$0$206,000
Fund Code Source Phase FY2015 FY2016 FY2017 FY2018 TotalMoDOT State ENG $400 $400 $2,800 $0 $3,600MoDOT-AC State ENG $1,600 $1,600 $11,200 $0 $14,400MoDOT State CON $0 $0 $37,200 $0 $37,200MoDOT-AC State CON $0 $0 $148,800 $0 $148,800Totals $2,000 $2,000 $200,000 $0 $204,000
ORIGIN
AL
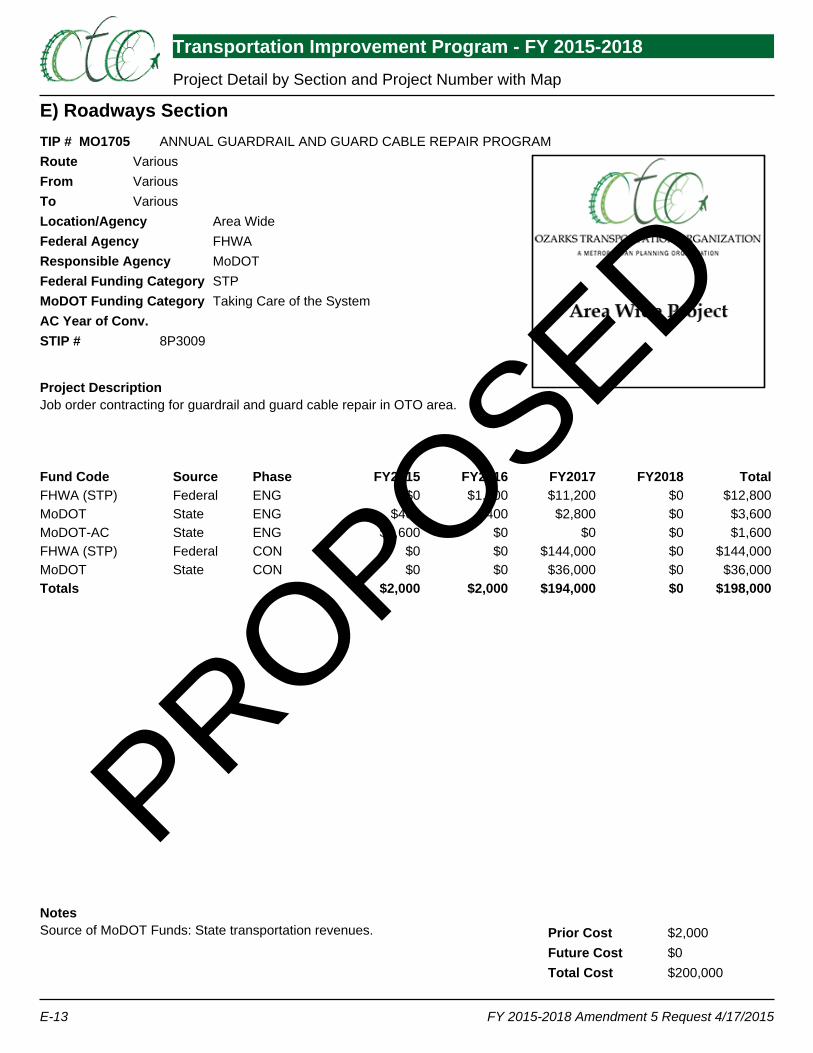
E) Roadways Section
Transportation Improvement Program - FY 2015-2018 Project Detail by Section and Project Number with Map
FY 2015-2018 Amendment 5 Request 4/17/2015E-13
TIP # MO1705RouteFromToLocation/AgencyFederal AgencyResponsible AgencyFederal Funding CategoryMoDOT Funding CategoryAC Year of Conv.STIP #
Project Description
NotesPrior CostFuture CostTotal Cost
ANNUAL GUARDRAIL AND GUARD CABLE REPAIR PROGRAMVariousVariousVarious
Area WideFHWAMoDOTSTPTaking Care of the System
8P3009
Job order contracting for guardrail and guard cable repair in OTO area.
Source of MoDOT Funds: State transportation revenues. $2,000$0$200,000
Fund Code Source Phase FY2015 FY2016 FY2017 FY2018 TotalFHWA (STP) Federal ENG $0 $1,600 $11,200 $0 $12,800MoDOT State ENG $400 $400 $2,800 $0 $3,600MoDOT-AC State ENG $1,600 $0 $0 $0 $1,600FHWA (STP) Federal CON $0 $0 $144,000 $0 $144,000MoDOT State CON $0 $0 $36,000 $0 $36,000Totals $2,000 $2,000 $194,000 $0 $198,000
PROPOSED

E) Roadways Section
Transportation Improvement Program - FY 2015-2018 Project Detail by Section and Project Number with Map
FY 2015-2018 Administrative Modification 5 5/11/2015E-7
TIP # RG1201RouteFromToLocation/AgencyFederal AgencyResponsible AgencyFederal Funding CategoryMoDOT Funding CategoryAC Year of Conv.STIP #
Project Description
NotesPrior CostFuture CostTotal Cost
ROUTE 60 AND ROUTE 125 INTERSECTIONUS 60 and Route 125US 60Route 125
MoDOTNHPP(NHS)Taking Care of the System
FY 2015, FY 2016, FY 20178P2381
Intersection improvements at Route 60 and Route 125 in Rogersville.
Source of State Funds: State transportation revenues. $32,000$0$379,000
Fund Code Source Phase FY2015 FY2016 FY2017 FY2018 TotalMoDOT State ENG $400 $1,400 $4,200 $0 $6,000MoDOT-AC State ENG $1,600 $5,600 $16,800 $0 $24,000MoDOT State CON $0 $0 $63,400 $0 $63,400MoDOT-AC State CON $0 $0 $253,600 $0 $253,600Totals $2,000 $7,000 $338,000 $0 $347,000
ORIGIN
AL
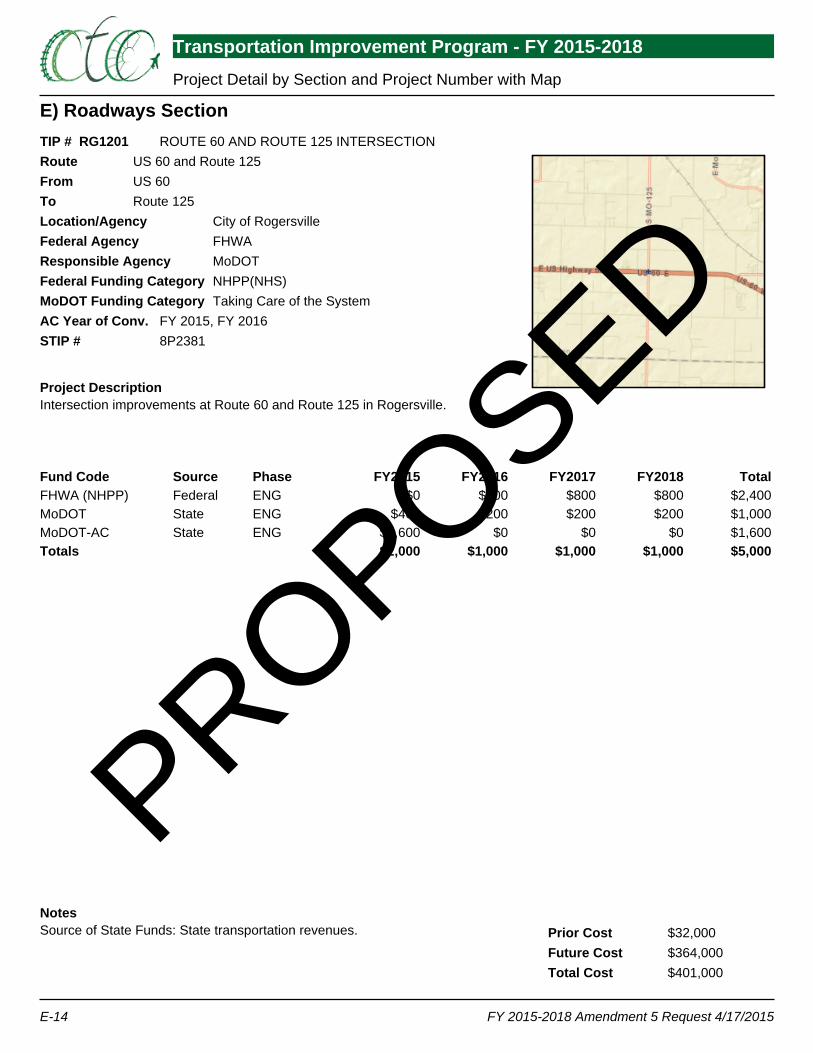
E) Roadways Section
Transportation Improvement Program - FY 2015-2018 Project Detail by Section and Project Number with Map
FY 2015-2018 Amendment 5 Request 4/17/2015E-14
TIP # RG1201RouteFromToLocation/AgencyFederal AgencyResponsible AgencyFederal Funding CategoryMoDOT Funding CategoryAC Year of Conv.STIP #
Project Description
NotesPrior CostFuture CostTotal Cost
ROUTE 60 AND ROUTE 125 INTERSECTIONUS 60 and Route 125US 60Route 125
City of RogersvilleFHWAMoDOTNHPP(NHS)Taking Care of the System
FY 2015, FY 20168P2381
Intersection improvements at Route 60 and Route 125 in Rogersville.
Source of State Funds: State transportation revenues. $32,000$364,000$401,000
Fund Code Source Phase FY2015 FY2016 FY2017 FY2018 TotalFHWA (NHPP) Federal ENG $0 $800 $800 $800 $2,400MoDOT State ENG $400 $200 $200 $200 $1,000MoDOT-AC State ENG $1,600 $0 $0 $0 $1,600Totals $2,000 $1,000 $1,000 $1,000 $5,000
PROPOSED
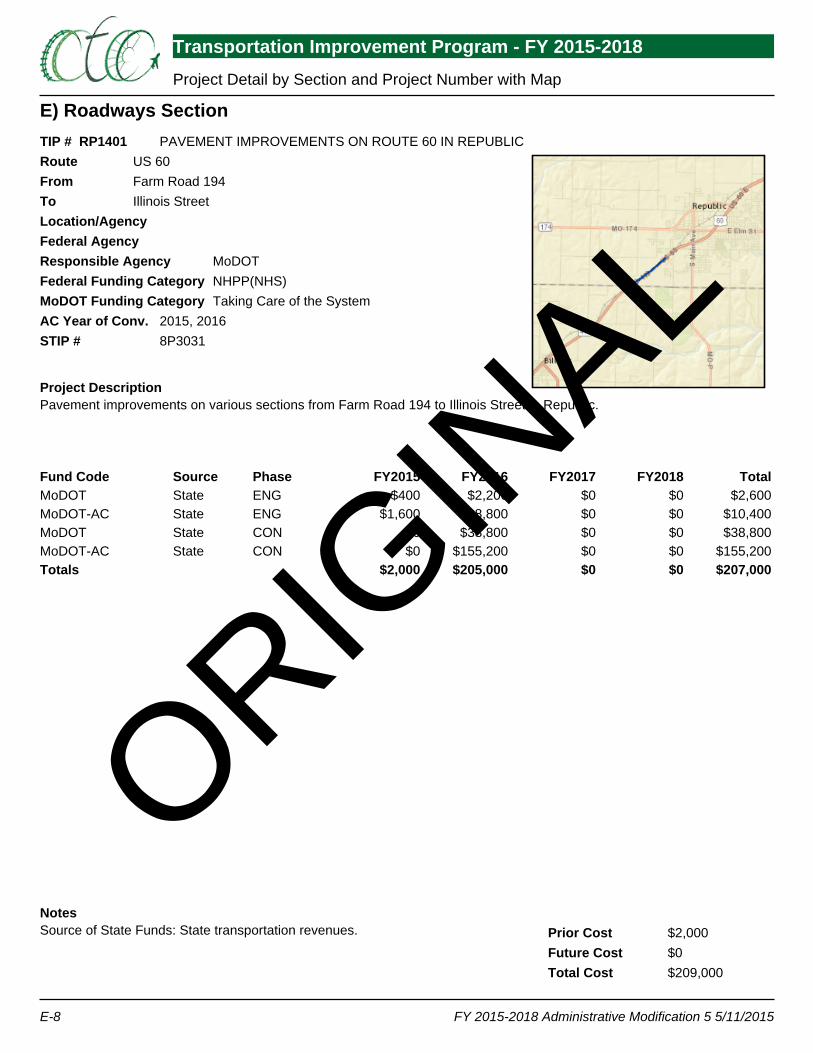
E) Roadways Section
Transportation Improvement Program - FY 2015-2018 Project Detail by Section and Project Number with Map
FY 2015-2018 Administrative Modification 5 5/11/2015E-8
TIP # RP1401RouteFromToLocation/AgencyFederal AgencyResponsible AgencyFederal Funding CategoryMoDOT Funding CategoryAC Year of Conv.STIP #
Project Description
NotesPrior CostFuture CostTotal Cost
PAVEMENT IMPROVEMENTS ON ROUTE 60 IN REPUBLICUS 60Farm Road 194Illinois Street
MoDOTNHPP(NHS)Taking Care of the System
2015, 20168P3031
Pavement improvements on various sections from Farm Road 194 to Illinois Street in Republic.
Source of State Funds: State transportation revenues. $2,000$0$209,000
Fund Code Source Phase FY2015 FY2016 FY2017 FY2018 TotalMoDOT State ENG $400 $2,200 $0 $0 $2,600MoDOT-AC State ENG $1,600 $8,800 $0 $0 $10,400MoDOT State CON $0 $38,800 $0 $0 $38,800MoDOT-AC State CON $0 $155,200 $0 $0 $155,200Totals $2,000 $205,000 $0 $0 $207,000
ORIGIN
AL
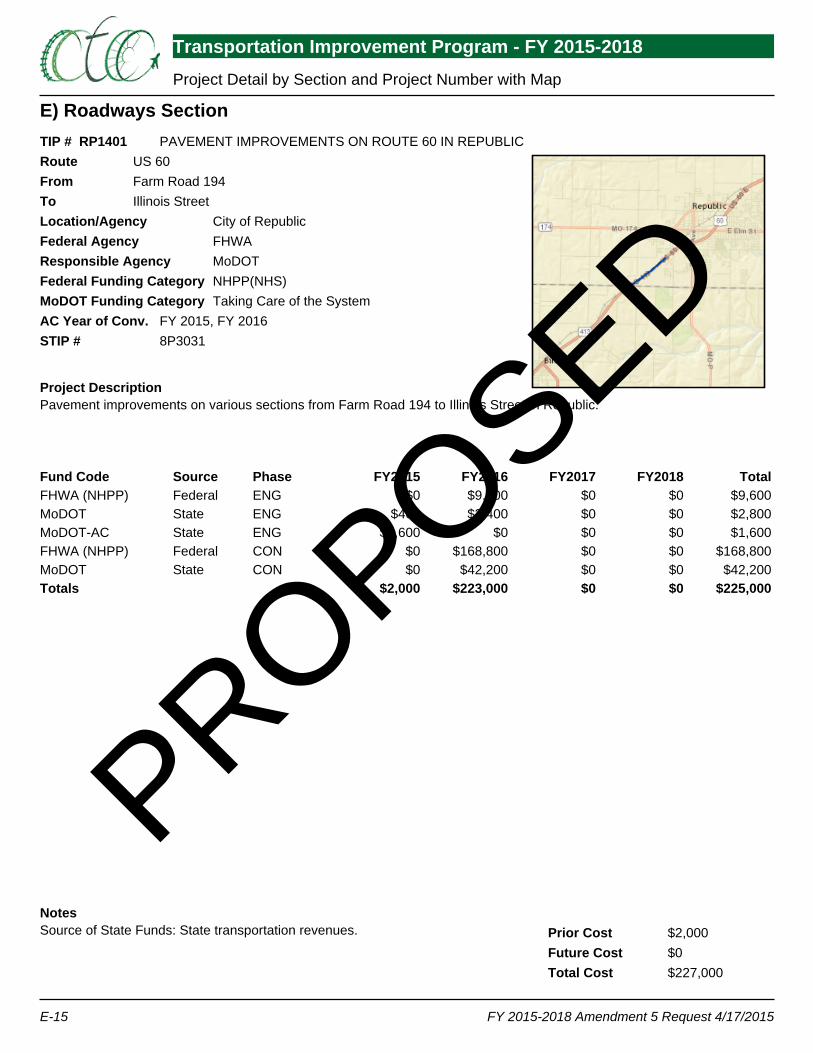
E) Roadways Section
Transportation Improvement Program - FY 2015-2018 Project Detail by Section and Project Number with Map
FY 2015-2018 Amendment 5 Request 4/17/2015E-15
TIP # RP1401RouteFromToLocation/AgencyFederal AgencyResponsible AgencyFederal Funding CategoryMoDOT Funding CategoryAC Year of Conv.STIP #
Project Description
NotesPrior CostFuture CostTotal Cost
PAVEMENT IMPROVEMENTS ON ROUTE 60 IN REPUBLICUS 60Farm Road 194Illinois Street
City of RepublicFHWAMoDOTNHPP(NHS)Taking Care of the System
FY 2015, FY 20168P3031
Pavement improvements on various sections from Farm Road 194 to Illinois Street in Republic.
Source of State Funds: State transportation revenues. $2,000$0$227,000
Fund Code Source Phase FY2015 FY2016 FY2017 FY2018 TotalFHWA (NHPP) Federal ENG $0 $9,600 $0 $0 $9,600MoDOT State ENG $400 $2,400 $0 $0 $2,800MoDOT-AC State ENG $1,600 $0 $0 $0 $1,600FHWA (NHPP) Federal CON $0 $168,800 $0 $0 $168,800MoDOT State CON $0 $42,200 $0 $0 $42,200Totals $2,000 $223,000 $0 $0 $225,000
PROPOSED
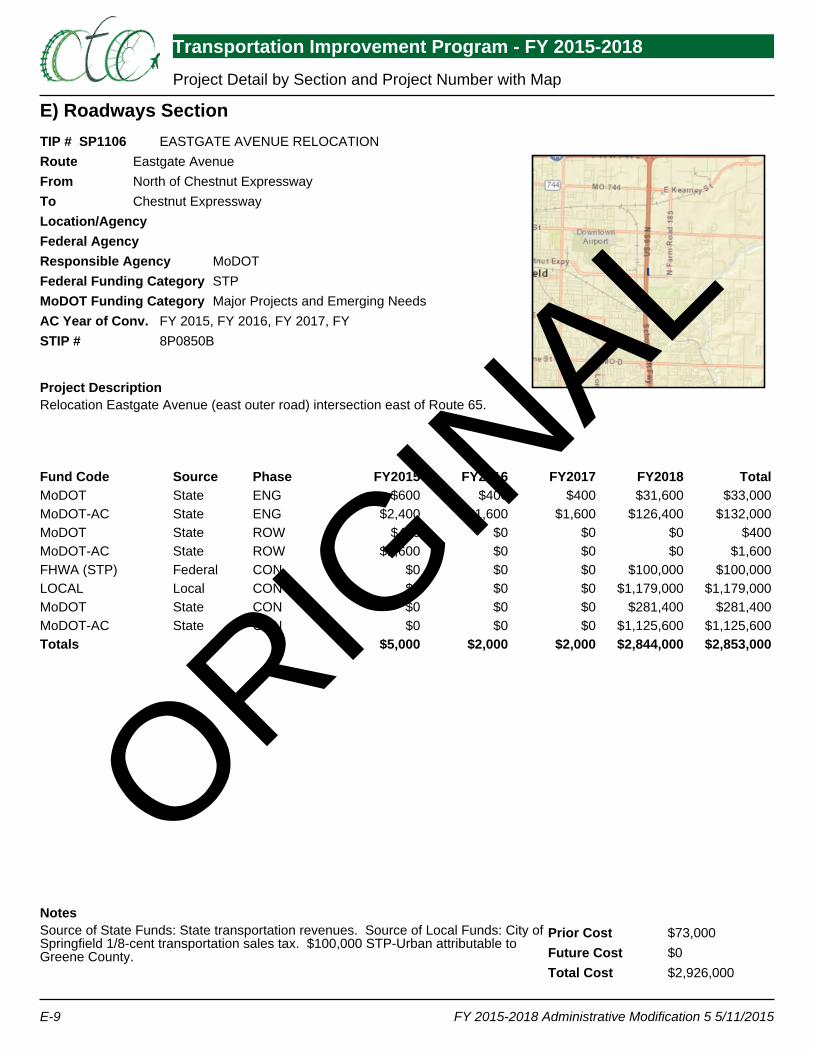
E) Roadways Section
Transportation Improvement Program - FY 2015-2018 Project Detail by Section and Project Number with Map
FY 2015-2018 Administrative Modification 5 5/11/2015E-9
TIP # SP1106RouteFromToLocation/AgencyFederal AgencyResponsible AgencyFederal Funding CategoryMoDOT Funding CategoryAC Year of Conv.STIP #
Project Description
NotesPrior CostFuture CostTotal Cost
EASTGATE AVENUE RELOCATIONEastgate AvenueNorth of Chestnut ExpresswayChestnut Expressway
MoDOTSTPMajor Projects and Emerging Needs
FY 2015, FY 2016, FY 2017, FY8P0850B
Relocation Eastgate Avenue (east outer road) intersection east of Route 65.
Source of State Funds: State transportation revenues. Source of Local Funds: City ofSpringfield 1/8-cent transportation sales tax. $100,000 STP-Urban attributable toGreene County.
$73,000$0$2,926,000
Fund Code Source Phase FY2015 FY2016 FY2017 FY2018 TotalMoDOT State ENG $600 $400 $400 $31,600 $33,000MoDOT-AC State ENG $2,400 $1,600 $1,600 $126,400 $132,000MoDOT State ROW $400 $0 $0 $0 $400MoDOT-AC State ROW $1,600 $0 $0 $0 $1,600FHWA (STP) Federal CON $0 $0 $0 $100,000 $100,000LOCAL Local CON $0 $0 $0 $1,179,000 $1,179,000MoDOT State CON $0 $0 $0 $281,400 $281,400MoDOT-AC State CON $0 $0 $0 $1,125,600 $1,125,600Totals $5,000 $2,000 $2,000 $2,844,000 $2,853,000
ORIGIN
AL
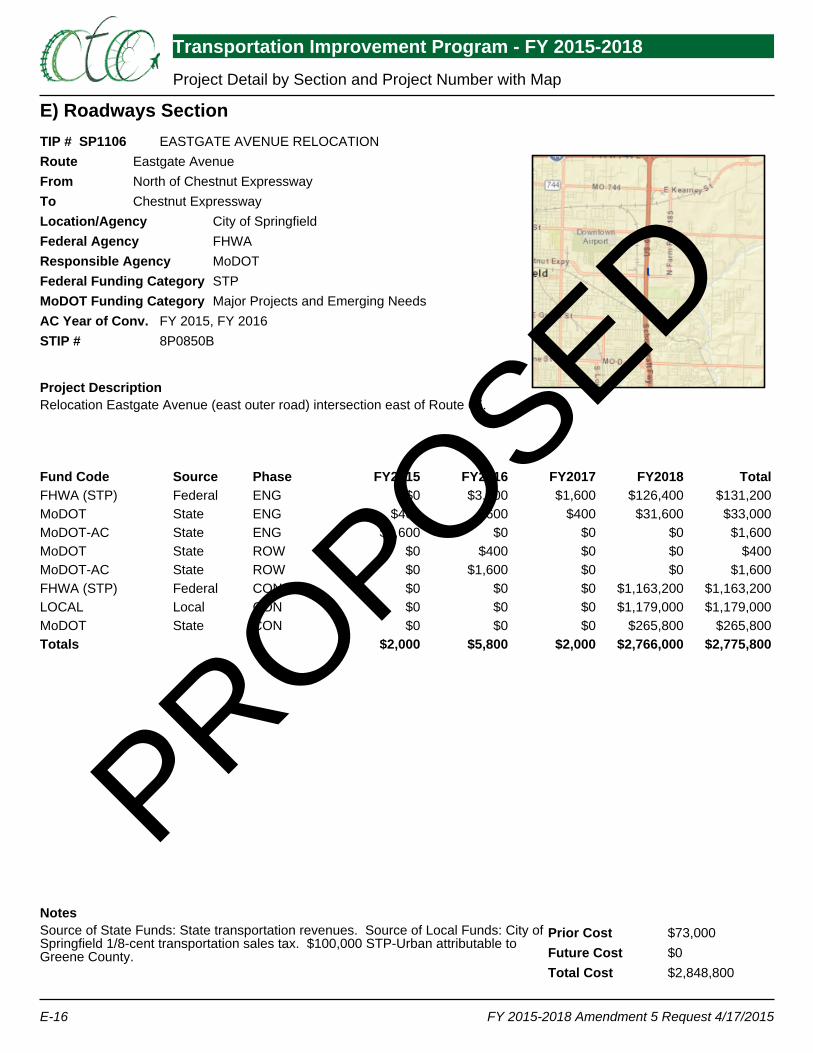
E) Roadways Section
Transportation Improvement Program - FY 2015-2018 Project Detail by Section and Project Number with Map
FY 2015-2018 Amendment 5 Request 4/17/2015E-16
TIP # SP1106RouteFromToLocation/AgencyFederal AgencyResponsible AgencyFederal Funding CategoryMoDOT Funding CategoryAC Year of Conv.STIP #
Project Description
NotesPrior CostFuture CostTotal Cost
EASTGATE AVENUE RELOCATIONEastgate AvenueNorth of Chestnut ExpresswayChestnut Expressway
City of SpringfieldFHWAMoDOTSTPMajor Projects and Emerging Needs
FY 2015, FY 20168P0850B
Relocation Eastgate Avenue (east outer road) intersection east of Route 65.
Source of State Funds: State transportation revenues. Source of Local Funds: City ofSpringfield 1/8-cent transportation sales tax. $100,000 STP-Urban attributable toGreene County.
$73,000$0$2,848,800
Fund Code Source Phase FY2015 FY2016 FY2017 FY2018 TotalFHWA (STP) Federal ENG $0 $3,200 $1,600 $126,400 $131,200MoDOT State ENG $400 $600 $400 $31,600 $33,000MoDOT-AC State ENG $1,600 $0 $0 $0 $1,600MoDOT State ROW $0 $400 $0 $0 $400MoDOT-AC State ROW $0 $1,600 $0 $0 $1,600FHWA (STP) Federal CON $0 $0 $0 $1,163,200 $1,163,200LOCAL Local CON $0 $0 $0 $1,179,000 $1,179,000MoDOT State CON $0 $0 $0 $265,800 $265,800Totals $2,000 $5,800 $2,000 $2,766,000 $2,775,800
PROPOSED

E) Roadways Section
Transportation Improvement Program - FY 2015-2018 Project Detail by Section and Project Number with Map
FY 2015-2018 Administrative Modification 5 5/11/2015E-10
TIP # SP1112RouteFromToLocation/AgencyFederal AgencyResponsible AgencyFederal Funding CategoryMoDOT Funding CategoryAC Year of Conv.STIP #
Project Description
NotesPrior CostFuture CostTotal Cost
ROUTE 65 SOUTHBOUND BRIDGE OVER I-44US 65US 65I-44
MoDOTNHPP(NHS)Taking Care of the System
FY 2015, FY 2016, FY 2017, FY8P2293
Replace Route 65 southbound bridge over I-44 in Springfield.
Source of State Funds: State transportation revenues. Source of $166,134.42Federal Funds: Earmark MO108.
$227,000$0$4,419,000
Fund Code Source Phase FY2015 FY2016 FY2017 FY2018 TotalMoDOT State ENG $400 $16,000 $30,000 $65,600 $112,000MoDOT-AC State ENG $1,600 $64,000 $120,000 $262,400 $448,000FHWA (HPP) Federal CON $0 $0 $0 $166,134 $166,134MoDOT State CON $0 $0 $0 $726,400 $726,400MoDOT-AC State CON $0 $0 $0 $2,739,466 $2,739,466Totals $2,000 $80,000 $150,000 $3,960,000 $4,192,000
ORIGIN
AL
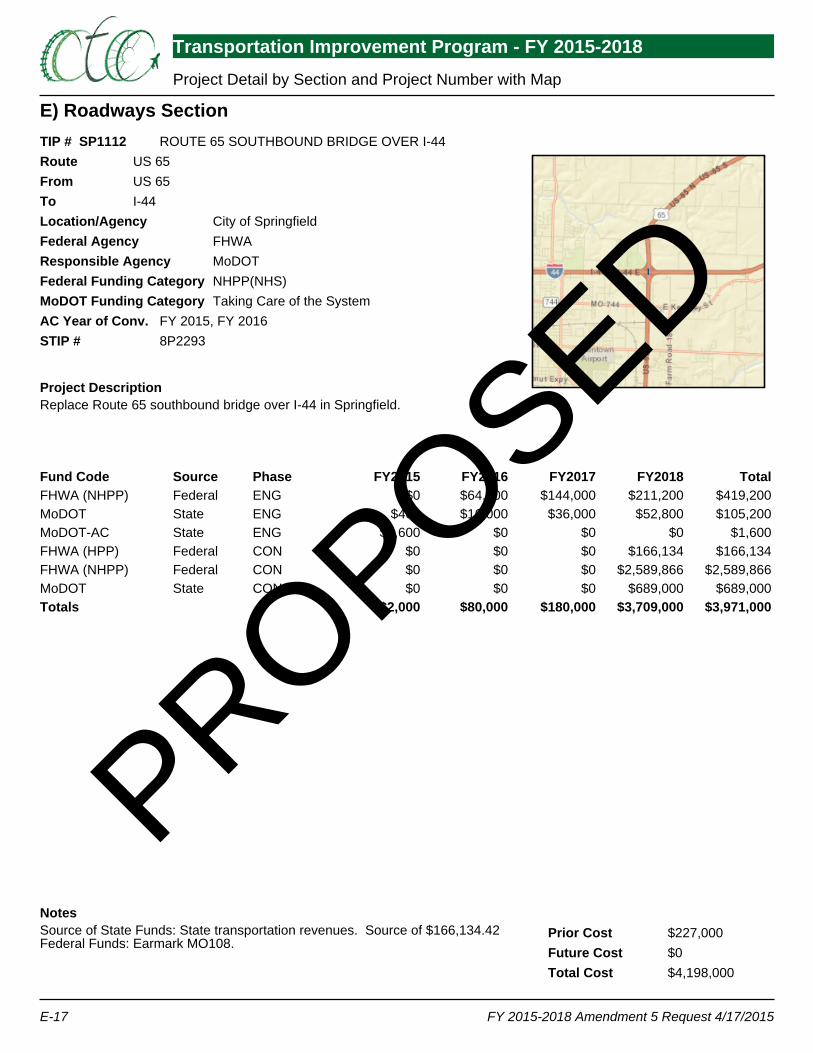
E) Roadways Section
Transportation Improvement Program - FY 2015-2018 Project Detail by Section and Project Number with Map
FY 2015-2018 Amendment 5 Request 4/17/2015E-17
TIP # SP1112RouteFromToLocation/AgencyFederal AgencyResponsible AgencyFederal Funding CategoryMoDOT Funding CategoryAC Year of Conv.STIP #
Project Description
NotesPrior CostFuture CostTotal Cost
ROUTE 65 SOUTHBOUND BRIDGE OVER I-44US 65US 65I-44
City of SpringfieldFHWAMoDOTNHPP(NHS)Taking Care of the System
FY 2015, FY 20168P2293
Replace Route 65 southbound bridge over I-44 in Springfield.
Source of State Funds: State transportation revenues. Source of $166,134.42Federal Funds: Earmark MO108.
$227,000$0$4,198,000
Fund Code Source Phase FY2015 FY2016 FY2017 FY2018 TotalFHWA (NHPP) Federal ENG $0 $64,000 $144,000 $211,200 $419,200MoDOT State ENG $400 $16,000 $36,000 $52,800 $105,200MoDOT-AC State ENG $1,600 $0 $0 $0 $1,600FHWA (HPP) Federal CON $0 $0 $0 $166,134 $166,134FHWA (NHPP) Federal CON $0 $0 $0 $2,589,866 $2,589,866MoDOT State CON $0 $0 $0 $689,000 $689,000Totals $2,000 $80,000 $180,000 $3,709,000 $3,971,000
PROPOSED

E) Roadways Section
Transportation Improvement Program - FY 2015-2018 Project Detail by Section and Project Number with Map
FY 2015-2018 Administrative Modification 5 5/11/2015E-11
TIP # SP1204RouteFromToLocation/AgencyFederal AgencyResponsible AgencyFederal Funding CategoryMoDOT Funding CategoryAC Year of Conv.STIP #
Project Description
NotesPrior CostFuture CostTotal Cost
EVANS ROAD BRIDGE OVER ROUTE 65Evans RoadEvans RoadUS 65
MoDOTNHPP(NHS)Taking Care of the System
FY 2015, FY 2016, FY 20178O2397
Improvements to the Evans Road bridge over Route 65 in Springfield. Project involves bridge A3107.
Source of State Funds: State transportation revenues. $15,000$0$1,045,000
Fund Code Source Phase FY2015 FY2016 FY2017 FY2018 TotalMoDOT State ENG $400 $400 $21,800 $0 $22,600MoDOT-AC State ENG $1,600 $1,600 $87,200 $0 $90,400MoDOT State CON $0 $0 $183,400 $0 $183,400MoDOT-AC State CON $0 $0 $733,600 $0 $733,600Totals $2,000 $2,000 $1,026,000 $0 $1,030,000
ORIGIN
AL
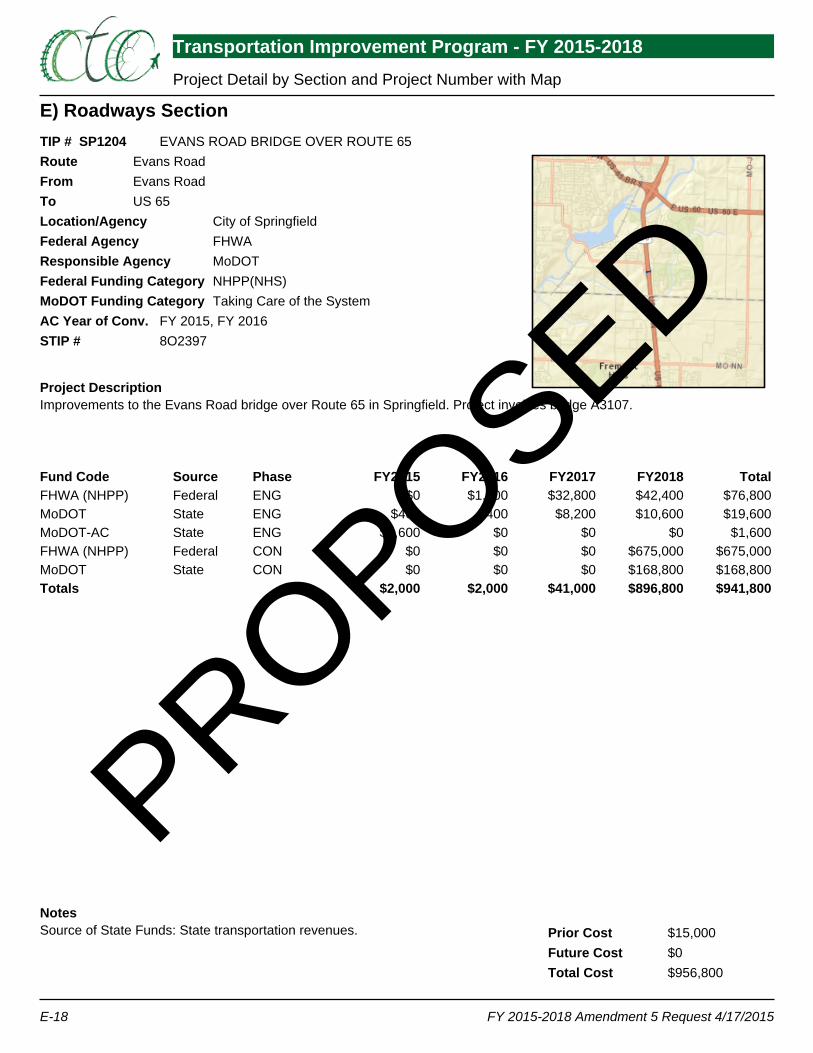
E) Roadways Section
Transportation Improvement Program - FY 2015-2018 Project Detail by Section and Project Number with Map
FY 2015-2018 Amendment 5 Request 4/17/2015E-18
TIP # SP1204RouteFromToLocation/AgencyFederal AgencyResponsible AgencyFederal Funding CategoryMoDOT Funding CategoryAC Year of Conv.STIP #
Project Description
NotesPrior CostFuture CostTotal Cost
EVANS ROAD BRIDGE OVER ROUTE 65Evans RoadEvans RoadUS 65
City of SpringfieldFHWAMoDOTNHPP(NHS)Taking Care of the System
FY 2015, FY 20168O2397
Improvements to the Evans Road bridge over Route 65 in Springfield. Project involves bridge A3107.
Source of State Funds: State transportation revenues. $15,000$0$956,800
Fund Code Source Phase FY2015 FY2016 FY2017 FY2018 TotalFHWA (NHPP) Federal ENG $0 $1,600 $32,800 $42,400 $76,800MoDOT State ENG $400 $400 $8,200 $10,600 $19,600MoDOT-AC State ENG $1,600 $0 $0 $0 $1,600FHWA (NHPP) Federal CON $0 $0 $0 $675,000 $675,000MoDOT State CON $0 $0 $0 $168,800 $168,800Totals $2,000 $2,000 $41,000 $896,800 $941,800
PROPOSED
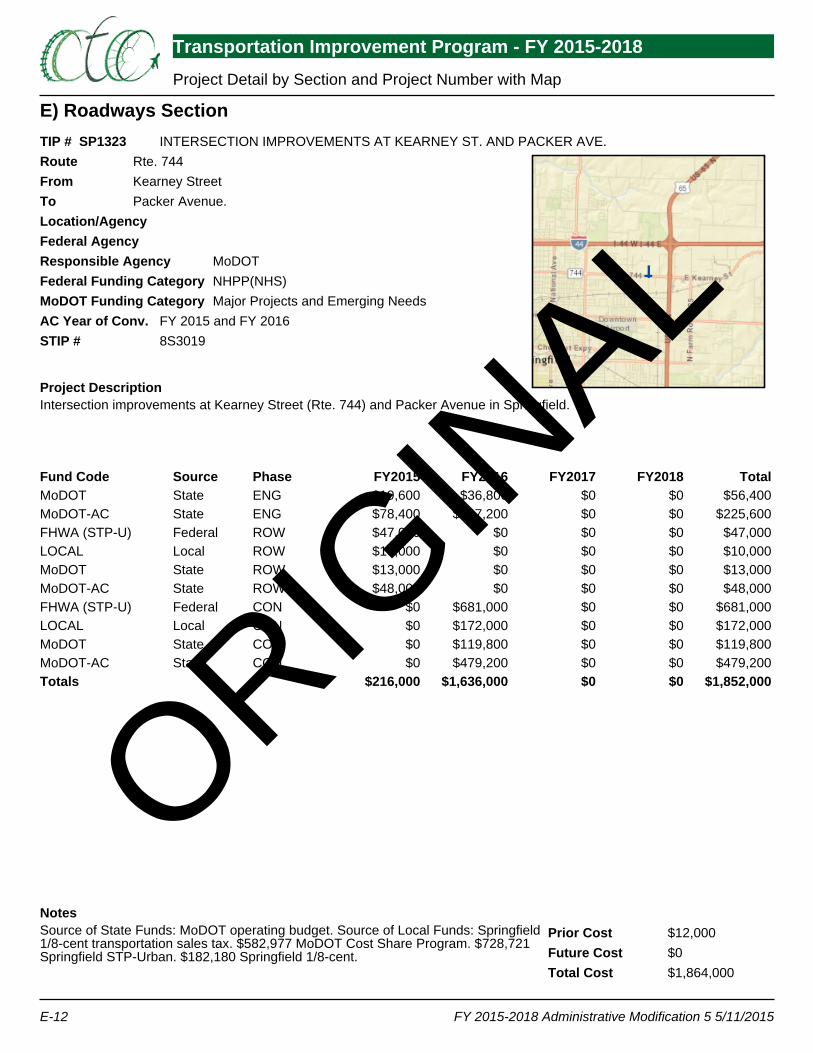
E) Roadways Section
Transportation Improvement Program - FY 2015-2018 Project Detail by Section and Project Number with Map
FY 2015-2018 Administrative Modification 5 5/11/2015E-12
TIP # SP1323RouteFromToLocation/AgencyFederal AgencyResponsible AgencyFederal Funding CategoryMoDOT Funding CategoryAC Year of Conv.STIP #
Project Description
NotesPrior CostFuture CostTotal Cost
INTERSECTION IMPROVEMENTS AT KEARNEY ST. AND PACKER AVE.Rte. 744Kearney StreetPacker Avenue.
MoDOTNHPP(NHS)Major Projects and Emerging Needs
FY 2015 and FY 20168S3019
Intersection improvements at Kearney Street (Rte. 744) and Packer Avenue in Springfield.
Source of State Funds: MoDOT operating budget. Source of Local Funds: Springfield1/8-cent transportation sales tax. $582,977 MoDOT Cost Share Program. $728,721Springfield STP-Urban. $182,180 Springfield 1/8-cent.
$12,000$0$1,864,000
Fund Code Source Phase FY2015 FY2016 FY2017 FY2018 TotalMoDOT State ENG $19,600 $36,800 $0 $0 $56,400MoDOT-AC State ENG $78,400 $147,200 $0 $0 $225,600FHWA (STP-U) Federal ROW $47,000 $0 $0 $0 $47,000LOCAL Local ROW $10,000 $0 $0 $0 $10,000MoDOT State ROW $13,000 $0 $0 $0 $13,000MoDOT-AC State ROW $48,000 $0 $0 $0 $48,000FHWA (STP-U) Federal CON $0 $681,000 $0 $0 $681,000LOCAL Local CON $0 $172,000 $0 $0 $172,000MoDOT State CON $0 $119,800 $0 $0 $119,800MoDOT-AC State CON $0 $479,200 $0 $0 $479,200Totals $216,000 $1,636,000 $0 $0 $1,852,000
ORIGIN
AL
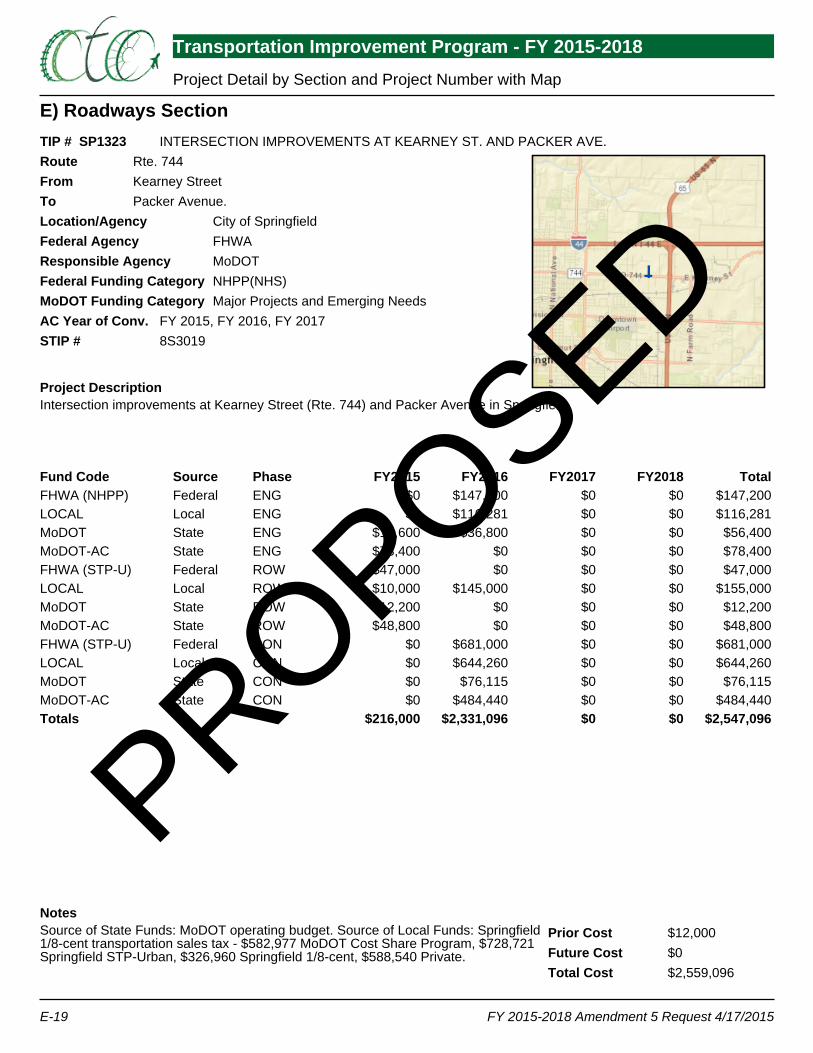
E) Roadways Section
Transportation Improvement Program - FY 2015-2018 Project Detail by Section and Project Number with Map
FY 2015-2018 Amendment 5 Request 4/17/2015E-19
TIP # SP1323RouteFromToLocation/AgencyFederal AgencyResponsible AgencyFederal Funding CategoryMoDOT Funding CategoryAC Year of Conv.STIP #
Project Description
NotesPrior CostFuture CostTotal Cost
INTERSECTION IMPROVEMENTS AT KEARNEY ST. AND PACKER AVE.Rte. 744Kearney StreetPacker Avenue.
City of SpringfieldFHWAMoDOTNHPP(NHS)Major Projects and Emerging Needs
FY 2015, FY 2016, FY 20178S3019
Intersection improvements at Kearney Street (Rte. 744) and Packer Avenue in Springfield.
Source of State Funds: MoDOT operating budget. Source of Local Funds: Springfield1/8-cent transportation sales tax - $582,977 MoDOT Cost Share Program, $728,721Springfield STP-Urban, $326,960 Springfield 1/8-cent, $588,540 Private.
$12,000$0$2,559,096
Fund Code Source Phase FY2015 FY2016 FY2017 FY2018 TotalFHWA (NHPP) Federal ENG $0 $147,200 $0 $0 $147,200LOCAL Local ENG $0 $116,281 $0 $0 $116,281MoDOT State ENG $19,600 $36,800 $0 $0 $56,400MoDOT-AC State ENG $78,400 $0 $0 $0 $78,400FHWA (STP-U) Federal ROW $47,000 $0 $0 $0 $47,000LOCAL Local ROW $10,000 $145,000 $0 $0 $155,000MoDOT State ROW $12,200 $0 $0 $0 $12,200MoDOT-AC State ROW $48,800 $0 $0 $0 $48,800FHWA (STP-U) Federal CON $0 $681,000 $0 $0 $681,000LOCAL Local CON $0 $644,260 $0 $0 $644,260MoDOT State CON $0 $76,115 $0 $0 $76,115MoDOT-AC State CON $0 $484,440 $0 $0 $484,440Totals $216,000 $2,331,096 $0 $0 $2,547,096
PROPOSED
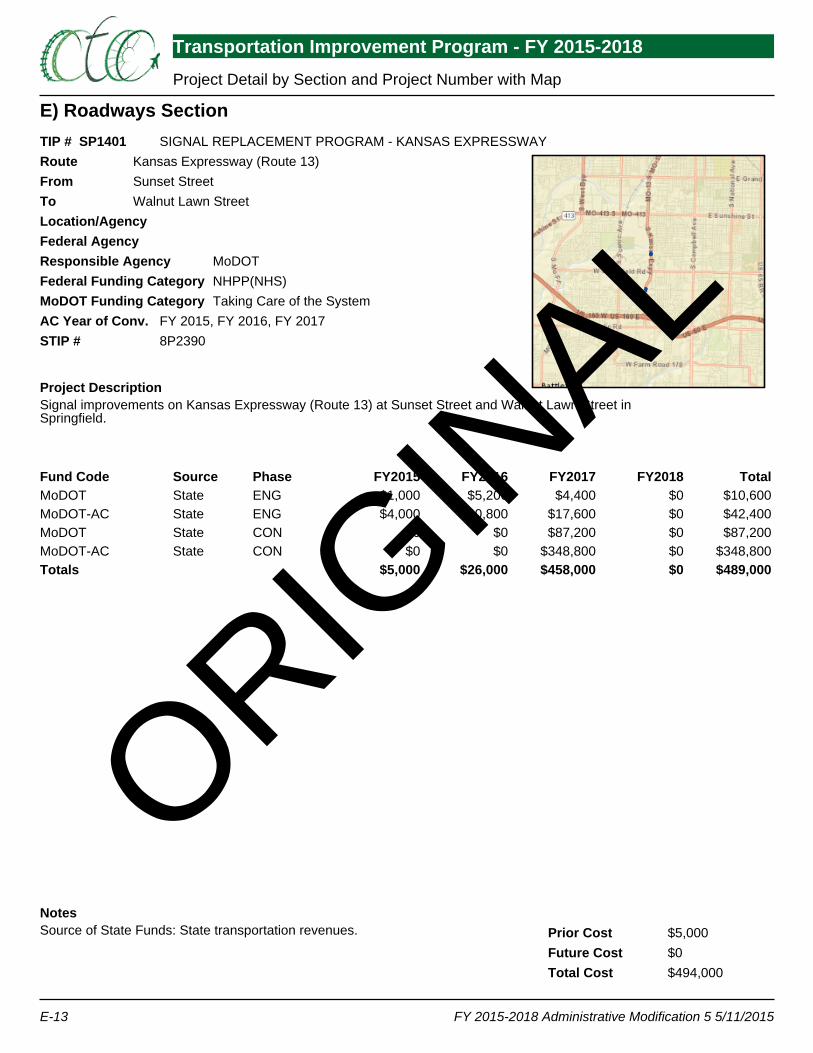
E) Roadways Section
Transportation Improvement Program - FY 2015-2018 Project Detail by Section and Project Number with Map
FY 2015-2018 Administrative Modification 5 5/11/2015E-13
TIP # SP1401RouteFromToLocation/AgencyFederal AgencyResponsible AgencyFederal Funding CategoryMoDOT Funding CategoryAC Year of Conv.STIP #
Project Description
NotesPrior CostFuture CostTotal Cost
SIGNAL REPLACEMENT PROGRAM - KANSAS EXPRESSWAY Kansas Expressway (Route 13)Sunset StreetWalnut Lawn Street
MoDOTNHPP(NHS)Taking Care of the System
FY 2015, FY 2016, FY 20178P2390
Signal improvements on Kansas Expressway (Route 13) at Sunset Street and Walnut Lawn Street inSpringfield.
Source of State Funds: State transportation revenues. $5,000$0$494,000
Fund Code Source Phase FY2015 FY2016 FY2017 FY2018 TotalMoDOT State ENG $1,000 $5,200 $4,400 $0 $10,600MoDOT-AC State ENG $4,000 $20,800 $17,600 $0 $42,400MoDOT State CON $0 $0 $87,200 $0 $87,200MoDOT-AC State CON $0 $0 $348,800 $0 $348,800Totals $5,000 $26,000 $458,000 $0 $489,000
ORIGIN
AL
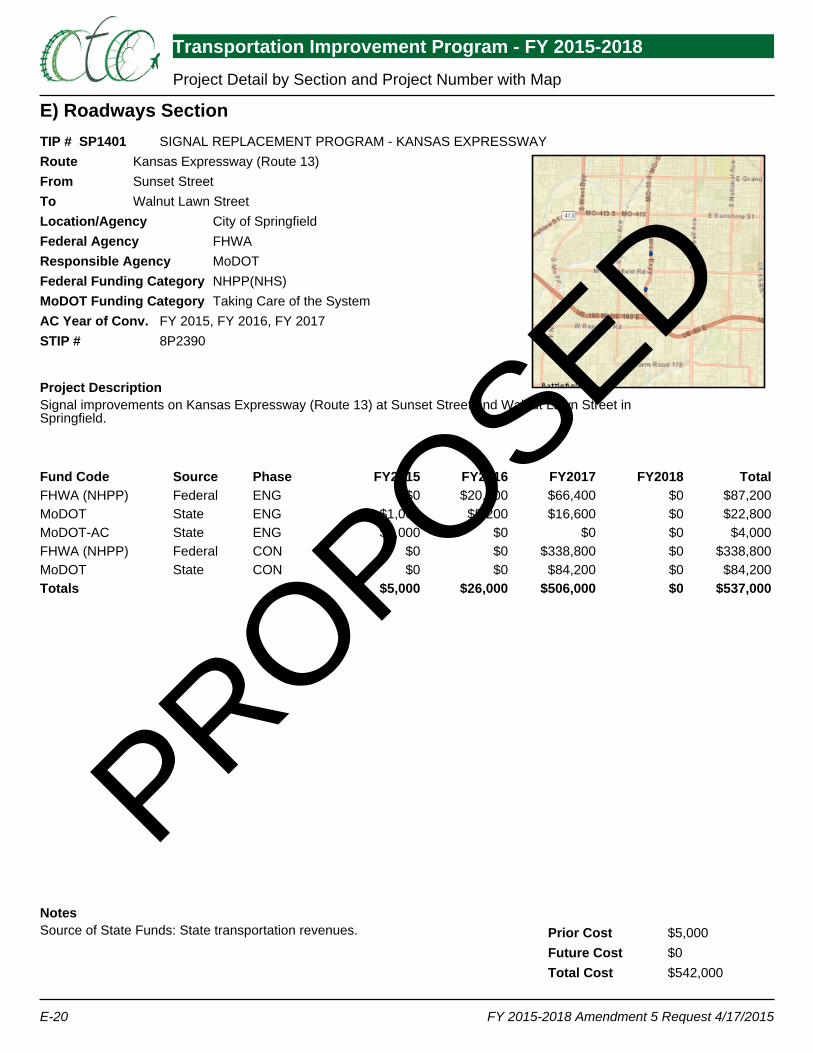
E) Roadways Section
Transportation Improvement Program - FY 2015-2018 Project Detail by Section and Project Number with Map
FY 2015-2018 Amendment 5 Request 4/17/2015E-20
TIP # SP1401RouteFromToLocation/AgencyFederal AgencyResponsible AgencyFederal Funding CategoryMoDOT Funding CategoryAC Year of Conv.STIP #
Project Description
NotesPrior CostFuture CostTotal Cost
SIGNAL REPLACEMENT PROGRAM - KANSAS EXPRESSWAY Kansas Expressway (Route 13)Sunset StreetWalnut Lawn Street
City of SpringfieldFHWAMoDOTNHPP(NHS)Taking Care of the System
FY 2015, FY 2016, FY 20178P2390
Signal improvements on Kansas Expressway (Route 13) at Sunset Street and Walnut Lawn Street inSpringfield.
Source of State Funds: State transportation revenues. $5,000$0$542,000
Fund Code Source Phase FY2015 FY2016 FY2017 FY2018 TotalFHWA (NHPP) Federal ENG $0 $20,800 $66,400 $0 $87,200MoDOT State ENG $1,000 $5,200 $16,600 $0 $22,800MoDOT-AC State ENG $4,000 $0 $0 $0 $4,000FHWA (NHPP) Federal CON $0 $0 $338,800 $0 $338,800MoDOT State CON $0 $0 $84,200 $0 $84,200Totals $5,000 $26,000 $506,000 $0 $537,000
PROPOSED
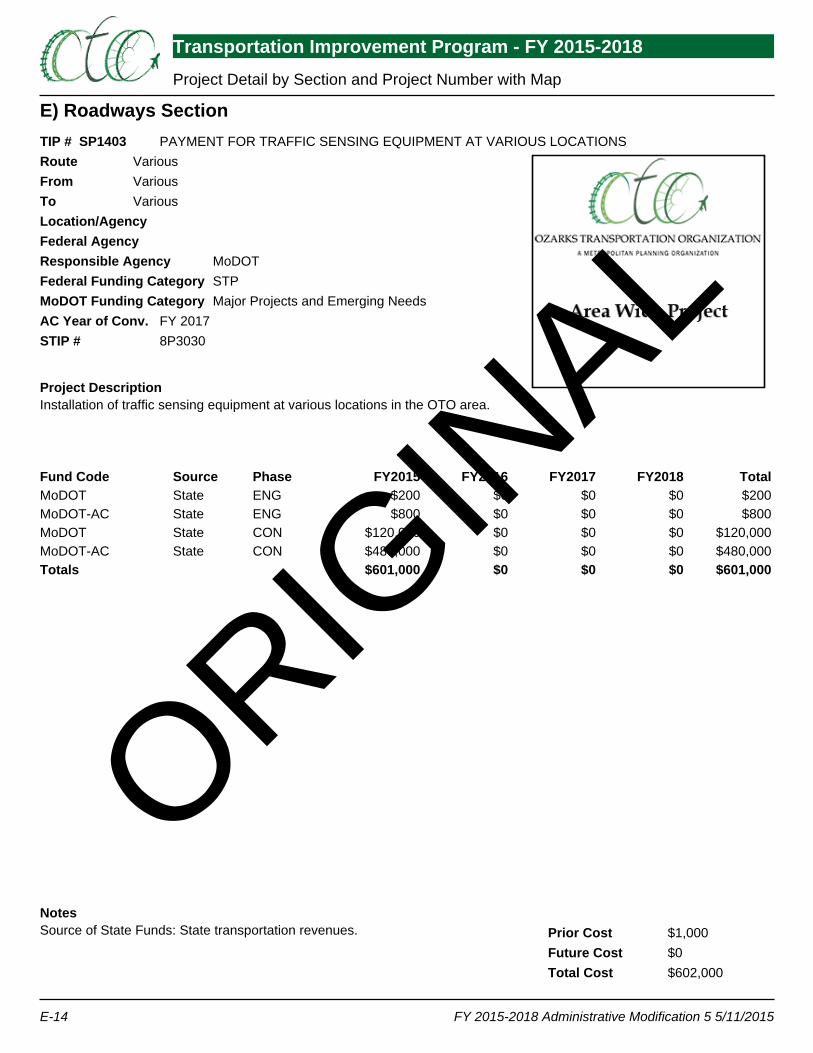
E) Roadways Section
Transportation Improvement Program - FY 2015-2018 Project Detail by Section and Project Number with Map
FY 2015-2018 Administrative Modification 5 5/11/2015E-14
TIP # SP1403RouteFromToLocation/AgencyFederal AgencyResponsible AgencyFederal Funding CategoryMoDOT Funding CategoryAC Year of Conv.STIP #
Project Description
NotesPrior CostFuture CostTotal Cost
PAYMENT FOR TRAFFIC SENSING EQUIPMENT AT VARIOUS LOCATIONSVariousVariousVarious
MoDOTSTPMajor Projects and Emerging Needs
FY 20178P3030
Installation of traffic sensing equipment at various locations in the OTO area.
Source of State Funds: State transportation revenues. $1,000$0$602,000
Fund Code Source Phase FY2015 FY2016 FY2017 FY2018 TotalMoDOT State ENG $200 $0 $0 $0 $200MoDOT-AC State ENG $800 $0 $0 $0 $800MoDOT State CON $120,000 $0 $0 $0 $120,000MoDOT-AC State CON $480,000 $0 $0 $0 $480,000Totals $601,000 $0 $0 $0 $601,000
ORIGIN
AL
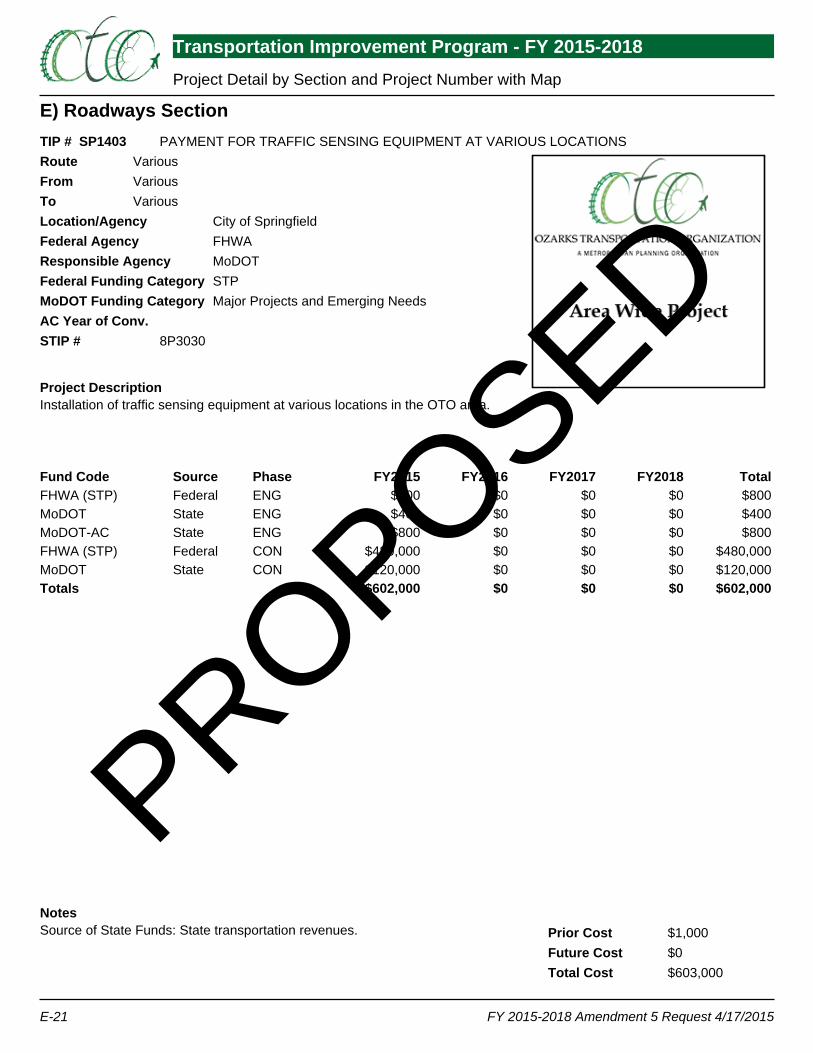
E) Roadways Section
Transportation Improvement Program - FY 2015-2018 Project Detail by Section and Project Number with Map
FY 2015-2018 Amendment 5 Request 4/17/2015E-21
TIP # SP1403RouteFromToLocation/AgencyFederal AgencyResponsible AgencyFederal Funding CategoryMoDOT Funding CategoryAC Year of Conv.STIP #
Project Description
NotesPrior CostFuture CostTotal Cost
PAYMENT FOR TRAFFIC SENSING EQUIPMENT AT VARIOUS LOCATIONSVariousVariousVarious
City of SpringfieldFHWAMoDOTSTPMajor Projects and Emerging Needs
8P3030
Installation of traffic sensing equipment at various locations in the OTO area.
Source of State Funds: State transportation revenues. $1,000$0$603,000
Fund Code Source Phase FY2015 FY2016 FY2017 FY2018 TotalFHWA (STP) Federal ENG $800 $0 $0 $0 $800MoDOT State ENG $400 $0 $0 $0 $400MoDOT-AC State ENG $800 $0 $0 $0 $800FHWA (STP) Federal CON $480,000 $0 $0 $0 $480,000MoDOT State CON $120,000 $0 $0 $0 $120,000Totals $602,000 $0 $0 $0 $602,000
PROPOSED
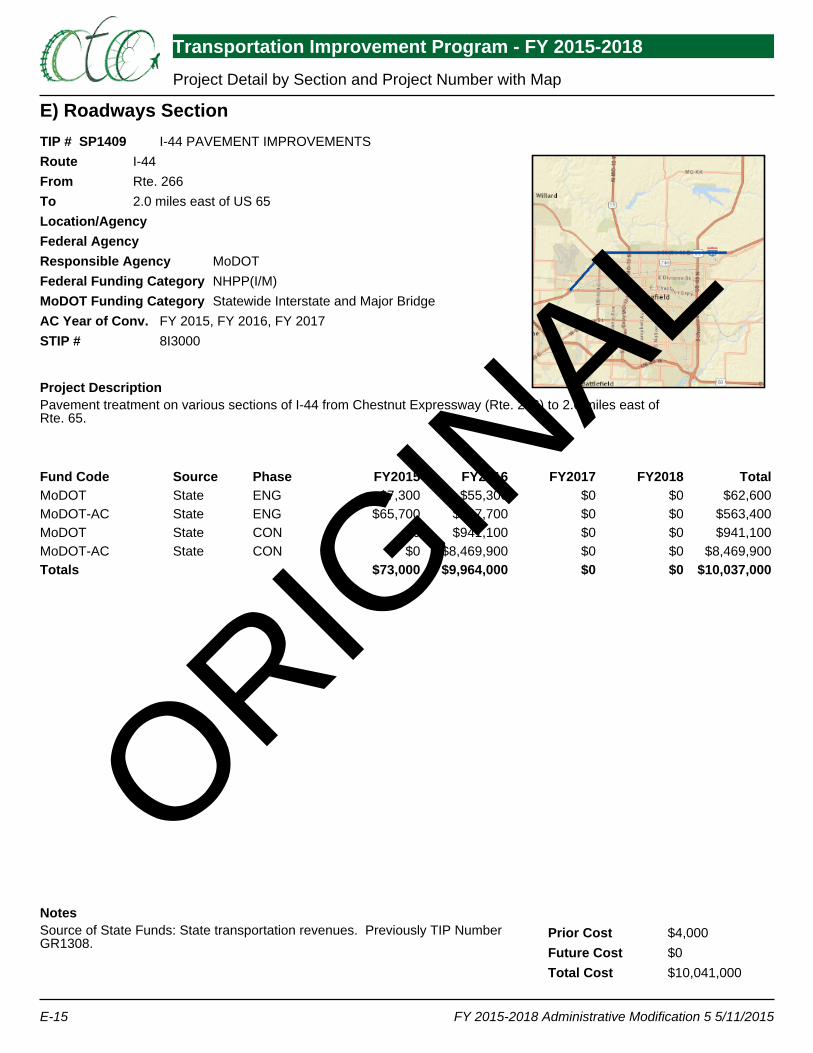
E) Roadways Section
Transportation Improvement Program - FY 2015-2018 Project Detail by Section and Project Number with Map
FY 2015-2018 Administrative Modification 5 5/11/2015E-15
TIP # SP1409RouteFromToLocation/AgencyFederal AgencyResponsible AgencyFederal Funding CategoryMoDOT Funding CategoryAC Year of Conv.STIP #
Project Description
NotesPrior CostFuture CostTotal Cost
I-44 PAVEMENT IMPROVEMENTSI-44Rte. 2662.0 miles east of US 65
MoDOTNHPP(I/M)Statewide Interstate and Major Bridge
FY 2015, FY 2016, FY 20178I3000
Pavement treatment on various sections of I-44 from Chestnut Expressway (Rte. 266) to 2.0 miles east ofRte. 65.
Source of State Funds: State transportation revenues. Previously TIP NumberGR1308.
$4,000$0$10,041,000
Fund Code Source Phase FY2015 FY2016 FY2017 FY2018 TotalMoDOT State ENG $7,300 $55,300 $0 $0 $62,600MoDOT-AC State ENG $65,700 $497,700 $0 $0 $563,400MoDOT State CON $0 $941,100 $0 $0 $941,100MoDOT-AC State CON $0 $8,469,900 $0 $0 $8,469,900Totals $73,000 $9,964,000 $0 $0 $10,037,000
ORIGIN
AL
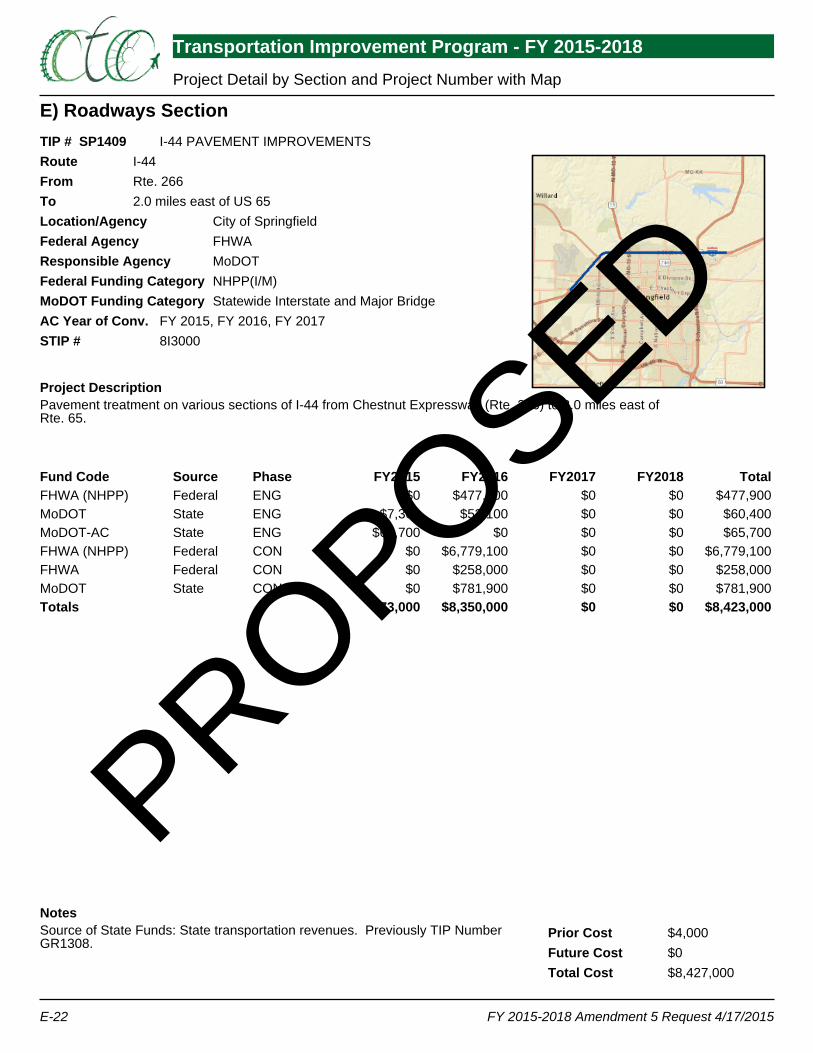
E) Roadways Section
Transportation Improvement Program - FY 2015-2018 Project Detail by Section and Project Number with Map
FY 2015-2018 Amendment 5 Request 4/17/2015E-22
TIP # SP1409RouteFromToLocation/AgencyFederal AgencyResponsible AgencyFederal Funding CategoryMoDOT Funding CategoryAC Year of Conv.STIP #
Project Description
NotesPrior CostFuture CostTotal Cost
I-44 PAVEMENT IMPROVEMENTSI-44Rte. 2662.0 miles east of US 65
City of SpringfieldFHWAMoDOTNHPP(I/M)Statewide Interstate and Major Bridge
FY 2015, FY 2016, FY 20178I3000
Pavement treatment on various sections of I-44 from Chestnut Expressway (Rte. 266) to 2.0 miles east ofRte. 65.
Source of State Funds: State transportation revenues. Previously TIP NumberGR1308.
$4,000$0$8,427,000
Fund Code Source Phase FY2015 FY2016 FY2017 FY2018 TotalFHWA (NHPP) Federal ENG $0 $477,900 $0 $0 $477,900MoDOT State ENG $7,300 $53,100 $0 $0 $60,400MoDOT-AC State ENG $65,700 $0 $0 $0 $65,700FHWA (NHPP) Federal CON $0 $6,779,100 $0 $0 $6,779,100FHWA Federal CON $0 $258,000 $0 $0 $258,000MoDOT State CON $0 $781,900 $0 $0 $781,900Totals $73,000 $8,350,000 $0 $0 $8,423,000
PROPOSED
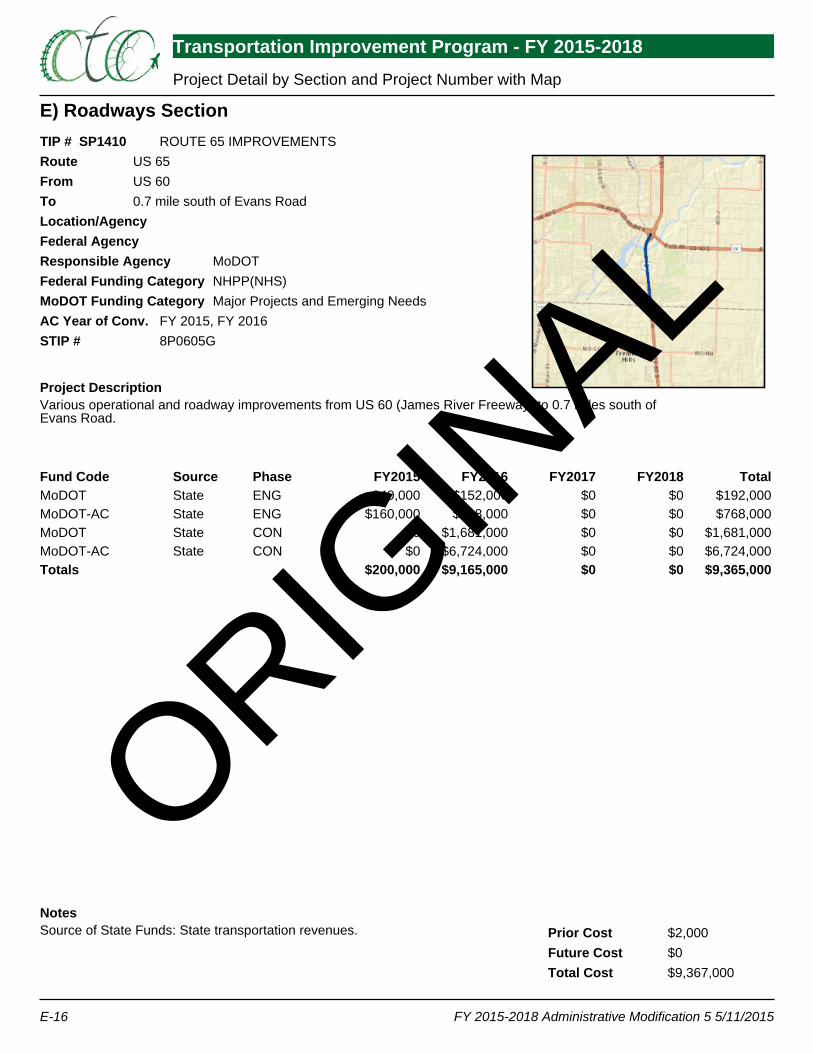
E) Roadways Section
Transportation Improvement Program - FY 2015-2018 Project Detail by Section and Project Number with Map
FY 2015-2018 Administrative Modification 5 5/11/2015E-16
TIP # SP1410RouteFromToLocation/AgencyFederal AgencyResponsible AgencyFederal Funding CategoryMoDOT Funding CategoryAC Year of Conv.STIP #
Project Description
NotesPrior CostFuture CostTotal Cost
ROUTE 65 IMPROVEMENTSUS 65US 600.7 mile south of Evans Road
MoDOTNHPP(NHS)Major Projects and Emerging Needs
FY 2015, FY 20168P0605G
Various operational and roadway improvements from US 60 (James River Freeway) to 0.7 miles south ofEvans Road.
Source of State Funds: State transportation revenues. $2,000$0$9,367,000
Fund Code Source Phase FY2015 FY2016 FY2017 FY2018 TotalMoDOT State ENG $40,000 $152,000 $0 $0 $192,000MoDOT-AC State ENG $160,000 $608,000 $0 $0 $768,000MoDOT State CON $0 $1,681,000 $0 $0 $1,681,000MoDOT-AC State CON $0 $6,724,000 $0 $0 $6,724,000Totals $200,000 $9,165,000 $0 $0 $9,365,000
ORIGIN
AL
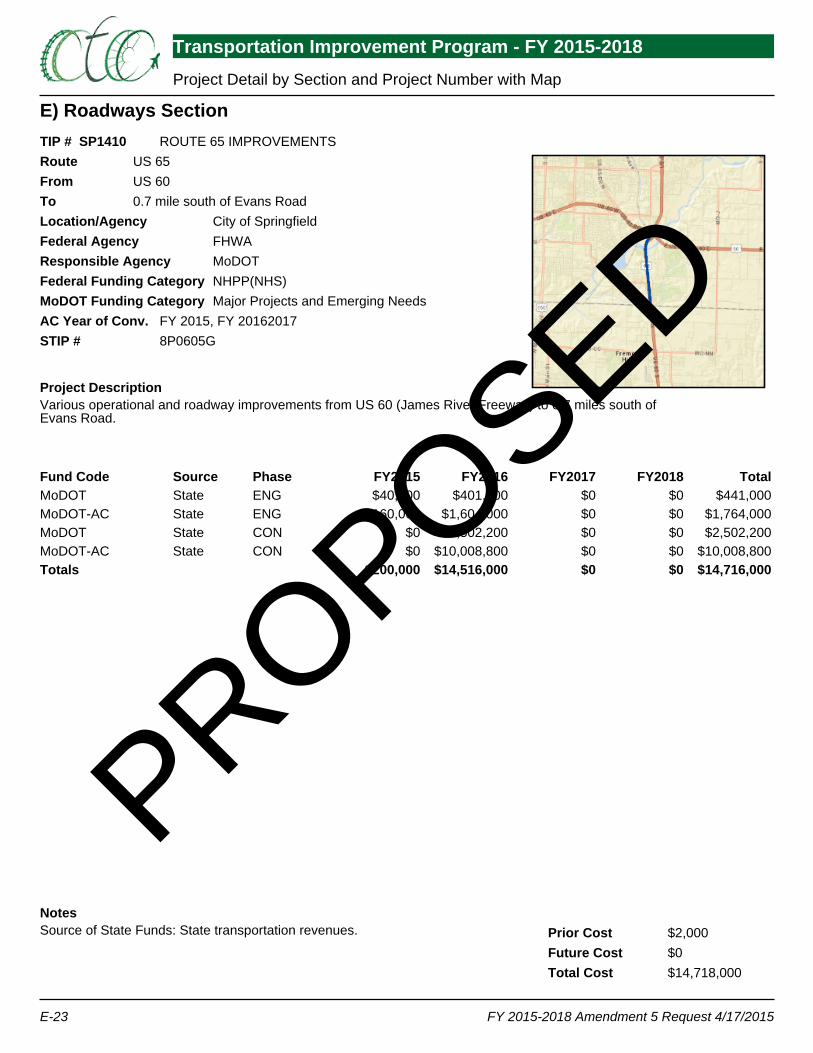
E) Roadways Section
Transportation Improvement Program - FY 2015-2018 Project Detail by Section and Project Number with Map
FY 2015-2018 Amendment 5 Request 4/17/2015E-23
TIP # SP1410RouteFromToLocation/AgencyFederal AgencyResponsible AgencyFederal Funding CategoryMoDOT Funding CategoryAC Year of Conv.STIP #
Project Description
NotesPrior CostFuture CostTotal Cost
ROUTE 65 IMPROVEMENTSUS 65US 600.7 mile south of Evans Road
City of SpringfieldFHWAMoDOTNHPP(NHS)Major Projects and Emerging Needs
FY 2015, FY 201620178P0605G
Various operational and roadway improvements from US 60 (James River Freeway) to 0.7 miles south ofEvans Road.
Source of State Funds: State transportation revenues. $2,000$0$14,718,000
Fund Code Source Phase FY2015 FY2016 FY2017 FY2018 TotalMoDOT State ENG $40,000 $401,000 $0 $0 $441,000MoDOT-AC State ENG $160,000 $1,604,000 $0 $0 $1,764,000MoDOT State CON $0 $2,502,200 $0 $0 $2,502,200MoDOT-AC State CON $0 $10,008,800 $0 $0 $10,008,800Totals $200,000 $14,516,000 $0 $0 $14,716,000
PROPOSED
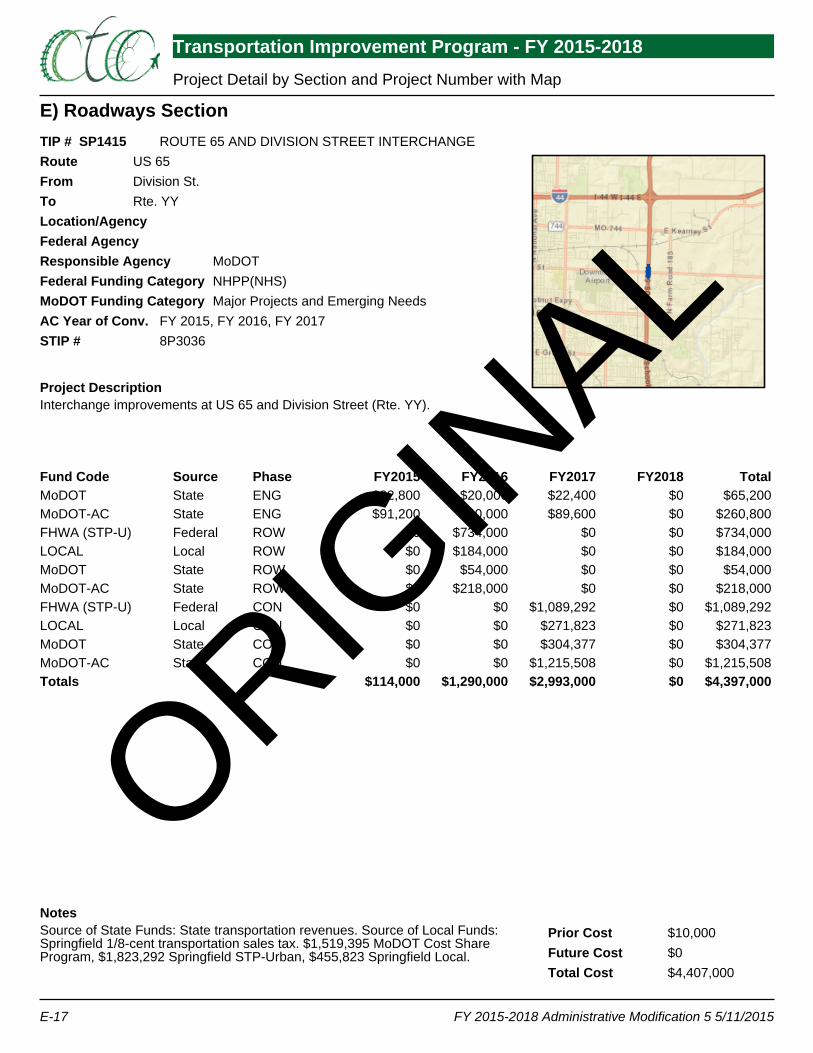
E) Roadways Section
Transportation Improvement Program - FY 2015-2018 Project Detail by Section and Project Number with Map
FY 2015-2018 Administrative Modification 5 5/11/2015E-17
TIP # SP1415RouteFromToLocation/AgencyFederal AgencyResponsible AgencyFederal Funding CategoryMoDOT Funding CategoryAC Year of Conv.STIP #
Project Description
NotesPrior CostFuture CostTotal Cost
ROUTE 65 AND DIVISION STREET INTERCHANGEUS 65Division St. Rte. YY
MoDOTNHPP(NHS)Major Projects and Emerging Needs
FY 2015, FY 2016, FY 20178P3036
Interchange improvements at US 65 and Division Street (Rte. YY).
Source of State Funds: State transportation revenues. Source of Local Funds:Springfield 1/8-cent transportation sales tax. $1,519,395 MoDOT Cost ShareProgram, $1,823,292 Springfield STP-Urban, $455,823 Springfield Local.
$10,000$0$4,407,000
Fund Code Source Phase FY2015 FY2016 FY2017 FY2018 TotalMoDOT State ENG $22,800 $20,000 $22,400 $0 $65,200MoDOT-AC State ENG $91,200 $80,000 $89,600 $0 $260,800FHWA (STP-U) Federal ROW $0 $734,000 $0 $0 $734,000LOCAL Local ROW $0 $184,000 $0 $0 $184,000MoDOT State ROW $0 $54,000 $0 $0 $54,000MoDOT-AC State ROW $0 $218,000 $0 $0 $218,000FHWA (STP-U) Federal CON $0 $0 $1,089,292 $0 $1,089,292LOCAL Local CON $0 $0 $271,823 $0 $271,823MoDOT State CON $0 $0 $304,377 $0 $304,377MoDOT-AC State CON $0 $0 $1,215,508 $0 $1,215,508Totals $114,000 $1,290,000 $2,993,000 $0 $4,397,000
ORIGIN
AL
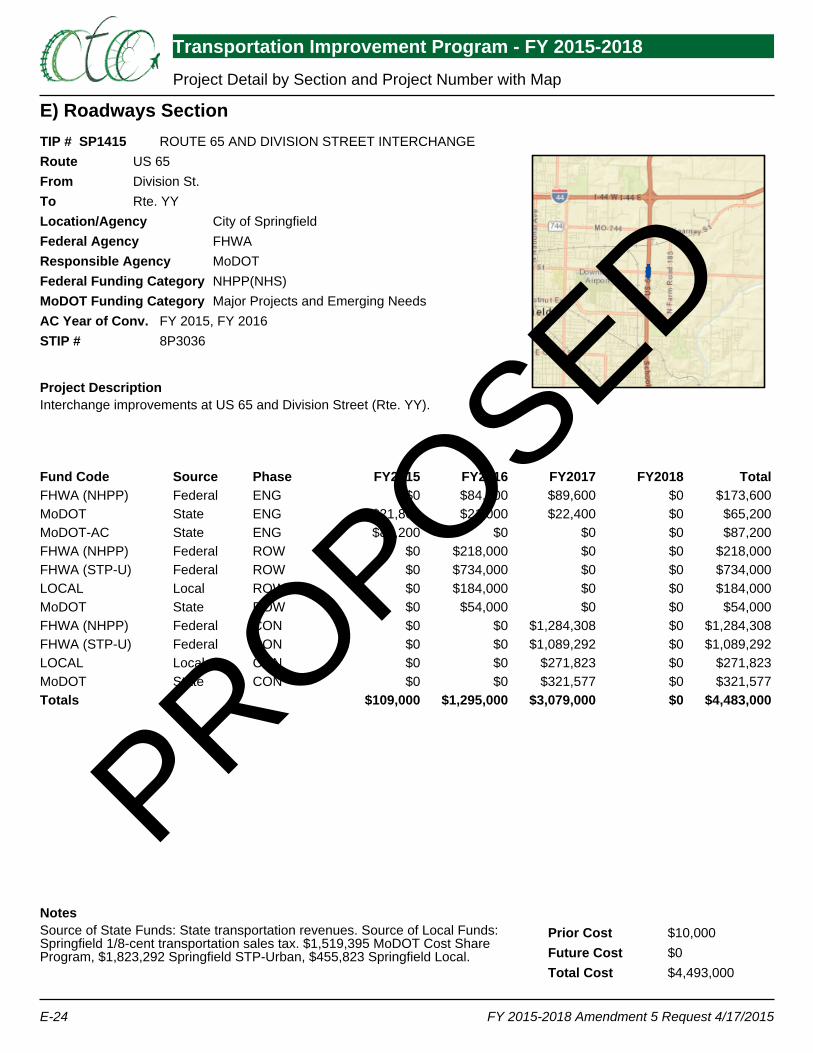
E) Roadways Section
Transportation Improvement Program - FY 2015-2018 Project Detail by Section and Project Number with Map
FY 2015-2018 Amendment 5 Request 4/17/2015E-24
TIP # SP1415RouteFromToLocation/AgencyFederal AgencyResponsible AgencyFederal Funding CategoryMoDOT Funding CategoryAC Year of Conv.STIP #
Project Description
NotesPrior CostFuture CostTotal Cost
ROUTE 65 AND DIVISION STREET INTERCHANGEUS 65Division St. Rte. YY
City of SpringfieldFHWAMoDOTNHPP(NHS)Major Projects and Emerging Needs
FY 2015, FY 20168P3036
Interchange improvements at US 65 and Division Street (Rte. YY).
Source of State Funds: State transportation revenues. Source of Local Funds:Springfield 1/8-cent transportation sales tax. $1,519,395 MoDOT Cost ShareProgram, $1,823,292 Springfield STP-Urban, $455,823 Springfield Local.
$10,000$0$4,493,000
Fund Code Source Phase FY2015 FY2016 FY2017 FY2018 TotalFHWA (NHPP) Federal ENG $0 $84,000 $89,600 $0 $173,600MoDOT State ENG $21,800 $21,000 $22,400 $0 $65,200MoDOT-AC State ENG $87,200 $0 $0 $0 $87,200FHWA (NHPP) Federal ROW $0 $218,000 $0 $0 $218,000FHWA (STP-U) Federal ROW $0 $734,000 $0 $0 $734,000LOCAL Local ROW $0 $184,000 $0 $0 $184,000MoDOT State ROW $0 $54,000 $0 $0 $54,000FHWA (NHPP) Federal CON $0 $0 $1,284,308 $0 $1,284,308FHWA (STP-U) Federal CON $0 $0 $1,089,292 $0 $1,089,292LOCAL Local CON $0 $0 $271,823 $0 $271,823MoDOT State CON $0 $0 $321,577 $0 $321,577Totals $109,000 $1,295,000 $3,079,000 $0 $4,483,000
PROPOSED
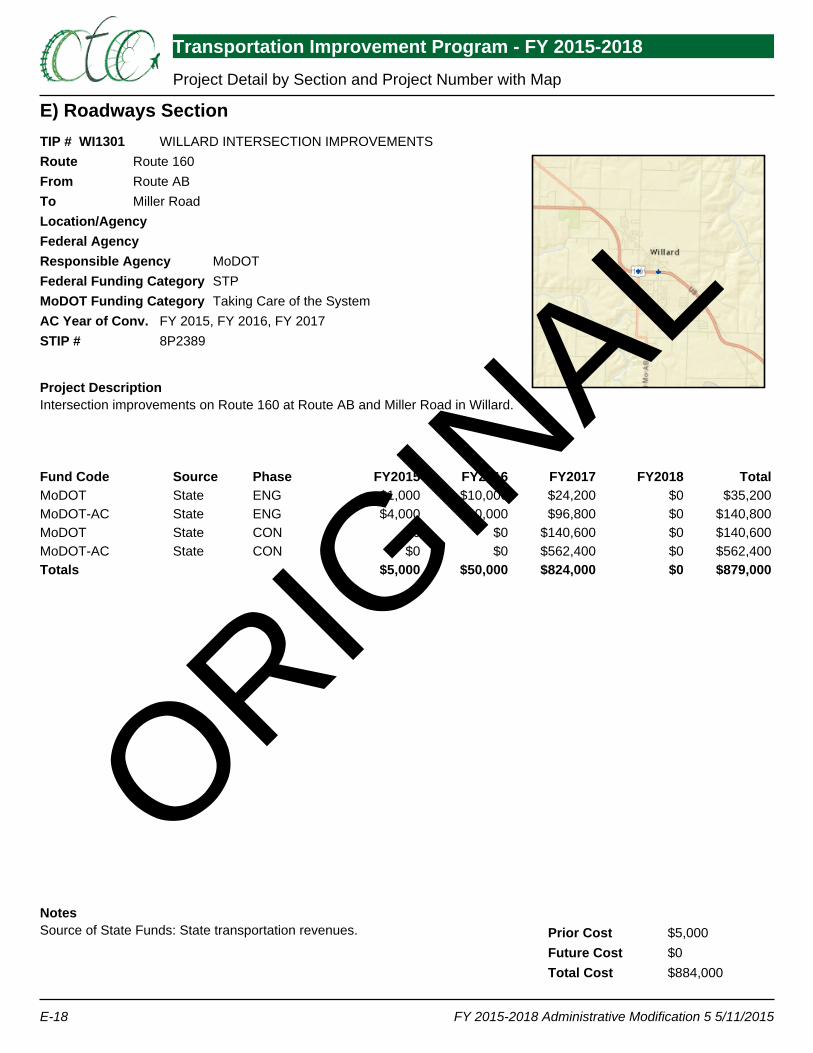
E) Roadways Section
Transportation Improvement Program - FY 2015-2018 Project Detail by Section and Project Number with Map
FY 2015-2018 Administrative Modification 5 5/11/2015E-18
TIP # WI1301RouteFromToLocation/AgencyFederal AgencyResponsible AgencyFederal Funding CategoryMoDOT Funding CategoryAC Year of Conv.STIP #
Project Description
NotesPrior CostFuture CostTotal Cost
WILLARD INTERSECTION IMPROVEMENTSRoute 160Route ABMiller Road
MoDOTSTPTaking Care of the System
FY 2015, FY 2016, FY 20178P2389
Intersection improvements on Route 160 at Route AB and Miller Road in Willard.
Source of State Funds: State transportation revenues. $5,000$0$884,000
Fund Code Source Phase FY2015 FY2016 FY2017 FY2018 TotalMoDOT State ENG $1,000 $10,000 $24,200 $0 $35,200MoDOT-AC State ENG $4,000 $40,000 $96,800 $0 $140,800MoDOT State CON $0 $0 $140,600 $0 $140,600MoDOT-AC State CON $0 $0 $562,400 $0 $562,400Totals $5,000 $50,000 $824,000 $0 $879,000
ORIGIN
AL
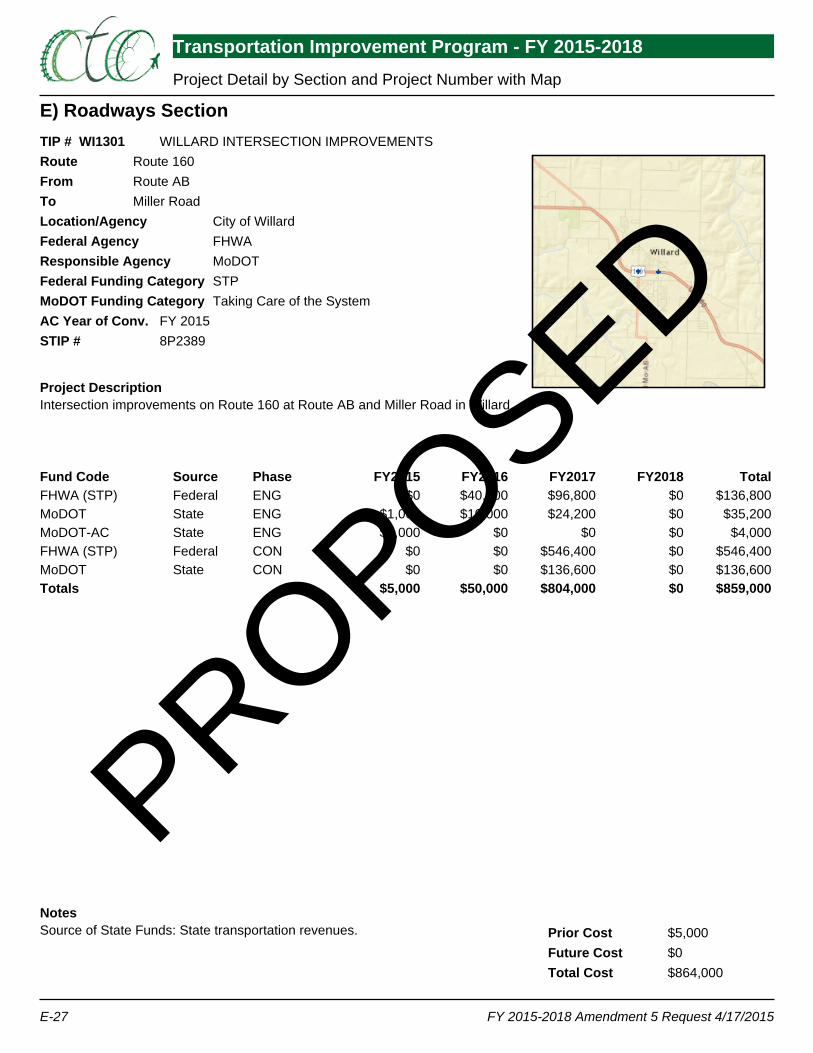
E) Roadways Section
Transportation Improvement Program - FY 2015-2018 Project Detail by Section and Project Number with Map
FY 2015-2018 Amendment 5 Request 4/17/2015E-27
TIP # WI1301RouteFromToLocation/AgencyFederal AgencyResponsible AgencyFederal Funding CategoryMoDOT Funding CategoryAC Year of Conv.STIP #
Project Description
NotesPrior CostFuture CostTotal Cost
WILLARD INTERSECTION IMPROVEMENTSRoute 160Route ABMiller Road
City of WillardFHWAMoDOTSTPTaking Care of the System
FY 20158P2389
Intersection improvements on Route 160 at Route AB and Miller Road in Willard.
Source of State Funds: State transportation revenues. $5,000$0$864,000
Fund Code Source Phase FY2015 FY2016 FY2017 FY2018 TotalFHWA (STP) Federal ENG $0 $40,000 $96,800 $0 $136,800MoDOT State ENG $1,000 $10,000 $24,200 $0 $35,200MoDOT-AC State ENG $4,000 $0 $0 $0 $4,000FHWA (STP) Federal CON $0 $0 $546,400 $0 $546,400MoDOT State CON $0 $0 $136,600 $0 $136,600Totals $5,000 $50,000 $804,000 $0 $859,000
PROPOSED
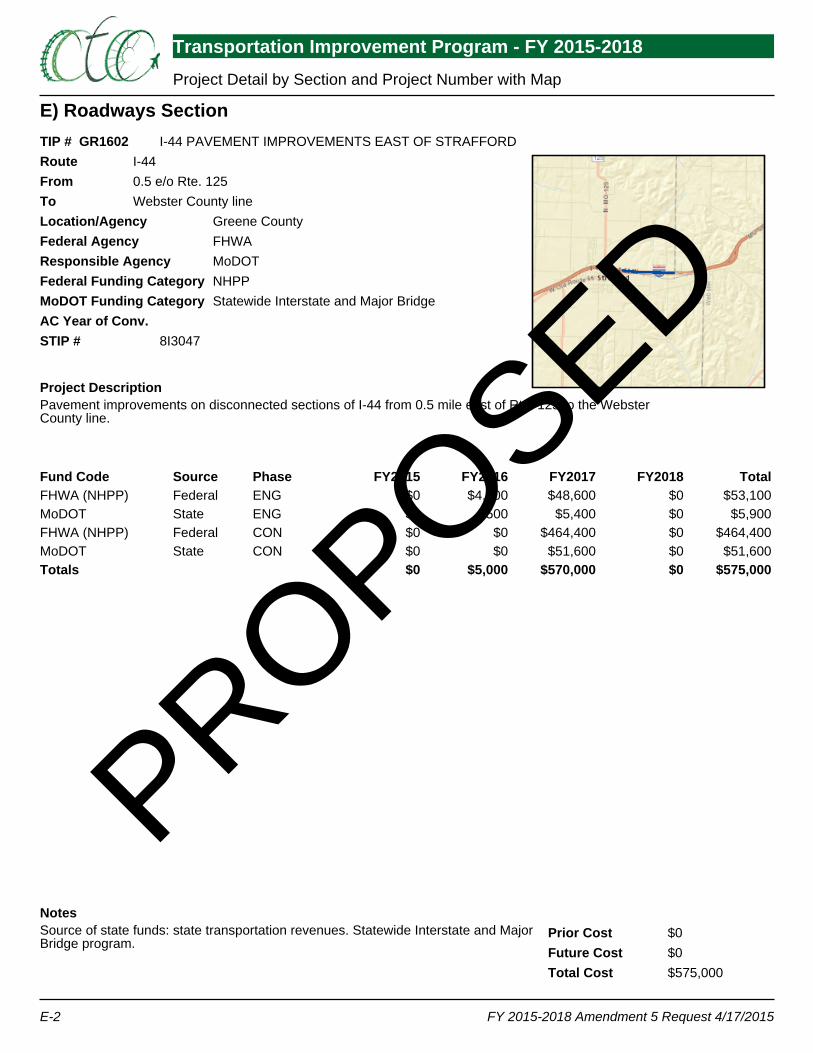
E) Roadways Section
Transportation Improvement Program - FY 2015-2018 Project Detail by Section and Project Number with Map
FY 2015-2018 Amendment 5 Request 4/17/2015E-2
TIP # GR1602RouteFromToLocation/AgencyFederal AgencyResponsible AgencyFederal Funding CategoryMoDOT Funding CategoryAC Year of Conv.STIP #
Project Description
NotesPrior CostFuture CostTotal Cost
I-44 PAVEMENT IMPROVEMENTS EAST OF STRAFFORDI-440.5 e/o Rte. 125Webster County line
Greene CountyFHWAMoDOTNHPPStatewide Interstate and Major Bridge
8I3047
Pavement improvements on disconnected sections of I-44 from 0.5 mile east of Rte. 125 to the WebsterCounty line.
Source of state funds: state transportation revenues. Statewide Interstate and MajorBridge program.
$0$0$575,000
Fund Code Source Phase FY2015 FY2016 FY2017 FY2018 TotalFHWA (NHPP) Federal ENG $0 $4,500 $48,600 $0 $53,100MoDOT State ENG $0 $500 $5,400 $0 $5,900FHWA (NHPP) Federal CON $0 $0 $464,400 $0 $464,400MoDOT State CON $0 $0 $51,600 $0 $51,600Totals $0 $5,000 $570,000 $0 $575,000
PROPOSED
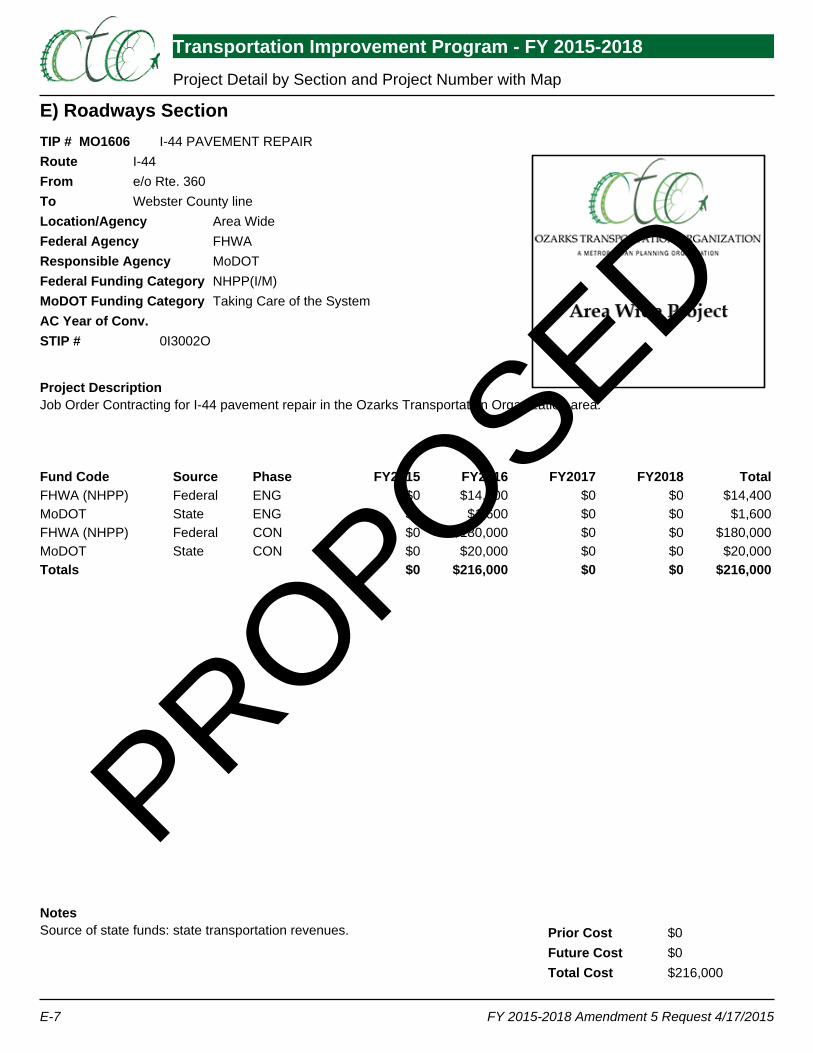
E) Roadways Section
Transportation Improvement Program - FY 2015-2018 Project Detail by Section and Project Number with Map
FY 2015-2018 Amendment 5 Request 4/17/2015E-7
TIP # MO1606RouteFromToLocation/AgencyFederal AgencyResponsible AgencyFederal Funding CategoryMoDOT Funding CategoryAC Year of Conv.STIP #
Project Description
NotesPrior CostFuture CostTotal Cost
I-44 PAVEMENT REPAIRI-44e/o Rte. 360Webster County line
Area WideFHWAMoDOTNHPP(I/M)Taking Care of the System
0I3002O
Job Order Contracting for I-44 pavement repair in the Ozarks Transportation Organization area.
Source of state funds: state transportation revenues. $0$0$216,000
Fund Code Source Phase FY2015 FY2016 FY2017 FY2018 TotalFHWA (NHPP) Federal ENG $0 $14,400 $0 $0 $14,400MoDOT State ENG $0 $1,600 $0 $0 $1,600FHWA (NHPP) Federal CON $0 $180,000 $0 $0 $180,000MoDOT State CON $0 $20,000 $0 $0 $20,000Totals $0 $216,000 $0 $0 $216,000
PROPOSED

E) Roadways Section
Transportation Improvement Program - FY 2015-2018 Project Detail by Section and Project Number with Map
FY 2015-2018 Amendment 5 Request 4/17/2015E-8
TIP # MO1607RouteFromToLocation/AgencyFederal AgencyResponsible AgencyFederal Funding CategoryMoDOT Funding CategoryAC Year of Conv.STIP #
Project Description
NotesPrior CostFuture CostTotal Cost
RESURFACING ON VARIOUS PRIMARY ROUTESVariousN/AN/A
Area WideFHWAMoDOTNHPP(NHS)Taking Care of the System
8P3050
Pavement improvements on primary routes in the OTO area.
Source of MoDOT funds: State transportation revenues. $0$6,638,000$6,689,000
Fund Code Source Phase FY2015 FY2016 FY2017 FY2018 TotalFHWA (NHPP) Federal ENG $0 $8,000 $8,000 $24,800 $40,800MoDOT State ENG $0 $2,000 $2,000 $6,200 $10,200Totals $0 $10,000 $10,000 $31,000 $51,000
PROPOSED
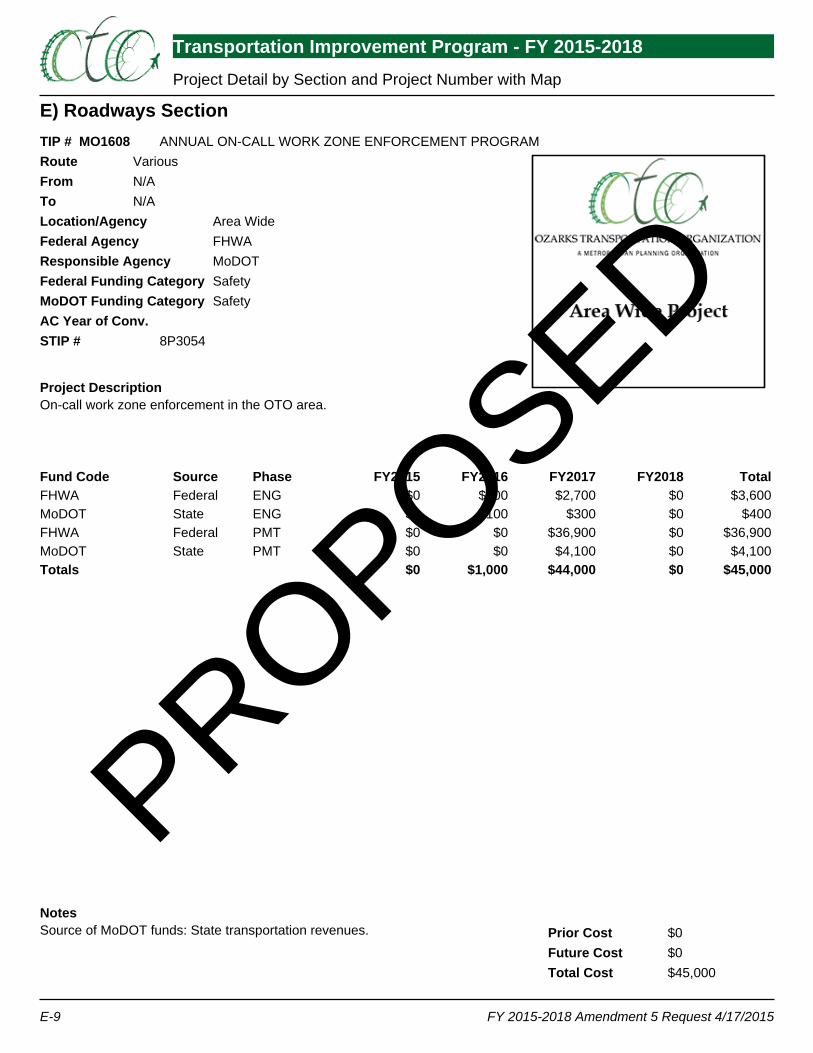
E) Roadways Section
Transportation Improvement Program - FY 2015-2018 Project Detail by Section and Project Number with Map
FY 2015-2018 Amendment 5 Request 4/17/2015E-9
TIP # MO1608RouteFromToLocation/AgencyFederal AgencyResponsible AgencyFederal Funding CategoryMoDOT Funding CategoryAC Year of Conv.STIP #
Project Description
NotesPrior CostFuture CostTotal Cost
ANNUAL ON-CALL WORK ZONE ENFORCEMENT PROGRAMVariousN/AN/A
Area WideFHWAMoDOTSafetySafety
8P3054
On-call work zone enforcement in the OTO area.
Source of MoDOT funds: State transportation revenues. $0$0$45,000
Fund Code Source Phase FY2015 FY2016 FY2017 FY2018 TotalFHWA Federal ENG $0 $900 $2,700 $0 $3,600MoDOT State ENG $0 $100 $300 $0 $400FHWA Federal PMT $0 $0 $36,900 $0 $36,900MoDOT State PMT $0 $0 $4,100 $0 $4,100Totals $0 $1,000 $44,000 $0 $45,000
PROPOSED

E) Roadways Section
Transportation Improvement Program - FY 2015-2018 Project Detail by Section and Project Number with Map
FY 2015-2018 Amendment 5 Request 4/17/2015E-10
TIP # MO1609RouteFromToLocation/AgencyFederal AgencyResponsible AgencyFederal Funding CategoryMoDOT Funding CategoryAC Year of Conv.STIP #
Project Description
NotesPrior CostFuture CostTotal Cost
SCOPING FOR BRIDGE IMPROVEMENTSVariousN/AN/A
Area WideFHWAMoDOT
Taking Care of the SystemFY 2017, FY 2018, FY 2019, FY8P3052
Scoping for bridge improvements in the OTO area.
Source of MoDOT funds: State transportation revenues. $0$10,000$40,000
Fund Code Source Phase FY2015 FY2016 FY2017 FY2018 TotalMoDOT State ENG $0 $2,000 $2,000 $2,000 $6,000MoDOT-AC State ENG $0 $8,000 $8,000 $8,000 $24,000Totals $0 $10,000 $10,000 $10,000 $30,000
PROPOSED

E) Roadways Section
Transportation Improvement Program - FY 2015-2018 Project Detail by Section and Project Number with Map
FY 2015-2018 Amendment 5 Request 4/17/2015E-11
TIP # MO1610RouteFromToLocation/AgencyFederal AgencyResponsible AgencyFederal Funding CategoryMoDOT Funding CategoryAC Year of Conv.STIP #
Project Description
NotesPrior CostFuture CostTotal Cost
SCOPING FOR VARIOUS SAFETY IMPROVEMENTSVariousN/AN/A
Area WideFHWAMoDOTSafetySafety
FY 2017, FY 2018, FY 2019, FY8P3053
Scoping for safety improvements at various locations in the OTO area.
Source of MoDOT funds: State transportation revenues. $0$10,000$40,000
Fund Code Source Phase FY2015 FY2016 FY2017 FY2018 TotalMoDOT State ENG $0 $2,000 $2,000 $2,000 $6,000MoDOT-AC State ENG $0 $8,000 $8,000 $8,000 $24,000Totals $0 $10,000 $10,000 $10,000 $30,000
PROPOSED
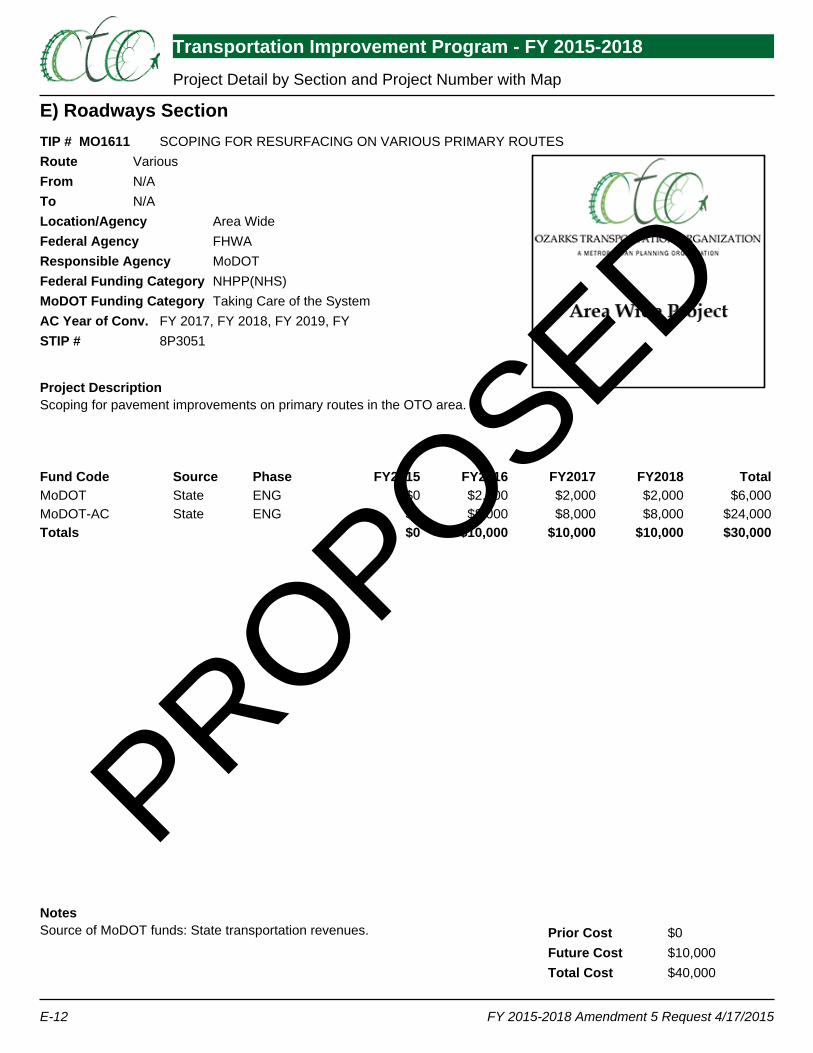
E) Roadways Section
Transportation Improvement Program - FY 2015-2018 Project Detail by Section and Project Number with Map
FY 2015-2018 Amendment 5 Request 4/17/2015E-12
TIP # MO1611RouteFromToLocation/AgencyFederal AgencyResponsible AgencyFederal Funding CategoryMoDOT Funding CategoryAC Year of Conv.STIP #
Project Description
NotesPrior CostFuture CostTotal Cost
SCOPING FOR RESURFACING ON VARIOUS PRIMARY ROUTESVariousN/AN/A
Area WideFHWAMoDOTNHPP(NHS)Taking Care of the System
FY 2017, FY 2018, FY 2019, FY8P3051
Scoping for pavement improvements on primary routes in the OTO area.
Source of MoDOT funds: State transportation revenues. $0$10,000$40,000
Fund Code Source Phase FY2015 FY2016 FY2017 FY2018 TotalMoDOT State ENG $0 $2,000 $2,000 $2,000 $6,000MoDOT-AC State ENG $0 $8,000 $8,000 $8,000 $24,000Totals $0 $10,000 $10,000 $10,000 $30,000
PROPOSED
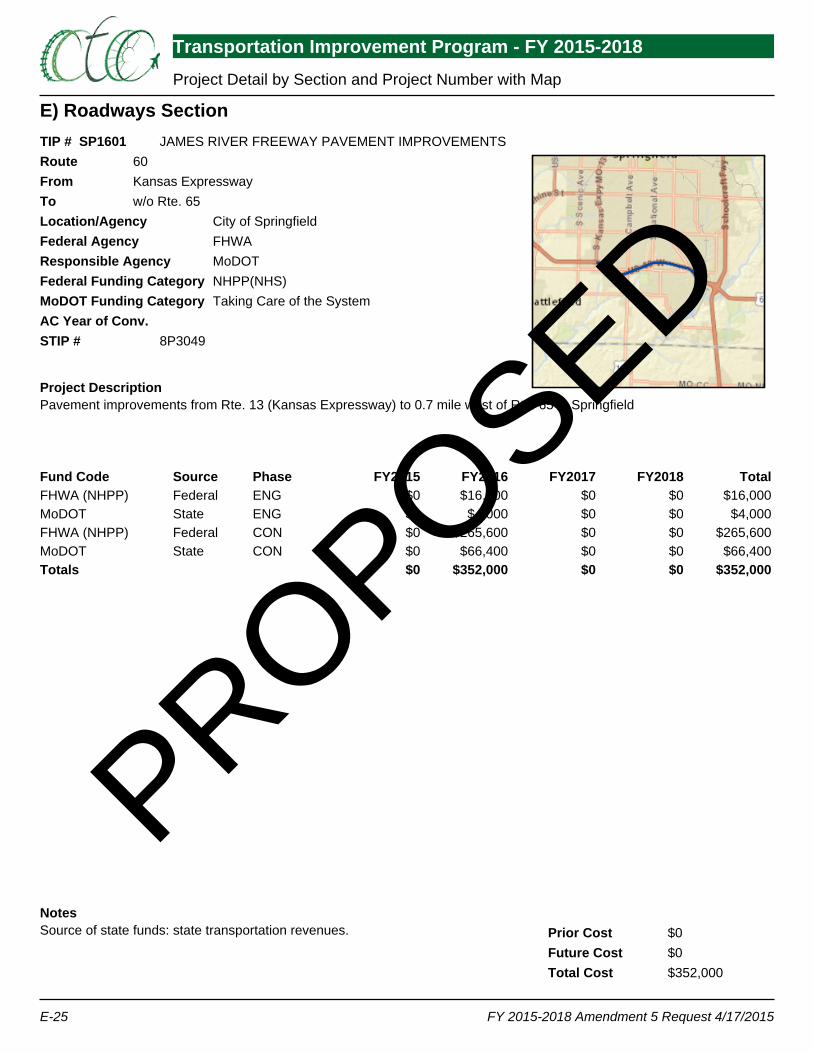
E) Roadways Section
Transportation Improvement Program - FY 2015-2018 Project Detail by Section and Project Number with Map
FY 2015-2018 Amendment 5 Request 4/17/2015E-25
TIP # SP1601RouteFromToLocation/AgencyFederal AgencyResponsible AgencyFederal Funding CategoryMoDOT Funding CategoryAC Year of Conv.STIP #
Project Description
NotesPrior CostFuture CostTotal Cost
JAMES RIVER FREEWAY PAVEMENT IMPROVEMENTS60Kansas Expresswayw/o Rte. 65
City of SpringfieldFHWAMoDOTNHPP(NHS)Taking Care of the System
8P3049
Pavement improvements from Rte. 13 (Kansas Expressway) to 0.7 mile west of Rte. 65 in Springfield
Source of state funds: state transportation revenues. $0$0$352,000
Fund Code Source Phase FY2015 FY2016 FY2017 FY2018 TotalFHWA (NHPP) Federal ENG $0 $16,000 $0 $0 $16,000MoDOT State ENG $0 $4,000 $0 $0 $4,000FHWA (NHPP) Federal CON $0 $265,600 $0 $0 $265,600MoDOT State CON $0 $66,400 $0 $0 $66,400Totals $0 $352,000 $0 $0 $352,000
PROPOSED
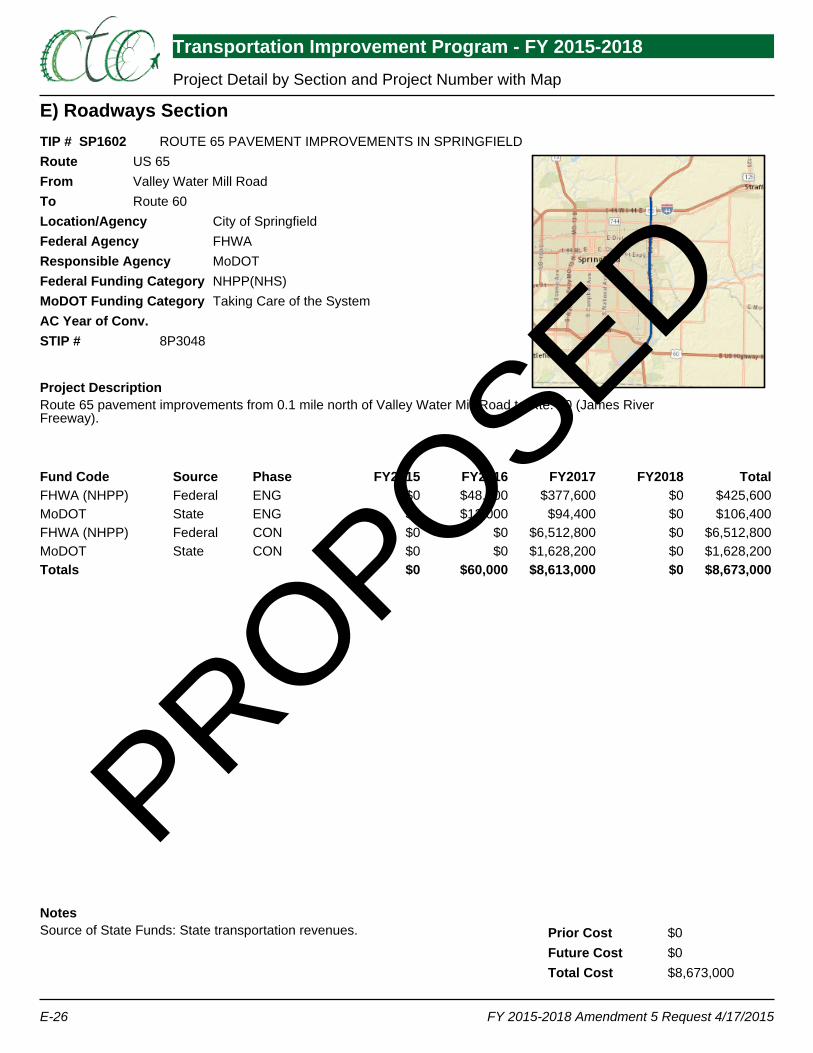
E) Roadways Section
Transportation Improvement Program - FY 2015-2018 Project Detail by Section and Project Number with Map
FY 2015-2018 Amendment 5 Request 4/17/2015E-26
TIP # SP1602RouteFromToLocation/AgencyFederal AgencyResponsible AgencyFederal Funding CategoryMoDOT Funding CategoryAC Year of Conv.STIP #
Project Description
NotesPrior CostFuture CostTotal Cost
ROUTE 65 PAVEMENT IMPROVEMENTS IN SPRINGFIELDUS 65Valley Water Mill RoadRoute 60
City of SpringfieldFHWAMoDOTNHPP(NHS)Taking Care of the System
8P3048
Route 65 pavement improvements from 0.1 mile north of Valley Water Mill Road to Rte. 60 (James RiverFreeway).
Source of State Funds: State transportation revenues. $0$0$8,673,000
Fund Code Source Phase FY2015 FY2016 FY2017 FY2018 TotalFHWA (NHPP) Federal ENG $0 $48,000 $377,600 $0 $425,600MoDOT State ENG $0 $12,000 $94,400 $0 $106,400FHWA (NHPP) Federal CON $0 $0 $6,512,800 $0 $6,512,800MoDOT State CON $0 $0 $1,628,200 $0 $1,628,200Totals $0 $60,000 $8,613,000 $0 $8,673,000
PROPOSED
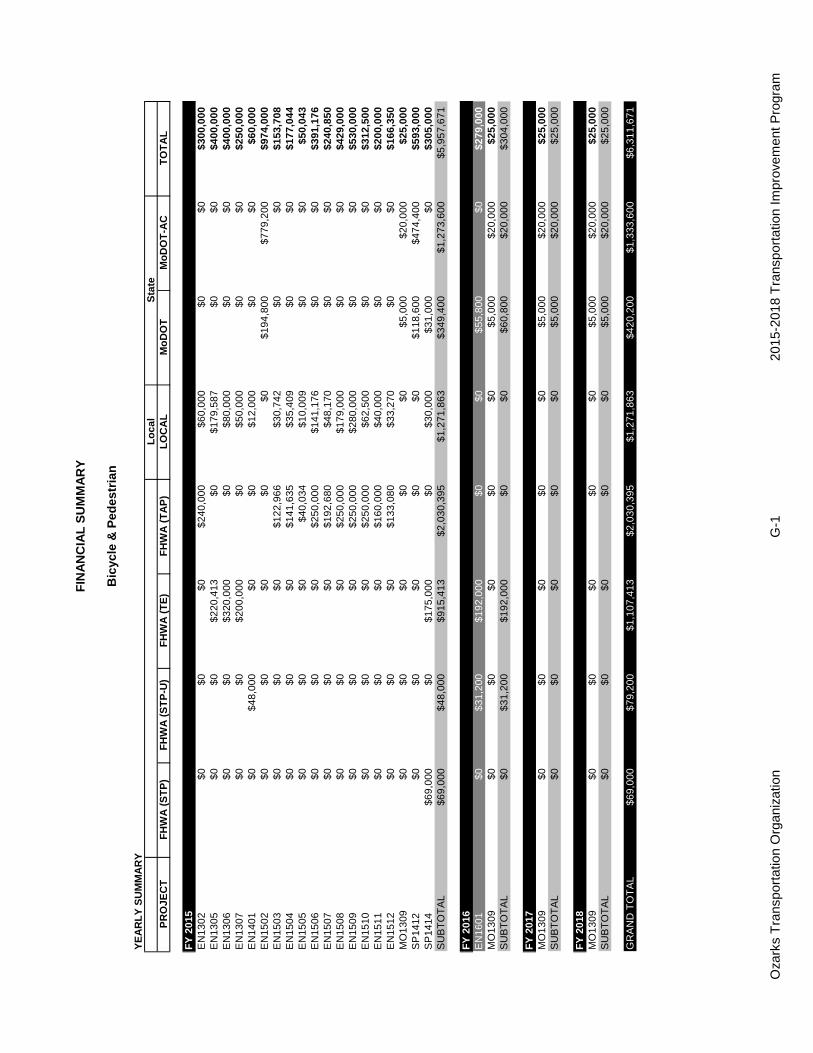
Oza
rks
Tra
nspo
rtat
ion
Org
aniz
atio
nG
-120
15-2
018
Tra
nspo
rtat
ion
Impr
ovem
ent P
rogr
am
YE
AR
LY
SU
MM
AR
YL
oc
al
PR
OJ
EC
TF
HW
A (
ST
P)
FH
WA
(S
TP
-U)
FH
WA
(T
E)
FH
WA
(T
AP
)L
OC
AL
Mo
DO
TM
oD
OT
-AC
TO
TA
L
EN
13
02
$0
$0
$0
$2
40
,00
0$
60
,00
0$
0$
0$
30
0,0
00
EN
13
05
$0
$0
$2
20
,41
3$
0$
17
9,5
87
$0
$0
$4
00
,00
0E
N1
30
6$
0$
0$
32
0,0
00
$0
$8
0,0
00
$0
$0
$4
00
,00
0E
N1
30
7$
0$
0$
20
0,0
00
$0
$5
0,0
00
$0
$0
$2
50
,00
0E
N1
40
1$
0$
48
,00
0$
0$
0$
12
,00
0$
0$
0$
60
,00
0E
N1
50
2$
0$
0$
0$
0$
0$
19
4,8
00
$7
79
,20
0$
97
4,0
00
EN
15
03
$0
$0
$0
$1
22
,96
6$
30
,74
2$
0$
0$
15
3,7
08
EN
15
04
$0
$0
$0
$1
41
,63
5$
35
,40
9$
0$
0$
17
7,0
44
EN
15
05
$0
$0
$0
$4
0,0
34
$1
0,0
09
$0
$0
$5
0,0
43
EN
15
06
$0
$0
$0
$2
50
,00
0$
14
1,1
76
$0
$0
$3
91
,17
6E
N1
50
7$
0$
0$
0$
19
2,6
80
$4
8,1
70
$0
$0
$2
40
,85
0E
N1
50
8$
0$
0$
0$
25
0,0
00
$1
79
,00
0$
0$
0$
42
9,0
00
EN
15
09
$0
$0
$0
$2
50
,00
0$
28
0,0
00
$0
$0
$5
30
,00
0E
N1
51
0$
0$
0$
0$
25
0,0
00
$6
2,5
00
$0
$0
$3
12
,50
0E
N1
51
1$
0$
0$
0$
16
0,0
00
$4
0,0
00
$0
$0
$2
00
,00
0E
N1
51
2$
0$
0$
0$
13
3,0
80
$3
3,2
70
$0
$0
$1
66
,35
0M
O1
30
9$
0$
0$
0$
0$
0$
5,0
00
$2
0,0
00
$2
5,0
00
SP
14
12
$0
$0
$0
$0
$0
$1
18
,60
0$
47
4,4
00
$5
93
,00
0S
P1
41
4$
69
,00
0$
0$
17
5,0
00
$0
$3
0,0
00
$3
1,0
00
$0
$3
05
,00
0S
UB
TO
TA
L$
69
,00
0$
48
,00
0$
91
5,4
13
$2
,03
0,3
95
$1
,27
1,8
63
$3
49
,40
0$
1,2
73
,60
0$
5,9
57
,67
1
EN
16
01
$0
$3
1,2
00
$1
92
,00
0$
0$
0$
55
,80
0$
0$
27
9,0
00
MO
13
09
$0
$0
$0
$0
$0
$5
,00
0$
20
,00
0$
25
,00
0S
UB
TO
TA
L$
0$
31
,20
0$
19
2,0
00
$0
$0
$6
0,8
00
$2
0,0
00
$3
04
,00
0
MO
13
09
$0
$0
$0
$0
$0
$5
,00
0$
20
,00
0$
25
,00
0S
UB
TO
TA
L$
0$
0$
0$
0$
0$
5,0
00
$2
0,0
00
$2
5,0
00
MO
13
09
$0
$0
$0
$0
$0
$5
,00
0$
20
,00
0$
25
,00
0S
UB
TO
TA
L$
0$
0$
0$
0$
0$
5,0
00
$2
0,0
00
$2
5,0
00
GR
AN
D T
OT
AL
$6
9,0
00
$7
9,2
00
$1
,10
7,4
13
$2
,03
0,3
95
$1
,27
1,8
63
$4
20
,20
0$
1,3
33
,60
0$
6,3
11
,67
1
FY
20
16
FY
20
17
FY
20
18
FIN
AN
CIA
L S
UM
MA
RY
Bic
ycle
& P
edes
tria
n
Sta
te
FY
20
15
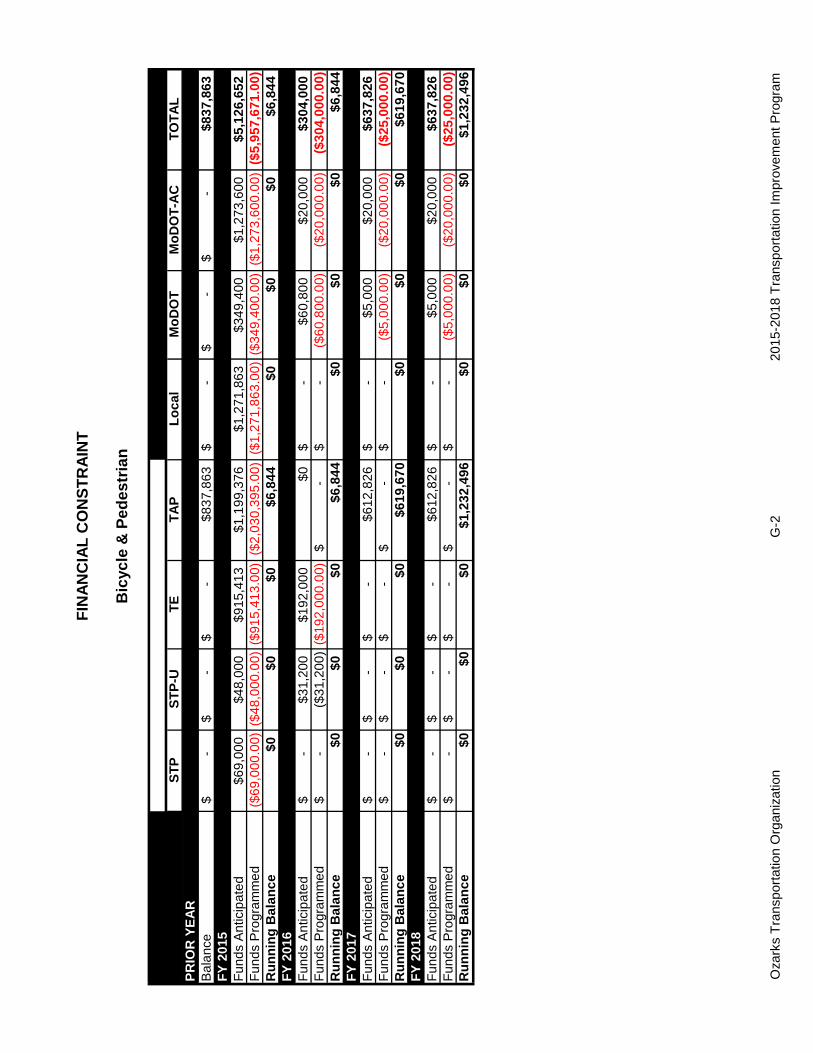
Oza
rks
Tra
nspo
rtat
ion
Org
aniz
atio
nG
-220
15-2
018
Tra
nspo
rtat
ion
Impr
ovem
ent P
rogr
am
ST
PS
TP
-UT
ET
AP
Lo
ca
lM
oD
OT
Mo
DO
T-A
CT
OT
AL
PR
IOR
YE
AR
Ba
lan
ce
-$
-$
-$
$
83
7,8
63
-$
-
$
-$
$
83
7,8
63
FY
20
15
Fu
nd
s A
ntic
ipa
ted
$6
9,0
00
$4
8,0
00
$9
15
,41
3$
1,1
99
,37
6$
1,2
71
,86
3$
34
9,4
00
$1
,27
3,6
00
$5
,12
6,6
52
Fu
nd
s P
rogr
am
me
d($
69
,00
0.0
0)
($4
8,0
00
.00
)($
91
5,4
13
.00
)($
2,0
30
,39
5.0
0)
($1
,27
1,8
63
.00
)($
34
9,4
00
.00
)($
1,2
73
,60
0.0
0)
($5
,95
7,6
71
.00
)R
un
nin
g B
ala
nc
e$
0$
0$
0$
6,8
44
$0
$0
$0
$6
,84
4F
Y 2
01
6F
un
ds
An
ticip
ate
d-
$
$
31
,20
0$
19
2,0
00
$0
-$
$
60
,80
0$
20
,00
0$
30
4,0
00
Fu
nd
s P
rogr
am
me
d-
$
($
31
,20
0)
($1
92
,00
0.0
0)
-$
-
$
($6
0,8
00
.00
)($
20
,00
0.0
0)
($3
04
,00
0.0
0)
Ru
nn
ing
Ba
lan
ce
$0
$0
$0
$6
,84
4$
0$
0$
0$
6,8
44
FY
20
17
Fu
nd
s A
ntic
ipa
ted
-$
-$
-$
$
61
2,8
26
-$
$
5,0
00
$2
0,0
00
$6
37
,82
6F
un
ds
Pro
gra
mm
ed
-$
-$
-$
-
$
-$
($
5,0
00
.00
)($
20
,00
0.0
0)
($2
5,0
00
.00
)R
un
nin
g B
ala
nc
e$
0$
0$
0$
61
9,6
70
$0
$0
$0
$6
19
,67
0F
Y 2
01
8F
un
ds
An
ticip
ate
d-
$
-
$
-
$
$6
12
,82
6-
$
$5
,00
0$
20
,00
0$
63
7,8
26
Fu
nd
s P
rogr
am
me
d-
$
-
$
-
$
-$
-
$
($5
,00
0.0
0)
($2
0,0
00
.00
)($
25
,00
0.0
0)
Ru
nn
ing
Ba
lan
ce
$0
$0
$0
$1
,23
2,4
96
$0
$0
$0
$1
,23
2,4
96
FIN
AN
CIA
L C
ON
ST
RA
INT
Bic
ycle
& P
ed
es
tria
n
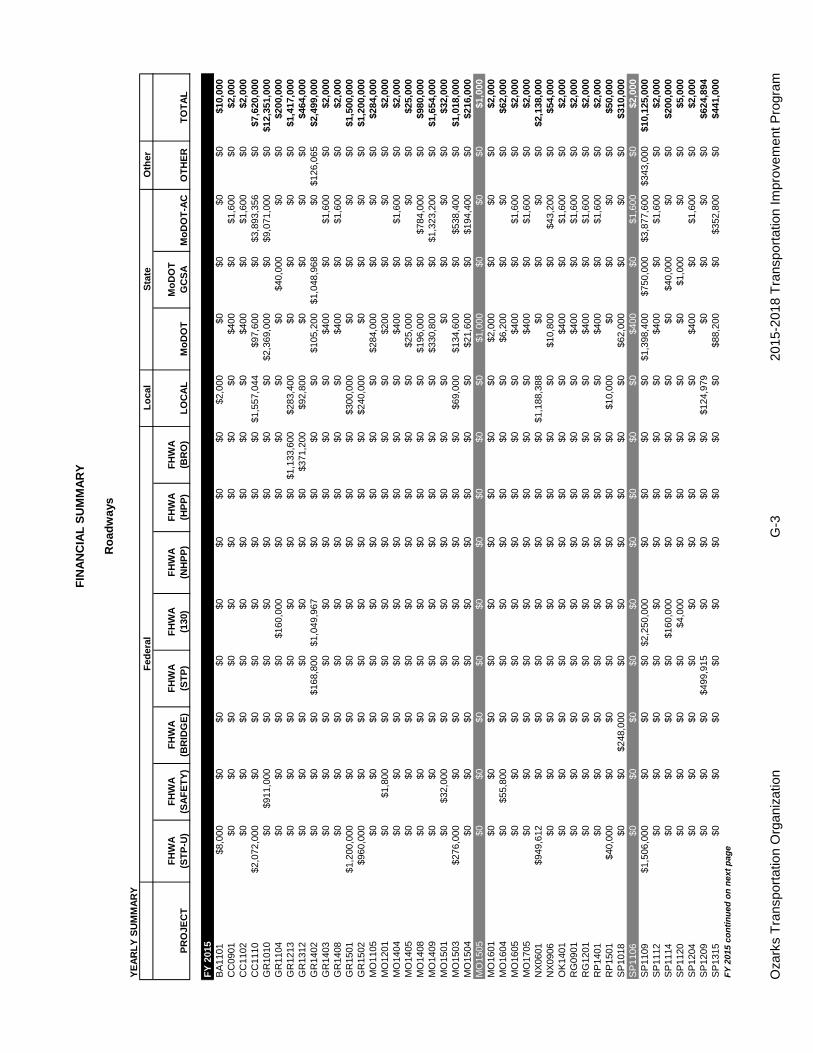
Oza
rks
Tra
nspo
rtat
ion
Org
aniz
atio
nG
-320
15-2
018
Tra
nspo
rtat
ion
Impr
ovem
ent P
rogr
am
YE
AR
LY
SU
MM
AR
YL
oca
lO
ther
PR
OJE
CT
FH
WA
(ST
P-U
)F
HW
A(S
AF
ET
Y)
FH
WA
(BR
IDG
E)
FH
WA
(ST
P)
FH
WA
(130
)F
HW
A(N
HP
P)
FH
WA
(HP
P)
FH
WA
(BR
O)
LO
CA
LM
oD
OT
Mo
DO
TG
CS
AM
oD
OT
-AC
OT
HE
RT
OT
AL
BA
1101
$8,0
00$0
$0$0
$0$0
$0$0
$2,0
00$0
$0$0
$0$1
0,00
0C
C09
01$0
$0$0
$0$0
$0$0
$0$0
$400
$0$1
,600
$0$2
,000
CC
1102
$0$0
$0$0
$0$0
$0$0
$0$4
00$0
$1,6
00$0
$2,0
00C
C11
10$2
,072
,000
$0$0
$0$0
$0$0
$0$1
,557
,044
$97,
600
$0$3
,893
,356
$0$7
,620
,000
GR
1010
$0$9
11,0
00$0
$0$0
$0$0
$0$0
$2,3
69,0
00$0
$9,0
71,0
00$0
$12,
351,
000
GR
1104
$0$0
$0$0
$160
,000
$0$0
$0$0
$0$4
0,00
0$0
$0$2
00,0
00G
R12
13$0
$0$0
$0$0
$0$0
$1,1
33,6
00$2
83,4
00$0
$0$0
$0$1
,417
,000
GR
1312
$0$0
$0$0
$0$0
$0$3
71,2
00$9
2,80
0$0
$0$0
$0$4
64,0
00G
R14
02$0
$0$0
$168
,800
$1,0
49,9
67$0
$0$0
$0$1
05,2
00$1
,048
,968
$0$1
26,0
65$2
,499
,000
GR
1403
$0$0
$0$0
$0$0
$0$0
$0$4
00$0
$1,6
00$0
$2,0
00G
R14
08$0
$0$0
$0$0
$0$0
$0$0
$400
$0$1
,600
$0$2
,000
GR
1501
$1,2
00,0
00$0
$0$0
$0$0
$0$0
$300
,000
$0$0
$0$0
$1,5
00,0
00G
R15
02$9
60,0
00$0
$0$0
$0$0
$0$0
$240
,000
$0$0
$0$0
$1,2
00,0
00M
O11
05$0
$0$0
$0$0
$0$0
$0$0
$284
,000
$0$0
$0$2
84,0
00M
O12
01$0
$1,8
00$0
$0$0
$0$0
$0$0
$200
$0$0
$0$2
,000
MO
1404
$0$0
$0$0
$0$0
$0$0
$0$4
00$0
$1,6
00$0
$2,0
00M
O14
05$0
$0$0
$0$0
$0$0
$0$0
$25,
000
$0$0
$0$2
5,00
0M
O14
08$0
$0$0
$0$0
$0$0
$0$0
$196
,000
$0$7
84,0
00$0
$980
,000
MO
1409
$0$0
$0$0
$0$0
$0$0
$0$3
30,8
00$0
$1,3
23,2
00$0
$1,6
54,0
00M
O15
01$0
$32,
000
$0$0
$0$0
$0$0
$0$0
$0$0
$0$3
2,00
0M
O15
03$2
76,0
00$0
$0$0
$0$0
$0$0
$69,
000
$134
,600
$0$5
38,4
00$0
$1,0
18,0
00M
O15
04$0
$0$0
$0$0
$0$0
$0$0
$21,
600
$0$1
94,4
00$0
$216
,000
MO
1505
$0$0
$0$0
$0$0
$0$0
$0$1
,000
$0$0
$0$1
,000
MO
1601
$0$0
$0$0
$0$0
$0$0
$0$2
,000
$0$0
$0$2
,000
MO
1604
$0$5
5,80
0$0
$0$0
$0$0
$0$0
$6,2
00$0
$0$0
$62,
000
MO
1605
$0$0
$0$0
$0$0
$0$0
$0$4
00$0
$1,6
00$0
$2,0
00M
O17
05$0
$0$0
$0$0
$0$0
$0$0
$400
$0$1
,600
$0$2
,000
NX
0601
$949
,612
$0$0
$0$0
$0$0
$0$1
,188
,388
$0$0
$0$0
$2,1
38,0
00N
X09
06$0
$0$0
$0$0
$0$0
$0$0
$10,
800
$0$4
3,20
0$0
$54,
000
OK
1401
$0$0
$0$0
$0$0
$0$0
$0$4
00$0
$1,6
00$0
$2,0
00R
G09
01$0
$0$0
$0$0
$0$0
$0$0
$400
$0$1
,600
$0$2
,000
RG
1201
$0$0
$0$0
$0$0
$0$0
$0$4
00$0
$1,6
00$0
$2,0
00R
P14
01$0
$0$0
$0$0
$0$0
$0$0
$400
$0$1
,600
$0$2
,000
RP
1501
$40,
000
$0$0
$0$0
$0$0
$0$1
0,00
0$0
$0$0
$0$5
0,00
0S
P10
18$0
$0$2
48,0
00$0
$0$0
$0$0
$0$6
2,00
0$0
$0$0
$310
,000
SP
1106
$0$0
$0$0
$0$0
$0$0
$0$4
00$0
$1,6
00$0
$2,0
00S
P11
09$1
,506
,000
$0$0
$0$2
,250
,000
$0$0
$0$0
$1,3
98,4
00$7
50,0
00$3
,877
,600
$343
,000
$10,
125,
000
SP
1112
$0$0
$0$0
$0$0
$0$0
$0$4
00$0
$1,6
00$0
$2,0
00S
P11
14$0
$0$0
$0$1
60,0
00$0
$0$0
$0$0
$40,
000
$0$0
$200
,000
SP
1120
$0$0
$0$0
$4,0
00$0
$0$0
$0$0
$1,0
00$0
$0$5
,000
SP
1204
$0$0
$0$0
$0$0
$0$0
$0$4
00$0
$1,6
00$0
$2,0
00S
P12
09$0
$0$0
$499
,915
$0$0
$0$0
$124
,979
$0$0
$0$0
$624
,894
SP
1315
$0$0
$0$0
$0$0
$0$0
$0$8
8,20
0$0
$352
,800
$0$4
41,0
00
FY
201
5
FIN
AN
CIA
L S
UM
MA
RY
Ro
adw
ays
Fed
eral
Sta
te
FY 2
015
cont
inue
d on
nex
t pag
e
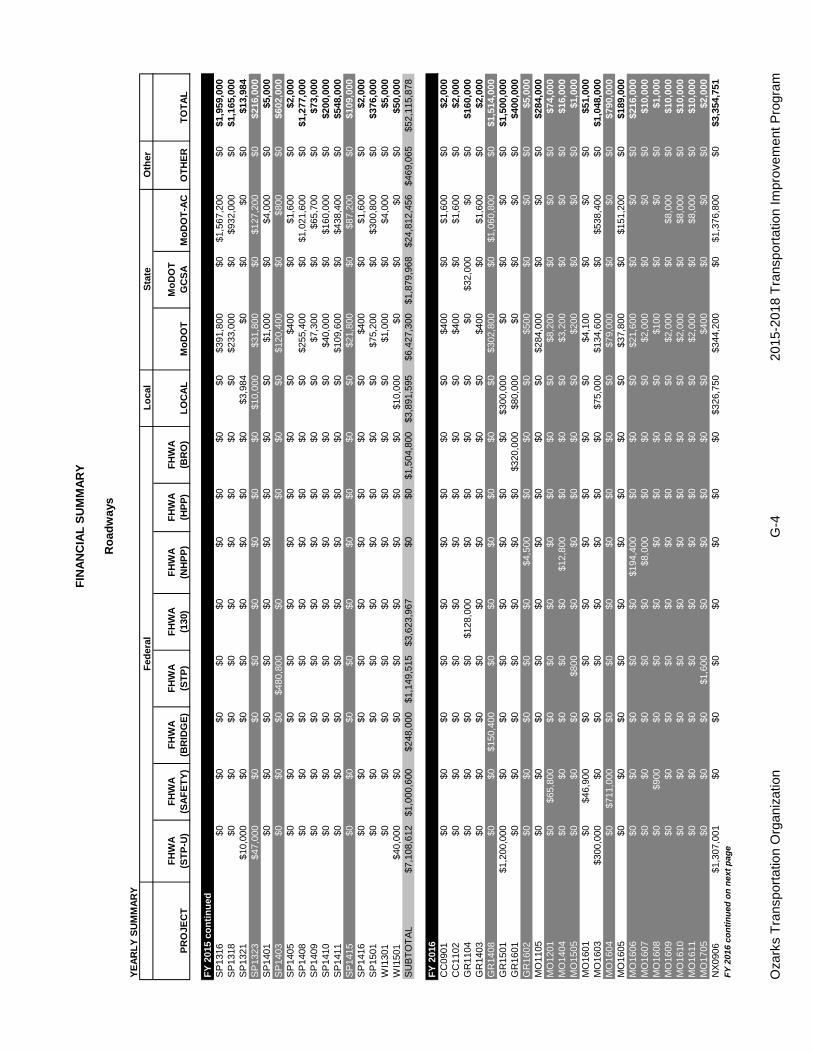
Oza
rks
Tra
nspo
rtat
ion
Org
aniz
atio
nG
-420
15-2
018
Tra
nspo
rtat
ion
Impr
ovem
ent P
rogr
am
YE
AR
LY
SU
MM
AR
YL
oca
lO
ther
PR
OJE
CT
FH
WA
(ST
P-U
)F
HW
A(S
AF
ET
Y)
FH
WA
(BR
IDG
E)
FH
WA
(ST
P)
FH
WA
(130
)F
HW
A(N
HP
P)
FH
WA
(HP
P)
FH
WA
(BR
O)
LO
CA
LM
oD
OT
Mo
DO
TG
CS
AM
oD
OT
-AC
OT
HE
RT
OT
AL
FIN
AN
CIA
L S
UM
MA
RY
Ro
adw
ays
Fed
eral
Sta
te
SP
1316
$0$0
$0$0
$0$0
$0$0
$0$3
91,8
00$0
$1,5
67,2
00$0
$1,9
59,0
00S
P13
18$0
$0$0
$0$0
$0$0
$0$0
$233
,000
$0$9
32,0
00$0
$1,1
65,0
00S
P13
21$1
0,00
0$0
$0$0
$0$0
$0$0
$3,9
84$0
$0$0
$0$1
3,98
4S
P13
23$4
7,00
0$0
$0$0
$0$0
$0$0
$10,
000
$31,
800
$0$1
27,2
00$0
$216
,000
SP
1401
$0$0
$0$0
$0$0
$0$0
$0$1
,000
$0$4
,000
$0$5
,000
SP
1403
$0$0
$0$4
80,8
00$0
$0$0
$0$1
20,4
00$0
$800
$0$6
02,0
00S
P14
05$0
$0$0
$0$0
$0$0
$0$0
$400
$0$1
,600
$0$2
,000
SP
1408
$0$0
$0$0
$0$0
$0$0
$0$2
55,4
00$0
$1,0
21,6
00$0
$1,2
77,0
00S
P14
09$0
$0$0
$0$0
$0$0
$0$0
$7,3
00$0
$65,
700
$0$7
3,00
0S
P14
10$0
$0$0
$0$0
$0$0
$0$0
$40,
000
$0$1
60,0
00$0
$200
,000
SP
1411
$0$0
$0$0
$0$0
$0$0
$0$1
09,6
00$0
$438
,400
$0$5
48,0
00S
P14
15$0
$0$0
$0$0
$0$0
$0$0
$21,
800
$0$8
7,20
0$0
$109
,000
SP
1416
$0$0
$0$0
$0$0
$0$0
$0$4
00$0
$1,6
00$0
$2,0
00S
P15
01$0
$0$0
$0$0
$0$0
$0$0
$75,
200
$0$3
00,8
00$0
$376
,000
WI1
301
$0$0
$0$0
$0$0
$0$0
$0$1
,000
$0$4
,000
$0$5
,000
WI1
501
$40,
000
$0$0
$0$0
$0$0
$0$1
0,00
0$0
$0$0
$0$5
0,00
0S
UB
TO
TA
L$7
,108
,612
$1,0
00,6
00$2
48,0
00$1
,149
,515
$3,6
23,9
67$0
$0$1
,504
,800
$3,8
91,5
95$6
,427
,300
$1,8
79,9
68$2
4,81
2,45
6$4
69,0
65$5
2,11
5,87
8
CC
0901
$0$0
$0$0
$0$0
$0$0
$0$4
00$0
$1,6
00$0
$2,0
00C
C11
02$0
$0$0
$0$0
$0$0
$0$0
$400
$0$1
,600
$0$2
,000
GR
1104
$0$0
$0$0
$128
,000
$0$0
$0$0
$0$3
2,00
0$0
$0$1
60,0
00G
R14
03$0
$0$0
$0$0
$0$0
$0$0
$400
$0$1
,600
$0$2
,000
GR
1408
$0$0
$150
,400
$0$0
$0$0
$0$0
$302
,800
$0$1
,060
,800
$0$1
,514
,000
GR
1501
$1,2
00,0
00$0
$0$0
$0$0
$0$0
$300
,000
$0$0
$0$0
$1,5
00,0
00G
R16
01$0
$0$0
$0$0
$0$0
$320
,000
$80,
000
$0$0
$0$0
$400
,000
GR
1602
$0$0
$0$0
$0$4
,500
$0$0
$0$5
00$0
$0$0
$5,0
00M
O11
05$0
$0$0
$0$0
$0$0
$0$0
$284
,000
$0$0
$0$2
84,0
00M
O12
01$0
$65,
800
$0$0
$0$0
$0$0
$0$8
,200
$0$0
$0$7
4,00
0M
O14
04$0
$0$0
$0$0
$12,
800
$0$0
$0$3
,200
$0$0
$0$1
6,00
0M
O15
05$0
$0$0
$800
$0$0
$0$0
$0$2
00$0
$0$0
$1,0
00M
O16
01$0
$46,
900
$0$0
$0$0
$0$0
$0$4
,100
$0$0
$0$5
1,00
0M
O16
03$3
00,0
00$0
$0$0
$0$0
$0$0
$75,
000
$134
,600
$0$5
38,4
00$0
$1,0
48,0
00M
O16
04$0
$711
,000
$0$0
$0$0
$0$0
$0$7
9,00
0$0
$0$0
$790
,000
MO
1605
$0$0
$0$0
$0$0
$0$0
$0$3
7,80
0$0
$151
,200
$0$1
89,0
00M
O16
06$0
$0$0
$0$0
$194
,400
$0$0
$0$2
1,60
0$0
$0$0
$216
,000
MO
1607
$0$0
$0$0
$0$8
,000
$0$0
$0$2
,000
$0$0
$0$1
0,00
0M
O16
08$0
$900
$0$0
$0$0
$0$0
$0$1
00$0
$0$0
$1,0
00M
O16
09$0
$0$0
$0$0
$0$0
$0$0
$2,0
00$0
$8,0
00$0
$10,
000
MO
1610
$0$0
$0$0
$0$0
$0$0
$0$2
,000
$0$8
,000
$0$1
0,00
0M
O16
11$0
$0$0
$0$0
$0$0
$0$0
$2,0
00$0
$8,0
00$0
$10,
000
MO
1705
$0$0
$0$1
,600
$0$0
$0$0
$0$4
00$0
$0$0
$2,0
00N
X09
06$1
,307
,001
$0$0
$0$0
$0$0
$0$3
26,7
50$3
44,2
00$0
$1,3
76,8
00$0
$3,3
54,7
51
FY
201
5 co
nti
nu
ed
FY
201
6
FY 2
016
cont
inue
d on
nex
t pag
e
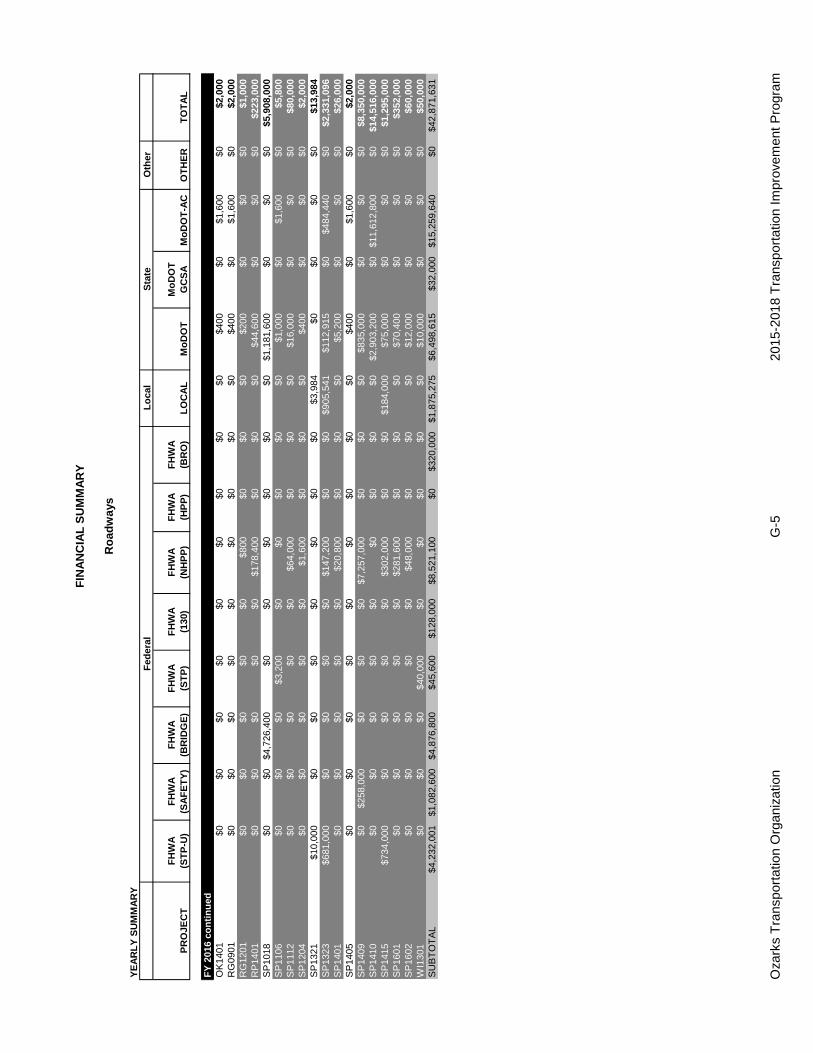
Oza
rks
Tra
nspo
rtat
ion
Org
aniz
atio
nG
-520
15-2
018
Tra
nspo
rtat
ion
Impr
ovem
ent P
rogr
am
YE
AR
LY
SU
MM
AR
YL
oca
lO
ther
PR
OJE
CT
FH
WA
(ST
P-U
)F
HW
A(S
AF
ET
Y)
FH
WA
(BR
IDG
E)
FH
WA
(ST
P)
FH
WA
(130
)F
HW
A(N
HP
P)
FH
WA
(HP
P)
FH
WA
(BR
O)
LO
CA
LM
oD
OT
Mo
DO
TG
CS
AM
oD
OT
-AC
OT
HE
RT
OT
AL
FIN
AN
CIA
L S
UM
MA
RY
Ro
adw
ays
Fed
eral
Sta
te
OK
1401
$0$0
$0$0
$0$0
$0$0
$0$4
00$0
$1,6
00$0
$2,0
00R
G09
01$0
$0$0
$0$0
$0$0
$0$0
$400
$0$1
,600
$0$2
,000
RG
1201
$0$0
$0$0
$0$8
00$0
$0$0
$200
$0$0
$0$1
,000
RP
1401
$0$0
$0$0
$0$1
78,4
00$0
$0$0
$44,
600
$0$0
$0$2
23,0
00S
P10
18$0
$0$4
,726
,400
$0$0
$0$0
$0$0
$1,1
81,6
00$0
$0$0
$5,9
08,0
00S
P11
06$0
$0$0
$3,2
00$0
$0$0
$0$0
$1,0
00$0
$1,6
00$0
$5,8
00S
P11
12$0
$0$0
$0$0
$64,
000
$0$0
$0$1
6,00
0$0
$0$0
$80,
000
SP
1204
$0$0
$0$0
$0$1
,600
$0$0
$0$4
00$0
$0$0
$2,0
00S
P13
21$1
0,00
0$0
$0$0
$0$0
$0$0
$3,9
84$0
$0$0
$0$1
3,98
4S
P13
23$6
81,0
00$0
$0$0
$0$1
47,2
00$0
$0$9
05,5
41$1
12,9
15$0
$484
,440
$0$2
,331
,096
SP
1401
$0$0
$0$0
$0$2
0,80
0$0
$0$0
$5,2
00$0
$0$0
$26,
000
SP
1405
$0$0
$0$0
$0$0
$0$0
$0$4
00$0
$1,6
00$0
$2,0
00S
P14
09$0
$258
,000
$0$0
$0$7
,257
,000
$0$0
$0$8
35,0
00$0
$0$0
$8,3
50,0
00S
P14
10$0
$0$0
$0$0
$0$0
$0$0
$2,9
03,2
00$0
$11,
612,
800
$0$1
4,51
6,00
0S
P14
15$7
34,0
00$0
$0$0
$0$3
02,0
00$0
$0$1
84,0
00$7
5,00
0$0
$0$0
$1,2
95,0
00S
P16
01$0
$0$0
$0$0
$281
,600
$0$0
$0$7
0,40
0$0
$0$0
$352
,000
SP
1602
$0$0
$0$0
$0$4
8,00
0$0
$0$0
$12,
000
$0$0
$0$6
0,00
0W
I130
1$0
$0$0
$40,
000
$0$0
$0$0
$0$1
0,00
0$0
$0$0
$50,
000
SU
BT
OT
AL
$4,2
32,0
01$1
,082
,600
$4,8
76,8
00$4
5,60
0$1
28,0
00$8
,521
,100
$0$3
20,0
00$1
,875
,275
$6,4
98,6
15$3
2,00
0$1
5,25
9,64
0$0
$42,
871,
631
FY
201
6 co
nti
nu
ed
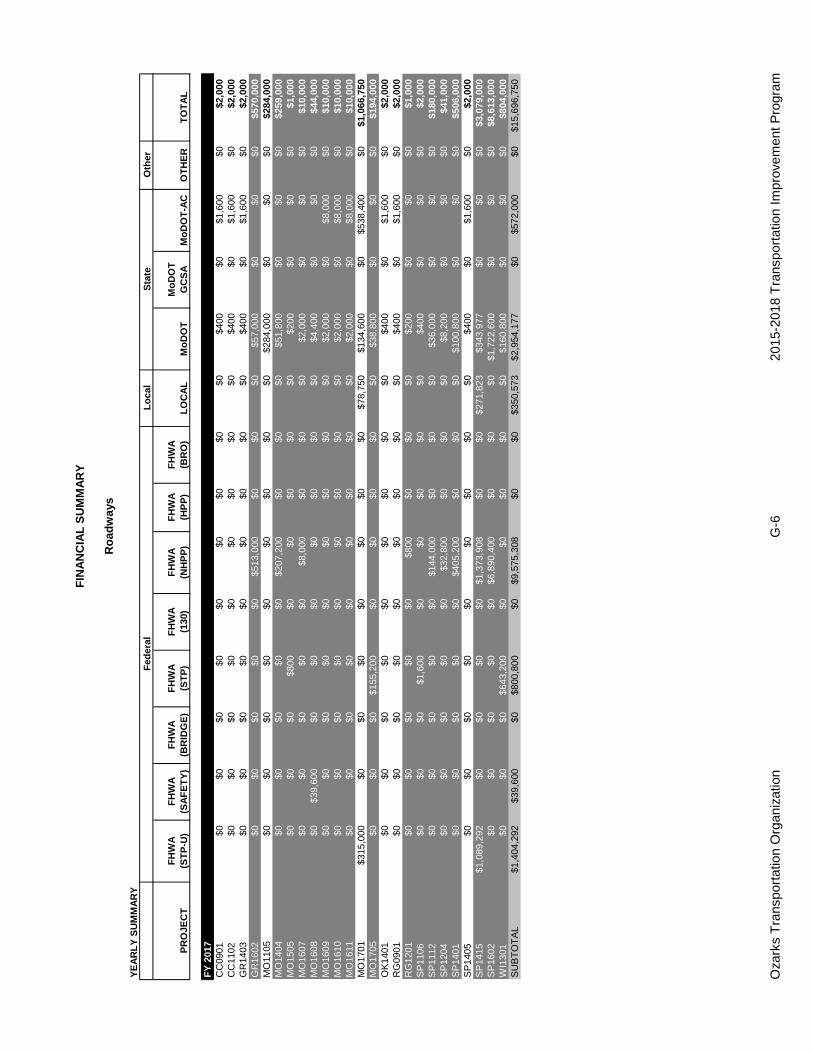
Oza
rks
Tra
nspo
rtat
ion
Org
aniz
atio
nG
-620
15-2
018
Tra
nspo
rtat
ion
Impr
ovem
ent P
rogr
am
YE
AR
LY
SU
MM
AR
YL
oca
lO
ther
PR
OJE
CT
FH
WA
(ST
P-U
)F
HW
A(S
AF
ET
Y)
FH
WA
(BR
IDG
E)
FH
WA
(ST
P)
FH
WA
(130
)F
HW
A(N
HP
P)
FH
WA
(HP
P)
FH
WA
(BR
O)
LO
CA
LM
oD
OT
Mo
DO
TG
CS
AM
oD
OT
-AC
OT
HE
RT
OT
AL
FIN
AN
CIA
L S
UM
MA
RY
Ro
adw
ays
Fed
eral
Sta
te
CC
0901
$0$0
$0$0
$0$0
$0$0
$0$4
00$0
$1,6
00$0
$2,0
00C
C11
02$0
$0$0
$0$0
$0$0
$0$0
$400
$0$1
,600
$0$2
,000
GR
1403
$0$0
$0$0
$0$0
$0$0
$0$4
00$0
$1,6
00$0
$2,0
00G
R16
02$0
$0$0
$0$0
$513
,000
$0$0
$0$5
7,00
0$0
$0$0
$570
,000
MO
1105
$0$0
$0$0
$0$0
$0$0
$0$2
84,0
00$0
$0$0
$284
,000
MO
1404
$0$0
$0$0
$0$2
07,2
00$0
$0$0
$51,
800
$0$0
$0$2
59,0
00M
O15
05$0
$0$0
$800
$0$0
$0$0
$0$2
00$0
$0$0
$1,0
00M
O16
07$0
$0$0
$0$0
$8,0
00$0
$0$0
$2,0
00$0
$0$0
$10,
000
MO
1608
$0$3
9,60
0$0
$0$0
$0$0
$0$0
$4,4
00$0
$0$0
$44,
000
MO
1609
$0$0
$0$0
$0$0
$0$0
$0$2
,000
$0$8
,000
$0$1
0,00
0M
O16
10$0
$0$0
$0$0
$0$0
$0$0
$2,0
00$0
$8,0
00$0
$10,
000
MO
1611
$0$0
$0$0
$0$0
$0$0
$0$2
,000
$0$8
,000
$0$1
0,00
0M
O17
01$3
15,0
00$0
$0$0
$0$0
$0$0
$78,
750
$134
,600
$0$5
38,4
00$0
$1,0
66,7
50M
O17
05$0
$0$0
$155
,200
$0$0
$0$0
$0$3
8,80
0$0
$0$0
$194
,000
OK
1401
$0$0
$0$0
$0$0
$0$0
$0$4
00$0
$1,6
00$0
$2,0
00R
G09
01$0
$0$0
$0$0
$0$0
$0$0
$400
$0$1
,600
$0$2
,000
RG
1201
$0$0
$0$0
$0$8
00$0
$0$0
$200
$0$0
$0$1
,000
SP
1106
$0$0
$0$1
,600
$0$0
$0$0
$0$4
00$0
$0$0
$2,0
00S
P11
12$0
$0$0
$0$0
$144
,000
$0$0
$0$3
6,00
0$0
$0$0
$180
,000
SP
1204
$0$0
$0$0
$0$3
2,80
0$0
$0$0
$8,2
00$0
$0$0
$41,
000
SP
1401
$0$0
$0$0
$0$4
05,2
00$0
$0$0
$100
,800
$0$0
$0$5
06,0
00S
P14
05$0
$0$0
$0$0
$0$0
$0$0
$400
$0$1
,600
$0$2
,000
SP
1415
$1,0
89,2
92$0
$0$0
$0$1
,373
,908
$0$0
$271
,823
$343
,977
$0$0
$0$3
,079
,000
SP
1602
$0$0
$0$0
$0$6
,890
,400
$0$0
$0$1
,722
,600
$0$0
$0$8
,613
,000
WI1
301
$0$0
$0$6
43,2
00$0
$0$0
$0$0
$160
,800
$0$0
$0$8
04,0
00S
UB
TO
TA
L$1
,404
,292
$39,
600
$0$8
00,8
00$0
$9,5
75,3
08$0
$0$3
50,5
73$2
,954
,177
$0$5
72,0
00$0
$15,
696,
750
FY
201
7
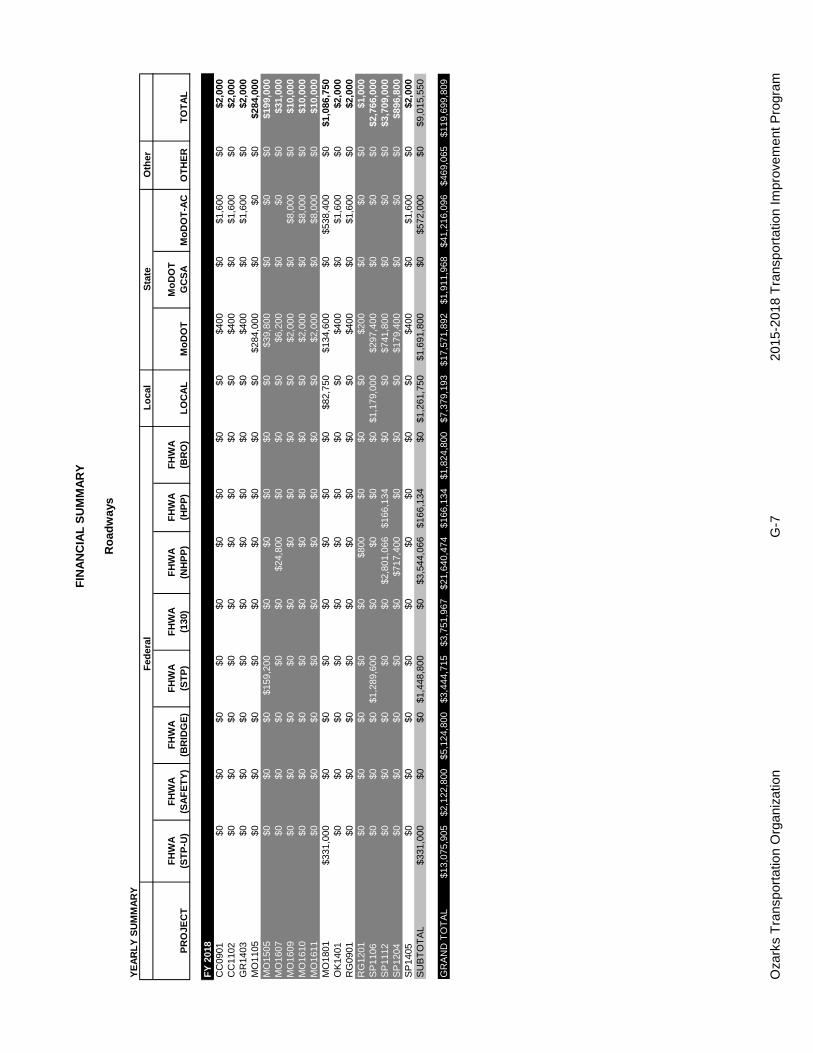
Oza
rks
Tra
nspo
rtat
ion
Org
aniz
atio
nG
-720
15-2
018
Tra
nspo
rtat
ion
Impr
ovem
ent P
rogr
am
YE
AR
LY
SU
MM
AR
YL
oca
lO
ther
PR
OJE
CT
FH
WA
(ST
P-U
)F
HW
A(S
AF
ET
Y)
FH
WA
(BR
IDG
E)
FH
WA
(ST
P)
FH
WA
(130
)F
HW
A(N
HP
P)
FH
WA
(HP
P)
FH
WA
(BR
O)
LO
CA
LM
oD
OT
Mo
DO
TG
CS
AM
oD
OT
-AC
OT
HE
RT
OT
AL
FIN
AN
CIA
L S
UM
MA
RY
Ro
adw
ays
Fed
eral
Sta
te
CC
0901
$0$0
$0$0
$0$0
$0$0
$0$4
00$0
$1,6
00$0
$2,0
00C
C11
02$0
$0$0
$0$0
$0$0
$0$0
$400
$0$1
,600
$0$2
,000
GR
1403
$0$0
$0$0
$0$0
$0$0
$0$4
00$0
$1,6
00$0
$2,0
00M
O11
05$0
$0$0
$0$0
$0$0
$0$0
$284
,000
$0$0
$0$2
84,0
00M
O15
05$0
$0$0
$159
,200
$0$0
$0$0
$0$3
9,80
0$0
$0$0
$199
,000
MO
1607
$0$0
$0$0
$0$2
4,80
0$0
$0$0
$6,2
00$0
$0$0
$31,
000
MO
1609
$0$0
$0$0
$0$0
$0$0
$0$2
,000
$0$8
,000
$0$1
0,00
0M
O16
10$0
$0$0
$0$0
$0$0
$0$0
$2,0
00$0
$8,0
00$0
$10,
000
MO
1611
$0$0
$0$0
$0$0
$0$0
$0$2
,000
$0$8
,000
$0$1
0,00
0M
O18
01$3
31,0
00$0
$0$0
$0$0
$0$0
$82,
750
$134
,600
$0$5
38,4
00$0
$1,0
86,7
50O
K14
01$0
$0$0
$0$0
$0$0
$0$0
$400
$0$1
,600
$0$2
,000
RG
0901
$0$0
$0$0
$0$0
$0$0
$0$4
00$0
$1,6
00$0
$2,0
00R
G12
01$0
$0$0
$0$0
$800
$0$0
$0$2
00$0
$0$0
$1,0
00S
P11
06$0
$0$0
$1,2
89,6
00$0
$0$0
$0$1
,179
,000
$297
,400
$0$0
$0$2
,766
,000
SP
1112
$0$0
$0$0
$0$2
,801
,066
$166
,134
$0$0
$741
,800
$0$0
$0$3
,709
,000
SP
1204
$0$0
$0$0
$0$7
17,4
00$0
$0$0
$179
,400
$0$0
$0$8
96,8
00S
P14
05$0
$0$0
$0$0
$0$0
$0$0
$400
$0$1
,600
$0$2
,000
SU
BT
OT
AL
$331
,000
$0$0
$1,4
48,8
00$0
$3,5
44,0
66$1
66,1
34$0
$1,2
61,7
50$1
,691
,800
$0$5
72,0
00$0
$9,0
15,5
50
GR
AN
D T
OT
AL
$13,
075,
905
$2,1
22,8
00$5
,124
,800
$3,4
44,7
15$3
,751
,967
$21,
640,
474
$166
,134
$1,8
24,8
00$7
,379
,193
$17,
571,
892
$1,9
11,9
68$4
1,21
6,09
6$4
69,0
65$1
19,6
99,8
09
FY
201
8
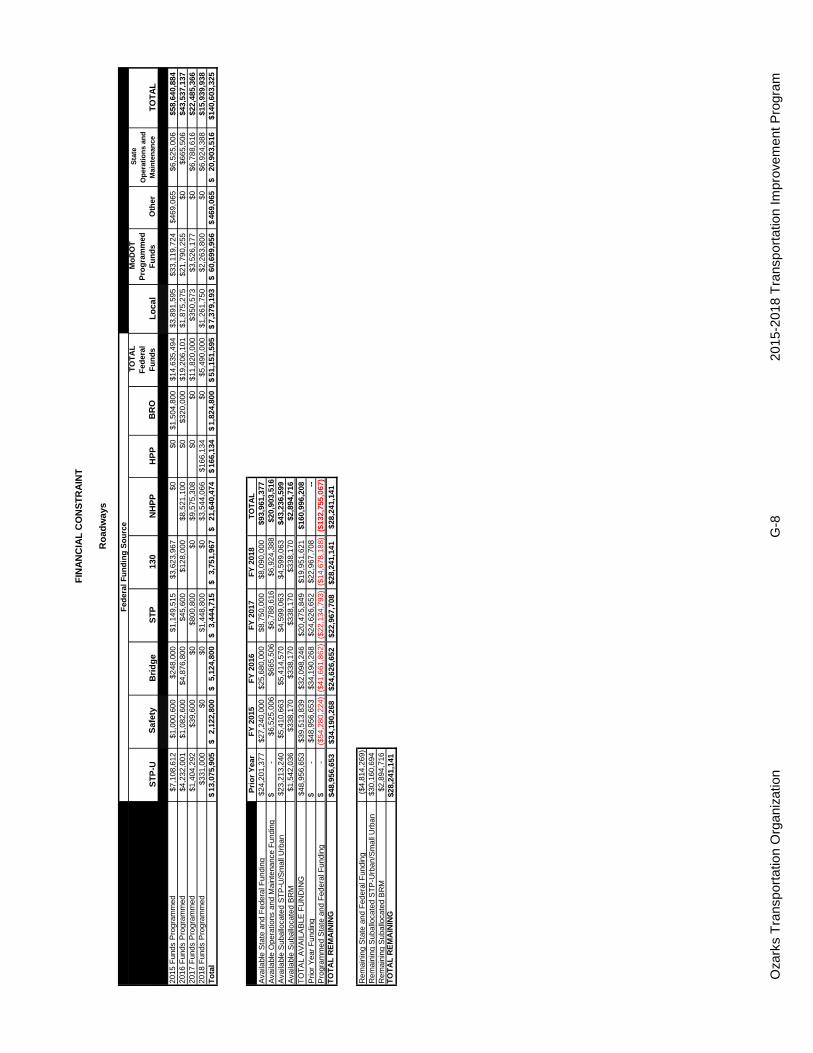
Oza
rks
Tra
nspo
rtat
ion
Org
aniz
atio
nG
-820
15-2
018
Tra
nspo
rtat
ion
Impr
ovem
ent P
rogr
am
ST
P-U
Saf
ety
Bri
dg
eS
TP
130
NH
PP
HP
P B
RO
TO
TA
L
Fed
eral
F
un
ds
Lo
cal
Mo
DO
T
Pro
gra
mm
ed
Fu
nd
s O
ther
Sta
te
Op
erat
ion
s an
d
Mai
nte
nan
ce
TO
TA
L20
0920
15 F
unds
Pro
gram
med
$7,1
08,6
12$1
,000
,600
$248
,000
$1,1
49,5
15$3
,623
,967
$0$0
$1,5
04,8
00$1
4,63
5,49
4$3
,891
,595
$33,
119,
724
$469
,065
$6,5
25,0
06$5
8,64
0,88
420
16 F
unds
Pro
gram
med
$4,2
32,0
01$1
,082
,600
$4,8
76,8
00$4
5,60
0$1
28,0
00$8
,521
,100
$0$3
20,0
00$1
9,20
6,10
1$1
,875
,275
$21,
790,
255
$0$6
65,5
06$4
3,53
7,13
720
17 F
unds
Pro
gram
med
$1,4
04,2
92$3
9,60
0$0
$800
,800
$0$9
,575
,308
$0$0
$11,
820,
000
$350
,573
$3,5
26,1
77$0
$6,7
88,6
16$2
2,48
5,36
620
18 F
unds
Pro
gram
med
$331
,000
$0$0
$1,4
48,8
00$0
$3,5
44,0
66$1
66,1
34$0
$5,4
90,0
00$1
,261
,750
$2,2
63,8
00$0
$6,9
24,3
88$1
5,93
9,93
8T
ota
l13
,075
,905
$ 2,
122,
800
$
5,12
4,80
0$
3,
444,
715
$
3,75
1,96
7$
21
,640
,474
$
16
6,13
4$
1,82
4,80
0$
51,1
51,5
95$
7,37
9,19
3$
60,6
99,9
56$
46
9,06
5$
20,9
03,5
16$
$140
,603
, 325
Pri
or
Yea
rF
Y 2
015
FY
201
6F
Y 2
017
FY
201
8T
OT
AL
Ava
ilabl
e S
tate
and
Fed
eral
Fun
ding
$24,
201,
377
$27,
240,
000
$25,
680,
000
$8,7
50,0
00$8
,090
,000
$93,
961,
377
Ava
ilabl
e O
pera
tions
and
Mai
nten
ance
Fun
ding
-$
$6
,525
,006
$665
,506
$6,7
88,6
16$6
,924
,388
$20,
903,
516
Ava
ilabl
e S
ubal
loca
ted
ST
P-U
/Sm
all U
rban
$23,
213,
240
$5,4
10,6
63$5
,414
,570
$4,5
99,0
63$4
,599
,063
$43,
236,
599
Ava
ilabl
e S
ubal
loca
ted
BR
M$1
,542
,036
$338
,170
$338
,170
$338
,170
$338
,170
$2,8
94,7
16T
OT
AL
AV
AIL
AB
LE F
UN
DIN
G$4
8,95
6,65
3$3
9,51
3,83
9$3
2,09
8,24
6$2
0,47
5,84
9$1
9,95
1,62
1$1
60,9
96,2
08P
rior
Yea
r F
undi
ng-
$
$48,
956,
653
$34,
190,
268
$24,
626,
652
$22,
967,
708
--P
rogr
amm
ed S
tate
and
Fed
eral
Fun
ding
-$
($
54,2
80,2
24)
($41
,661
,862
)($
22,1
34,7
93)
($14
,678
,188
)($
132,
755,
067)
TO
TA
L R
EM
AIN
ING
$48,
956,
653
$34,
190,
268
$24,
626,
652
$22,
967,
708
$28,
241,
141
$28,
241,
141
Rem
aini
ng S
tate
and
Fed
eral
Fun
ding
($4,
814,
269)
Rem
aini
ng S
ubal
loca
ted
ST
P-U
rban
/Sm
all U
rban
$30,
160,
694
Rem
aini
ng S
ubal
loca
ted
BR
M$2
,894
,716
TO
TA
L R
EM
AIN
ING
$28,
241,
141
Fed
eral
Fu
nd
ing
So
urc
e
FIN
AN
CIA
L C
ON
ST
RA
INT
Ro
ad
wa
ys

TAB 6
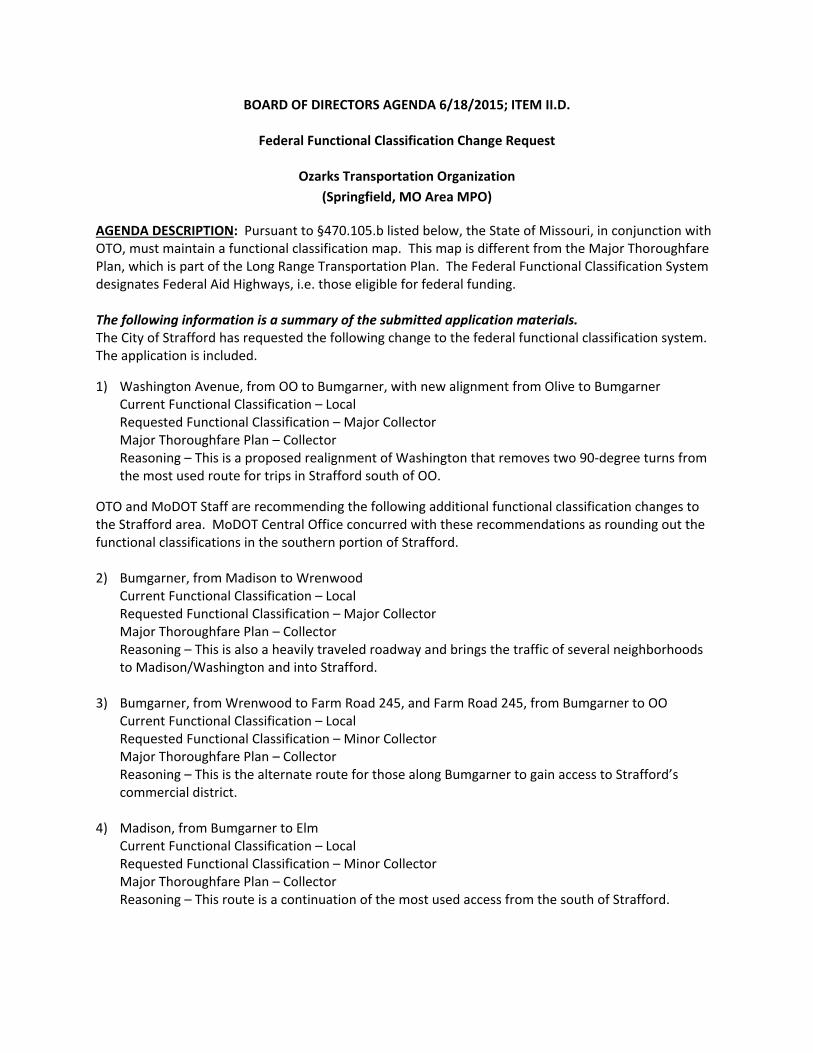
BOARD OF DIRECTORS AGENDA 6/18/2015; ITEM II.D.
Federal Functional Classification Change Request
Ozarks Transportation Organization
(Springfield, MO Area MPO)
AGENDA DESCRIPTION: Pursuant to §470.105.b listed below, the State of Missouri, in conjunction with OTO, must maintain a functional classification map. This map is different from the Major Thoroughfare Plan, which is part of the Long Range Transportation Plan. The Federal Functional Classification System designates Federal Aid Highways, i.e. those eligible for federal funding. The following information is a summary of the submitted application materials. The City of Strafford has requested the following change to the federal functional classification system. The application is included.
1) Washington Avenue, from OO to Bumgarner, with new alignment from Olive to Bumgarner Current Functional Classification – Local Requested Functional Classification – Major Collector Major Thoroughfare Plan – Collector Reasoning – This is a proposed realignment of Washington that removes two 90‐degree turns from the most used route for trips in Strafford south of OO.
OTO and MoDOT Staff are recommending the following additional functional classification changes to the Strafford area. MoDOT Central Office concurred with these recommendations as rounding out the functional classifications in the southern portion of Strafford. 2) Bumgarner, from Madison to Wrenwood
Current Functional Classification – Local Requested Functional Classification – Major Collector Major Thoroughfare Plan – Collector Reasoning – This is also a heavily traveled roadway and brings the traffic of several neighborhoods to Madison/Washington and into Strafford.
3) Bumgarner, from Wrenwood to Farm Road 245, and Farm Road 245, from Bumgarner to OO Current Functional Classification – Local Requested Functional Classification – Minor Collector Major Thoroughfare Plan – Collector Reasoning – This is the alternate route for those along Bumgarner to gain access to Strafford’s commercial district.
4) Madison, from Bumgarner to Elm Current Functional Classification – Local Requested Functional Classification – Minor Collector Major Thoroughfare Plan – Collector Reasoning – This route is a continuation of the most used access from the south of Strafford.
MoDOT has requested the following change to the federal functional classification system. The application is also included.
5) Evans Road (Farm Road 188) from Southwood Road east to end of public travel Current Functional Classification – Minor Arterial Requested Functional Classification – Local Major Thoroughfare Plan – Secondary Arterial (does not yet reflect changes in roadway) Reasoning – Due to the construction of E. Riverbluff Boulevard and Southwood Road, the majority of the former alignment of Evans Road was barricaded to public travel. Only this short segment of Farm Road 188 remains to serve a rehabilitation facility. The new routes now function as a minor arterial, whereas Farm Road 188 functions as a local route.
TECHNICAL PLANNING COMMITTEE ACTION TAKEN: At its May 20, 2015 meeting, the Technical Planning Committee recommended that the Board of Directors approve the proposed changes to the Functional Classification System. BOARD OF DIRECTORS ACTION REQUESTED: That a member of the Board of Directors makes a motion regarding the proposed changes to the Functional Classification System: “Move to approve the proposed changes to the Federal Functional Classification System.” OR “Move to have the Technical Planning Committee consider the following changes…”
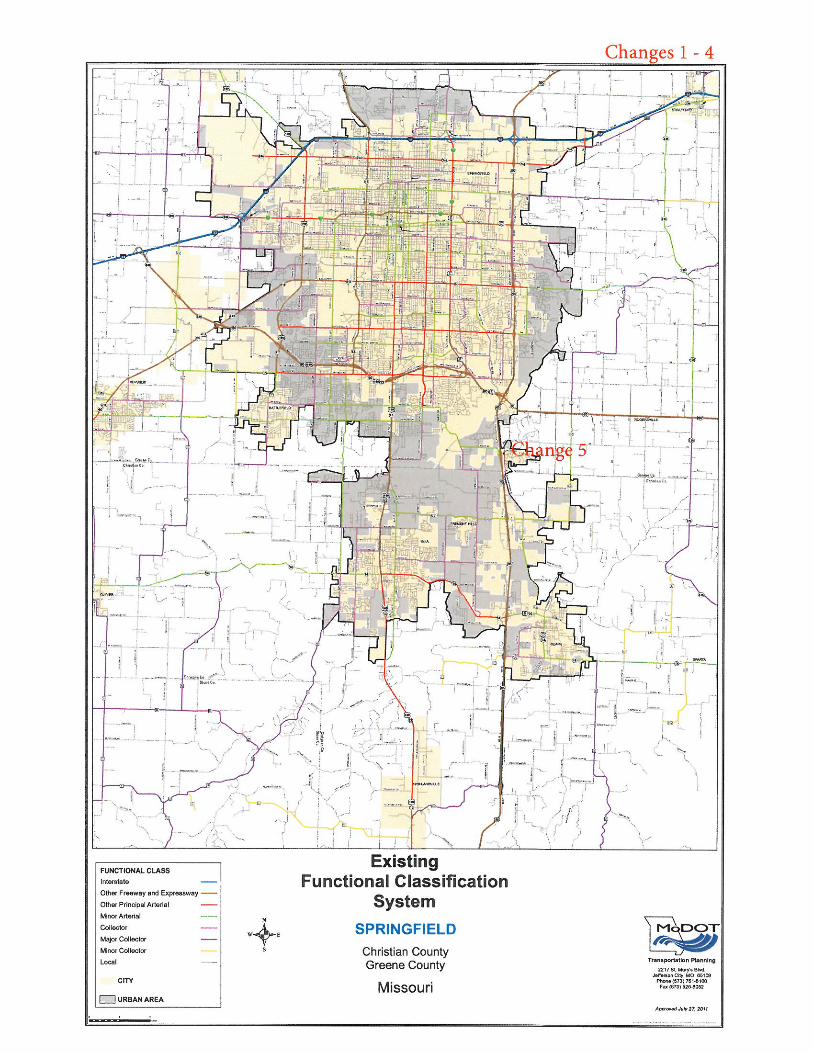
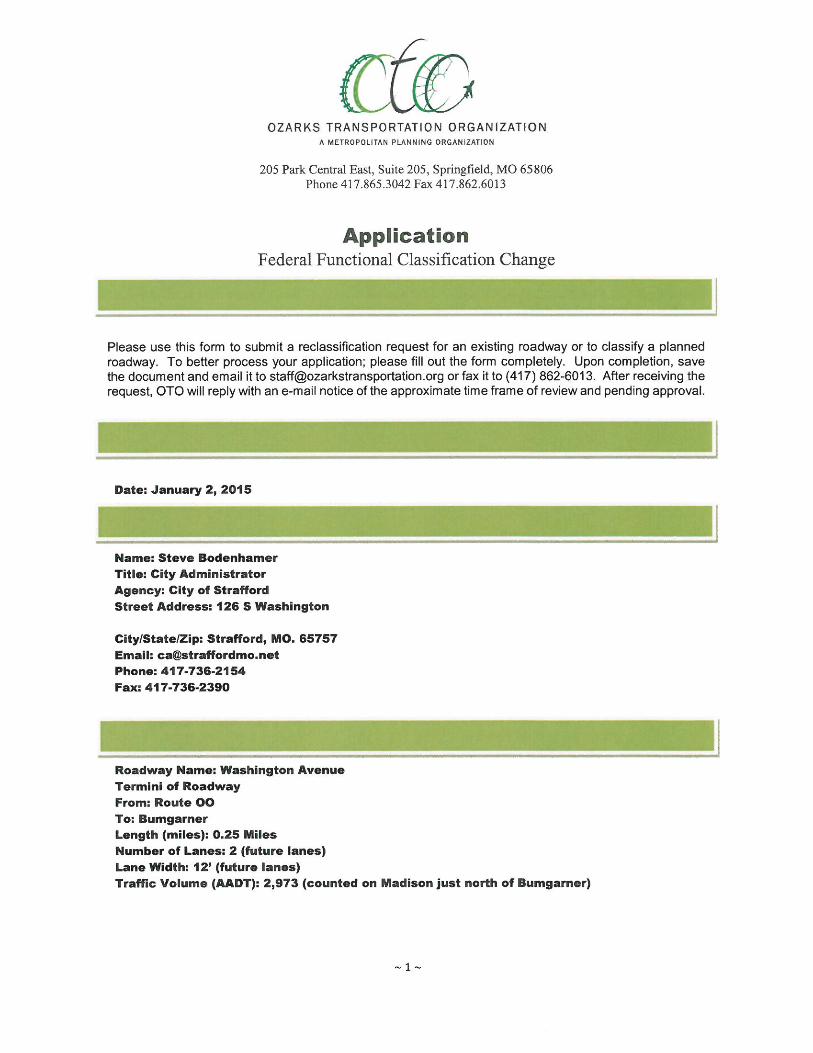
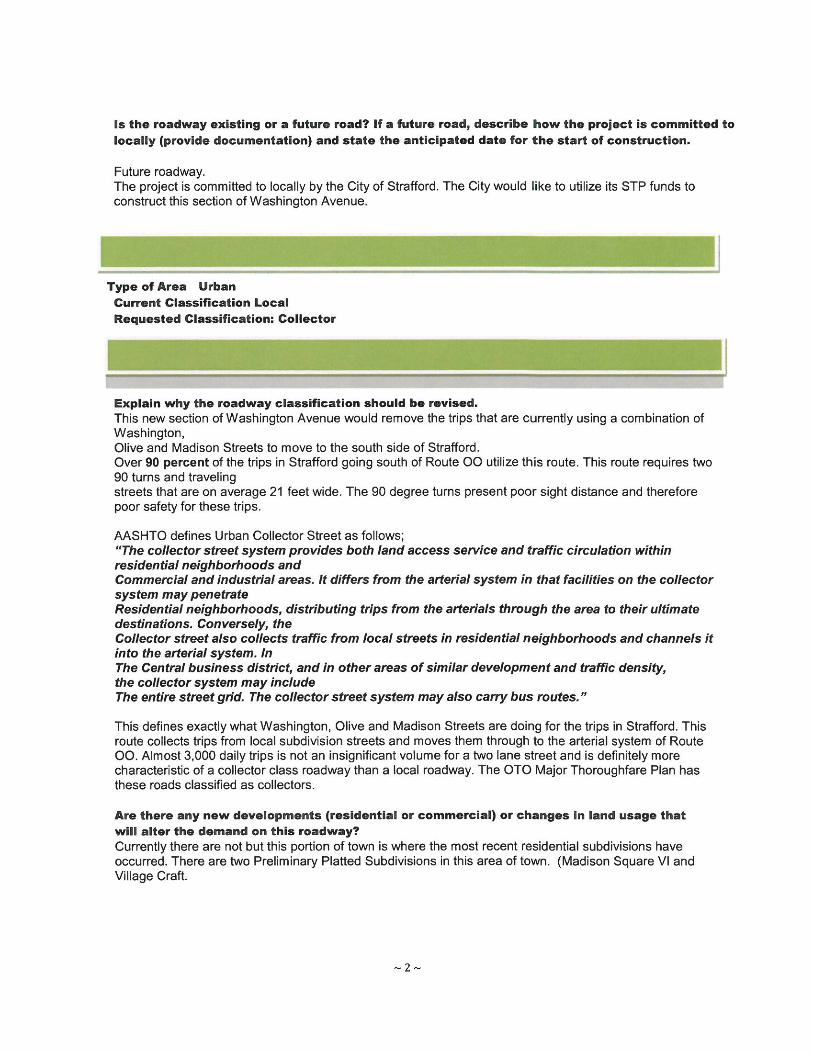
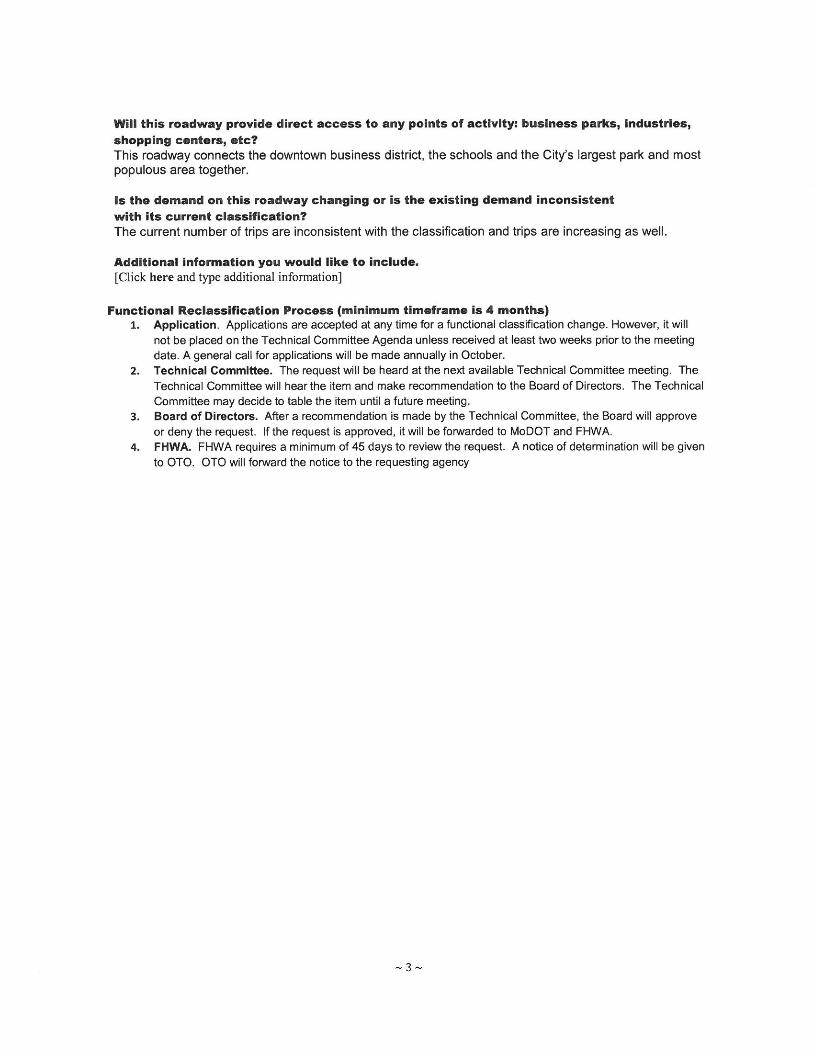
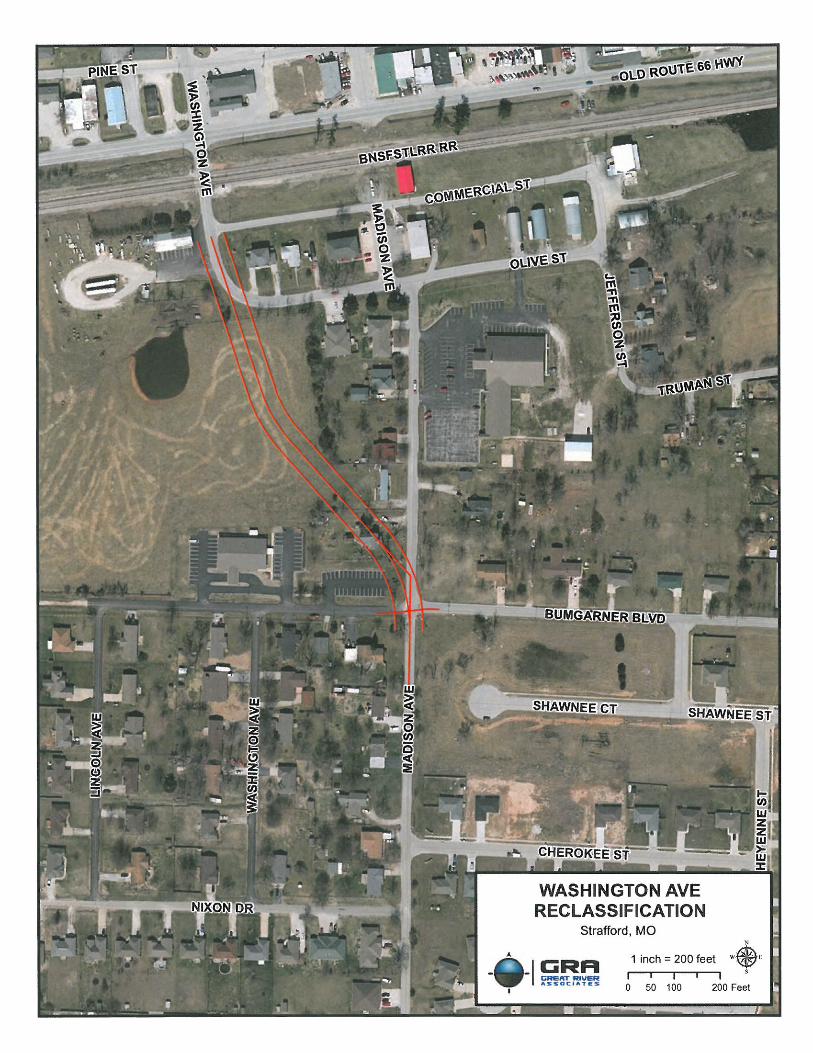
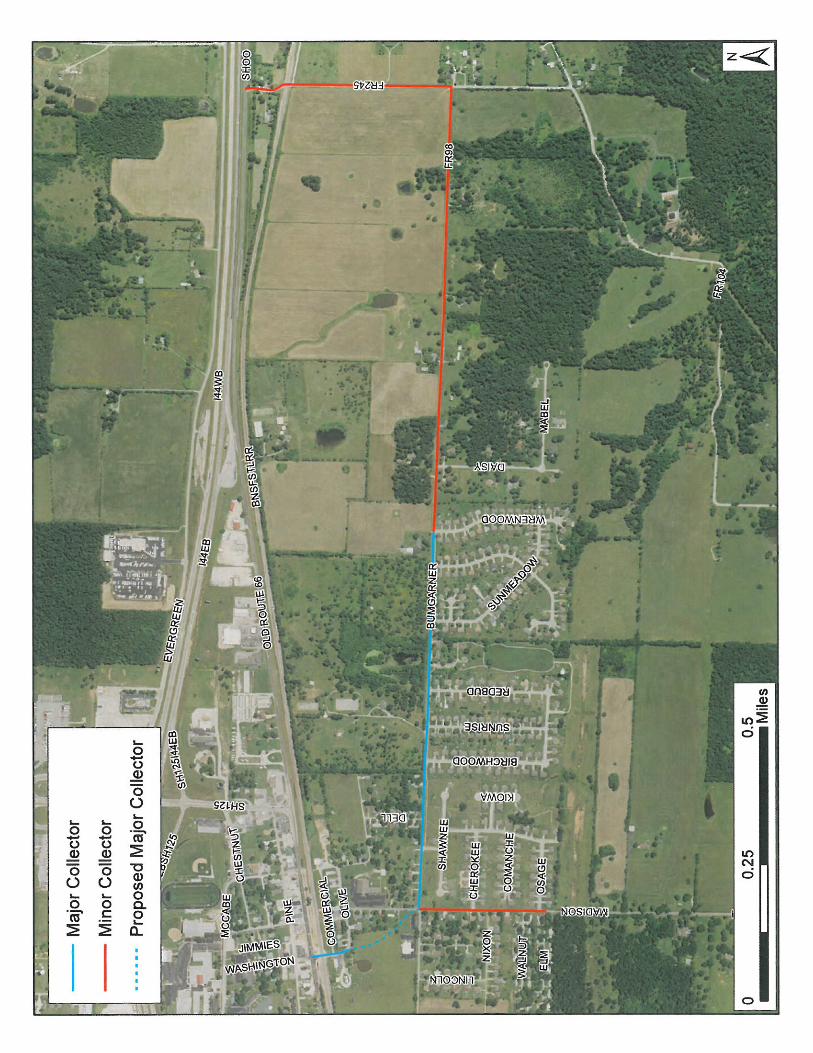
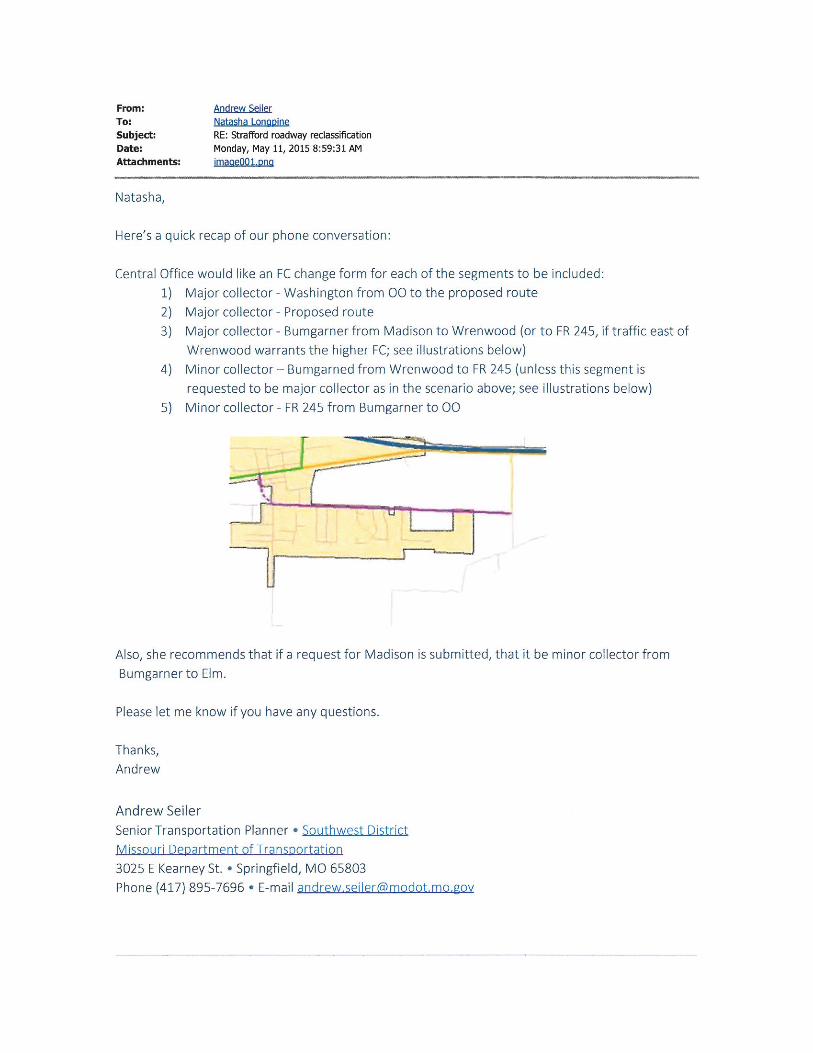
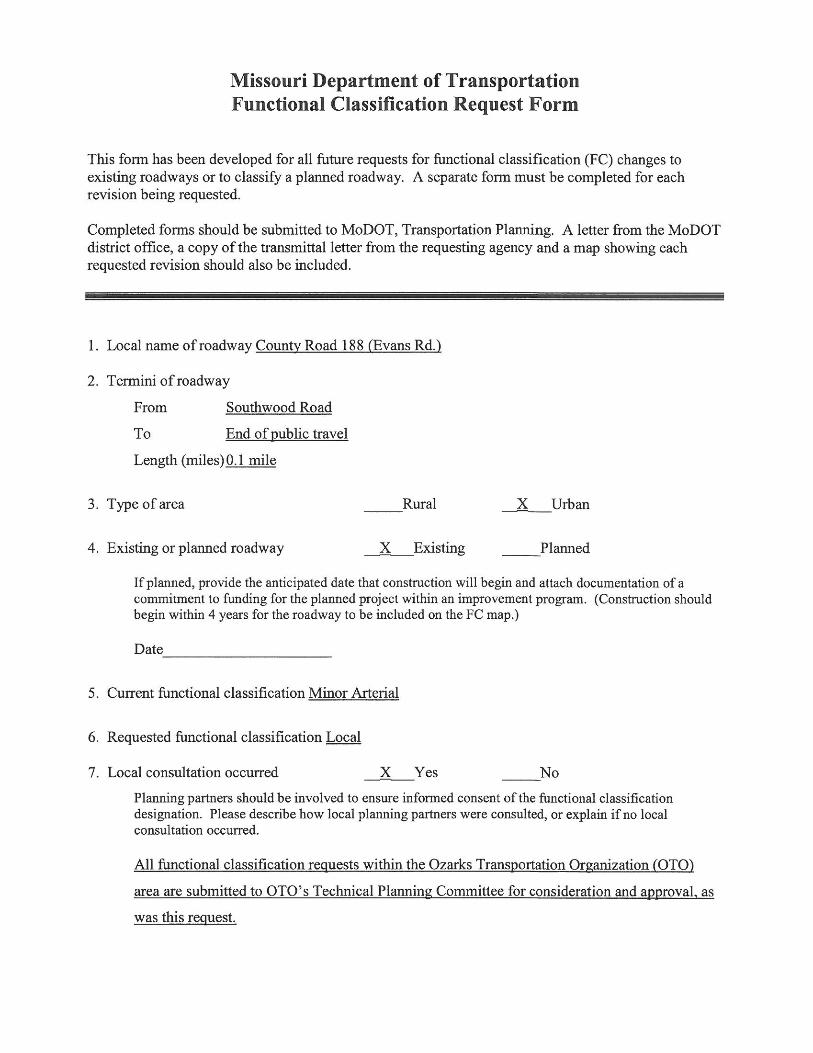
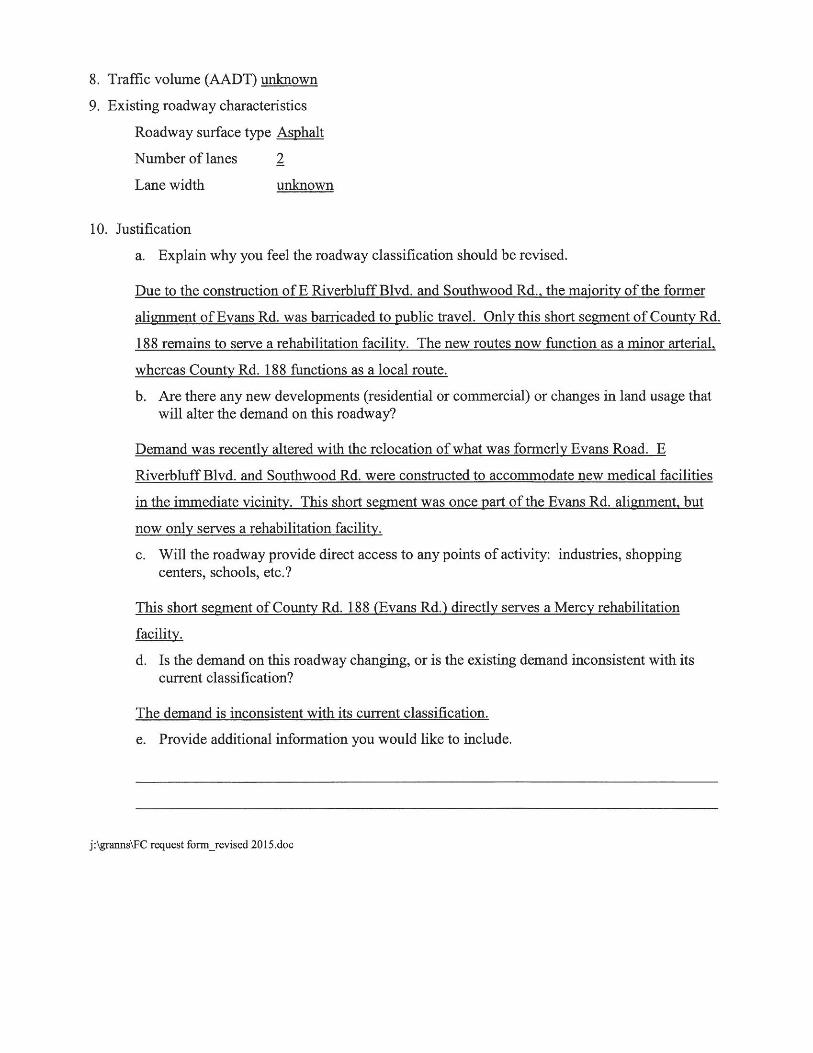
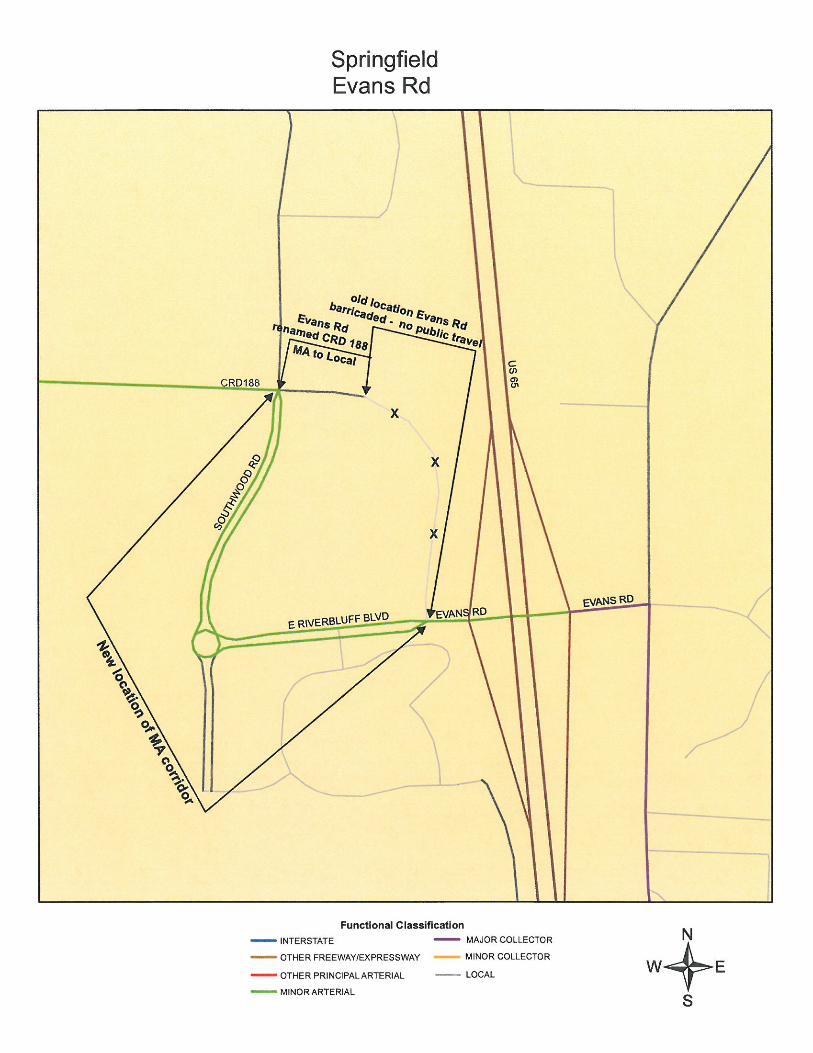

TAB 7

BOARD OF DIRECTORS AGENDA 6/18/2015; ITEM II.E.
Federal Funds Balance Report – March 31, 2015
Ozarks Transportation Organization
(Springfield, MO Area MPO)
AGENDA DESCRIPTION: The Funds Balance Report included in the agenda is a snapshot of the federal funds balance for each funding program and each jurisdiction. This report only includes the federal allocation to date. At the time of this report, federal funding had only been appropriated through May 31, 2015. This report reflects that appropriation. Congress has since appropriated funding through July, though the OTO share of that is not yet known. It is also unknown whether Congress will simply extend MAP‐21 through the Federal Fiscal Year at the end of September, or enact a new surface transportation authorization before then. Please refer to Page v for information on expected balances after October 1, 2015. This assumes full appropriations for FY 2015 and FY 2016. BACKGROUND: Ozarks Transportation Organization is allocated STP‐Urban, Small Urban, and BRM (On‐System Bridge) funds each year through MoDOT from the Federal Highway Administration. MoDOT has enacted a policy of allowing no more than three years of this STP‐Urban allocation to accrue due to requirements by FHWA. If a balance greater than 3 years accrues, funds will lapse (be forfeited).
OTO has elected to sub‐allocate the STP‐Urban and Small Urban funds among the jurisdictions within the MPO area. Each of these jurisdiction’s allocations are based upon the population within the MPO area. OTO’s balance is monitored as a whole by MoDOT, while OTO staff monitors each jurisdiction’s individual balance. When MoDOT calculates the OTO balance, it is based upon obligated funds and not programmed funds, so a project is only subtracted from the balance upon obligation from FHWA. OTO receives reports showing the projects that have been obligated. MoDOT’s policy allows for any cost share projects with MoDOT that are programmed in the Statewide Transportation Improvement Program, although not necessarily obligated, to be subtracted from the balance. The next deadline to meet the MoDOT funds lapse policy is September 30, 2015.
Staff has included a report which documents the balance allowed, the balance obligated, and the balance that needs to be obligated by the end of the Federal Fiscal Year in order not to be rescinded by MoDOT. According to staff records, as a whole, OTO has obligated or has programmed in cost shares with MoDOT, funding exceeding the minimum amount required to be programmed for FY 2015, therefore, there is not an immediate threat of rescission by MoDOT. This report, however, does not include the full FY 2015 allocation, as Congress has only authorized funding through May 2015. Also, MoDOT has suspended the cost share program, so balances will accumulate at a much faster rate than they have in the past. OTO jurisdictions are reminded to be mindful of their balances, obligating funding as soon as is possible for projects.
The report also outlines activity in other OTO funding accounts, such as BRM, Small Urban, and the Transportation Alternatives Program. These accounts are subject to the same rescission policy.
The Obligation Summary Report Balance Sheet (Page 1) indicates the STP‐Urban balance for OTO as a whole. OTO has an ending balance of $17,015,383.61 as of March 31, 2015. After the MoDOT cost share projects that appear in the STIP are subtracted, the balance is $7,232,166.54. This is well within the balance allowed to be carried by MoDOT.
In 2009, $3.5 million in STP‐Urban funding was rescinded when SAFETEA‐LU expired, though it was restored nine months later. The only action that prevents a rescission of federal funding is obligation. The OTO unobligated balance of all funds that is subject to rescission is $19,075,010.83. It is recommended that this funding be obligated as quickly as possible to protect against further rescissions. Several jurisdictions have partnered with MoDOT to spend these funds. OTO commends those who have acted in response to the suggestion that these funds be spent.
The Introduction also contains information regarding the FY 2015 and FY 2016 funding allocations.
BOARD OF DIRECTORS ACTION REQUESTED:
No official action requested, however, OTO is requesting each jurisdiction review the report for any inaccuracies or changes in project status and advise staff.
March 2015 FUNDS BALANCE REPORT
Table of Contents
Introduction ........................................................................................................................................................... i
Balance Summary ................................................................................................................................................. 1
Bridge (BRM) Balance ........................................................................................................................................... 2
Transportation Alternatives Program (TAP) Balance ............................................................................................ 3
Christian County.................................................................................................................................................... 4
Greene County ...................................................................................................................................................... 5
City of Battlefield .................................................................................................................................................. 7
City of Nixa ............................................................................................................................................................ 8
City of Ozark .......................................................................................................................................................... 9
City of Republic ................................................................................................................................................... 10
City of Springfield ................................................................................................................................................ 11
City of Strafford................................................................................................................................................... 14
City of Willard ..................................................................................................................................................... 15
Funding Allocation .............................................................................................................................................. 16
All Allocations ..................................................................................................................................................... 18
All Obligations by Project .................................................................................................................................... 24
MoDOT Reports .................................................................................................................................................. 31
Ozarks Transportation Organization Page i Funds Balance Report – March 2015
ObligationExecuted Project
Agreement
Programmed in TIP
Priority in LRTP
Surface Transportation Program Funding The federal surface transportation authorization legislation, MAP‐21 (Moving Ahead for Progress in the 21st
Century Act), reauthorizes federal highway, transit, and other surface transportation programs through
September 30, 2014. MAP‐21 is a continuation of prior surface transportation authorization legislation
including TEA‐21, ISTEA, and others dating back to the first Federal Aid Highway Act of 1956.
The Surface Transportation Program (STP) funding is distributed to varying programs and public agencies for
implementation of the authorizing legislation requirements. This distribution includes a specific allocation to
urbanized areas over 200,000 by percentage of population. These urbanized areas are part of metropolitan
planning areas, and more specifically, transportation management areas (TMAs). The Ozarks Transportation
Organization (OTO) is the TMA for the Springfield, Missouri urbanized area.
OTO is responsible for project selection, programming, reasonable progress, and the maintenance of fund
balances for three subcategories of STP funding – Transportation Alternatives Program, On‐System Bridge
(BRM), and STP funding (both Urban and Small Urban). This report monitors the funding balance and
obligations made by OTO member jurisdictions for this funding. OTO has been receiving sub‐allocated
funding since 2003.
Eligible Entities for OTO Suballocated STP Funds All cities and counties within OTO’s metropolitan planning boundary
All transportation corporations within OTO’s metropolitan planning boundary
Missouri Department of Transportation
All public transit agencies within OTO’s metropolitan planning boundary
OTO
An obligation is a commitment of the federal government’s promise to pay for the federal share of a project’s
eligible cost. This commitment occurs when the project is approved and the project agreement is executed.
Obligation is a key step in financing and obligated funds are considered “used” even though no cash is
transferred.
Obligating a Project
To ensure each jurisdiction has access to STP funding, OTO monitors how each OTO member utilizes available
STP funding. Also, MoDOT has a statewide policy regarding the accumulation of STP funds, which is limited
to a three year accrual. Committed cost share funds are allowed to count toward that balance. Any
unobligated funding, however, is subject to rescission by Congress. The following report highlights the
amount of funding which needs to be obligated to meet MoDOT’s accrual policy, as well as the amount of
funding subject to rescission by Congress.
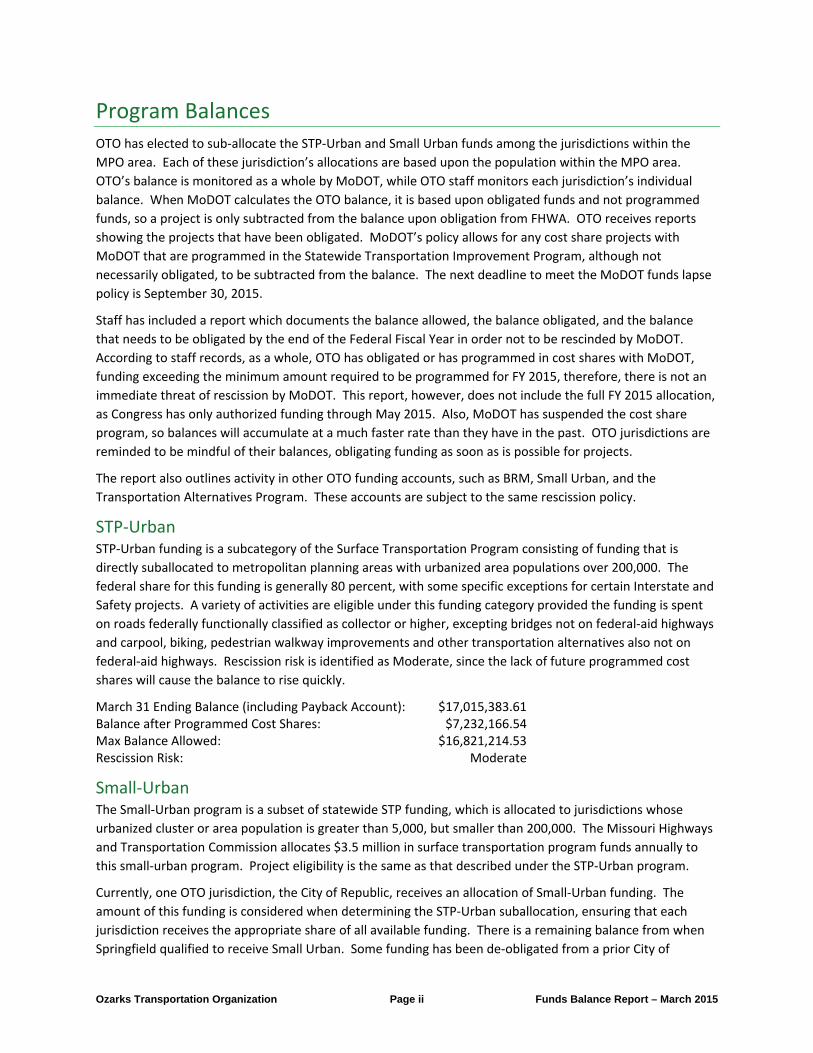
Ozarks Transportation Organization Page ii Funds Balance Report – March 2015
Program Balances OTO has elected to sub‐allocate the STP‐Urban and Small Urban funds among the jurisdictions within the
MPO area. Each of these jurisdiction’s allocations are based upon the population within the MPO area.
OTO’s balance is monitored as a whole by MoDOT, while OTO staff monitors each jurisdiction’s individual
balance. When MoDOT calculates the OTO balance, it is based upon obligated funds and not programmed
funds, so a project is only subtracted from the balance upon obligation from FHWA. OTO receives reports
showing the projects that have been obligated. MoDOT’s policy allows for any cost share projects with
MoDOT that are programmed in the Statewide Transportation Improvement Program, although not
necessarily obligated, to be subtracted from the balance. The next deadline to meet the MoDOT funds lapse
policy is September 30, 2015.
Staff has included a report which documents the balance allowed, the balance obligated, and the balance
that needs to be obligated by the end of the Federal Fiscal Year in order not to be rescinded by MoDOT.
According to staff records, as a whole, OTO has obligated or has programmed in cost shares with MoDOT,
funding exceeding the minimum amount required to be programmed for FY 2015, therefore, there is not an
immediate threat of rescission by MoDOT. This report, however, does not include the full FY 2015 allocation,
as Congress has only authorized funding through May 2015. Also, MoDOT has suspended the cost share
program, so balances will accumulate at a much faster rate than they have in the past. OTO jurisdictions are
reminded to be mindful of their balances, obligating funding as soon as is possible for projects.
The report also outlines activity in other OTO funding accounts, such as BRM, Small Urban, and the
Transportation Alternatives Program. These accounts are subject to the same rescission policy.
STP‐Urban STP‐Urban funding is a subcategory of the Surface Transportation Program consisting of funding that is
directly suballocated to metropolitan planning areas with urbanized area populations over 200,000. The
federal share for this funding is generally 80 percent, with some specific exceptions for certain Interstate and
Safety projects. A variety of activities are eligible under this funding category provided the funding is spent
on roads federally functionally classified as collector or higher, excepting bridges not on federal‐aid highways
and carpool, biking, pedestrian walkway improvements and other transportation alternatives also not on
federal‐aid highways. Rescission risk is identified as Moderate, since the lack of future programmed cost
shares will cause the balance to rise quickly.
March 31 Ending Balance (including Payback Account): $17,015,383.61 Balance after Programmed Cost Shares: $7,232,166.54 Max Balance Allowed: $16,821,214.53 Rescission Risk: Moderate
Small‐Urban The Small‐Urban program is a subset of statewide STP funding, which is allocated to jurisdictions whose
urbanized cluster or area population is greater than 5,000, but smaller than 200,000. The Missouri Highways
and Transportation Commission allocates $3.5 million in surface transportation program funds annually to
this small‐urban program. Project eligibility is the same as that described under the STP‐Urban program.
Currently, one OTO jurisdiction, the City of Republic, receives an allocation of Small‐Urban funding. The
amount of this funding is considered when determining the STP‐Urban suballocation, ensuring that each
jurisdiction receives the appropriate share of all available funding. There is a remaining balance from when
Springfield qualified to receive Small Urban. Some funding has been de‐obligated from a prior City of
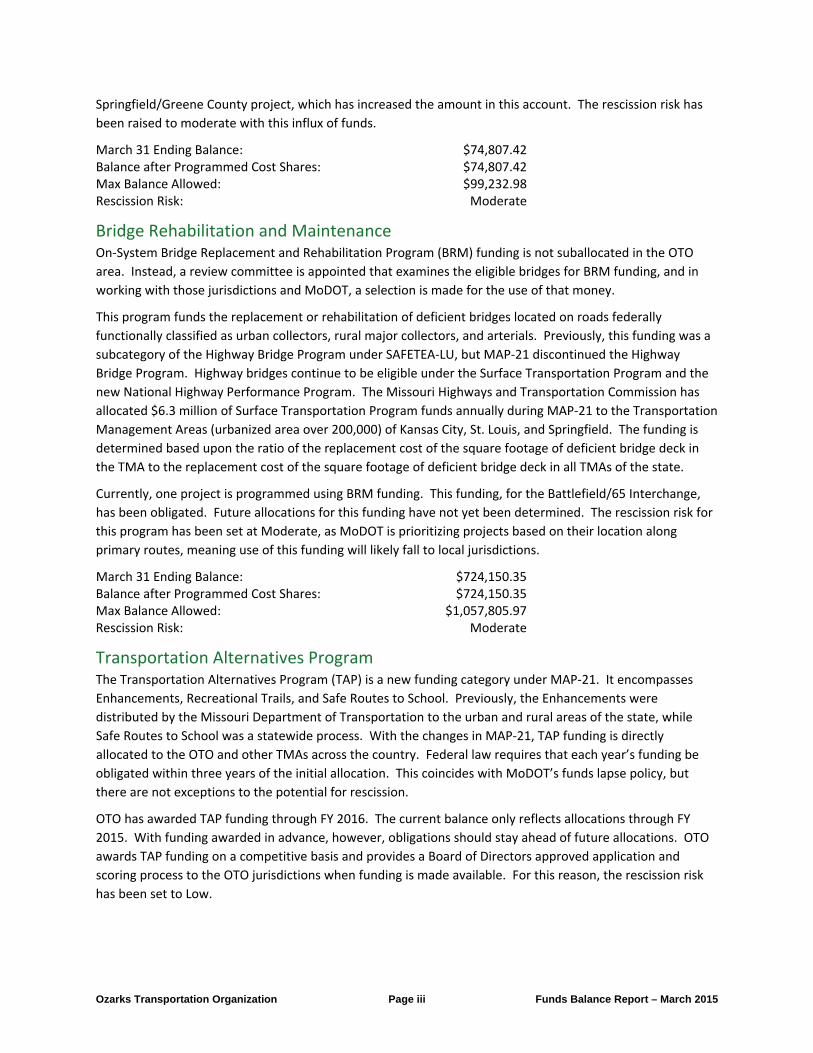
Ozarks Transportation Organization Page iii Funds Balance Report – March 2015
Springfield/Greene County project, which has increased the amount in this account. The rescission risk has
been raised to moderate with this influx of funds.
March 31 Ending Balance: $74,807.42 Balance after Programmed Cost Shares: $74,807.42 Max Balance Allowed: $99,232.98 Rescission Risk: Moderate
Bridge Rehabilitation and Maintenance On‐System Bridge Replacement and Rehabilitation Program (BRM) funding is not suballocated in the OTO
area. Instead, a review committee is appointed that examines the eligible bridges for BRM funding, and in
working with those jurisdictions and MoDOT, a selection is made for the use of that money.
This program funds the replacement or rehabilitation of deficient bridges located on roads federally
functionally classified as urban collectors, rural major collectors, and arterials. Previously, this funding was a
subcategory of the Highway Bridge Program under SAFETEA‐LU, but MAP‐21 discontinued the Highway
Bridge Program. Highway bridges continue to be eligible under the Surface Transportation Program and the
new National Highway Performance Program. The Missouri Highways and Transportation Commission has
allocated $6.3 million of Surface Transportation Program funds annually during MAP‐21 to the Transportation
Management Areas (urbanized area over 200,000) of Kansas City, St. Louis, and Springfield. The funding is
determined based upon the ratio of the replacement cost of the square footage of deficient bridge deck in
the TMA to the replacement cost of the square footage of deficient bridge deck in all TMAs of the state.
Currently, one project is programmed using BRM funding. This funding, for the Battlefield/65 Interchange,
has been obligated. Future allocations for this funding have not yet been determined. The rescission risk for
this program has been set at Moderate, as MoDOT is prioritizing projects based on their location along
primary routes, meaning use of this funding will likely fall to local jurisdictions.
March 31 Ending Balance: $724,150.35 Balance after Programmed Cost Shares: $724,150.35 Max Balance Allowed: $1,057,805.97 Rescission Risk: Moderate
Transportation Alternatives Program The Transportation Alternatives Program (TAP) is a new funding category under MAP‐21. It encompasses
Enhancements, Recreational Trails, and Safe Routes to School. Previously, the Enhancements were
distributed by the Missouri Department of Transportation to the urban and rural areas of the state, while
Safe Routes to School was a statewide process. With the changes in MAP‐21, TAP funding is directly
allocated to the OTO and other TMAs across the country. Federal law requires that each year’s funding be
obligated within three years of the initial allocation. This coincides with MoDOT’s funds lapse policy, but
there are not exceptions to the potential for rescission.
OTO has awarded TAP funding through FY 2016. The current balance only reflects allocations through FY
2015. With funding awarded in advance, however, obligations should stay ahead of future allocations. OTO
awards TAP funding on a competitive basis and provides a Board of Directors approved application and
scoring process to the OTO jurisdictions when funding is made available. For this reason, the rescission risk
has been set to Low.
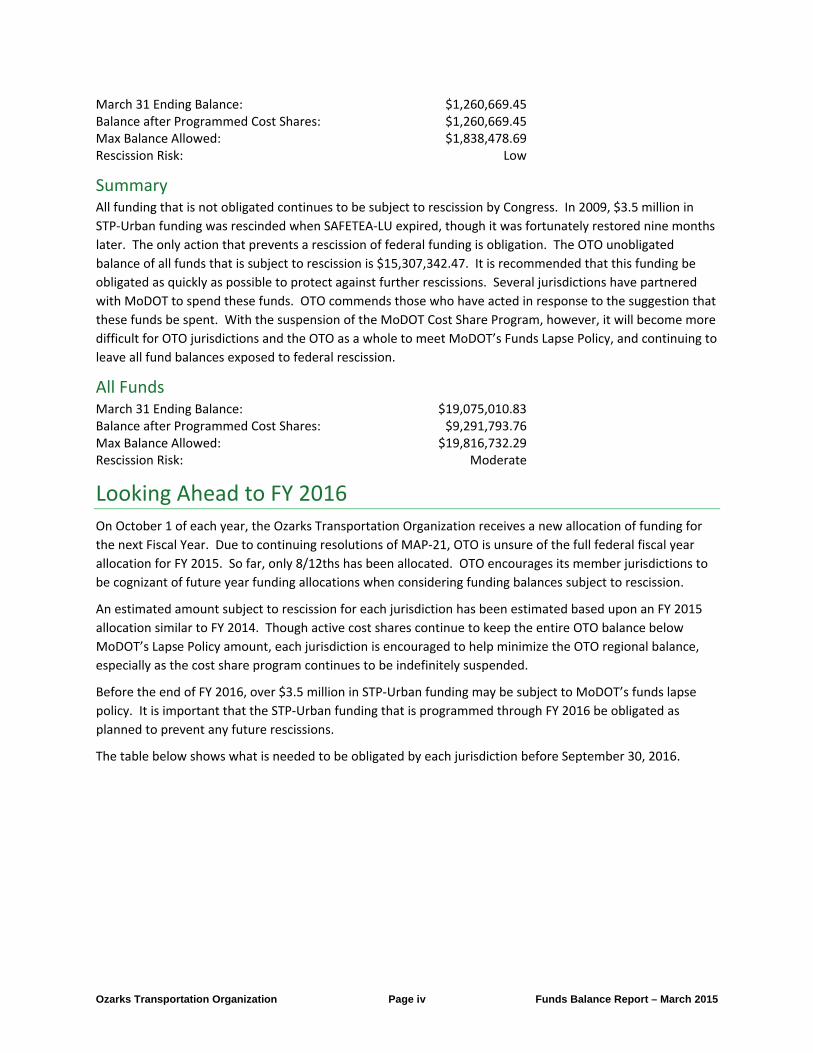
Ozarks Transportation Organization Page iv Funds Balance Report – March 2015
March 31 Ending Balance: $1,260,669.45 Balance after Programmed Cost Shares: $1,260,669.45 Max Balance Allowed: $1,838,478.69 Rescission Risk: Low
Summary All funding that is not obligated continues to be subject to rescission by Congress. In 2009, $3.5 million in
STP‐Urban funding was rescinded when SAFETEA‐LU expired, though it was fortunately restored nine months
later. The only action that prevents a rescission of federal funding is obligation. The OTO unobligated
balance of all funds that is subject to rescission is $15,307,342.47. It is recommended that this funding be
obligated as quickly as possible to protect against further rescissions. Several jurisdictions have partnered
with MoDOT to spend these funds. OTO commends those who have acted in response to the suggestion that
these funds be spent. With the suspension of the MoDOT Cost Share Program, however, it will become more
difficult for OTO jurisdictions and the OTO as a whole to meet MoDOT’s Funds Lapse Policy, and continuing to
leave all fund balances exposed to federal rescission.
All Funds March 31 Ending Balance: $19,075,010.83 Balance after Programmed Cost Shares: $9,291,793.76 Max Balance Allowed: $19,816,732.29 Rescission Risk: Moderate
Looking Ahead to FY 2016 On October 1 of each year, the Ozarks Transportation Organization receives a new allocation of funding for
the next Fiscal Year. Due to continuing resolutions of MAP‐21, OTO is unsure of the full federal fiscal year
allocation for FY 2015. So far, only 8/12ths has been allocated. OTO encourages its member jurisdictions to
be cognizant of future year funding allocations when considering funding balances subject to rescission.
An estimated amount subject to rescission for each jurisdiction has been estimated based upon an FY 2015
allocation similar to FY 2014. Though active cost shares continue to keep the entire OTO balance below
MoDOT’s Lapse Policy amount, each jurisdiction is encouraged to help minimize the OTO regional balance,
especially as the cost share program continues to be indefinitely suspended.
Before the end of FY 2016, over $3.5 million in STP‐Urban funding may be subject to MoDOT’s funds lapse
policy. It is important that the STP‐Urban funding that is programmed through FY 2016 be obligated as
planned to prevent any future rescissions.
The table below shows what is needed to be obligated by each jurisdiction before September 30, 2016.
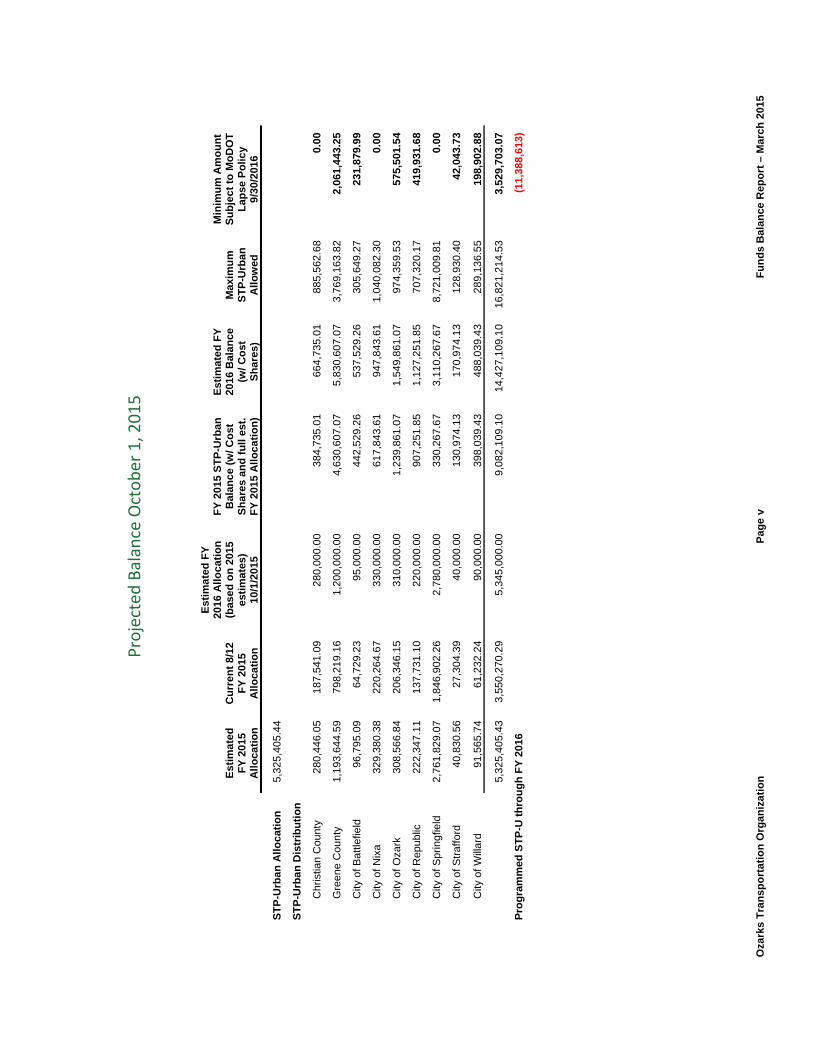
Oza
rks
Tra
nsp
ort
atio
n O
rgan
iza
tio
n
Pag
e v
Fu
nd
s B
alan
ce R
epo
rt –
Mar
ch
201
5
Projected
Balance October 1, 2015
Est
ima
ted
F
Y 2
015
All
oca
tio
n
Cu
rren
t 8/
12
FY
201
5 A
llo
cati
on
Est
ima
ted
FY
20
16 A
llo
cati
on
(b
ase
d o
n 2
015
esti
ma
tes
) 10
/1/2
015
FY
201
5 S
TP
-Urb
an
Bal
ance
(w
/ Co
st
Sh
ares
an
d f
ull
est.
F
Y 2
015
All
oca
tio
n)
Est
ima
ted
FY
20
16 B
ala
nce
(w
/ Co
st
Sh
ares
)
Max
imu
m
ST
P-U
rba
n
All
ow
ed
Min
imu
m A
mo
un
t S
ub
jec
t to
Mo
DO
T
Lap
se P
olic
y 9/
30/2
016
ST
P-U
rba
n A
llo
cati
on
5,
325,
405.
44
ST
P-U
rba
n D
istr
ibu
tio
n
C
hris
tian
Cou
nty
280,
446.
05
187,
541.
09
280,
000.
00
384,
735.
01
664,
735.
01
885,
562.
68
0.00
Gre
ene
Cou
nty
1,
193,
644.
59
798,
219.
16
1,20
0,00
0.00
4,
630,
607.
07
5,83
0,60
7.07
3,
769,
163.
82
2,06
1,44
3.25
City
of B
attle
field
96
,795
.09
64,7
29.2
3 95
,000
.00
442,
529.
26
537,
529.
26
305,
649.
27
231,
879.
99
City
of N
ixa
32
9,38
0.38
22
0,26
4.67
33
0,00
0.00
61
7,84
3.61
94
7,84
3.61
1,
040,
082.
30
0.00
City
of
Oza
rk
308,
566.
84
206,
346.
15
310,
000.
00
1,23
9,86
1.07
1,
549,
861.
07
974,
359.
53
575,
501.
54
City
of R
epub
lic
222,
347.
11
137,
731.
10
220,
000.
00
907,
251.
85
1,12
7,25
1.85
70
7,32
0.17
41
9,93
1.68
City
of S
prin
gfie
ld
2,76
1,82
9.07
1,
846,
902.
26
2,78
0,00
0.00
33
0,26
7.67
3,
110,
267.
67
8,72
1,00
9.81
0.
00
City
of S
traf
ford
40
,830
.56
27,3
04.3
9 40
,000
.00
130,
974.
13
170,
974.
13
128,
930.
40
42,0
43.7
3
City
of W
illar
d 91
,565
.74
61,2
32.2
4 90
,000
.00
398,
039.
43
488,
039.
43
289,
136.
55
198,
902.
88
5,
325,
405.
43
3,55
0,27
0.29
5,
345,
000.
00
9,08
2,10
9.10
14
,427
,109
.10
16,8
21,2
14.5
3 3,
529,
703.
07
Pro
gra
mm
ed S
TP
-U t
hro
ug
h F
Y 2
016
(11,
388,
613
)
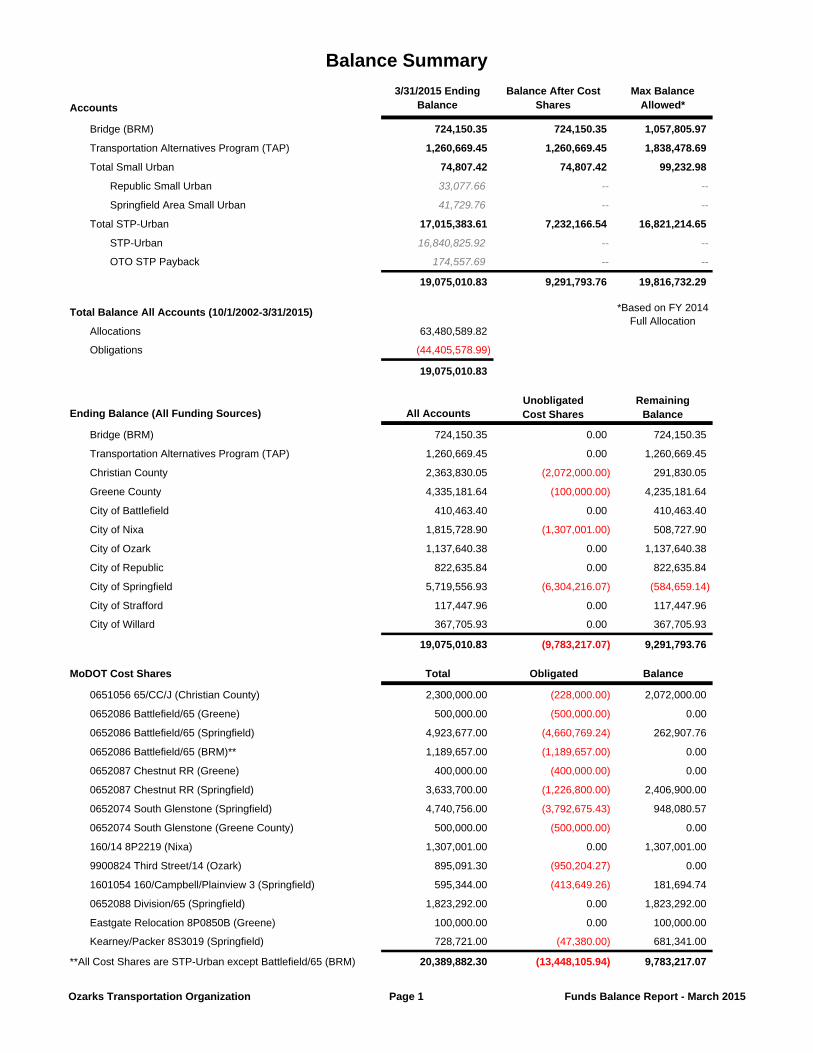
Balance Summary
Accounts
3/31/2015 Ending Balance
Balance After Cost Shares
Max Balance Allowed*
Bridge (BRM) 724,150.35 724,150.35 1,057,805.97
Transportation Alternatives Program (TAP) 1,260,669.45 1,260,669.45 1,838,478.69
Total Small Urban 74,807.42 74,807.42 99,232.98
Republic Small Urban 33,077.66 -- --
Springfield Area Small Urban 41,729.76 -- --
Total STP-Urban 17,015,383.61 7,232,166.54 16,821,214.65
STP-Urban 16,840,825.92 -- --
OTO STP Payback 174,557.69 -- --
19,075,010.83 9,291,793.76 19,816,732.29
Total Balance All Accounts (10/1/2002-3/31/2015)
Allocations 63,480,589.82
Obligations (44,405,578.99)
19,075,010.83
Ending Balance (All Funding Sources) All Accounts
Bridge (BRM) 724,150.35 0.00 724,150.35
Transportation Alternatives Program (TAP) 1,260,669.45 0.00 1,260,669.45
Christian County 2,363,830.05 (2,072,000.00) 291,830.05
Greene County 4,335,181.64 (100,000.00) 4,235,181.64
City of Battlefield 410,463.40 0.00 410,463.40
City of Nixa 1,815,728.90 (1,307,001.00) 508,727.90
City of Ozark 1,137,640.38 0.00 1,137,640.38
City of Republic 822,635.84 0.00 822,635.84
City of Springfield 5,719,556.93 (6,304,216.07) (584,659.14)
City of Strafford 117,447.96 0.00 117,447.96
City of Willard 367,705.93 0.00 367,705.93
19,075,010.83 (9,783,217.07) 9,291,793.76
MoDOT Cost Shares Total Obligated Balance
0651056 65/CC/J (Christian County) 2,300,000.00 (228,000.00) 2,072,000.00
0652086 Battlefield/65 (Greene) 500,000.00 (500,000.00) 0.00
0652086 Battlefield/65 (Springfield) 4,923,677.00 (4,660,769.24) 262,907.76
0652086 Battlefield/65 (BRM)** 1,189,657.00 (1,189,657.00) 0.00
0652087 Chestnut RR (Greene) 400,000.00 (400,000.00) 0.00
0652087 Chestnut RR (Springfield) 3,633,700.00 (1,226,800.00) 2,406,900.00
0652074 South Glenstone (Springfield) 4,740,756.00 (3,792,675.43) 948,080.57
0652074 South Glenstone (Greene County) 500,000.00 (500,000.00) 0.00
160/14 8P2219 (Nixa) 1,307,001.00 0.00 1,307,001.00
9900824 Third Street/14 (Ozark) 895,091.30 (950,204.27) 0.00
1601054 160/Campbell/Plainview 3 (Springfield) 595,344.00 (413,649.26) 181,694.74
0652088 Division/65 (Springfield) 1,823,292.00 0.00 1,823,292.00
Eastgate Relocation 8P0850B (Greene) 100,000.00 0.00 100,000.00
Kearney/Packer 8S3019 (Springfield) 728,721.00 (47,380.00) 681,341.00
**All Cost Shares are STP-Urban except Battlefield/65 (BRM) 20,389,882.30 (13,448,105.94) 9,783,217.07
UnobligatedCost Shares
RemainingBalance
*Based on FY 2014 Full Allocation
Ozarks Transportation Organization Page 1 Funds Balance Report - March 2015
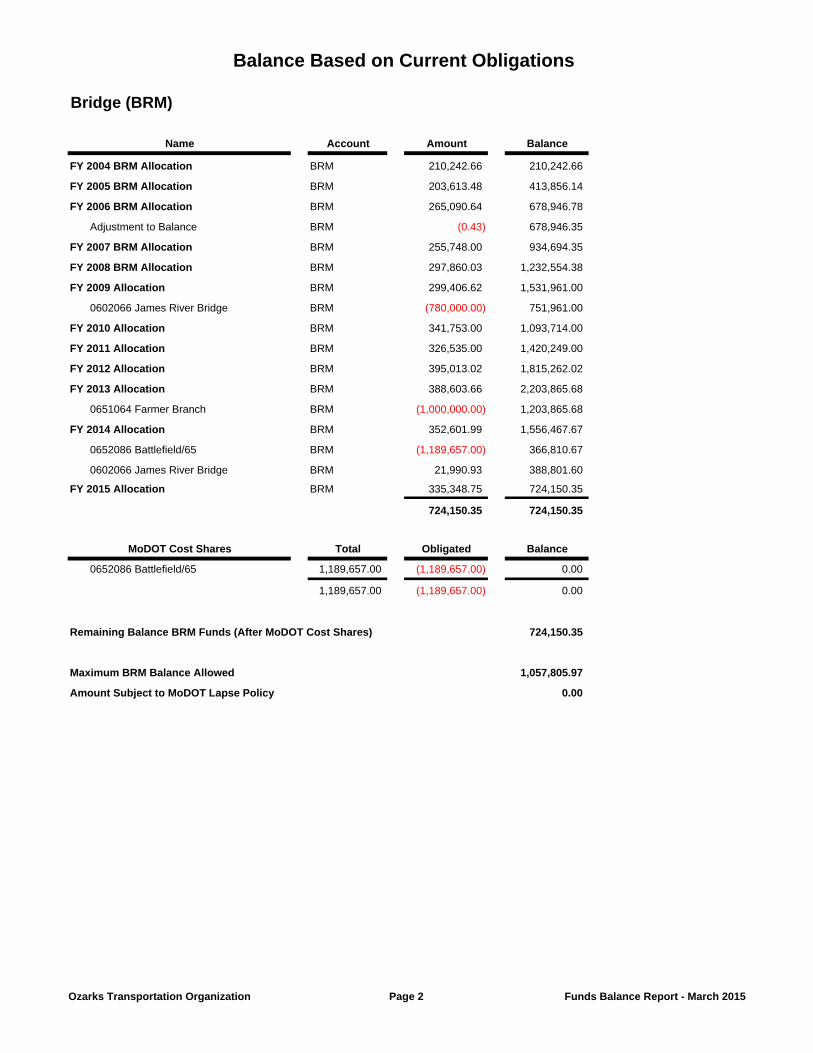
Balance Based on Current Obligations
Bridge (BRM)
Name Account Amount Balance
FY 2004 BRM Allocation BRM 210,242.66 210,242.66
FY 2005 BRM Allocation BRM 203,613.48 413,856.14
FY 2006 BRM Allocation BRM 265,090.64 678,946.78
Adjustment to Balance BRM (0.43) 678,946.35
FY 2007 BRM Allocation BRM 255,748.00 934,694.35
FY 2008 BRM Allocation BRM 297,860.03 1,232,554.38
FY 2009 Allocation BRM 299,406.62 1,531,961.00
0602066 James River Bridge BRM (780,000.00) 751,961.00
FY 2010 Allocation BRM 341,753.00 1,093,714.00
FY 2011 Allocation BRM 326,535.00 1,420,249.00
FY 2012 Allocation BRM 395,013.02 1,815,262.02
FY 2013 Allocation BRM 388,603.66 2,203,865.68
0651064 Farmer Branch BRM (1,000,000.00) 1,203,865.68
FY 2014 Allocation BRM 352,601.99 1,556,467.67
0652086 Battlefield/65 BRM (1,189,657.00) 366,810.67
0602066 James River Bridge BRM 21,990.93 388,801.60
FY 2015 Allocation BRM 335,348.75 724,150.35
724,150.35 724,150.35
MoDOT Cost Shares Total Obligated Balance
0652086 Battlefield/65 1,189,657.00 (1,189,657.00) 0.00
1,189,657.00 (1,189,657.00) 0.00
Remaining Balance BRM Funds (After MoDOT Cost Shares) 724,150.35
Maximum BRM Balance Allowed 1,057,805.97
Amount Subject to MoDOT Lapse Policy 0.00
Ozarks Transportation Organization Page 2 Funds Balance Report - March 2015
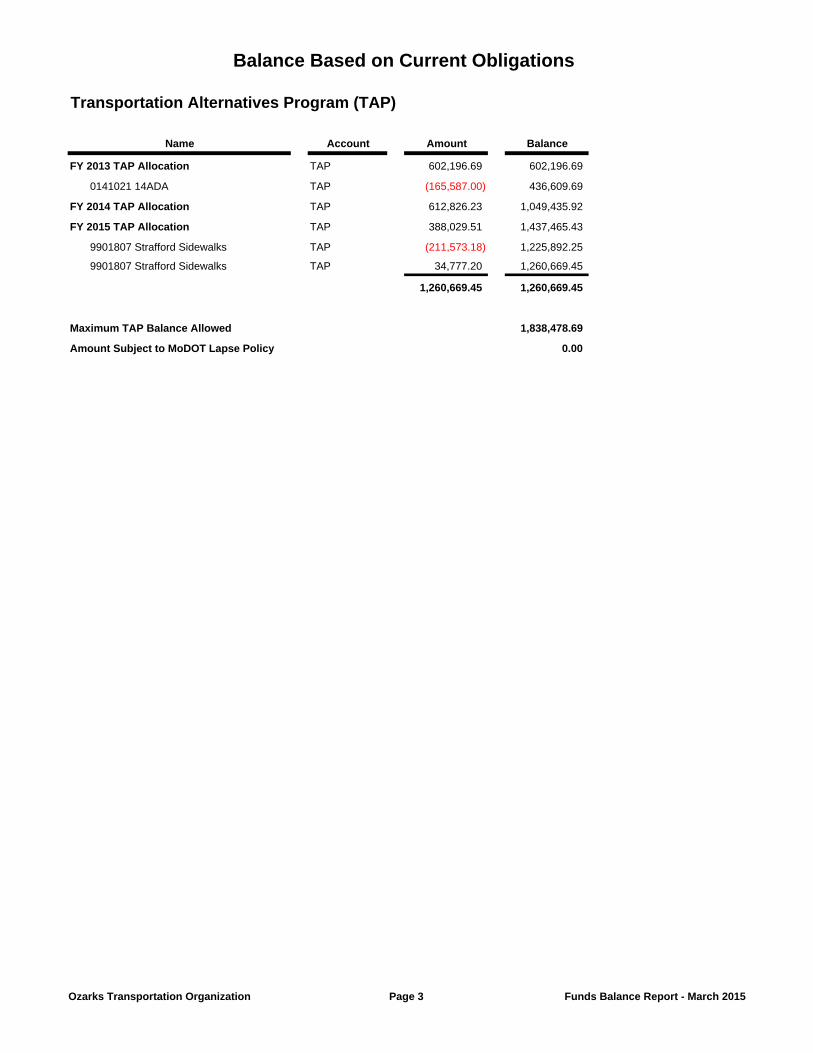
Balance Based on Current Obligations
Transportation Alternatives Program (TAP)
Name Account Amount Balance
FY 2013 TAP Allocation TAP 602,196.69 602,196.69
0141021 14ADA TAP (165,587.00) 436,609.69
FY 2014 TAP Allocation TAP 612,826.23 1,049,435.92
FY 2015 TAP Allocation TAP 388,029.51 1,437,465.43
9901807 Strafford Sidewalks TAP (211,573.18) 1,225,892.25
9901807 Strafford Sidewalks TAP 34,777.20 1,260,669.45
1,260,669.45 1,260,669.45
Maximum TAP Balance Allowed 1,838,478.69
Amount Subject to MoDOT Lapse Policy 0.00
Ozarks Transportation Organization Page 3 Funds Balance Report - March 2015
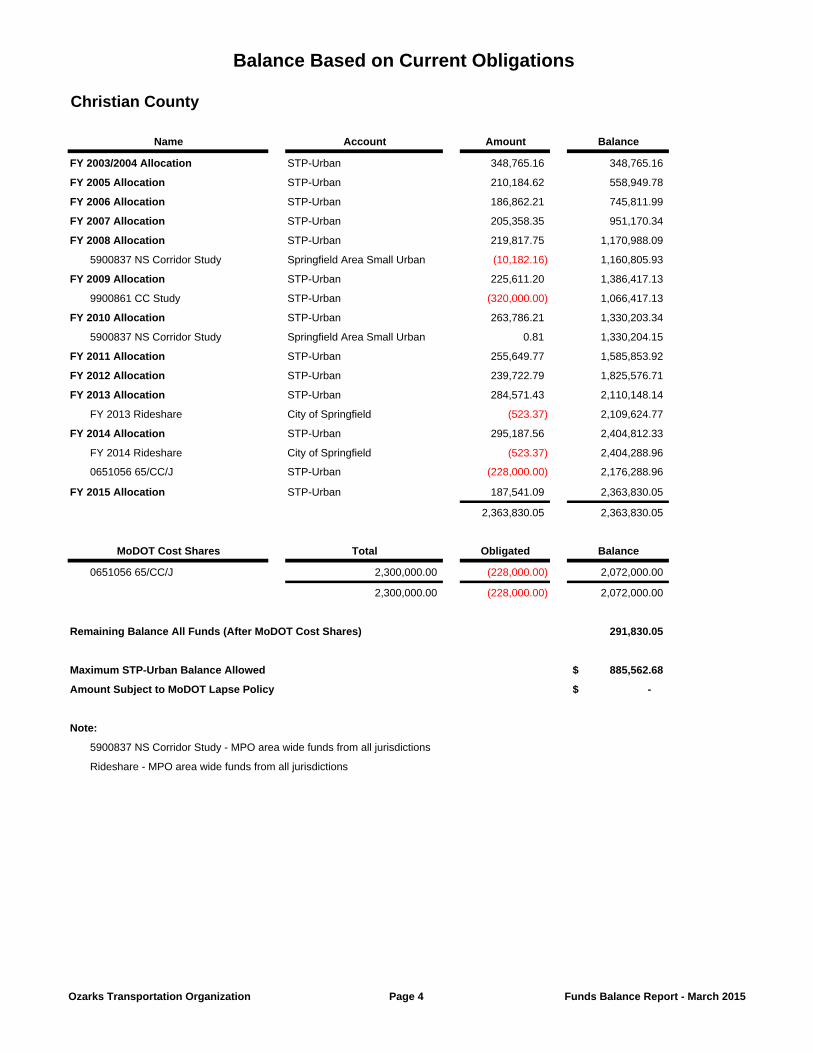
Balance Based on Current Obligations
Christian County
Name Account Amount Balance
FY 2003/2004 Allocation STP-Urban 348,765.16 348,765.16
FY 2005 Allocation STP-Urban 210,184.62 558,949.78
FY 2006 Allocation STP-Urban 186,862.21 745,811.99
FY 2007 Allocation STP-Urban 205,358.35 951,170.34
FY 2008 Allocation STP-Urban 219,817.75 1,170,988.09
5900837 NS Corridor Study Springfield Area Small Urban (10,182.16) 1,160,805.93
FY 2009 Allocation STP-Urban 225,611.20 1,386,417.13
9900861 CC Study STP-Urban (320,000.00) 1,066,417.13
FY 2010 Allocation STP-Urban 263,786.21 1,330,203.34
5900837 NS Corridor Study Springfield Area Small Urban 0.81 1,330,204.15
FY 2011 Allocation STP-Urban 255,649.77 1,585,853.92
FY 2012 Allocation STP-Urban 239,722.79 1,825,576.71
FY 2013 Allocation STP-Urban 284,571.43 2,110,148.14
FY 2013 Rideshare City of Springfield (523.37) 2,109,624.77
FY 2014 Allocation STP-Urban 295,187.56 2,404,812.33
FY 2014 Rideshare City of Springfield (523.37) 2,404,288.96
0651056 65/CC/J STP-Urban (228,000.00) 2,176,288.96
FY 2015 Allocation STP-Urban 187,541.09 2,363,830.05
2,363,830.05 2,363,830.05
MoDOT Cost Shares Total Obligated Balance
0651056 65/CC/J 2,300,000.00 (228,000.00) 2,072,000.00
2,300,000.00 (228,000.00) 2,072,000.00
Remaining Balance All Funds (After MoDOT Cost Shares) 291,830.05
Maximum STP-Urban Balance Allowed 885,562.68$
Amount Subject to MoDOT Lapse Policy -$
Note:
5900837 NS Corridor Study - MPO area wide funds from all jurisdictions
Rideshare - MPO area wide funds from all jurisdictions
Ozarks Transportation Organization Page 4 Funds Balance Report - March 2015
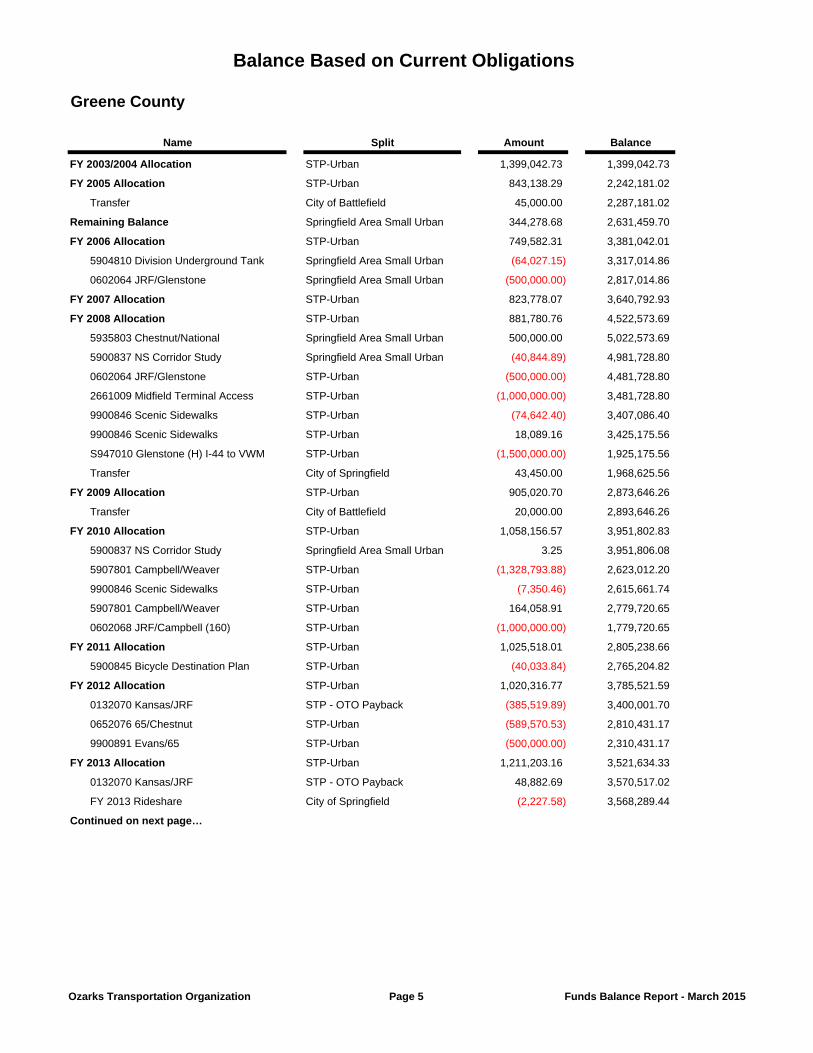
Balance Based on Current Obligations
Greene County
Name Split Amount Balance
FY 2003/2004 Allocation STP-Urban 1,399,042.73 1,399,042.73
FY 2005 Allocation STP-Urban 843,138.29 2,242,181.02
Transfer City of Battlefield 45,000.00 2,287,181.02
Remaining Balance Springfield Area Small Urban 344,278.68 2,631,459.70
FY 2006 Allocation STP-Urban 749,582.31 3,381,042.01
5904810 Division Underground Tank Springfield Area Small Urban (64,027.15) 3,317,014.86
0602064 JRF/Glenstone Springfield Area Small Urban (500,000.00) 2,817,014.86
FY 2007 Allocation STP-Urban 823,778.07 3,640,792.93
FY 2008 Allocation STP-Urban 881,780.76 4,522,573.69
5935803 Chestnut/National Springfield Area Small Urban 500,000.00 5,022,573.69
5900837 NS Corridor Study Springfield Area Small Urban (40,844.89) 4,981,728.80
0602064 JRF/Glenstone STP-Urban (500,000.00) 4,481,728.80
2661009 Midfield Terminal Access STP-Urban (1,000,000.00) 3,481,728.80
9900846 Scenic Sidewalks STP-Urban (74,642.40) 3,407,086.40
9900846 Scenic Sidewalks STP-Urban 18,089.16 3,425,175.56
S947010 Glenstone (H) I-44 to VWM STP-Urban (1,500,000.00) 1,925,175.56
Transfer City of Springfield 43,450.00 1,968,625.56
FY 2009 Allocation STP-Urban 905,020.70 2,873,646.26
Transfer City of Battlefield 20,000.00 2,893,646.26
FY 2010 Allocation STP-Urban 1,058,156.57 3,951,802.83
5900837 NS Corridor Study Springfield Area Small Urban 3.25 3,951,806.08
5907801 Campbell/Weaver STP-Urban (1,328,793.88) 2,623,012.20
9900846 Scenic Sidewalks STP-Urban (7,350.46) 2,615,661.74
5907801 Campbell/Weaver STP-Urban 164,058.91 2,779,720.65
0602068 JRF/Campbell (160) STP-Urban (1,000,000.00) 1,779,720.65
FY 2011 Allocation STP-Urban 1,025,518.01 2,805,238.66
5900845 Bicycle Destination Plan STP-Urban (40,033.84) 2,765,204.82
FY 2012 Allocation STP-Urban 1,020,316.77 3,785,521.59
0132070 Kansas/JRF STP - OTO Payback (385,519.89) 3,400,001.70
0652076 65/Chestnut STP-Urban (589,570.53) 2,810,431.17
9900891 Evans/65 STP-Urban (500,000.00) 2,310,431.17
FY 2013 Allocation STP-Urban 1,211,203.16 3,521,634.33
0132070 Kansas/JRF STP - OTO Payback 48,882.69 3,570,517.02
FY 2013 Rideshare City of Springfield (2,227.58) 3,568,289.44
Continued on next page…
Ozarks Transportation Organization Page 5 Funds Balance Report - March 2015
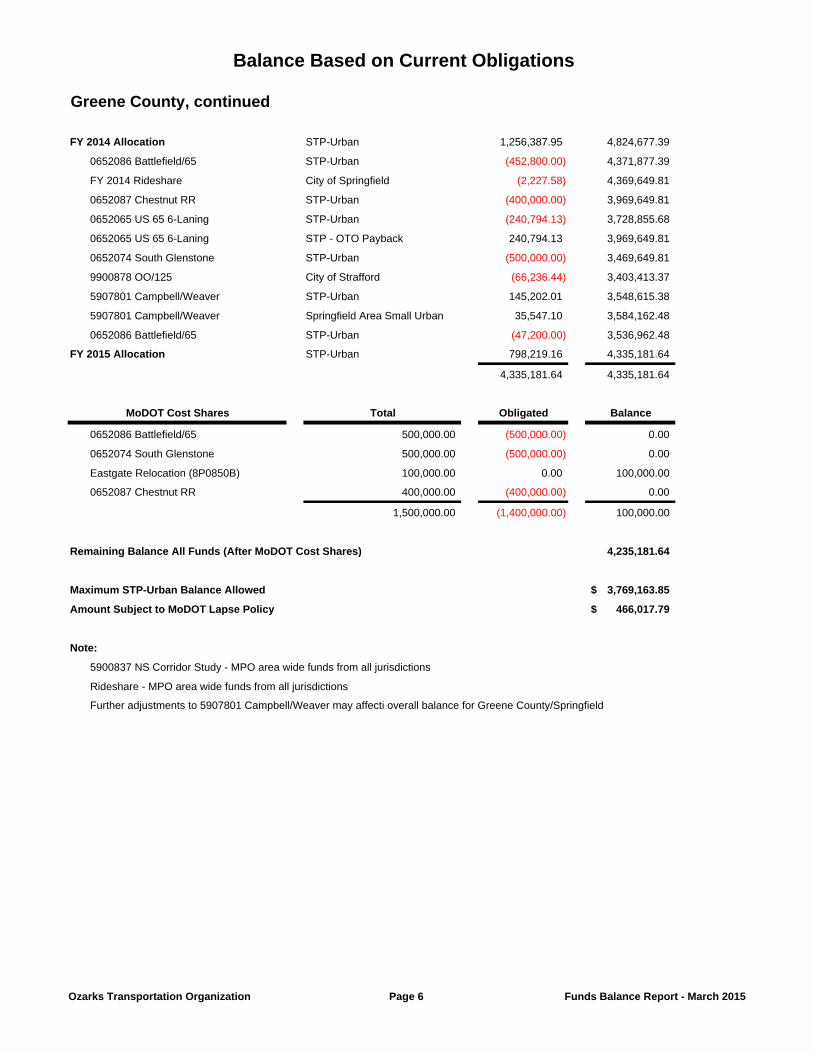
Balance Based on Current Obligations
Greene County, continued
FY 2014 Allocation STP-Urban 1,256,387.95 4,824,677.39
0652086 Battlefield/65 STP-Urban (452,800.00) 4,371,877.39
FY 2014 Rideshare City of Springfield (2,227.58) 4,369,649.81
0652087 Chestnut RR STP-Urban (400,000.00) 3,969,649.81
0652065 US 65 6-Laning STP-Urban (240,794.13) 3,728,855.68
0652065 US 65 6-Laning STP - OTO Payback 240,794.13 3,969,649.81
0652074 South Glenstone STP-Urban (500,000.00) 3,469,649.81
9900878 OO/125 City of Strafford (66,236.44) 3,403,413.37
5907801 Campbell/Weaver STP-Urban 145,202.01 3,548,615.38
5907801 Campbell/Weaver Springfield Area Small Urban 35,547.10 3,584,162.48
0652086 Battlefield/65 STP-Urban (47,200.00) 3,536,962.48
FY 2015 Allocation STP-Urban 798,219.16 4,335,181.64
4,335,181.64 4,335,181.64
MoDOT Cost Shares Total Obligated Balance
0652086 Battlefield/65 500,000.00 (500,000.00) 0.00
0652074 South Glenstone 500,000.00 (500,000.00) 0.00
Eastgate Relocation (8P0850B) 100,000.00 0.00 100,000.00
0652087 Chestnut RR 400,000.00 (400,000.00) 0.00
1,500,000.00 (1,400,000.00) 100,000.00
Remaining Balance All Funds (After MoDOT Cost Shares) 4,235,181.64
Maximum STP-Urban Balance Allowed 3,769,163.85$
Amount Subject to MoDOT Lapse Policy 466,017.79$
Note:
5900837 NS Corridor Study - MPO area wide funds from all jurisdictions
Rideshare - MPO area wide funds from all jurisdictions
Further adjustments to 5907801 Campbell/Weaver may affecti overall balance for Greene County/Springfield
Ozarks Transportation Organization Page 6 Funds Balance Report - March 2015
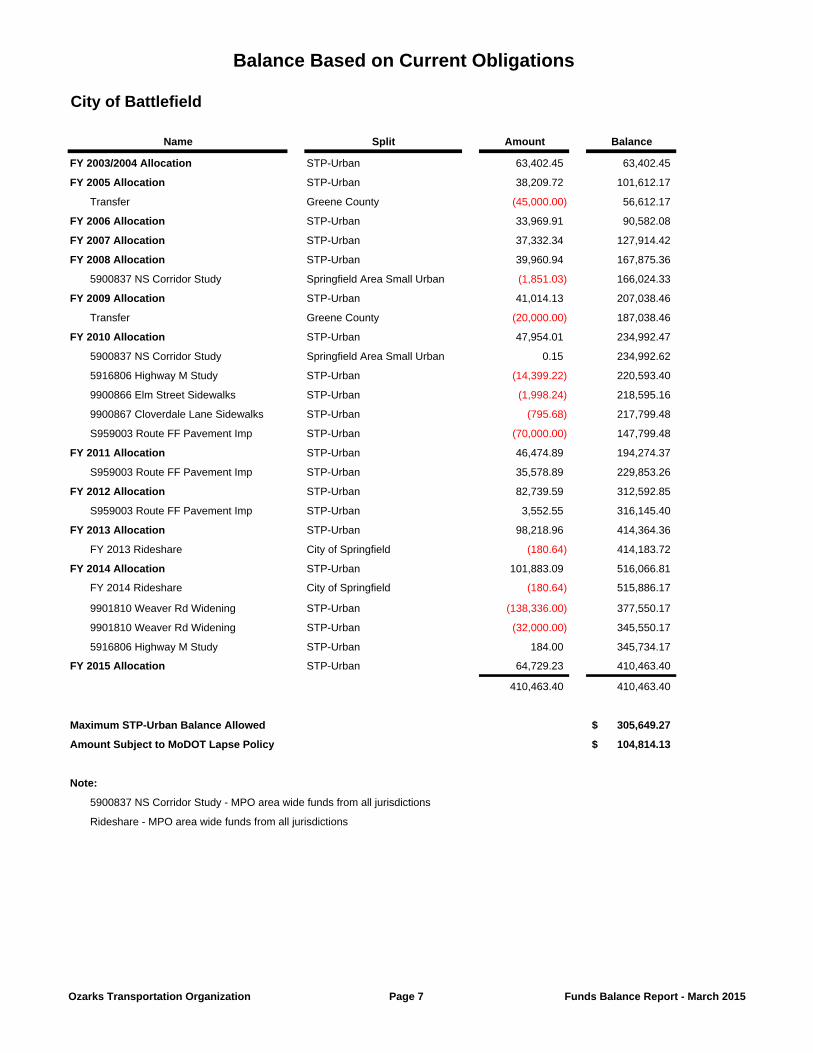
Balance Based on Current Obligations
City of Battlefield
Name Split Amount Balance
FY 2003/2004 Allocation STP-Urban 63,402.45 63,402.45
FY 2005 Allocation STP-Urban 38,209.72 101,612.17
Transfer Greene County (45,000.00) 56,612.17
FY 2006 Allocation STP-Urban 33,969.91 90,582.08
FY 2007 Allocation STP-Urban 37,332.34 127,914.42
FY 2008 Allocation STP-Urban 39,960.94 167,875.36
5900837 NS Corridor Study Springfield Area Small Urban (1,851.03) 166,024.33
FY 2009 Allocation STP-Urban 41,014.13 207,038.46
Transfer Greene County (20,000.00) 187,038.46
FY 2010 Allocation STP-Urban 47,954.01 234,992.47
5900837 NS Corridor Study Springfield Area Small Urban 0.15 234,992.62
5916806 Highway M Study STP-Urban (14,399.22) 220,593.40
9900866 Elm Street Sidewalks STP-Urban (1,998.24) 218,595.16
9900867 Cloverdale Lane Sidewalks STP-Urban (795.68) 217,799.48
S959003 Route FF Pavement Imp STP-Urban (70,000.00) 147,799.48
FY 2011 Allocation STP-Urban 46,474.89 194,274.37
S959003 Route FF Pavement Imp STP-Urban 35,578.89 229,853.26
FY 2012 Allocation STP-Urban 82,739.59 312,592.85
S959003 Route FF Pavement Imp STP-Urban 3,552.55 316,145.40
FY 2013 Allocation STP-Urban 98,218.96 414,364.36
FY 2013 Rideshare City of Springfield (180.64) 414,183.72
FY 2014 Allocation STP-Urban 101,883.09 516,066.81
FY 2014 Rideshare City of Springfield (180.64) 515,886.17
9901810 Weaver Rd Widening STP-Urban (138,336.00) 377,550.17
9901810 Weaver Rd Widening STP-Urban (32,000.00) 345,550.17
5916806 Highway M Study STP-Urban 184.00 345,734.17
FY 2015 Allocation STP-Urban 64,729.23 410,463.40
410,463.40 410,463.40
Maximum STP-Urban Balance Allowed 305,649.27$
Amount Subject to MoDOT Lapse Policy 104,814.13$
Note:
5900837 NS Corridor Study - MPO area wide funds from all jurisdictions
Rideshare - MPO area wide funds from all jurisdictions
Ozarks Transportation Organization Page 7 Funds Balance Report - March 2015
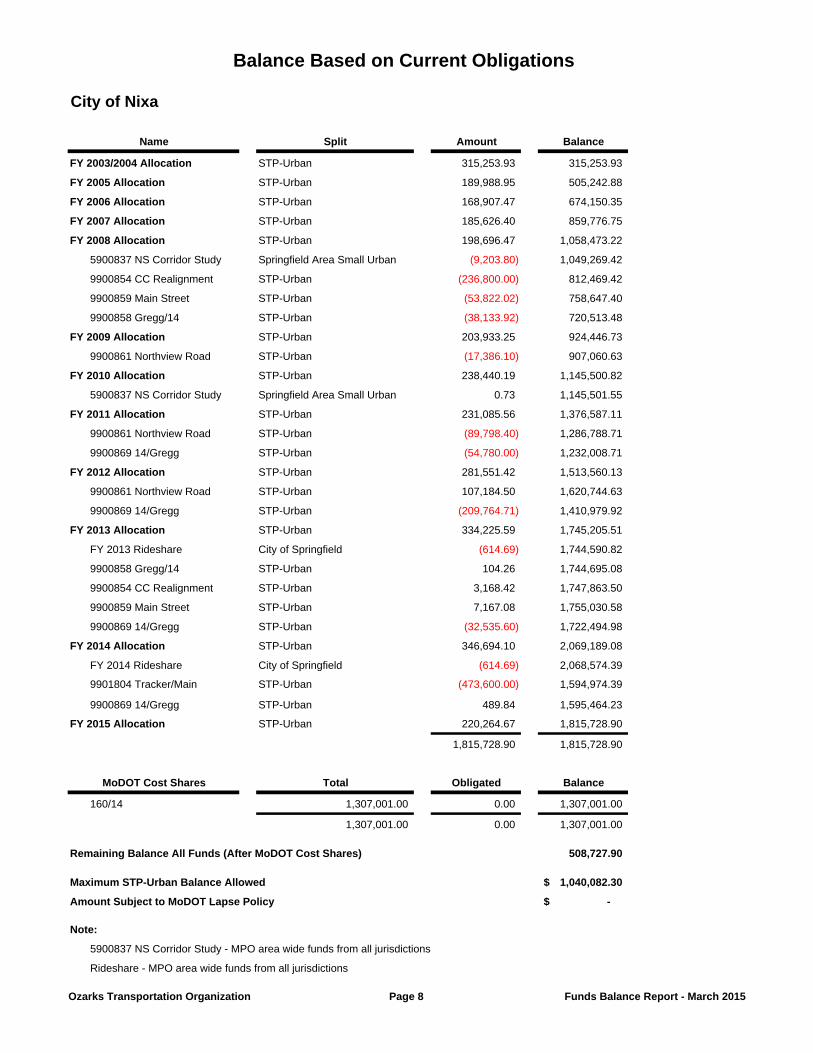
Balance Based on Current Obligations
City of Nixa
Name Split Amount Balance
FY 2003/2004 Allocation STP-Urban 315,253.93 315,253.93
FY 2005 Allocation STP-Urban 189,988.95 505,242.88
FY 2006 Allocation STP-Urban 168,907.47 674,150.35
FY 2007 Allocation STP-Urban 185,626.40 859,776.75
FY 2008 Allocation STP-Urban 198,696.47 1,058,473.22
5900837 NS Corridor Study Springfield Area Small Urban (9,203.80) 1,049,269.42
9900854 CC Realignment STP-Urban (236,800.00) 812,469.42
9900859 Main Street STP-Urban (53,822.02) 758,647.40
9900858 Gregg/14 STP-Urban (38,133.92) 720,513.48
FY 2009 Allocation STP-Urban 203,933.25 924,446.73
9900861 Northview Road STP-Urban (17,386.10) 907,060.63
FY 2010 Allocation STP-Urban 238,440.19 1,145,500.82
5900837 NS Corridor Study Springfield Area Small Urban 0.73 1,145,501.55
FY 2011 Allocation STP-Urban 231,085.56 1,376,587.11
9900861 Northview Road STP-Urban (89,798.40) 1,286,788.71
9900869 14/Gregg STP-Urban (54,780.00) 1,232,008.71
FY 2012 Allocation STP-Urban 281,551.42 1,513,560.13
9900861 Northview Road STP-Urban 107,184.50 1,620,744.63
9900869 14/Gregg STP-Urban (209,764.71) 1,410,979.92
FY 2013 Allocation STP-Urban 334,225.59 1,745,205.51
FY 2013 Rideshare City of Springfield (614.69) 1,744,590.82
9900858 Gregg/14 STP-Urban 104.26 1,744,695.08
9900854 CC Realignment STP-Urban 3,168.42 1,747,863.50
9900859 Main Street STP-Urban 7,167.08 1,755,030.58
9900869 14/Gregg STP-Urban (32,535.60) 1,722,494.98
FY 2014 Allocation STP-Urban 346,694.10 2,069,189.08
FY 2014 Rideshare City of Springfield (614.69) 2,068,574.39
9901804 Tracker/Main STP-Urban (473,600.00) 1,594,974.39
9900869 14/Gregg STP-Urban 489.84 1,595,464.23
FY 2015 Allocation STP-Urban 220,264.67 1,815,728.90
1,815,728.90 1,815,728.90
MoDOT Cost Shares Total Obligated Balance
160/14 1,307,001.00 0.00 1,307,001.00
1,307,001.00 0.00 1,307,001.00
Remaining Balance All Funds (After MoDOT Cost Shares) 508,727.90
Maximum STP-Urban Balance Allowed 1,040,082.30$
Amount Subject to MoDOT Lapse Policy -$
Note:
5900837 NS Corridor Study - MPO area wide funds from all jurisdictions
Rideshare - MPO area wide funds from all jurisdictions
Ozarks Transportation Organization Page 8 Funds Balance Report - March 2015
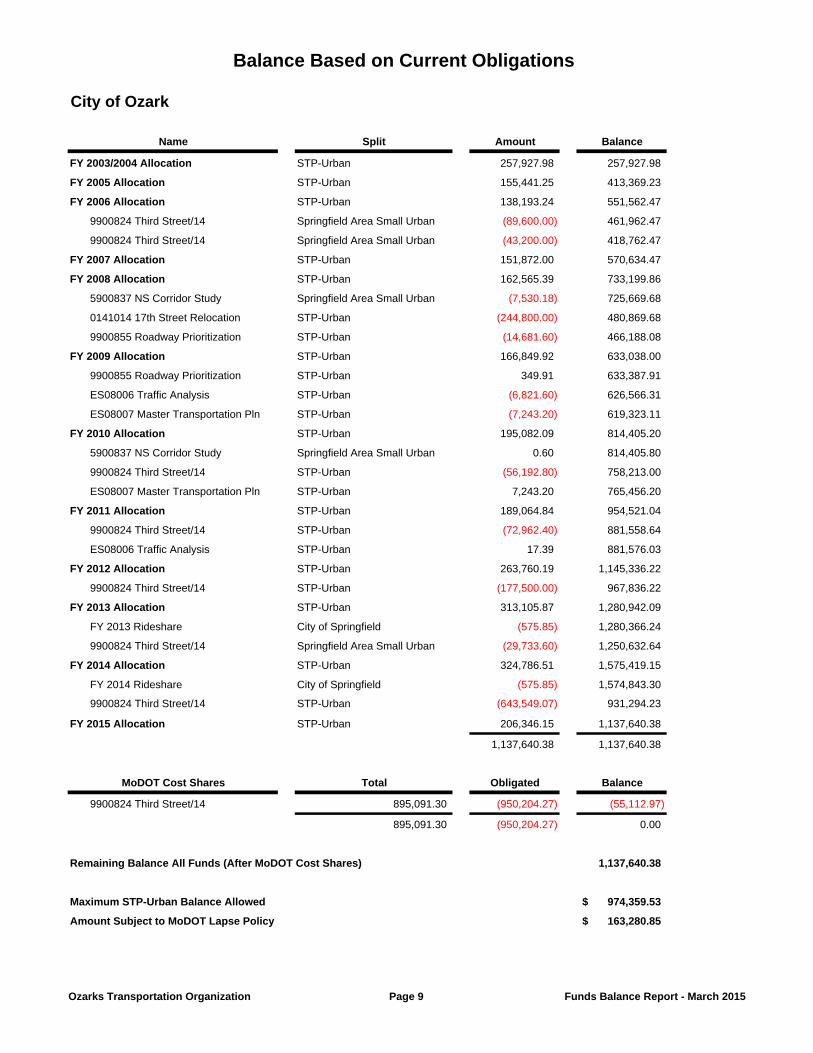
Balance Based on Current Obligations
City of Ozark
Name Split Amount Balance
FY 2003/2004 Allocation STP-Urban 257,927.98 257,927.98
FY 2005 Allocation STP-Urban 155,441.25 413,369.23
FY 2006 Allocation STP-Urban 138,193.24 551,562.47
9900824 Third Street/14 Springfield Area Small Urban (89,600.00) 461,962.47
9900824 Third Street/14 Springfield Area Small Urban (43,200.00) 418,762.47
FY 2007 Allocation STP-Urban 151,872.00 570,634.47
FY 2008 Allocation STP-Urban 162,565.39 733,199.86
5900837 NS Corridor Study Springfield Area Small Urban (7,530.18) 725,669.68
0141014 17th Street Relocation STP-Urban (244,800.00) 480,869.68
9900855 Roadway Prioritization STP-Urban (14,681.60) 466,188.08
FY 2009 Allocation STP-Urban 166,849.92 633,038.00
9900855 Roadway Prioritization STP-Urban 349.91 633,387.91
ES08006 Traffic Analysis STP-Urban (6,821.60) 626,566.31
ES08007 Master Transportation Pln STP-Urban (7,243.20) 619,323.11
FY 2010 Allocation STP-Urban 195,082.09 814,405.20
5900837 NS Corridor Study Springfield Area Small Urban 0.60 814,405.80
9900824 Third Street/14 STP-Urban (56,192.80) 758,213.00
ES08007 Master Transportation Pln STP-Urban 7,243.20 765,456.20
FY 2011 Allocation STP-Urban 189,064.84 954,521.04
9900824 Third Street/14 STP-Urban (72,962.40) 881,558.64
ES08006 Traffic Analysis STP-Urban 17.39 881,576.03
FY 2012 Allocation STP-Urban 263,760.19 1,145,336.22
9900824 Third Street/14 STP-Urban (177,500.00) 967,836.22
FY 2013 Allocation STP-Urban 313,105.87 1,280,942.09
FY 2013 Rideshare City of Springfield (575.85) 1,280,366.24
9900824 Third Street/14 Springfield Area Small Urban (29,733.60) 1,250,632.64
FY 2014 Allocation STP-Urban 324,786.51 1,575,419.15
FY 2014 Rideshare City of Springfield (575.85) 1,574,843.30
9900824 Third Street/14 STP-Urban (643,549.07) 931,294.23
FY 2015 Allocation STP-Urban 206,346.15 1,137,640.38
1,137,640.38 1,137,640.38
MoDOT Cost Shares Total Obligated Balance
9900824 Third Street/14 895,091.30 (950,204.27) (55,112.97)
895,091.30 (950,204.27) 0.00
Remaining Balance All Funds (After MoDOT Cost Shares) 1,137,640.38
Maximum STP-Urban Balance Allowed 974,359.53$
Amount Subject to MoDOT Lapse Policy 163,280.85$
Ozarks Transportation Organization Page 9 Funds Balance Report - March 2015
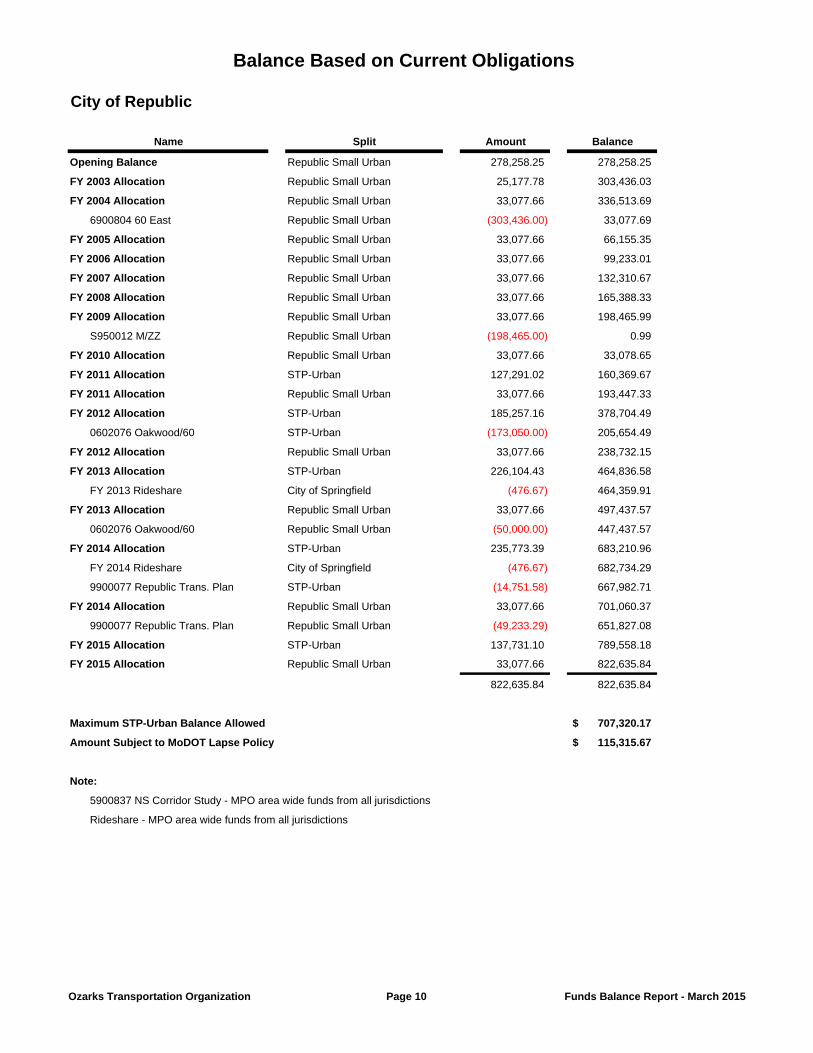
Balance Based on Current Obligations
City of Republic
Name Split Amount Balance
Opening Balance Republic Small Urban 278,258.25 278,258.25
FY 2003 Allocation Republic Small Urban 25,177.78 303,436.03
FY 2004 Allocation Republic Small Urban 33,077.66 336,513.69
6900804 60 East Republic Small Urban (303,436.00) 33,077.69
FY 2005 Allocation Republic Small Urban 33,077.66 66,155.35
FY 2006 Allocation Republic Small Urban 33,077.66 99,233.01
FY 2007 Allocation Republic Small Urban 33,077.66 132,310.67
FY 2008 Allocation Republic Small Urban 33,077.66 165,388.33
FY 2009 Allocation Republic Small Urban 33,077.66 198,465.99
S950012 M/ZZ Republic Small Urban (198,465.00) 0.99
FY 2010 Allocation Republic Small Urban 33,077.66 33,078.65
FY 2011 Allocation STP-Urban 127,291.02 160,369.67
FY 2011 Allocation Republic Small Urban 33,077.66 193,447.33
FY 2012 Allocation STP-Urban 185,257.16 378,704.49
0602076 Oakwood/60 STP-Urban (173,050.00) 205,654.49
FY 2012 Allocation Republic Small Urban 33,077.66 238,732.15
FY 2013 Allocation STP-Urban 226,104.43 464,836.58
FY 2013 Rideshare City of Springfield (476.67) 464,359.91
FY 2013 Allocation Republic Small Urban 33,077.66 497,437.57
0602076 Oakwood/60 Republic Small Urban (50,000.00) 447,437.57
FY 2014 Allocation STP-Urban 235,773.39 683,210.96
FY 2014 Rideshare City of Springfield (476.67) 682,734.29
9900077 Republic Trans. Plan STP-Urban (14,751.58) 667,982.71
FY 2014 Allocation Republic Small Urban 33,077.66 701,060.37
9900077 Republic Trans. Plan Republic Small Urban (49,233.29) 651,827.08
FY 2015 Allocation STP-Urban 137,731.10 789,558.18
FY 2015 Allocation Republic Small Urban 33,077.66 822,635.84
822,635.84 822,635.84
Maximum STP-Urban Balance Allowed 707,320.17$
Amount Subject to MoDOT Lapse Policy 115,315.67$
Note:
5900837 NS Corridor Study - MPO area wide funds from all jurisdictions
Rideshare - MPO area wide funds from all jurisdictions
Ozarks Transportation Organization Page 10 Funds Balance Report - March 2015
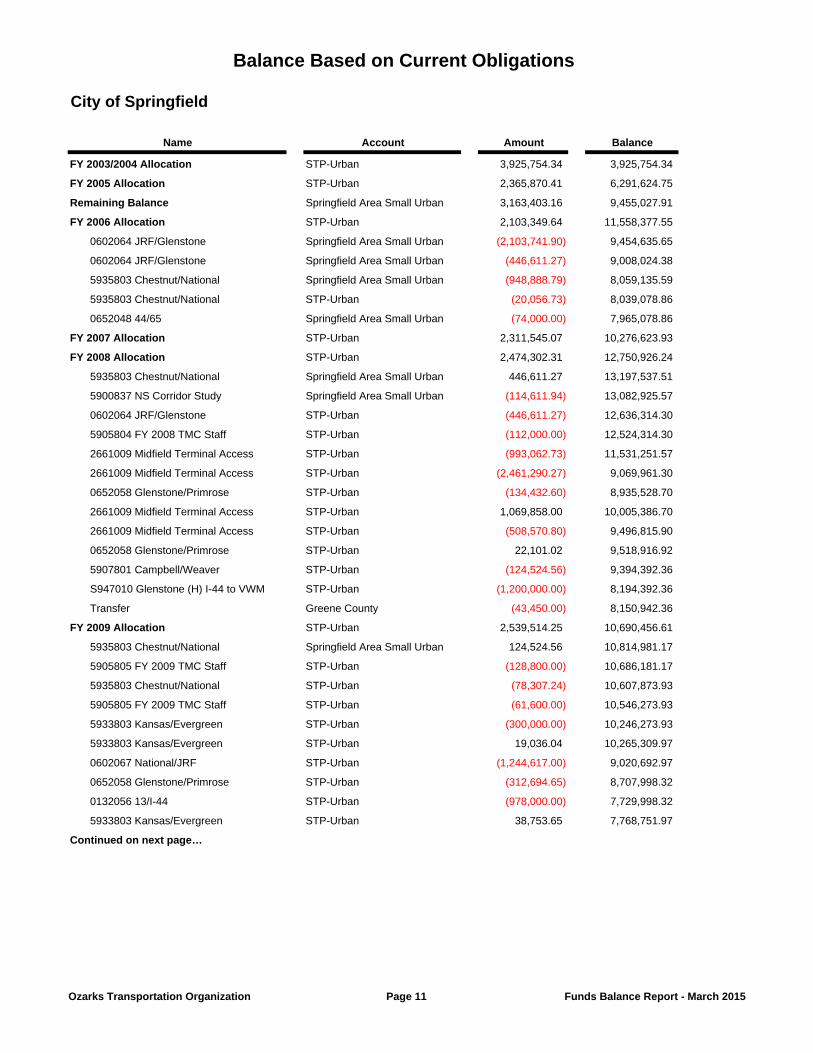
Balance Based on Current Obligations
City of Springfield
Name Account Amount Balance
FY 2003/2004 Allocation STP-Urban 3,925,754.34 3,925,754.34
FY 2005 Allocation STP-Urban 2,365,870.41 6,291,624.75
Remaining Balance Springfield Area Small Urban 3,163,403.16 9,455,027.91
FY 2006 Allocation STP-Urban 2,103,349.64 11,558,377.55
0602064 JRF/Glenstone Springfield Area Small Urban (2,103,741.90) 9,454,635.65
0602064 JRF/Glenstone Springfield Area Small Urban (446,611.27) 9,008,024.38
5935803 Chestnut/National Springfield Area Small Urban (948,888.79) 8,059,135.59
5935803 Chestnut/National STP-Urban (20,056.73) 8,039,078.86
0652048 44/65 Springfield Area Small Urban (74,000.00) 7,965,078.86
FY 2007 Allocation STP-Urban 2,311,545.07 10,276,623.93
FY 2008 Allocation STP-Urban 2,474,302.31 12,750,926.24
5935803 Chestnut/National Springfield Area Small Urban 446,611.27 13,197,537.51
5900837 NS Corridor Study Springfield Area Small Urban (114,611.94) 13,082,925.57
0602064 JRF/Glenstone STP-Urban (446,611.27) 12,636,314.30
5905804 FY 2008 TMC Staff STP-Urban (112,000.00) 12,524,314.30
2661009 Midfield Terminal Access STP-Urban (993,062.73) 11,531,251.57
2661009 Midfield Terminal Access STP-Urban (2,461,290.27) 9,069,961.30
0652058 Glenstone/Primrose STP-Urban (134,432.60) 8,935,528.70
2661009 Midfield Terminal Access STP-Urban 1,069,858.00 10,005,386.70
2661009 Midfield Terminal Access STP-Urban (508,570.80) 9,496,815.90
0652058 Glenstone/Primrose STP-Urban 22,101.02 9,518,916.92
5907801 Campbell/Weaver STP-Urban (124,524.56) 9,394,392.36
S947010 Glenstone (H) I-44 to VWM STP-Urban (1,200,000.00) 8,194,392.36
Transfer Greene County (43,450.00) 8,150,942.36
FY 2009 Allocation STP-Urban 2,539,514.25 10,690,456.61
5935803 Chestnut/National Springfield Area Small Urban 124,524.56 10,814,981.17
5905805 FY 2009 TMC Staff STP-Urban (128,800.00) 10,686,181.17
5935803 Chestnut/National STP-Urban (78,307.24) 10,607,873.93
5905805 FY 2009 TMC Staff STP-Urban (61,600.00) 10,546,273.93
5933803 Kansas/Evergreen STP-Urban (300,000.00) 10,246,273.93
5933803 Kansas/Evergreen STP-Urban 19,036.04 10,265,309.97
0602067 National/JRF STP-Urban (1,244,617.00) 9,020,692.97
0652058 Glenstone/Primrose STP-Urban (312,694.65) 8,707,998.32
0132056 13/I-44 STP-Urban (978,000.00) 7,729,998.32
5933803 Kansas/Evergreen STP-Urban 38,753.65 7,768,751.97
Continued on next page…
Ozarks Transportation Organization Page 11 Funds Balance Report - March 2015
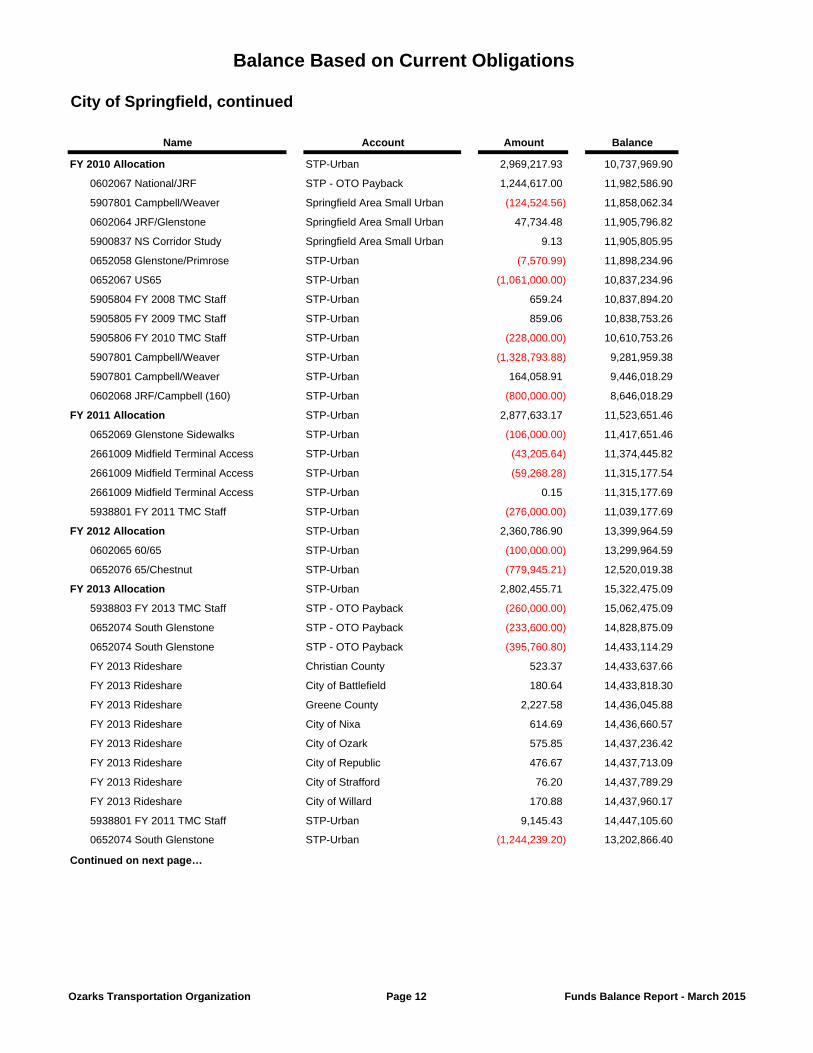
Balance Based on Current Obligations
City of Springfield, continued
Name Account Amount Balance
FY 2010 Allocation STP-Urban 2,969,217.93 10,737,969.90
0602067 National/JRF STP - OTO Payback 1,244,617.00 11,982,586.90
5907801 Campbell/Weaver Springfield Area Small Urban (124,524.56) 11,858,062.34
0602064 JRF/Glenstone Springfield Area Small Urban 47,734.48 11,905,796.82
5900837 NS Corridor Study Springfield Area Small Urban 9.13 11,905,805.95
0652058 Glenstone/Primrose STP-Urban (7,570.99) 11,898,234.96
0652067 US65 STP-Urban (1,061,000.00) 10,837,234.96
5905804 FY 2008 TMC Staff STP-Urban 659.24 10,837,894.20
5905805 FY 2009 TMC Staff STP-Urban 859.06 10,838,753.26
5905806 FY 2010 TMC Staff STP-Urban (228,000.00) 10,610,753.26
5907801 Campbell/Weaver STP-Urban (1,328,793.88) 9,281,959.38
5907801 Campbell/Weaver STP-Urban 164,058.91 9,446,018.29
0602068 JRF/Campbell (160) STP-Urban (800,000.00) 8,646,018.29
FY 2011 Allocation STP-Urban 2,877,633.17 11,523,651.46
0652069 Glenstone Sidewalks STP-Urban (106,000.00) 11,417,651.46
2661009 Midfield Terminal Access STP-Urban (43,205.64) 11,374,445.82
2661009 Midfield Terminal Access STP-Urban (59,268.28) 11,315,177.54
2661009 Midfield Terminal Access STP-Urban 0.15 11,315,177.69
5938801 FY 2011 TMC Staff STP-Urban (276,000.00) 11,039,177.69
FY 2012 Allocation STP-Urban 2,360,786.90 13,399,964.59
0602065 60/65 STP-Urban (100,000.00) 13,299,964.59
0652076 65/Chestnut STP-Urban (779,945.21) 12,520,019.38
FY 2013 Allocation STP-Urban 2,802,455.71 15,322,475.09
5938803 FY 2013 TMC Staff STP - OTO Payback (260,000.00) 15,062,475.09
0652074 South Glenstone STP - OTO Payback (233,600.00) 14,828,875.09
0652074 South Glenstone STP - OTO Payback (395,760.80) 14,433,114.29
FY 2013 Rideshare Christian County 523.37 14,433,637.66
FY 2013 Rideshare City of Battlefield 180.64 14,433,818.30
FY 2013 Rideshare Greene County 2,227.58 14,436,045.88
FY 2013 Rideshare City of Nixa 614.69 14,436,660.57
FY 2013 Rideshare City of Ozark 575.85 14,437,236.42
FY 2013 Rideshare City of Republic 476.67 14,437,713.09
FY 2013 Rideshare City of Strafford 76.20 14,437,789.29
FY 2013 Rideshare City of Willard 170.88 14,437,960.17
5938801 FY 2011 TMC Staff STP-Urban 9,145.43 14,447,105.60
0652074 South Glenstone STP-Urban (1,244,239.20) 13,202,866.40
Continued on next page…
Ozarks Transportation Organization Page 12 Funds Balance Report - March 2015
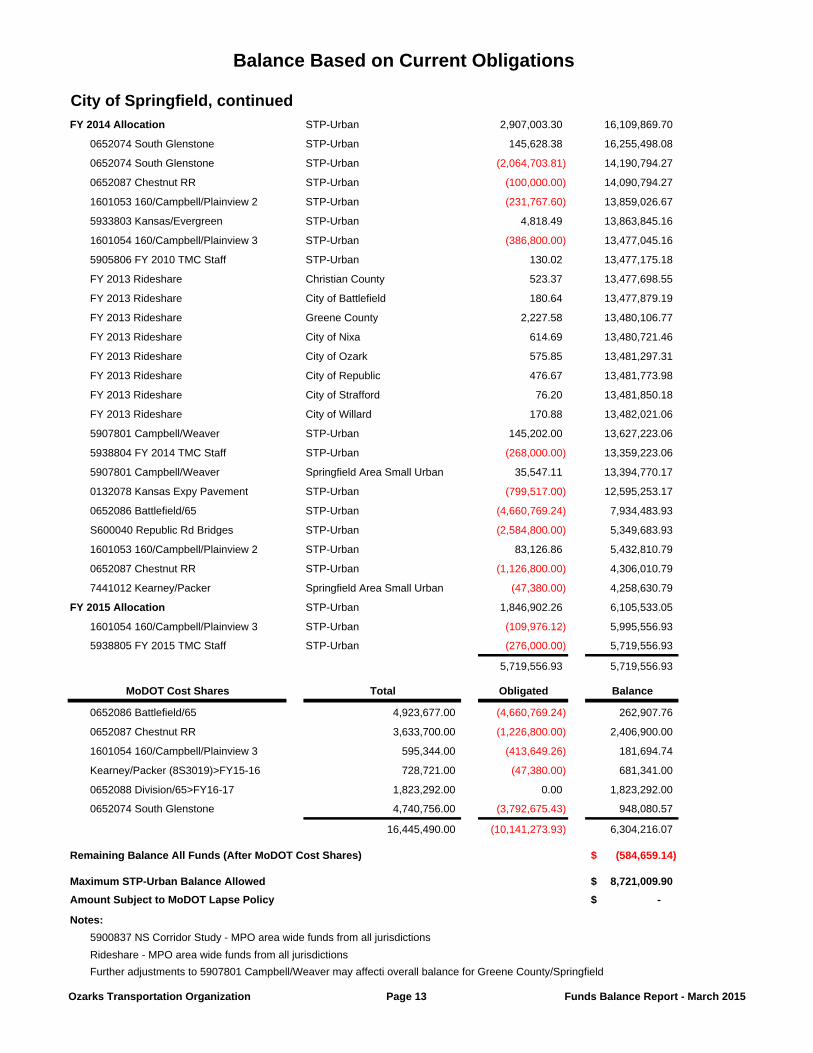
Balance Based on Current Obligations
City of Springfield, continuedFY 2014 Allocation STP-Urban 2,907,003.30 16,109,869.70
0652074 South Glenstone STP-Urban 145,628.38 16,255,498.08
0652074 South Glenstone STP-Urban (2,064,703.81) 14,190,794.27
0652087 Chestnut RR STP-Urban (100,000.00) 14,090,794.27
1601053 160/Campbell/Plainview 2 STP-Urban (231,767.60) 13,859,026.67
5933803 Kansas/Evergreen STP-Urban 4,818.49 13,863,845.16
1601054 160/Campbell/Plainview 3 STP-Urban (386,800.00) 13,477,045.16
5905806 FY 2010 TMC Staff STP-Urban 130.02 13,477,175.18
FY 2013 Rideshare Christian County 523.37 13,477,698.55
FY 2013 Rideshare City of Battlefield 180.64 13,477,879.19
FY 2013 Rideshare Greene County 2,227.58 13,480,106.77
FY 2013 Rideshare City of Nixa 614.69 13,480,721.46
FY 2013 Rideshare City of Ozark 575.85 13,481,297.31
FY 2013 Rideshare City of Republic 476.67 13,481,773.98
FY 2013 Rideshare City of Strafford 76.20 13,481,850.18
FY 2013 Rideshare City of Willard 170.88 13,482,021.06
5907801 Campbell/Weaver STP-Urban 145,202.00 13,627,223.06
5938804 FY 2014 TMC Staff STP-Urban (268,000.00) 13,359,223.06
5907801 Campbell/Weaver Springfield Area Small Urban 35,547.11 13,394,770.17
0132078 Kansas Expy Pavement STP-Urban (799,517.00) 12,595,253.17
0652086 Battlefield/65 STP-Urban (4,660,769.24) 7,934,483.93
S600040 Republic Rd Bridges STP-Urban (2,584,800.00) 5,349,683.93
1601053 160/Campbell/Plainview 2 STP-Urban 83,126.86 5,432,810.79
0652087 Chestnut RR STP-Urban (1,126,800.00) 4,306,010.79
7441012 Kearney/Packer Springfield Area Small Urban (47,380.00) 4,258,630.79
FY 2015 Allocation STP-Urban 1,846,902.26 6,105,533.05
1601054 160/Campbell/Plainview 3 STP-Urban (109,976.12) 5,995,556.93
5938805 FY 2015 TMC Staff STP-Urban (276,000.00) 5,719,556.93
5,719,556.93 5,719,556.93
MoDOT Cost Shares Total Obligated Balance
0652086 Battlefield/65 4,923,677.00 (4,660,769.24) 262,907.76
0652087 Chestnut RR 3,633,700.00 (1,226,800.00) 2,406,900.00
1601054 160/Campbell/Plainview 3 595,344.00 (413,649.26) 181,694.74
Kearney/Packer (8S3019)>FY15-16 728,721.00 (47,380.00) 681,341.00
0652088 Division/65>FY16-17 1,823,292.00 0.00 1,823,292.00
0652074 South Glenstone 4,740,756.00 (3,792,675.43) 948,080.57
16,445,490.00 (10,141,273.93) 6,304,216.07
Remaining Balance All Funds (After MoDOT Cost Shares) (584,659.14)$
Maximum STP-Urban Balance Allowed 8,721,009.90$
Amount Subject to MoDOT Lapse Policy -$
Notes:
5900837 NS Corridor Study - MPO area wide funds from all jurisdictions
Rideshare - MPO area wide funds from all jurisdictions
Further adjustments to 5907801 Campbell/Weaver may affecti overall balance for Greene County/Springfield
Ozarks Transportation Organization Page 13 Funds Balance Report - March 2015
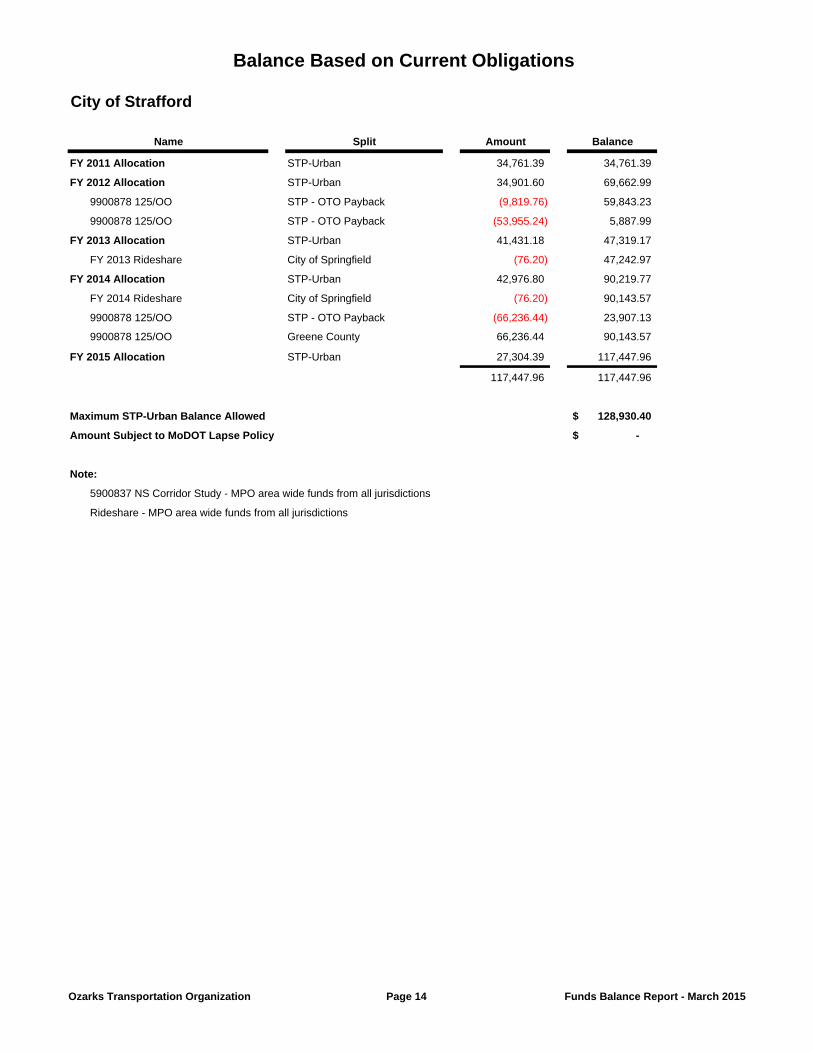
Balance Based on Current Obligations
City of Strafford
Name Split Amount Balance
FY 2011 Allocation STP-Urban 34,761.39 34,761.39
FY 2012 Allocation STP-Urban 34,901.60 69,662.99
9900878 125/OO STP - OTO Payback (9,819.76) 59,843.23
9900878 125/OO STP - OTO Payback (53,955.24) 5,887.99
FY 2013 Allocation STP-Urban 41,431.18 47,319.17
FY 2013 Rideshare City of Springfield (76.20) 47,242.97
FY 2014 Allocation STP-Urban 42,976.80 90,219.77
FY 2014 Rideshare City of Springfield (76.20) 90,143.57
9900878 125/OO STP - OTO Payback (66,236.44) 23,907.13
9900878 125/OO Greene County 66,236.44 90,143.57
FY 2015 Allocation STP-Urban 27,304.39 117,447.96
117,447.96 117,447.96
Maximum STP-Urban Balance Allowed 128,930.40$
Amount Subject to MoDOT Lapse Policy -$
Note:
5900837 NS Corridor Study - MPO area wide funds from all jurisdictions
Rideshare - MPO area wide funds from all jurisdictions
Ozarks Transportation Organization Page 14 Funds Balance Report - March 2015
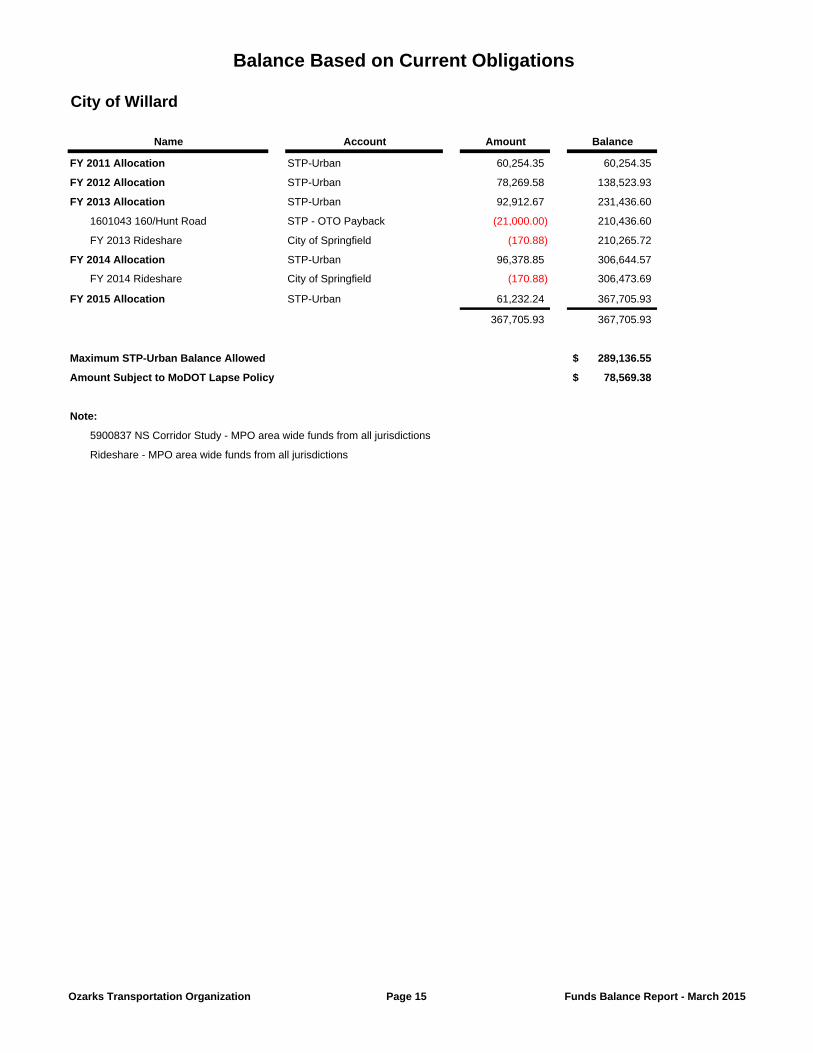
Balance Based on Current Obligations
City of Willard
Name Account Amount Balance
FY 2011 Allocation STP-Urban 60,254.35 60,254.35
FY 2012 Allocation STP-Urban 78,269.58 138,523.93
FY 2013 Allocation STP-Urban 92,912.67 231,436.60
1601043 160/Hunt Road STP - OTO Payback (21,000.00) 210,436.60
FY 2013 Rideshare City of Springfield (170.88) 210,265.72
FY 2014 Allocation STP-Urban 96,378.85 306,644.57
FY 2014 Rideshare City of Springfield (170.88) 306,473.69
FY 2015 Allocation STP-Urban 61,232.24 367,705.93
367,705.93 367,705.93
Maximum STP-Urban Balance Allowed 289,136.55$
Amount Subject to MoDOT Lapse Policy 78,569.38$
Note:
5900837 NS Corridor Study - MPO area wide funds from all jurisdictions
Rideshare - MPO area wide funds from all jurisdictions
Ozarks Transportation Organization Page 15 Funds Balance Report - March 2015
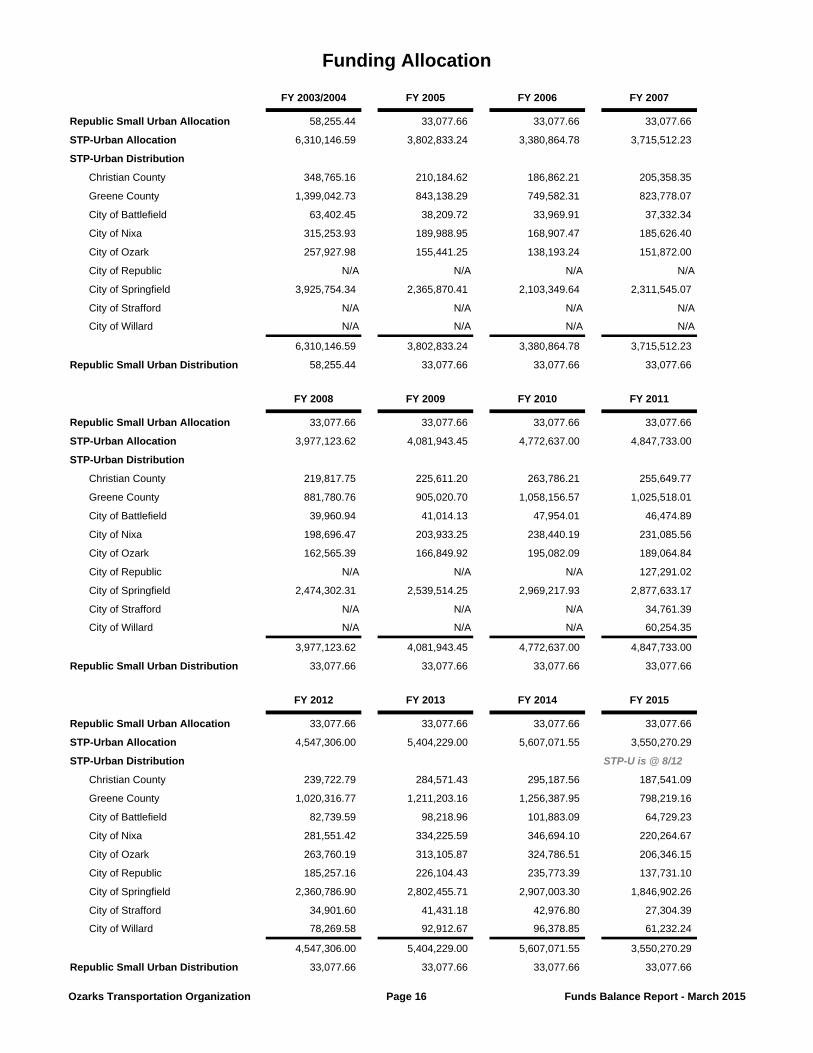
Funding Allocation
FY 2003/2004 FY 2005 FY 2006 FY 2007
Republic Small Urban Allocation 58,255.44 33,077.66 33,077.66 33,077.66
STP-Urban Allocation 6,310,146.59 3,802,833.24 3,380,864.78 3,715,512.23
STP-Urban Distribution
Christian County 348,765.16 210,184.62 186,862.21 205,358.35
Greene County 1,399,042.73 843,138.29 749,582.31 823,778.07
City of Battlefield 63,402.45 38,209.72 33,969.91 37,332.34
City of Nixa 315,253.93 189,988.95 168,907.47 185,626.40
City of Ozark 257,927.98 155,441.25 138,193.24 151,872.00
City of Republic N/A N/A N/A N/A
City of Springfield 3,925,754.34 2,365,870.41 2,103,349.64 2,311,545.07
City of Strafford N/A N/A N/A N/A
City of Willard N/A N/A N/A N/A
6,310,146.59 3,802,833.24 3,380,864.78 3,715,512.23
Republic Small Urban Distribution 58,255.44 33,077.66 33,077.66 33,077.66
FY 2008 FY 2009 FY 2010 FY 2011
Republic Small Urban Allocation 33,077.66 33,077.66 33,077.66 33,077.66
STP-Urban Allocation 3,977,123.62 4,081,943.45 4,772,637.00 4,847,733.00
STP-Urban Distribution
Christian County 219,817.75 225,611.20 263,786.21 255,649.77
Greene County 881,780.76 905,020.70 1,058,156.57 1,025,518.01
City of Battlefield 39,960.94 41,014.13 47,954.01 46,474.89
City of Nixa 198,696.47 203,933.25 238,440.19 231,085.56
City of Ozark 162,565.39 166,849.92 195,082.09 189,064.84
City of Republic N/A N/A N/A 127,291.02
City of Springfield 2,474,302.31 2,539,514.25 2,969,217.93 2,877,633.17
City of Strafford N/A N/A N/A 34,761.39
City of Willard N/A N/A N/A 60,254.35
3,977,123.62 4,081,943.45 4,772,637.00 4,847,733.00
Republic Small Urban Distribution 33,077.66 33,077.66 33,077.66 33,077.66
FY 2012 FY 2013 FY 2014 FY 2015
Republic Small Urban Allocation 33,077.66 33,077.66 33,077.66 33,077.66
STP-Urban Allocation 4,547,306.00 5,404,229.00 5,607,071.55 3,550,270.29
STP-Urban Distribution STP-U is @ 8/12
Christian County 239,722.79 284,571.43 295,187.56 187,541.09
Greene County 1,020,316.77 1,211,203.16 1,256,387.95 798,219.16
City of Battlefield 82,739.59 98,218.96 101,883.09 64,729.23
City of Nixa 281,551.42 334,225.59 346,694.10 220,264.67
City of Ozark 263,760.19 313,105.87 324,786.51 206,346.15
City of Republic 185,257.16 226,104.43 235,773.39 137,731.10
City of Springfield 2,360,786.90 2,802,455.71 2,907,003.30 1,846,902.26
City of Strafford 34,901.60 41,431.18 42,976.80 27,304.39
City of Willard 78,269.58 92,912.67 96,378.85 61,232.24
4,547,306.00 5,404,229.00 5,607,071.55 3,550,270.29
Republic Small Urban Distribution 33,077.66 33,077.66 33,077.66 33,077.66
Ozarks Transportation Organization Page 16 Funds Balance Report - March 2015
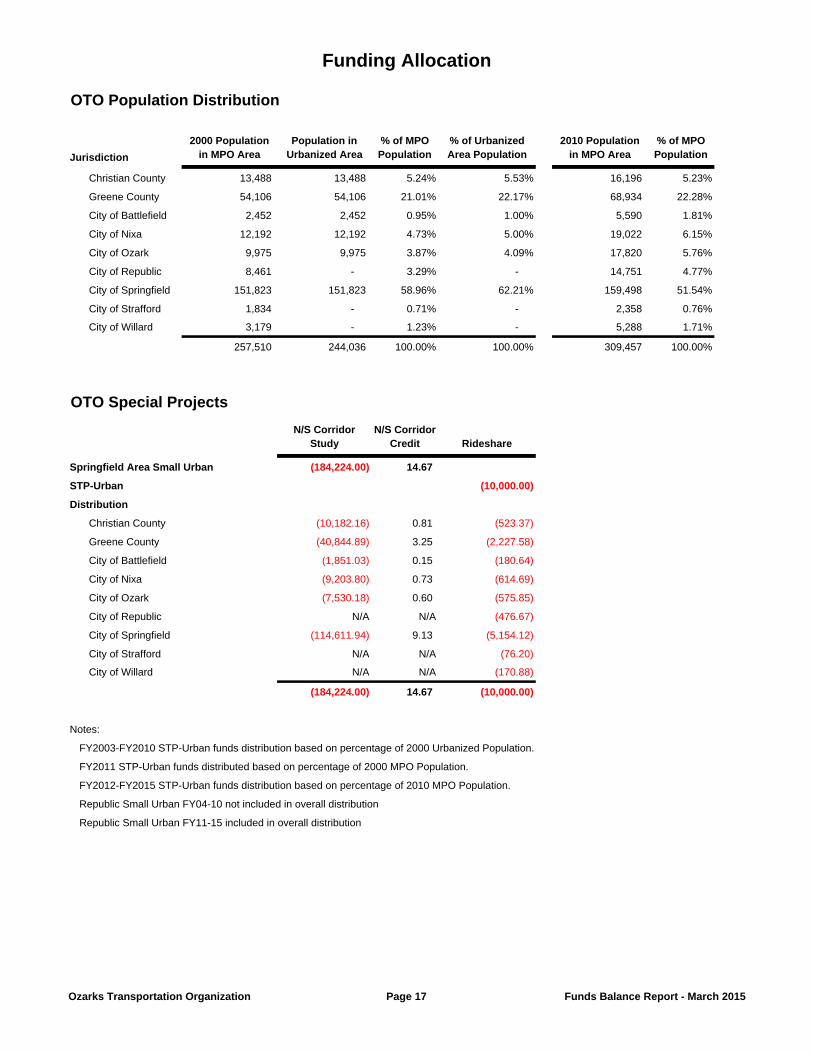
Funding Allocation
OTO Population Distribution
Jurisdiction
2000 Population in MPO Area
Population in Urbanized Area
% of MPO Population
% of Urbanized Area Population
2010 Population in MPO Area
% of MPO Population
Christian County 13,488 13,488 5.24% 5.53% 16,196 5.23%
Greene County 54,106 54,106 21.01% 22.17% 68,934 22.28%
City of Battlefield 2,452 2,452 0.95% 1.00% 5,590 1.81%
City of Nixa 12,192 12,192 4.73% 5.00% 19,022 6.15%
City of Ozark 9,975 9,975 3.87% 4.09% 17,820 5.76%
City of Republic 8,461 - 3.29% - 14,751 4.77%
City of Springfield 151,823 151,823 58.96% 62.21% 159,498 51.54%
City of Strafford 1,834 - 0.71% - 2,358 0.76%
City of Willard 3,179 - 1.23% - 5,288 1.71%
257,510 244,036 100.00% 100.00% 309,457 100.00%
OTO Special Projects
N/S Corridor Study
N/S Corridor Credit Rideshare
Springfield Area Small Urban (184,224.00) 14.67
STP-Urban (10,000.00)
Distribution
Christian County (10,182.16) 0.81 (523.37)
Greene County (40,844.89) 3.25 (2,227.58)
City of Battlefield (1,851.03) 0.15 (180.64)
City of Nixa (9,203.80) 0.73 (614.69)
City of Ozark (7,530.18) 0.60 (575.85)
City of Republic N/A N/A (476.67)
City of Springfield (114,611.94) 9.13 (5,154.12)
City of Strafford N/A N/A (76.20)
City of Willard N/A N/A (170.88)
(184,224.00) 14.67 (10,000.00)
Notes:
FY2003-FY2010 STP-Urban funds distribution based on percentage of 2000 Urbanized Population.
FY2011 STP-Urban funds distributed based on percentage of 2000 MPO Population.
FY2012-FY2015 STP-Urban funds distribution based on percentage of 2010 MPO Population.
Republic Small Urban FY04-10 not included in overall distribution
Republic Small Urban FY11-15 included in overall distribution
Ozarks Transportation Organization Page 17 Funds Balance Report - March 2015
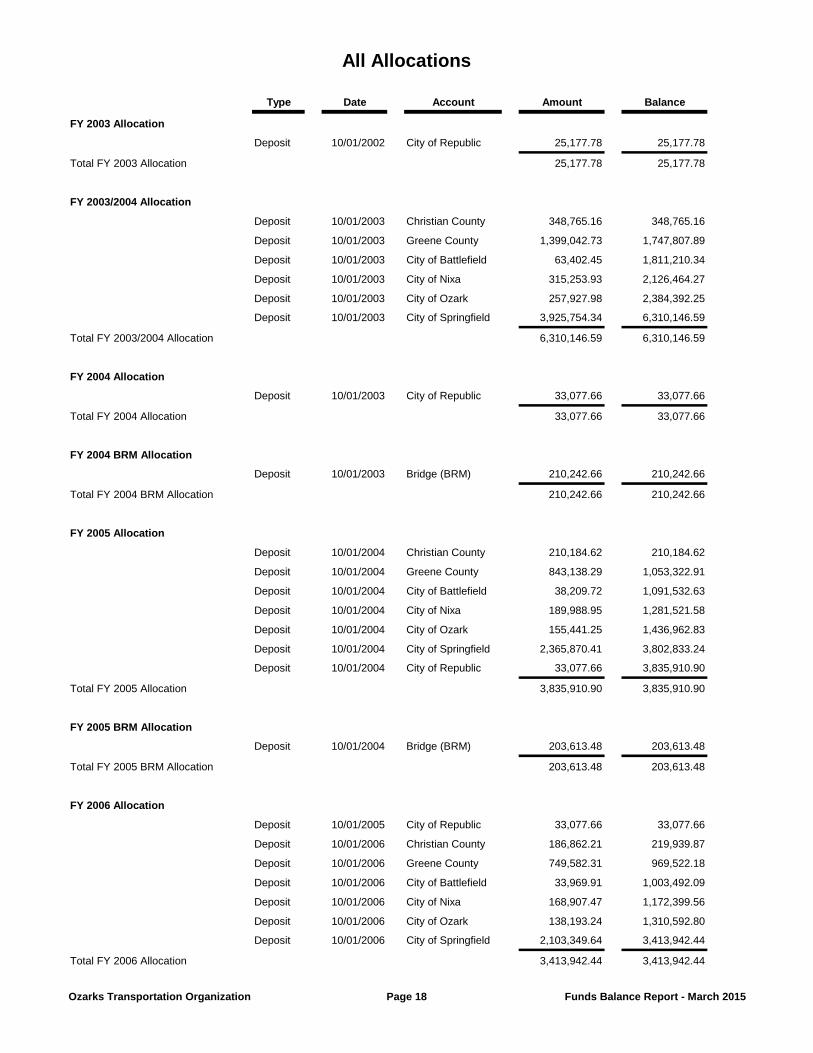
All Allocations
Type Date Account Amount Balance
FY 2003 Allocation
Deposit 10/01/2002 City of Republic 25,177.78 25,177.78
Total FY 2003 Allocation 25,177.78 25,177.78
FY 2003/2004 Allocation
Deposit 10/01/2003 Christian County 348,765.16 348,765.16
Deposit 10/01/2003 Greene County 1,399,042.73 1,747,807.89
Deposit 10/01/2003 City of Battlefield 63,402.45 1,811,210.34
Deposit 10/01/2003 City of Nixa 315,253.93 2,126,464.27
Deposit 10/01/2003 City of Ozark 257,927.98 2,384,392.25
Deposit 10/01/2003 City of Springfield 3,925,754.34 6,310,146.59
Total FY 2003/2004 Allocation 6,310,146.59 6,310,146.59
FY 2004 Allocation
Deposit 10/01/2003 City of Republic 33,077.66 33,077.66
Total FY 2004 Allocation 33,077.66 33,077.66
FY 2004 BRM Allocation
Deposit 10/01/2003 Bridge (BRM) 210,242.66 210,242.66
Total FY 2004 BRM Allocation 210,242.66 210,242.66
FY 2005 Allocation
Deposit 10/01/2004 Christian County 210,184.62 210,184.62
Deposit 10/01/2004 Greene County 843,138.29 1,053,322.91
Deposit 10/01/2004 City of Battlefield 38,209.72 1,091,532.63
Deposit 10/01/2004 City of Nixa 189,988.95 1,281,521.58
Deposit 10/01/2004 City of Ozark 155,441.25 1,436,962.83
Deposit 10/01/2004 City of Springfield 2,365,870.41 3,802,833.24
Deposit 10/01/2004 City of Republic 33,077.66 3,835,910.90
Total FY 2005 Allocation 3,835,910.90 3,835,910.90
FY 2005 BRM Allocation
Deposit 10/01/2004 Bridge (BRM) 203,613.48 203,613.48
Total FY 2005 BRM Allocation 203,613.48 203,613.48
FY 2006 Allocation
Deposit 10/01/2005 City of Republic 33,077.66 33,077.66
Deposit 10/01/2006 Christian County 186,862.21 219,939.87
Deposit 10/01/2006 Greene County 749,582.31 969,522.18
Deposit 10/01/2006 City of Battlefield 33,969.91 1,003,492.09
Deposit 10/01/2006 City of Nixa 168,907.47 1,172,399.56
Deposit 10/01/2006 City of Ozark 138,193.24 1,310,592.80
Deposit 10/01/2006 City of Springfield 2,103,349.64 3,413,942.44
Total FY 2006 Allocation 3,413,942.44 3,413,942.44
Ozarks Transportation Organization Page 18 Funds Balance Report - March 2015
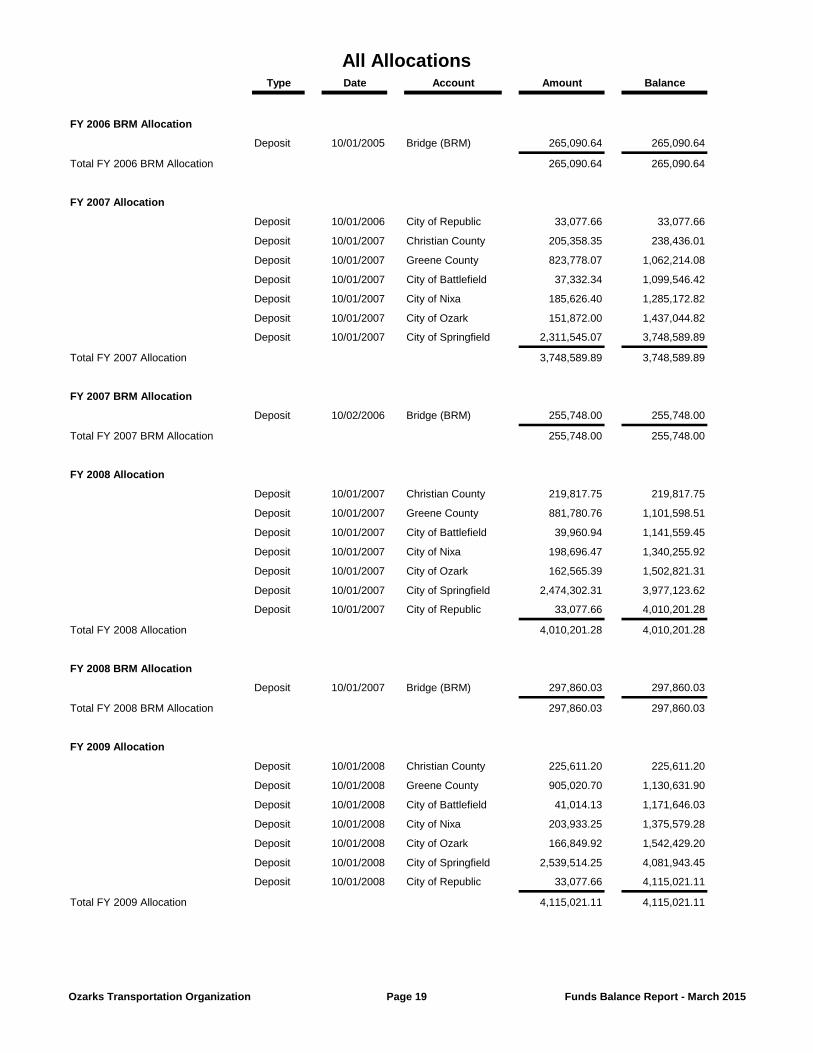
All AllocationsType Date Account Amount Balance
FY 2006 BRM Allocation
Deposit 10/01/2005 Bridge (BRM) 265,090.64 265,090.64
Total FY 2006 BRM Allocation 265,090.64 265,090.64
FY 2007 Allocation
Deposit 10/01/2006 City of Republic 33,077.66 33,077.66
Deposit 10/01/2007 Christian County 205,358.35 238,436.01
Deposit 10/01/2007 Greene County 823,778.07 1,062,214.08
Deposit 10/01/2007 City of Battlefield 37,332.34 1,099,546.42
Deposit 10/01/2007 City of Nixa 185,626.40 1,285,172.82
Deposit 10/01/2007 City of Ozark 151,872.00 1,437,044.82
Deposit 10/01/2007 City of Springfield 2,311,545.07 3,748,589.89
Total FY 2007 Allocation 3,748,589.89 3,748,589.89
FY 2007 BRM Allocation
Deposit 10/02/2006 Bridge (BRM) 255,748.00 255,748.00
Total FY 2007 BRM Allocation 255,748.00 255,748.00
FY 2008 Allocation
Deposit 10/01/2007 Christian County 219,817.75 219,817.75
Deposit 10/01/2007 Greene County 881,780.76 1,101,598.51
Deposit 10/01/2007 City of Battlefield 39,960.94 1,141,559.45
Deposit 10/01/2007 City of Nixa 198,696.47 1,340,255.92
Deposit 10/01/2007 City of Ozark 162,565.39 1,502,821.31
Deposit 10/01/2007 City of Springfield 2,474,302.31 3,977,123.62
Deposit 10/01/2007 City of Republic 33,077.66 4,010,201.28
Total FY 2008 Allocation 4,010,201.28 4,010,201.28
FY 2008 BRM Allocation
Deposit 10/01/2007 Bridge (BRM) 297,860.03 297,860.03
Total FY 2008 BRM Allocation 297,860.03 297,860.03
FY 2009 Allocation
Deposit 10/01/2008 Christian County 225,611.20 225,611.20
Deposit 10/01/2008 Greene County 905,020.70 1,130,631.90
Deposit 10/01/2008 City of Battlefield 41,014.13 1,171,646.03
Deposit 10/01/2008 City of Nixa 203,933.25 1,375,579.28
Deposit 10/01/2008 City of Ozark 166,849.92 1,542,429.20
Deposit 10/01/2008 City of Springfield 2,539,514.25 4,081,943.45
Deposit 10/01/2008 City of Republic 33,077.66 4,115,021.11
Total FY 2009 Allocation 4,115,021.11 4,115,021.11
Ozarks Transportation Organization Page 19 Funds Balance Report - March 2015
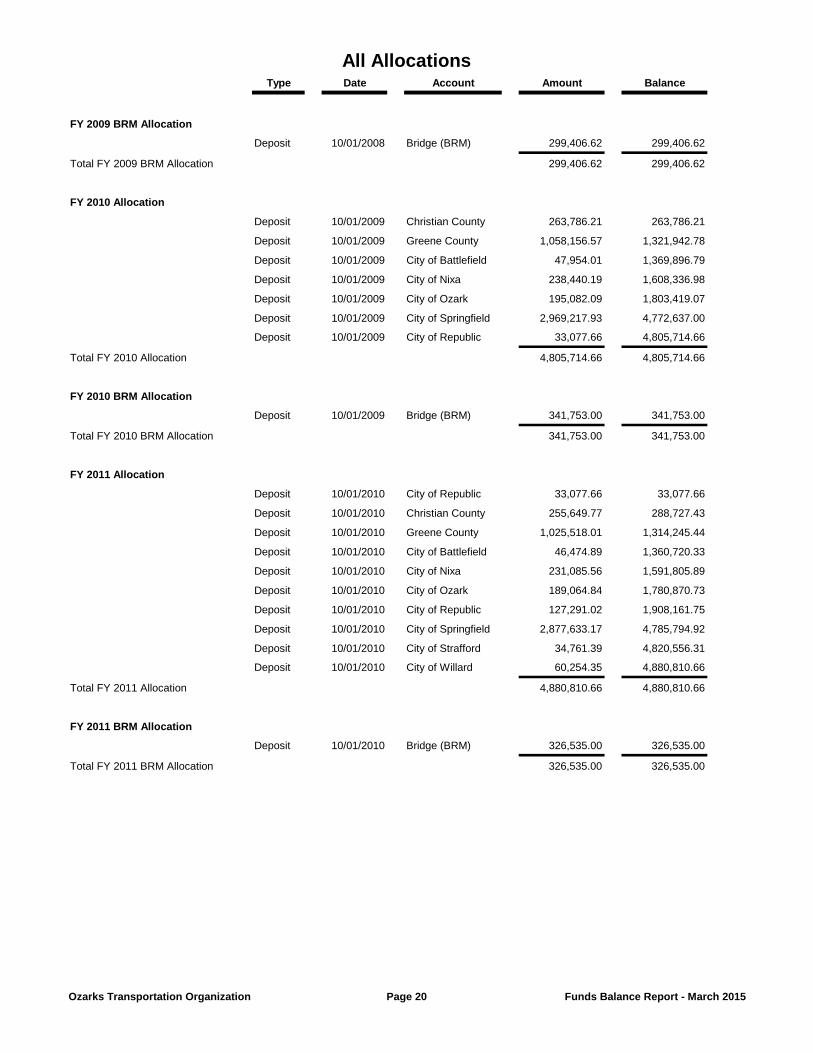
All AllocationsType Date Account Amount Balance
FY 2009 BRM Allocation
Deposit 10/01/2008 Bridge (BRM) 299,406.62 299,406.62
Total FY 2009 BRM Allocation 299,406.62 299,406.62
FY 2010 Allocation
Deposit 10/01/2009 Christian County 263,786.21 263,786.21
Deposit 10/01/2009 Greene County 1,058,156.57 1,321,942.78
Deposit 10/01/2009 City of Battlefield 47,954.01 1,369,896.79
Deposit 10/01/2009 City of Nixa 238,440.19 1,608,336.98
Deposit 10/01/2009 City of Ozark 195,082.09 1,803,419.07
Deposit 10/01/2009 City of Springfield 2,969,217.93 4,772,637.00
Deposit 10/01/2009 City of Republic 33,077.66 4,805,714.66
Total FY 2010 Allocation 4,805,714.66 4,805,714.66
FY 2010 BRM Allocation
Deposit 10/01/2009 Bridge (BRM) 341,753.00 341,753.00
Total FY 2010 BRM Allocation 341,753.00 341,753.00
FY 2011 Allocation
Deposit 10/01/2010 City of Republic 33,077.66 33,077.66
Deposit 10/01/2010 Christian County 255,649.77 288,727.43
Deposit 10/01/2010 Greene County 1,025,518.01 1,314,245.44
Deposit 10/01/2010 City of Battlefield 46,474.89 1,360,720.33
Deposit 10/01/2010 City of Nixa 231,085.56 1,591,805.89
Deposit 10/01/2010 City of Ozark 189,064.84 1,780,870.73
Deposit 10/01/2010 City of Republic 127,291.02 1,908,161.75
Deposit 10/01/2010 City of Springfield 2,877,633.17 4,785,794.92
Deposit 10/01/2010 City of Strafford 34,761.39 4,820,556.31
Deposit 10/01/2010 City of Willard 60,254.35 4,880,810.66
Total FY 2011 Allocation 4,880,810.66 4,880,810.66
FY 2011 BRM Allocation
Deposit 10/01/2010 Bridge (BRM) 326,535.00 326,535.00
Total FY 2011 BRM Allocation 326,535.00 326,535.00
Ozarks Transportation Organization Page 20 Funds Balance Report - March 2015
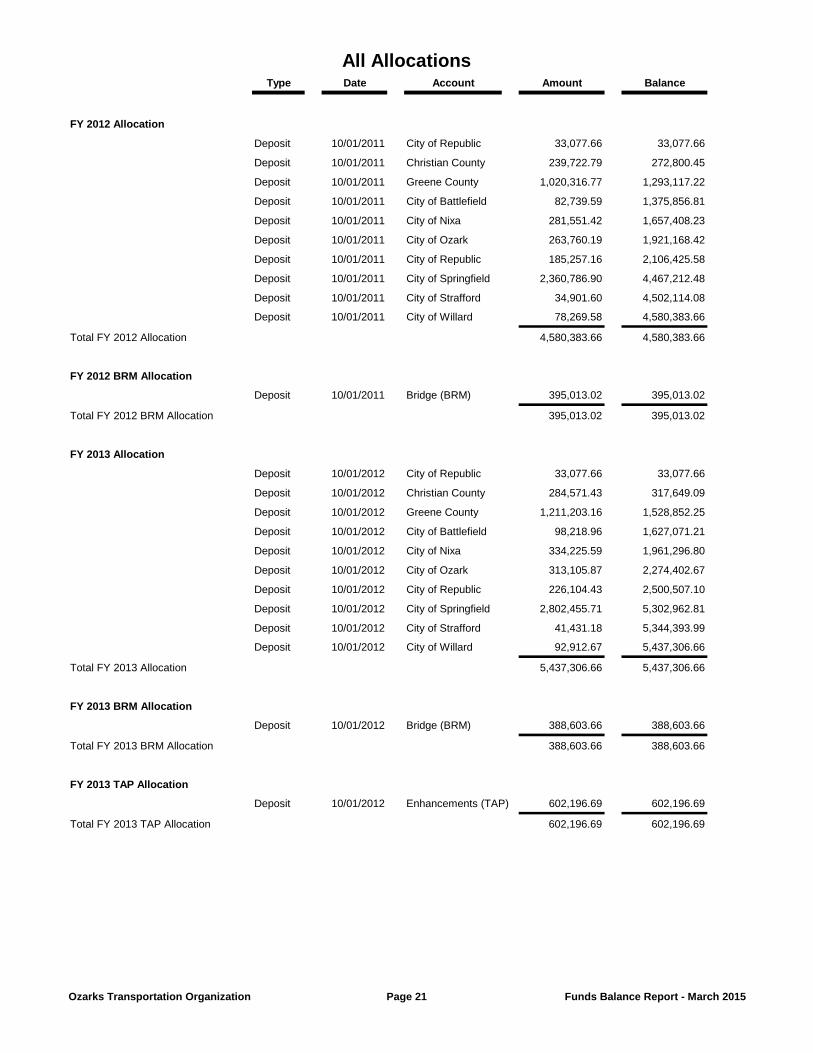
All AllocationsType Date Account Amount Balance
FY 2012 Allocation
Deposit 10/01/2011 City of Republic 33,077.66 33,077.66
Deposit 10/01/2011 Christian County 239,722.79 272,800.45
Deposit 10/01/2011 Greene County 1,020,316.77 1,293,117.22
Deposit 10/01/2011 City of Battlefield 82,739.59 1,375,856.81
Deposit 10/01/2011 City of Nixa 281,551.42 1,657,408.23
Deposit 10/01/2011 City of Ozark 263,760.19 1,921,168.42
Deposit 10/01/2011 City of Republic 185,257.16 2,106,425.58
Deposit 10/01/2011 City of Springfield 2,360,786.90 4,467,212.48
Deposit 10/01/2011 City of Strafford 34,901.60 4,502,114.08
Deposit 10/01/2011 City of Willard 78,269.58 4,580,383.66
Total FY 2012 Allocation 4,580,383.66 4,580,383.66
FY 2012 BRM Allocation
Deposit 10/01/2011 Bridge (BRM) 395,013.02 395,013.02
Total FY 2012 BRM Allocation 395,013.02 395,013.02
FY 2013 Allocation
Deposit 10/01/2012 City of Republic 33,077.66 33,077.66
Deposit 10/01/2012 Christian County 284,571.43 317,649.09
Deposit 10/01/2012 Greene County 1,211,203.16 1,528,852.25
Deposit 10/01/2012 City of Battlefield 98,218.96 1,627,071.21
Deposit 10/01/2012 City of Nixa 334,225.59 1,961,296.80
Deposit 10/01/2012 City of Ozark 313,105.87 2,274,402.67
Deposit 10/01/2012 City of Republic 226,104.43 2,500,507.10
Deposit 10/01/2012 City of Springfield 2,802,455.71 5,302,962.81
Deposit 10/01/2012 City of Strafford 41,431.18 5,344,393.99
Deposit 10/01/2012 City of Willard 92,912.67 5,437,306.66
Total FY 2013 Allocation 5,437,306.66 5,437,306.66
FY 2013 BRM Allocation
Deposit 10/01/2012 Bridge (BRM) 388,603.66 388,603.66
Total FY 2013 BRM Allocation 388,603.66 388,603.66
FY 2013 TAP Allocation
Deposit 10/01/2012 Enhancements (TAP) 602,196.69 602,196.69
Total FY 2013 TAP Allocation 602,196.69 602,196.69
Ozarks Transportation Organization Page 21 Funds Balance Report - March 2015
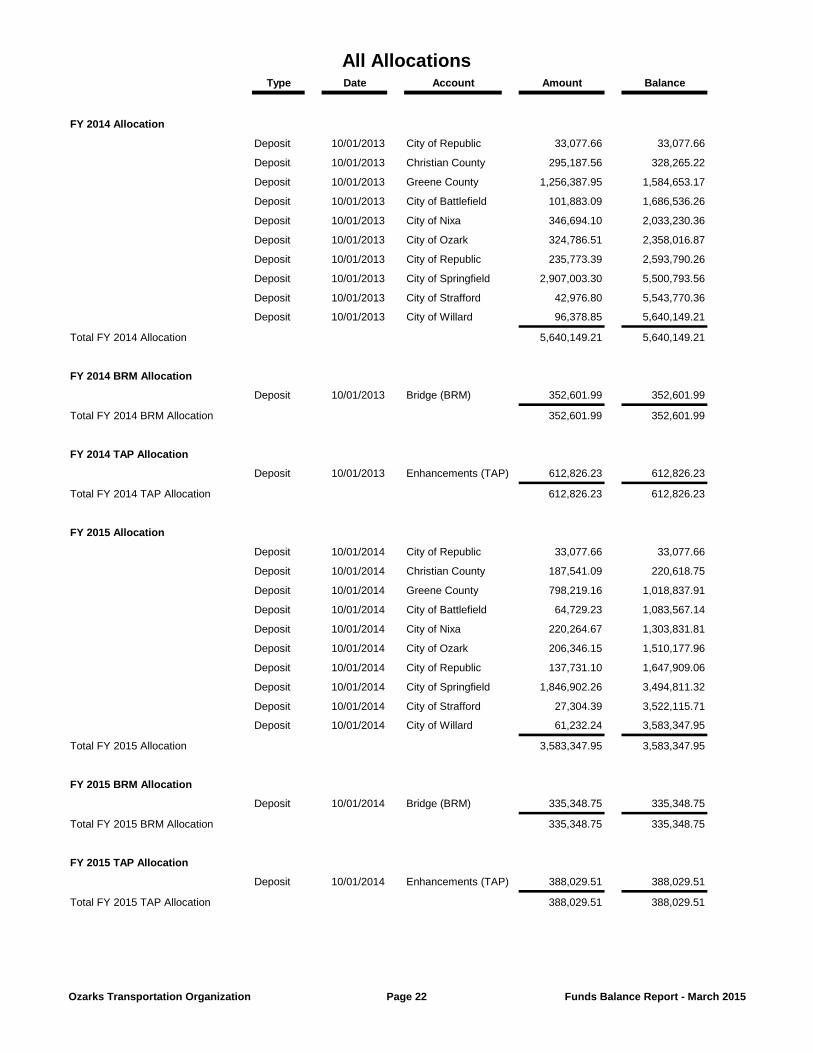
All AllocationsType Date Account Amount Balance
FY 2014 Allocation
Deposit 10/01/2013 City of Republic 33,077.66 33,077.66
Deposit 10/01/2013 Christian County 295,187.56 328,265.22
Deposit 10/01/2013 Greene County 1,256,387.95 1,584,653.17
Deposit 10/01/2013 City of Battlefield 101,883.09 1,686,536.26
Deposit 10/01/2013 City of Nixa 346,694.10 2,033,230.36
Deposit 10/01/2013 City of Ozark 324,786.51 2,358,016.87
Deposit 10/01/2013 City of Republic 235,773.39 2,593,790.26
Deposit 10/01/2013 City of Springfield 2,907,003.30 5,500,793.56
Deposit 10/01/2013 City of Strafford 42,976.80 5,543,770.36
Deposit 10/01/2013 City of Willard 96,378.85 5,640,149.21
Total FY 2014 Allocation 5,640,149.21 5,640,149.21
FY 2014 BRM Allocation
Deposit 10/01/2013 Bridge (BRM) 352,601.99 352,601.99
Total FY 2014 BRM Allocation 352,601.99 352,601.99
FY 2014 TAP Allocation
Deposit 10/01/2013 Enhancements (TAP) 612,826.23 612,826.23
Total FY 2014 TAP Allocation 612,826.23 612,826.23
FY 2015 Allocation
Deposit 10/01/2014 City of Republic 33,077.66 33,077.66
Deposit 10/01/2014 Christian County 187,541.09 220,618.75
Deposit 10/01/2014 Greene County 798,219.16 1,018,837.91
Deposit 10/01/2014 City of Battlefield 64,729.23 1,083,567.14
Deposit 10/01/2014 City of Nixa 220,264.67 1,303,831.81
Deposit 10/01/2014 City of Ozark 206,346.15 1,510,177.96
Deposit 10/01/2014 City of Republic 137,731.10 1,647,909.06
Deposit 10/01/2014 City of Springfield 1,846,902.26 3,494,811.32
Deposit 10/01/2014 City of Strafford 27,304.39 3,522,115.71
Deposit 10/01/2014 City of Willard 61,232.24 3,583,347.95
Total FY 2015 Allocation 3,583,347.95 3,583,347.95
FY 2015 BRM Allocation
Deposit 10/01/2014 Bridge (BRM) 335,348.75 335,348.75
Total FY 2015 BRM Allocation 335,348.75 335,348.75
FY 2015 TAP Allocation
Deposit 10/01/2014 Enhancements (TAP) 388,029.51 388,029.51
Total FY 2015 TAP Allocation 388,029.51 388,029.51
Ozarks Transportation Organization Page 22 Funds Balance Report - March 2015

All AllocationsType Date Account Amount Balance
Republic Small Urban Opening Balance
Deposit 09/30/2002 City of Republic 278,258.25 278,258.25
Total Republic Small Urban Opening Balance 278,258.25 278,258.25
Springfield Area Small-U Opening Balance
Deposit 09/30/2006 City of Springfield 3,163,403.16 3,163,403.16
Deposit 09/30/2006 Greene County 344,278.68 3,507,681.84
Total Springfield Area Small-U Opening Balance 3,507,681.84 3,507,681.84
TOTAL ALLOCATIONS 63,480,589.82
Ozarks Transportation Organization Page 23 Funds Balance Report - March 2015
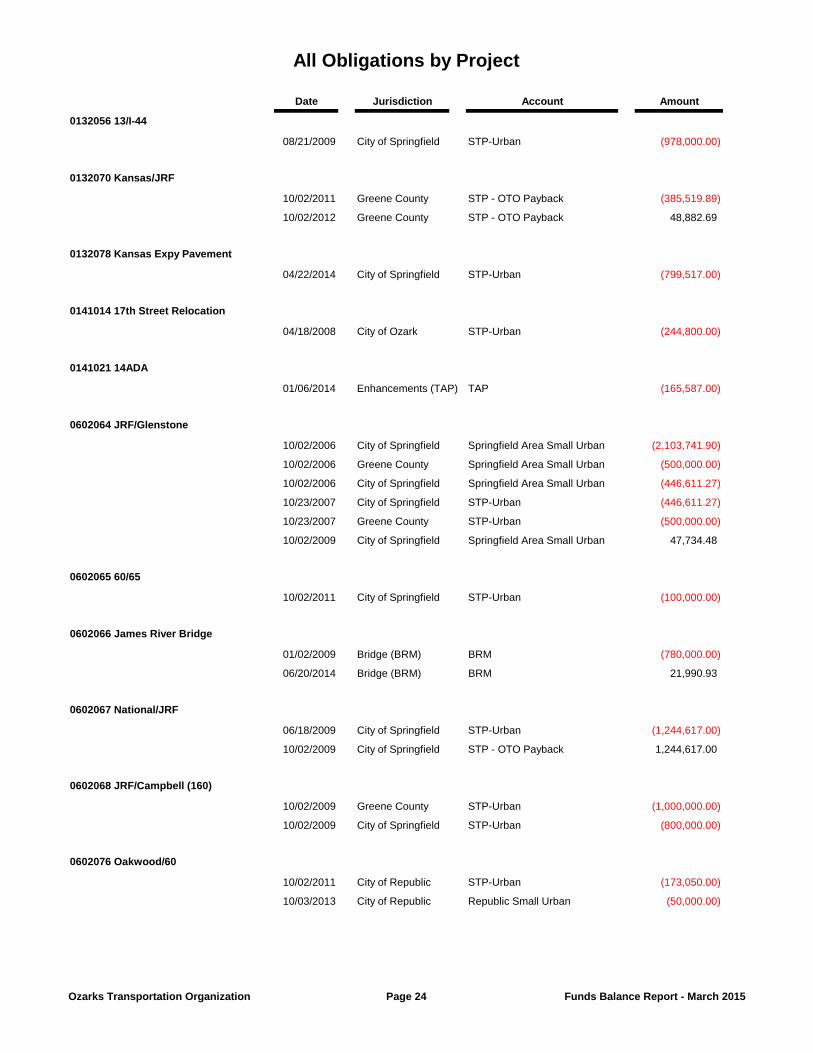
All Obligations by Project
Date Jurisdiction Account Amount
0132056 13/I-44
08/21/2009 City of Springfield STP-Urban (978,000.00)
0132070 Kansas/JRF
10/02/2011 Greene County STP - OTO Payback (385,519.89)
10/02/2012 Greene County STP - OTO Payback 48,882.69
0132078 Kansas Expy Pavement
04/22/2014 City of Springfield STP-Urban (799,517.00)
0141014 17th Street Relocation
04/18/2008 City of Ozark STP-Urban (244,800.00)
0141021 14ADA
01/06/2014 Enhancements (TAP) TAP (165,587.00)
0602064 JRF/Glenstone
10/02/2006 City of Springfield Springfield Area Small Urban (2,103,741.90)
10/02/2006 Greene County Springfield Area Small Urban (500,000.00)
10/02/2006 City of Springfield Springfield Area Small Urban (446,611.27)
10/23/2007 City of Springfield STP-Urban (446,611.27)
10/23/2007 Greene County STP-Urban (500,000.00)
10/02/2009 City of Springfield Springfield Area Small Urban 47,734.48
0602065 60/65
10/02/2011 City of Springfield STP-Urban (100,000.00)
0602066 James River Bridge
01/02/2009 Bridge (BRM) BRM (780,000.00)
06/20/2014 Bridge (BRM) BRM 21,990.93
0602067 National/JRF
06/18/2009 City of Springfield STP-Urban (1,244,617.00)
10/02/2009 City of Springfield STP - OTO Payback 1,244,617.00
0602068 JRF/Campbell (160)
10/02/2009 Greene County STP-Urban (1,000,000.00)
10/02/2009 City of Springfield STP-Urban (800,000.00)
0602076 Oakwood/60
10/02/2011 City of Republic STP-Urban (173,050.00)
10/03/2013 City of Republic Republic Small Urban (50,000.00)
Ozarks Transportation Organization Page 24 Funds Balance Report - March 2015
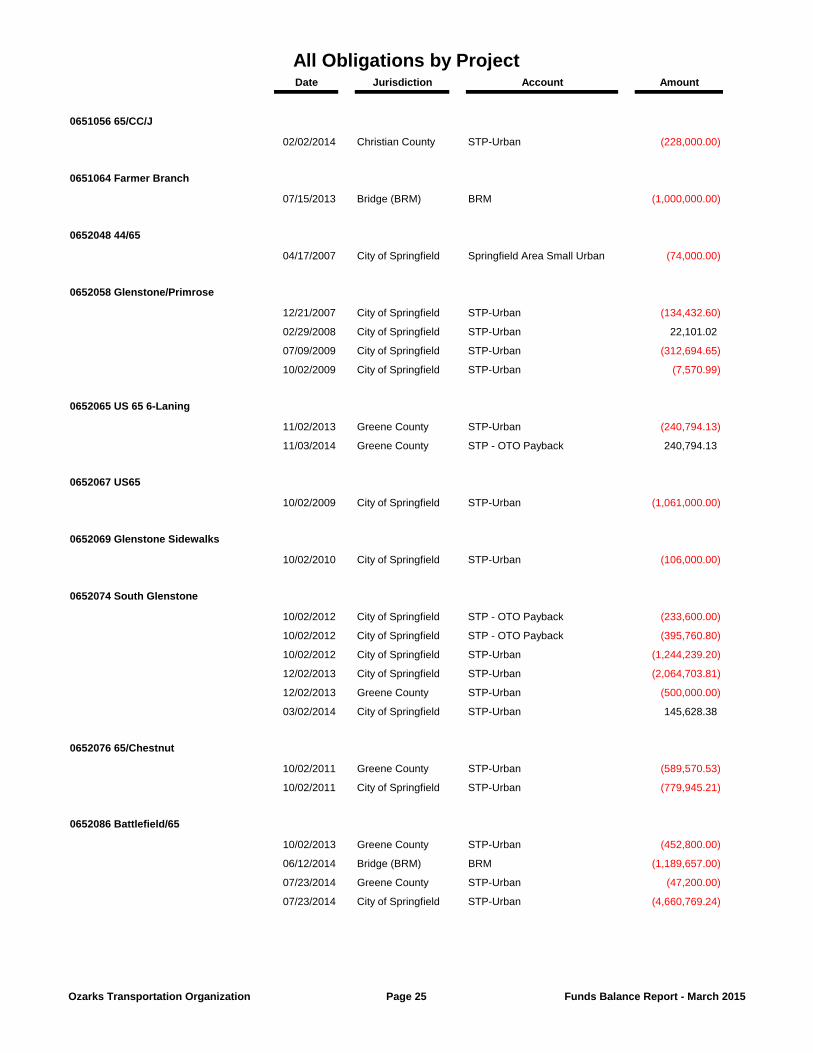
All Obligations by ProjectDate Jurisdiction Account Amount
0651056 65/CC/J
02/02/2014 Christian County STP-Urban (228,000.00)
0651064 Farmer Branch
07/15/2013 Bridge (BRM) BRM (1,000,000.00)
0652048 44/65
04/17/2007 City of Springfield Springfield Area Small Urban (74,000.00)
0652058 Glenstone/Primrose
12/21/2007 City of Springfield STP-Urban (134,432.60)
02/29/2008 City of Springfield STP-Urban 22,101.02
07/09/2009 City of Springfield STP-Urban (312,694.65)
10/02/2009 City of Springfield STP-Urban (7,570.99)
0652065 US 65 6-Laning
11/02/2013 Greene County STP-Urban (240,794.13)
11/03/2014 Greene County STP - OTO Payback 240,794.13
0652067 US65
10/02/2009 City of Springfield STP-Urban (1,061,000.00)
0652069 Glenstone Sidewalks
10/02/2010 City of Springfield STP-Urban (106,000.00)
0652074 South Glenstone
10/02/2012 City of Springfield STP - OTO Payback (233,600.00)
10/02/2012 City of Springfield STP - OTO Payback (395,760.80)
10/02/2012 City of Springfield STP-Urban (1,244,239.20)
12/02/2013 City of Springfield STP-Urban (2,064,703.81)
12/02/2013 Greene County STP-Urban (500,000.00)
03/02/2014 City of Springfield STP-Urban 145,628.38
0652076 65/Chestnut
10/02/2011 Greene County STP-Urban (589,570.53)
10/02/2011 City of Springfield STP-Urban (779,945.21)
0652086 Battlefield/65
10/02/2013 Greene County STP-Urban (452,800.00)
06/12/2014 Bridge (BRM) BRM (1,189,657.00)
07/23/2014 Greene County STP-Urban (47,200.00)
07/23/2014 City of Springfield STP-Urban (4,660,769.24)
Ozarks Transportation Organization Page 25 Funds Balance Report - March 2015
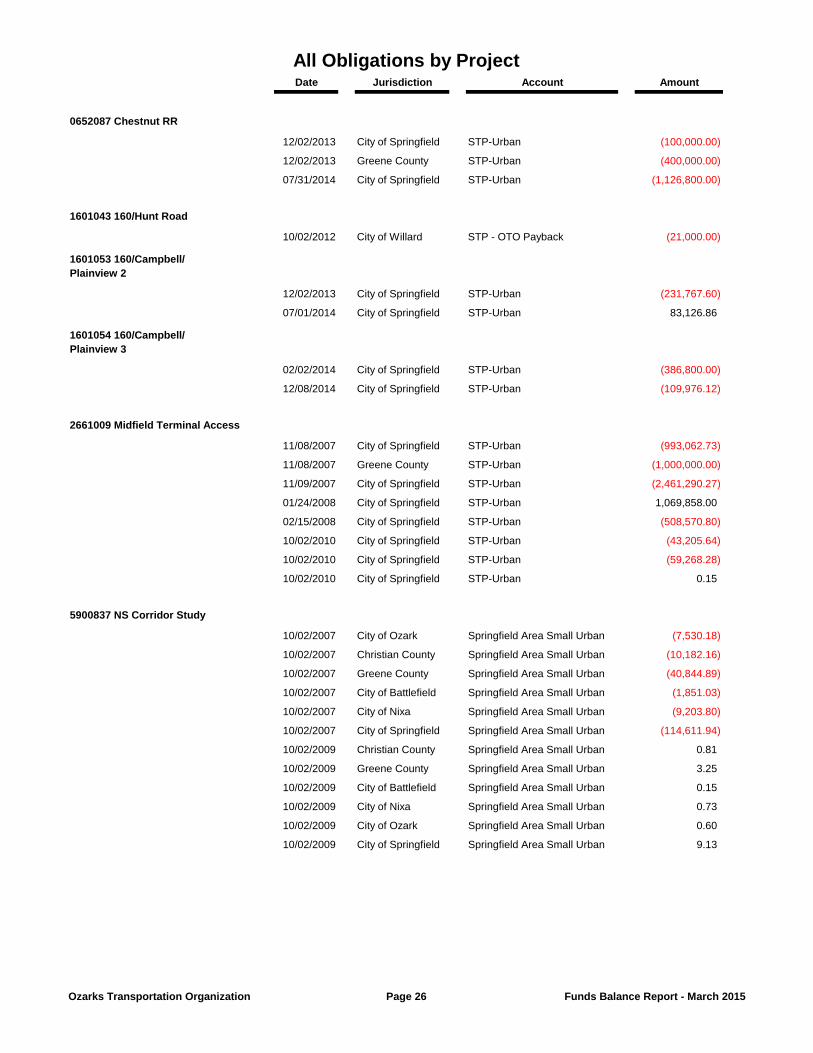
All Obligations by ProjectDate Jurisdiction Account Amount
0652087 Chestnut RR
12/02/2013 City of Springfield STP-Urban (100,000.00)
12/02/2013 Greene County STP-Urban (400,000.00)
07/31/2014 City of Springfield STP-Urban (1,126,800.00)
1601043 160/Hunt Road
10/02/2012 City of Willard STP - OTO Payback (21,000.00)
1601053 160/Campbell/Plainview 2
12/02/2013 City of Springfield STP-Urban (231,767.60)
07/01/2014 City of Springfield STP-Urban 83,126.86
1601054 160/Campbell/Plainview 3
02/02/2014 City of Springfield STP-Urban (386,800.00)
12/08/2014 City of Springfield STP-Urban (109,976.12)
2661009 Midfield Terminal Access
11/08/2007 City of Springfield STP-Urban (993,062.73)
11/08/2007 Greene County STP-Urban (1,000,000.00)
11/09/2007 City of Springfield STP-Urban (2,461,290.27)
01/24/2008 City of Springfield STP-Urban 1,069,858.00
02/15/2008 City of Springfield STP-Urban (508,570.80)
10/02/2010 City of Springfield STP-Urban (43,205.64)
10/02/2010 City of Springfield STP-Urban (59,268.28)
10/02/2010 City of Springfield STP-Urban 0.15
5900837 NS Corridor Study
10/02/2007 City of Ozark Springfield Area Small Urban (7,530.18)
10/02/2007 Christian County Springfield Area Small Urban (10,182.16)
10/02/2007 Greene County Springfield Area Small Urban (40,844.89)
10/02/2007 City of Battlefield Springfield Area Small Urban (1,851.03)
10/02/2007 City of Nixa Springfield Area Small Urban (9,203.80)
10/02/2007 City of Springfield Springfield Area Small Urban (114,611.94)
10/02/2009 Christian County Springfield Area Small Urban 0.81
10/02/2009 Greene County Springfield Area Small Urban 3.25
10/02/2009 City of Battlefield Springfield Area Small Urban 0.15
10/02/2009 City of Nixa Springfield Area Small Urban 0.73
10/02/2009 City of Ozark Springfield Area Small Urban 0.60
10/02/2009 City of Springfield Springfield Area Small Urban 9.13
Ozarks Transportation Organization Page 26 Funds Balance Report - March 2015
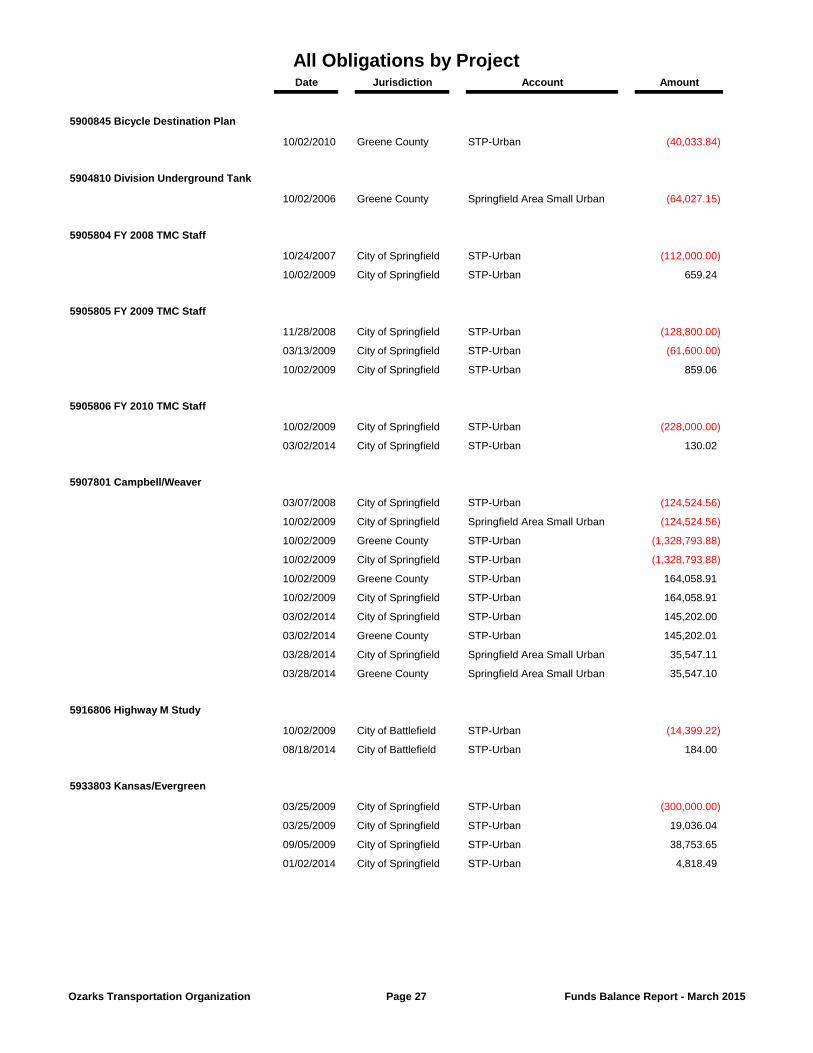
All Obligations by ProjectDate Jurisdiction Account Amount
5900845 Bicycle Destination Plan
10/02/2010 Greene County STP-Urban (40,033.84)
5904810 Division Underground Tank
10/02/2006 Greene County Springfield Area Small Urban (64,027.15)
5905804 FY 2008 TMC Staff
10/24/2007 City of Springfield STP-Urban (112,000.00)
10/02/2009 City of Springfield STP-Urban 659.24
5905805 FY 2009 TMC Staff
11/28/2008 City of Springfield STP-Urban (128,800.00)
03/13/2009 City of Springfield STP-Urban (61,600.00)
10/02/2009 City of Springfield STP-Urban 859.06
5905806 FY 2010 TMC Staff
10/02/2009 City of Springfield STP-Urban (228,000.00)
03/02/2014 City of Springfield STP-Urban 130.02
5907801 Campbell/Weaver
03/07/2008 City of Springfield STP-Urban (124,524.56)
10/02/2009 City of Springfield Springfield Area Small Urban (124,524.56)
10/02/2009 Greene County STP-Urban (1,328,793.88)
10/02/2009 City of Springfield STP-Urban (1,328,793.88)
10/02/2009 Greene County STP-Urban 164,058.91
10/02/2009 City of Springfield STP-Urban 164,058.91
03/02/2014 City of Springfield STP-Urban 145,202.00
03/02/2014 Greene County STP-Urban 145,202.01
03/28/2014 City of Springfield Springfield Area Small Urban 35,547.11
03/28/2014 Greene County Springfield Area Small Urban 35,547.10
5916806 Highway M Study
10/02/2009 City of Battlefield STP-Urban (14,399.22)
08/18/2014 City of Battlefield STP-Urban 184.00
5933803 Kansas/Evergreen
03/25/2009 City of Springfield STP-Urban (300,000.00)
03/25/2009 City of Springfield STP-Urban 19,036.04
09/05/2009 City of Springfield STP-Urban 38,753.65
01/02/2014 City of Springfield STP-Urban 4,818.49
Ozarks Transportation Organization Page 27 Funds Balance Report - March 2015
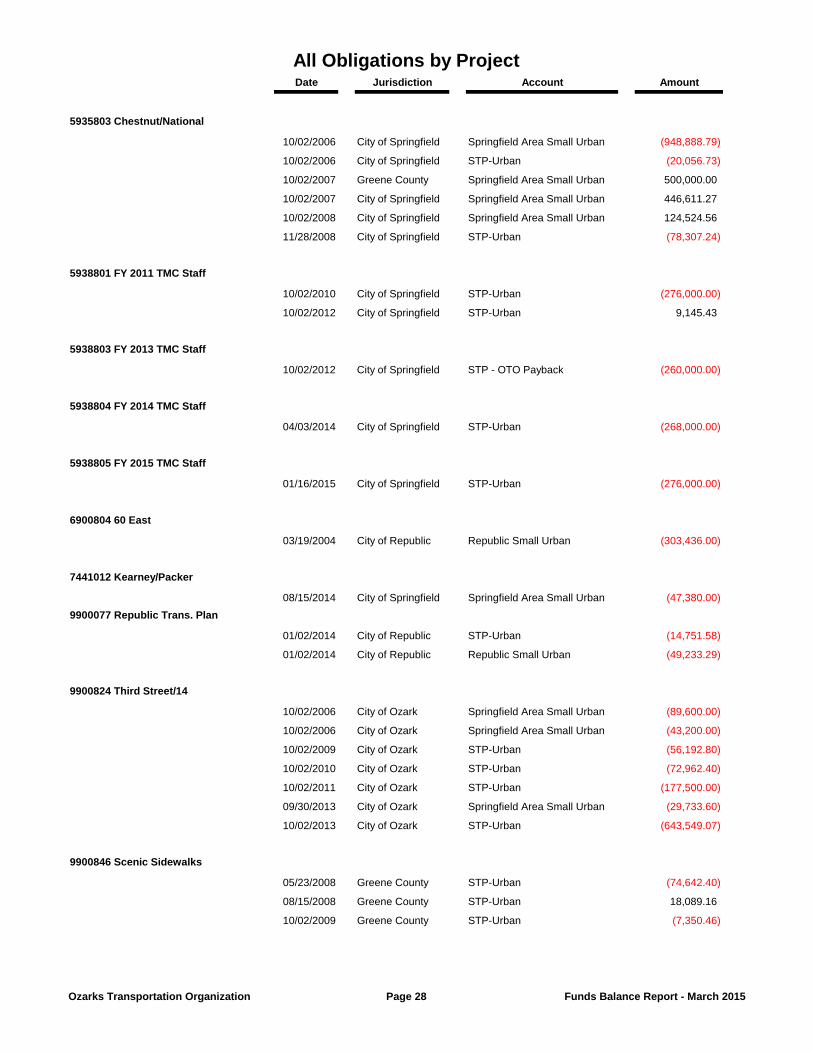
All Obligations by ProjectDate Jurisdiction Account Amount
5935803 Chestnut/National
10/02/2006 City of Springfield Springfield Area Small Urban (948,888.79)
10/02/2006 City of Springfield STP-Urban (20,056.73)
10/02/2007 Greene County Springfield Area Small Urban 500,000.00
10/02/2007 City of Springfield Springfield Area Small Urban 446,611.27
10/02/2008 City of Springfield Springfield Area Small Urban 124,524.56
11/28/2008 City of Springfield STP-Urban (78,307.24)
5938801 FY 2011 TMC Staff
10/02/2010 City of Springfield STP-Urban (276,000.00)
10/02/2012 City of Springfield STP-Urban 9,145.43
5938803 FY 2013 TMC Staff
10/02/2012 City of Springfield STP - OTO Payback (260,000.00)
5938804 FY 2014 TMC Staff
04/03/2014 City of Springfield STP-Urban (268,000.00)
5938805 FY 2015 TMC Staff
01/16/2015 City of Springfield STP-Urban (276,000.00)
6900804 60 East
03/19/2004 City of Republic Republic Small Urban (303,436.00)
7441012 Kearney/Packer
08/15/2014 City of Springfield Springfield Area Small Urban (47,380.00)
9900077 Republic Trans. Plan
01/02/2014 City of Republic STP-Urban (14,751.58)
01/02/2014 City of Republic Republic Small Urban (49,233.29)
9900824 Third Street/14
10/02/2006 City of Ozark Springfield Area Small Urban (89,600.00)
10/02/2006 City of Ozark Springfield Area Small Urban (43,200.00)
10/02/2009 City of Ozark STP-Urban (56,192.80)
10/02/2010 City of Ozark STP-Urban (72,962.40)
10/02/2011 City of Ozark STP-Urban (177,500.00)
09/30/2013 City of Ozark Springfield Area Small Urban (29,733.60)
10/02/2013 City of Ozark STP-Urban (643,549.07)
9900846 Scenic Sidewalks
05/23/2008 Greene County STP-Urban (74,642.40)
08/15/2008 Greene County STP-Urban 18,089.16
10/02/2009 Greene County STP-Urban (7,350.46)
Ozarks Transportation Organization Page 28 Funds Balance Report - March 2015
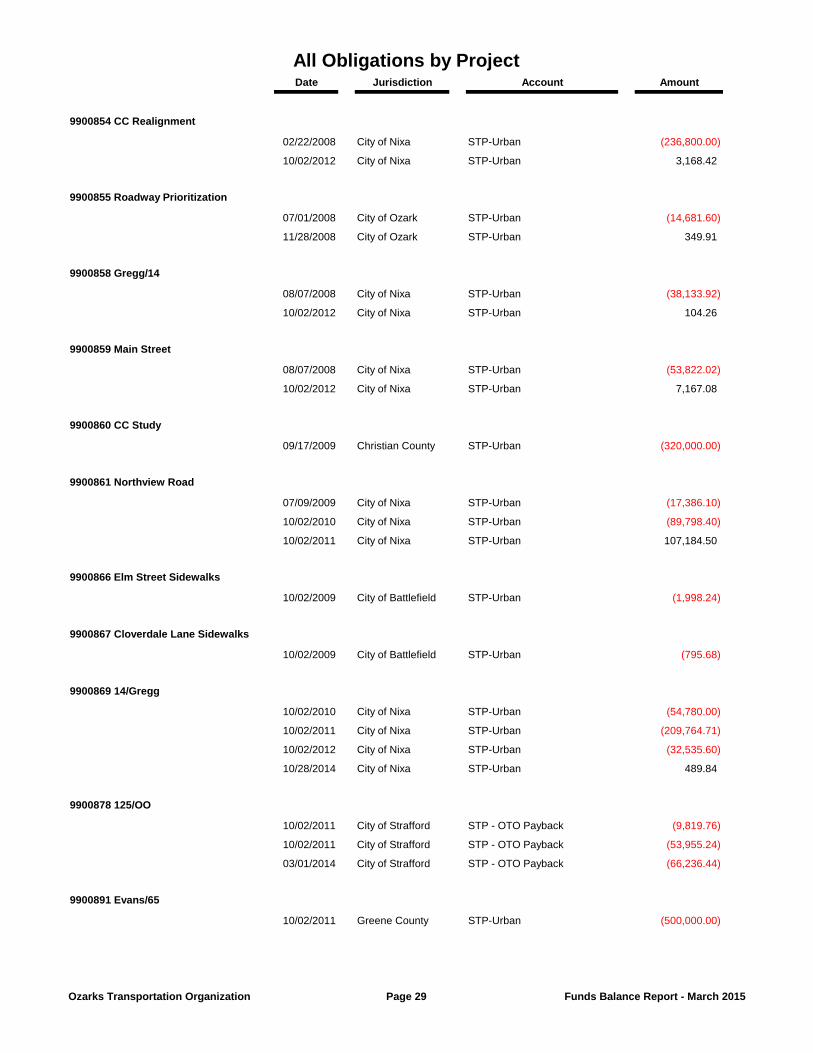
All Obligations by ProjectDate Jurisdiction Account Amount
9900854 CC Realignment
02/22/2008 City of Nixa STP-Urban (236,800.00)
10/02/2012 City of Nixa STP-Urban 3,168.42
9900855 Roadway Prioritization
07/01/2008 City of Ozark STP-Urban (14,681.60)
11/28/2008 City of Ozark STP-Urban 349.91
9900858 Gregg/14
08/07/2008 City of Nixa STP-Urban (38,133.92)
10/02/2012 City of Nixa STP-Urban 104.26
9900859 Main Street
08/07/2008 City of Nixa STP-Urban (53,822.02)
10/02/2012 City of Nixa STP-Urban 7,167.08
9900860 CC Study
09/17/2009 Christian County STP-Urban (320,000.00)
9900861 Northview Road
07/09/2009 City of Nixa STP-Urban (17,386.10)
10/02/2010 City of Nixa STP-Urban (89,798.40)
10/02/2011 City of Nixa STP-Urban 107,184.50
9900866 Elm Street Sidewalks
10/02/2009 City of Battlefield STP-Urban (1,998.24)
9900867 Cloverdale Lane Sidewalks
10/02/2009 City of Battlefield STP-Urban (795.68)
9900869 14/Gregg
10/02/2010 City of Nixa STP-Urban (54,780.00)
10/02/2011 City of Nixa STP-Urban (209,764.71)
10/02/2012 City of Nixa STP-Urban (32,535.60)
10/28/2014 City of Nixa STP-Urban 489.84
9900878 125/OO
10/02/2011 City of Strafford STP - OTO Payback (9,819.76)
10/02/2011 City of Strafford STP - OTO Payback (53,955.24)
03/01/2014 City of Strafford STP - OTO Payback (66,236.44)
9900891 Evans/65
10/02/2011 Greene County STP-Urban (500,000.00)
Ozarks Transportation Organization Page 29 Funds Balance Report - March 2015
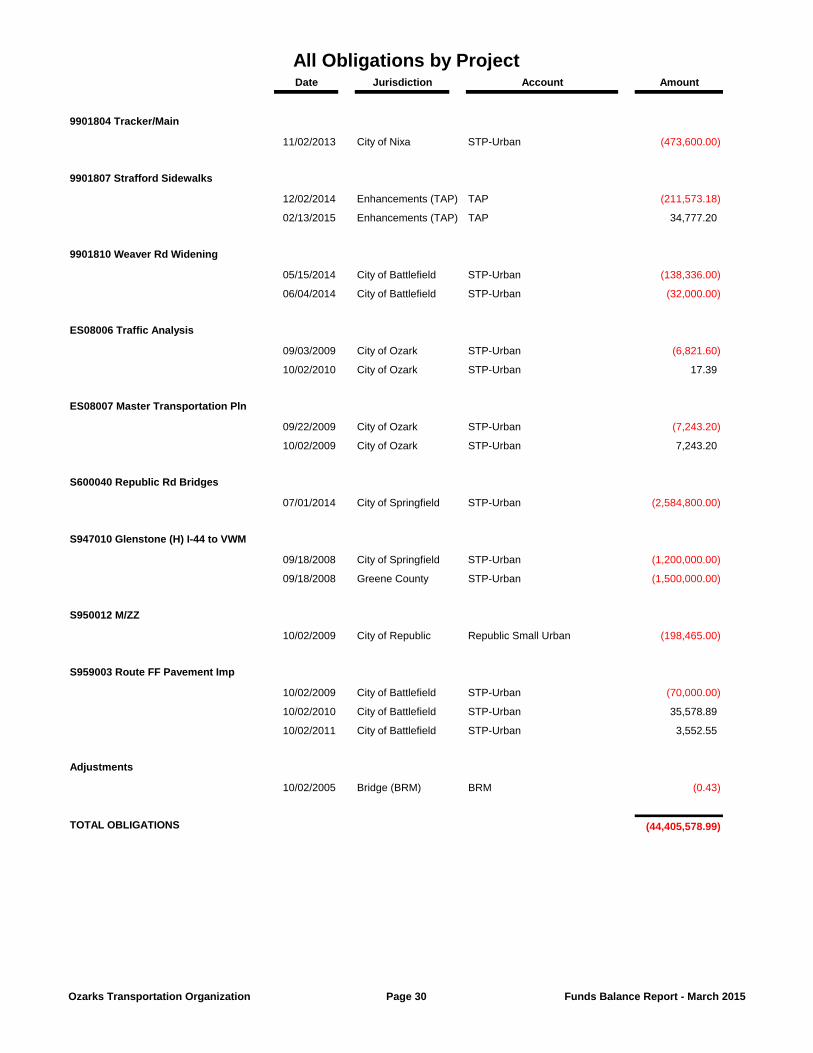
All Obligations by ProjectDate Jurisdiction Account Amount
9901804 Tracker/Main
11/02/2013 City of Nixa STP-Urban (473,600.00)
9901807 Strafford Sidewalks
12/02/2014 Enhancements (TAP) TAP (211,573.18)
02/13/2015 Enhancements (TAP) TAP 34,777.20
9901810 Weaver Rd Widening
05/15/2014 City of Battlefield STP-Urban (138,336.00)
06/04/2014 City of Battlefield STP-Urban (32,000.00)
ES08006 Traffic Analysis
09/03/2009 City of Ozark STP-Urban (6,821.60)
10/02/2010 City of Ozark STP-Urban 17.39
ES08007 Master Transportation Pln
09/22/2009 City of Ozark STP-Urban (7,243.20)
10/02/2009 City of Ozark STP-Urban 7,243.20
S600040 Republic Rd Bridges
07/01/2014 City of Springfield STP-Urban (2,584,800.00)
S947010 Glenstone (H) I-44 to VWM
09/18/2008 City of Springfield STP-Urban (1,200,000.00)
09/18/2008 Greene County STP-Urban (1,500,000.00)
S950012 M/ZZ
10/02/2009 City of Republic Republic Small Urban (198,465.00)
S959003 Route FF Pavement Imp
10/02/2009 City of Battlefield STP-Urban (70,000.00)
10/02/2010 City of Battlefield STP-Urban 35,578.89
10/02/2011 City of Battlefield STP-Urban 3,552.55
Adjustments
10/02/2005 Bridge (BRM) BRM (0.43)
TOTAL OBLIGATIONS (44,405,578.99)
Ozarks Transportation Organization Page 30 Funds Balance Report - March 2015
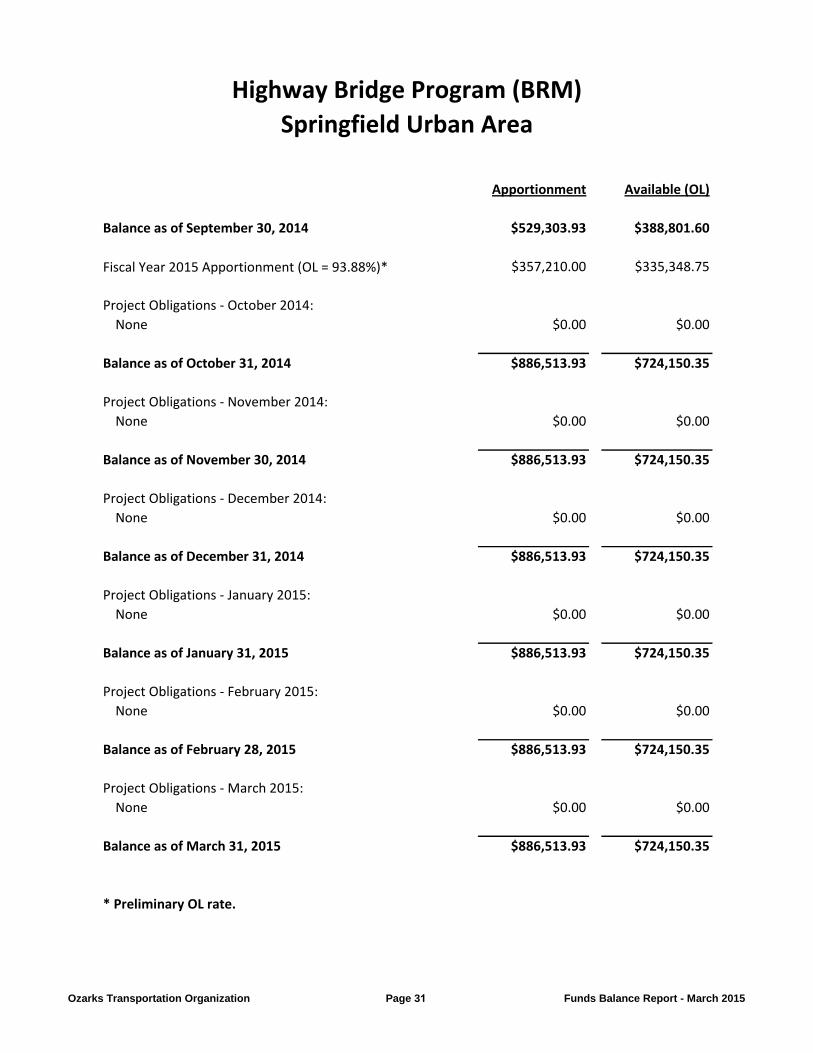
Apportionment Available (OL)
Balance as of September 30, 2014 $529,303.93 $388,801.60
Fiscal Year 2015 Apportionment (OL = 93.88%)* $357,210.00 $335,348.75
Project Obligations - October 2014:
None $0.00 $0.00
Balance as of October 31, 2014 $886,513.93 $724,150.35
Project Obligations - November 2014:
None $0.00 $0.00
Balance as of November 30, 2014 $886,513.93 $724,150.35
Project Obligations - December 2014:
None $0.00 $0.00
Balance as of December 31, 2014 $886,513.93 $724,150.35
Project Obligations - January 2015:
None $0.00 $0.00
Balance as of January 31, 2015 $886,513.93 $724,150.35
Project Obligations - February 2015:
None $0.00 $0.00
Balance as of February 28, 2015 $886,513.93 $724,150.35
Project Obligations - March 2015:
None $0.00 $0.00
Balance as of March 31, 2015 $886,513.93 $724,150.35
* Preliminary OL rate.
Highway Bridge Program (BRM)
Springfield Urban Area
Ozarks Transportation Organization Page 31 Funds Balance Report - March 2015
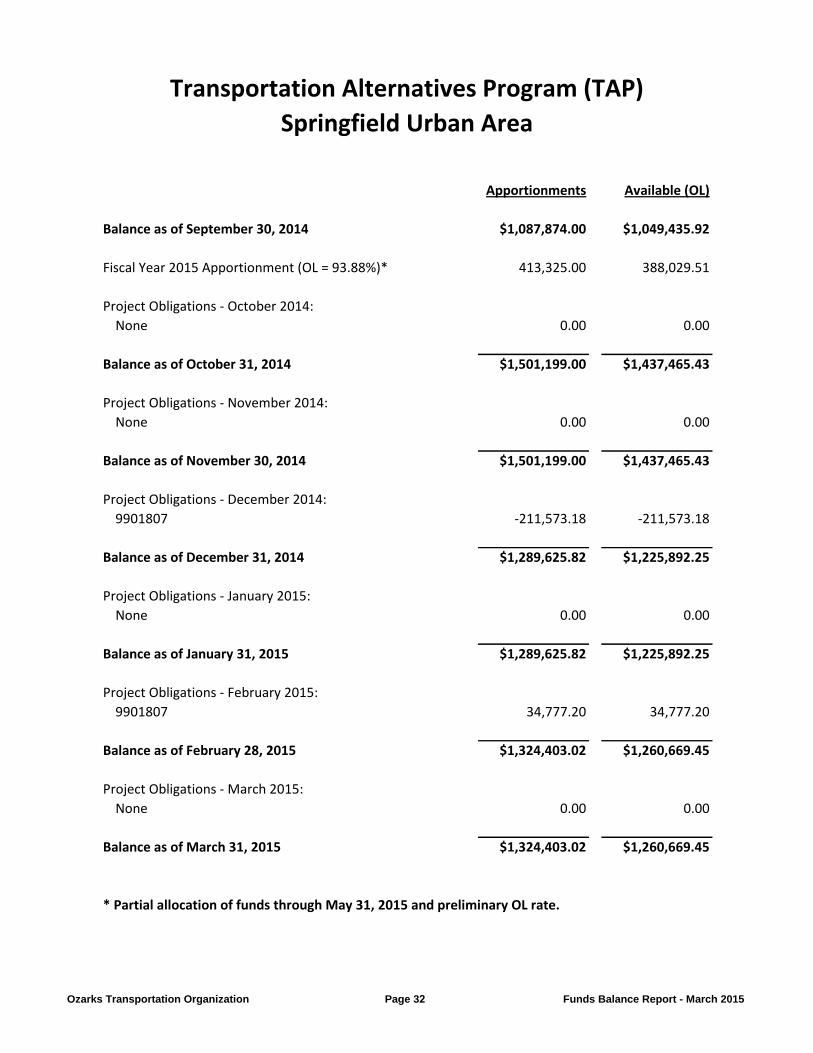
Apportionments Available (OL)
Balance as of September 30, 2014 $1,087,874.00 $1,049,435.92
Fiscal Year 2015 Apportionment (OL = 93.88%)* 413,325.00 388,029.51
Project Obligations - October 2014:
None 0.00 0.00
Balance as of October 31, 2014 $1,501,199.00 $1,437,465.43
Project Obligations - November 2014:
None 0.00 0.00
Balance as of November 30, 2014 $1,501,199.00 $1,437,465.43
Project Obligations - December 2014:
9901807 -211,573.18 -211,573.18
Balance as of December 31, 2014 $1,289,625.82 $1,225,892.25
Project Obligations - January 2015:
None 0.00 0.00
Balance as of January 31, 2015 $1,289,625.82 $1,225,892.25
Project Obligations - February 2015:
9901807 34,777.20 34,777.20
Balance as of February 28, 2015 $1,324,403.02 $1,260,669.45
Project Obligations - March 2015:
None 0.00 0.00
Balance as of March 31, 2015 $1,324,403.02 $1,260,669.45
* Partial allocation of funds through May 31, 2015 and preliminary OL rate.
Transportation Alternatives Program (TAP)
Springfield Urban Area
Ozarks Transportation Organization Page 32 Funds Balance Report - March 2015
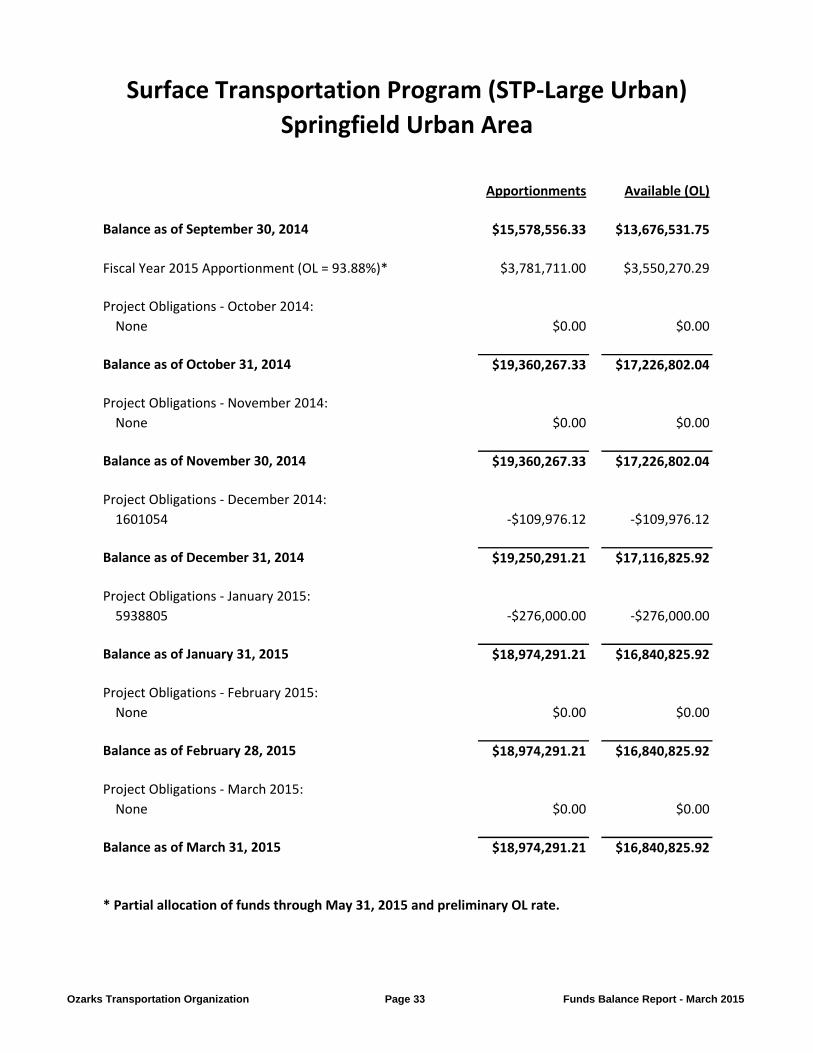
Apportionments Available (OL)
Balance as of September 30, 2014 $15,578,556.33 $13,676,531.75
Fiscal Year 2015 Apportionment (OL = 93.88%)* $3,781,711.00 $3,550,270.29
Project Obligations - October 2014:
None $0.00 $0.00
Balance as of October 31, 2014 $19,360,267.33 $17,226,802.04
Project Obligations - November 2014:
None $0.00 $0.00
Balance as of November 30, 2014 $19,360,267.33 $17,226,802.04
Project Obligations - December 2014:
1601054 -$109,976.12 -$109,976.12
Balance as of December 31, 2014 $19,250,291.21 $17,116,825.92
Project Obligations - January 2015:
5938805 -$276,000.00 -$276,000.00
Balance as of January 31, 2015 $18,974,291.21 $16,840,825.92
Project Obligations - February 2015:
None $0.00 $0.00
Balance as of February 28, 2015 $18,974,291.21 $16,840,825.92
Project Obligations - March 2015:
None $0.00 $0.00
Balance as of March 31, 2015 $18,974,291.21 $16,840,825.92
* Partial allocation of funds through May 31, 2015 and preliminary OL rate.
Surface Transportation Program (STP-Large Urban)
Springfield Urban Area
Ozarks Transportation Organization Page 33 Funds Balance Report - March 2015
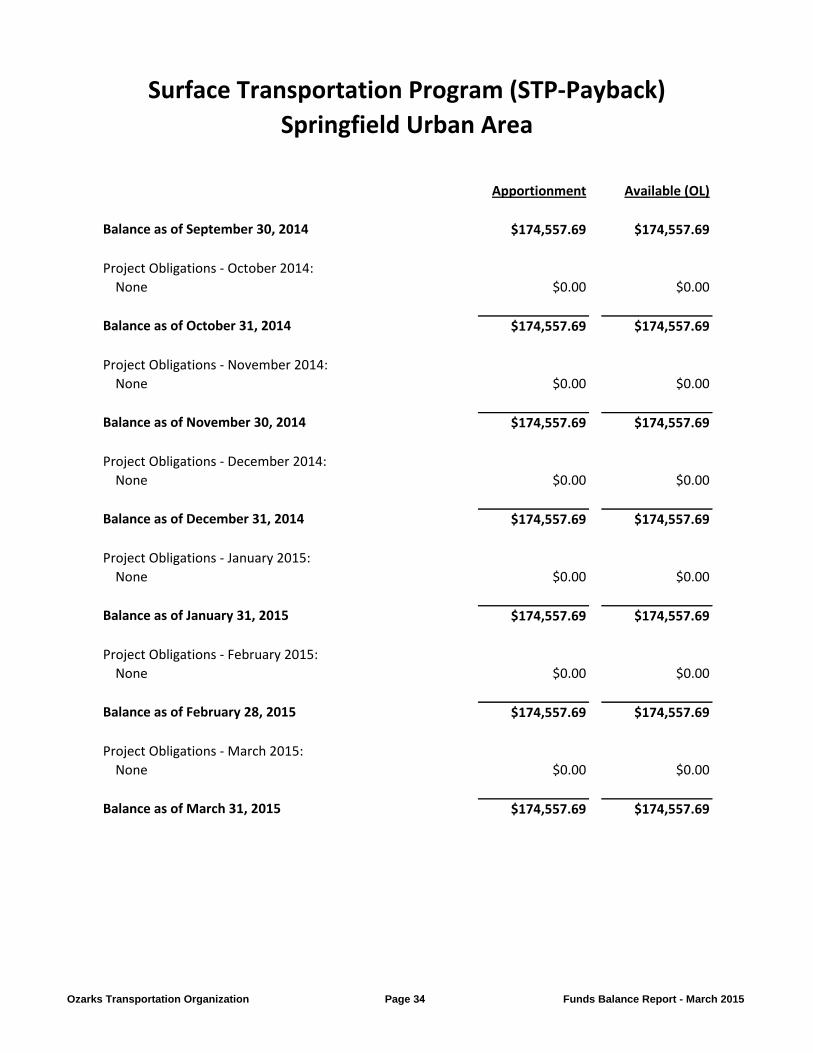
Apportionment Available (OL)
Balance as of September 30, 2014 $174,557.69 $174,557.69
Project Obligations - October 2014:
None $0.00 $0.00
Balance as of October 31, 2014 $174,557.69 $174,557.69
Project Obligations - November 2014:
None $0.00 $0.00
Balance as of November 30, 2014 $174,557.69 $174,557.69
Project Obligations - December 2014:
None $0.00 $0.00
Balance as of December 31, 2014 $174,557.69 $174,557.69
Project Obligations - January 2015:
None $0.00 $0.00
Balance as of January 31, 2015 $174,557.69 $174,557.69
Project Obligations - February 2015:
None $0.00 $0.00
Balance as of February 28, 2015 $174,557.69 $174,557.69
Project Obligations - March 2015:
None $0.00 $0.00
Balance as of March 31, 2015 $174,557.69 $174,557.69
Surface Transportation Program (STP-Payback)
Springfield Urban Area
Ozarks Transportation Organization Page 34 Funds Balance Report - March 2015
This report was prepared in cooperation with the USDOT,including FHWA and FTA, as well as the Missouri
Department of Transportation. The opinions, findings,and conclusions expressed in this publication are those of
the authors and not necessarily those of the Missouri Highwaysand Transportation Commission, the Federal HighwayAAdministration or the Federal Transit Administration.

TAB 8
BOARD OF DIRECTORS AGENDA 6/18/2015; ITEM II.F.
Performance Measures Report
Ozarks Transportation Organization (Springfield, MO Area MPO)
AGENDA DESCRIPTION:
The current surface transportation authorization bill, MAP‐21 (Moving Ahead for Progress in the 21st Century), introduced performance measures into the planning process requirements. Ahead of passage by MAP‐21, OTO included performance measures in the Long Range Transportation Plan, Journey 2035. This is OTO’s third annual Performance Measures Report, providing an assessment of the OTO area and the efficacy of the performance measures themselves. The Report provides a quick reference for how the region is performing along with a more detailed description of each measure and its results, as well as a brief discussion of notable factors which may have impacted each measure’s current trend. An infographic summarizing these measures will be provided at the meeting. BOARD OF DIRECTORS ACTION REQUESTED: No action required. Informational only.
OZARKS TRANSPORTATION ORGANIZATION ANNUAL REPORT ON
PERFORMANCE MEASURES 2014
Ozarks Transportation Organization 205 PARK CENTRAL EAST, SUITE 205 | SPRINGFIELD, MO 65806 | 417.865.3042
www.OzarksTransportation.org
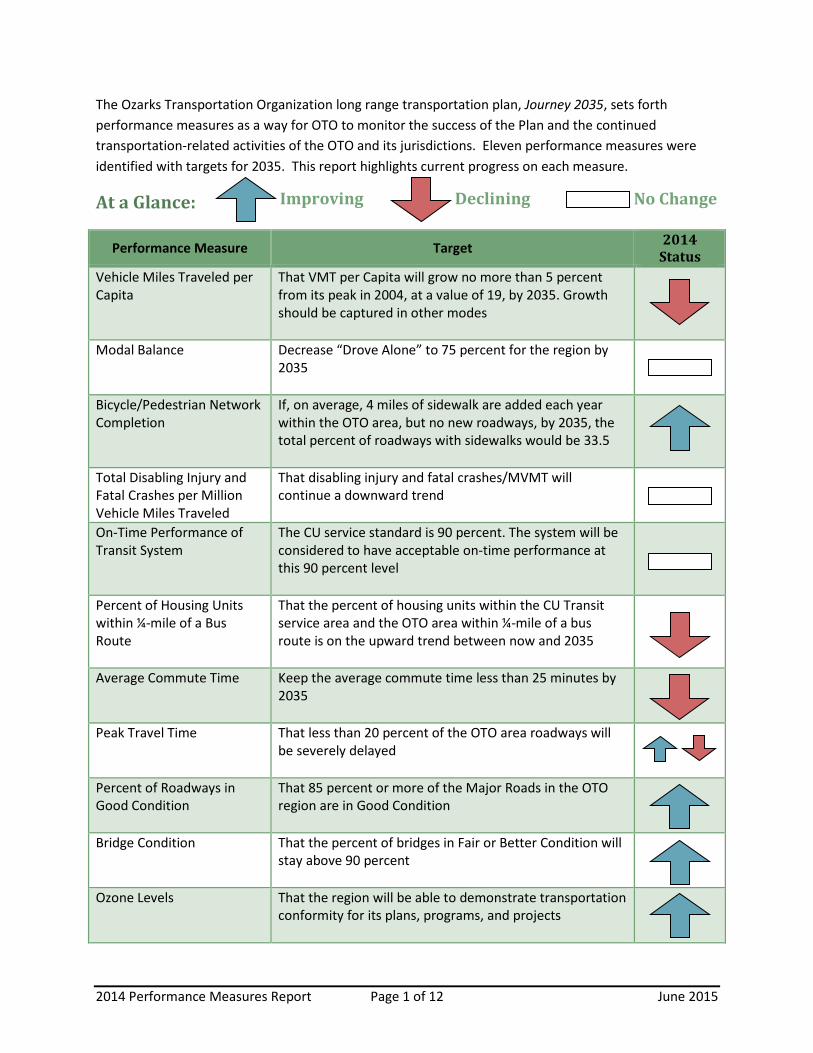
The Ozarks Transportation Organization long range transportation plan, Journey 2035, sets forth performance measures as a way for OTO to monitor the success of the Plan and the continued transportation-related activities of the OTO and its jurisdictions. Eleven performance measures were identified with targets for 2035. This report highlights current progress on each measure.
At a Glance:
Performance Measure Target 2014 Status
Vehicle Miles Traveled per Capita
That VMT per Capita will grow no more than 5 percent from its peak in 2004, at a value of 19, by 2035. Growth should be captured in other modes
Modal Balance Decrease “Drove Alone” to 75 percent for the region by 2035
Bicycle/Pedestrian Network Completion
If, on average, 4 miles of sidewalk are added each year within the OTO area, but no new roadways, by 2035, the total percent of roadways with sidewalks would be 33.5
Total Disabling Injury and Fatal Crashes per Million Vehicle Miles Traveled
That disabling injury and fatal crashes/MVMT will continue a downward trend
On-Time Performance of Transit System
The CU service standard is 90 percent. The system will be considered to have acceptable on-time performance at this 90 percent level
Percent of Housing Units within ¼-mile of a Bus Route
That the percent of housing units within the CU Transit service area and the OTO area within ¼-mile of a bus route is on the upward trend between now and 2035
Average Commute Time Keep the average commute time less than 25 minutes by 2035
Peak Travel Time That less than 20 percent of the OTO area roadways will be severely delayed
Percent of Roadways in Good Condition
That 85 percent or more of the Major Roads in the OTO region are in Good Condition
Bridge Condition That the percent of bridges in Fair or Better Condition will stay above 90 percent
Ozone Levels That the region will be able to demonstrate transportation conformity for its plans, programs, and projects
Improving Declining No Change
2014 Performance Measures Report Page 1 of 12 June 2015
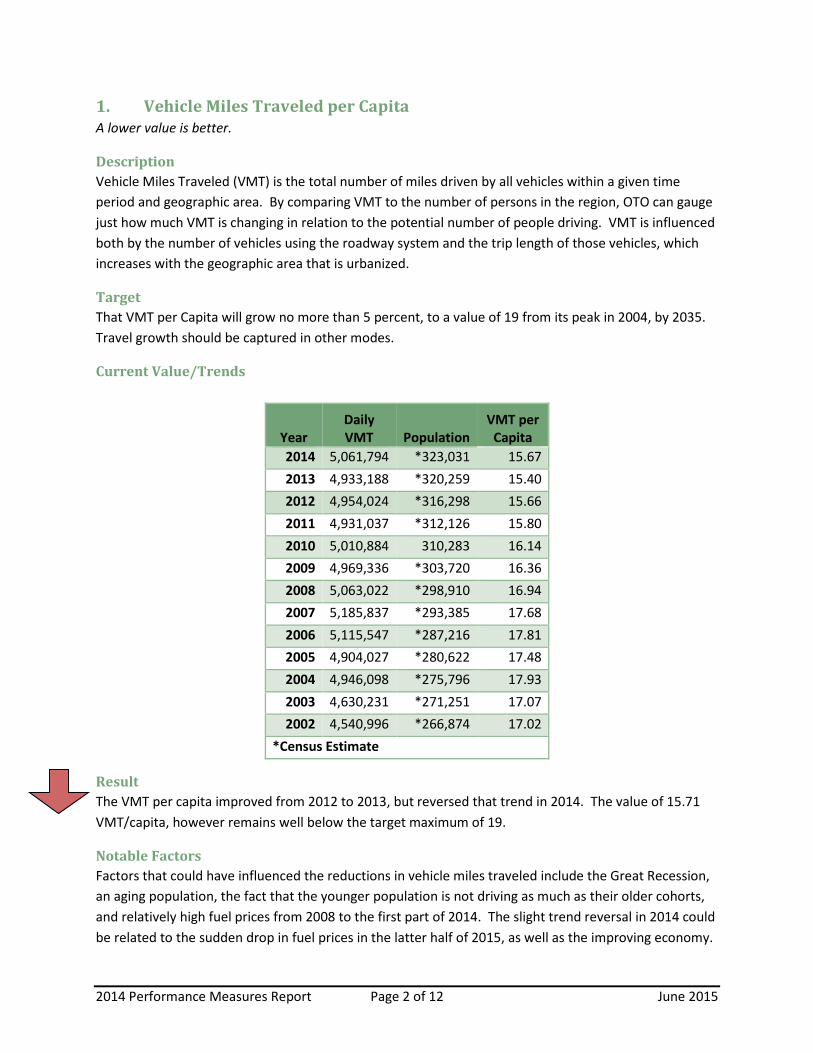
1. Vehicle Miles Traveled per Capita A lower value is better.
Description Vehicle Miles Traveled (VMT) is the total number of miles driven by all vehicles within a given time period and geographic area. By comparing VMT to the number of persons in the region, OTO can gauge just how much VMT is changing in relation to the potential number of people driving. VMT is influenced both by the number of vehicles using the roadway system and the trip length of those vehicles, which increases with the geographic area that is urbanized.
Target That VMT per Capita will grow no more than 5 percent, to a value of 19 from its peak in 2004, by 2035. Travel growth should be captured in other modes.
Current Value/Trends
Year Daily VMT Population
VMT per Capita
2014 5,061,794 *323,031 15.67 2013 4,933,188 *320,259 15.40 2012 4,954,024 *316,298 15.66 2011 4,931,037 *312,126 15.80 2010 5,010,884 310,283 16.14 2009 4,969,336 *303,720 16.36 2008 5,063,022 *298,910 16.94 2007 5,185,837 *293,385 17.68 2006 5,115,547 *287,216 17.81 2005 4,904,027 *280,622 17.48 2004 4,946,098 *275,796 17.93 2003 4,630,231 *271,251 17.07 2002 4,540,996 *266,874 17.02
*Census Estimate
Result The VMT per capita improved from 2012 to 2013, but reversed that trend in 2014. The value of 15.71 VMT/capita, however remains well below the target maximum of 19.
Notable Factors Factors that could have influenced the reductions in vehicle miles traveled include the Great Recession, an aging population, the fact that the younger population is not driving as much as their older cohorts, and relatively high fuel prices from 2008 to the first part of 2014. The slight trend reversal in 2014 could be related to the sudden drop in fuel prices in the latter half of 2015, as well as the improving economy.
2014 Performance Measures Report Page 2 of 12 June 2015
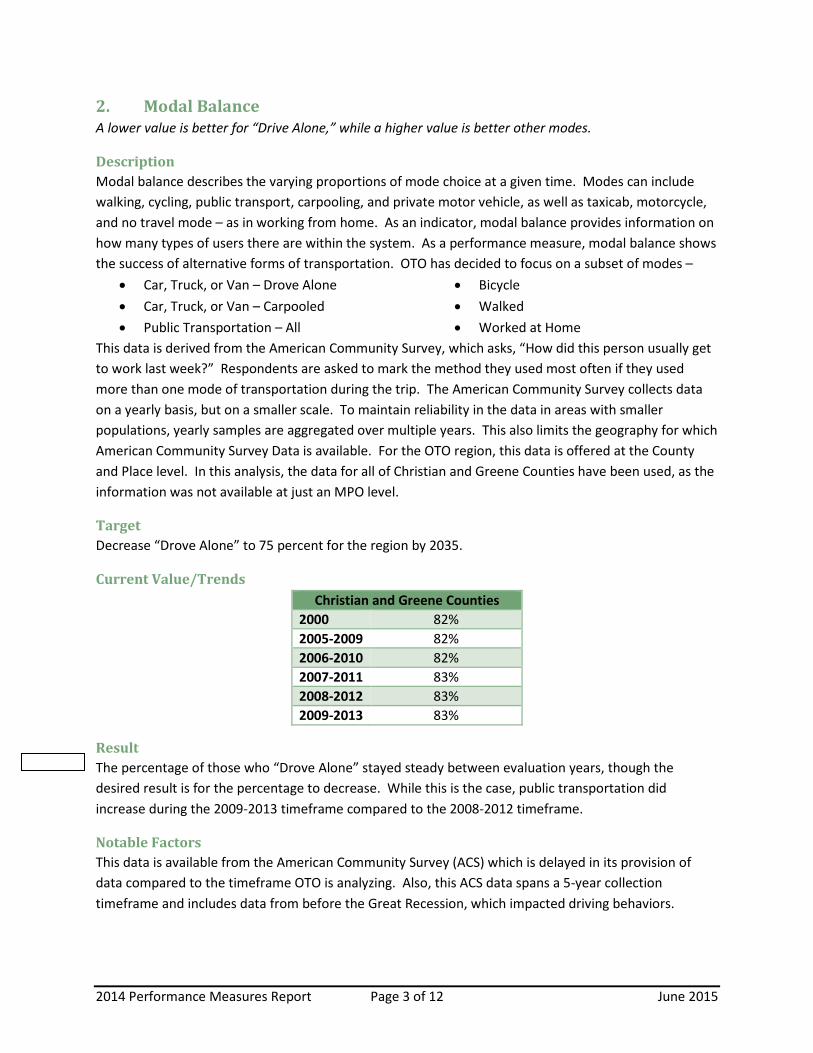
2. Modal Balance A lower value is better for “Drive Alone,” while a higher value is better other modes.
Description Modal balance describes the varying proportions of mode choice at a given time. Modes can include walking, cycling, public transport, carpooling, and private motor vehicle, as well as taxicab, motorcycle, and no travel mode – as in working from home. As an indicator, modal balance provides information on how many types of users there are within the system. As a performance measure, modal balance shows the success of alternative forms of transportation. OTO has decided to focus on a subset of modes –
• Car, Truck, or Van – Drove Alone • Car, Truck, or Van – Carpooled • Public Transportation – All
• Bicycle • Walked • Worked at Home
This data is derived from the American Community Survey, which asks, “How did this person usually get to work last week?” Respondents are asked to mark the method they used most often if they used more than one mode of transportation during the trip. The American Community Survey collects data on a yearly basis, but on a smaller scale. To maintain reliability in the data in areas with smaller populations, yearly samples are aggregated over multiple years. This also limits the geography for which American Community Survey Data is available. For the OTO region, this data is offered at the County and Place level. In this analysis, the data for all of Christian and Greene Counties have been used, as the information was not available at just an MPO level.
Target Decrease “Drove Alone” to 75 percent for the region by 2035.
Current Value/Trends Christian and Greene Counties
2000 82% 2005-2009 82% 2006-2010 82% 2007-2011 83% 2008-2012 83% 2009-2013 83%
Result The percentage of those who “Drove Alone” stayed steady between evaluation years, though the desired result is for the percentage to decrease. While this is the case, public transportation did increase during the 2009-2013 timeframe compared to the 2008-2012 timeframe.
Notable Factors This data is available from the American Community Survey (ACS) which is delayed in its provision of data compared to the timeframe OTO is analyzing. Also, this ACS data spans a 5-year collection timeframe and includes data from before the Great Recession, which impacted driving behaviors.
2014 Performance Measures Report Page 3 of 12 June 2015
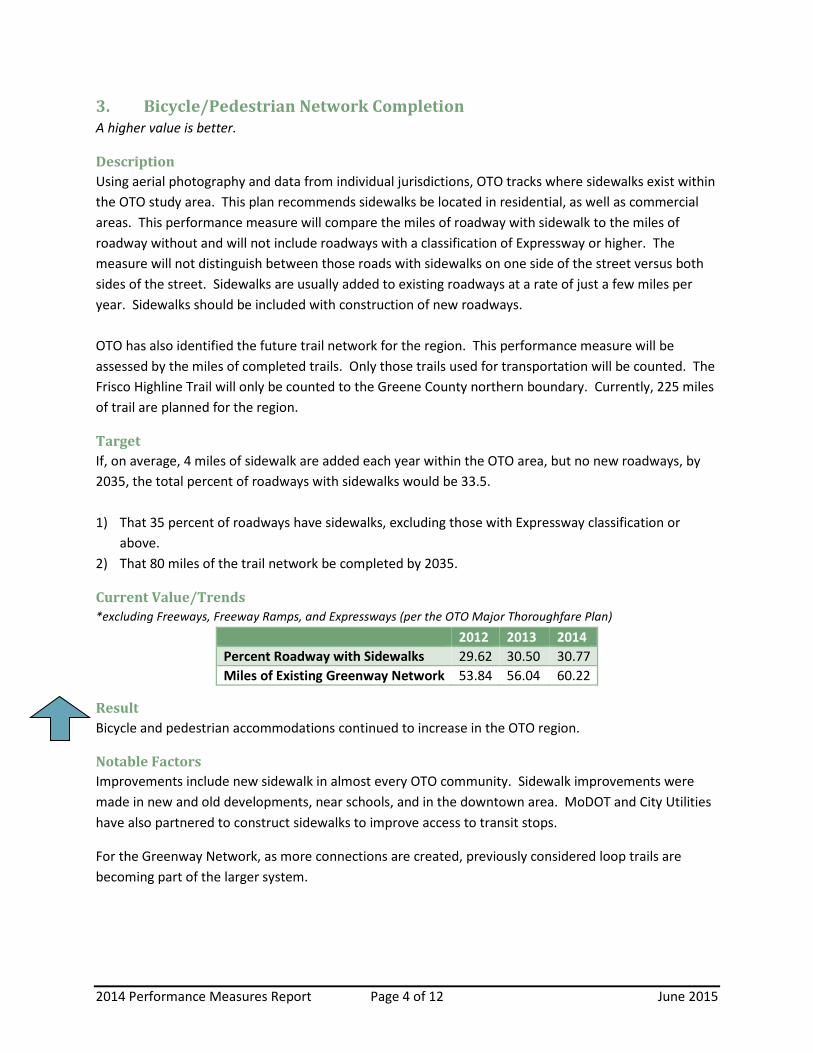
3. Bicycle/Pedestrian Network Completion A higher value is better.
Description Using aerial photography and data from individual jurisdictions, OTO tracks where sidewalks exist within the OTO study area. This plan recommends sidewalks be located in residential, as well as commercial areas. This performance measure will compare the miles of roadway with sidewalk to the miles of roadway without and will not include roadways with a classification of Expressway or higher. The measure will not distinguish between those roads with sidewalks on one side of the street versus both sides of the street. Sidewalks are usually added to existing roadways at a rate of just a few miles per year. Sidewalks should be included with construction of new roadways. OTO has also identified the future trail network for the region. This performance measure will be assessed by the miles of completed trails. Only those trails used for transportation will be counted. The Frisco Highline Trail will only be counted to the Greene County northern boundary. Currently, 225 miles of trail are planned for the region.
Target If, on average, 4 miles of sidewalk are added each year within the OTO area, but no new roadways, by 2035, the total percent of roadways with sidewalks would be 33.5. 1) That 35 percent of roadways have sidewalks, excluding those with Expressway classification or
above. 2) That 80 miles of the trail network be completed by 2035.
Current Value/Trends *excluding Freeways, Freeway Ramps, and Expressways (per the OTO Major Thoroughfare Plan)
2012 2013 2014 Percent Roadway with Sidewalks 29.62 30.50 30.77 Miles of Existing Greenway Network 53.84 56.04 60.22
Result Bicycle and pedestrian accommodations continued to increase in the OTO region.
Notable Factors Improvements include new sidewalk in almost every OTO community. Sidewalk improvements were made in new and old developments, near schools, and in the downtown area. MoDOT and City Utilities have also partnered to construct sidewalks to improve access to transit stops.
For the Greenway Network, as more connections are created, previously considered loop trails are becoming part of the larger system.
2014 Performance Measures Report Page 4 of 12 June 2015
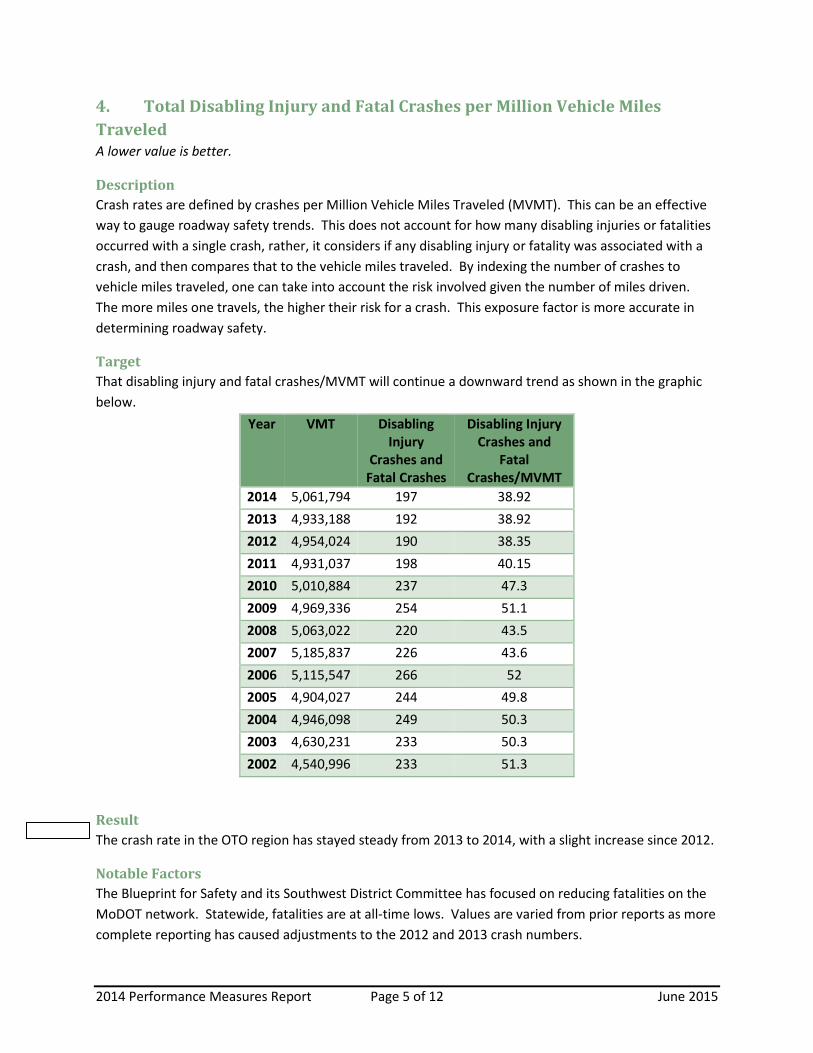
4. Total Disabling Injury and Fatal Crashes per Million Vehicle Miles Traveled A lower value is better.
Description Crash rates are defined by crashes per Million Vehicle Miles Traveled (MVMT). This can be an effective way to gauge roadway safety trends. This does not account for how many disabling injuries or fatalities occurred with a single crash, rather, it considers if any disabling injury or fatality was associated with a crash, and then compares that to the vehicle miles traveled. By indexing the number of crashes to vehicle miles traveled, one can take into account the risk involved given the number of miles driven. The more miles one travels, the higher their risk for a crash. This exposure factor is more accurate in determining roadway safety.
Target That disabling injury and fatal crashes/MVMT will continue a downward trend as shown in the graphic below.
Year VMT Disabling Injury
Crashes and Fatal Crashes
Disabling Injury Crashes and
Fatal Crashes/MVMT
2014 5,061,794 197 38.92 2013 4,933,188 192 38.92 2012 4,954,024 190 38.35 2011 4,931,037 198 40.15 2010 5,010,884 237 47.3 2009 4,969,336 254 51.1 2008 5,063,022 220 43.5 2007 5,185,837 226 43.6 2006 5,115,547 266 52 2005 4,904,027 244 49.8 2004 4,946,098 249 50.3 2003 4,630,231 233 50.3 2002 4,540,996 233 51.3
Result The crash rate in the OTO region has stayed steady from 2013 to 2014, with a slight increase since 2012.
Notable Factors The Blueprint for Safety and its Southwest District Committee has focused on reducing fatalities on the MoDOT network. Statewide, fatalities are at all-time lows. Values are varied from prior reports as more complete reporting has caused adjustments to the 2012 and 2013 crash numbers.
2014 Performance Measures Report Page 5 of 12 June 2015
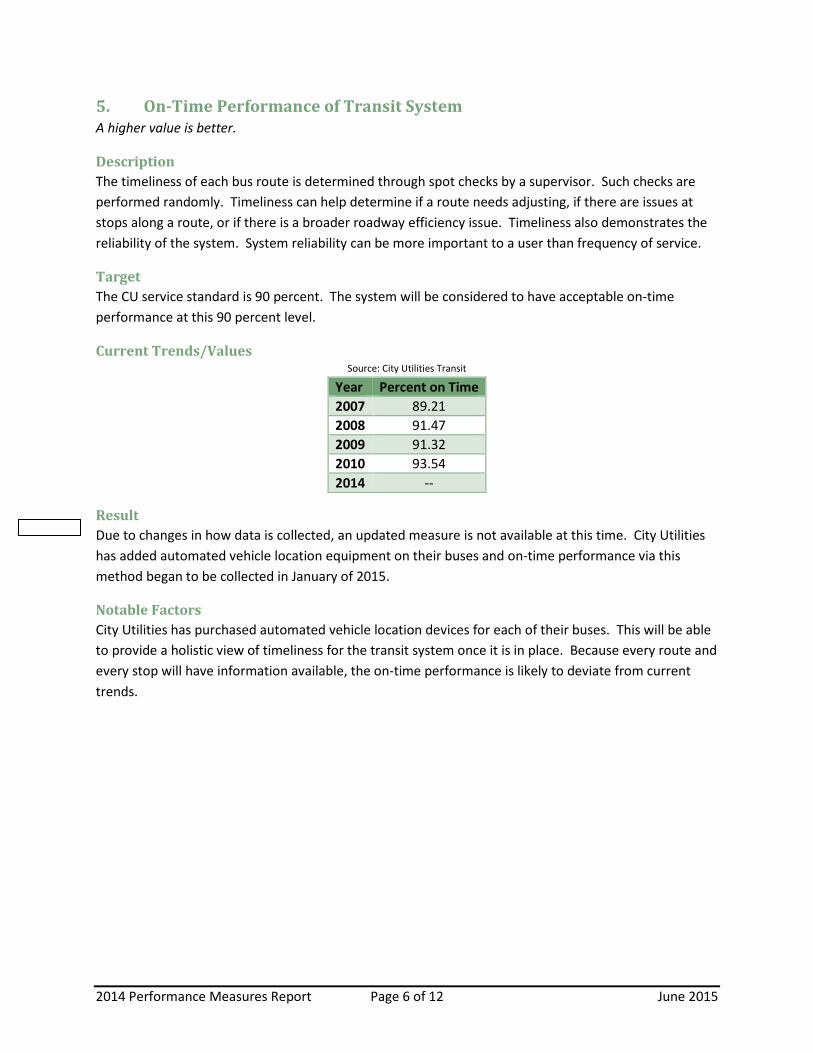
5. On-Time Performance of Transit System A higher value is better.
Description The timeliness of each bus route is determined through spot checks by a supervisor. Such checks are performed randomly. Timeliness can help determine if a route needs adjusting, if there are issues at stops along a route, or if there is a broader roadway efficiency issue. Timeliness also demonstrates the reliability of the system. System reliability can be more important to a user than frequency of service.
Target The CU service standard is 90 percent. The system will be considered to have acceptable on-time performance at this 90 percent level.
Current Trends/Values Source: City Utilities Transit
Year Percent on Time 2007 89.21 2008 91.47 2009 91.32 2010 93.54 2014 --
Result Due to changes in how data is collected, an updated measure is not available at this time. City Utilities has added automated vehicle location equipment on their buses and on-time performance via this method began to be collected in January of 2015.
Notable Factors City Utilities has purchased automated vehicle location devices for each of their buses. This will be able to provide a holistic view of timeliness for the transit system once it is in place. Because every route and every stop will have information available, the on-time performance is likely to deviate from current trends.
2014 Performance Measures Report Page 6 of 12 June 2015
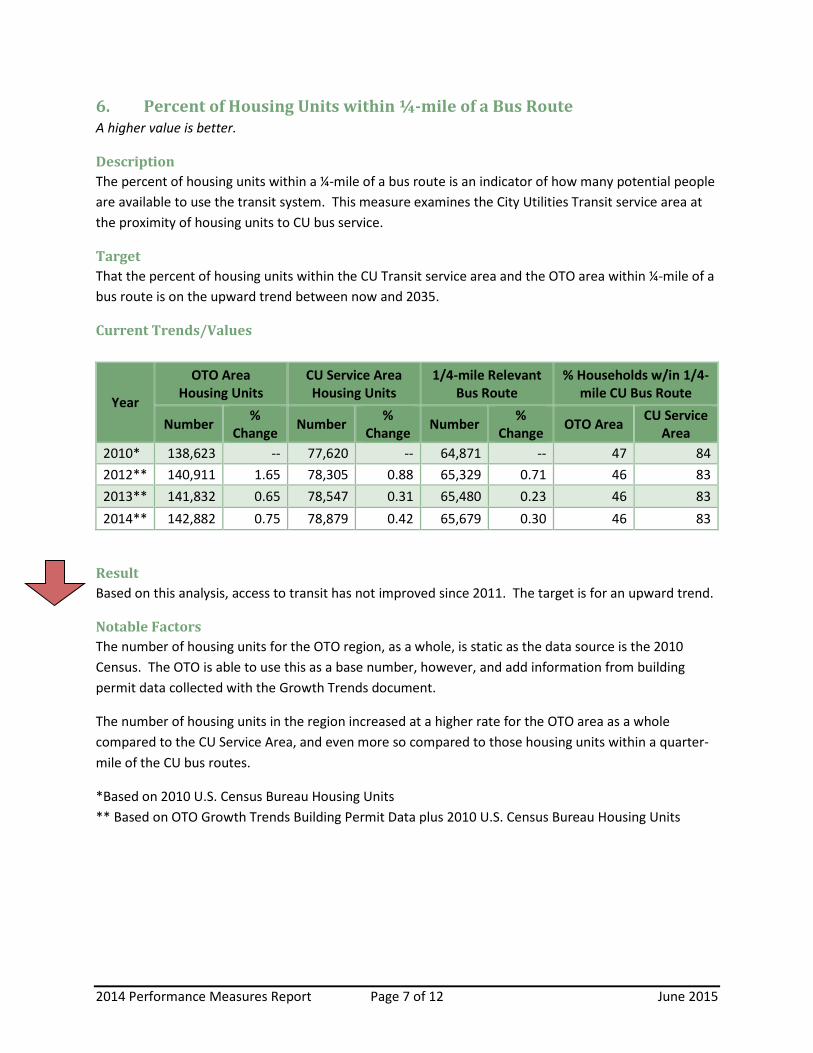
6. Percent of Housing Units within ¼-mile of a Bus Route A higher value is better.
Description The percent of housing units within a ¼-mile of a bus route is an indicator of how many potential people are available to use the transit system. This measure examines the City Utilities Transit service area at the proximity of housing units to CU bus service.
Target That the percent of housing units within the CU Transit service area and the OTO area within ¼-mile of a bus route is on the upward trend between now and 2035.
Current Trends/Values
Year
OTO Area Housing Units
CU Service Area Housing Units
1/4-mile Relevant Bus Route
% Households w/in 1/4-mile CU Bus Route
Number % Change Number %
Change Number % Change OTO Area CU Service
Area 2010* 138,623 -- 77,620 -- 64,871 -- 47 84 2012** 140,911 1.65 78,305 0.88 65,329 0.71 46 83 2013** 141,832 0.65 78,547 0.31 65,480 0.23 46 83 2014** 142,882 0.75 78,879 0.42 65,679 0.30 46 83
Result Based on this analysis, access to transit has not improved since 2011. The target is for an upward trend.
Notable Factors The number of housing units for the OTO region, as a whole, is static as the data source is the 2010 Census. The OTO is able to use this as a base number, however, and add information from building permit data collected with the Growth Trends document.
The number of housing units in the region increased at a higher rate for the OTO area as a whole compared to the CU Service Area, and even more so compared to those housing units within a quarter-mile of the CU bus routes.
*Based on 2010 U.S. Census Bureau Housing Units ** Based on OTO Growth Trends Building Permit Data plus 2010 U.S. Census Bureau Housing Units
2014 Performance Measures Report Page 7 of 12 June 2015
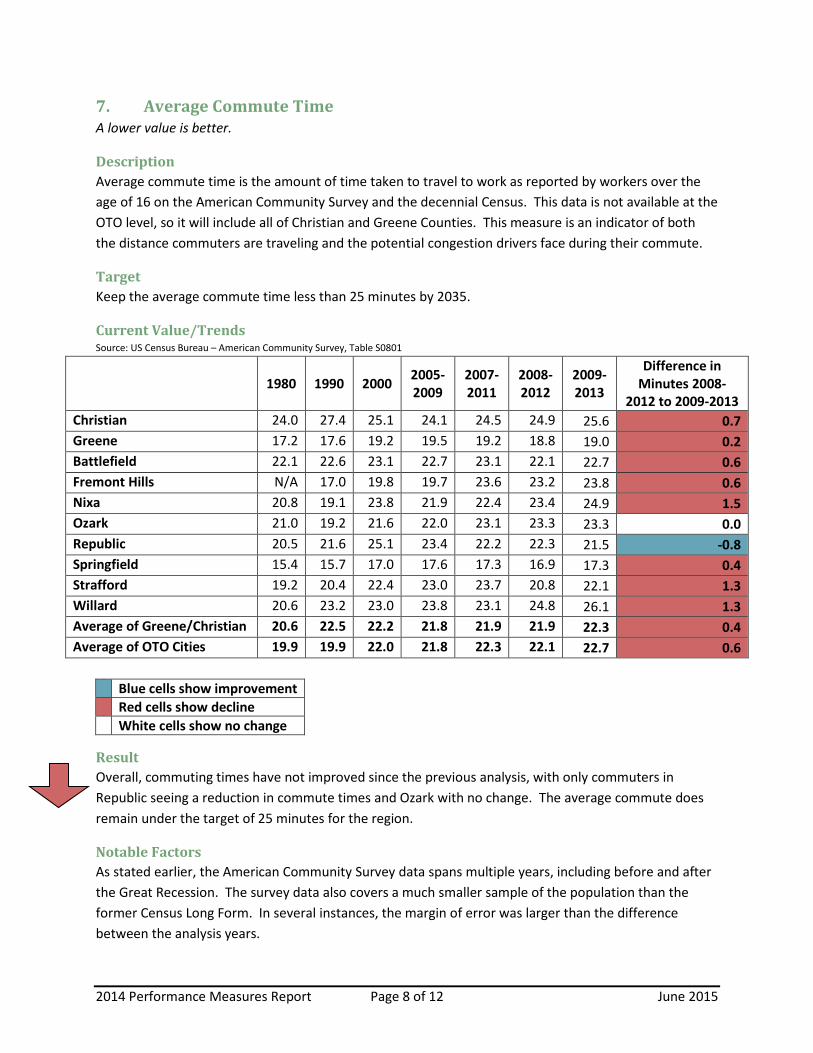
7. Average Commute Time A lower value is better.
Description Average commute time is the amount of time taken to travel to work as reported by workers over the age of 16 on the American Community Survey and the decennial Census. This data is not available at the OTO level, so it will include all of Christian and Greene Counties. This measure is an indicator of both the distance commuters are traveling and the potential congestion drivers face during their commute.
Target Keep the average commute time less than 25 minutes by 2035.
Current Value/Trends Source: US Census Bureau – American Community Survey, Table S0801
1980 1990 2000 2005-
2009 2007-2011
2008-2012
2009-2013
Difference in Minutes 2008-
2012 to 2009-2013 Christian 24.0 27.4 25.1 24.1 24.5 24.9 25.6 0.7 Greene 17.2 17.6 19.2 19.5 19.2 18.8 19.0 0.2 Battlefield 22.1 22.6 23.1 22.7 23.1 22.1 22.7 0.6 Fremont Hills N/A 17.0 19.8 19.7 23.6 23.2 23.8 0.6 Nixa 20.8 19.1 23.8 21.9 22.4 23.4 24.9 1.5 Ozark 21.0 19.2 21.6 22.0 23.1 23.3 23.3 0.0 Republic 20.5 21.6 25.1 23.4 22.2 22.3 21.5 -0.8 Springfield 15.4 15.7 17.0 17.6 17.3 16.9 17.3 0.4 Strafford 19.2 20.4 22.4 23.0 23.7 20.8 22.1 1.3 Willard 20.6 23.2 23.0 23.8 23.1 24.8 26.1 1.3 Average of Greene/Christian 20.6 22.5 22.2 21.8 21.9 21.9 22.3 0.4 Average of OTO Cities 19.9 19.9 22.0 21.8 22.3 22.1 22.7 0.6
Blue cells show improvement Red cells show decline White cells show no change
Result Overall, commuting times have not improved since the previous analysis, with only commuters in Republic seeing a reduction in commute times and Ozark with no change. The average commute does remain under the target of 25 minutes for the region.
Notable Factors As stated earlier, the American Community Survey data spans multiple years, including before and after the Great Recession. The survey data also covers a much smaller sample of the population than the former Census Long Form. In several instances, the margin of error was larger than the difference between the analysis years.
2014 Performance Measures Report Page 8 of 12 June 2015
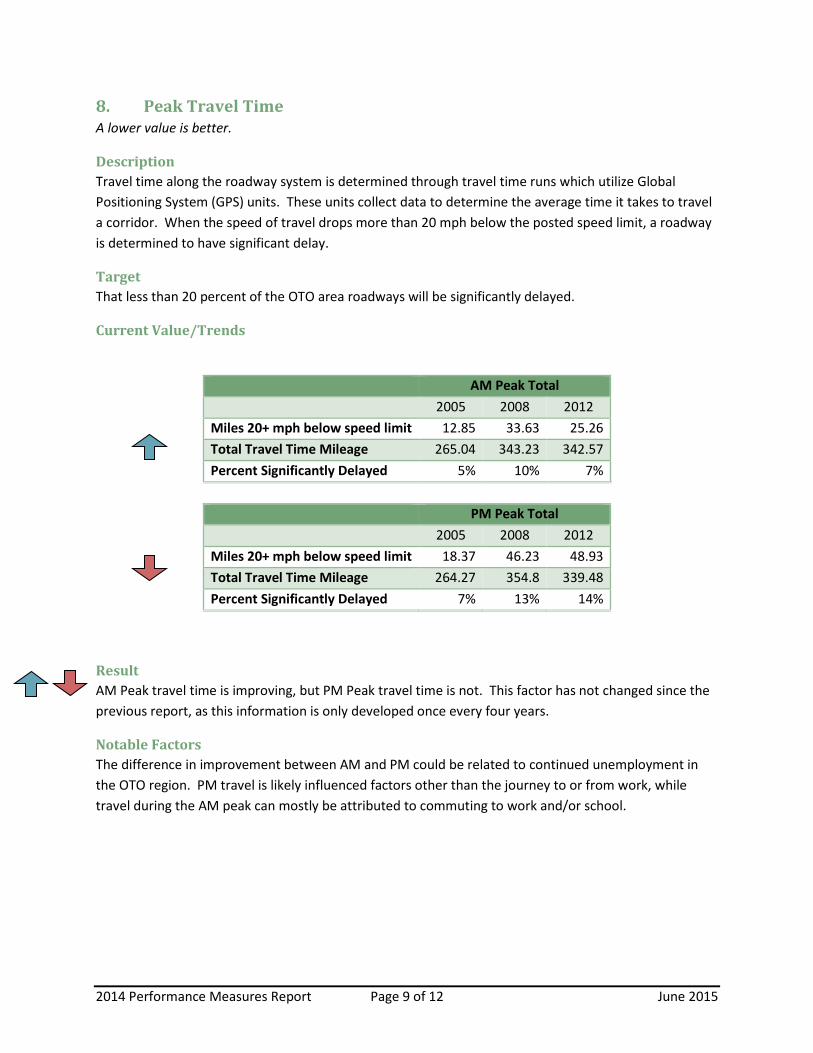
8. Peak Travel Time A lower value is better.
Description Travel time along the roadway system is determined through travel time runs which utilize Global Positioning System (GPS) units. These units collect data to determine the average time it takes to travel a corridor. When the speed of travel drops more than 20 mph below the posted speed limit, a roadway is determined to have significant delay.
Target That less than 20 percent of the OTO area roadways will be significantly delayed.
Current Value/Trends
AM Peak Total 2005 2008 2012 Miles 20+ mph below speed limit 12.85 33.63 25.26 Total Travel Time Mileage 265.04 343.23 342.57 Percent Significantly Delayed 5% 10% 7% PM Peak Total 2005 2008 2012 Miles 20+ mph below speed limit 18.37 46.23 48.93 Total Travel Time Mileage 264.27 354.8 339.48 Percent Significantly Delayed 7% 13% 14%
Result AM Peak travel time is improving, but PM Peak travel time is not. This factor has not changed since the previous report, as this information is only developed once every four years.
Notable Factors The difference in improvement between AM and PM could be related to continued unemployment in the OTO region. PM travel is likely influenced factors other than the journey to or from work, while travel during the AM peak can mostly be attributed to commuting to work and/or school.
2014 Performance Measures Report Page 9 of 12 June 2015
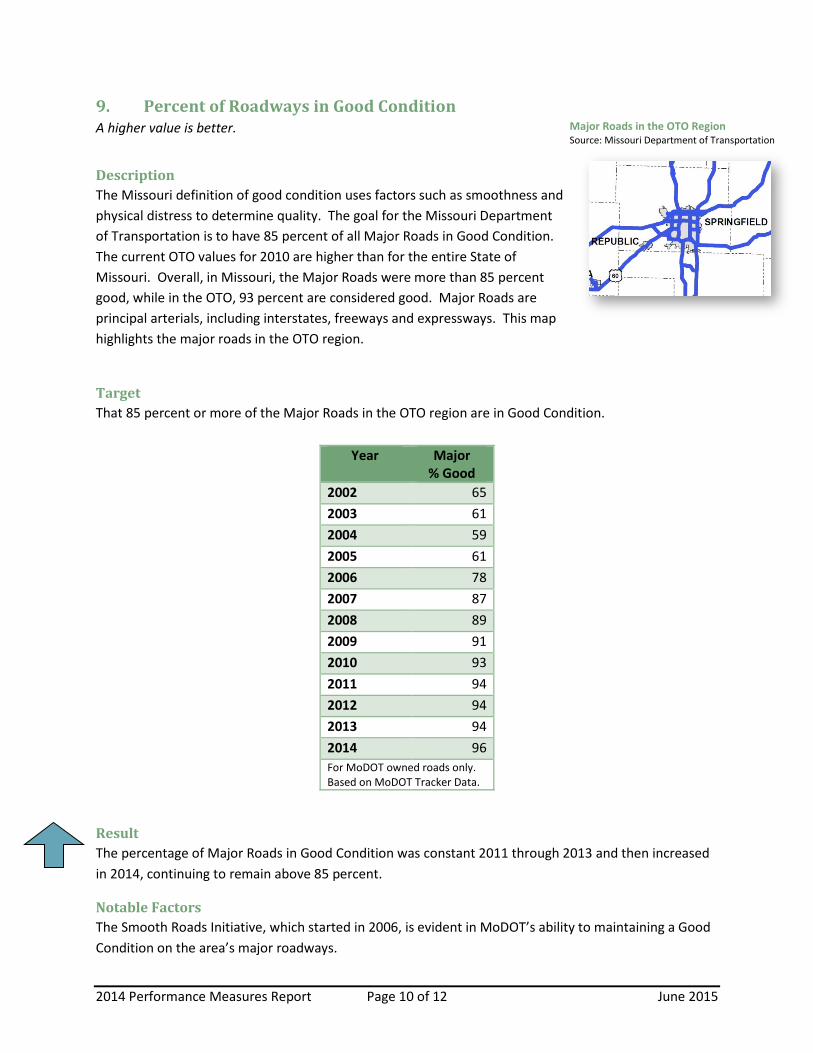
9. Percent of Roadways in Good Condition A higher value is better.
Description The Missouri definition of good condition uses factors such as smoothness and physical distress to determine quality. The goal for the Missouri Department of Transportation is to have 85 percent of all Major Roads in Good Condition. The current OTO values for 2010 are higher than for the entire State of Missouri. Overall, in Missouri, the Major Roads were more than 85 percent good, while in the OTO, 93 percent are considered good. Major Roads are principal arterials, including interstates, freeways and expressways. This map highlights the major roads in the OTO region.
Target That 85 percent or more of the Major Roads in the OTO region are in Good Condition.
Year Major % Good
2002 65 2003 61 2004 59 2005 61 2006 78 2007 87 2008 89 2009 91 2010 93 2011 94 2012 94 2013 94 2014 96 For MoDOT owned roads only. Based on MoDOT Tracker Data.
Result The percentage of Major Roads in Good Condition was constant 2011 through 2013 and then increased in 2014, continuing to remain above 85 percent.
Notable Factors The Smooth Roads Initiative, which started in 2006, is evident in MoDOT’s ability to maintaining a Good Condition on the area’s major roadways.
Major Roads in the OTO Region Source: Missouri Department of Transportation
2014 Performance Measures Report Page 10 of 12 June 2015
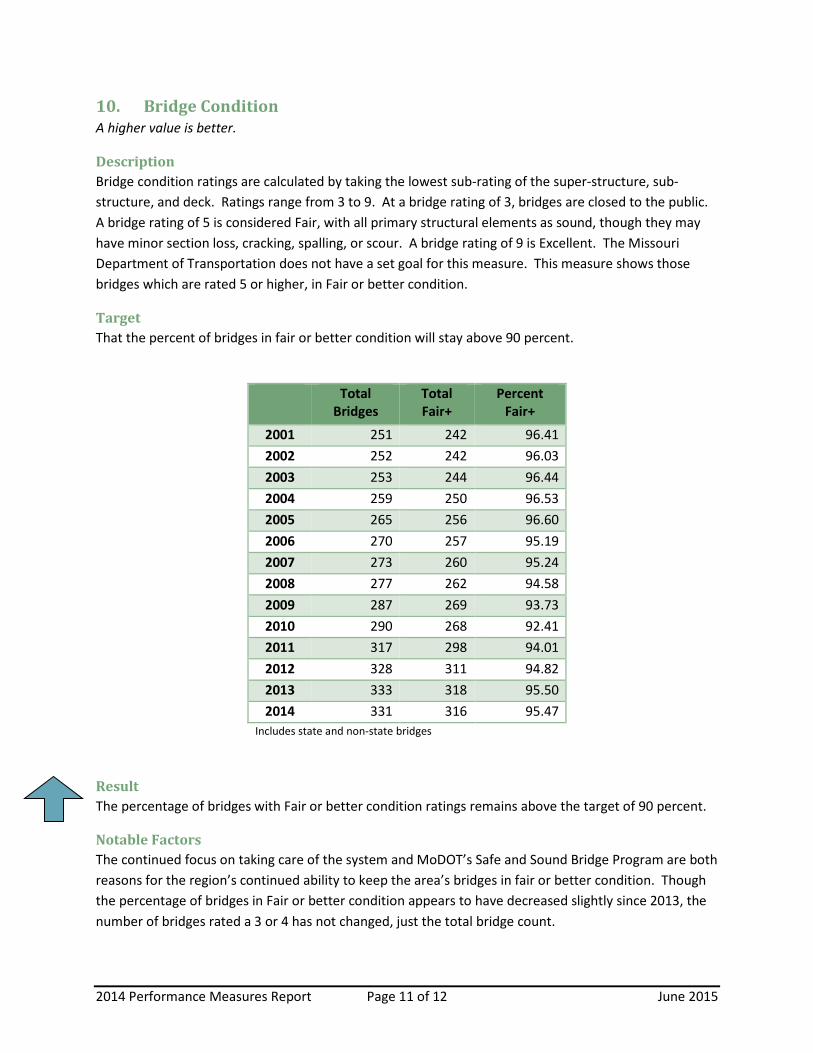
10. Bridge Condition A higher value is better.
Description Bridge condition ratings are calculated by taking the lowest sub-rating of the super-structure, sub-structure, and deck. Ratings range from 3 to 9. At a bridge rating of 3, bridges are closed to the public. A bridge rating of 5 is considered Fair, with all primary structural elements as sound, though they may have minor section loss, cracking, spalling, or scour. A bridge rating of 9 is Excellent. The Missouri Department of Transportation does not have a set goal for this measure. This measure shows those bridges which are rated 5 or higher, in Fair or better condition.
Target That the percent of bridges in fair or better condition will stay above 90 percent.
Total Bridges
Total Fair+
Percent Fair+
2001 251 242 96.41 2002 252 242 96.03 2003 253 244 96.44 2004 259 250 96.53 2005 265 256 96.60 2006 270 257 95.19 2007 273 260 95.24 2008 277 262 94.58 2009 287 269 93.73 2010 290 268 92.41 2011 317 298 94.01 2012 328 311 94.82 2013 333 318 95.50 2014 331 316 95.47
Includes state and non-state bridges
Result The percentage of bridges with Fair or better condition ratings remains above the target of 90 percent.
Notable Factors The continued focus on taking care of the system and MoDOT’s Safe and Sound Bridge Program are both reasons for the region’s continued ability to keep the area’s bridges in fair or better condition. Though the percentage of bridges in Fair or better condition appears to have decreased slightly since 2013, the number of bridges rated a 3 or 4 has not changed, just the total bridge count.
2014 Performance Measures Report Page 11 of 12 June 2015
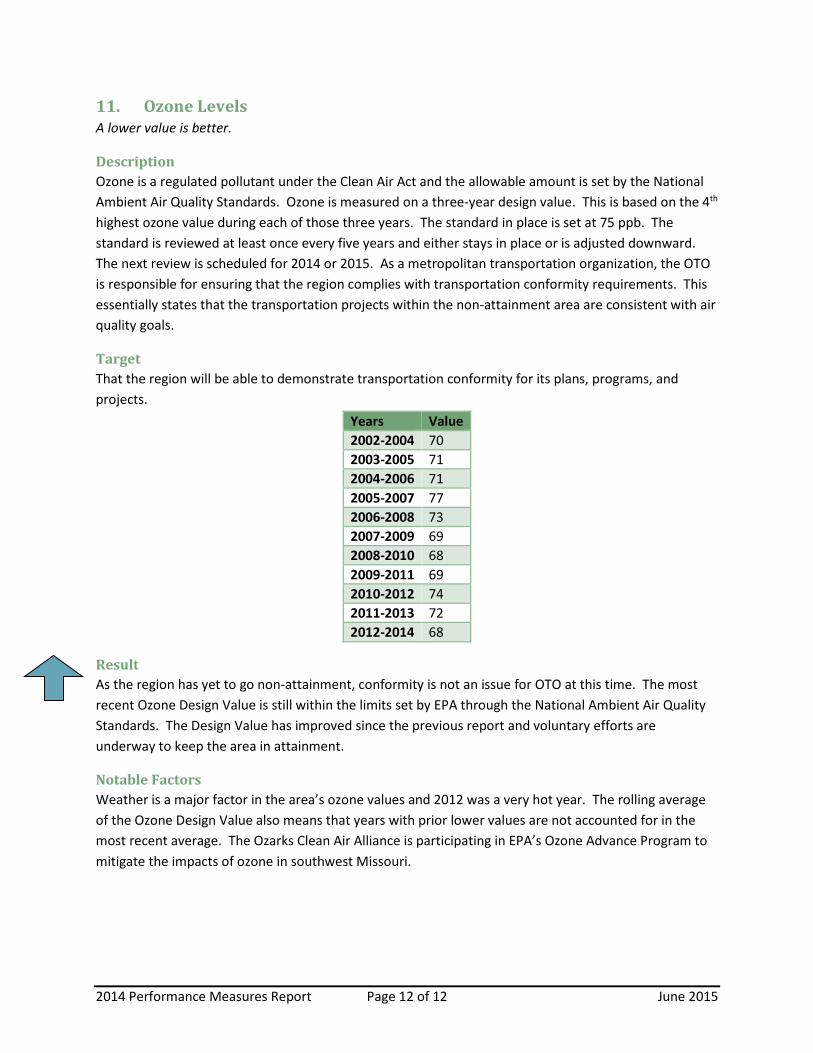
11. Ozone Levels A lower value is better.
Description Ozone is a regulated pollutant under the Clean Air Act and the allowable amount is set by the National Ambient Air Quality Standards. Ozone is measured on a three-year design value. This is based on the 4th highest ozone value during each of those three years. The standard in place is set at 75 ppb. The standard is reviewed at least once every five years and either stays in place or is adjusted downward. The next review is scheduled for 2014 or 2015. As a metropolitan transportation organization, the OTO is responsible for ensuring that the region complies with transportation conformity requirements. This essentially states that the transportation projects within the non-attainment area are consistent with air quality goals.
Target That the region will be able to demonstrate transportation conformity for its plans, programs, and projects.
Years Value 2002-2004 70 2003-2005 71 2004-2006 71 2005-2007 77 2006-2008 73 2007-2009 69 2008-2010 68 2009-2011 69 2010-2012 74 2011-2013 72 2012-2014 68
Result As the region has yet to go non-attainment, conformity is not an issue for OTO at this time. The most recent Ozone Design Value is still within the limits set by EPA through the National Ambient Air Quality Standards. The Design Value has improved since the previous report and voluntary efforts are underway to keep the area in attainment.
Notable Factors Weather is a major factor in the area’s ozone values and 2012 was a very hot year. The rolling average of the Ozone Design Value also means that years with prior lower values are not accounted for in the most recent average. The Ozarks Clean Air Alliance is participating in EPA’s Ozone Advance Program to mitigate the impacts of ozone in southwest Missouri.
2014 Performance Measures Report Page 12 of 12 June 2015
This report was prepared in cooperation with the USDOT, including FHWA and FTA, as well as the Missouri
Department of Transportation. The opinions, findings, and conclusions expressed in this are those of the authors and
not necessarily those of the Missouri Highways and Transportation Commission, the Federal Highway
Administration or the Federal Transit Administration.
Ozarks Transportation Organization 205 Park Central East, Suite 205
Springfield, MO 65806 (417) 865-3042
(417) 862-6013 Fax www.OzarksTransportation.org

TAB 9
BOARD OF DIRECTORS AGENDA 6/18/2015; ITEM II.G.
Financial Statements for the Third Quarter 2014‐2015 Budget Year
Ozarks Transportation Organization (Springfield, MO Area MPO)
AGENDA DESCRIPTION:
Included for consideration are the third quarter financial statements for the 2014‐2015 Budget Year. This period includes January 1, 2015 through March 31, 2015. The agenda packet is divided into two sections: the OTO Operational Financial Statements and the OTO UPWP Financial Statements. Section One – OTO Operational Financial Statements
Profit and Loss Statement The OTO completed the following budgeted projects for the third quarter: OTO Conference Room Monitors and 2 computer replacements – $4,203.14
Budget vs. Actual The OTO budgeted expenses in the amount of $780,973.00 for the budget year. Actual expenses at the end of the third quarter are $482,550.32. This is 61.8% percent of budgeted expenses. During this period, revenue exceeded expenses in the amount of $19,873.04.
Balance Sheet
Operating Fund Balance Report which shows a fund balance of $292,327.13. Section Two – OTO UPWP Financial Statements
UPWP Profit and Loss Statement, Budget vs. Actual, Balance Sheet The UPWP Financial statements have been included in this agenda so that board members can see the amount of in‐kind and MoDOT direct cost the OTO is utilizing as budgeted in the UPWP Budget. The In‐kind and MoDOT direct‐cost revenue and expense are shown in the UPWP Financial statements. The OTO UPWP budgeted expenses are $905,973.00 once the in‐kind expense is included.
Unified Planning Work Program Progress Report – 3rd Quarter This is the report that outlines the tasks and budget percentage completed in comparison to the OTO’s Unified Planning Work Program (the OTO’s grant budget).
The OTO was able to utilize $16,945.72 of in‐kind match income during the third quarter. Staff would like to thank all member jurisdictions and MoDOT for helping with the in‐kind match documentation. During this budget year, in‐kind match from meeting attendance and MoDOT Staff Direct Cost is allowing the OTO to have an effective federal reimbursement rate of 91.63 percent, whereas without the in‐kind match, OTO would only be reimbursed at the 80 percent rate.
BOARD OF DIRECTORS ACTION REQUESTED: That a member of the Board Directors makes one of the following motions: “Move to accept the OTO Operational Third Quarter Financial Statements for the 2014‐2015 Budget Year.” OR “Move to return to staff the OTO Operational Third Quarter Financial Statements for the 2014‐2015 Budget Year in order to…”
OTO Operational Financial
Reports
Excludes the In‐Kind Income/Expense
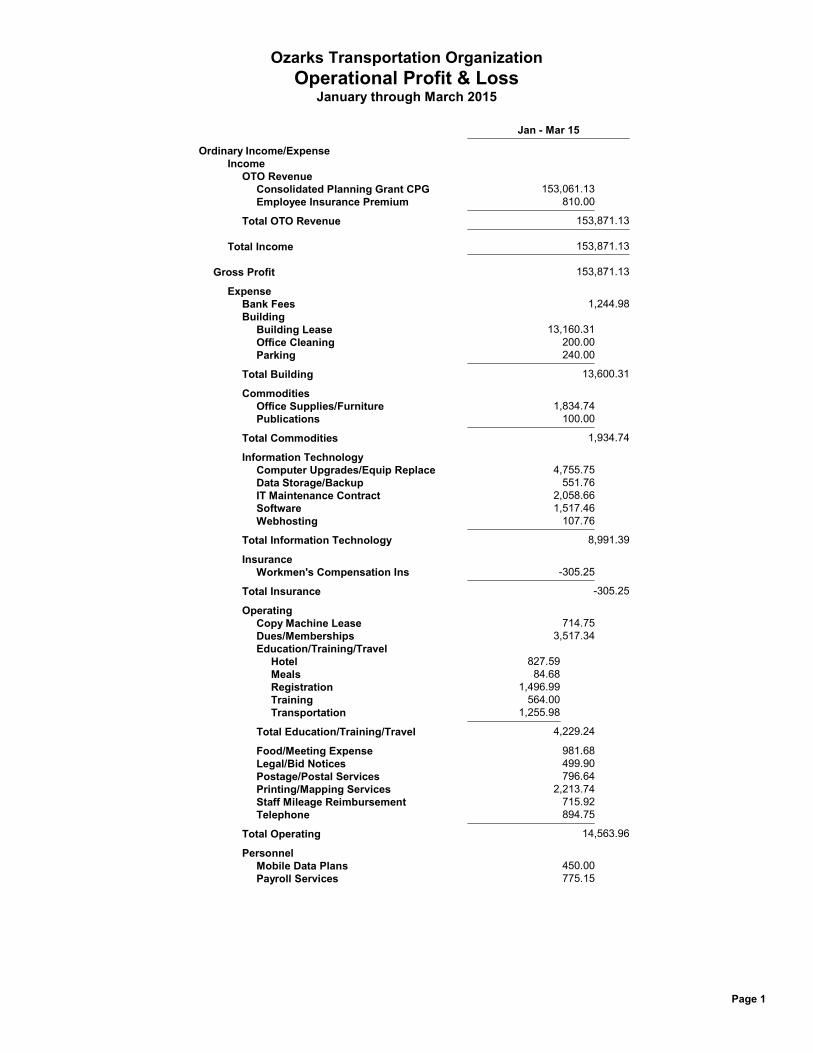
Jan - Mar 15
Ordinary Income/ExpenseIncome
OTO RevenueConsolidated Planning Grant CPG 153,061.13Employee Insurance Premium 810.00
Total OTO Revenue 153,871.13
Total Income 153,871.13
Gross Profit 153,871.13
ExpenseBank Fees 1,244.98Building
Building Lease 13,160.31Office Cleaning 200.00Parking 240.00
Total Building 13,600.31
CommoditiesOffice Supplies/Furniture 1,834.74Publications 100.00
Total Commodities 1,934.74
Information TechnologyComputer Upgrades/Equip Replace 4,755.75Data Storage/Backup 551.76IT Maintenance Contract 2,058.66Software 1,517.46Webhosting 107.76
Total Information Technology 8,991.39
InsuranceWorkmen's Compensation Ins -305.25
Total Insurance -305.25
OperatingCopy Machine Lease 714.75Dues/Memberships 3,517.34Education/Training/Travel
Hotel 827.59Meals 84.68Registration 1,496.99Training 564.00Transportation 1,255.98
Total Education/Training/Travel 4,229.24
Food/Meeting Expense 981.68Legal/Bid Notices 499.90Postage/Postal Services 796.64Printing/Mapping Services 2,213.74Staff Mileage Reimbursement 715.92Telephone 894.75
Total Operating 14,563.96
PersonnelMobile Data Plans 450.00Payroll Services 775.15
Ozarks Transportation OrganizationOperational Profit & Loss
January through March 2015
Page 1
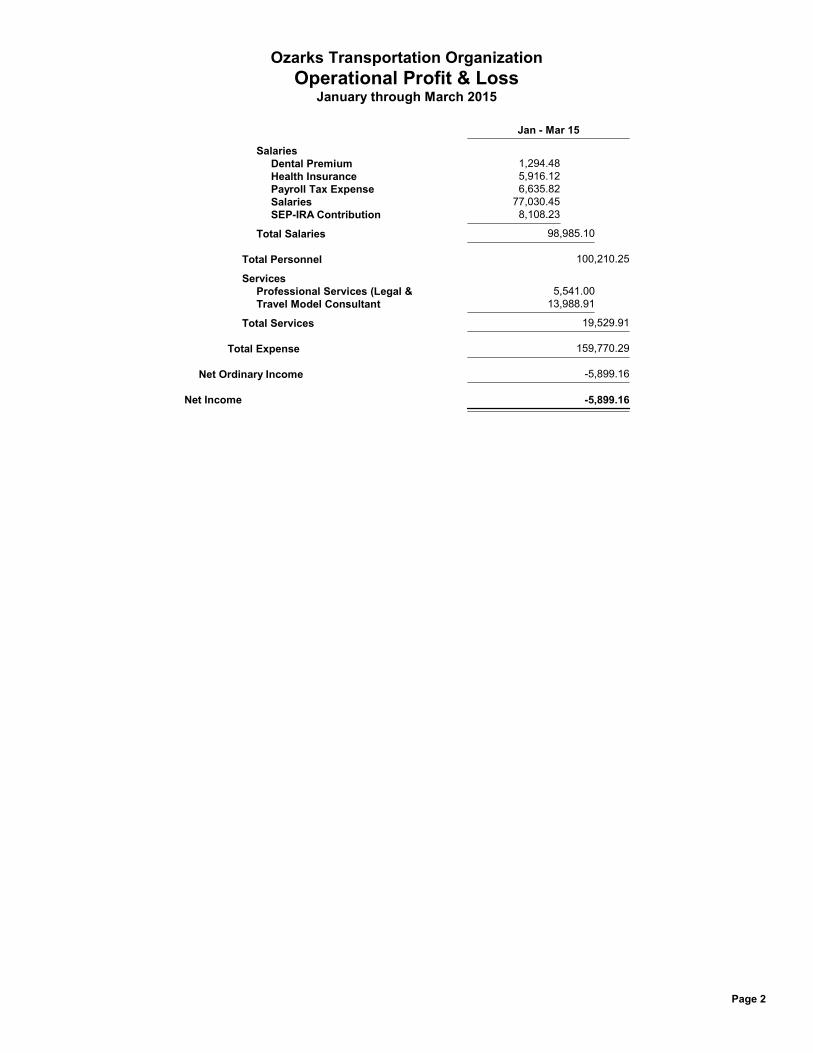
Jan - Mar 15
SalariesDental Premium 1,294.48Health Insurance 5,916.12Payroll Tax Expense 6,635.82Salaries 77,030.45SEP-IRA Contribution 8,108.23
Total Salaries 98,985.10
Total Personnel 100,210.25
ServicesProfessional Services (Legal & 5,541.00Travel Model Consultant 13,988.91
Total Services 19,529.91
Total Expense 159,770.29
Net Ordinary Income -5,899.16
Net Income -5,899.16
Ozarks Transportation OrganizationOperational Profit & Loss
January through March 2015
Page 2
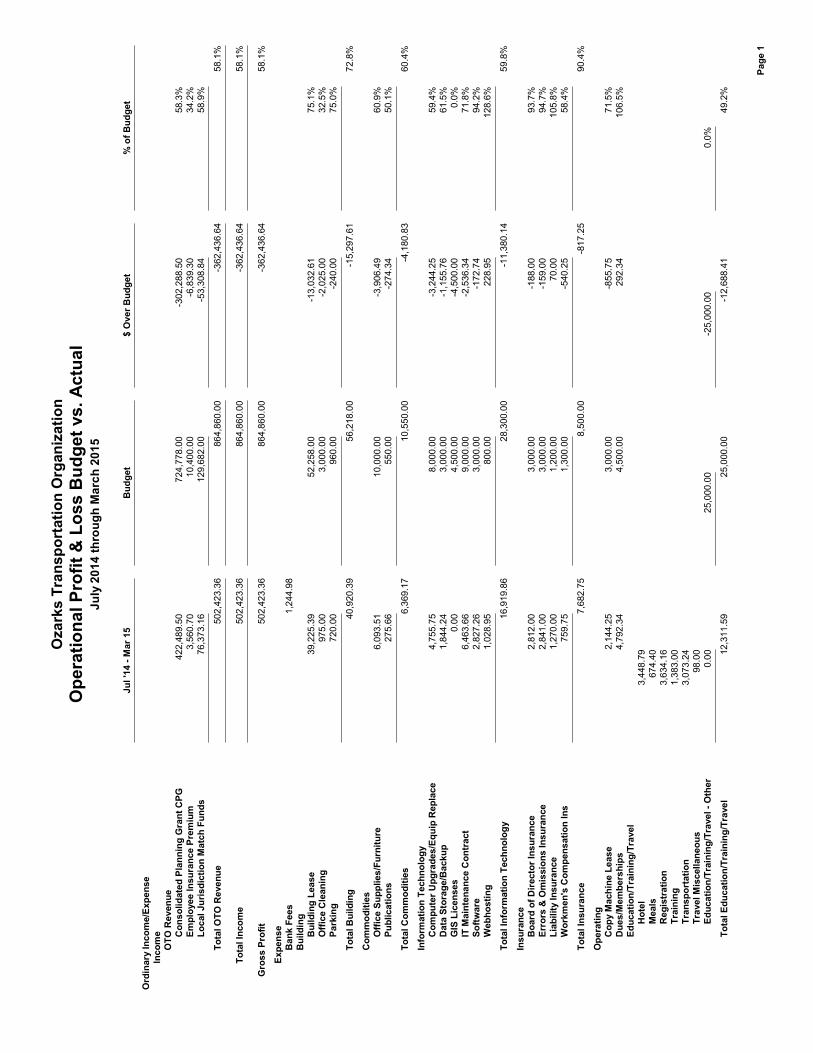
Jul '
14 -
Mar
15
Bud
get
$ O
ver B
udge
t%
of B
udge
t
Ord
inar
y In
com
e/Ex
pens
eIn
com
eO
TO R
even
ueC
onso
lidat
ed P
lann
ing
Gra
nt C
PG422,489.50
724,778.00
-302,288.50
58.3%
Empl
oyee
Insu
ranc
e Pr
emiu
m3,560.70
10,400.00
-6,839.30
34.2%
Loca
l Jur
isdi
ctio
n M
atch
Fun
ds76,373.16
129,682.00
-53,308.84
58.9%
Tota
l OTO
Rev
enue
502,423.36
864,860.00
-362,436.64
58.1%
Tota
l Inc
ome
502,423.36
864,860.00
-362,436.64
58.1%
Gro
ss P
rofit
502,423.36
864,860.00
-362,436.64
58.1%
Expe
nse
Ban
k Fe
es1,244.98
Bui
ldin
gB
uild
ing
Leas
e39,225.39
52,258.00
-13,032.61
75.1%
Offi
ce C
lean
ing
975.00
3,000.00
-2,025.00
32.5%
Park
ing
720.00
960.00
-240.00
75.0%
Tota
l Bui
ldin
g40,920.39
56,218.00
-15,297.61
72.8%
Com
mod
ities
Offi
ce S
uppl
ies/
Furn
iture
6,093.51
10,000.00
-3,906.49
60.9%
Publ
icat
ions
275.66
550.00
-274.34
50.1%
Tota
l Com
mod
ities
6,369.17
10,550.00
-4,180.83
60.4%
Info
rmat
ion
Tech
nolo
gyC
ompu
ter U
pgra
des/
Equi
p R
epla
ce4,755.75
8,000.00
-3,244.25
59.4%
Dat
a St
orag
e/B
acku
p1,844.24
3,000.00
-1,155.76
61.5%
GIS
Lic
ense
s0.00
4,500.00
-4,500.00
0.0%
IT M
aint
enan
ce C
ontr
act
6,463.66
9,000.00
-2,536.34
71.8%
Softw
are
2,827.26
3,000.00
-172.74
94.2%
Web
host
ing
1,028.95
800.00
228.95
128.6%
Tota
l Inf
orm
atio
n Te
chno
logy
16,919.86
28,300.00
-11,380.14
59.8%
Insu
ranc
eB
oard
of D
irect
or In
sura
nce
2,812.00
3,000.00
-188.00
93.7%
Erro
rs &
Om
issi
ons
Insu
ranc
e2,841.00
3,000.00
-159.00
94.7%
Liab
ility
Insu
ranc
e1,270.00
1,200.00
70.00
105.8%
Wor
kmen
's C
ompe
nsat
ion
Ins
759.75
1,300.00
-540.25
58.4%
Tota
l Ins
uran
ce7,682.75
8,500.00
-817.25
90.4%
Ope
ratin
gC
opy
Mac
hine
Lea
se2,144.25
3,000.00
-855.75
71.5%
Due
s/M
embe
rshi
ps4,792.34
4,500.00
292.34
106.5%
Educ
atio
n/Tr
aini
ng/T
rave
lH
otel
3,448.79
Mea
ls674.40
Reg
istr
atio
n3,634.16
Trai
ning
1,383.00
Tran
spor
tatio
n3,073.24
Trav
el M
isce
llane
ous
98.00
Educ
atio
n/Tr
aini
ng/T
rave
l - O
ther
0.00
25,000.00
-25,000.00
0.0%
Tota
l Edu
catio
n/Tr
aini
ng/T
rave
l12,311.59
25,000.00
-12,688.41
49.2%
Oza
rks
Tran
spor
tatio
n O
rgan
izat
ion
Ope
ratio
nal P
rofit
& L
oss
Bud
get v
s. A
ctua
lJu
ly 2
014
thro
ugh
Mar
ch 2
015
Page
1
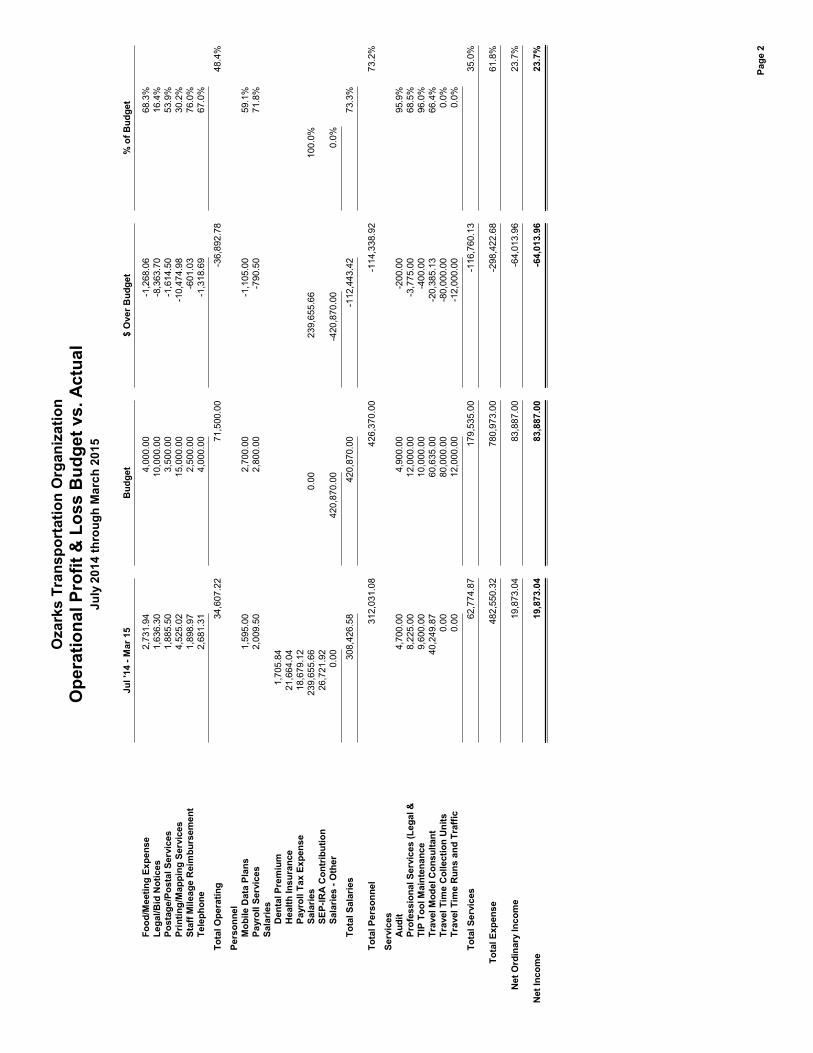
Jul '
14 -
Mar
15
Bud
get
$ O
ver B
udge
t%
of B
udge
t
Food
/Mee
ting
Expe
nse
2,731.94
4,000.00
-1,268.06
68.3%
Lega
l/Bid
Not
ices
1,636.30
10,000.00
-8,363.70
16.4%
Post
age/
Post
al S
ervi
ces
1,885.50
3,500.00
-1,614.50
53.9%
Prin
ting/
Map
ping
Ser
vice
s4,525.02
15,000.00
-10,474.98
30.2%
Staf
f Mile
age
Rei
mbu
rsem
ent
1,898.97
2,500.00
-601.03
76.0%
Tele
phon
e2,681.31
4,000.00
-1,318.69
67.0%
Tota
l Ope
ratin
g34,607.22
71,500.00
-36,892.78
48.4%
Pers
onne
lM
obile
Dat
a Pl
ans
1,595.00
2,700.00
-1,105.00
59.1%
Payr
oll S
ervi
ces
2,009.50
2,800.00
-790.50
71.8%
Sala
ries
Den
tal P
rem
ium
1,705.84
Hea
lth In
sura
nce
21,664.04
Payr
oll T
ax E
xpen
se18,679.12
Sala
ries
239,655.66
0.00
239,655.66
100.0%
SEP-
IRA
Con
trib
utio
n26,721.92
Sala
ries
- Oth
er0.00
420,870.00
-420,870.00
0.0%
Tota
l Sal
arie
s308,426.58
420,870.00
-112,443.42
73.3%
Tota
l Per
sonn
el312,031.08
426,370.00
-114,338.92
73.2%
Serv
ices
Aud
it4,700.00
4,900.00
-200.00
95.9%
Prof
essi
onal
Ser
vice
s (L
egal
&8,225.00
12,000.00
-3,775.00
68.5%
TIP
Tool
Mai
nten
ance
9,600.00
10,000.00
-400.00
96.0%
Trav
el M
odel
Con
sulta
nt40,249.87
60,635.00
-20,385.13
66.4%
Trav
el T
ime
Col
lect
ion
Uni
ts0.00
80,000.00
-80,000.00
0.0%
Trav
el T
ime
Run
s an
d Tr
affic
0.00
12,000.00
-12,000.00
0.0%
Tota
l Ser
vice
s62,774.87
179,535.00
-116,760.13
35.0%
Tota
l Exp
ense
482,550.32
780,973.00
-298,422.68
61.8%
Net
Ord
inar
y In
com
e19,873.04
83,887.00
-64,013.96
23.7%
Net
Inco
me
19,8
73.0
483
,887
.00
-64,
013.
9623
.7%
Oza
rks
Tran
spor
tatio
n O
rgan
izat
ion
Ope
ratio
nal P
rofit
& L
oss
Bud
get v
s. A
ctua
lJu
ly 2
014
thro
ugh
Mar
ch 2
015
Page
2
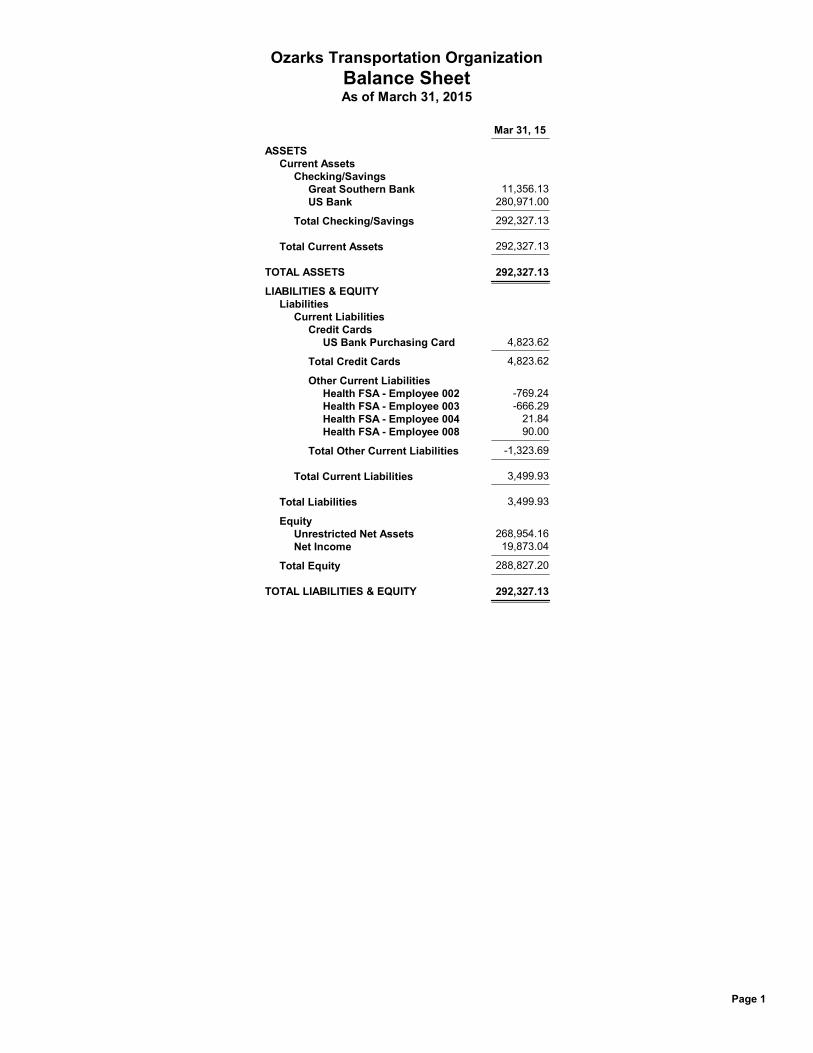
Mar 31, 15
ASSETSCurrent Assets
Checking/SavingsGreat Southern Bank 11,356.13US Bank 280,971.00
Total Checking/Savings 292,327.13
Total Current Assets 292,327.13
TOTAL ASSETS 292,327.13
LIABILITIES & EQUITYLiabilities
Current LiabilitiesCredit Cards
US Bank Purchasing Card 4,823.62
Total Credit Cards 4,823.62
Other Current LiabilitiesHealth FSA - Employee 002 -769.24Health FSA - Employee 003 -666.29Health FSA - Employee 004 21.84Health FSA - Employee 008 90.00
Total Other Current Liabilities -1,323.69
Total Current Liabilities 3,499.93
Total Liabilities 3,499.93
EquityUnrestricted Net Assets 268,954.16Net Income 19,873.04
Total Equity 288,827.20
TOTAL LIABILITIES & EQUITY 292,327.13
Ozarks Transportation OrganizationBalance SheetAs of March 31, 2015
Page 1
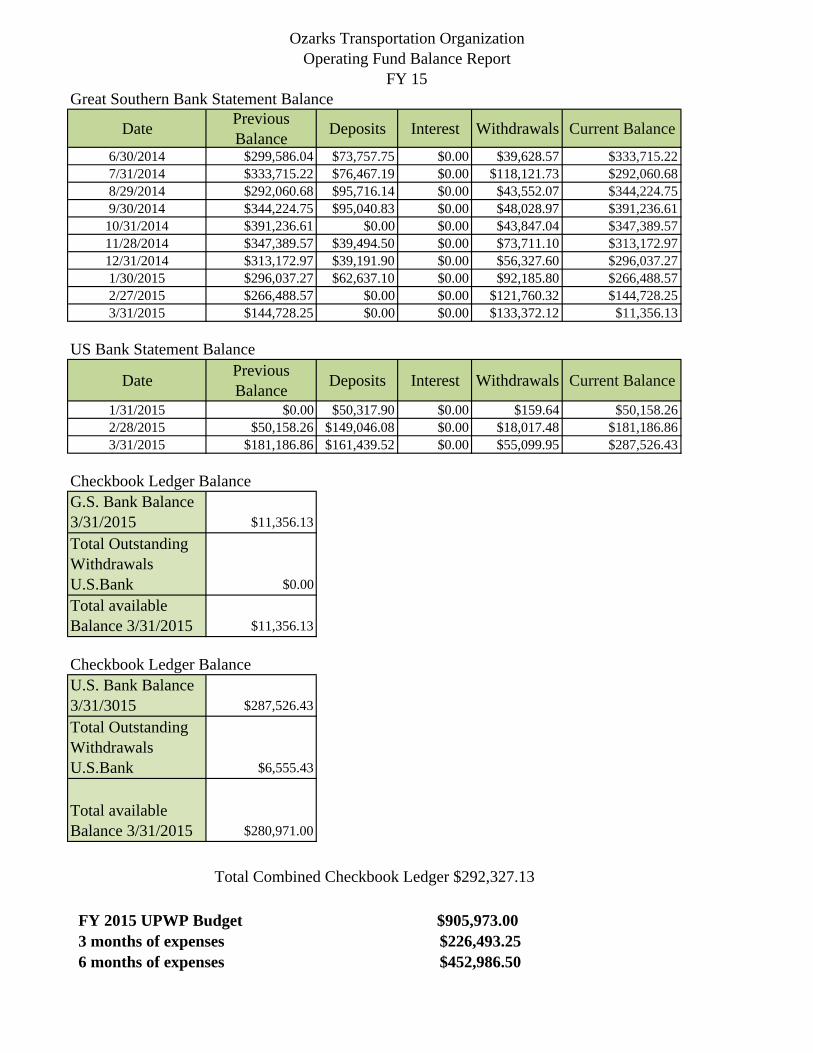
Ozarks Transportation OrganizationOperating Fund Balance Report
FY 15Great Southern Bank Statement Balance
Date Previous Balance Deposits Interest Withdrawals Current Balance
6/30/2014 $299,586.04 $73,757.75 $0.00 $39,628.57 $333,715.227/31/2014 $333,715.22 $76,467.19 $0.00 $118,121.73 $292,060.688/29/2014 $292,060.68 $95,716.14 $0.00 $43,552.07 $344,224.759/30/2014 $344,224.75 $95,040.83 $0.00 $48,028.97 $391,236.61
10/31/2014 $391,236.61 $0.00 $0.00 $43,847.04 $347,389.5711/28/2014 $347,389.57 $39,494.50 $0.00 $73,711.10 $313,172.9712/31/2014 $313,172.97 $39,191.90 $0.00 $56,327.60 $296,037.271/30/2015 $296,037.27 $62,637.10 $0.00 $92,185.80 $266,488.572/27/2015 $266,488.57 $0.00 $0.00 $121,760.32 $144,728.253/31/2015 $144,728.25 $0.00 $0.00 $133,372.12 $11,356.13
US Bank Statement Balance
Date Previous Balance Deposits Interest Withdrawals Current Balance
1/31/2015 $0.00 $50,317.90 $0.00 $159.64 $50,158.262/28/2015 $50,158.26 $149,046.08 $0.00 $18,017.48 $181,186.863/31/2015 $181,186.86 $161,439.52 $0.00 $55,099.95 $287,526.43
Checkbook Ledger BalanceG.S. Bank Balance 3/31/2015 $11,356.13Total Outstanding Withdrawals U.S.Bank $0.00Total available Balance 3/31/2015 $11,356.13
Checkbook Ledger BalanceU.S. Bank Balance 3/31/3015 $287,526.43Total Outstanding Withdrawals U.S.Bank $6,555.43
Total available Balance 3/31/2015 $280,971.00
FY 2015 UPWP Budget 3 months of expenses 6 months of expenses
$905,973.00$226,493.25$452,986.50
Total Combined Checkbook Ledger $292,327.13
OTO UPWP Financial
Reports
Same as OTO Operational Financial Reports but includes In‐Kind Income/Expense to
match Unified Planning Work Program (OTO Consolidated Planning Grant) Budget.
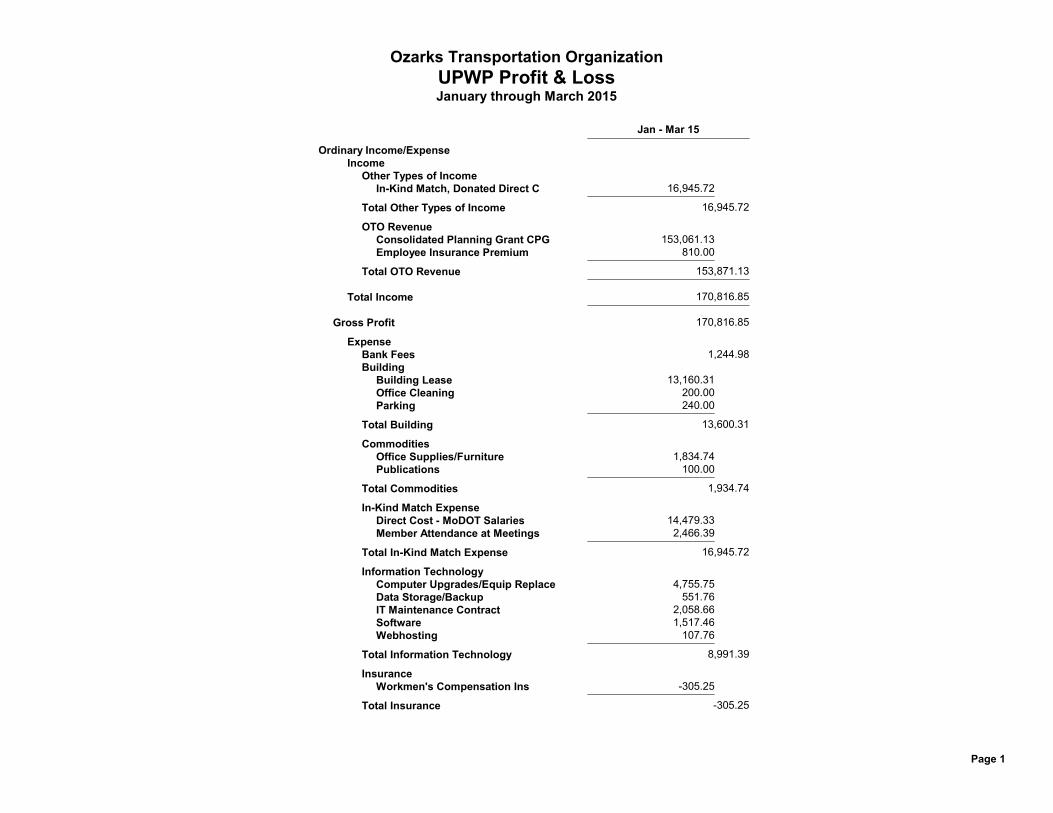
Jan - Mar 15
Ordinary Income/ExpenseIncome
Other Types of IncomeIn-Kind Match, Donated Direct C 16,945.72
Total Other Types of Income 16,945.72
OTO RevenueConsolidated Planning Grant CPG 153,061.13Employee Insurance Premium 810.00
Total OTO Revenue 153,871.13
Total Income 170,816.85
Gross Profit 170,816.85
ExpenseBank Fees 1,244.98Building
Building Lease 13,160.31Office Cleaning 200.00Parking 240.00
Total Building 13,600.31
CommoditiesOffice Supplies/Furniture 1,834.74Publications 100.00
Total Commodities 1,934.74
In-Kind Match ExpenseDirect Cost - MoDOT Salaries 14,479.33Member Attendance at Meetings 2,466.39
Total In-Kind Match Expense 16,945.72
Information TechnologyComputer Upgrades/Equip Replace 4,755.75Data Storage/Backup 551.76IT Maintenance Contract 2,058.66Software 1,517.46Webhosting 107.76
Total Information Technology 8,991.39
InsuranceWorkmen's Compensation Ins -305.25
Total Insurance -305.25
Ozarks Transportation OrganizationUPWP Profit & LossJanuary through March 2015
Page 1
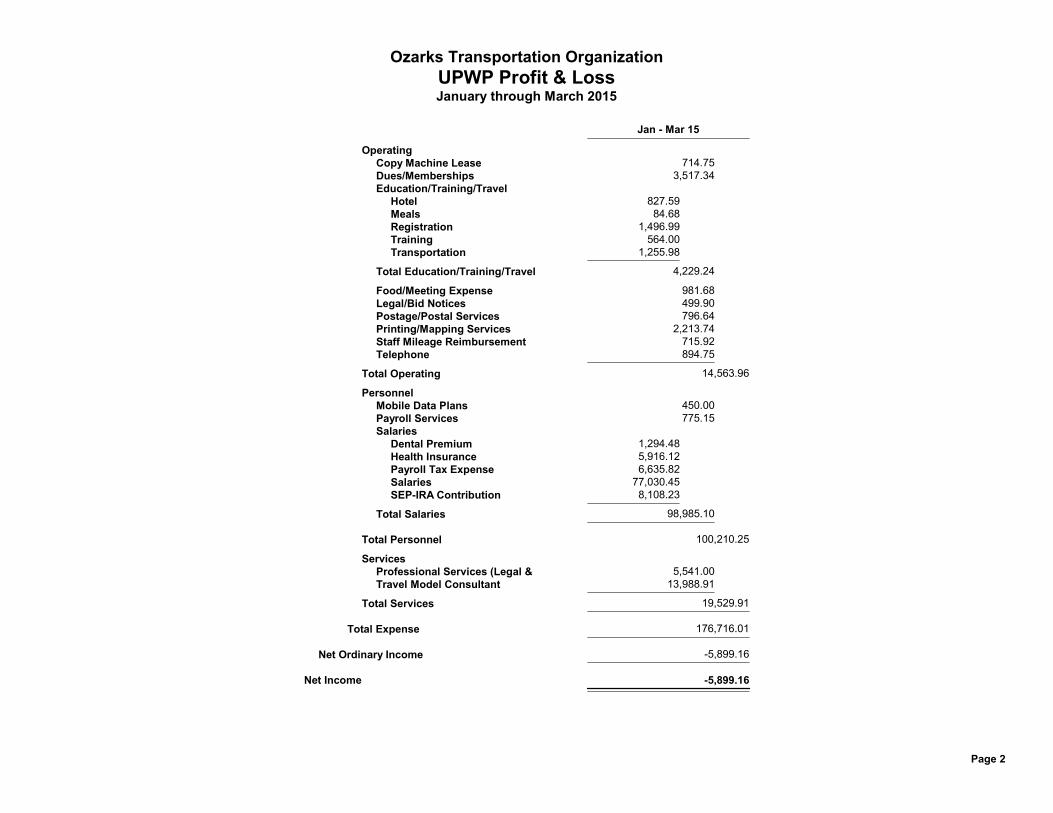
Jan - Mar 15
OperatingCopy Machine Lease 714.75Dues/Memberships 3,517.34Education/Training/Travel
Hotel 827.59Meals 84.68Registration 1,496.99Training 564.00Transportation 1,255.98
Total Education/Training/Travel 4,229.24
Food/Meeting Expense 981.68Legal/Bid Notices 499.90Postage/Postal Services 796.64Printing/Mapping Services 2,213.74Staff Mileage Reimbursement 715.92Telephone 894.75
Total Operating 14,563.96
PersonnelMobile Data Plans 450.00Payroll Services 775.15Salaries
Dental Premium 1,294.48Health Insurance 5,916.12Payroll Tax Expense 6,635.82Salaries 77,030.45SEP-IRA Contribution 8,108.23
Total Salaries 98,985.10
Total Personnel 100,210.25
ServicesProfessional Services (Legal & 5,541.00Travel Model Consultant 13,988.91
Total Services 19,529.91
Total Expense 176,716.01
Net Ordinary Income -5,899.16
Net Income -5,899.16
Ozarks Transportation OrganizationUPWP Profit & LossJanuary through March 2015
Page 2
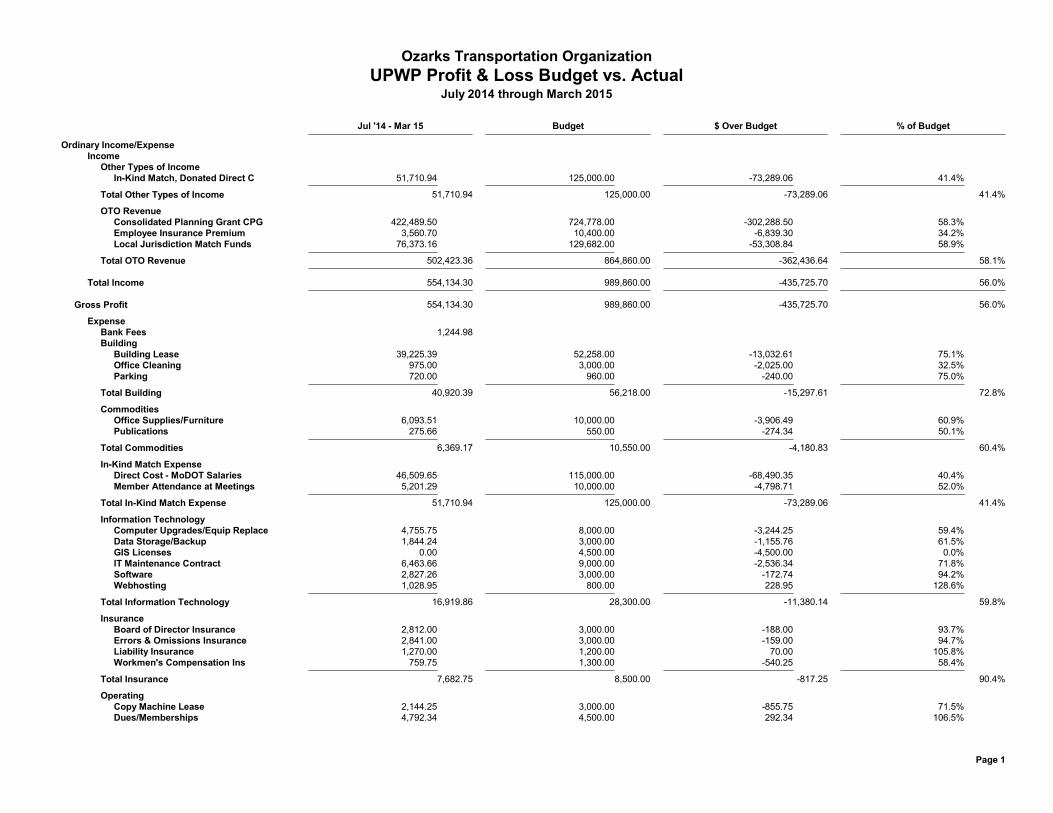
Jul '14 - Mar 15 Budget $ Over Budget % of Budget
Ordinary Income/ExpenseIncome
Other Types of IncomeIn-Kind Match, Donated Direct C 51,710.94 125,000.00 -73,289.06 41.4%
Total Other Types of Income 51,710.94 125,000.00 -73,289.06 41.4%
OTO RevenueConsolidated Planning Grant CPG 422,489.50 724,778.00 -302,288.50 58.3%Employee Insurance Premium 3,560.70 10,400.00 -6,839.30 34.2%Local Jurisdiction Match Funds 76,373.16 129,682.00 -53,308.84 58.9%
Total OTO Revenue 502,423.36 864,860.00 -362,436.64 58.1%
Total Income 554,134.30 989,860.00 -435,725.70 56.0%
Gross Profit 554,134.30 989,860.00 -435,725.70 56.0%
ExpenseBank Fees 1,244.98Building
Building Lease 39,225.39 52,258.00 -13,032.61 75.1%Office Cleaning 975.00 3,000.00 -2,025.00 32.5%Parking 720.00 960.00 -240.00 75.0%
Total Building 40,920.39 56,218.00 -15,297.61 72.8%
CommoditiesOffice Supplies/Furniture 6,093.51 10,000.00 -3,906.49 60.9%Publications 275.66 550.00 -274.34 50.1%
Total Commodities 6,369.17 10,550.00 -4,180.83 60.4%
In-Kind Match ExpenseDirect Cost - MoDOT Salaries 46,509.65 115,000.00 -68,490.35 40.4%Member Attendance at Meetings 5,201.29 10,000.00 -4,798.71 52.0%
Total In-Kind Match Expense 51,710.94 125,000.00 -73,289.06 41.4%
Information TechnologyComputer Upgrades/Equip Replace 4,755.75 8,000.00 -3,244.25 59.4%Data Storage/Backup 1,844.24 3,000.00 -1,155.76 61.5%GIS Licenses 0.00 4,500.00 -4,500.00 0.0%IT Maintenance Contract 6,463.66 9,000.00 -2,536.34 71.8%Software 2,827.26 3,000.00 -172.74 94.2%Webhosting 1,028.95 800.00 228.95 128.6%
Total Information Technology 16,919.86 28,300.00 -11,380.14 59.8%
InsuranceBoard of Director Insurance 2,812.00 3,000.00 -188.00 93.7%Errors & Omissions Insurance 2,841.00 3,000.00 -159.00 94.7%Liability Insurance 1,270.00 1,200.00 70.00 105.8%Workmen's Compensation Ins 759.75 1,300.00 -540.25 58.4%
Total Insurance 7,682.75 8,500.00 -817.25 90.4%
OperatingCopy Machine Lease 2,144.25 3,000.00 -855.75 71.5%Dues/Memberships 4,792.34 4,500.00 292.34 106.5%
Ozarks Transportation OrganizationUPWP Profit & Loss Budget vs. Actual
July 2014 through March 2015
Page 1
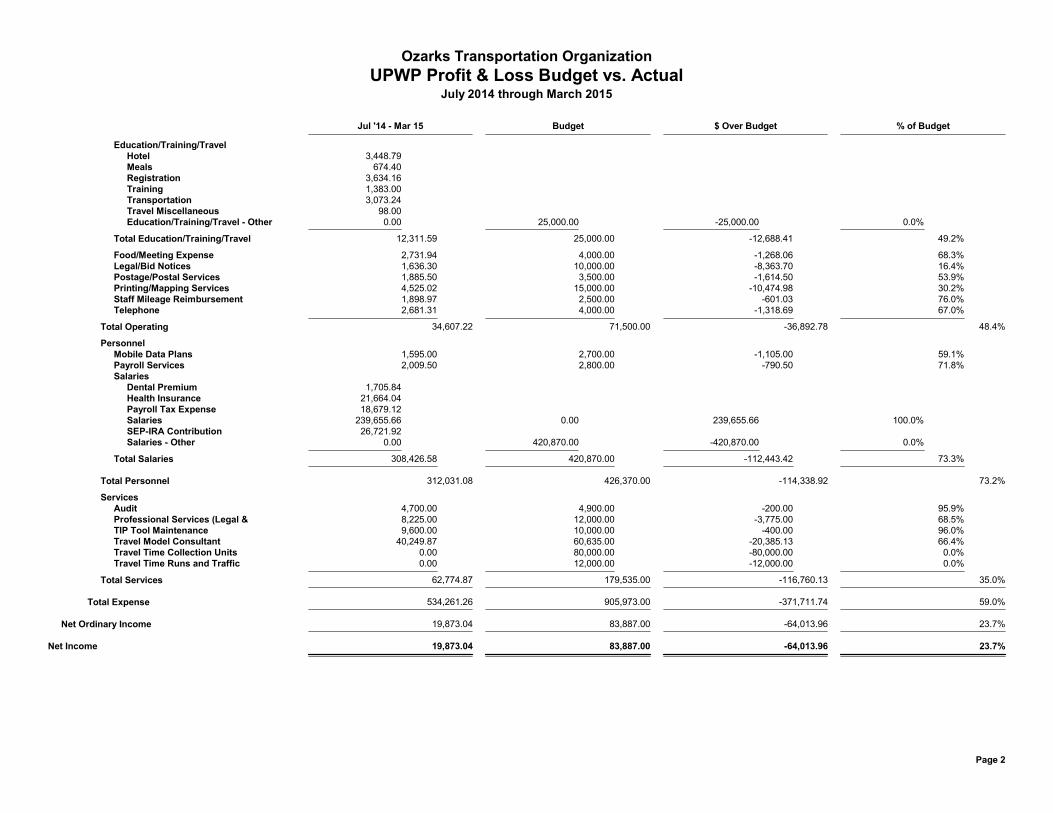
Jul '14 - Mar 15 Budget $ Over Budget % of Budget
Education/Training/TravelHotel 3,448.79Meals 674.40Registration 3,634.16Training 1,383.00Transportation 3,073.24Travel Miscellaneous 98.00Education/Training/Travel - Other 0.00 25,000.00 -25,000.00 0.0%
Total Education/Training/Travel 12,311.59 25,000.00 -12,688.41 49.2%
Food/Meeting Expense 2,731.94 4,000.00 -1,268.06 68.3%Legal/Bid Notices 1,636.30 10,000.00 -8,363.70 16.4%Postage/Postal Services 1,885.50 3,500.00 -1,614.50 53.9%Printing/Mapping Services 4,525.02 15,000.00 -10,474.98 30.2%Staff Mileage Reimbursement 1,898.97 2,500.00 -601.03 76.0%Telephone 2,681.31 4,000.00 -1,318.69 67.0%
Total Operating 34,607.22 71,500.00 -36,892.78 48.4%
PersonnelMobile Data Plans 1,595.00 2,700.00 -1,105.00 59.1%Payroll Services 2,009.50 2,800.00 -790.50 71.8%Salaries
Dental Premium 1,705.84Health Insurance 21,664.04Payroll Tax Expense 18,679.12Salaries 239,655.66 0.00 239,655.66 100.0%SEP-IRA Contribution 26,721.92Salaries - Other 0.00 420,870.00 -420,870.00 0.0%
Total Salaries 308,426.58 420,870.00 -112,443.42 73.3%
Total Personnel 312,031.08 426,370.00 -114,338.92 73.2%
ServicesAudit 4,700.00 4,900.00 -200.00 95.9%Professional Services (Legal & 8,225.00 12,000.00 -3,775.00 68.5%TIP Tool Maintenance 9,600.00 10,000.00 -400.00 96.0%Travel Model Consultant 40,249.87 60,635.00 -20,385.13 66.4%Travel Time Collection Units 0.00 80,000.00 -80,000.00 0.0%Travel Time Runs and Traffic 0.00 12,000.00 -12,000.00 0.0%
Total Services 62,774.87 179,535.00 -116,760.13 35.0%
Total Expense 534,261.26 905,973.00 -371,711.74 59.0%
Net Ordinary Income 19,873.04 83,887.00 -64,013.96 23.7%
Net Income 19,873.04 83,887.00 -64,013.96 23.7%
Ozarks Transportation OrganizationUPWP Profit & Loss Budget vs. Actual
July 2014 through March 2015
Page 2
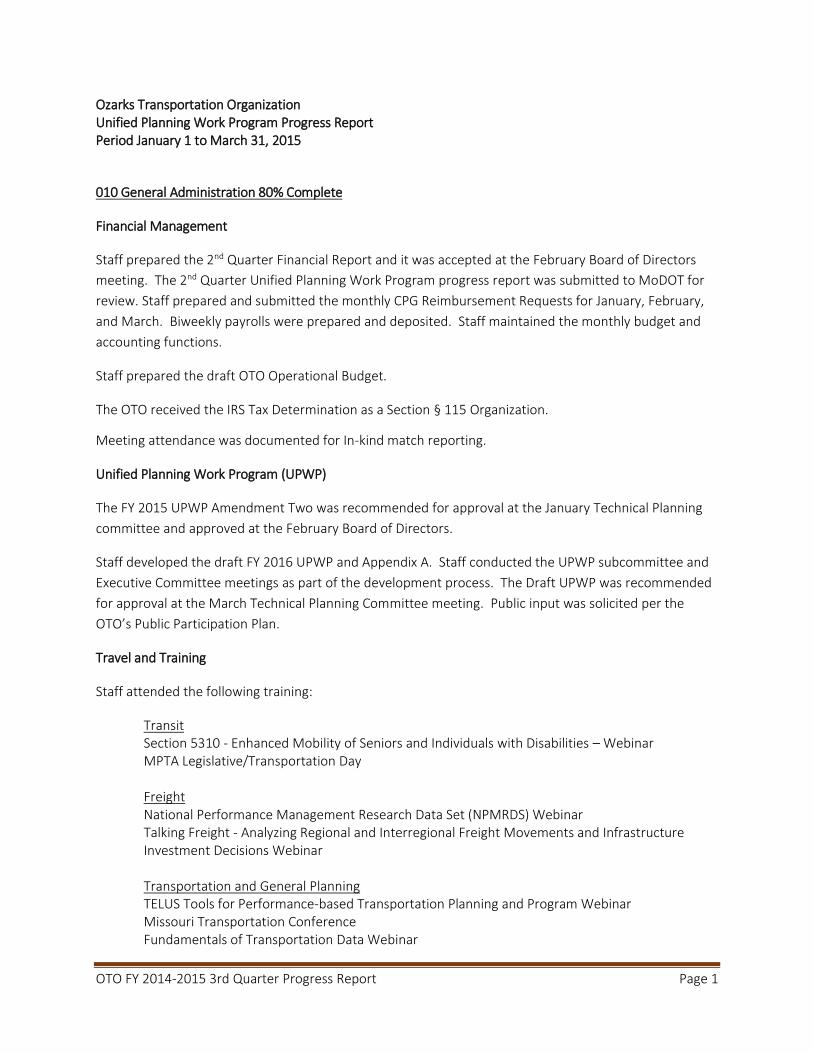
OTO FY 2014-2015 3rd Quarter Progress Report Page 1
Ozarks Transportation Organization Unified Planning Work Program Progress Report Period January 1 to March 31, 2015
010 General Administration 80% Complete
Financial Management
Staff prepared the 2nd Quarter Financial Report and it was accepted at the February Board of Directors
meeting. The 2nd Quarter Unified Planning Work Program progress report was submitted to MoDOT for
review. Staff prepared and submitted the monthly CPG Reimbursement Requests for January, February,
and March. Biweekly payrolls were prepared and deposited. Staff maintained the monthly budget and
accounting functions.
Staff prepared the draft OTO Operational Budget.
The OTO received the IRS Tax Determination as a Section § 115 Organization.
Meeting attendance was documented for In-kind match reporting.
Unified Planning Work Program (UPWP)
The FY 2015 UPWP Amendment Two was recommended for approval at the January Technical Planning
committee and approved at the February Board of Directors.
Staff developed the draft FY 2016 UPWP and Appendix A. Staff conducted the UPWP subcommittee and
Executive Committee meetings as part of the development process. The Draft UPWP was recommended
for approval at the March Technical Planning Committee meeting. Public input was solicited per the
OTO’s Public Participation Plan.
Travel and Training
Staff attended the following training:
Transit Section 5310 - Enhanced Mobility of Seniors and Individuals with Disabilities – Webinar MPTA Legislative/Transportation Day
Freight National Performance Management Research Data Set (NPMRDS) Webinar Talking Freight - Analyzing Regional and Interregional Freight Movements and Infrastructure Investment Decisions Webinar Transportation and General Planning TELUS Tools for Performance-based Transportation Planning and Program Webinar Missouri Transportation Conference Fundamentals of Transportation Data Webinar
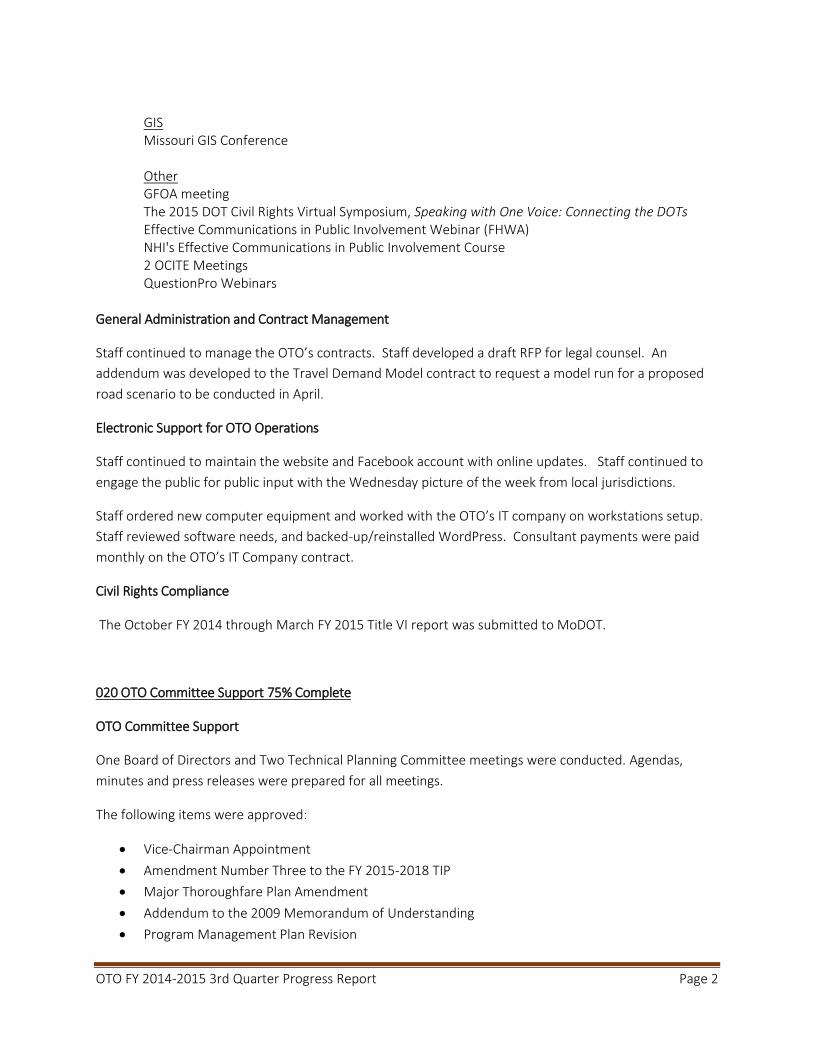
OTO FY 2014-2015 3rd Quarter Progress Report Page 2
GIS Missouri GIS Conference Other GFOA meeting The 2015 DOT Civil Rights Virtual Symposium, Speaking with One Voice: Connecting the DOTs Effective Communications in Public Involvement Webinar (FHWA) NHI's Effective Communications in Public Involvement Course 2 OCITE Meetings QuestionPro Webinars
General Administration and Contract Management
Staff continued to manage the OTO’s contracts. Staff developed a draft RFP for legal counsel. An
addendum was developed to the Travel Demand Model contract to request a model run for a proposed
road scenario to be conducted in April.
Electronic Support for OTO Operations
Staff continued to maintain the website and Facebook account with online updates. Staff continued to
engage the public for public input with the Wednesday picture of the week from local jurisdictions.
Staff ordered new computer equipment and worked with the OTO’s IT company on workstations setup.
Staff reviewed software needs, and backed-up/reinstalled WordPress. Consultant payments were paid
monthly on the OTO’s IT Company contract.
Civil Rights Compliance
The October FY 2014 through March FY 2015 Title VI report was submitted to MoDOT.
020 OTO Committee Support 75% Complete
OTO Committee Support
One Board of Directors and Two Technical Planning Committee meetings were conducted. Agendas,
minutes and press releases were prepared for all meetings.
The following items were approved:
Vice-Chairman Appointment
Amendment Number Three to the FY 2015-2018 TIP
Major Thoroughfare Plan Amendment
Addendum to the 2009 Memorandum of Understanding
Program Management Plan Revision
OTO FY 2014-2015 3rd Quarter Progress Report Page 3
FY 2015 UPWP Amendment Two
FY 2015 2nd Quarter Financial Statements
Comment Letter on EPA Ozone Standards
The following items were reviewed:
Reasonable Progress Policy Enforcement
Administrative Modification 3 to the FY 2015-2018 TIP
Amendment Number Four to the FY 2015-2018 TIP
Public Participation Plan Amendment
OTO Growth Trends Report
Draft FY 2016 Unified Planning Work Program
The OTO Executive Committee met in February and March to review the OTO budget and UPWP in
advance of the Board of Directors meeting. The Executive Committee also drafted and reviewed a Bylaw
Amendment.
Staff conducted a Board Member Orientation for new Board members in February.
One BPAC Meeting was held in March, at which the Bike/Ped Safety Education Plan was reviewed, as well
as the implementation needs for OTO’s priority trails.
Community Committee participation
Staff participated on various community committees including the Ozarks Clean Air Alliance, Blueprint for
Safety, the Springfield-Greene County Integrated Plan for the Environment Task Force, the Southwest
Missouri Council of Governments, Springfield Traffic Advisory Board Bike/Ped Committee, and Ozarks
Greenways and associated committees. In addition, staff participated on the Nixa Community School
Implementation Plan Subcommittee. Work with the Ozark Greenways STAR Team included the
development of a Bicycle Friendly Business program that the committee and Ozark Greenways can use to
encourage bicycling in the region.
Staff attended the MoDOT Planning Partners Meeting in February and prepared/presented on OTO’s
online TIP Tool. Staff also participated in conference calls with planning partners regarding the 325 plan
and Senate Bill 540.
OTO Policy and Administrative Documents
Staff developed a draft Bylaw amendment that was recommended for approval at the March Technical
Planning Committee.
Public Involvement
Staff completed the redesign of the giveusyourinput.org public input website in February. Staff continued
to publish press releases and receive public comment. Staff worked on maintain the records in
OTO FY 2014-2015 3rd Quarter Progress Report Page 4
accordance with the Sunshine Law and State of Missouri Records Retention. Work was done on Public
Participation Plan Evaluation. Staff prepared for and attended several expos to gather public input for the
Long Range Transportation Plan.
OTO joined the Nixa, Ozark, and Republic Chambers of Commerce in order to gain additional participation
for plans and make contacts.
Members Attendance at OTO Meetings
New forms were distributed for In-kind Rate and Members Jurisdiction Representatives at the January
Technical Planning Committee and February Board of Directors meetings. Sign-in sheets were distributed
at every meeting for In-kind tracking.
030 OTO General Planning and Plan Implementation 75% Complete
OTO Long-Range Transportation Plan, Journey 2035
Staff developed a final report and completed invoicing on the Travel Demand Model. Staff began
gathering public involvement for the LRTP. This included developing a survey in both English and Spanish,
and the promotion of the survey to gather input. The survey was distributed online as well as through
several live events in the Springfield area, including the Republic, Ozark, and Nixa Business Expos and the
Ozark Greenways Annual Meeting.
As part of the LRTP, the Major Thoroughfare Plan Subcommittee met to discuss existing classifications
and design standards. Staff also began preparing to meet with communities on a local level to review the
MTP in more detail.
One major thoroughfare plan was processed and approved, along with the solicitation of public
comment.
Congestion Management Process Implementation
One quarterly meeting of the CMP was held, at which coordination with the LRTP was discussed. Staff
worked on CMP Statistics.
Bicycle and Pedestrian Plan Implementation
Staff met with the City of Springfield and the Springfield-Greene County Health Department to work on
the FHWA Walk-Friendly Community Program Application.
Staff wrote an article for inclusion in a local magazine – Ozarks Living – on recent TAP awards and bicycle
safety.
OTO FY 2014-2015 3rd Quarter Progress Report Page 5
Geographic Information Systems (GIS)
Staff continued the work on the Interactive TIP Map and Interactive OTO Base map.
Developed Aerial Highway Change maps for OTO presentations.
MTP maps were developed for the MTP subcommittee meetings.
2014 Growth Trends map were developed and 2015 Growth Trends Geocoding Permits were analyzed.
Analysis regarding the impact of the MoDOT 325 plan was completed.
Maps showing Aerial Highway Changes were created.
CMP Statistics were produced.
MTP maps for Sub-committee meetings were created.
Air Quality Planning
Staff worked with the OCAA to host a retreat and regular monthly meetings to establish a work program
for the year and to meet the objectives of the Ozone and PM Path Forward documents.
Staff submitted comments to EPA regarding the proposed Ozone standard, both from OTO and the
Ozarks Clean Air Alliance.
Demographics and Future Projections
Staff developed and presented the 2014 Growth Trends Report. Work begun on the 2015 Growth Trends
Geocoding permits.
Performance Measures
Staff started collecting information for calendar year 2014 Performance Measure Inputs. GIS support
was done with sidewalk updates. Staff is participating in statewide and multistate conference calls
regarding the implementation of performance measures.
Mapping and Graphics Support for OTO Operations
Staff developed a zoning map for Willard and updated OTO’s mapping of Willard land use.
Travel Time Collection Units
Staff provided input to MoDOT and the City of Springfield on the RFP developed for the travel time units.
OTO FY 2014-2015 3rd Quarter Progress Report Page 6
040 Transportation Improvement Program 65% Complete
TIP Amendments
Two administrative modifications were processed, one TIP amendment was posted online, another was
completed and a third was prepared for Board of Directors approval.
A request for project change on prior awarded TAP funding was reviewed and granted.
Transportation Alternative Project applications scored in January by committee. Staff took these through
the Approval and TIP amendment process and developed a reasonable progress schedule for awardees.
Federal Funds Tracking
Staff continued to monitor OTO fund balances as they are supplied monthly, and prepared a funds
balance report which included future outlays per projects programmed in the TIP.
Online TIP Tool
Staff developed an online TIP Amendment form for communities to request amendments to the TIP.
050 Transportation Demand Management 70% Complete
Coordinate Employer Outreach Activities
Staff responded and met with a major employer about the employer-based program.
Collect and Analyze Data to Determine Potential Demand
Work was done on the Transportation Demand Report.
060 OTO and City Utilities Transit Planning 75% Complete
Meetings of the Local Coordinating Board for Transit were held in January and March. The committee
continued to work on the development of the Transit Coordination Plan - 5 Year Implementation Plan to
meet the performance review requirements. The committee reviewed the TDM Report and FTA 5310
projects.
070 OTO and MoDOT Special Studies and Projects 65% Complete
Staff served on the Springfield-Greene County Community Focus Report Steering Committee and served
as chair of the Transportation Section. The transportation section report was completed and presented
to the Steering Committee. The Final Community Focus Report will be published in Fall 2015.

OTO FY 2014-2015 3rd Quarter Progress Report Page 7
Staff gained access to FHWA HEER data for use in planning activities.
Staff met with MoDOT District Office on ITS needs and applications.
080 MoDOT Transportation Studies & Data Collection 75% Complete
MoDOT staff continued to work on work on transportation planning work in the OTO region that was
eligible for MoDOT Direct Cost. A total of 411.75 MoDOT staff hours were completed during the months
of January, February, and March.

TAB 10
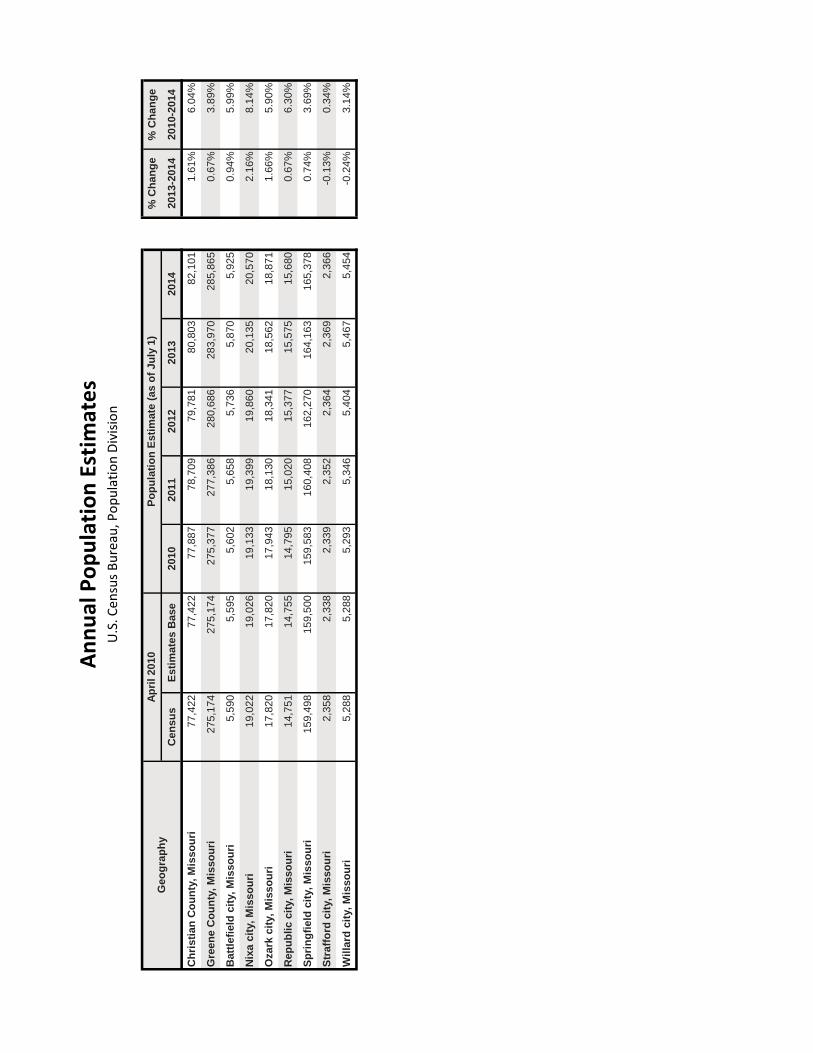
% C
ha
ng
e%
Ch
an
ge
Cen
su
sE
sti
mate
s B
ase
2010
2011
2012
2013
2014
2013-2
014
2010-2
014
Ch
risti
an
Co
un
ty,
Mis
so
uri
77,4
2277
,422
77,8
8778
,709
79,7
8180
,803
82,1
011.
61%
6.04
%
Gre
en
e C
ou
nty
, M
isso
uri
275,
174
275,
174
275,
377
277,
386
280,
686
283,
970
285,
865
0.67
%3.
89%
Batt
lefi
eld
cit
y,
Mis
so
uri
5,59
05,
595
5,60
25,
658
5,73
65,
870
5,92
50.
94%
5.99
%
Nix
a c
ity,
Mis
so
uri
19,0
2219
,026
19,1
3319
,399
19,8
6020
,135
20,5
702.
16%
8.14
%
Ozark
cit
y,
Mis
so
uri
17,8
2017
,820
17,9
4318
,130
18,3
4118
,562
18,8
711.
66%
5.90
%
Rep
ub
lic c
ity,
Mis
so
uri
14,7
5114
,755
14,7
9515
,020
15,3
7715
,575
15,6
800.
67%
6.30
%
Sp
rin
gfi
eld
cit
y,
Mis
so
uri
159,
498
159,
500
159,
583
160,
408
162,
270
164,
163
165,
378
0.74
%3.
69%
Str
aff
ord
cit
y,
Mis
so
uri
2,35
82,
338
2,33
92,
352
2,36
42,
369
2,36
6-0
.13%
0.34
%
Wil
lard
cit
y,
Mis
so
uri
5,28
85,
288
5,29
35,
346
5,40
45,
467
5,45
4-0
.24%
3.14
%
Geo
gra
ph
yA
pri
l 2010
Po
pu
lati
on
Esti
mate
(as o
f Ju
ly 1
)
An
nu
al P
op
ula
tio
n E
stim
ate
sU
.S. C
ensu
s B
ure
au, P
op
ula
tio
n D
ivis
ion
Transportation Management Center Features
Articles 1 – 4
By Joshua Boley
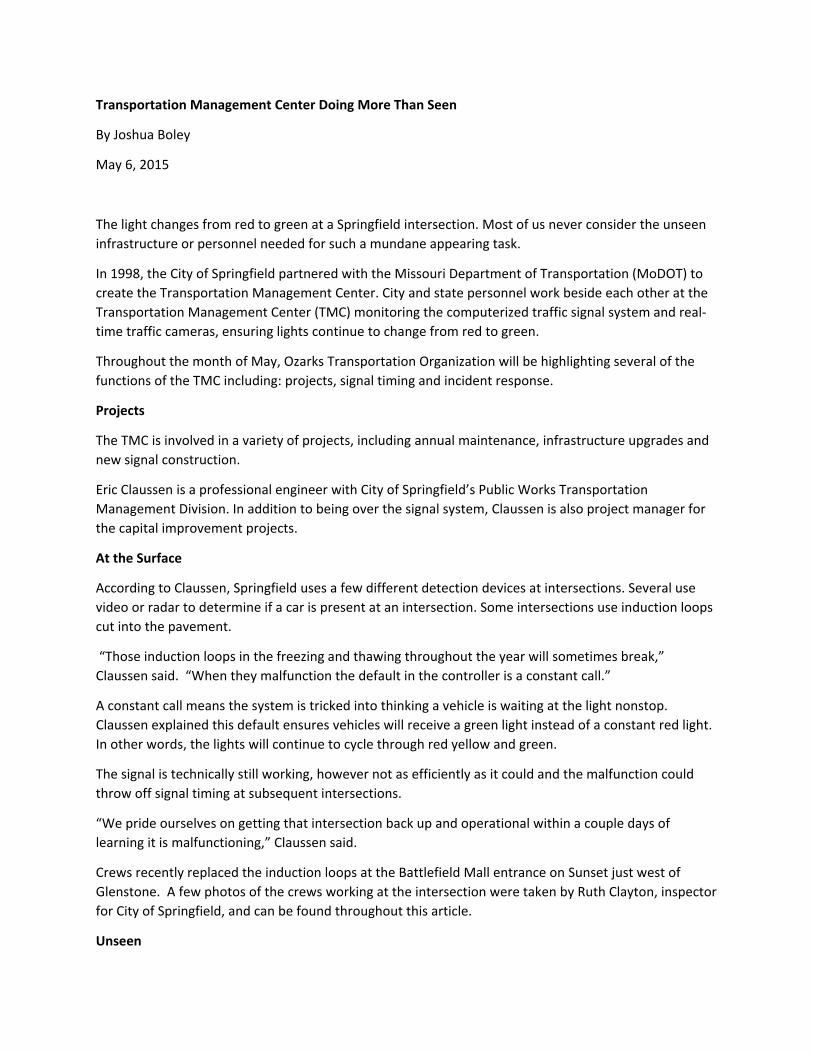
Transportation Management Center Doing More Than Seen
By Joshua Boley
May 6, 2015
The light changes from red to green at a Springfield intersection. Most of us never consider the unseen
infrastructure or personnel needed for such a mundane appearing task.
In 1998, the City of Springfield partnered with the Missouri Department of Transportation (MoDOT) to
create the Transportation Management Center. City and state personnel work beside each other at the
Transportation Management Center (TMC) monitoring the computerized traffic signal system and real‐
time traffic cameras, ensuring lights continue to change from red to green.
Throughout the month of May, Ozarks Transportation Organization will be highlighting several of the
functions of the TMC including: projects, signal timing and incident response.
Projects
The TMC is involved in a variety of projects, including annual maintenance, infrastructure upgrades and
new signal construction.
Eric Claussen is a professional engineer with City of Springfield’s Public Works Transportation
Management Division. In addition to being over the signal system, Claussen is also project manager for
the capital improvement projects.
At the Surface
According to Claussen, Springfield uses a few different detection devices at intersections. Several use
video or radar to determine if a car is present at an intersection. Some intersections use induction loops
cut into the pavement.
“Those induction loops in the freezing and thawing throughout the year will sometimes break,”
Claussen said. “When they malfunction the default in the controller is a constant call.”
A constant call means the system is tricked into thinking a vehicle is waiting at the light nonstop.
Claussen explained this default ensures vehicles will receive a green light instead of a constant red light.
In other words, the lights will continue to cycle through red yellow and green.
The signal is technically still working, however not as efficiently as it could and the malfunction could
throw off signal timing at subsequent intersections.
“We pride ourselves on getting that intersection back up and operational within a couple days of
learning it is malfunctioning,” Claussen said.
Crews recently replaced the induction loops at the Battlefield Mall entrance on Sunset just west of
Glenstone. A few photos of the crews working at the intersection were taken by Ruth Clayton, inspector
for City of Springfield, and can be found throughout this article.
Unseen
The TMC is also working on a streetscape project on Jefferson Avenue from Park Central East though
Water Street. While the public will notice new sidewalks, street lights and signal lights at Jefferson and
Olive, Claussen explained most of the work will never been seen.
“It’s only two blocks long, but we are redoing the storm water infrastructure all the way down and there
is quite a bit of City Utilities gas and water along it as well,” Claussen said.
The Jefferson streetscape project is scheduled to last five months and Claussen said the public can have
a hard time understanding why projects last so long when they only see a fraction of the work taking
place.
“Why was it an inconvenience for five months? There is all this unseen [infrastructure] that has to be
done as part of these projects,” Claussen said.
The TMC will soon be starting an intersection project, including signals, poles, cabinets and detection
system, at Campbell and Primrose and has just finished a widening project on Primrose that also
included the signal at Primrose and Kings. Similar to the streetscape project, many of the improvements
to these intersections are unseen by the public.
“[A]t Kings & Primrose,” Claussen said, “we installed CU gas and water, stormwater inlets and pipes
along both sides of the roadway, communications conduit under the sidewalk, conduits and bases for
CU street lighting, and underground infrastructure for our traffic signal (conduits and wiring to go from
the cabinet to each signal head, button, or detector). Above ground, you see the wider street
pavement, new signal poles, new streetlights; but there is a lot that occurs under the surface.”
This week focused on projects and how unseen infrastructure can affect the timing of their completion.
Next week, learn how timing of signals is crucial for the TMC’s coordinated traffic plan, keeping the
Springfield drivers commute smooth.
Signal Timing: The Science of Moving Traffic Safely
By Joshua Boley
May 13, 2015
Last week we talked about the unseen infrastructure required for simply changing a red light to green.
As important as this infrastructure is, signal timing must be planned and deliberate.
This week looks at the calculations and organization used by the Transportation Management Center
staff to keep traffic flowing every day.
Planning
Signal timing is not a shot in the dark, according to Eric Claussen, professional engineer with City of
Springfield Public Works Transportation Management Division. The first step for a new, or updated,
signal project is gathering data.
“By data, I mean turning movement counts,” Claussen said. “We are basically setting detectors in each
one of the approach lanes and getting the count on our true volume at each individual intersection.”
Transportation Management Center (TMC) staff will also physically drive the routes affected by the
signal project. The data from detectors and driving the routes is used in conjunction with federal
requirements designated in the Manual for Uniform Traffic Control Devices to begin signal timing
calculations.
TMC staff also consider if the intersection is, or should be, part of the organization’s coordinated plan.
Signals on a major arterial are typically part of the coordinated plan. Conversely, outlining intersections
run in free operation.
The objective of a coordinated plan is to move vehicles in groups, called platoons, through multiple
signals before having to stop at a red light again. By moving vehicles in platoons, intersections on major
arterials are less congested.
“Free operation means it is more responsive to the traffic that’s approaching the intersection,” Claussen
said. “We may have a favored roadway, but it’s going to be more responsive to traffic.”
Springfield’s traffic is unique for a larger community because the public uses major arterials, such as
Glenstone and Kansas Expressway, for commuting instead of a large highway system. As a result,
commuters may have to wait longer than they want on side streets to ensure arterials are able to move
large volumes of traffic through the city.
Timing
After considering all the data, factors and information, staff will begin determining the signal’s timing. As
mentioned, federal requirements govern the length of timing for things such as yellow, all red, which
will be discussed later, and pedestrian crossing duration. These factors affect the signals cycle timing.

Cycle timing refers to the time it takes an intersection to go from yellow though red and green and back
to yellow. According to Jason Haynes, traffic engineer with City of Springfield Public Works
Transportation Management Division, cycle length is essentially a balancing act.
“Somebody may call and say, ‘you need to lengthen this left turn time; it’s always cutting off the last
vehicle,” Haynes said. “We would love to give a little more green time and not cut that last vehicle, but if
we do, we are taking it from somewhere else.”
Additionally, adding or moving even a few seconds of green light time from one signal to another could
throw off the entire coordinated plan. Haynes also explained just because a cycle length may be 120
seconds doesn’t mean vehicles are moving the whole time.
“We keep talking about the cycle length and how important it is, but there is a lot of lost time,” Haynes
said. “You may have s 120 second cycle but have 30 seconds of lost time.”
Lost time occurs when nobody is moving. Yellow, all red and the time it takes for a driver to react and
start moving all contribute to lost time. Claussen believes that lost time is increasing as a result of digital
distractions.
“If it’s ... peak rush and you have someone in the turn lane looking down because they are texting and
only two vehicles may get through where normally eight would,” Claussen said. “Then all of a sudden
that’s compiled on the next cycle and instead of having to push eight cars through you are pushing 14
because only two got through on the time before.”
Network
Cycle timing is maintained by a partnership within the TMC. The City of Springfield and the Missouri
Department of Transportation (MoDOT) work together when developing, monitoring and maintaining
timing plans.
“[T]hat’s why we have this partnership just in this building with MoDOT staff, because the traveling
public doesn’t understand where those jurisdictional boundaries are,” Claussen said.
MoDOT maintains the majority of major arterials with the City picking up some major arterials as well as
secondary arterials and side streets. Currently, MoDOT has about 129 signals within the Springfield area
compared to the City’s 140.
Safety
With nearly 270 signals throughout Springfield safety has to be a priority. Haynes explained that a great
deal of safety is actually built into the system.
“At every one of the signals there is an all red,” Haynes said. “The signal will sit in red in all directions for
a certain amount of time, usually around two seconds.”
This all red helps ensure that vehicles traveling a certain direction have cleared the intersection prior to
allowing opposing or cross traffic to begin moving. Despite this built in safety, Haynes said it’s always a
good idea to look for traffic to make sure no one is running a signal before moving into the intersection.
The TMC staff has received legal requests after an accident wanting to know if the system had shown
green for vehicles coming from opposing directions. According to Claussen, the system is built to
prevent this.
“There is a safety device in each one of those controllers called a conflict monitor card,” Claussen said.
“Basically, what it does is not allow the controller to show green in opposing directions.”
This is actually done by clipping designated circuits on the conflict monitor card prior to its installation in
a signal control cabinet.
Contact
The public is encouraged to call if they notice an issue with any traffic signal or intersection.
“When we do get calls, we appreciate it,” Haynes said. “They are our eyes in the field.”
You can reach the City of Springfield by calling 417‐864‐1000 or by their website at springfieldmo.gov or
by their new app gospringfieldmo available for Apple and Android. MoDOT can also be reached at 417‐
895‐7600 or at modot.org.
Intelligent Transportation System Monitoring Springfield Streets
By Joshua Boley
May 19, 2015
The left lane is closed and drivers know several blocks in advance to switch lanes. An accident happens
at an intersection and emergency personnel have a bird’s eye view of view prior to arriving on scene.
The Intelligent Transportation System (ITS) helps make all of this possible.
ITS is the name given to a variety of technologies used by the Transportation Management Center (TMC)
to not only gather data, but to utilize it to help keep traffic moving smoothly.
Closed circuit television (CCTV), dynamic message signs (DMS) and traffic sensors make up a majority of
the ITS according to Brian Doubrava, professional engineer over ITS with City of Springfield.
“What it all comes down to is getting better information to the TMC, so that we can both make better
decisions on signal timing, and also assist with incident response,” Doubrava said.
The System
Doubrava is responsible for ensuring the expansive system is intact and working properly. The
responsibility is no easy task given that the system spans three networks, and multiple jurisdictions in 21
counties.
“We have our Ozarks Traffic network, we have our City network and our MoDOT network,” Doubrava
said. “It all intermingles.”
There are 115 CCTV cameras in the system throughout the 21 counties. Forty‐four of those cameras
belong to the City of Springfield and operate inside the City. Another 51 cameras are operated by
MoDOT inside Springfield, with the remaining 20 spaced along I‐44.
The ITS also has 22 DMS boards. City of Springfield operates five of the boards on city arterials with
MoDOT maintaining the other 17 on arterials such as U.S. 65 and U.S. 60 throughout the City. Twenty‐
five additional boards span I‐44 in multiple counties.
Speed and count detection systems are also placed along roadsides to help the TMC monitor traffic
flows and volumes.
“There’s a wide array of technologies that we have out there and we have to keep them talking to each
other,” Doubrava said.
DMS boards
The use of DMS boards is perhaps the most misunderstood technology by the public, according to
Doubrava.
“It’s something that is very useful if there is an incident there,” Doubrava said. “But, if all people see is a
safety message they don’t think they are working.”
Boards are placed around the City and provide information to the public in the event of an incident. The
board can let drivers know in advance to switch lanes or even to take a different route. However, if
there is not an incident in the vicinity of a board, then a safety message is displayed.
Doubrava said there is some negative feedback because members of the public only see the safety
messages.
“They’re only driving by it at a snapshot of a day”, Doubrava said. “Not to say every board changes all
the time, but unless there is something downstream of that board we are not going to put something on
that relates to an incident if there is not an incident there.”
Planned expansion and upgrades could see DMS boards posting travel times around the City.
Future
“We have a bid out right now for traffic sensing and travel time technology that will put 80 plus sensors
out in the field, so we will be able to get accurate travel times out in the field on a day‐to‐day basis,”
Doubrava said.
The open request for proposal is for a system that will use either Bluetooth or Wi‐Fi to ping a variety of
devices which will send data to the TMC.
“They [pings] will come in encrypted, so we won’t know anything about them, but when they hit
another sensor down the road they will match up and create a travel time between there,” Doubrava
said.
Proposals are scheduled to be completed in a few weeks with the award being made a couple weeks
following. If all goes well, Doubrava expects the upgrades to be completed by this fall.
Staying informed
The upgrades would also allow the TMC to post travel times on their website, OzarksTraffic.com. The
site is free and allows the public to see the locations of all the DMS boards along with their messages.
The public can also see live video from the CCTV cameras throughout the city.
“It’s still a pretty new website and we are doing a lot of expansion on it,” Doubrava said. “There is still a
lot of information out there right now that could be very useful to a lot of people.”
Incident Management
By Joshua Boley
May 20, 2015
As we learned last week, the Transportation Management Center (TMC) monitors the flow of traffic
through Springfield via its Intelligent Transportation System. But, who is actually behind the cameras
and how do they respond if they see an issue?
Rena Rippe is a Traffic Technician II – TMC Operator with City of Springfield. Her primary responsibility is
to monitor live feeds from CCTV cameras and the computer aided dispatch (CAD) interface.
“What I do is watch the cameras, both City and MoDOT, and if I see anything that is going to have any
effect on traffic at all, then I have a decision to make,” Rippe said. “Do I need to call 911 because it is an
accident, or is it just debris in the road?”
Most of the incidents Rippe sees on her monitors are non‐injury accidents. Despite the lack of injuries,
individuals are still reluctant to move their vehicles until a police officer arrives on scene. However, as of
August 2014, Springfield Police are no longer responding to non‐injury accidents.
Incident Response
Clearing vehicles after an accident is just one reason MoDOT’s incident response program was formed.
According to Rippe, MoDOT personnel can arrive on scene, inform the motorists that no report will be
taken, and help move vehicles and debris so traffic can start flowing.
Bruce Pettus, incident management coordinator, heads up MoDOT’s incident response program for the
Springfield TMC. Pettus maintains a crew of two field personnel for Springfield and one for Joplin.
“This crew does what is commonly referred to as “Freeway Service Patrol” type activities where they
patrol the roadway during peak times to assist stranded motorist with flat tires, an out of gas type
situation or to provide traffic control and cleanup at crash scenes,” Pettus said.
As the TMC operator, Rippe has direct contact to the MoDOT crew and keeps them informed of issues
she sees. Additionally, once the crew is on scene, they can provide further information to Rippe so she
can update the CAD interface and the website OzarksTraffic.com.
“We don’t put any comments on anything that we don’t see or have the incident response people tell us
about,” Rippe said.
Although incident response personnel work set hours, they are available 24/7 as needed. In an effort to
keep response times low during nonscheduled hours, crew members drive their response vehicles
home. These vehicles are classified as emergency vehicles and are equipped with a traffic arrow,
warning lights and loud horn.
“[T]he trucks are equipped with a wide variety of traffic control devices such as cones and signs,” Pettus
said. “In addition to this, there are numerous other items carried on the trucks such as power tools for
cutting the guard cable or guard rail if needed.”
The vehicle’s equipment is there to help MoDOT crews not only do their jobs, but do it safely.
“The most difficult thing about this job is the on‐scene safety of our personnel as they work in such a
dangerous environment,” Pettus said. “We have had three of our employees statewide struck and killed
doing this job.”
Agency Cooperation
While the MoDOT incident response program is capable of handling a variety of situations, sometimes a
police officer is required.
Not only does the CAD interface allow the TMC operator to post important traffic information for
emergency crews and police, it also allows the operators to see incidents those groups have posted as
well. Rippe explained sometimes an operator may not be aware of an incident until they see a post.
Once they are aware, they can move the cameras accordingly to help give emergency personnel and
police additional information.
Rippe said several officers know about the live traffic camera feed on OzarksTraffic.com, and use it to
know more about an incident. Additionally, officers have started calling the TMC operators for
assistance.
“They call us quite a bit,” Rippe said. “It is becoming more and more common for officers to call.”
Rippe described a recent call from an officer who responded to a call and could not find the incident
based on the information he had. He asked Rippe if she could locate the incident with the help of the
CCTV cameras. After moving one of the cameras, she was able to direct the officer to the incident’s
location.
“I am excited about the police using the site and feeling comfortable in calling us,” Rippe said.
Officers also utilize the site and TMC operators to find the safest routes to an accident for responding
emergency personnel.
The staff of the Transportation Management Center are constantly looking at how to improve
communication, not only between their own personnel, but with outside agencies as well. The Missouri
State Highway Patrol is working with the TMC to have CAD interfaced into their system as well.
Every aspect of the TMC, from projects and signal timing to ITS and incident response, all serve to keep
Springfield’s pedestrians and motorists moving safely. Bruce Pettus said it best:
“Our roadways are only getting more congested and we must maximize their efficiency through good
traffic incident management practices, which includes the motorist.”
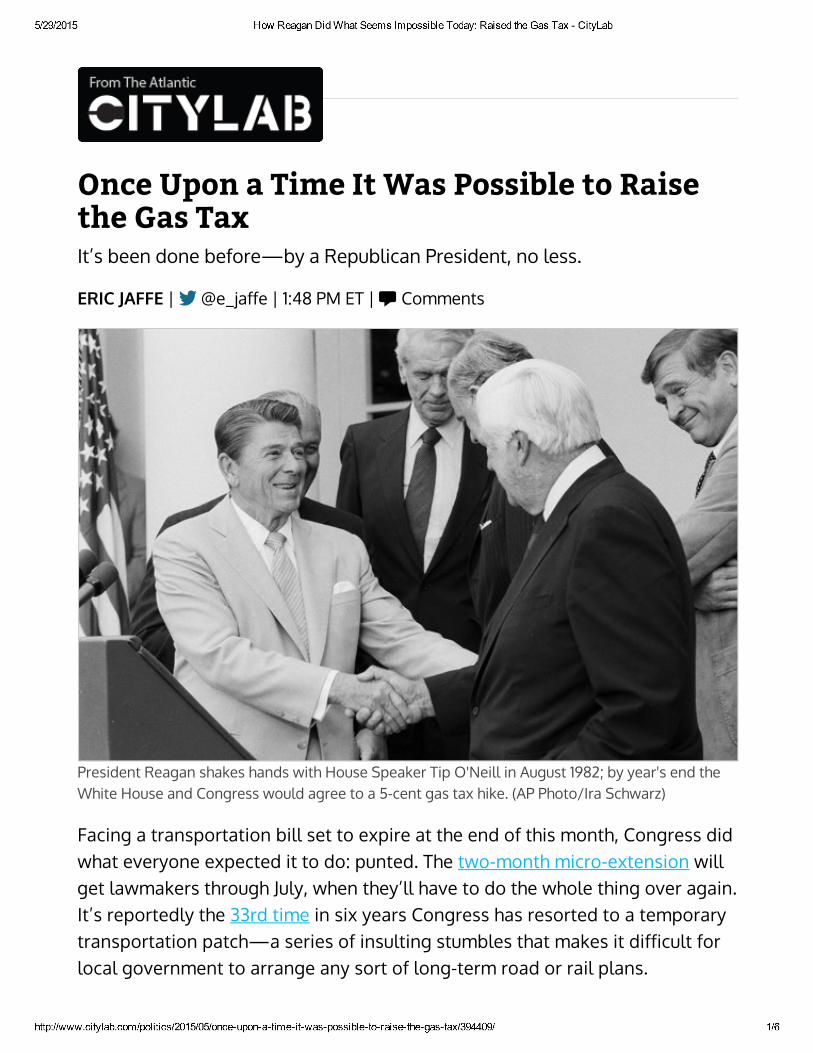
5/29/2015 How Reagan Did What Seems Impossible Today: Raised the Gas Tax CityLab
http://www.citylab.com/politics/2015/05/onceuponatimeitwaspossibletoraisethegastax/394409/ 1/6
Once Upon a Time It Was Possible to Raisethe Gas TaxIt’s been done before—by a Republican President, no less.
ERIC JAFFE | @e_jaffe | 1:48 PM ET | Comments
President Reagan shakes hands with House Speaker Tip O'Neill in August 1982; by year's end theWhite House and Congress would agree to a 5-cent gas tax hike. (AP Photo/Ira Schwarz)
Facing a transportation bill set to expire at the end of this month, Congress didwhat everyone expected it to do: punted. The two-month micro-extension willget lawmakers through July, when they’ll have to do the whole thing over again.It’s reportedly the 33rd time in six years Congress has resorted to a temporarytransportation patch—a series of insulting stumbles that makes it difficult forlocal government to arrange any sort of long-term road or rail plans.
From The Atlantic
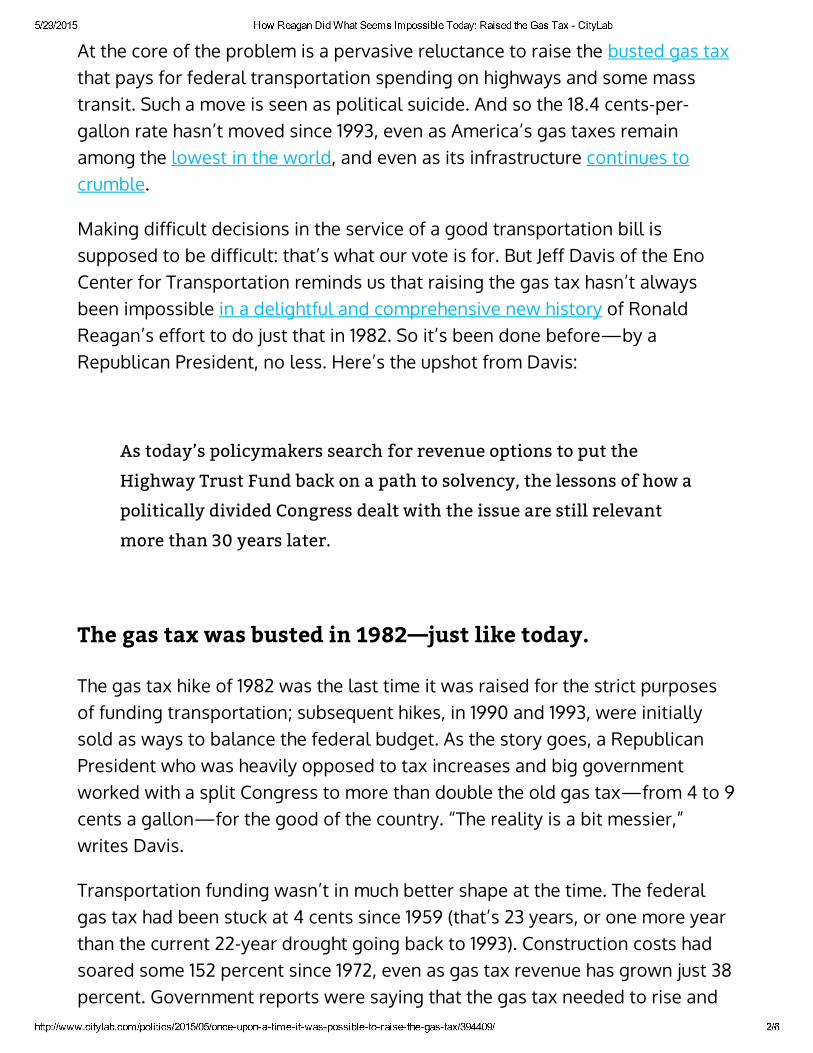
5/29/2015 How Reagan Did What Seems Impossible Today: Raised the Gas Tax CityLab
http://www.citylab.com/politics/2015/05/onceuponatimeitwaspossibletoraisethegastax/394409/ 2/6
At the core of the problem is a pervasive reluctance to raise the busted gas taxthat pays for federal transportation spending on highways and some masstransit. Such a move is seen as political suicide. And so the 18.4 cents-per-gallon rate hasn’t moved since 1993, even as America’s gas taxes remainamong the lowest in the world, and even as its infrastructure continues tocrumble.
Making difficult decisions in the service of a good transportation bill issupposed to be difficult: that’s what our vote is for. But Jeff Davis of the EnoCenter for Transportation reminds us that raising the gas tax hasn’t alwaysbeen impossible in a delightful and comprehensive new history of RonaldReagan’s effort to do just that in 1982. So it’s been done before—by aRepublican President, no less. Here’s the upshot from Davis:
As today’s policymakers search for revenue options to put the
Highway Trust Fund back on a path to solvency, the lessons of how a
politically divided Congress dealt with the issue are still relevant
more than 30 years later.
The gas tax was busted in 1982—just like today.
The gas tax hike of 1982 was the last time it was raised for the strict purposesof funding transportation; subsequent hikes, in 1990 and 1993, were initiallysold as ways to balance the federal budget. As the story goes, a RepublicanPresident who was heavily opposed to tax increases and big governmentworked with a split Congress to more than double the old gas tax—from 4 to 9cents a gallon—for the good of the country. “The reality is a bit messier,”writes Davis.
Transportation funding wasn’t in much better shape at the time. The federalgas tax had been stuck at 4 cents since 1959 (that’s 23 years, or one more yearthan the current 22-year drought going back to 1993). Construction costs hadsoared some 152 percent since 1972, even as gas tax revenue has grown just 38percent. Government reports were saying that the gas tax needed to rise and
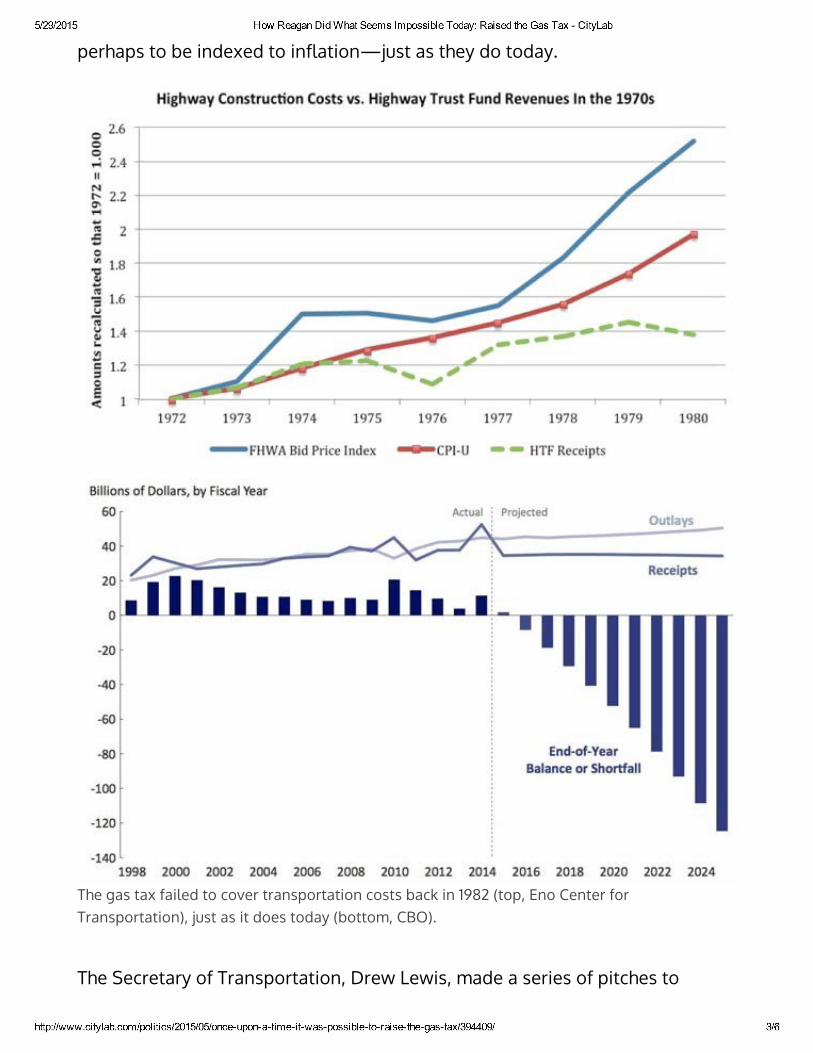
5/29/2015 How Reagan Did What Seems Impossible Today: Raised the Gas Tax CityLab
http://www.citylab.com/politics/2015/05/onceuponatimeitwaspossibletoraisethegastax/394409/ 3/6
perhaps to be indexed to inflation—just as they do today.
The gas tax failed to cover transportation costs back in 1982 (top, Eno Center forTransportation), just as it does today (bottom, CBO).
The Secretary of Transportation, Drew Lewis, made a series of pitches to
5/29/2015 How Reagan Did What Seems Impossible Today: Raised the Gas Tax CityLab
http://www.citylab.com/politics/2015/05/onceuponatimeitwaspossibletoraisethegastax/394409/ 4/6
Reagan about the need to raise the gas tax:
1. Lewis first tried to sell the idea by gaining support of the urban masstransit lobby. The idea was they would receive 20 percent of the newfunding—a penny for every nickel raised. But Reagan initially felt such amove conflicted with his goal of achieving “Federalism,” or devolvingresponsibility from the federal government down to the state level.
2. For his second attempt, Lewis appealed his pitch to Reagan’s Federalistsensibilities. He put the word “federalism” in the title of his proposal andused it 11 times throughout. He also emphasized the high social costs offailing infrastructure. Reagan passed again, telling reporters that hewouldn’t raise the gas tax “unless there’s a palace coup and I’m overtakenor overthrown.”
3. Lewis’s third (and ultimately final) proposal emerged just as recession washitting the country and the GOP got hit hard during the 1982 midtermelections. Officials from both parties—including Democratic Speaker ofthe House Tip O’Neill—publicly supported a 5-cent hike. Lewis packagedthe idea as capable of increasing construction jobs within 90 days of itspassage.
Here’s six lessons for Congress today.
On November 23, 1982, Reagan approved of the idea. (When asked by areporter if there’s been “a palace coup,” he gave a garbled answer about howthat had been said in a different context.) The Gipper addressed the Americanpublic a few days later, using words that could easily be echoed today:
“So, what we’re proposing is to add the equivalent of 5 cents per
gallon to the existing Federal highway user fee, the gas tax. That
hasn’t been increased for the last 23 years. The cost to the average
motorist will be small, but the benefit to our transportation system
will be immense...”
5/29/2015 How Reagan Did What Seems Impossible Today: Raised the Gas Tax CityLab
http://www.citylab.com/politics/2015/05/onceuponatimeitwaspossibletoraisethegastax/394409/ 5/6
“If Reagan told me once, he told mefifteen thousand times–I’d ratherget 80 percent of what I want thango over the cliff with my flagsflying.”
Eno’s Davis highlights a number of lessons that lawmakers could (at leasttheoretically) draw from the experience. Persistence counts. Devolution—anapproach many still support for transportation funding—has its flaws; manystates worried about raising enough money to make up for what they lost.Congress can force a President’s hand, especially with an announcement ofbipartisan support for a bill. Failure to pass a temporary, one-year patch hadincreased pressure for a longer solution.
And, last but not least, “compromise” is not a sin; here’s Davis quoting Chief ofStaff James Baker:
“If Reagan told me once, he told me fifteen thousand times–I’d
rather get 80 percent of what I want than go over the cliff with my
flags flying.”
It’s probably time to retire the gas tax.
On one hand, there’s some comfort in knowing that, strictly speaking, it’spossible to raise transportation funding for the sake of transportation. Latelylawmakers have resorted to roundabout methods to pay for roads and rails,often grabbing from the general taxpayer fund to do so. That’s anunsustainable (and arguably illegal) approach that masks the real problem: theprice of driving in America doesn’t cover its true costs.
5/29/2015 How Reagan Did What Seems Impossible Today: Raised the Gas Tax CityLab
http://www.citylab.com/politics/2015/05/onceuponatimeitwaspossibletoraisethegastax/394409/ 6/6
ALL POSTS | @e_jaffe
On the other hand, the circumstances that conspired to achieve the 1982 hikemay be unique to that historical moment. The nature of the gas tax itself—hidden away in fuel prices—also obscures progress in this conversation. It’shard for anyone to know just how much they personally contribute to highwaymaintenance and construction, let alone that it’s nowhere near enough.
The best way to lose this illusion would be to replace the gas tax with a per-mile driving fee that made it painfully clear how much it costs to drive—andthat could be adjusted for all the social nuisances that car-reliance creates,from pollution to congestion to traffic deaths. But Davis’s history shows us howdifficult it is for federal officials to work with what’s already in front of them.Bold leadership in a brand new direction is something we’re unlikely to seeanytime soon.
About the Author
Eric Jaffe is a senior associate editor at CityLab. He writes abouttransportation as well as behavior, crime, and history, and has ageneral interest in the science of city life. He's the author of ACurious Madness (2014) and The King's Best Highway (2010), andlives in New York.
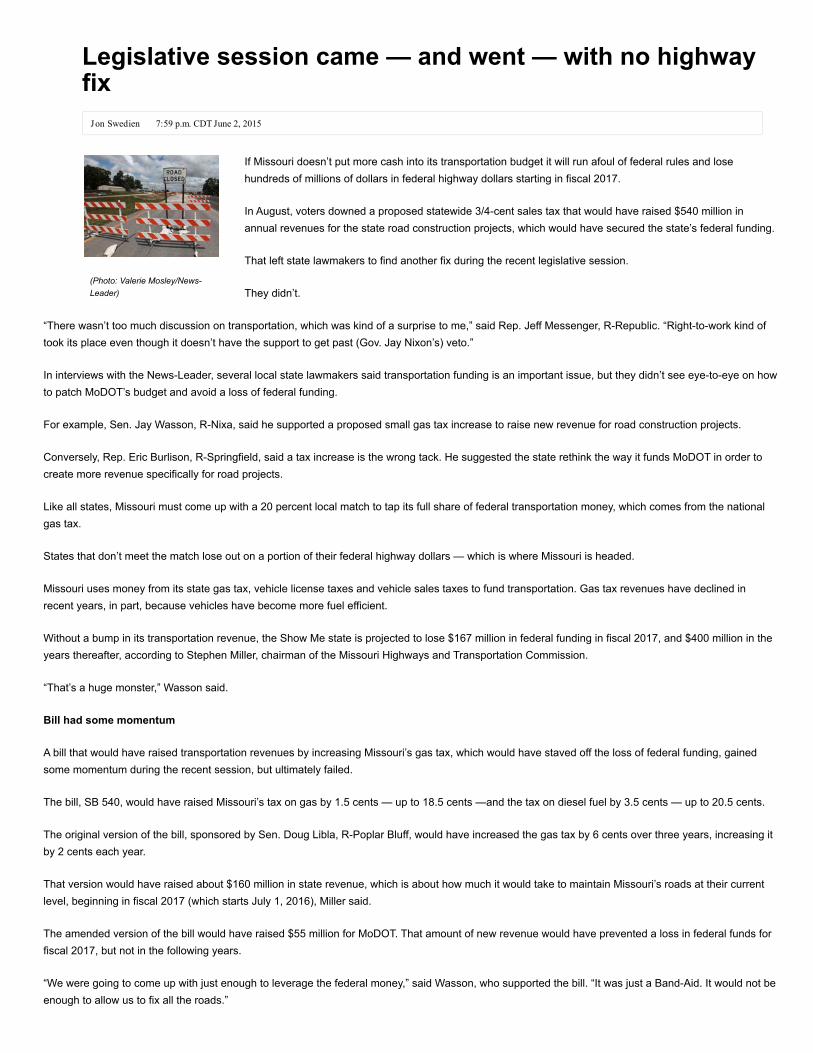
Legislative session came — and went — with no highwayfixJon Swedien 7:59 p.m. CDT June 2, 2015
If Missouri doesn’t put more cash into its transportation budget it will run afoul of federal rules and losehundreds of millions of dollars in federal highway dollars starting in fiscal 2017.
In August, voters downed a proposed statewide 3/4cent sales tax that would have raised $540 million inannual revenues for the state road construction projects, which would have secured the state’s federal funding.
That left state lawmakers to find another fix during the recent legislative session.
They didn’t.
“There wasn’t too much discussion on transportation, which was kind of a surprise to me,” said Rep. Jeff Messenger, RRepublic. “Righttowork kind oftook its place even though it doesn’t have the support to get past (Gov. Jay Nixon’s) veto.”
In interviews with the NewsLeader, several local state lawmakers said transportation funding is an important issue, but they didn’t see eyetoeye on howto patch MoDOT’s budget and avoid a loss of federal funding.
For example, Sen. Jay Wasson, RNixa, said he supported a proposed small gas tax increase to raise new revenue for road construction projects.
Conversely, Rep. Eric Burlison, RSpringfield, said a tax increase is the wrong tack. He suggested the state rethink the way it funds MoDOT in order tocreate more revenue specifically for road projects.
Like all states, Missouri must come up with a 20 percent local match to tap its full share of federal transportation money, which comes from the nationalgas tax.
States that don’t meet the match lose out on a portion of their federal highway dollars — which is where Missouri is headed.
Missouri uses money from its state gas tax, vehicle license taxes and vehicle sales taxes to fund transportation. Gas tax revenues have declined inrecent years, in part, because vehicles have become more fuel efficient.
Without a bump in its transportation revenue, the Show Me state is projected to lose $167 million in federal funding in fiscal 2017, and $400 million in theyears thereafter, according to Stephen Miller, chairman of the Missouri Highways and Transportation Commission.
“That’s a huge monster,” Wasson said.
Bill had some momentum
A bill that would have raised transportation revenues by increasing Missouri’s gas tax, which would have staved off the loss of federal funding, gainedsome momentum during the recent session, but ultimately failed.
The bill, SB 540, would have raised Missouri’s tax on gas by 1.5 cents — up to 18.5 cents —and the tax on diesel fuel by 3.5 cents — up to 20.5 cents.
The original version of the bill, sponsored by Sen. Doug Libla, RPoplar Bluff, would have increased the gas tax by 6 cents over three years, increasing itby 2 cents each year.
That version would have raised about $160 million in state revenue, which is about how much it would take to maintain Missouri’s roads at their currentlevel, beginning in fiscal 2017 (which starts July 1, 2016), Miller said.
The amended version of the bill would have raised $55 million for MoDOT. That amount of new revenue would have prevented a loss in federal funds forfiscal 2017, but not in the following years.
“We were going to come up with just enough to leverage the federal money,” said Wasson, who supported the bill. “It was just a BandAid. It would not beenough to allow us to fix all the roads.”
(Photo: Valerie Mosley/NewsLeader)
But for opponents of the bill, the tax increase was a nonstarter.
“It seems kind of silly to make a tax cut one year and then a tax hike the next,” said Messenger, noting lawmakers passed an income tax cut last year.
Likewise, Burlison said it seemed “schizophrenic” to cut one tax one year and increase another the next.
“I don’t think that the legislature has an appetite to vote for a tax increase at this time after the voters voted one down” in August, Burlison said.
Wasson said he understood that line of thinking, but noted the proposed gas tax was a much smaller tax hike than the statewide sales tax proposal.
“But that’s why we came back with a very small tax increase – 2 cents,” he said.
A fix without a tax hike?
Some area Republicans argue the transportation budget can be patched without raising taxes.
“Question is do we have to raise taxes to do that?” asked Burlison.
His answer is no.
This past session, Burlison introduced legislation that would have used an accounting switch to free up more dollars for road projects.
The legislation, HB1198, would have moved MoDOT employees’ salaries, benefits and pension costs into the state’s general fund.
Currently, only 1 percent of the department’s revenue comes from the general fund. Most of its revenue comes from fuel taxes, vehicle and driverlicensing fees, vehicle sales taxes and federal dollars, according to the MoDOT’s October 2014 Financial Snapshot.
Moving the department’s personnel costs over to the general fund would free up a considerable amount of revenue to be used on road improvementprojects, Burlison said.
Of course, this tack would also require making spending cuts elsewhere in state government in order to free up dollars for MoDOT employees’ salaries,benefits and pension costs within the general fund.
Burlison said he plans to introduce the bill again next year and believes it will gain more traction. He noted bills often must be introduced several timesbefore they are passed.
It would have at least one opponent. Messenger thinks Burlison is taking the wrong tack, he said.
Messenger said there is already too much pressure on the general fund and he prefers departments to have their own dedicated sources of revenue.
Yet, like Burlison, Messenger believes there is a way to plug the hole in the state’s transportation budget without a tax increase, although it is unlikely tomake state agencies happy, he said.
Messenger would like to take money set aside for agencies’ potential budget overruns, and dedicate it to the transportation budget, he said.
This would mean that state agencies could not go over on their budgets and would force them to be very financially disciplined, Messenger said.
Messenger is not sure whether this proposal would gain enough traction next session to get passed, but he is trying to garner support for the measure inthe interim and will decide later if he wants to introduce it as a bill, he said.
The Springfield area’s lone Democratic lawmaker, Rep. Charlie Norr, said it was disappointing the Republicancontrolled legislature couldn’t find thepolitical will to raise taxes for the transportation budget.
“We haven’t raised the gas taxes since the ’90s,” Norr said. “I think the legislature needs to show some fortitude and raise some taxes and use it forhighways.”
Miller, the state highway commission chair, summed up the legislature’s inaction saying, “It’s frustrating.”
Local impact
The Missouri Department of Transportation has come up with a plan in case there is not a revenue bump and it does lose federal funding.
In January, the department announced its “325 Plan” that outlines how the department would go about spending its projected 2017 construction budget,which includes about $325 million for projects.
This budget is significantly smaller than its 2014 construction budget, which included $700 million for projects, said Robert Brendel, MoDOT specialassignment coordinator.
Under this plan, road improvement projects will be concentrated on 8,000 miles of highway starting in 2017, Brendel said.
Brendel said the other 26,000 miles of statemaintained road will only receive limited maintenance as department revenue allows.
Among those roads will be some of Springfield’s main thoroughfares — such as Kansas Expressway, Chestnut Expressway and Glenstone Avenue, saidLaurel McKean, MoDOT assistant district engineer, who works out of the Springfield office.
McKean said people will continue to see MoDOT projects in the coming year — like adding lanes to U.S. 65 — but they will dry up in 2017.
“The biggest impact to Springfield is all the major arterials in town are now on the supplementary list,” McKean said. “We won’t be able to make theimpact on congestion and safety that we did in the past.”
Sara Fields, executive director of the Ozarks Transportation Organization, said federal dollars that go directly to local departments would not be affected ifthe state failed to meet its match requirements.
But it has already affected costshare programs that allow local agencies to team up with the state to improve roads.
In the past, local agencies would partner with the state to complete big projects on important roads through costshare programs, Fields said. But nowMoDOT has cut the programs that allowed them to do that because of its declining revenue, Fields said.
The bigger issue, however, is the potential loss of federal funds, Fields said.
“We pay for that and it would be a shame to lose it,” she said.
Next year, we’ll see
Messenger said he expects transportation will be a much bigger issue in the next legislative session, and that lawmakers will prevent the loss of federalfunding.
If lawmakers come up with no other solution between now and the end of the next session, Messenger believes they will backfill the transportationbudget with dollars from the state’s general fund to ensure Missouri doesn’t lose out on its federal highway funding, he said.
For his part Wasson said he’s not sure how lawmakers will fix the transportation budget. But it might not happen until people see the roads deteriorate, hesaid.
“The public is only going to realize this when the roads are failing,” Wasson said. “I think we’ll figure out a way to do this, it just might get painful to do.”
Read or Share this story: http://sgfnow.co/1M2Z8kp
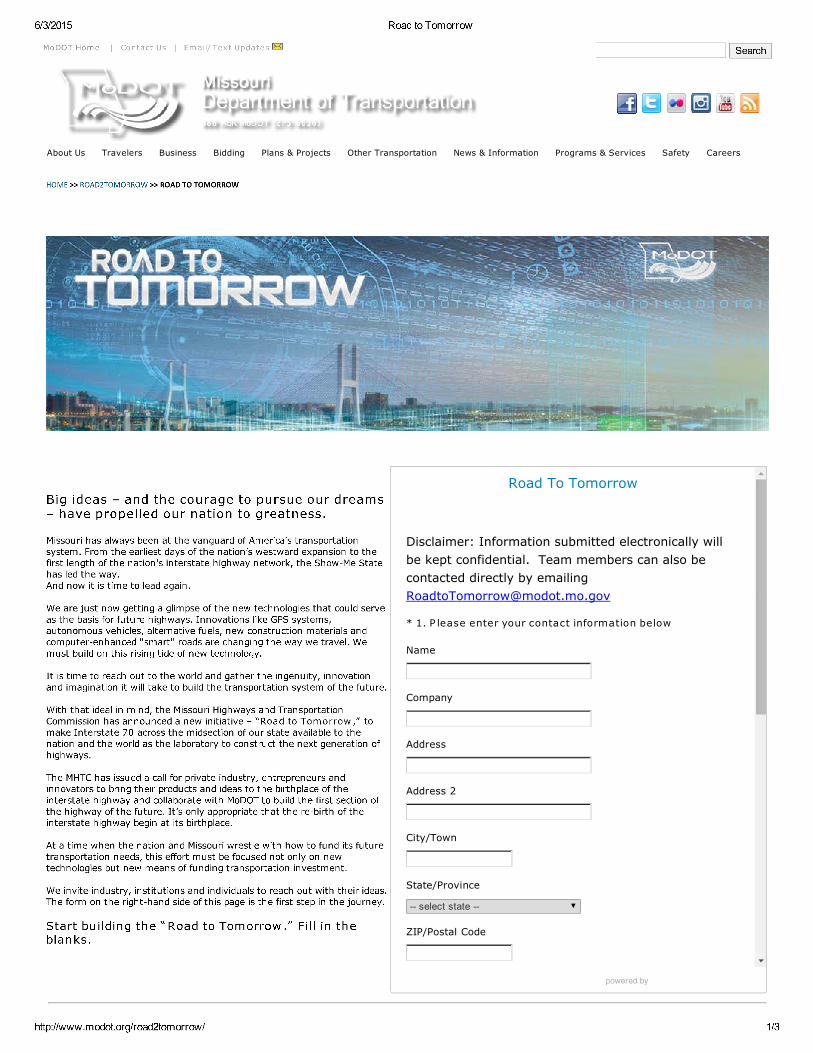
6/3/2015 Road to Tomorrow
http://www.modot.org/road2tomorrow/ 1/3
MoDOT Home | Contact Us | Email/ Text Updates Search
HOME >> ROAD2TOMORROW >> ROAD TO TOMORROW
Big ideas – and the courage to pursue our dreams– have propelled our nation to greatness. Missouri has always been at the vanguard of America's transportationsystem. From the earliest days of the nation’s westward expansion to thefirst length of the nation's interstate highway network, the Show-Me Statehas led the way.And now it is time to lead again. We are just now getting a glimpse of the new technologies that could serveas the basis for future highways. Innovations like GPS systems,autonomous vehicles, alternative fuels, new construction materials andcomputer-enhanced "smart" roads are changing the way we travel. Wemust build on this rising tide of new technology. It is time to reach out to the world and gather the ingenuity, innovationand imagination it will take to build the transportation system of the future. With that ideal in mind, the Missouri Highways and TransportationCommission has announced a new initiative – “Road to Tomorrow ,” tomake Interstate 70 across the midsection of our state available to thenation and the world as the laboratory to construct the next generation ofhighways. The MHTC has issued a call for private industry, entrepreneurs andinnovators to bring their products and ideas to the birthplace of theinterstate highway and collaborate with MoDOT to build the first section ofthe highway of the future. It’s only appropriate that the re-birth of theinterstate highway begin at its birthplace. At a time when the nation and Missouri wrestle with how to fund its futuretransportation needs, this effort must be focused not only on newtechnologies but new means of funding transportation investment. We invite industry, institutions and individuals to reach out with their ideas.The form on the right-hand side of this page is the first step in the journey. Start building the “Road to Tomorrow .” Fill in theblanks.
Disclaimer: Information submitted electronically willbe kept confidential. Team members can also becontacted directly by [email protected]
Road To Tomorrow
* 1. P lease enter your contact information below
Name
Company
Address
Address 2
City/Town
State/Province
select state
ZIP/Postal Code
powered by
About Us Travelers Business Bidding Plans & Projects Other Transportation News & Information Programs & Services Safety Careers


