Board of Directors Date: 26 September 2018 Attachment Number: F Title of Report: QTR1 18-19 Patient Safety Review Purpose of the report and the key issues for consideration/decision: The quarterly Patient Safety Review is designed to augment the monthly Patient Safety and Mortality Scorecard surveillance with additional local and national health intelligence. Its aims are to monitor patient safety, identify vulnerabilities and highlight organisational learning whilst promoting discussion of quality and patient safety. Key issues: • Two Never Events were reported during quarter 1 and four since December 2017. A number of these incidents highlight the application of safety checklists across interventional procedure areas as a persistent theme. • The Never Event that occurred in December 2017 was not formally reported until May 2018. • Performance around the six week diagnostic standard and the percentage of higher risk TIA cases treated within 24 hours. Both metrics fell below thresholds in the last quarter. • Sepsis CQUIN QTR1 18-19: performance is below the threshold set for screening. Deterioration on the previous quarter for IVAB administration is also observed. Further detail can be seen in Appendix 1. Prepared by: Ms Caroline Booton; Clinical Quality Analyst Presented by: Mr Karl Mainprize; Executive Medical Director Strategic Objective(s) supported by this paper: Financial Sustainability Empower & Engage Staff Quality of Care X Is this on the Trust’s risk register: No X Yes If Yes, Score Which CQC Standards apply to this report: All key lines of enquiry. Have all implications related to this report been considered: (please X) Finance Revenue & Capital Equality & Diversity National Policy/Legislation Patient Experience X Human Resources Terms of Authorisation Governance & Risk Management (BAF) Other: Page 1
Transcript
Board of Directors Date: 26 September 2018
Attachment Number: F
Title of Report: QTR1 18-19 Patient Safety Review Purpose of the report and the key issues for consideration/decision:
The quarterly Patient Safety Review is designed to augment the monthly Patient Safety and Mortality Scorecard surveillance with additional local and national health intelligence. Its aims are to monitor patient safety, identify vulnerabilities and highlight organisational learning whilst promoting discussion of quality and patient safety. Key issues: • Two Never Events were reported during quarter 1 and four since December
2017. A number of these incidents highlight the application of safety checklists across interventional procedure areas as a persistent theme.
• The Never Event that occurred in December 2017 was not formally reported until May 2018.
• Performance around the six week diagnostic standard and the percentage of higher risk TIA cases treated within 24 hours. Both metrics fell below thresholds in the last quarter.
• Sepsis CQUIN QTR1 18-19: performance is below the threshold set for screening. Deterioration on the previous quarter for IVAB administration is also observed.
Further detail can be seen in Appendix 1.
Prepared by: Ms Caroline Booton; Clinical Quality Analyst Presented by: Mr Karl Mainprize; Executive Medical Director Strategic Objective(s) supported by this paper:
Financial Sustainability Empower & Engage Staff
Quality of Care X
Is this on the Trust’s risk register:
No X Yes If Yes, Score
Which CQC Standards apply to this report:
All key lines of enquiry.
Have all implications related to this report been considered: (please X)
Finance Revenue & Capital Equality & Diversity
National Policy/Legislation Patient Experience X
Human Resources Terms of Authorisation
Governance & Risk Management (BAF) Other:
Page 1
Action Required: (please X)
Approve Discuss X Receive for information Decision
Previously Considered By:
Executive Assurance Group Date: 19/09/18
Recommendations:
The Board of Directors is asked to discuss and note the detail in Appendix 1.
Page 2
Patient Safety Review Quarter 1 2018-19
About
Compiled each quarter using local and national health intelligence, the Patient Safety Review is aligned to the aims of the Quality Improvement Strategy and is designed to augment the monthly Patient Safety and Mortality Scorecard surveillance. Using relevant benchmarking and extended timeframes where appropriate, both sets of monitoring seek to identify vulnerabilities against which corrective action can be taken and highlight organizational learning. The overall aim is to promote discussion of quality and patient safety.
Learning from deaths and serious incidents is available in complementary quarterly reports.
Contents
1. Harm free care: building a positive patient safety culture ............... 3
2.1 Harm associated with falls ............................................................. 6
2.2 Harm associated with pressure ulcers ........................................... 7
2.2.1 Management of complex wounds .......................................... 9
2. 3 Harm associated with medication ................................................ 9
7. Written complaints ........................................................................... 22
7.1 Patient Advice and Liaison Service (PALS) ................................... 23
8. Appendix: national clinical audit benchmarking .............................. 25
3
1. Harm free care: building a positive patient safety culture
Patient safety incidents aggregate overview
The Trust’s median reporting rate (April to September 2017) continues above average amongst the 135 non-specialist acute trust cohort (Source: National Reporting and Learning System [NRLS]). Organizations that report more incidents usually have a more effective safety culture on the basis that in order to learn it is necessary to understand where the problems are occurring. The expectation is that the rate of incidents reported should rise as a sign of a strong safety culture, whilst the number of incidents resulting in harm should fall. Of the incidents reported in the latest NRLS release, 97.8% were categorized as either low or no harm (97.8% for the cohort).
Figure 1 provides an overview of reported incidents that resulted in moderate, severe harm or death. An upward trend in moderate harm events in the preceding fiscal year is ascribed to the three pressure ulcer clusters5 notified in this period.
Figure 1: Incidents that resulted in moderate, severe harm or death
The 2017 NHS National Staff Survey indicates that the percentage of staff witnessing potentially harmful errors, near misses or incidents is in the lowest (best performing) 20% of acute trusts in England as is the fairness and
effectiveness of incident reporting procedures.
The percentage of staff receiving Staff and Patient Safety training for the quarter stands at: 89.5%. Alternative approaches to training delivery are being implemented to meet the minimum threshold of 90%
It is important that staff report safety risk promptly so that action can be taken to prevent harm to others. Deterioration in the time taken in uploading incidents to the NRLS, an issue previously highlighted by the Care Quality Commission [CQC] remains in view. Only incidents where investigation closure is complete can be uploaded. The median time (April to September 2017) is 60 days [previously 51 days – source NRLS]. The median for the cohort is 21 days. The provisional local median time to uploading an incident is currently at 19 days [source NRLS].
Serious incidents and Never Events
The Trust reported four serious incidents between April and June 2018, including two Never Events [denoted as bold type].1 Never Events are preventable patient safety incidents that should not occur. The two notifications follow on from the Never Event notified in March 2018: wrong site procedure [radiological intervention].
1. Central line guidewire remained in situ [Critical Care Unit] 2. Wrong site block procedure [Theatres] 3. Deep tissue injury pressure ulcer (heel) [Acute Admissions Unit].2 4. Ward 5 environment – immediate action taken to relocate.
Please note that investigation of the serious incidents reported in the quarter is not yet complete; key findings will be included in the next iteration of this report. Of immediate note:
The CCU event occurred in December 2017, but was not formally reported until May 2018.
Initial review of the Never Events has highlighted that safety checklists are not embedded across services despite high profile and widespread application. A variety of Local Safety Standards for Invasive Procedures [LocSSIPs] are in circulation reflective of local ownership and development,
1 QTR1 4 SIRI notifications; QTR2 xx notifications; QTR3 xx notifications; &, QTR4 xx notifications to STEIS 2 A pressure ulcer cluster on Ward 2 in 2017/18 identified delayed opportunities to “React to Red”, failure to seek expert advice and support and shortfall in off-loading principals.
but which may challenge a consistent application and focus across interventional areas.
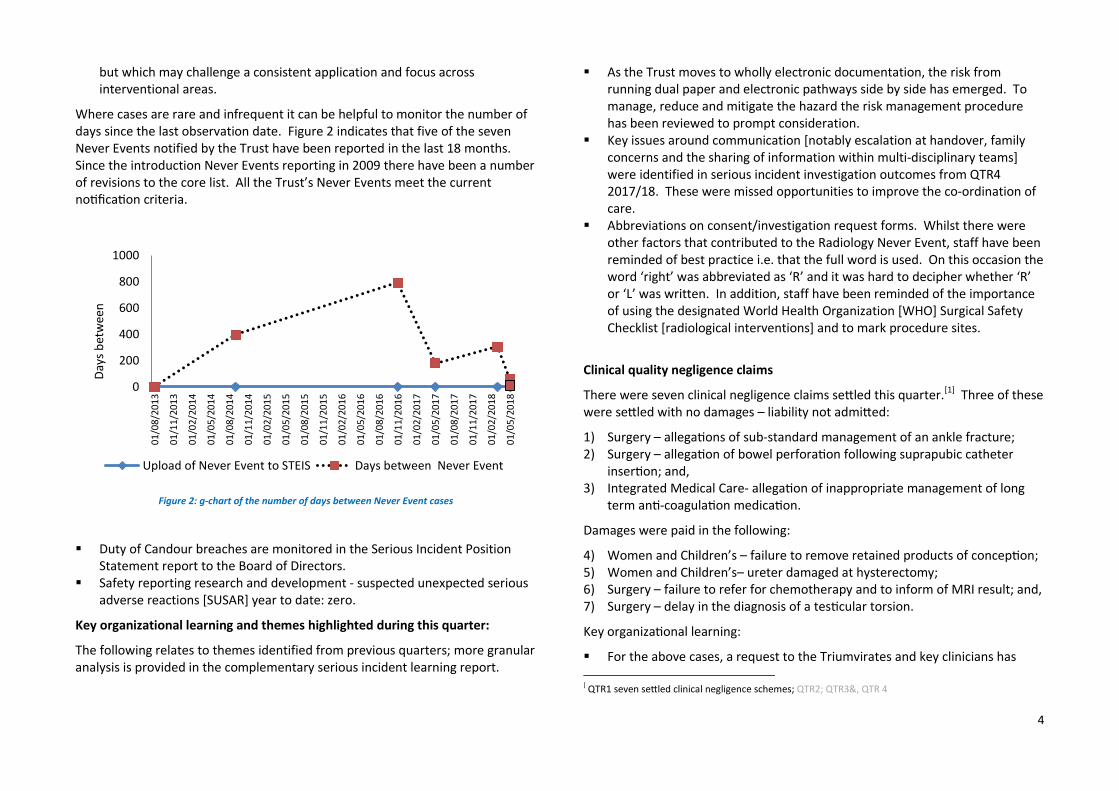
Where cases are rare and infrequent it can be helpful to monitor the number of days since the last observation date. Figure 2 indicates that five of the seven Never Events notified by the Trust have been reported in the last 18 months. Since the introduction Never Events reporting in 2009 there have been a number of revisions to the core list. All the Trust’s Never Events meet the current notification criteria.
Figure 2: g-chart of the number of days between Never Event cases
Duty of Candour breaches are monitored in the Serious Incident Position Statement report to the Board of Directors.
Safety reporting research and development - suspected unexpected serious adverse reactions [SUSAR] year to date: zero.
Key organizational learning and themes highlighted during this quarter:
The following relates to themes identified from previous quarters; more granular analysis is provided in the complementary serious incident learning report.
As the Trust moves to wholly electronic documentation, the risk from running dual paper and electronic pathways side by side has emerged. To manage, reduce and mitigate the hazard the risk management procedure has been reviewed to prompt consideration.
Key issues around communication [notably escalation at handover, family concerns and the sharing of information within multi-disciplinary teams] were identified in serious incident investigation outcomes from QTR4 2017/18. These were missed opportunities to improve the co-ordination of care.
Abbreviations on consent/investigation request forms. Whilst there were other factors that contributed to the Radiology Never Event, staff have been reminded of best practice i.e. that the full word is used. On this occasion the word ‘right’ was abbreviated as ‘R’ and it was hard to decipher whether ‘R’ or ‘L’ was written. In addition, staff have been reminded of the importance of using the designated World Health Organization [WHO] Surgical Safety Checklist [radiological interventions] and to mark procedure sites.
Clinical quality negligence claims
There were seven clinical negligence claims settled this quarter.[1] Three of these were settled with no damages – liability not admitted:
1) Surgery – allegations of sub-standard management of an ankle fracture; 2) Surgery – allegation of bowel perforation following suprapubic catheter
insertion; and, 3) Integrated Medical Care- allegation of inappropriate management of long
term anti-coagulation medication.
Damages were paid in the following:
4) Women and Children’s – failure to remove retained products of conception; 5) Women and Children’s– ureter damaged at hysterectomy; 6) Surgery – failure to refer for chemotherapy and to inform of MRI result; and, 7) Surgery – delay in the diagnosis of a testicular torsion.
Key organizational learning:
For the above cases, a request to the Triumvirates and key clinicians has
Upload of Never Event to STEIS Days between Never Event
5
been made that all relevant learning is identified and shared within relevant forums.
NHS Resolution considers that claims are often pursued in search of an explanation or acknowledgement, potentially because of a failure earlier in the process, such as lack of candour. Oversight of the origin of claims may provide some awareness as to how successfully Trust processes resolve emergent issues:
Of the eight cases reported to NHS Resolution this quarter, six had previously been reported via incident reporting, complaints or PALS processes and/or inquest matters. Seven of these cases were new letters of claim. One case was reported to NHS Resolution and a successful application was made for inquest funding.
NHS Resolution (formerly NHSLA)
In 2017, the NHS Resolution annual report showed that, although childbirth litigation claims represented only 10% of claims, they accounted for 50% of total claims in terms of value. Concerns have been raised about cases in which children suffer brain damage at birth and have to live the rest of their lives with complex care needs. NHS Resolution requires trusts to report all maternity incidents that have led to severe brain injury.
Maternity qualifying incidents under NHS Resolution’s Early Notification Scheme 2018/19: zero cases
In order to apply for a 10% reduction on its annual clinical negligence premium, the Maternity Service has undertaken a self-assessment against ten pre-determined standards. There remain outstanding actions relating to the following criteria: CTG competency based assessment [over and above the current mandated training]3 and multi-disciplinary maternity emergencies training.4 Actions to mitigate potential risk to the quality of patient care have been submitted to NHS Resolution.
Regulation 28
The Coroner has the legal power and duty to issue a report following an inquest if it appears there is a risk of other deaths occurring in similar circumstances. A
‘report under regulation 28’ is sent to a provider to take action to reduce risk and published on the judiciary website. The Trust received no such notification this quarter.
Key learning highlighted this quarter:
The Trust has recently commenced a quarterly Clinical Learning Forum and included group learning from claims and litigation to improve the learning feedback loop.
Following collaboration with NHS Resolution, Getting it Right First Time [GIRFT] reviewed litigation across Trust surgical specialties with the aim of promoting discussion between clinicians, managers and the claims department to improve handling and learning from claims. GIRFT suggest that each clinical negligence claim is reviewed in conjunction with learning from complaints, serious incidents and inquests. A litigation case discussion and learning meeting has been arranged by the Clinical Lead for Orthopaedics for September 2018.
Further learning from deaths/ inquests/Coronial matters:
The Coroners and Justice Act 2009 s.21 made a recommendation for the appointment of Medical Examiners to improve the death certification process in England and Wales. The aims include:
Increased transparency for bereaved families; Improved quality and accuracy of medical certificates as to cause of death; Introduction of medical examiners [ME] as an effective system of medical
scrutiny applicable to all deaths that do not require a coroner’s post-mortem or inquest;
Reporting of clinical governance matters to support local learning and changes to practice and procedures; and,
Provision of public health surveillance.
Implementation is expected to be from April 2019, with approximately 385 experienced doctors to be appointed on a part- time basis.
6
2. Highest burden of harm
Falls, pressure ulcers, medication errors and staffing are the Trust’s most reported incidents. There is clinical consensus that the first three of these may largely be preventable through appropriate patient care whilst research suggests possible links between staffing levels and skill mix with patient safety.
2.1 Harm associated with falls
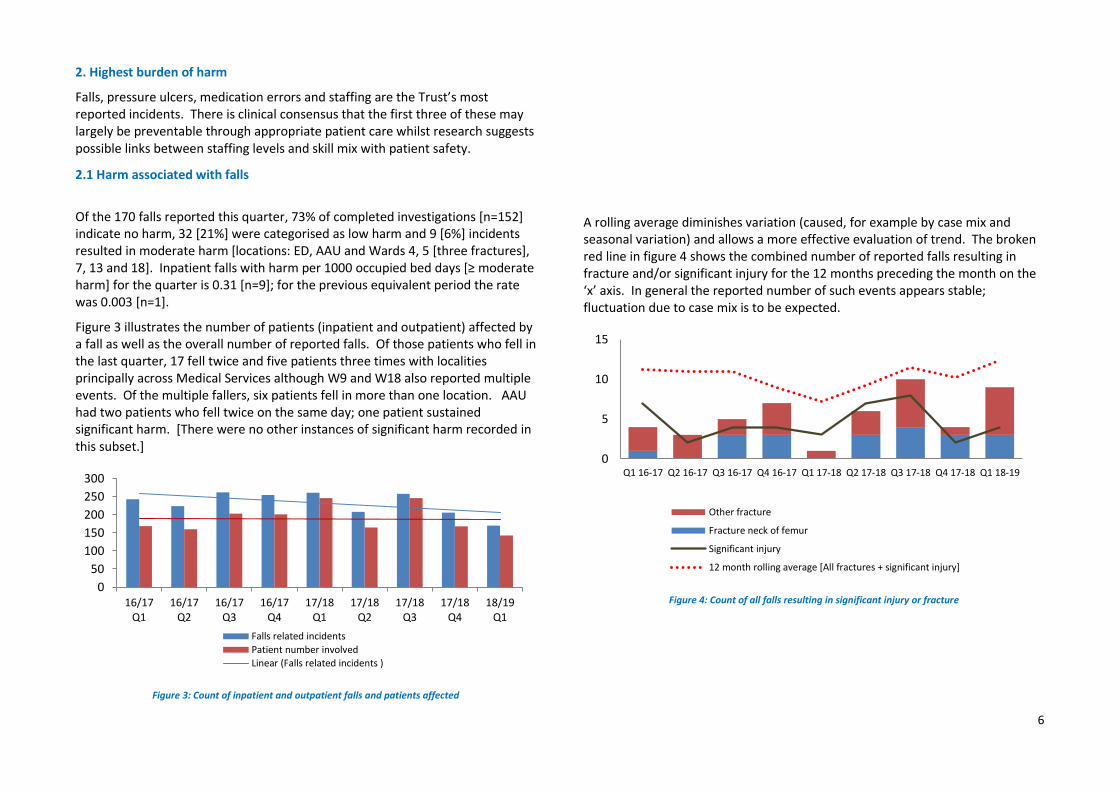
Of the 170 falls reported this quarter, 73% of completed investigations [n=152] indicate no harm, 32 [21%] were categorised as low harm and 9 [6%] incidents resulted in moderate harm [locations: ED, AAU and Wards 4, 5 [three fractures], 7, 13 and 18]. Inpatient falls with harm per 1000 occupied bed days [≥ moderate harm] for the quarter is 0.31 [n=9]; for the previous equivalent period the rate was 0.003 [n=1].
Figure 3 illustrates the number of patients (inpatient and outpatient) affected by a fall as well as the overall number of reported falls. Of those patients who fell in the last quarter, 17 fell twice and five patients three times with localities principally across Medical Services although W9 and W18 also reported multiple events. Of the multiple fallers, six patients fell in more than one location. AAU had two patients who fell twice on the same day; one patient sustained significant harm. [There were no other instances of significant harm recorded in this subset.]
Figure 3: Count of inpatient and outpatient falls and patients affected
A rolling average diminishes variation (caused, for example by case mix and seasonal variation) and allows a more effective evaluation of trend. The broken red line in figure 4 shows the combined number of reported falls resulting in fracture and/or significant injury for the 12 months preceding the month on the ‘x’ axis. In general the reported number of such events appears stable; fluctuation due to case mix is to be expected.
Figure 4: Count of all falls resulting in significant injury or fracture 0
12 month rolling average [All fractures + significant injury]
7
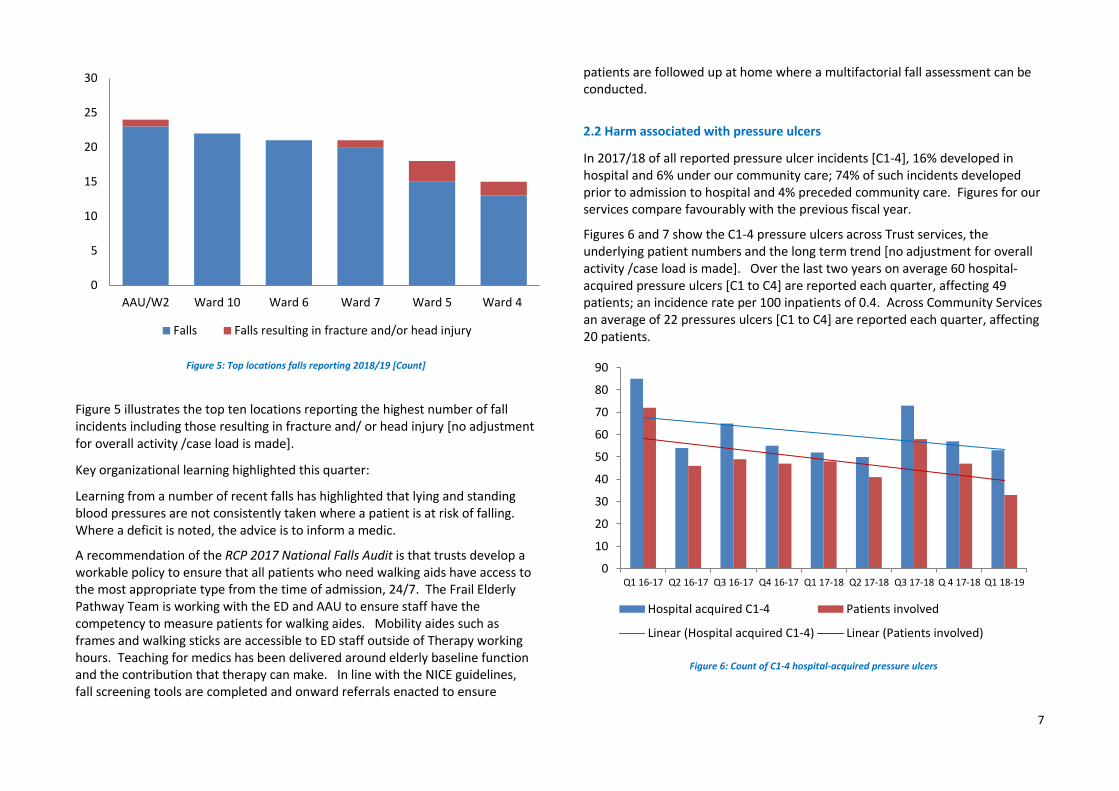
Figure 5: Top locations falls reporting 2018/19 [Count]
Figure 5 illustrates the top ten locations reporting the highest number of fall incidents including those resulting in fracture and/ or head injury [no adjustment for overall activity /case load is made].
Key organizational learning highlighted this quarter:
Learning from a number of recent falls has highlighted that lying and standing blood pressures are not consistently taken where a patient is at risk of falling. Where a deficit is noted, the advice is to inform a medic.
A recommendation of the RCP 2017 National Falls Audit is that trusts develop a workable policy to ensure that all patients who need walking aids have access to the most appropriate type from the time of admission, 24/7. The Frail Elderly Pathway Team is working with the ED and AAU to ensure staff have the competency to measure patients for walking aides. Mobility aides such as frames and walking sticks are accessible to ED staff outside of Therapy working hours. Teaching for medics has been delivered around elderly baseline function and the contribution that therapy can make. In line with the NICE guidelines, fall screening tools are completed and onward referrals enacted to ensure
patients are followed up at home where a multifactorial fall assessment can be conducted.
2.2 Harm associated with pressure ulcers
In 2017/18 of all reported pressure ulcer incidents [C1-4], 16% developed in hospital and 6% under our community care; 74% of such incidents developed prior to admission to hospital and 4% preceded community care. Figures for our services compare favourably with the previous fiscal year.
Figures 6 and 7 show the C1-4 pressure ulcers across Trust services, the underlying patient numbers and the long term trend [no adjustment for overall activity /case load is made]. Over the last two years on average 60 hospital-acquired pressure ulcers [C1 to C4] are reported each quarter, affecting 49 patients; an incidence rate per 100 inpatients of 0.4. Across Community Services an average of 22 pressures ulcers [C1 to C4] are reported each quarter, affecting 20 patients.
Figure 6: Count of C1-4 hospital-acquired pressure ulcers
0
5
10
15
20
25
30
AAU/W2 Ward 10 Ward 6 Ward 7 Ward 5 Ward 4
Falls Falls resulting in fracture and/or head injury
Linear (Hospital acquired C1-4) Linear (Patients involved)
8
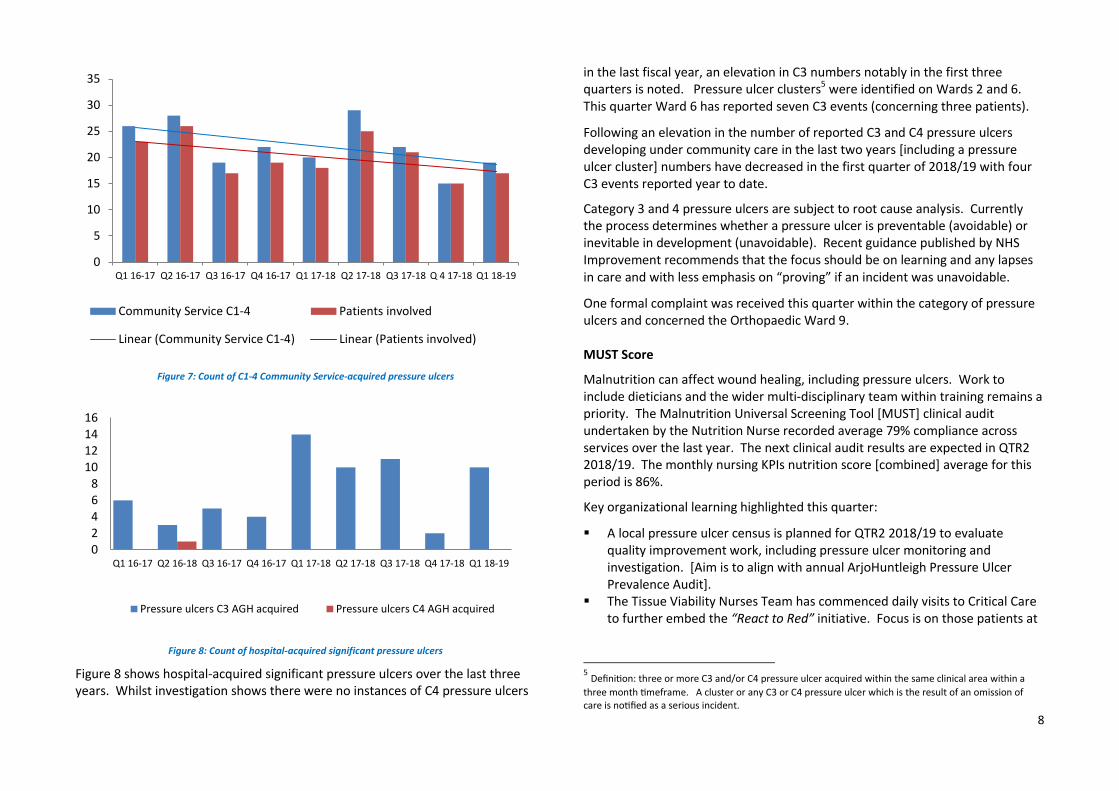
Figure 7: Count of C1-4 Community Service-acquired pressure ulcers
Figure 8: Count of hospital-acquired significant pressure ulcers
Figure 8 shows hospital-acquired significant pressure ulcers over the last three years. Whilst investigation shows there were no instances of C4 pressure ulcers
in the last fiscal year, an elevation in C3 numbers notably in the first three quarters is noted. Pressure ulcer clusters5 were identified on Wards 2 and 6. This quarter Ward 6 has reported seven C3 events (concerning three patients).
Following an elevation in the number of reported C3 and C4 pressure ulcers developing under community care in the last two years [including a pressure ulcer cluster] numbers have decreased in the first quarter of 2018/19 with four C3 events reported year to date.
Category 3 and 4 pressure ulcers are subject to root cause analysis. Currently the process determines whether a pressure ulcer is preventable (avoidable) or inevitable in development (unavoidable). Recent guidance published by NHS Improvement recommends that the focus should be on learning and any lapses in care and with less emphasis on “proving” if an incident was unavoidable.
One formal complaint was received this quarter within the category of pressure ulcers and concerned the Orthopaedic Ward 9. MUST Score
Malnutrition can affect wound healing, including pressure ulcers. Work to include dieticians and the wider multi-disciplinary team within training remains a priority. The Malnutrition Universal Screening Tool [MUST] clinical audit undertaken by the Nutrition Nurse recorded average 79% compliance across services over the last year. The next clinical audit results are expected in QTR2 2018/19. The monthly nursing KPIs nutrition score [combined] average for this period is 86%.
Key organizational learning highlighted this quarter:
A local pressure ulcer census is planned for QTR2 2018/19 to evaluate quality improvement work, including pressure ulcer monitoring and investigation. [Aim is to align with annual ArjoHuntleigh Pressure Ulcer Prevalence Audit].
The Tissue Viability Nurses Team has commenced daily visits to Critical Care to further embed the “React to Red” initiative. Focus is on those patients at
5 Definition: three or more C3 and/or C4 pressure ulcer acquired within the same clinical area within a
three month timeframe. A cluster or any C3 or C4 pressure ulcer which is the result of an omission of care is notified as a serious incident.
risk of pressure damage – incidents highlight medical device related issues – with the aim of preventing deterioration.
2.2.1 Management of complex wounds
Improving the care and treatment of wounds encompasses more than pressure ulcers which is why key quality improvement work focuses on improving wound care for all patients (inpatient and outpatient). Research evidence indicates that 30% of chronic wounds (failure to heal ≥ 4 weeks) do not receive a full assessment based on best practice guidelines. Failure to complete a comprehensive assessment can contribute to ineffective treatment which delays the rate of wound healing. Community Services aim to increase the number of full wound assessments for chronic wounds:
At QTR4 2017/18 clinical audit of a district caseload indicated that of the 36 patients meeting the chronic wound criteria, 38.9% had a full wound assessment. Stretch targets for 2018/19 have been agreed of 60% at QTR2 and 80% at QTR4.
Review of patient case notes registered within the Airedale, Wharfedale and Craven locality highlighted the following areas of care and treatment as requiring greater consideration: the effect of medication on wound healing, the impact on quality of life, including social isolation, and, greater attention to potential systemic infection. These areas form the basis for on-going quality improvement initiatives and monitoring.
Progress in year to date:
The focus of ongoing work is on developing and publishing comprehensive wound care templates for wound, leg ulcer and pressure ulcer assessment and management.
Ensuring that the date of review is planned at the time of the initial and ongoing assessment. [The templates are designed to facilitate this.]
Staff have received training from the Tissue Viability Nurses to increase knowledge and skills on holistic wound assessment.
Issues with peripatetic working and the functionality of the templates on mobile SystmOne have been highlighted by this work.
To improve the delivery of holistic skin and wound assessment within the acute setting, the following work has been undertaken:
Revision of the Wound Care Plan to form a Skin Assessment and Wound Care Plan.
Establishment of a joint wound care Formulary aligned with Community Services and Bradford District Care Foundation NHS Trust. Implementation of a Skin Tear Pathway to support accurate assessment and appropriate treatment.
The acute wound care Formulary is currently under review. 2. 3 Harm associated with medication
According to the latest NRLS breakdown of incidents 8.6% of all Trust reported incidents are medication related. This compares to 10.7% for the 135 acute non-specialist organisations comparator group.
Figure 9 charts the overall medication incidents reported over the last three years against a median for the time period of 120. This quarter of the 109 incidents reported: 95 resulted in no harm; 13 in low harm; one incident had an initial severity of moderate harm [Radiology - reaction to contrast].
Figure 9: Count of medication incidents reported each quarter
The top three process errors are: [1] medication administration errors, [2]
prescribing/process errors, and, [3] dispensing/supply errors. Figures 10 and 11 illustrate the errors across services over the last three years.
Figure 10: Count of top three medication process errors for AGH site
Figure 11: Count of top three medication process errors for Community Services
Review has indicated that the majority of the errors reported within Community Services concern events that occurred in another clinical area or within Primary Care.
2017 CQC Inpatient Survey: results show the Trust is performing “about the same” as most of the 148 participating providers for the following:
Purpose of medicines; Taking medication; Information about medicine; and, Danger signals; and, Medication side effects. For this particular question, scores are generally
low for most organisations. The following scored significantly lower than in 2016: “If you brought your own medication with you to hospital, were you able to take it when you needed to? “
CQC Local System Review: Beyond Barriers: How older people move between health and social care in England (July 2018)
In 2018 the Bradford locality was one of 20 participating sites in the above CQC review. The local areas report highlighted the following areas requiring improvement: The time people wait for medicine on discharge; Ensuring people discharged to their homes have a clear understanding of the
medicines they have been prescribed.
Key organization learning from incidents and/ or complaints where medication is a factor [including contributory]:
Chlordiazepoxide. A root cause investigation has been undertaken and learning shared from the incident on AAU which included, amongst other factors, failure to prescribe appropriate treatment for alcohol withdrawal as the applicable assessment was not completed.
Ward 9 medication serious incident – insulin omitted from prescription on admission. A root cause investigation is in the process of being finalised and any relevant learning with be included at the next quarterly update.
Other key organization learning arising from medication incidents within the last year:
Admin error Dispensing / Supply Prescribing / Process
11
The April 2018 release of SystmOne has the ability to configure local warnings on medicines. A pilot of levodopa-containing medicines for Parkinson’s disease was added to a drug list with an associated warning and icon indicating their clinical urgency. Following positive feedback from EPMA users, this warning has been configured for an agreed list of time critical medicines.
Learning from medicines management audit programme:
None advised.
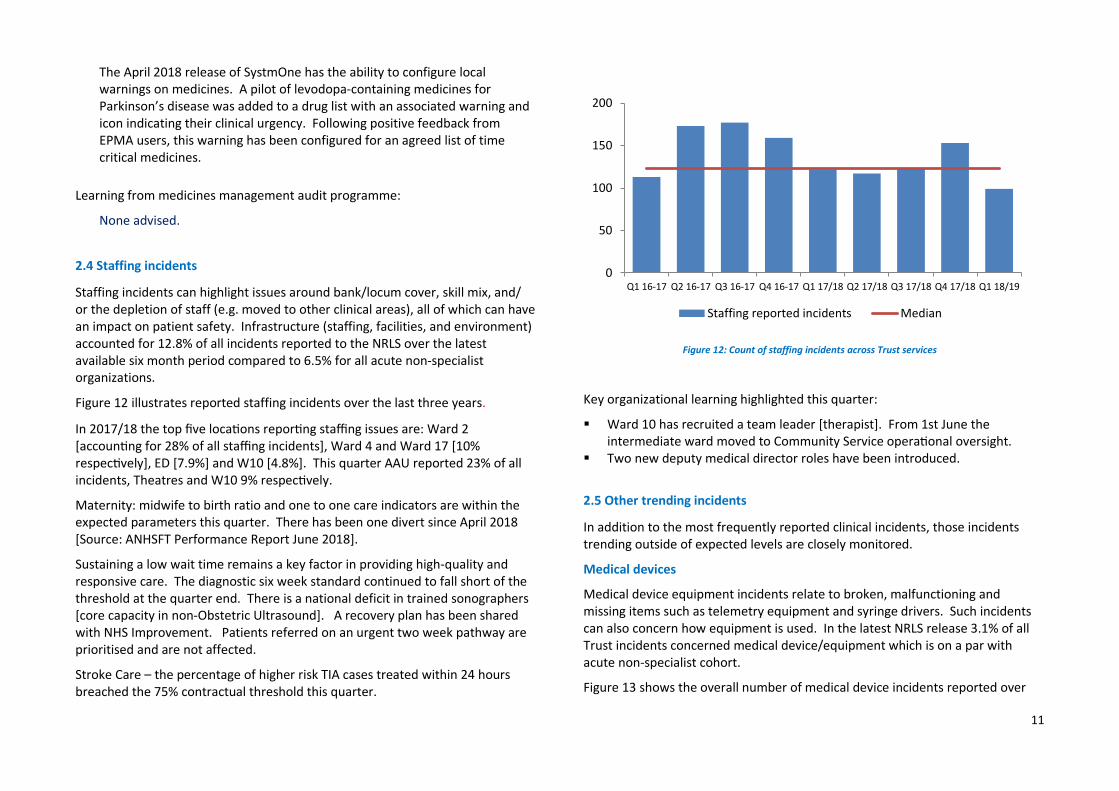
2.4 Staffing incidents
Staffing incidents can highlight issues around bank/locum cover, skill mix, and/ or the depletion of staff (e.g. moved to other clinical areas), all of which can have an impact on patient safety. Infrastructure (staffing, facilities, and environment) accounted for 12.8% of all incidents reported to the NRLS over the latest available six month period compared to 6.5% for all acute non-specialist organizations.
Figure 12 illustrates reported staffing incidents over the last three years.
In 2017/18 the top five locations reporting staffing issues are: Ward 2 [accounting for 28% of all staffing incidents], Ward 4 and Ward 17 [10% respectively], ED [7.9%] and W10 [4.8%]. This quarter AAU reported 23% of all incidents, Theatres and W10 9% respectively.
Maternity: midwife to birth ratio and one to one care indicators are within the expected parameters this quarter. There has been one divert since April 2018 [Source: ANHSFT Performance Report June 2018].
Sustaining a low wait time remains a key factor in providing high-quality and responsive care. The diagnostic six week standard continued to fall short of the threshold at the quarter end. There is a national deficit in trained sonographers [core capacity in non-Obstetric Ultrasound]. A recovery plan has been shared with NHS Improvement. Patients referred on an urgent two week pathway are prioritised and are not affected.
Stroke Care – the percentage of higher risk TIA cases treated within 24 hours breached the 75% contractual threshold this quarter.
Figure 12: Count of staffing incidents across Trust services
Key organizational learning highlighted this quarter:
Ward 10 has recruited a team leader [therapist]. From 1st June the intermediate ward moved to Community Service operational oversight.
Two new deputy medical director roles have been introduced.
2.5 Other trending incidents
In addition to the most frequently reported clinical incidents, those incidents trending outside of expected levels are closely monitored.
Medical devices
Medical device equipment incidents relate to broken, malfunctioning and missing items such as telemetry equipment and syringe drivers. Such incidents can also concern how equipment is used. In the latest NRLS release 3.1% of all Trust incidents concerned medical device/equipment which is on a par with acute non-specialist cohort.
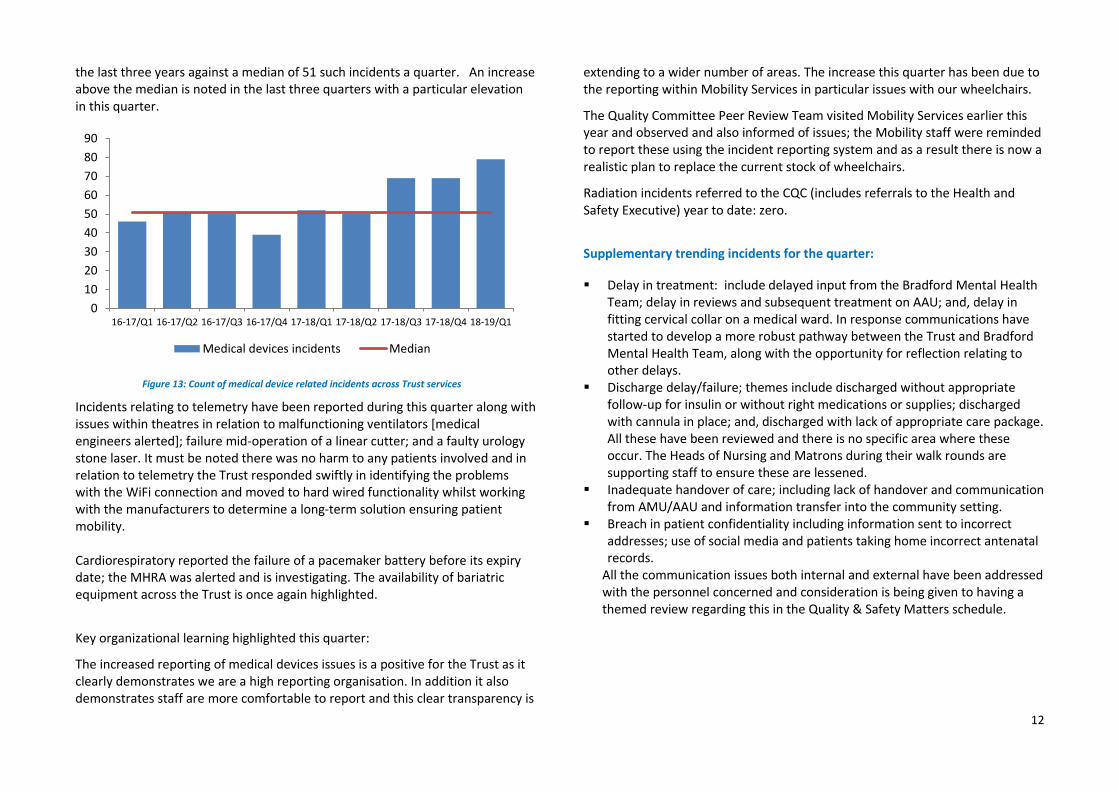
Figure 13 shows the overall number of medical device incidents reported over
the last three years against a median of 51 such incidents a quarter. An increase above the median is noted in the last three quarters with a particular elevation in this quarter.
Figure 13: Count of medical device related incidents across Trust services
Incidents relating to telemetry have been reported during this quarter along with issues within theatres in relation to malfunctioning ventilators [medical engineers alerted]; failure mid-operation of a linear cutter; and a faulty urology stone laser. It must be noted there was no harm to any patients involved and in relation to telemetry the Trust responded swiftly in identifying the problems with the WiFi connection and moved to hard wired functionality whilst working with the manufacturers to determine a long-term solution ensuring patient mobility. Cardiorespiratory reported the failure of a pacemaker battery before its expiry date; the MHRA was alerted and is investigating. The availability of bariatric equipment across the Trust is once again highlighted.
Key organizational learning highlighted this quarter:
The increased reporting of medical devices issues is a positive for the Trust as it clearly demonstrates we are a high reporting organisation. In addition it also demonstrates staff are more comfortable to report and this clear transparency is
extending to a wider number of areas. The increase this quarter has been due to the reporting within Mobility Services in particular issues with our wheelchairs.
The Quality Committee Peer Review Team visited Mobility Services earlier this year and observed and also informed of issues; the Mobility staff were reminded to report these using the incident reporting system and as a result there is now a realistic plan to replace the current stock of wheelchairs.
Radiation incidents referred to the CQC (includes referrals to the Health and Safety Executive) year to date: zero.
Supplementary trending incidents for the quarter:
Delay in treatment: include delayed input from the Bradford Mental Health Team; delay in reviews and subsequent treatment on AAU; and, delay in fitting cervical collar on a medical ward. In response communications have started to develop a more robust pathway between the Trust and Bradford Mental Health Team, along with the opportunity for reflection relating to other delays.
Discharge delay/failure; themes include discharged without appropriate follow-up for insulin or without right medications or supplies; discharged with cannula in place; and, discharged with lack of appropriate care package. All these have been reviewed and there is no specific area where these occur. The Heads of Nursing and Matrons during their walk rounds are supporting staff to ensure these are lessened.
Inadequate handover of care; including lack of handover and communication from AMU/AAU and information transfer into the community setting.
Breach in patient confidentiality including information sent to incorrect addresses; use of social media and patients taking home incorrect antenatal records.
All the communication issues both internal and external have been addressed with the personnel concerned and consideration is being given to having a themed review regarding this in the Quality & Safety Matters schedule.
The Mental Health Act [MHA] (1983) covers the assessment, treatment and rights of people with a mental health disorder. Section 5.2 allows the compulsory detention of a patient already receiving inpatient treatment for up to 72 hours by the doctor in charge of the case. The patient must be suffering from a mental disorder and be a potential danger to themselves or to others. The detention is to allow time for an application for admission under Section 2 or 3 to be made.
Figure 14 opposite shows those inpatients under any type of MHA section since April 2018 drilled down to indicate those instances where a patient has absconded.
This quarter: One attempted suicide was reported ; and, There was one complaint [April 2018] regarding poor management of
mental health needs on AMU.
Figure 14: Count of detentions and those absconding under Section 5.2 of the MHA 1983
Key organizational learning highlighted this quarter:
There were two serious incidents in the previous year concerning patients with mental health needs. One case identified issues around the assessment of risk, awareness of process and consistency of approach between providers [Bradford District Care Foundation NHS Trust]. A delay in Mental Health Act assessment has highlighted Treat as One recommendation for out of area patients.
The Trust is participating in the 2018/19 national CQUIN aimed at improving the mental health of patients presenting to A&E. Mental health and acute hospital providers, working together with other partners are tasked with ensuring that people presenting at A&E with primary or secondary mental health and/or underlying psychosocial needs have these met.
2.7 Mental Capacity Act - Deprivation of Liberty Safeguards
The Deprivation of Liberty Safeguards (DoLS) are part of the Mental Capacity Act [MCA] 2005 and are meant to ensure that people in hospitals (and care homes) are looked after in a way that does not inappropriately restrict their freedom
Figure 15 illustrates activity around the safeguards in the last year.
Figure 15: Count of safeguards activity and reported incidents concerning the Mental Capacity Act
0
1
2
3
4
5
6
Co
un
t o
f p
atie
nts
IP under section + absconded0
20
40
60
QTR1 17/18 QTR2 17/18 QTR3 17/18 QTR4 17/18C
ou
nt
Number of DOLS applications made Number of DoLS Declined/not granted
Number of DOLS authorised by LA
14
Key organizational learning highlighted this quarter:
In 2018 the Bradford locality was one of 20 participating sites in a CQC review of how people aged over 65 move between the health and social care systems. Local feedback highlighted a deficit in staff understanding of people’s rights under the MCA.
An audit of Assessment of Mental Capacity and Best Interest Decision Making was undertaken in March 2018. Of the 28 notes reviewed, there was full documentation in all instances of the assessment of capacity. Whilst best interest decision making showed improvement on the previous audit [January 2016] it is recommended that further education is focused on this area. The completion of MCA baseline questions in the clerking proformas is inconsistent, a finding that has been communicated to junior doctors and supervising consultants.
The Trust is part of NHS Improvement’s Enhanced Observation and Care Collaborative, an initiative to adopt improvement methodologies and create a learning community for the most vulnerable hospital in-patients.
2.8 Patient Safety Alerts
Through the analysis of safety incidents and safety information from other sources – including, royal colleges and coroner letters – NHS England develops advice and issues alerts on potential and identified risks to safety. Whilst the Trust is fully compliant with all patient safety alerts on the CAS system, the following have outstanding internal actions: Supporting the introduction of National Safety Standards for Invasive
Procedures - implementation schedule is in place for Theatres, Endoscopy and Outpatients.
Fenwal to Frensenius Kabi blood bag conversion [issue: availability of fluid bags with appropriate connectors].
3. Harm associated with infection
The Trust aims for a sustained reduction in the incidence of avoidable harm from
MRSA bacteraemia, C.difficile and E coli bacteraemia.
There were six C.difficile cases reported in 2017/18; one was found to be
avoidable with a further case awaiting confirmation of investigation outcome. One case year to date has been notified. [Ward 7- investigation outcome is awaited].
See Figure 16 for latest Public Health C. difficile infection per 100, 000 bed days in Trust patients aged 2 or over
Since 2010 there have been ten MRSA bacteraemia cases. The last event was notified in June 2016.
According to Public Health England [PHE], there has been a sustained year on year increase in the number of E.coli bacteraemia cases with the overall rate across the UK increasing by 45% between 2009 and 2016. In the last year there were 17 hospital acquired E.coli bacteraemia cases compared to 23 in 2016/17. The 2017/18 AGH rate per 100,000 bed days [hospital onset] is 15.5 compared to 22.2 for England. Year to date there have been five cases reported [hospital onset]. Infection prevention and control plans for 2018 include a 10% or greater reduction in cases.
Figure 16: Infection per 100, 000 bed days in Trust patients aged 2 or over
9.8
14.6
5.2
15.0 13.7
0
2
4
6
8
10
12
14
16
2014/15 2015/16 2016/17 2017/18
Airedale NHS Foundation Trust England average
15
Hand hygiene: Trust level hand hygiene percentage compliance since April 2018 is 98%. Staffing compliance over 13 months to September 2018: Doctors 97%;
Nurses 99%; HCSW 99% and Other 97%. Due to variation in sample size direct comparison between groups should not be made.
Ward 1 compliance is below 94% March to May 2018 with no return submitted in June.
The percentage of staff receiving infection level 1 and 2 training for the quarter stands at: 89.1% and 79.5%.
Flu vaccination uptake by clinical staff has improved from a baseline of 60.3% in 2016 to 74.5% in the latest available period (Sep 17 to Feb 18). The 2018/19 CQUIN target for clinical uptake is 75%.
2017 CQC NHS Inpatient Survey:
In response to the following question, “In your opinion, how clean was the hospital room or ward that you were in?” the Trust scored 88.3 out of a possible top score of 100. A higher score indicates better performance. The Trust is performing “about the same” as the other 148 participating trusts.
The question regarding cleanliness of toilets and bathrooms has been removed from the questionnaire.
The following measures were identified within the CQUIN scheme 2017-19 (Antimicrobial Resistance and Sepsis) with the aim of reducing the impact of serious infections. Last year’s results against the target are summarized below:
Total antibiotic usage (for both in-patients and out-patients) per 1,000 admissions – target not met
Total usage (for both in-patients and out-patients) of meropenem per 1,000 admissions – target not met
Total usage (for both in-patients and out-patients) of piperacillin-tazobactam per 1,000 admissions – target met
An international shortage in piperacillin-tazobactam since April 2016 has led to an increase in overall antibiotics and meropenem usage as a consequence of using alternative antibiotics in the last year. Results for 2018/19 will be available in QTR4.
Key organizational learning highlighted in the last year and/ or this quarter:
One case New-Delhi metallo beta-lactamase (NDM-1) confirmed. All infection prevention and control precautions in place and patient discharged home.
MRSA colonisation suppression treatment Mupirocin not available nationally from May to June 2018. In response the Trust reverted to Prontoderm; no increase in positive re-screens has been observed.
Measles outbreak in Bradford; relevant information circulated. Nipah Virus interim guidance issued. A urinary catheter point prevalence audit was undertaken to whether
catheterisation is correctly applied. Of the sample of 44, 96% of patients had a justifiable reason for the intervention: monitoring urine output, retention of urine and long term catheters. One patient had no reason specified; the other patient had a catheter for mobility/skin integrity issues. Themes noted: incomplete documentation, leg bags not secured and catheter bag undated.
16
4. NHS Safety Thermometer
The NHS Safety Thermometer has been removed as an official NHS Statistic. Due to inconsistencies in data collection, it has been acknowledged that national aggregated results are unreliable. If used as a local improvement tool, with a good understanding of local collection practices, such concerns are not relevant.
The tool records the presence or absence of four harms: pressure ulcers, falls, urinary tract infections (UTIs) in patients with a catheter and new venous thromboembolism (VTE). Patients are assessed once a month in their care settings by frontline healthcare professionals; the monthly sample is around 475 patients.
This summary charts opposite [figures 17 and 18] show the new harms that developed under our care over the last 13 months using a mean average and based on the CQC Insight Tool methodology. Where sample sizes are small some variability in returns can be expected.
Key learning identified in the last year:
In the period June 2017 to June 2018 three patients per 100 sampled developed a new harm; pressure ulcers accounted for the highest burden of harm with a rate of 1.57 reported per 100 patients. 6
Ward 10 has the highest rate of new pressure ulcers: 4.45 per 100 patients sampled.
Ward 7 has the highest rate of falls: 1.42 per 100 patients sampled. Ward 5 has the highest rate of catheter and new UTI: 1.81 per 100 patients
sampled. Ward 18 the highest rate of new VTE: 0.87 per 100 patients sampled. Overall Ward 5 has the highest rate of new harms.
The above should be evaluated in the context of denominator size and case mix. Full analysis has been shared with the operational lead for critical appraisal of clinical significance. [N.B. Key organizational learning from the four harms is described in the body of this report.]
6 Ward 16 results are not included in the above analysis owing to a sample size below 85 patients.
Figure 17: Percentage of patients with new pressure ulcer and fall with harm all settings
Figure 18: Percentage of patients with Catheter + UTI and new VTE all settings
0.00%
0.50%
1.00%
1.50%
2.00%
2.50%
3.00%
Sep
-16
Oct
-16
No
v-1
6
Dec
-16
Jan
-17
Feb
-17
Mar
-17
Ap
r-1
7
May
-17
Jun
-17
Jul-
17
Au
g-1
7
Sep
-17
Oct
-17
No
v-1
7
Dec
-17
Jan
-18
Feb
-18
Mar
-18
Ap
r-1
8
May
-18
Jun
-18
Per
cen
tage
of
pat
ien
ts
PU - new PU average Fall + harm Fall + harm average
0.00%
0.20%
0.40%
0.60%
0.80%
1.00%
1.20%
Sep
-16
Oct
-16
No
v-1
6
Dec
-16
Jan
-17
Feb
-17
Mar
-17
Ap
r-1
7
May
-17
Jun
-17
Jul-
17
Au
g-1
7
Sep
-17
Oct
-17
No
v-1
7
Dec
-17
Jan
-18
Feb
-18
Mar
-18
Ap
r-1
8
May
-18
Jun
-18
Per
cen
tage
of
pat
ien
ts
Catheter UTI UTI average VTE - new VTE average
17
5. Mortality
Mortality in the United Kingdom [UK]: since 2011 the number of deaths and crude mortality has increased across the UK. The number of deaths has increased more than the crude death rate due to population growth. Provisional national figures on the number of weekly deaths indicate that winter mortality was higher than usual in 2015, 2017 and 2018.
5.1 Weekday and weekend mortality
Weekday and weekend admission mortality is illustrated in figures 19 and 20. A cyclical winter peak in deaths (blue bar) and deaths as a percentage of spells (red line) is evident in the weekday chart and to a lesser extent the weekend chart. A particular elevation is noted in December 2016. The weekday percentage of deaths to spells is generally below that of the HES acute peer (all acute providers). The lower number of admissions and deaths at weekend is evident in the fluctuations in the weekend chart. The Trust rates appear to oscillate around the peer rate. No adjustment for case-mix is made in the local data.
The analysis does not identify whether or not a death is avoidable. The latest HSMR emergency weekday and emergency weekend values are within the expected range.
NB This data will be monitored in future on the Mortality Scorecard as a quarterly refresh.
Figure 19: Mortality [value and rate] - weekday admission
Figure 20: Mortality [value and rate] - weekend admission
0.00%
0.20%
0.40%
0.60%
0.80%
1.00%
1.20%
1.40%
1.60%
0
10
20
30
40
50
60
70
Ap
r-1
5
Jun
-15
Au
g-1
5
Oct
-15
Dec
-15
Feb
-16
Ap
r-1
6
Jun
-16
Au
g-1
6
Oct
-16
Dec
-16
Feb
-17
Ap
r-1
7
Jun
-17
Au
g-1
7
Oct
-17
Dec
-17
Feb
-18
Ap
r-1
8
Jun
-18
Wee
kday
dea
ths
Weekday Weekday % of spells Peer weekday deaths % of spells
0.00%
0.50%
1.00%
1.50%
2.00%
2.50%
3.00%
3.50%
4.00%
0
5
10
15
20
25
30
Ap
r-1
5
Jun
-15
Au
g-1
5
Oct
-15
Dec
-15
Feb
-16
Ap
r-1
6
Jun
-16
Au
g-1
6
Oct
-16
Dec
-16
Feb
-17
Ap
r-1
7
Jun
-17
Au
g-1
7
Oct
-17
Dec
-17
Feb
-18
Ap
r-1
8
Jun
-18
Wee
ken
d d
eath
s
Weekend Weekend % of spells Peer weekend deaths % of spells
18
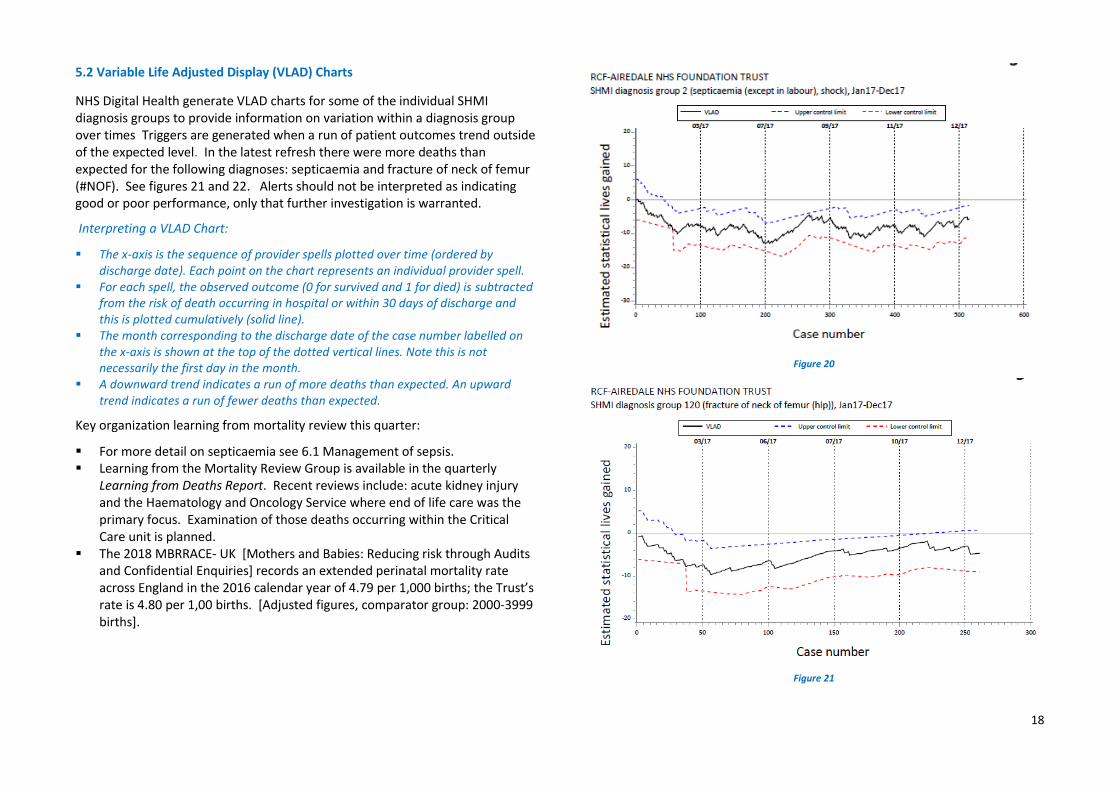
5.2 Variable Life Adjusted Display (VLAD) Charts
NHS Digital Health generate VLAD charts for some of the individual SHMI diagnosis groups to provide information on variation within a diagnosis group over times Triggers are generated when a run of patient outcomes trend outside of the expected level. In the latest refresh there were more deaths than expected for the following diagnoses: septicaemia and fracture of neck of femur (#NOF). See figures 21 and 22. Alerts should not be interpreted as indicating good or poor performance, only that further investigation is warranted.
Interpreting a VLAD Chart:
The x-axis is the sequence of provider spells plotted over time (ordered by discharge date). Each point on the chart represents an individual provider spell.
For each spell, the observed outcome (0 for survived and 1 for died) is subtracted from the risk of death occurring in hospital or within 30 days of discharge and this is plotted cumulatively (solid line).
The month corresponding to the discharge date of the case number labelled on the x-axis is shown at the top of the dotted vertical lines. Note this is not necessarily the first day in the month.
A downward trend indicates a run of more deaths than expected. An upward trend indicates a run of fewer deaths than expected.
Key organization learning from mortality review this quarter:
For more detail on septicaemia see 6.1 Management of sepsis. Learning from the Mortality Review Group is available in the quarterly
Learning from Deaths Report. Recent reviews include: acute kidney injury and the Haematology and Oncology Service where end of life care was the primary focus. Examination of those deaths occurring within the Critical Care unit is planned.
The 2018 MBRRACE- UK [Mothers and Babies: Reducing risk through Audits and Confidential Enquiries] records an extended perinatal mortality rate across England in the 2016 calendar year of 4.79 per 1,000 births; the Trust’s rate is 4.80 per 1,00 births. [Adjusted figures, comparator group: 2000-3999 births].
Figure 20
Figure 21
19
6. Harm associated with deterioration
According to the NRLS in 2015 around 7% of patient safety incidents reported as resulting in death or severe harm related to failure to recognize or act on deterioration. Research has shown that 26% of preventable deaths concern failures in clinical monitoring, failure to set up systems, respond to deterioration and act on test results (NHS Improvement [NHSI]).
The Royal College of Physicians recommend that clinical assessment of all adults is standardized across providers with the routine recording of a minimum clinical data set of physiological parameters — National Early Warning Score (NEWS). The Trust’s nursing key performance indicators (KPIs) monitor monthly compliance with NEWS based on the take five audit standards. Since April 2018 a NEWS score [with observations undertaken] is recorded in 93% of those case notes sampled on general wards. 7
According to NHSI those organizations and teams that place NEWS within a whole system of care produce better outcomes for patients.
6.1 Management of sepsis
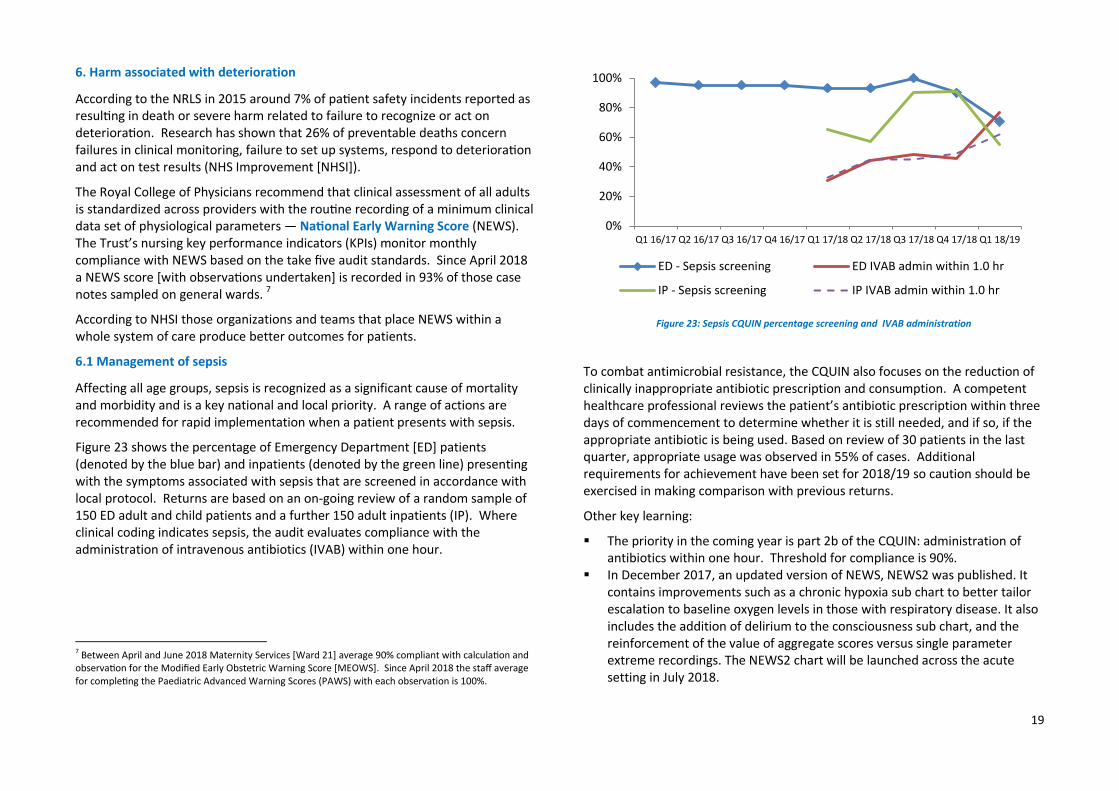
Affecting all age groups, sepsis is recognized as a significant cause of mortality and morbidity and is a key national and local priority. A range of actions are recommended for rapid implementation when a patient presents with sepsis.
Figure 23 shows the percentage of Emergency Department [ED] patients (denoted by the blue bar) and inpatients (denoted by the green line) presenting with the symptoms associated with sepsis that are screened in accordance with local protocol. Returns are based on an on-going review of a random sample of 150 ED adult and child patients and a further 150 adult inpatients (IP). Where clinical coding indicates sepsis, the audit evaluates compliance with the administration of intravenous antibiotics (IVAB) within one hour.
7 Between April and June 2018 Maternity Services [Ward 21] average 90% compliant with calculation and observation for the Modified Early Obstetric Warning Score [MEOWS]. Since April 2018 the staff average for completing the Paediatric Advanced Warning Scores (PAWS) with each observation is 100%.
Figure 23: Sepsis CQUIN percentage screening and IVAB administration
To combat antimicrobial resistance, the CQUIN also focuses on the reduction of clinically inappropriate antibiotic prescription and consumption. A competent healthcare professional reviews the patient’s antibiotic prescription within three days of commencement to determine whether it is still needed, and if so, if the appropriate antibiotic is being used. Based on review of 30 patients in the last quarter, appropriate usage was observed in 55% of cases. Additional requirements for achievement have been set for 2018/19 so caution should be exercised in making comparison with previous returns.
Other key learning:
The priority in the coming year is part 2b of the CQUIN: administration of antibiotics within one hour. Threshold for compliance is 90%.
In December 2017, an updated version of NEWS, NEWS2 was published. It contains improvements such as a chronic hypoxia sub chart to better tailor escalation to baseline oxygen levels in those with respiratory disease. It also includes the addition of delirium to the consciousness sub chart, and the reinforcement of the value of aggregate scores versus single parameter extreme recordings. The NEWS2 chart will be launched across the acute setting in July 2018.
VTE causes appreciable death and long-term morbidity. Emerging evidence suggests that a proportion of cases of VTE acquired in healthcare settings are preventable through more effective risk assessment and chemical and mechanical prophylaxis. In order to achieve a sustainable VTE process, the clinical leads for VTE and the Clinical Audit and Effectiveness have agreed a priority work stream to commence in QTR2 2018/19 to finalize an online root cause analysis tool. Results will be reviewed at the VTE Steering Group.
Figure 24 shows local VTE risk assessment compliance. The median is 95.7% over the reporting period. This is the central point at which half the observations are expected to be above and below. Performance continues to meet the national threshold of 95%.
There is further work planned to support the completion of risk assessments by introducing a S1 icon to remind during ward rounds of the need to re-assess for VTE. This will be particularly useful within surgical specialties.
The new VTE follow-up clinic commenced during April 2018 for patients with a confirmed event and it is anticipated evaluation will be undertaken during Q3 2018/19 in relation to efficacy.
6.3 Cardiac arrest
According to the National Confidential Enquiry into Patient Outcome and Death (NCEPOD), improved assessment on hospital admission and recognition and response when acutely ill patients deteriorate can prevent cardiac arrest and subsequent resuscitation attempts in a third of cases. National recommendations include improvements in decision-making around what care is likely to benefit acutely unwell patients, including do not attempt cardiopulmonary resuscitation (DNACPR) decisions where appropriate.
Figure 25 shows the number of confirmed cardiac/respiratory arrests across services.
Care of the patient is reviewed 24 hours prior to the arrest to ascertain whether deterioration has been identified and acted on. Fifteen cases are being reviewed for the last quarter. Any issues concerning DNACPR are also considered; whilst some cases are in process of review, two incidences of concern have been identified this quarter.
Figure 25: Count of cardiac/respiratory arrests across services
90.0%
91.0%
92.0%
93.0%
94.0%
95.0%
96.0%
97.0%
98.0%
99.0%
Airedale
National
Target
Median
0
1
2
3
4
5
6
7
8
Inpatient wards Specialist areas
21
Key organization learning from arrests:
Some evidence of improved documentation in previous areas of concern, notably NEWS recording.
Standard Operating Procedures [SOP] in Pharmacy prevented issuing emergency drugs at the time of need. Ward staff acted appropriately and there was no patient harm. Actions to address this include: Pharmacy SOP update; information highlighted to individuals and cascaded within the Pharmacy team; the revised Resuscitation Policy is to include link to SOP.
It is essential to identify patients for whom CPR is inappropriate. It is also important to recognize those patients who would not want CPR to be attempted in the event of cardiopulmonary arrest and who competently refuse this treatment option. The aim of the monthly DNACPR audit is to provide assurance that the Do Not Attempt cardiopulmonary Resuscitation (DNACPR) Policy is being correctly adhered to throughout the Trust.
Key learning identified from the DNACPR Audit:
DNACPR forms are not completely filled in, printed out, or signed by practitioners.
o Incomplete patient demographic data on S1 results in the form being unpopulated. Issue is to be raised with TPP/ software developers.
o Errors on forms generated in the community setting outside our service domain have been highlighted to commissioner.
Identifying patients with a DNACPR in an emergency to avoid CPR remains challenging. This is particularly apparent where a patient has moved through care settings. Electronic flagging of DNACPR to ensure alert on handover sheets and smartboards has been incorporated into S1. [Nursing kardex red sticker continues as aide memoir.]
Forms should travel with the patient and be reviewed on change of care setting. Instructions have been added to new Discharge Policy.
All of the above points have been highlighted via the governance process. The clinical lead is working with the Medical Director to ensure learning points and common procedures relating to DNACPR are disseminated effectively to medical
staff.
6.4 Acute Kidney Injury
As a significant source of harm – between five and 15% of all admitted hospital patients are affected - the early detection and effective management of Acute Kidney Injury [AKI] is a key priority for the Trust in 2018/19. AKI is not a physical injury to the kidney, but is a sudden reduction in kidney function and usually occurs without symptoms, making it difficult to identify.
The primary aim of NHS England’s acute kidney programme “Think kidneys” is to reduce the risk of acute kidney injury. To do so, establishing local and national data collection and audit is paramount. A standardised data flow via the implementation of a nationally agreed algorithm for laboratory information management systems for the early detection of AKI has been established. Our Pathology Service is one of the 72 per cent of laboratories across England reporting AKI warning stage test results to the UK Renal Registry.
Following the introduction of an AKI bundle in September 2017 [AKI 8 change package] and an underpinning education programme to coincide with the junior doctor changeover, a pilot commenced on the Acute Admissions Unit in October 2017. Subsequent modifications to the AKI8 tool have been made with further adjustments planned to ensure effective utilization. Compliance with the bundle appears to be generally improving although evidence that this is making a difference to either AKI incidence or clinical outcome is lacking. The issue of AKI will be discussed at the July 2018 Medical Governance meeting to identify a strategy going forwards.
A mortality case note review undertaken over the last quarter by the Mortality Review Group highlighted the challenge of identifying patients with a hospital acquired AKI from patients with AKI on arrival, making assessment of care and treatment difficult.
22
7. Written complaints
Patient complaints offer insight into safety-related problems which may not be identified by traditional systems of healthcare monitoring (e.g. incident reporting systems, clinical audit and case review). Whilst it is acknowledged that a high complaint rate can be indicative of a proactive culture where organizations seek feedback via a complaints process, it is difficult to judge this from the published data, and therefore the view is taken that a high complaint rate is less desirable.
The last four years has seen a year on year decrease in the number of formal complaints with 59 reported in the previous year. Review of KO41 categorisation highlights issues around clinical treatment, delay in treatment and communication to patients.
Across England hospital and community services in 2016/17 - latest available intelligence - there was an increase in complaints of 1.4%; across Yorkshire and Humber there was an increase of 8.6%.
Figure 26 shows the rate of new complaints per 10,000 finished consultant episodes [FCE] over the latest available quarters compared to all acute trusts [based on NHS Digital experimental statistics]. On average over this period the Trust has 9.6 complaints per 10,000 FCE compared to 39.7 for all acute providers.
Figure 26: New complaints per 10,000 FCE [NHS Digital]
Table 2: 2018/19 written complaints and outcome frequency
Source: NHS Digital. Updated: QTR2 2018/19.
Number
Number
Upheld
Number
Partially
Upheld
Number
Not
Upheld
England 113,989 33.7% 30.4% 35.9%
NHS England North (Yorkshire and
Humber) 12,040 31.3% 29.5% 39.2%
Airedale NHS FT 59 17.9% 55.2% 26.9%
Bradford Teaching Hospitals NHS FT 556 36.1% 28.9% 35.0%
In the 2017 NHS Inpatient Survey the score for providing information explaining how to complain about the care received was 3.0 out of a possible 10 (the higher score the better). The Trust is performing “about the same” for that particular question as most other providers that took part in the survey.
Aggregate overview for 2018/19
Since April 2018 there have been 16 complaints. Staff have reported – via the Ulysses incident system – 20 potential/written patient complaints over the last quarter.
Ten complaints concern clinical treatment. Two others relate to communication/information to patients.
No complaints were risk rated red over this period. 8 Integrated Medical Care Group recorded the highest number of complaints
across service groups with seven formal notifications. The location with the highest number of complaints is: ED [four complaints-
one shared with Ward 17].
8 Risk rated red: immediate escalation to the executive team for further advice.
Gynaecology has received two formal complaints. Other specialties: General Surgery, T&O and Obstetrics.
Three complaints originated as a PALS contact [two concern clinical treatment Ward 6 & Gynaecology; and the other delay in admission T&O].
Around a third of the complaints concern those aged 65 and over [8 complaints].
Three complaints originate from a BAME group [two in previous year]. There are currently six breaches of the 40 day procedural standard for the
management and investigation of complaints [three in the previous quarter]. The agreement of the terms of reference, availability of complainant, clinical staff, and other organisations/agencies are factors that can delay investigation.
Zero complaints were referred to the PHSO for investigation and none were upheld.
Key recommendations made by the PHSO during this quarter:
None advised.
7.1 Patient Advice and Liaison Service (PALS)
The organization receives a significant amount of feedback about its care and services from the issues raised from contacts with the Patient Advice and Liaison Service (PALS). The top five themes raised in the previous year are ranked as follows: [1] care and treatment; [2] communication; [3] environment; [4] attitude and behaviors, and, [5] waiting times. Review of attitude and behaviors show that around 39% concern nursing/midwifery staff, 32% doctors and almost 16% medical secretaries and receptionists [other staff groups 13%].
Aggregate overview for 2018/19:
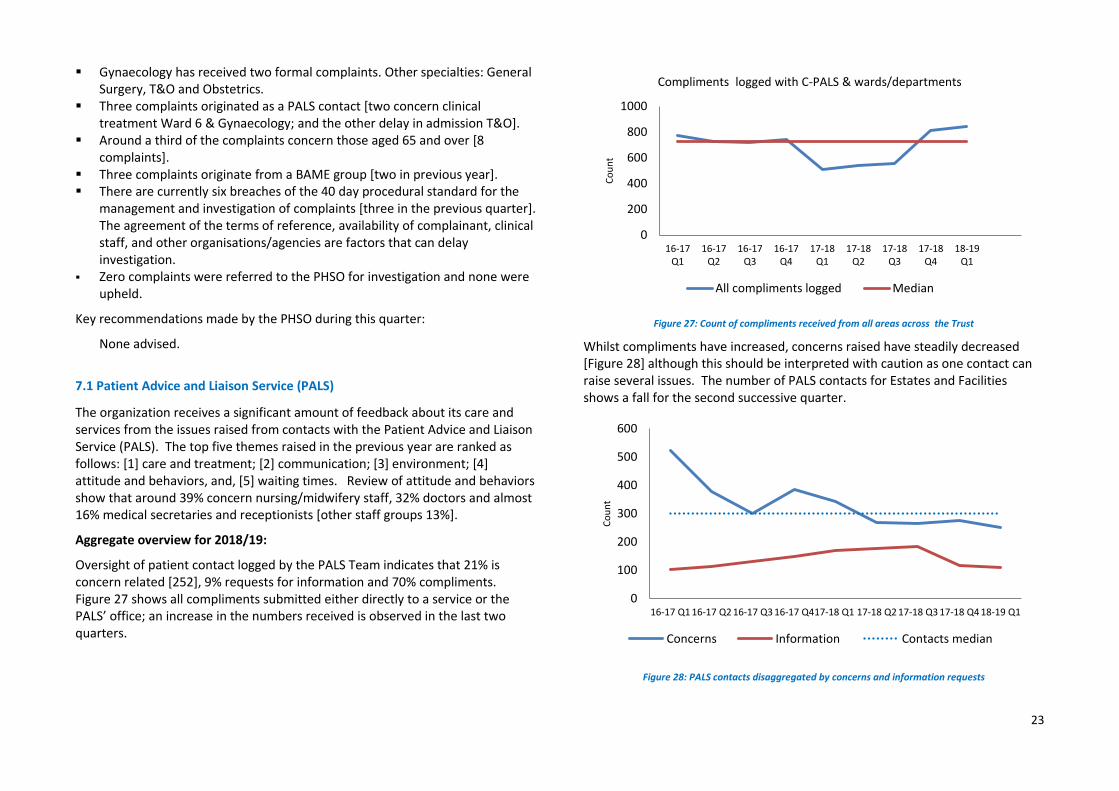
Oversight of patient contact logged by the PALS Team indicates that 21% is concern related [252], 9% requests for information and 70% compliments. Figure 27 shows all compliments submitted either directly to a service or the PALS’ office; an increase in the numbers received is observed in the last two quarters.
Figure 27: Count of compliments received from all areas across the Trust
Whilst compliments have increased, concerns raised have steadily decreased [Figure 28] although this should be interpreted with caution as one contact can raise several issues. The number of PALS contacts for Estates and Facilities shows a fall for the second successive quarter.
Figure 28: PALS contacts disaggregated by concerns and information requests
0
200
400
600
800
1000
16-17Q1
16-17Q2
16-17Q3
16-17Q4
17-18Q1
17-18Q2
17-18Q3
17-18Q4
18-19Q1
Co
un
t
Compliments logged with C-PALS & wards/departments
Poor communication, particularly around discharge; Estates: car parking and process for fines; and, Attitude and behaviour of staff, predominantly medical and nursing staff.
Key organizational learning:
Provide support to lead investigators of complaints through development of a training package/tool to ensure a timely and responsive approach to complaint management.
25
8. Appendix: national clinical audit benchmarking
The National Hip Fracture Database (NHFD) is a national clinical audit based at the Royal College of Physicians. Data on all aspects of hip fracture care is collected and fed back to staff to allow tracking of performance and facilitation of quality improvement.