DRAFT Outcomes: DM – Decision Making DS – Discussion IE- Information/Education Strategic Direction: PDC – Person Driven Care EPP – Engaged and Proactive People SHC – Sustainable Health Care 1 BOARD OF DIRECTORS’ MEETING DATE: May 18, 2016 TIME: 13:20 PLACE: Labelle Head Office Boardroom AGENDA TIME ITEM NUMBER TOPIC SPEAKER POLICY REFERENCE OUTCOME STRATEGIC DIRECTION IN CAMERA 1.0 In-camera Denise Alcock √ 13:20- 13:30 2.0 Call to Order 2.1 Welcome 2.2 Declaration of Conflict of Interest Denise Alcock Denise Alcock V- B- 14 3.0 Approval of Agenda (including the consent agenda) Denise Alcock DM 4.0 Consent Agenda (Any Board Member may request that any item be removed from this consent agenda and moved to the regular agenda) Denise Alcock DM 4.1 Minutes from the April 20, 2016 Board meeting DM ALL 4.1.1 Status of Follow-up/Action Items from Previous Board Minutes IE ALL 4.2 Client Services, Quality and Safety Committee Membership DM 4.3 Draft Client Services, Quality and Safety Committee Minutes IE ALL 4.4 Draft Finance and Audit Committee Minutes IE 4.4.1 Financial Statements IE SHC 4.4.2 Multi-Sector Service Accountability Agreement (MSAA) Declaration of Compliance DM
Transcript
DRAFT
Outcomes: DM – Decision Making DS – Discussion IE- Information/Education Strategic Direction: PDC – Person Driven Care EPP – Engaged and Proactive People SHC – Sustainable Health Care
1
BOARD OF DIRECTORS’ MEETING DATE: May 18, 2016
TIME: 13:20 PLACE: Labelle Head Office Boardroom
AGENDA
TIM
E
ITEM
NU
MB
ER
TOPIC
SP
EA
KER
PO
LIC
Y
REFER
EN
CE
OU
TC
OM
E
STR
ATEG
IC
DIR
EC
TIO
N
IN
CA
MER
A
1.0
In-camera
Denise Alcock
√
13:20-13:30
2.0
Call to Order 2.1 Welcome 2.2 Declaration of Conflict of Interest
Denise Alcock Denise Alcock
V-B-14
3.0
Approval of Agenda (including the consent agenda)
Denise Alcock
DM
4.0
Consent Agenda (Any Board Member
may request that any item be removed from this consent agenda and moved to the regular agenda)
Denise Alcock
DM
4.1 Minutes from the April 20, 2016 Board meeting
DM ALL
4.1.1 Status of Follow-up/Action Items from Previous Board Minutes
IE ALL
4.2 Client Services, Quality and Safety Committee Membership
DM
4.3 Draft Client Services, Quality and Safety Committee Minutes
IE ALL
4.4 Draft Finance and Audit Committee
Minutes
IE
4.4.1 Financial Statements IE SHC
4.4.2 Multi-Sector Service
Accountability Agreement (MSAA) Declaration of Compliance
DM
DRAFT
DRAFT
Outcomes: DM – Decision Making DS – Discussion IE- Information/Education Strategic Direction: PDC – Person Driven Care EPP – Engaged and Proactive People SHC – Sustainable Health Care
2
TIM
E
ITEM
NU
MB
ER
TOPIC
SP
EA
KER
PO
LIC
Y
REFER
EN
CE
OU
TC
OM
E
STR
ATEG
IC
DIR
EC
TIO
N
IN
CA
MER
A
13:30-13:45
5.0
Board Chair and CEO Report (verbal)
Denise Alcock & Marc Sougavinski
DS
13:45-14:15
6.0
Patient Story
Catherine Butler
DS
14:15-14:45
7.0
Quality and Financial Reports 7.1 Scorecard and Financial and Performance Results 7.2 2016-2017 Scorecard
Maria Barrados/ Deryl Rasquinha
IE
DM
14:45-14:55
8.0
Community Reports (verbal)
Denise Alcock
IE
14:55-15:00
9.0
Other Business 9.1 Public questions and comments
Denise Alcock
IE
Adjournment
Denise Alcock
DM
Minutes – Champlain CCAC Board of Directors, April 20, 2016
Champlain Community Care Access Centre Centre d’accès aux soins communautaires de Champlain
Head Office
4200 Labelle Street Suite 100 Ottawa ON K1J 1J8 Siège social 4200, rue Labelle Bureau 100 Ottawa ON K1J 1J8
Vice-President, People and Organizational Development
Executive Assistant
Vice-President, Performance and Strategy
RECORDER: Ashley Haugh Executive Assistant
GUESTS:
AGENDA ITEM ACTION TO BE
TAKEN
1.0 CALL TO ORDER
1.1 Welcome
Denise Alcock, Board Chair, welcomed everyone to the meeting.
1.2 Declaration of Conflict of Interest
There was no declaration of conflict.
2
Minutes – Champlain CCAC Board of Directors, April 20, 2016
2.0 APPROVAL OF AGENDA
It was moved by Andrée Durieux-Smith, seconded by Diane Hupé and agreed to
approve the agenda, including the consent agenda for the April 20, 2016 meeting.
CARRIED
Motion Carried
04-16-16
3.0 CONSENT AGENDA
The consent agenda for the April 20, 2016 Champlain CCAC Board meeting
contained the following information items and motions:
3.1 That the Champlain CCAC Board approves the minutes of the March 23,
2016 meeting.
3.1.1 Status of Follow-up/Action Items from previous Board minutes
3.2 That the Champlain CCAC Board approves the 2016-2017 Board work plan.
3.3 Draft Client Services, Quality and Safety Committee (CSQS) minutes
containing the following updates:
o Quality reports
o CSQS committee 2016-2017 work plan and presentation schedule
o Update on accreditation
o Update on the Champlain CCAC Action Plan
o Enhanced Clinical Oversight of Service Provider Organizations (SPOs)
on Clinical Service Expectations
o Annual Privacy program update
o Scorecard review
o 2014-2017 Multi-Sector Service Accountability Agreement (MSAA) –
2016-2017 amendments
3.4 Draft Finance Committee and Audit Committee minutes containing the
following updates: o Scorecard review o 2014-2017 Multi-Sector Service Accountability Agreement (MSAA) –
2016-2017 amendments
o Labelle lease
o Monthly financial results & year-end projection
o 2016-2017 fiscal outlook
o Service Provider Organization (SPO) inspection strategy
o Committee 2016-2017 work plan and presentation
3.4.1 Financial Statements
Approved by motion 04-16-16
3
Minutes – Champlain CCAC Board of Directors, April 20, 2016
4.0 BOARD CHAIR AND CEO REPORT
The Board Chair reported:
There has been continued conference calls for CCAC Board Chairs regarding
the upcoming health system structural change. The other main topic on the
conference calls has been the upcoming Ontario Association of Community
Care Access Centres (OACCAC) conference.
The Ontario Hospital Association is hosting a regional meeting on May 16 in
Ottawa regarding health system reconfiguration. The Deputy Minister of
Health and Long-Term Care (MOHLTC) is attending.
The peer-to-peer Board evaluations will be sent to Board members shortly. If
you have any questions contact the Board Chair.
The CEO reported:
On April 26 the CEOs of the CCACs and Local Health Integration Networks
(LHINs) are meeting with the Deputy Minister and Associate Deputy Minister
of MOHLTC.
The Standing Committee on Public Accounts at Queen’s Park has asked for an
update on the CCAC section of the Auditor General’s Annual Report. The
Committee has invited MOHLTC, the OACCAC and the CEOS of the three
CCACs audited (Champlain, Central and North East) to appear before the
Committee on May 11.
5.0 GOVERNANCE COMMITTEE REPORT
5.1 Annual General Meeting
The Board discussed the format of the Annual General Meeting (AGM):
Per the by-laws, the corporation is required to hold an AGM to elect the Board
of Directors, approve by-law amendments, receive the Audited Financial
Statements, and approve the appointment of Auditors.
In addition to these required “business” items, the AGM also included reports
from the committees, Board Chair and CEO. As well, there has also been a
guest speaker.
In this year of transition, the AGM will contain the traditional business items
as well as reports from committees, the Board Chair and CEO. There may also
be the opportunity to have a brief statement from a member of the Patient and
Caregiver Council
The IMPACT Centre could also be highlighted at the AGM.
5.2 Board Officers
An email will be sent to members shortly regarding interest in officer positions for
2016-2017.
4
Minutes – Champlain CCAC Board of Directors, April 20, 2016
6.0 PERSONAL SUPPORT SERVICES
The Board reviewed the Personal Support Services (PSS) strategy identified in the
Champlain CCAC Action Plan (#15) and the December 2015 Community Annual
Planning Submission (CAPS) submitted to the Champlain LHIN:
PSS visits will be focusing on services to be delivered rather than a block of
time.
Currently, patients are assessed for services needed (e.g., a bath, assistance
with getting out of bed, etc.) and are given a block of time for the service (e.g.,
an hour). However, the services often don’t require an hour of service so
workers are not always there for a full hour, stay in the home waiting for the
hour to end or do other non-ordered services.
By focusing on and paying for the services ordered there will be a reduction in
costs as visits will shift from one hour to approximately 45 minutes. The new
PSS strategy should have initial savings of $1-$1.5M which will assist with
the approximate $10M funding gap identified for 2016-2017.
The new PSS strategy will begin with new patients and will be implemented
for current patients during reassessments if appropriate.
There will be ongoing monitoring/evaluation of the PSS strategy.
The new strategy provides greater equity as all patients will be provided with
the services ordered rather than other services that may or may not be provided
if there is extra time.
Discussion included:
Soft skills/interpersonal skills are important skills for all workers entering the
home. While assisting patients with the ordered services, PSS workers should
be interacting with the patient and monitoring the physical and social
wellbeing.
Knowing a service will be an hour allows for a caregiver to go out and do
errands, a shorter period makes this more difficult.
Patient needs, including their support structure, are taken into consideration as part of the assessments done by the Care Coordinator.
Supplies over ordering continues to be examined by staff. There is a high cost
to same day deliveries so supplies are ordered based on projected needs or in
standard kits as this is more efficient than same day delivery costs. Unused
supplies cannot be returned to the SPO due to infection prevention and control.
As part of the recent supplies and equipment contract, the new vendor is
committed to reviewing this issue. Staff as well as patients and caregivers will
participate in this review.
Staff continues to examine measures to find efficiencies and reduce costs to
meet budget constraints.
Regular reports will be brought to the Board on the Action Plan and budget
strategies.
5
Minutes – Champlain CCAC Board of Directors, April 20, 2016
7.0 QUALITY AND FINANCIAL REPORTS
7.1 Scorecard and Financial and Performance Results
The scorecard was reviewed at the joint Client Services, Quality and Safety committee
and Finance and Audit committee and presented to the Board for information.
It is expected there will be an approximate $1.8M deficit for 2015-2016, less than 1%
of the budget. The deficit is carried over into 2016-2017.
7.2 2016-2017 Fiscal Outlook
Due to increased patient demand and increased acuity, there continues to be budget
pressures in 2016-2017. The CAPS submission estimated a $10M deficit. Staff
continues to examine measures to find efficiencies and reduce costs to meet budget
constraints. The Champlain LHIN is aware of the budget pressures.
7.3 Multi-Sector Service Accountability Agreement (MSAA)
The Board reviewed the 2016-2017 amendments to the 2014-2017 MSAA:
The MSAA was received on March 29 with an original sign back date of
March 31. An extension was granted until April 12, which allowed the CSQS
and Finance and Audit committees to review the document. It needed to be
signed back to the Champlain LHIN to allow the April 15 funding to flow.
Most targets will be met, however, with growing referrals and higher acuity patients and only a projected 0.5% base budget increase not all targets will be met.
An accompanying letter was sent to the Champlain LHIN outlining some of
the targets that may not be met. As included in the CSQS and Finance and
Audit committee minutes, this includes:
o Funding increases are not meeting the increases in patient demand and
acuity. The 2016-2017 CAPS submitted in December identified a
$10M funding gap. In January and February 2016, the Champlain
CCAC was operating at 106%-107% over capacity and this trend is
expected to continue. The organization does not want to wait list, but
there is also an obligation to have a balanced budget.
o The definition of balanced budget should be expanded to be plus or
minus 1%. CCACs should also be allowed to keep any surplus funds
and carry them over to the next budget year. Currently, if a CCAC has
a deficit it must be recovered in the next year’s budget, but surpluses
must be returned to the government.
o The Champlain CCAC welcomes the opportunity to share
administrative functions with the Champlain LHIN during this
transition period to meet the reduced target of 6.4% administrative
costs.
6
Minutes – Champlain CCAC Board of Directors, April 20, 2016
o The Champlain CCAC has the highest percentage of Very High and
High MAPLe patients (high acuity patients) in the province. High
acuity require more services per patient meaning less patients can be
served within the budget. This may mean the Champlain CCAC may
be slightly below the 60,328 patient target in the MSAA.
o The 5 day wait time for complex Personal Support Services (PSS)
patients (95 percentile) is based on a very small patient population
(approximately 100 patients per month) so a small portions of patients
can easily shift the results. The Champlain CCAC has been working
hard to meet this metrics. Some patients do request delayed starts to
their PSS services (approximately 6-8% each month) and these
patients are included in the definition for this target.
o The Champlain CCAC is a committed partner in the integration of
health services in Champlain. The CCAC was not involved in the 10
points listed as Community Support Services (CSS) initiatives in the
MSAA. We look forward to learning more about the initiatives.
Additional funding may be required to support implementation.
o The Champlain CCAC is committed to working with the Champlain
LHIN and the Ministry of Health and Long-Term Care (MOHLTC) in
the advancement of new programs. New initiatives introduced
throughout the year – e.g., physician assisted death, self-directed care,
caregiver strategy, etc. – will require additional funding.
o The Champlain CCAC identified approximately $500K in additional
funding requests in its 2016-2017 CAPS for Interactive Voice
Response (IVR) rollout, integration with CSS agencies, care plan
flexibility pilot, and a Lean project.
It was moved by Michael Ennis, seconded by Maria Barrados and agreed that the
Champlain CCAC Board agrees with the submission made for the 2016-2017
amendments to the 2014-2017 Multi-Sector Service Accountability Agreement.
CARRIED
Motion Carried
04-16-17
8.0 CHAMPLAIN CCAC ACTION PLAN
The Board reviewed the Champlain CCAC Action Plan priorities:
The Champlain CCAC Action Plan was developed to address issues identified
in the Board’s response to Patients First: A Proposal to Strengthen Patient-
Centred Health Care in Ontario. It also addresses items raised in the Office of
the Auditor General reports as well as the Ministry of Health and Long-Term
Care’s 10 point plan.
The Action Plan focuses on how the Champlain CCAC will maintain high
needs clients at home through 20 key initiatives grouped under three main
themes:
o Maintaining Increasingly Complex Patients at Home
7
Minutes – Champlain CCAC Board of Directors, April 20, 2016
o Modernizing and Improving the Home and Community Care Delivery
Model
o Sustainability for Growth
It is a living document and can be updated as needed as details of the system
transformation are confirmed.
Priority work for 2016-2017 has been identified under each of the 20 points in
the Action Plan. This work has been categorized into three main areas:
o Clinical care work related to patient experience/Quality Improvement
o Other work-in-progress or previously planned
o Mandatory work (e.g., MSAA, Government initiatives, etc.)
The categorizations take into consideration available resources – human and
financial.
An update report will be provided at each Board meeting.
Discussion included:
In this transition year in the health system, the Action Plan provides high level
guidance to the organization for the current year and the future. Each of the
items will have work plans developed by staff.
9.0 COMMUNITY REPORTS
The Board discussed CCAC Board member attendance at Champlain LHIN Board
meetings.
10.0 OTHER BUSINESS
10.1 Public Questions and Comments
There were no public questions or comments.
It was moved by Bill Skinner, seconded by Michael Ennis and agreed to move in-
camera.
CARRIED
It was moved by Robert D’Aoust, seconded by Melody Isinger and agreed to adjourn
DENISE ALCOCK, CHAIR MARC SOUGAVINSKI, CEO AND BOARD
SECRETARY
Champlain CCAC Board – May 18, 2016
Item 4.1.1 – Status of Follow-up/Action Items from Previous Board Minutes PAGE 1
Submission to the Board
Status of Follow-up/Action Items - Previous Board Minutes
May 18, 2016
INFORMATION ITEM
To provide an update on business arising from the previous Board minutes (as of April 20, 2016 meeting).
BACKGROUND/ISSUE
DATE OF MEETING FOLLOW-UP/ACTION REQUIRED UPDATE
March 23, 2016 In future Employee Engagement survey results include information on the total numbers/denominators when including figures.
March 23, 2016 Employee Engagement action plan to be brought back to the Board before summer.
Will take place at the June Board meeting.
March 23, 2016 Report on absenteeism at the April Board meeting.
Will take place at the June Board meeting combined with Employee Engagement.
Ashley Haugh, Executive Assistant
Item 4.2 – CSQS Committee Membership
MOTION
MAY 18, 2016
Champlain CCAC Board
Client Services, Quality and Safety (CSQS) Committee Membership
At the March 2016 Board meeting the Board approved appointing a member of the Patient and Caregiver Council or Patient Advisory Program to the CSQS. It was
determined that the Chairs of the Governance and CSQS committees and Patrice Connolly would meet with any potential candidates and make a recommendation to the Board.
Per the new Community Members on Board Committees policy, a Community
Member is appointed for a two year term and may be eligible for an additional, one-year term.
Moved by: Seconded by:
Be it resolved, That the Board approves appointing Russel Morton to the
Client Services, Quality and Safety Committee for a two year term beginning immediately (May 18, 2016).
Carried Defeated
Minutes – Champlain CCAC Client Services, Quality and Safety Committee – May 9, 2016
Champlain Community Care Access Centre Centre d’accès aux soins communautaires de Champlain
Head Office
4200 Labelle Street Suite 100 Ottawa ON K1J 1J8 Siège social 4200, rue Labelle Bureau 100 Ottawa ON K1J 1J8
It was moved by Abebe Engdasaw, seconded by Andrée Durieux-Smith and agreed
to approve the agenda for the May 9, 2016 meeting.
CARRIED
3.0 Approval of Minutes
It was moved by Andrée Durieux-Smith, seconded by Abebe Engdasaw and agreed
to approve the minutes of the April 11, 2016 meeting.
CARRIED
4.0 Business Arising
There was no business arising.
5.0 Quality Reports 5.1 Adverse Events There were no adverse events to report.
6.0 IMPACT Centre Update and Tour
The Committee received an update and tour of the IMPACT Centre:
People want to remain in their homes as long as possible. Technology is one way to assist patients, caregivers and families meet this goal.
The IMPACT Centre is working with health care technology developers and vendors to test, evaluate and recommend new technologies with patients and caregivers in real-life situations. The IMPACT Centre is set up to resemble a typical apartment with a kitchen, living area, bedroom and bathroom.
The goals of the IMPACT Centre are to: o Enhance patient safety o Enable patients and caregivers o Enable the circle of care o Enhance service quality
There are technologies that support socialization, monitoring, safety, etc. It allows authorized caregivers and members of the circle of care to monitor activities – e.g., sensors to see if the patient has gotten out of bed, opened the front door, opened the fridge, etc.
Want technology that is easy to use out of the box for the patient and the circle of care/families.
Staff is working with Bruyère and Carleton University on a potential research project to use data from the use of technology to be able to predict if a patient is at risk of a fall. Funding is required for this project.
Discussion included:
Started looking for vendors by reaching out and issued a Request for Proposal. There are a variety of business models possible to roll out the technologies, that are currently under review
Technologies can enable new practices. Where feasible, these practices will be evaluated in planned pilot sites looking at new models of care and enhanced care coordination
7.0 Employee Health and Wellness Annual Report The Committee reviewed the annual Employee Health and Wellness report:
The Employee Health and Wellness Program consists of: o Occupational Health and Safety Program o Infection Prevention and Control (IPAC) Program o Wellness Program o Mental Health Strategy
Overall, the CCAC is performing well in employee health and wellness. However, there are areas for improvement.
In 2016-2017, quarterly meetings of the six Joint Heath and Safety Committees (JHSC) at the Champlain CCAC will be scheduled in advance to ensure meetings are taking place in all locations. Inspections and follow-ups required will also be closely monitored.
The health and safety of employees and the workplace is important and this will continue to be a priority during this time of health system transformation.
Joint CSQS and Finance and Audit Committees
8.0 Scorecard Review
The Committees discussed the April scorecard (March data); the last scorecard for
the 2015-2016 year:
Overall, the Champlain CCAC has performed well.
Referral volume continues to remain higher than a year ago.
Significant progress has been made on service wait times in the community
over the past year and it is currently around 25 days; from close to 120 days
a year ago. Work continues to meet the provincial target of 21 days (90%
receiving service within 21 day).
The five day wait time for complex PSS continues to improve.
Patient complaint resolution time has generally increased, however, it is due
to the delay in the administrative closure of files not in the resolution of the
actual complaints. Work was done in April to administratively close the
5.0 Approval of Minutes The minutes were approved by consent.
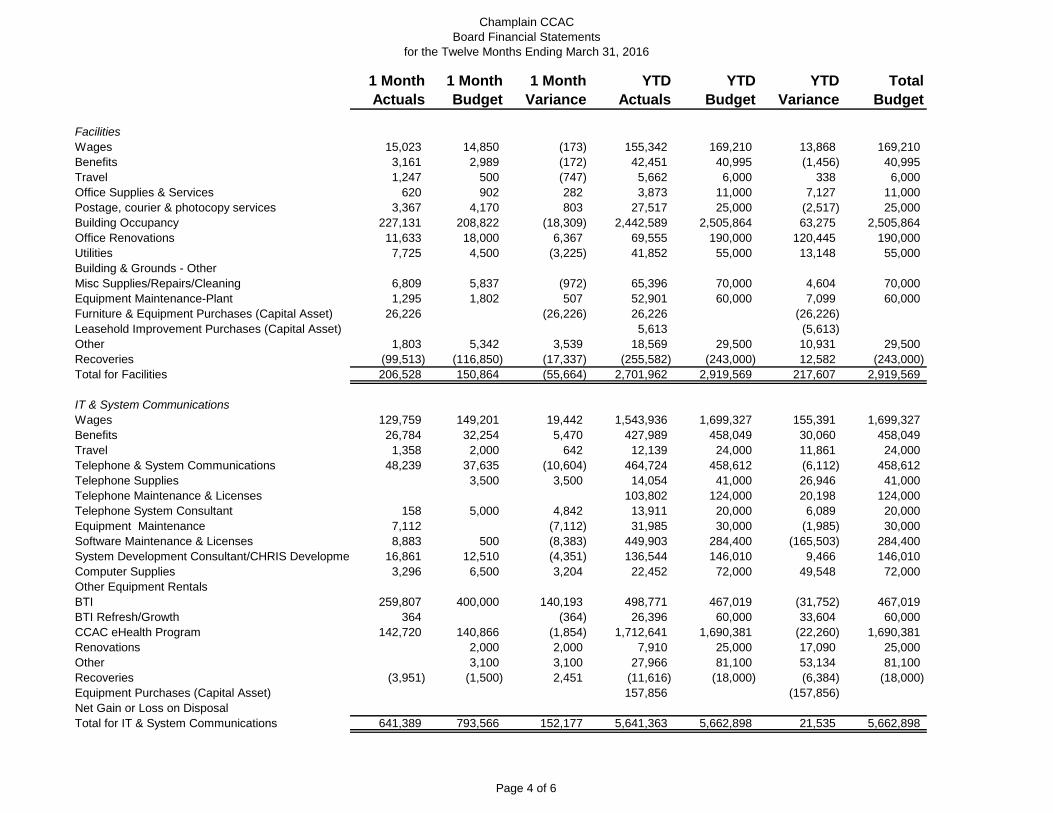
6.0 March 2016 – Year-End Financials The Committee reviewed the 2015-2016 year-end financials:
The Champlain CCAC ended the year with an approximate $1.8M deficit or less than 1% of the total budget. This will need to be recovered from the 2016-2017 budget.
An increase in Clinical Care expenditures due to increased patient referrals and acuity is the main reason for the deficit.
There were savings from staff vacancies, administration and other efficiencies.
Additional one-time and base funding received from the Champlain LHIN provided assistance at year-end.
Discussion included:
There is ongoing recruitment to hire vacant Care Coordinators, Rapid Response Nurses, etc. however, this does take time. Staff vacancies can lead to large caseloads.
The Committee thanked staff for their work to end the 2015-2016 year with less than 1% deficit.
7.0 Sustainability Initiatives It was moved by Sherryl Smith, seconded by Robert D’Aoust and agreed to move in-camera.
CARRIED
8.0 Standing Committee On Public Accounts Marc Sougavinski, CEO, will be appearing before the Standing Committee on Public Accounts on May 11 as a follow-up to the Auditor General’s 2015 Annual Report. The Ministry of Health and Long-Term Care, Ontario Association of Community Care Access Centres and the CEOs of the other two CCACs audited, Central and North East, will also be appearing before the Committee. A link to watch the meeting has been sent to all Board members. Follow-up required by the Champlain CCAC from the Auditor General’s report has been included in the Action Plan.
9.0 MSAA Declaration of Compliance Annually, the Board is required to sign the MSAA Declaration of Compliance and submit it to the Champlain Local Health Integration Network. The Champlain CCAC is complying with the MSAA. It was moved by Maria Barrados, seconded by Sherryl Smith and agreed to recommend the Board approve the MSAA Declaration of Compliance.
CARRIED It was moved by Robert D’Aoust, seconded by Sherryl Smith and agreed to adjourn the meeting.
CARRIED
ACTION: More details on the
three components of the
Declaration of Compliance to
be included in the overview for
the Board meeting.
CONFIRMED: __________________________________________ MARIA BARRADOS, CHAIR
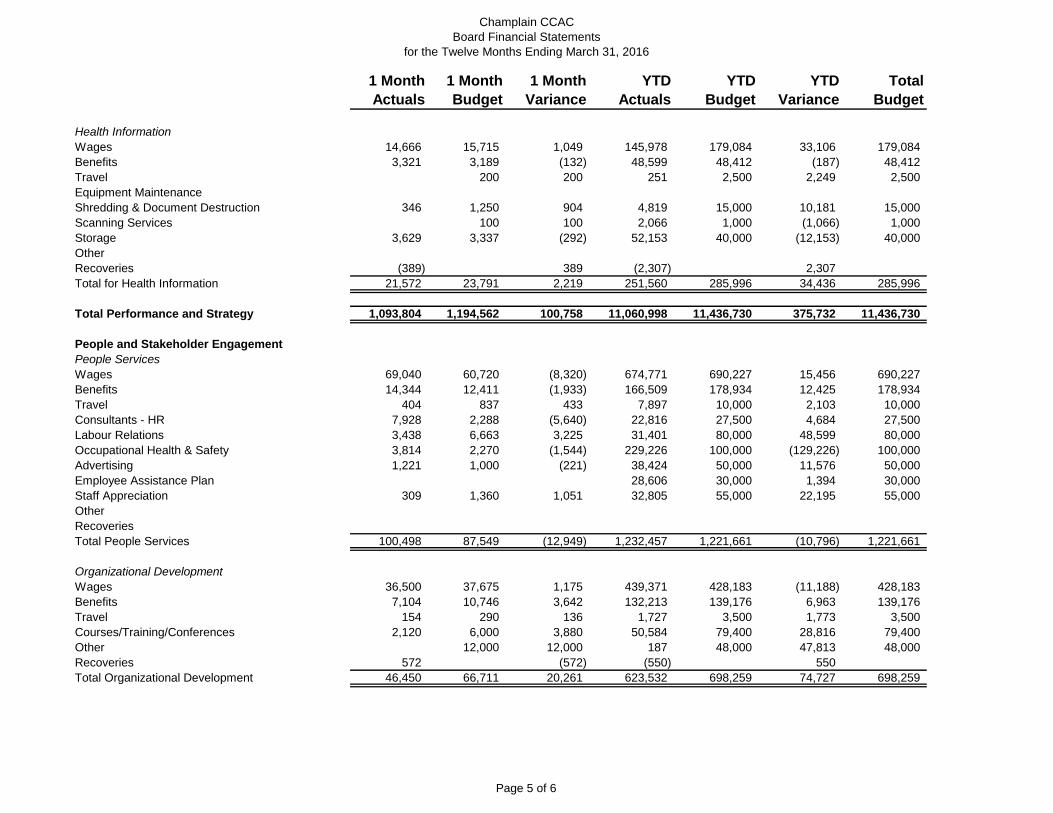
Total Stakeholder Engagement 64,030 60,225 (3,805) 661,501 691,934 30,433 691,934
Total People and Stakeholder Engagement 210,980 214,485 3,508 2,517,489 2,611,854 94,365 2,611,854
Total Administration 1,337,312 1,713,748 376,449 15,753,585 16,100,290 346,705 16,100,290
Total Expenses 21,760,936 20,648,117 (1,112,819) 238,949,587 234,992,146 (3,957,441) 234,992,146
Revenue less Expenses 290,180 290,180 (1,848,067) (1,848,067)
Page 6 of 6
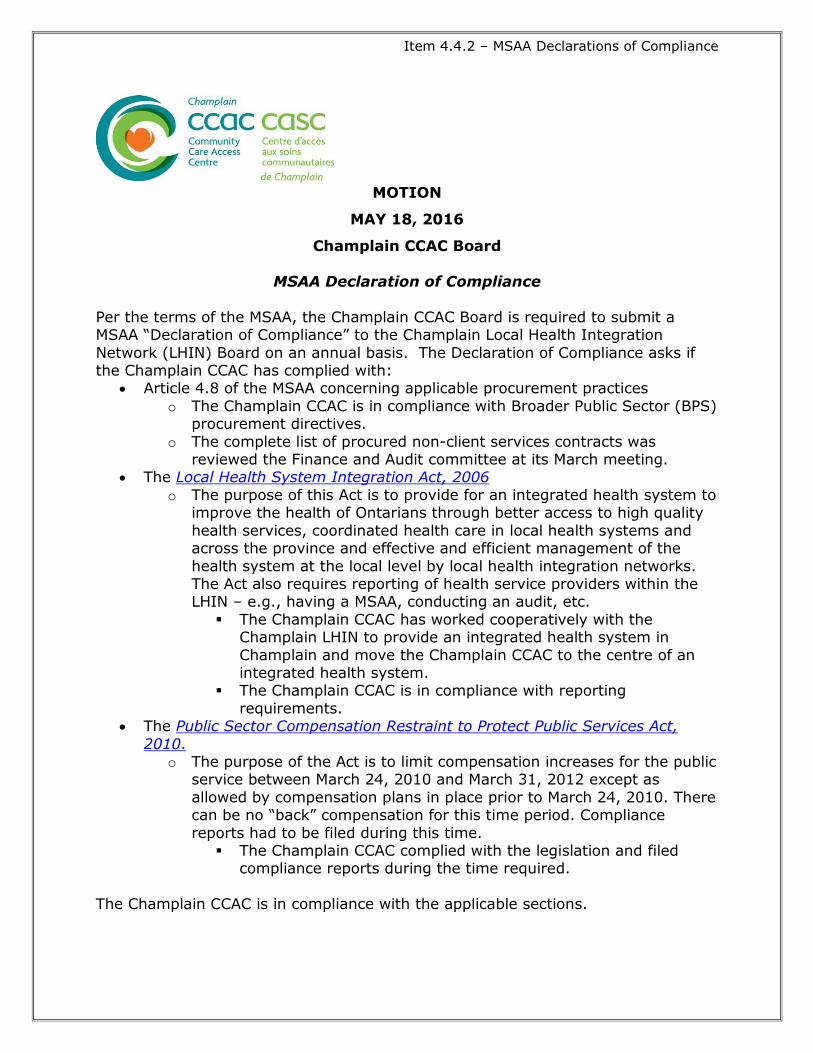
Item 4.4.2 – MSAA Declarations of Compliance
MOTION
MAY 18, 2016
Champlain CCAC Board
MSAA Declaration of Compliance
Per the terms of the MSAA, the Champlain CCAC Board is required to submit a MSAA “Declaration of Compliance” to the Champlain Local Health Integration
Network (LHIN) Board on an annual basis. The Declaration of Compliance asks if the Champlain CCAC has complied with:
Article 4.8 of the MSAA concerning applicable procurement practices
o The Champlain CCAC is in compliance with Broader Public Sector (BPS) procurement directives.
o The complete list of procured non-client services contracts was reviewed the Finance and Audit committee at its March meeting.
The Local Health System Integration Act, 2006
o The purpose of this Act is to provide for an integrated health system to improve the health of Ontarians through better access to high quality
health services, coordinated health care in local health systems and across the province and effective and efficient management of the
health system at the local level by local health integration networks. The Act also requires reporting of health service providers within the LHIN – e.g., having a MSAA, conducting an audit, etc.
The Champlain CCAC has worked cooperatively with the Champlain LHIN to provide an integrated health system in
Champlain and move the Champlain CCAC to the centre of an integrated health system.
The Champlain CCAC is in compliance with reporting
requirements. The Public Sector Compensation Restraint to Protect Public Services Act,
2010. o The purpose of the Act is to limit compensation increases for the public
service between March 24, 2010 and March 31, 2012 except as
allowed by compensation plans in place prior to March 24, 2010. There can be no “back” compensation for this time period. Compliance
reports had to be filed during this time. The Champlain CCAC complied with the legislation and filed
compliance reports during the time required.
The Champlain CCAC is in compliance with the applicable sections.
In addition, the Champlain CCAC submits monthly reports to the Champlain LHIN on the MSAA metrics and progress towards achievements. This is also included in
the monthly Board Finance report.
The Finance and Audit Committee recommends Board approval of the MSAA compliance.
Moved by: Seconded by:
Be it resolved, That the Board approves the annual MSAA Declarations of
Compliance for April 1, 2015-March 31, 2016.
Carried Defeated
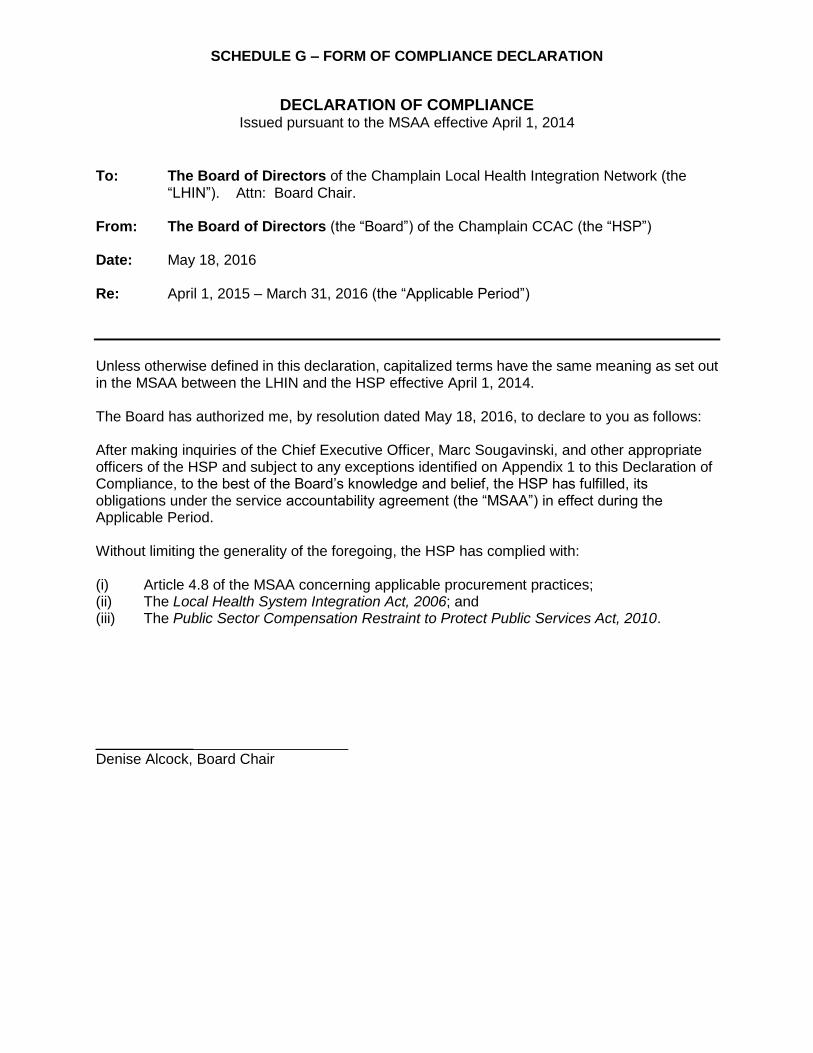
SCHEDULE G – FORM OF COMPLIANCE DECLARATION
DECLARATION OF COMPLIANCE Issued pursuant to the MSAA effective April 1, 2014
To: The Board of Directors of the Champlain Local Health Integration Network (the
“LHIN”). Attn: Board Chair. From: The Board of Directors (the “Board”) of the Champlain CCAC (the “HSP”) Date: May 18, 2016 Re: April 1, 2015 – March 31, 2016 (the “Applicable Period”)
Unless otherwise defined in this declaration, capitalized terms have the same meaning as set out in the MSAA between the LHIN and the HSP effective April 1, 2014. The Board has authorized me, by resolution dated May 18, 2016, to declare to you as follows: After making inquiries of the Chief Executive Officer, Marc Sougavinski, and other appropriate officers of the HSP and subject to any exceptions identified on Appendix 1 to this Declaration of Compliance, to the best of the Board’s knowledge and belief, the HSP has fulfilled, its obligations under the service accountability agreement (the “MSAA”) in effect during the Applicable Period. Without limiting the generality of the foregoing, the HSP has complied with: (i) Article 4.8 of the MSAA concerning applicable procurement practices; (ii) The Local Health System Integration Act, 2006; and (iii) The Public Sector Compensation Restraint to Protect Public Services Act, 2010.
Schedule G – Form of Compliance Declaration Cont’d.
Appendix 1 - Exceptions
[Please identify each obligation under the MSAA that the HSP did not meet during the Applicable Period, together with an explanation as to why the obligation was not met and an estimated date by which the HSP expects to be in compliance.]
No exceptions
Champlain
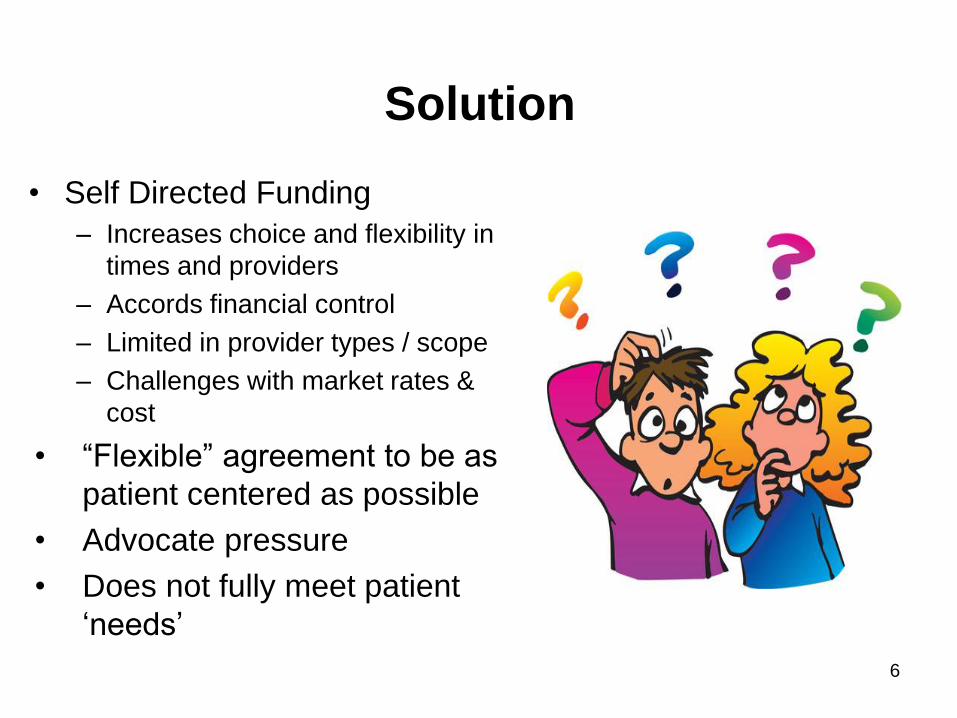
One Family’s Journey
Champlain CCAC Board Presentation
May 18, 2016
Presented by:
Catherine Butler – VP, Clinical Care
Key Points About the Situation
• Patient is early teens with a rare genetics disorder and lives
at home with devoted parents
• Care delivered in “hospital in the home” environment
• Caregiver stress
• Care Plan includes 39 Nsg hrs/wk & 8.75 PSW hrs/wk
• Also receives monetary support through MCYS but no
mechanism to combine funding or flow through one agency
for ease of reporting
• Medically complex and medically fragile patient
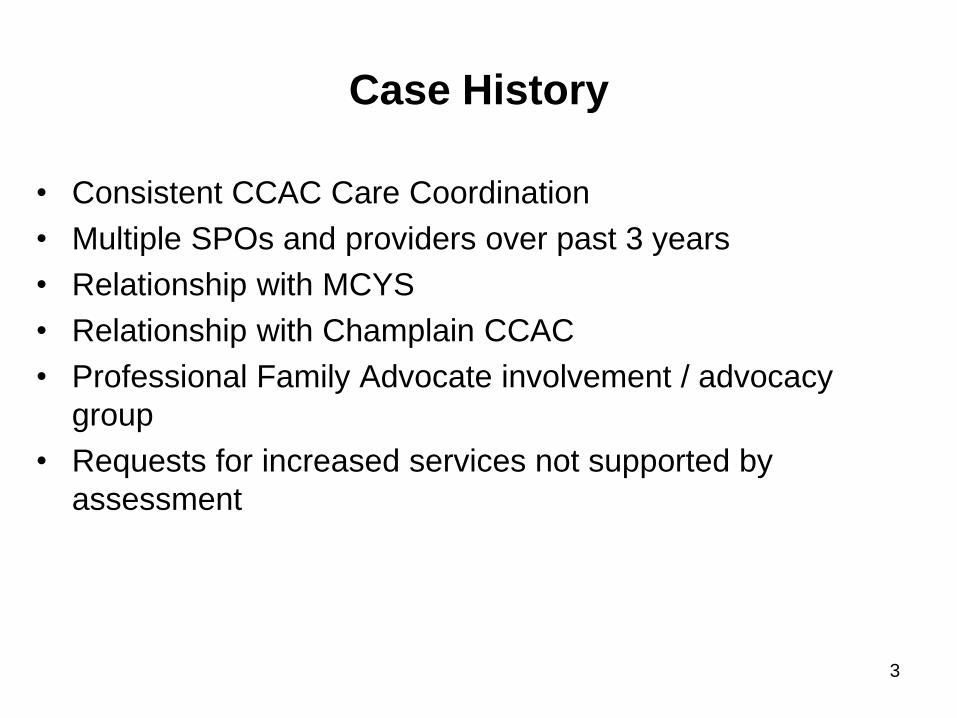
Case History
• Consistent CCAC Care Coordination
• Multiple SPOs and providers over past 3 years
• Relationship with MCYS
• Relationship with Champlain CCAC
• Professional Family Advocate involvement / advocacy
group
• Requests for increased services not supported by
Absenteeism annualized rate 10.2 9 days 12.3 12.5 N/A
Staff WSIB Reported Incidents 1 1 1 1 0.7
Champlain
3
Financial People
Patient Trends Definition Discussion Questions
Referral Volume
The count of new referrals to the CCAC during the time period. Only referrals that initiate Case Management intake Assessments are counted in this indicator.
Is CCAC demand increasing? Is it from hospitals, physicians, or community?
Intake queue wait time
90th percentile days waited from the patient’s referral date to the date of the Intake Assessment.
How is patient risk being managed for patients waiting for service? What options exist to streamline intake?
Total Personal Support Services (PSS) Patients Waitlisted
A snapshot view of the count of the number of PSS patients on the waitlist as at the end of the month, divided by those who are fully waitlisted (having no PSS service), and those that are partially waitlisted (having some PSS service, but assessed for needing more).
What is being done to manage patient risk?
Total Physiotherapy (PT) Patients Waitlisted
A snapshot view of the count of the number of PT patients on the waitlist as at the end of the month
How are patient risks being managed?
Total Occupational Therapy (OT) Patients Waitlisted
A snapshot view of the count of the number of OT patients on the waitlist as at the end of the month
How are patient risks being managed?
Patient Trends Definition Discussion Questions
Service Wait-timeCommunity (90th
Percentile Days Waiting)
Wait time from patient intake / application date for referrals sourced from the community (e.g. Family, Self) to receiving the first direct care service visit, where the patient is an adult patient on Home Care services. The 90th percentile focuses on ensuring that 90% of patients will receive a visit in the targeted time frame, or better.
Should service eligibility or service guidelines be reviewed/reduced? What advocacy should the Board engage in?
5 day wait time –Complex PersonalSupport Services (PSS)
Measures the percent of patients whose 1st PSS visit was achieved within 5 days, from Service Authorization Date to the 1st PSS Visit Date for the episode of care. Patients with an “On-Hold” episode between the authorization and 1st visit, are excluded from the measure. (On hold is used, for example, if a patients discharge is delayed from hospital due to complications)
How have Quality Improvement Plan (QIP) action plans improved performance?
5 day wait time -Nursing
Measures the percent of patients whose 1st Nursing visit was achieved within 5 days, from Service Authorization Date to the 1st Nursing Visit Date for the episode of care. Patients with an “On-Hold” episode between the authorization and 1st visit, are excluded from the measure. (On hold is used, for example, if a patients discharge is delayed from hospital due to complications)
How have QIP action plans improved performance?
Patient Complaints Resolution Time
Measures the number of days for a complaint to be resolved with the patient, from the time the complaint was recorded.
How are we doing with addressing patients’ needs and/or resolving issues?
Patient Experience
Measures the percent positive rating for overall satisfaction with care. How have Person Driven Care action plans improved patient experience?
Patient Trends Definition Discussion Questions
Tracking to Budget targetsNet surplus/deficit as calculated by Revenue minus Expenses, as per plan.
Are we tracking to budget plans? Are our cost/patients to plan? Is demand for service to expectations? What additional actions if any, are required at this time?
Patient Trends Definition Discussion Questions
Staff Turnover Rate at which employees leave an organization. Calculated as number of permanent employees who terminate or cease employment, divided by the average number of permanent employees on staff
If not as expected, what is the underlying cause and mitigating action plan?
Staff Turnover within 6 months
Rate at which employees leave an organization within the first 6 months of hire.
If not as expected, what is the underlying cause and mitigating action plan?
Absenteeism annualizedRate
Total number of sick hours, paid and unpaid for all permanent and temporary staff (excludes casuals), divided by number of permanent staff.
If not as expected, what is the underlying cause and mitigating action plan?
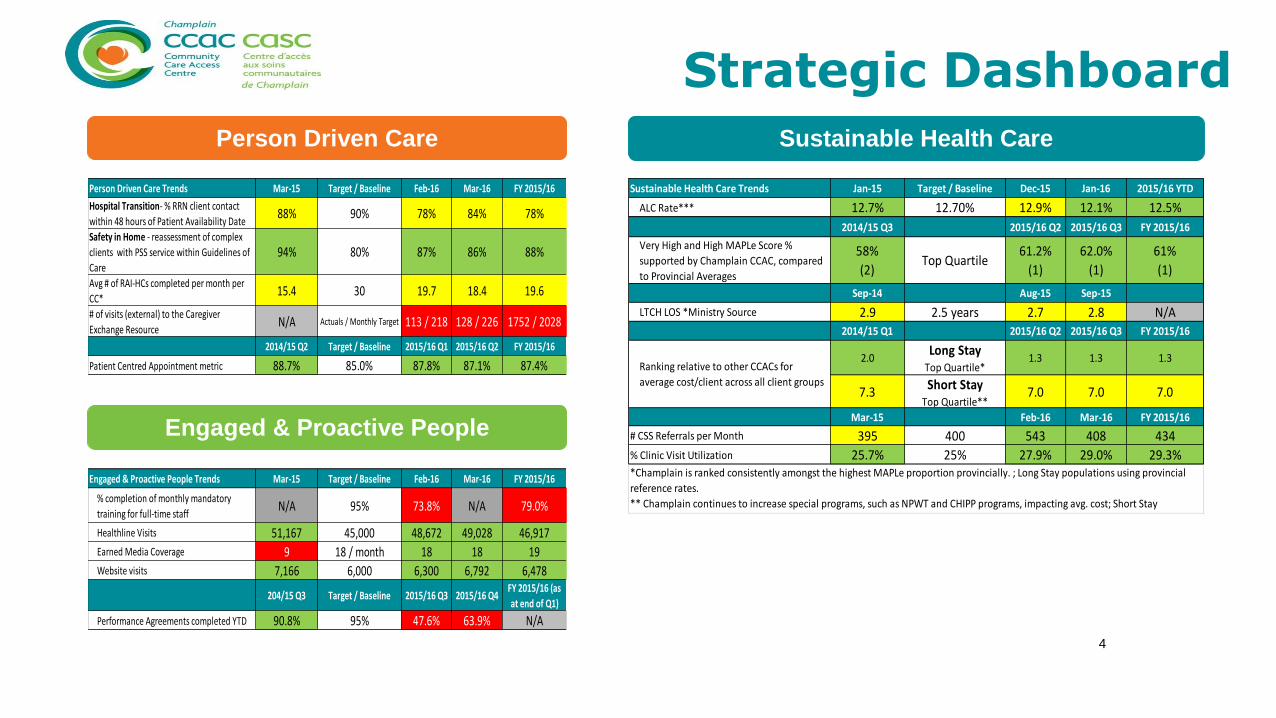
*Champlain is ranked consistently amongst the highest MAPLe proportion provincially. ; Long Stay populations using provincial
reference rates.
** Champlain continues to increase special programs, such as NPWT and CHIPP programs, impacting avg. cost; Short Stay
Population costs are calculated using local CCAC rates.
Champlain
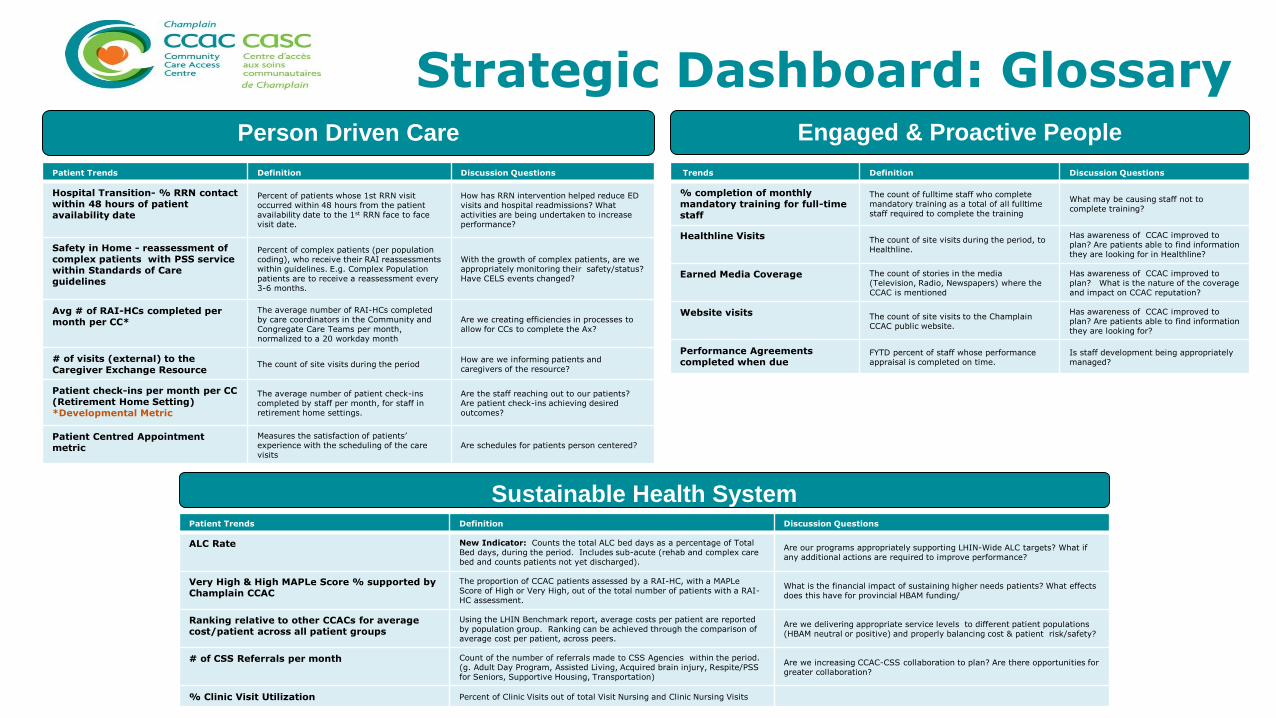
Person Driven Care Engaged & Proactive People
Sustainable Health System
Patient Trends Definition Discussion Questions
Hospital Transition- % RRN contact within 48 hours of patient availability date
Percent of patients whose 1st RRN visit occurred within 48 hours from the patient availability date to the 1st RRN face to face visit date.
How has RRN intervention helped reduce ED visits and hospital readmissions? What activities are being undertaken to increase performance?
Safety in Home - reassessment of complex patients with PSS service within Standards of Care guidelines
Percent of complex patients (per population coding), who receive their RAI reassessments within guidelines. E.g. Complex Population patients are to receive a reassessment every 3-6 months.
With the growth of complex patients, are we appropriately monitoring their safety/status? Have CELS events changed?
Avg # of RAI-HCs completed per month per CC*
The average number of RAI-HCs completed by care coordinators in the Community and Congregate Care Teams per month, normalized to a 20 workday month
Are we creating efficiencies in processes to allow for CCs to complete the Ax?
# of visits (external) to the Caregiver Exchange Resource
The count of site visits during the periodHow are we informing patients and caregivers of the resource?
Patient check-ins per month per CC (Retirement Home Setting) *Developmental Metric
The average number of patient check-ins completed by staff per month, for staff in retirement home settings.
Are the staff reaching out to our patients? Are patient check-ins achieving desired outcomes?
Patient Centred Appointment metric
Measures the satisfaction of patients’ experience with the scheduling of the care visits
Are schedules for patients person centered?
Trends Definition Discussion Questions
% completion of monthly mandatory training for full-time staff
The count of fulltime staff who complete mandatory training as a total of all fulltime staff required to complete the training
What may be causing staff not to complete training?
Healthline Visits The count of site visits during the period, to Healthline.
Has awareness of CCAC improved to plan? Are patients able to find information they are looking for in Healthline?
Earned Media Coverage The count of stories in the media (Television, Radio, Newspapers) where the CCAC is mentioned
Has awareness of CCAC improved to plan? What is the nature of the coverage and impact on CCAC reputation?
Website visits The count of site visits to the Champlain CCAC public website.
Has awareness of CCAC improved to plan? Are patients able to find information they are looking for?
Performance Agreements completed when due
FYTD percent of staff whose performance appraisal is completed on time.
Is staff development being appropriately managed?
Patient Trends Definition Discussion Questions
ALC Rate New Indicator: Counts the total ALC bed days as a percentage of Total Bed days, during the period. Includes sub-acute (rehab and complex care bed and counts patients not yet discharged).
Are our programs appropriately supporting LHIN-Wide ALC targets? What if any additional actions are required to improve performance?
Very High & High MAPLe Score % supported by Champlain CCAC
The proportion of CCAC patients assessed by a RAI-HC, with a MAPLe Score of High or Very High, out of the total number of patients with a RAI-HC assessment.
What is the financial impact of sustaining higher needs patients? What effects does this have for provincial HBAM funding/
Ranking relative to other CCACs for average cost/patient across all patient groups
Using the LHIN Benchmark report, average costs per patient are reported by population group. Ranking can be achieved through the comparison of average cost per patient, across peers.
Are we delivering appropriate service levels to different patient populations (HBAM neutral or positive) and properly balancing cost & patient risk/safety?
# of CSS Referrals per month Count of the number of referrals made to CSS Agencies within the period. (g. Adult Day Program, Assisted Living, Acquired brain injury, Respite/PSS for Seniors, Supportive Housing, Transportation)
Are we increasing CCAC-CSS collaboration to plan? Are there opportunities for greater collaboration?
% Clinic Visit Utilization Percent of Clinic Visits out of total Visit Nursing and Clinic Nursing Visits
Strategic Dashboard: Glossary
Champlain CCAC Financial Results – Executive Summary For the fiscal year ended March 31, 2016
OVERVIEW This executive summary covers Champlain CCAC’s financial results for the fiscal year ending March 31, 2016.
BUDGET ASSUMPTIONS AND UPDATES The F2015/16 budget was restated to reflect a base increase of 1.0% (i.e. $2.3M) confirmed by the LHIN. This is approximately $1M less than the
original budget assumption of a 1.5% base increase. Budget changes were made prospectively from August until March 31, 2016 -- prior months’
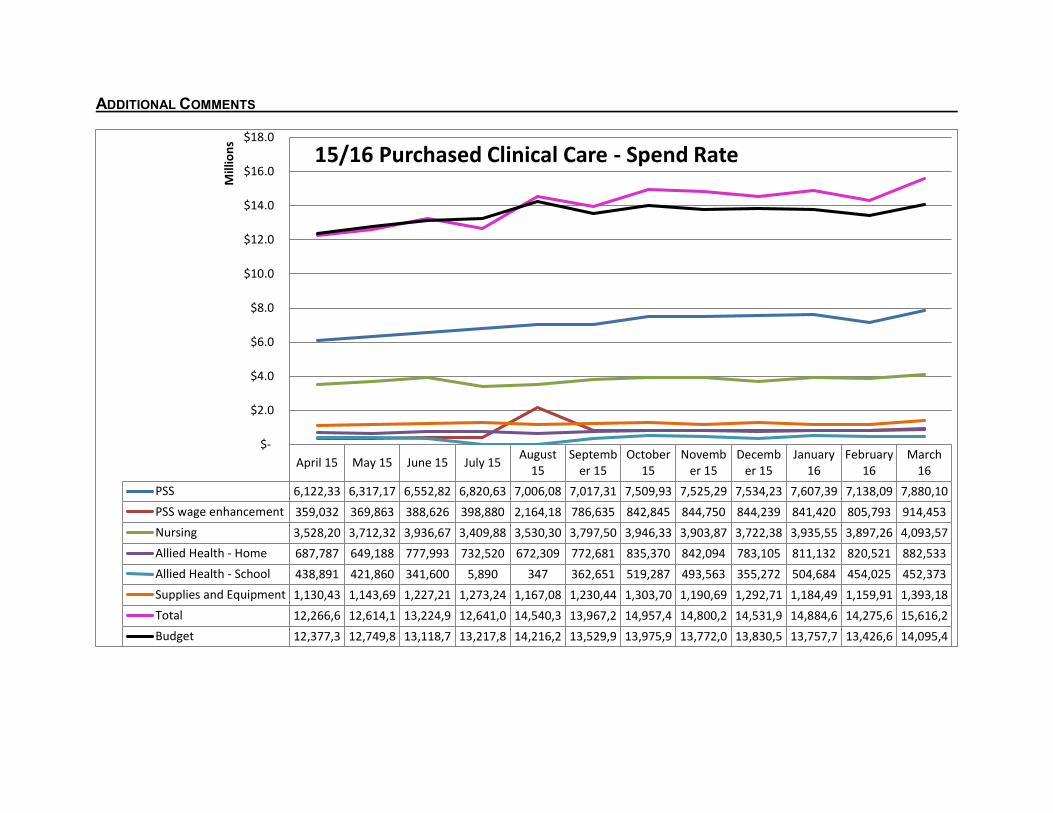
budgets and actuals were not restated. Purchased clinical services budgets were reduced to reflect spending patterns. However the decrease
was offset by additional PSW wage enhancement funding added. The only other changes to the 15/16 budget were a reduction in Health Links
budget and an increase to anticipated legal fees. Updates to revenue assumptions can be found in Appendix I.
CONDENSED OPERATING STATEMENT
March March March Mar %
Var Mar YTD Mar YTD Mar YTD YTD %
Var Total Year
Actuals Budget Variance to Budget Actuals Budget Variance to Budget Budget
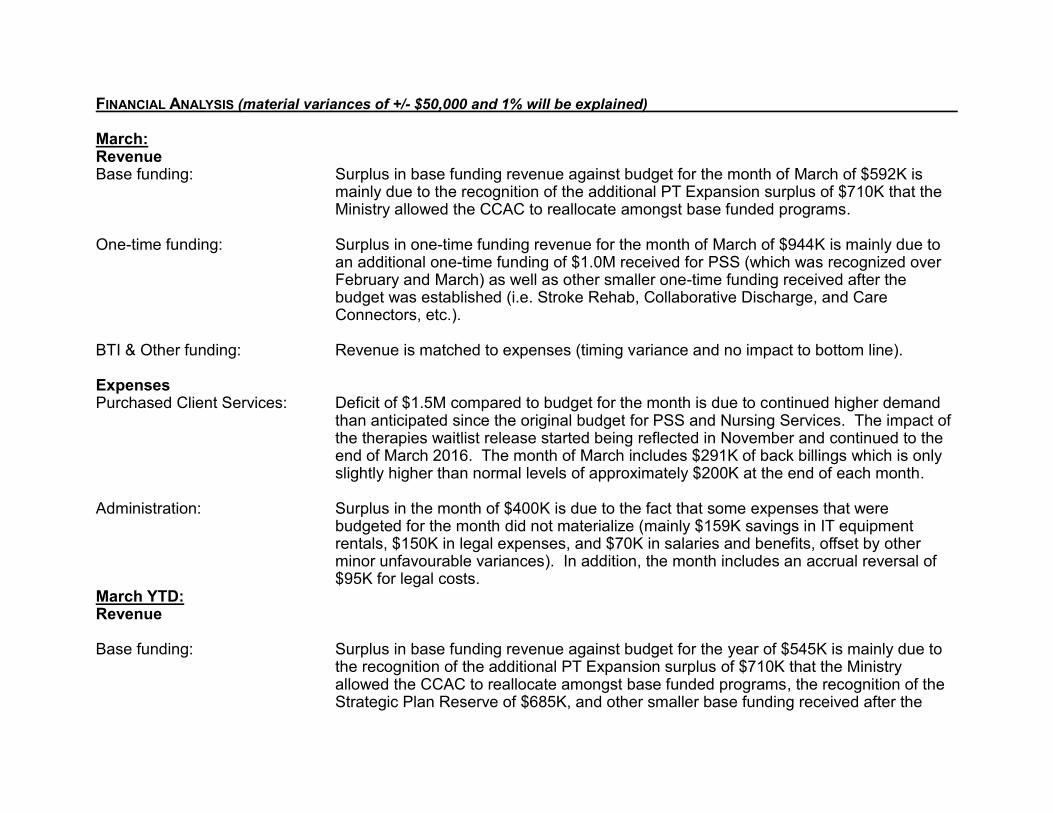
FINANCIAL ANALYSIS (material variances of +/- $50,000 and 1% will be explained) March: Revenue Base funding: Surplus in base funding revenue against budget for the month of March of $592K is
mainly due to the recognition of the additional PT Expansion surplus of $710K that the Ministry allowed the CCAC to reallocate amongst base funded programs.
One-time funding: Surplus in one-time funding revenue for the month of March of $944K is mainly due to
an additional one-time funding of $1.0M received for PSS (which was recognized over February and March) as well as other smaller one-time funding received after the budget was established (i.e. Stroke Rehab, Collaborative Discharge, and Care Connectors, etc.).
BTI & Other funding: Revenue is matched to expenses (timing variance and no impact to bottom line). Expenses Purchased Client Services: Deficit of $1.5M compared to budget for the month is due to continued higher demand
than anticipated since the original budget for PSS and Nursing Services. The impact of the therapies waitlist release started being reflected in November and continued to the end of March 2016. The month of March includes $291K of back billings which is only slightly higher than normal levels of approximately $200K at the end of each month.
Administration: Surplus in the month of $400K is due to the fact that some expenses that were
budgeted for the month did not materialize (mainly $159K savings in IT equipment rentals, $150K in legal expenses, and $70K in salaries and benefits, offset by other minor unfavourable variances). In addition, the month includes an accrual reversal of $95K for legal costs.
March YTD: Revenue Base funding: Surplus in base funding revenue against budget for the year of $545K is mainly due to
the recognition of the additional PT Expansion surplus of $710K that the Ministry allowed the CCAC to reallocate amongst base funded programs, the recognition of the Strategic Plan Reserve of $685K, and other smaller base funding received after the
budget was established of $192K; offset by $615K reduction in CCO funding, $208K reduction in Hips & Knees funding, and $218K of lower revenue recognized in nursing initiatives.
One-time funding: Surplus of $1.45 million year to date is mainly due to unbudgeted one-time funding
received after original budget was established, including $340K for Care Connectors and $1.0 million for PSS.
BTI & Other funding: Revenue is matched to expenses (timing variance and no impact to bottom line). Expenses Purchased Client Services: Deficit of $6.2 million year to date is due to higher demand than anticipated for PSS and
Nursing Services since original budget established. Care Coordination and I&R: Surplus of $1.3 million year to date is due to numerous vacancies in earlier part of this
year. These savings are slightly offset by fewer recoveries received (positions budgeted (transitional navigators)) with expected recoveries from other agencies (WSIB and Kemptville Hospital for employees for whom we receive reimbursement).
Direct Care: Surplus of $664K year to date is due to numerous vacancies in internal therapies and
nursing initiatives. Many of these vacancies have been filled but the cumulative impact of previous months’ vacancies continues to leave us in a large year-to-date surplus position.
Administration: The surplus in Administration of $347K compared to budget is mainly due to lower
spending in salaries and benefits of $307K year to date. Note: the Statement of Financial Position (Balance Sheet) can be found in Appendix II.
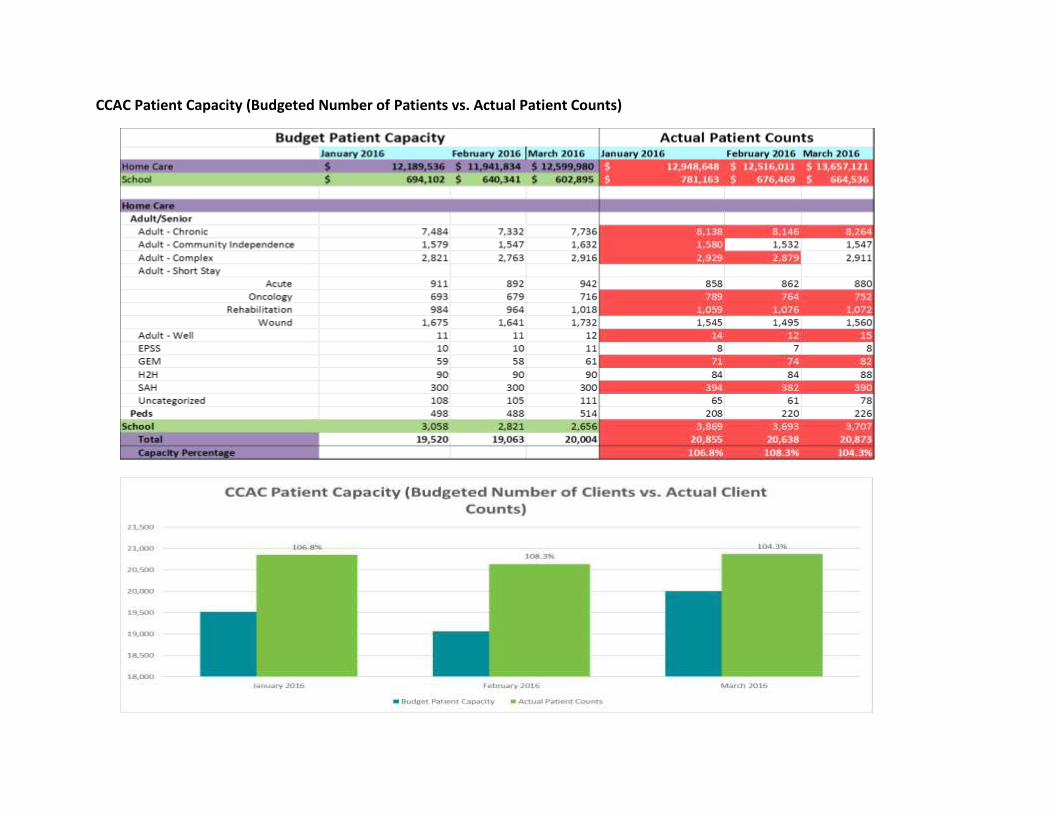
The Patient Capacity charts below show that, overall, the Actual Patients served exceeded the Budgeted Capacity of patients in the
last quarter of 2015/16. Champlain CCAC has been able to contain its deficit to $1.8M at year end largely due to one-time funding
support from the LHIN received at year-end. Over the last quarter of F2015-2016, monthly deficits were ranging from $0.8M-
$1.5M/month. These monthly deficit ranges are expected to continue transitioning into F2016-2017 driven by patient demand and
patient acuity. Plans are underway to identify sustainability initiatives to address these financial pressures.
CCAC Patient Capacity (Budgeted Number of Patients vs. Actual Patient Counts)
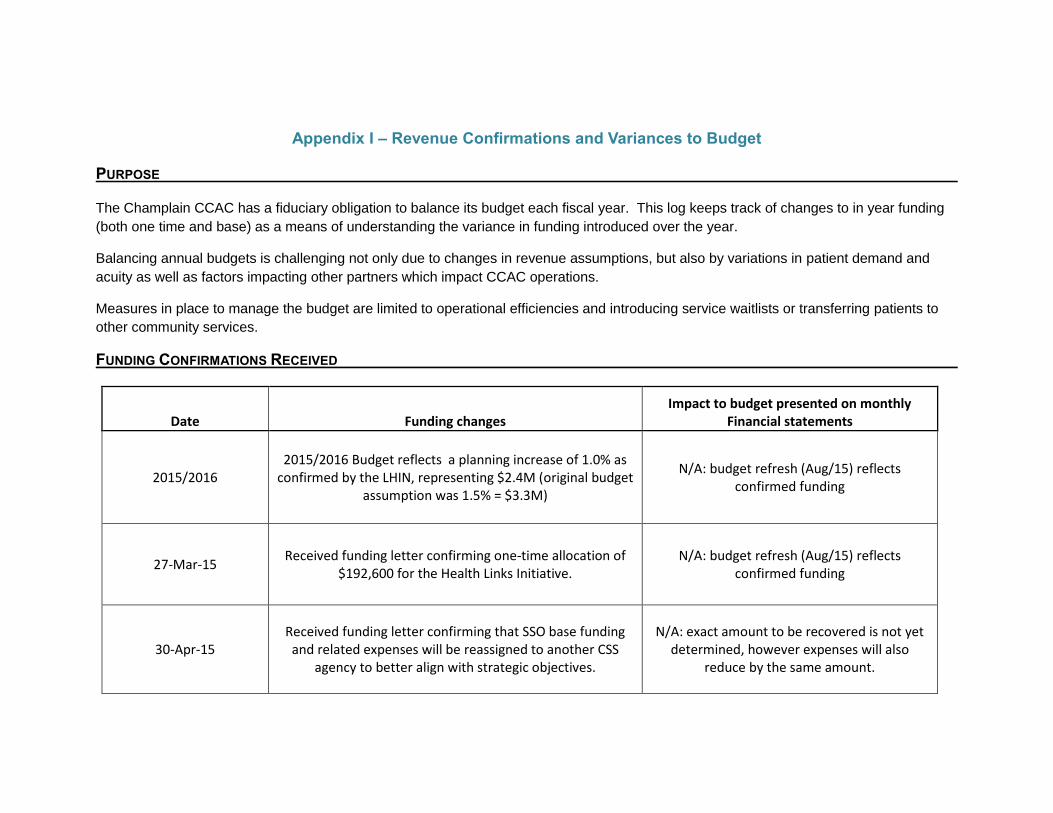
Appendix I – Revenue Confirmations and Variances to Budget PURPOSE The Champlain CCAC has a fiduciary obligation to balance its budget each fiscal year. This log keeps track of changes to in year funding
(both one time and base) as a means of understanding the variance in funding introduced over the year.
Balancing annual budgets is challenging not only due to changes in revenue assumptions, but also by variations in patient demand and
acuity as well as factors impacting other partners which impact CCAC operations.
Measures in place to manage the budget are limited to operational efficiencies and introducing service waitlists or transferring patients to
other community services.
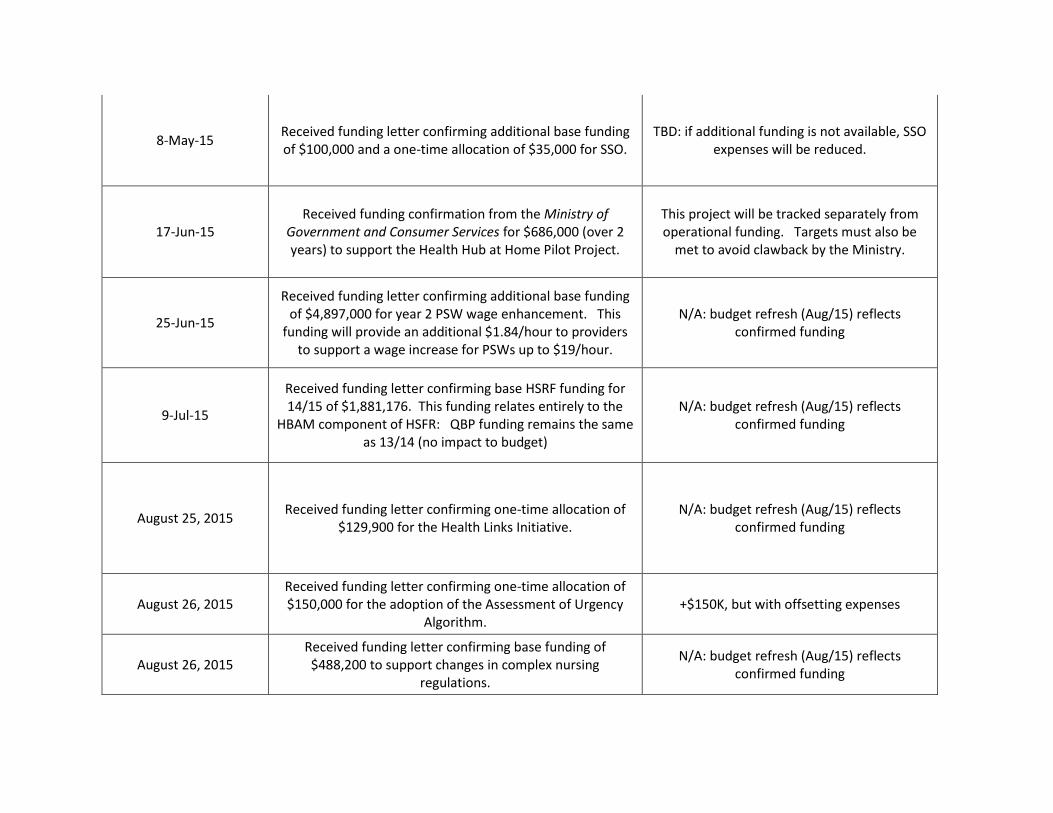
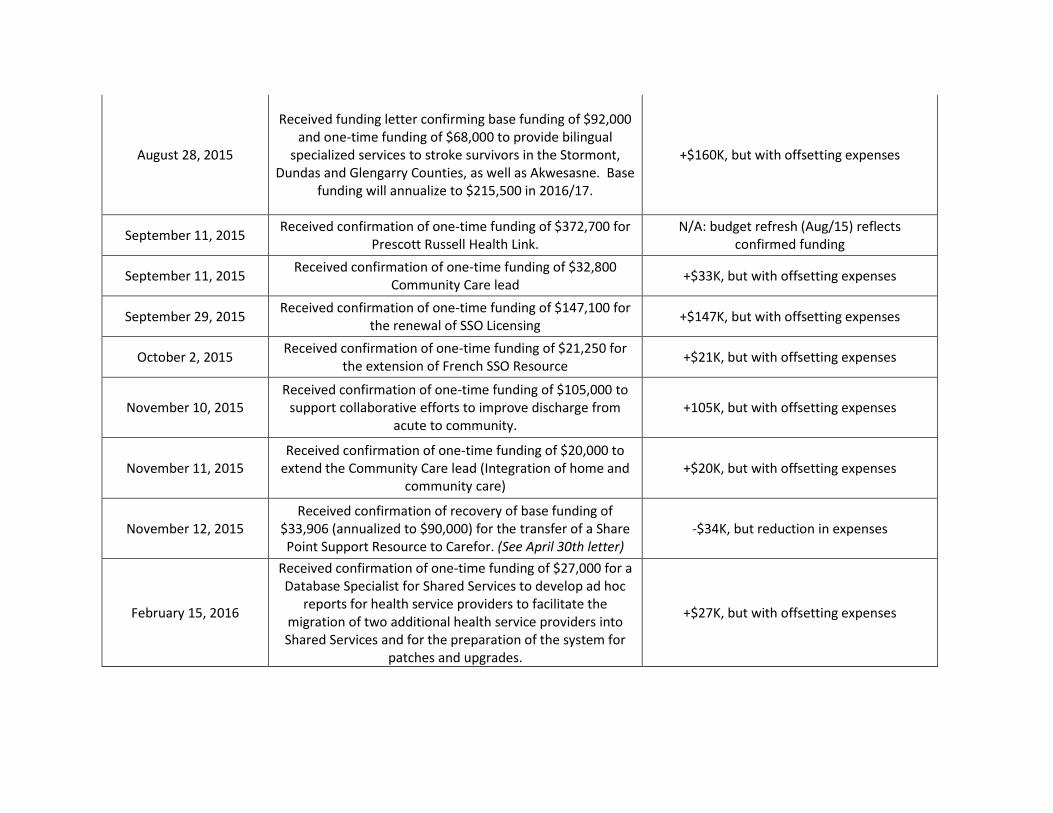
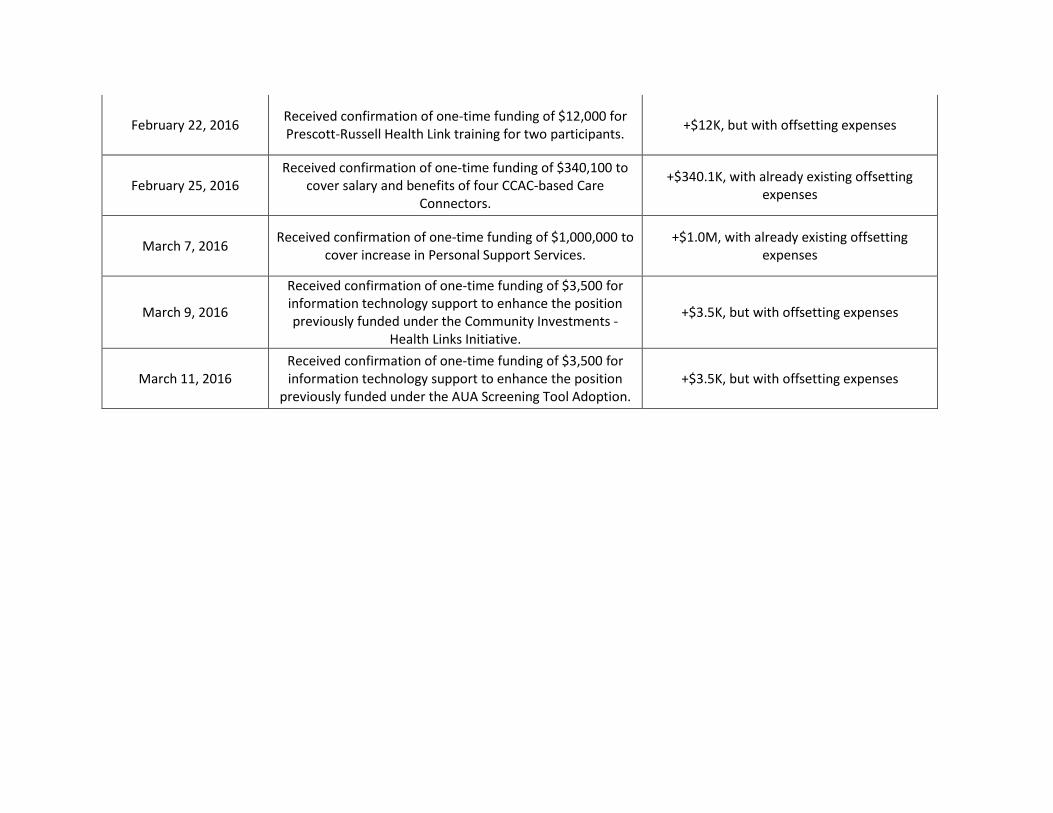
FUNDING CONFIRMATIONS RECEIVED
Date Funding changes Impact to budget presented on monthly
Financial statements
2015/2016 2015/2016 Budget reflects a planning increase of 1.0% as
confirmed by the LHIN, representing $2.4M (original budget assumption was 1.5% = $3.3M)
Received funding letter confirming base funding of $92,000 and one-time funding of $68,000 to provide bilingual
specialized services to stroke survivors in the Stormont, Dundas and Glengarry Counties, as well as Akwesasne. Base
funding will annualize to $215,500 in 2016/17.
+$160K, but with offsetting expenses
September 11, 2015 Received confirmation of one-time funding of $372,700 for
Prescott Russell Health Link. N/A: budget refresh (Aug/15) reflects
confirmed funding
September 11, 2015 Received confirmation of one-time funding of $32,800
Community Care lead +$33K, but with offsetting expenses
September 29, 2015 Received confirmation of one-time funding of $147,100 for
the renewal of SSO Licensing +$147K, but with offsetting expenses
October 2, 2015 Received confirmation of one-time funding of $21,250 for
the extension of French SSO Resource +$21K, but with offsetting expenses
November 10, 2015 Received confirmation of one-time funding of $105,000 to
support collaborative efforts to improve discharge from acute to community.
+105K, but with offsetting expenses
November 11, 2015 Received confirmation of one-time funding of $20,000 to
extend the Community Care lead (Integration of home and community care)
+$20K, but with offsetting expenses
November 12, 2015 Received confirmation of recovery of base funding of
$33,906 (annualized to $90,000) for the transfer of a Share Point Support Resource to Carefor. (See April 30th letter)
-$34K, but reduction in expenses
February 15, 2016
Received confirmation of one-time funding of $27,000 for a Database Specialist for Shared Services to develop ad hoc
reports for health service providers to facilitate the migration of two additional health service providers into Shared Services and for the preparation of the system for
patches and upgrades.
+$27K, but with offsetting expenses
February 22, 2016 Received confirmation of one-time funding of $12,000 for Prescott-Russell Health Link training for two participants.
+$12K, but with offsetting expenses
February 25, 2016 Received confirmation of one-time funding of $340,100 to
cover salary and benefits of four CCAC-based Care Connectors.
+$340.1K, with already existing offsetting expenses
March 7, 2016 Received confirmation of one-time funding of $1,000,000 to
cover increase in Personal Support Services. +$1.0M, with already existing offsetting
expenses
March 9, 2016
Received confirmation of one-time funding of $3,500 for information technology support to enhance the position previously funded under the Community Investments -
Health Links Initiative.
+$3.5K, but with offsetting expenses
March 11, 2016 Received confirmation of one-time funding of $3,500 for information technology support to enhance the position
previously funded under the AUA Screening Tool Adoption. +$3.5K, but with offsetting expenses
Appendix II – Statement of Financial Position
COMMUNITY CARE ACCESS CENTRE
BALANCE SHEET
March 31, 2016 February 29, 2016 March 31, 2015
ASSETS
CURRENT ASSETS
Cash-CDN $11,588,108 $11,631,437 $14,981,223
Accounts Receivable 1,516,689 983,508 1,172,455
Prepaid Expenses 289,133 87,150 134,339
13,393,930 12,702,095 16,288,017
CAPITAL ASSETS 995,228 1,144,632 1,673,398
$14,389,158 $13,846,727 $17,961,415
LIABILITIES
CURRENT LIABILITIES
Accounts Payable and Accrued Liabilities $13,902,384 12,460,289 13,565,539
Due to MOHLTC 1,339,613 2,349,387 2,722,478
15,241,997 14,809,676 16,288,017
LONG-TERM LIABILITIES
Deferred Contributions - Capital Assets 995,228 1,089,327 1,673,398
16,237,225 15,899,003 17,961,415
NET ASSETS
Carry-over 13/14 (283,399)
Operational (1,848,067) (2,064,959) 283,399
Other Programs (separate funding) 0 12,683 -
(1,848,067) (2,052,276) -
$14,389,158 $13,846,727 $17,961,415
Champlain
Board Scorecard
April 2016
(Data as of March 2016)Proposed FY 2016/17 Metrics
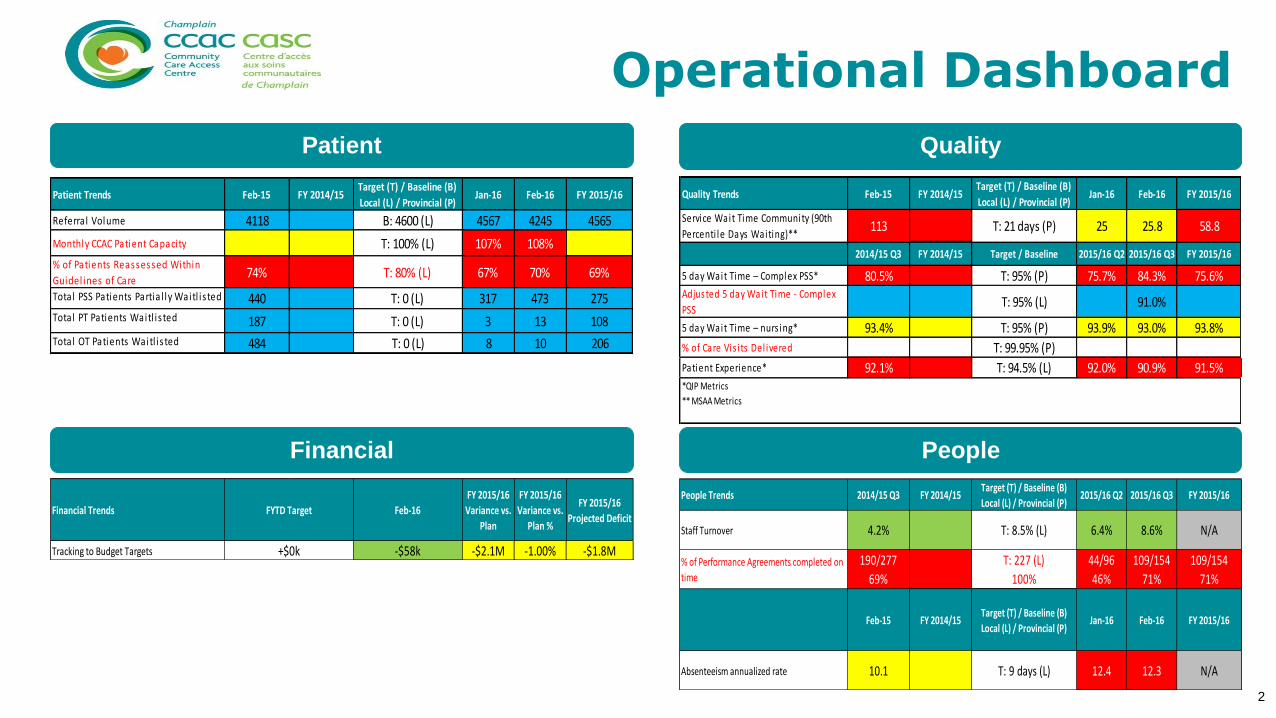
Tracking to Budget Targets -$58k -$2.1M -1.00% -$1.8M
FYTD Target
+$0k
Champlain
3
Financial People
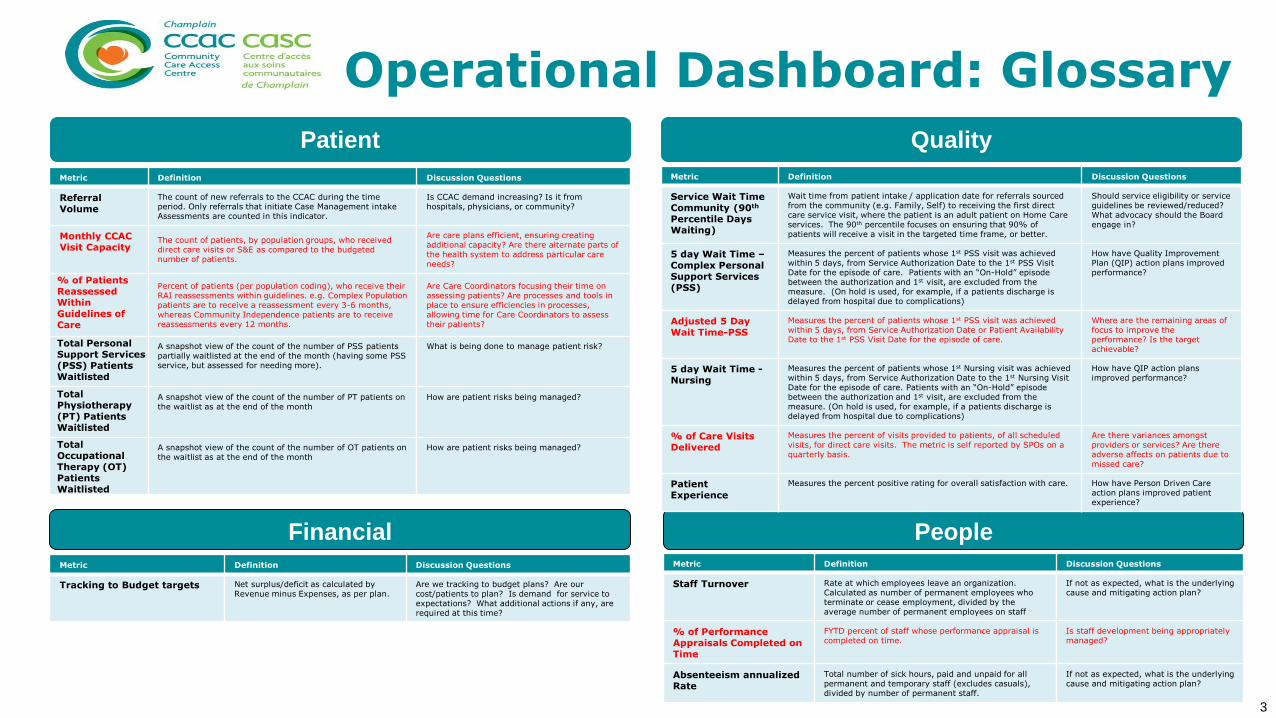
Metric Definition Discussion Questions
Referral Volume
The count of new referrals to the CCAC during the time period. Only referrals that initiate Case Management intake Assessments are counted in this indicator.
Is CCAC demand increasing? Is it from hospitals, physicians, or community?
Monthly CCAC Visit Capacity
The count of patients, by population groups, who received direct care visits or S&E as compared to the budgeted number of patients.
Are care plans efficient, ensuring creating additional capacity? Are there alternate parts of the health system to address particular care needs?
% of Patients Reassessed Within Guidelines of Care
Percent of patients (per population coding), who receive their RAI reassessments within guidelines. e.g. Complex Population patients are to receive a reassessment every 3-6 months, whereas Community Independence patients are to receive reassessments every 12 months.
Are Care Coordinators focusing their time on assessing patients? Are processes and tools in place to ensure efficiencies in processes, allowing time for Care Coordinators to assess their patients?
Total Personal Support Services (PSS) Patients Waitlisted
A snapshot view of the count of the number of PSS patients partially waitlisted at the end of the month (having some PSS service, but assessed for needing more).
What is being done to manage patient risk?
Total Physiotherapy (PT) Patients Waitlisted
A snapshot view of the count of the number of PT patients on the waitlist as at the end of the month
How are patient risks being managed?
Total Occupational Therapy (OT) Patients Waitlisted
A snapshot view of the count of the number of OT patients on the waitlist as at the end of the month
How are patient risks being managed?
Metric Definition Discussion Questions
Service Wait TimeCommunity (90th
Percentile Days Waiting)
Wait time from patient intake / application date for referrals sourced from the community (e.g. Family, Self) to receiving the first direct care service visit, where the patient is an adult patient on Home Care services. The 90th percentile focuses on ensuring that 90% of patients will receive a visit in the targeted time frame, or better.
Should service eligibility or service guidelines be reviewed/reduced? What advocacy should the Board engage in?
5 day Wait Time –Complex PersonalSupport Services (PSS)
Measures the percent of patients whose 1st PSS visit was achieved within 5 days, from Service Authorization Date to the 1st PSS Visit Date for the episode of care. Patients with an “On-Hold” episode between the authorization and 1st visit, are excluded from the measure. (On hold is used, for example, if a patients discharge is delayed from hospital due to complications)
How have Quality Improvement Plan (QIP) action plans improved performance?
Adjusted 5 Day Wait Time-PSS
Measures the percent of patients whose 1st PSS visit was achieved within 5 days, from Service Authorization Date or Patient Availability Date to the 1st PSS Visit Date for the episode of care.
Where are the remaining areas of focus to improve the performance? Is the target achievable?
5 day Wait Time -Nursing
Measures the percent of patients whose 1st Nursing visit was achieved within 5 days, from Service Authorization Date to the 1st Nursing Visit Date for the episode of care. Patients with an “On-Hold” episode between the authorization and 1st visit, are excluded from the measure. (On hold is used, for example, if a patients discharge is delayed from hospital due to complications)
How have QIP action plans improved performance?
% of Care Visits Delivered
Measures the percent of visits provided to patients, of all scheduled visits, for direct care visits. The metric is self reported by SPOs on a quarterly basis.
Are there variances amongst providers or services? Are there adverse affects on patients due to missed care?
Patient Experience
Measures the percent positive rating for overall satisfaction with care. How have Person Driven Care action plans improved patient experience?
Metric Definition Discussion Questions
Tracking to Budget targets Net surplus/deficit as calculated by Revenue minus Expenses, as per plan.
Are we tracking to budget plans? Are our cost/patients to plan? Is demand for service to expectations? What additional actions if any, are required at this time?
Metric Definition Discussion Questions
Staff Turnover Rate at which employees leave an organization. Calculated as number of permanent employees who terminate or cease employment, divided by the average number of permanent employees on staff
If not as expected, what is the underlying cause and mitigating action plan?
% of Performance Appraisals Completed on Time
FYTD percent of staff whose performance appraisal is completed on time.
Is staff development being appropriately managed?
Absenteeism annualizedRate
Total number of sick hours, paid and unpaid for all permanent and temporary staff (excludes casuals), divided by number of permanent staff.
If not as expected, what is the underlying cause and mitigating action plan?
Patient Quality
Operational Dashboard: Glossary
Champlain 4
Strategic Dashboard
Supporting Complex Patients Sustainable Health Care
*Champlain is ranked consistently amongst the highest MAPLe proportion provincially. ; Long Stay populations using provincial reference rates.
** Champlain continues to increase special programs, such as NPWT and CHIPP programs, impacting avg. cost; Short Stay Population costs are calculated
using local CCAC rates.
Champlain
Supporting Complex Patients Sustainable Health System
Metrics Definition Discussion Questions
Reassessment of Complex Patients within Guidelines
Percent of patients (per population coding), who receive their RAI reassessments within guidelines. E.g. Complex Population patients are to receive a reassessment every 3-6 months,.
Are Care Coordinators focusing their time on assessing patients? Are processes and tools in place to ensure efficiencies in processes, allowing time for Care Coordinators to assess their patients?
% of Complex Patients with a Care Coordinator Contact (tel./FtoF) within X Months
Count of the number of complex population patients who have had a Care Coordinator contact within last 3 months out of all complex population patients.
Are complex patients being monitored closely? Are there risks for some patients? If patients do not have a contact within last 3 months, what are the potential impacts?
% of Complex Patients with 1 Care Coordinator in Past 12 Months
Percent of complex patients active in the current month, who have had 1 Care Coordinator consistently assigned to the patient in the past 12 months.
When there are transitions, are Care Coordinators briefing peers effectively? What may cause higher number of assigned Care Coordinators (turnover, reassignments, etc.)?
% of Complex Patients With aCompleted Medication Reconciliation
% of Complex Population patients with a BPMH completed within 30 days of either a RAI-HC completed with triggers for needing a Medication Reconciliation, or within 30 days of an initial face to face visit by a RRN or MHAN nurse.
Are there risks to patients if the CCAC is not completing a medication reconciliation? Are there other health professionals completing the Med Rec? Are there barriers to completing a Med Rec. ?
Metrics Definition Discussion Questions
ALC Rate New Indicator: Counts the total ALC bed days as a percentage of Total Bed days, during the period. Includes sub-acute (rehab and complex care bed and counts patients not yet discharged).
Are our programs appropriately supporting LHIN-Wide ALC targets? What if any additional actions are required to improve performance?
Very High & High MAPLe Score % supported by Champlain CCAC
The proportion of CCAC patients assessed by a RAI-HC, with a MAPLe Score of High or Very High, out of the total number of patients with a RAI-HC assessment.
What is the financial impact of sustaining higher needs patients? What effects does this have for provincial HBAM funding/
Ranking relative to other CCACs for average cost/patient across all patient groups
Using the LHIN Benchmark report, average costs per patient are reported by population group. Ranking can be achieved through the comparison of average cost per patient, across peers.
Are we delivering appropriate service levels to different patient populations (HBAM neutral or positive) and properly balancing cost & patient risk/safety?
% Clinic Visit Utilization Percent of Clinic Visits out of total Visit Nursing and Clinic Nursing Visits