Boards: Does one size fit all? Jeffrey L. Coles Department of Finance W.P. Carey School of Business Arizona State University [email protected]Tel: (480) 965-4475 Naveen D. Daniel Department of Financ e Georgia State University [email protected]Tel: (404) 651-2691 Lalitha Naveen Department of Finance Georgia State University [email protected]Tel: (404) 651-2632 This Version: Jan 1, 2004 JEL classification code: G32; G34; K22 Key words: Corporate governance; directors; board composition; board size; Tobin’s Q * We thank Vikas Agarwal, Anup Agrawal, Sebastien Pouget, Mike Rebello, Kumar Venkatraman, and seminar participants at the Atlanta Finance Workshop and University of Alabama for helpful comments. The authors gratefully acknowledge research grants from Georgia State University Research Foundation and BSI Gamma Foundation.
Transcript
Boards: Does one size fit all?
Jeffrey L. Coles
Department of Finance W.P. Carey School of Business
* We thank Vikas Agarwal, Anup Agrawal, Sebastien Pouget, Mike Rebello, Kumar Venkatraman, and seminar participants at the Atlanta Finance Workshop and University of Alabama for helpful comments. The authors gratefully acknowledge research grants from Georgia State University Research Foundation and BSI Gamma Foundation.
Boards: Does one size fit all?
Abstract
This paper reexamines the effect of board composition and board size on Tobin’s Q. We find that
Tobin’s Q increases in board size for firms that have greater advising requirements, such as
diversified firms and high-debt firms. Also, Tobin’s Q increases with fraction insiders in firms
where the firm-specific knowledge of insiders is relatively more important, such as R&D
intensive firms. Overall, our results challenge the traditional notion that only small boards with
high fraction of outsiders are value-enhancing.
1
Boards: Does one size fit all?
1. Introduction
The board of directors of a corporation performs the critical function of monitoring and
advising the top management. Conventional wisdom suggests that a greater level of board
independence allows for more effective monitoring and thus improves firm performance. Indeed,
several studies have documented that an outsider-dominated, or more independent, board makes
better decisions from the shareholder’s perspective in carrying out discrete tasks such as hiring
and firing of the CEO (Weisbach, 1988, Borokhovich, Parrino, and Trapani, 1996), adoption of
anti-takeover provisions (Brickley, Coles, and Terry, 1994), and negotiating takeover premiums
(Byrd and Hickman, 1992, Cotter, Shivdasani, and Zenner, 1997).
A second factor that is considered to affect the board’s ability to function effectively is
the size of the board. Lipton and Lorsch (1992) and Jensen (1993) suggest that larger boards may
be less effective than smaller boards due to co-ordination problems in larger boards and
problems such as director free-riding. Yermack (1996) and Eisenberg, Sundgren, and Wells
(1998) provide evidence that firms with smaller boards have higher Tobin’s Q.1
Collectively, these, and other similar, studies have been taken as a blanket prescription
that smaller, outsider-dominated boards are optimal from a corporate governance standpoint.
Increasingly, institutional investors and corporate governance entities have called for outsider-
dominated boards. For instance, TIAA-CREF, one of the largest pension funds in the world has
stated that it will not invest in companies that do not have a majority of outside directors on the
board. Similarly, CALPERS, another large pension fund, recommends that the CEO should be
1 Tobin’s Q is the ratio of market value of assets to book value of assets. This ratio has been widely used in corporate finance as a proxy for firm value/firm performance (see for example, Morck, Shleifer, and Vishny, 1988; McConnell and Servaes, 1990; Yermack, 1996)
2
the only inside director on a firm’s board.2 Such institutional pressure has resulted in a decrease
in board size (Wu, 2003) and fraction of insiders on the board (Huson, Parrino, and Starks, 2001).
While these results are interesting, they nevertheless beg the question of why large boards
and boards with high insider concentration exist. Leading researchers have increasingly
expressed similar views. For instance, Hermalin and Weisbach (2003) question, “why hasn’t
economic Darwinism eliminated (these) unfit organizational form(s)?” Similarly, Bhagat and
Black (2001) question whether “inside and affiliated directors play valuable roles that may be
lost in a single-minded drive for greater board independence.” McConnell (2002) urges caution
in compelling companies to conform to a single model of board composition.
The purpose of this paper is to provide empirical evidence that smaller, outsider-
dominated boards are not always optimal. We examine two related questions: When is it
beneficial to have a larger board? When is it beneficial to have higher insider- fraction on the
board?
To understand when large boards and higher insider- fraction are beneficial to firms, it is
necessary to examine the role played by corporate boards in firms. Outside directors (outsiders)
are responsible both for monitoring and advising the CEO on the firm’s strategy (Lorsch and
MacIver, 1989). The monitoring role of the board has been studied extensively, and, as
discussed earlier, the general consensus is that smaller boards are more effective at monitoring.
The advisory role of the board, however, has received far less attention. A few exceptions are
Klein (1998), Agrawal and Knoeber (2001), Adams (2000), and Adams and Mehran (2003).
Klein (1998) argues that the CEO’s need for advice will increase with the complexity of the
organization. Diversified firms are more complex (Rose and Shephard, 1997). Both Hermalin
and Weisbach (1988), and Yermack (1996), suggest that CEOs of diversified firms have greater 2 Jensen (1993) also suggests that the CEO be the only insider on the board.
3
need for advice as they operate in multiple segments, and therefore require larger boards. We
expect, therefore, that board size will be higher for diversified firms.
A related strand of literature, starting with Pfeffer (1972), suggests that boards are chosen
to maximize the provision of important resources to the firm (see also Pfeffer and Salancik, 1978;
Klein, 1998; Hillman et al 2002). Klein (1998), for instance, suggests that advisory needs of the
CEO increase with the extent to which the firm depends on the environment for resources. Klein
uses the ratio of debt to assets (book leverage) as a proxy for this dependence. Anderson et al
(2003) document that firms that have bigger boards have lower cost of debt. This finding is
inconsistent with larger boards being ineffective monitors but is consistent with the board
playing an important advisory role that enables firms to gain access to low-cost debt. Based on
these arguments, we expect that board size will be higher for firms with higher debt ratios.
Inside directors (insiders) also play an important role on the board by providing
information to the outsiders (Mace, 1971; Lipton and Lorsch, 1992; Jensen, 1993; and Raheja,
2002) and aiding in strategic decisions (Baysinger and Hoskisson, 1990). Further, inside
directors possess more firm-specific knowledge (Fama and Jensen, 1983). Thus, the benefits
from having more insiders are higher for firms operating in more uncertain environments, which
may have greater needs for such specialized knowledge (Williamson, 1975). We use R&D
expenditure as a proxy for uncertainty, consistent with prior research (Dosi, Rumelt, Teece, and
Winter, 1994; Klein, 1998). We expect, therefore, that R&D-intensive firms will have a higher
fraction of insiders on the board.
Our arguments above suggest that certain firms benefit from larger boards and higher
insider fraction. To the extent that firms choose board structure (board size and fraction of
insiders on the board) optimally, we would not observe any relation between firm value Tobin’s
4
Q and board structure. This is similar to arguments made in Demsetz and Lehn (1985). Firms,
however, may be constrained by external pressures from choosing boards optimally. For instance,
Bhagat and Black (2001) argue that the increase in fraction of outside directors over time may be
due to changes in conventional wisdom and legal pressures and such an increase may be neither
efficient, nor an endogenous response to changes in firm characteristics. Further, transaction
costs and contracting costs may prevent firms from maintaining an optimal board composition at
all points in time. For these reasons, we might expect a relation between Tobin’s Q and board
structure. In particular, given our earlier discussion, we expect that Tobin’s Q will increase in
board size for diversified firms, and for firms with high debt ratios. Further, we expect that
Tobin’s Q will increase with fraction insiders for R&D intensive firms.
We test our hypotheses using data from Compact Disclosure over the period 1992-1998,
a sample of 2740 firm-year observations. We estimate regressions similar to Yermack (1996),
where the dependent variable is Tobin’s Q as measured by the ratio of market value of assets to
book value of assets. Our main findings are consistent with the hypotheses discussed above. First,
we find that Q is increasing in board size in diversified firms, and in firms with higher leverage.
This is inconsistent with the widely-held notion that larger boards destroy firm value. In both
instances, we find that the increase in value comes from the presence of outsiders on the board,
not insiders, which is consistent with the advisory role played by the outsiders in such firms.
Second, we find that Q is increasing in fraction of inside directors in R&D-intensive firms.3 This
result is also inconsistent with conventional wisdom that higher fraction of insiders on the board
destroys firm value.
3 We classify all directors who are also officers of the firm as “insiders” and all non-officer directors as “outsiders”. This is similar to the classification used in Huson, Parrino, and Starks (2001) and Adams and Mehran (2002).
5
It is quite possible that both board size and fraction of insiders are in fact determined by
firm value. Hermalin and Weisbach (1988, 1991, 2003) and Bhagat and Black (1999, 2001)
discuss the need to control for the endogeneity inherent in any regression of firm performance on
board composition. To enable us to address the endogeneity issue, we first attempt to explain the
determinants of board size and the fraction of insiders on the board. We find, as expected, that
diversified firms and high- leverage firms have larger boards. However, contrary to our
expectations, we do not find that R&D-intensive firms have a higher fraction of insiders on the
board. We then estimate a simultaneous system of equations involving Q, board size, fraction
insiders, and CEO ownership, to control for the endogeneity. Our main results as discussed
above hold in the simultaneous equation setting.
Our findings add to the literature in several ways. First, our results question whether
recommendations for smaller boards, with high outsider-concentration are necessarily value-
enhancing. To the contrary, our evidence suggests that for certain types of firms, such boards
could actually lower firm value. This is consistent with arguments in Gillan et al (2002), and
Bainbridge (2003), that regulatory actions applying a one-size-fits-all criteria may be suboptimal.
Second, our evidence suggests that boards play an important advisory role in firms. This
complements recent findings in Adams (2000), Adams and Mehran (2003), and Agrawal and
Knoeber (2001) regarding the advisory role of boards.
Third, we add to the literature on the determinants of board size and board composition.
Our finding that firms that have greater advisory requirements tend to have larger boards
complements the limited empirical literature on board size. Our results on the impact of fraction
insiders on Q in high R&D firms complements research in Rosenstein and Wyatt (1997), who
find that in certain instances addition of an insider increases stock price, and Klein (1998), who
6
finds that firm performance is positively related to the fraction of insiders on the investment and
finance committee.
The remainder of the paper is arranged as follows. Section 2 discusses related literature
and develops our hypotheses. Section 3 describes the data collection, and the key variables used
in the study. Section 4 discusses univariate results relating board structure and Tobin’s Q.
Section 5 presents regression results that examine our key hypothesis relating Q, board structure,
and firm characteristics. Section 6 describes the regression results of board size and insider
fraction. Section 7 discusses regression results of Tobin’s Q that control for endogeneity in board
structure and CEO ownership. Section 8 discusses the robustness of our main results to alternate
specifications. Section 9 concludes.
2. Literature review and hypotheses development
In this section, we discuss the related literature, and develop our key hypotheses.
2.1. Board size and firm performance
Directors serve different functions. While outside directors (outsiders) serve to monitor
the top management and to advise the CEO on the business strategy, inside directors (insiders)
serve to convey information to the outsiders (Mace, 1971; Lipton and Lorsch, 1992; Jensen,
1993).
Much of the literature on board size has called for smaller boards. These arguments are
based on the notion that smaller groups are more cohesive, more productive, and can monitor the
firm more effectively. Bigger groups are fraught with problems such as social loafing and higher
co-ordination costs, and hence are not good monitors. Lipton and Lorsch (1992) argue that
boards of 8 or 9 members are most effective. According to them, when the board is bigger than
this, it becomes hard for all the board members to express their ideas and opinions in the limited
7
time available at board meetings. Jensen (1993) concurs with this view, and states that boards of
more than 7 or 8 members function less effectively, and are easier for the CEO to control.
Yermack (1996) provides empirical support for these arguments by showing a negative relation
between Q and board size.4
There are, however, some advantages to having larger boards. These are largely related to
the advisory role of the board, which has been relatively less examined in the literature. Dalton et
al (1999) state that larger boards may offer an exceptional level of high quality advice and
counsel to the CEO. Hermalin and Weisbach (1988) suggest that outside directors serve as
potential sources of counsel and add expertise and experience to the board. Lorsch and McIver
(1989), similarly, note that directors consider that one of their key duties during normal times is
to advise the CEO. In fact, Adams (2000) documents that boards devote significant resources –
up to 52% of total director meetings – to activities that are not traditionally considered to be
monitoring activities. Further evidence of the advisory role of outside directors is provided in
Adams and Mehran (2003). They find that as the number of states in which a bank has operations
increases, the board size increases, perhaps to accommodate representatives of subsidiaries from
different states. Also, Agrawal and Knoeber (2001) find that firms that require more political
advice have a higher proportion of outsiders on their board who have political connections.
It is likely, therefore, that while smaller boards are more effective at monitoring, as the
firm’s advising requirements increase, board size will increase. Yermack (1996) suggests that
CEOs of diversified firms may require higher levels of advice, and the need for advice may
increase in the number of business segments. Therefore, in diversified firms, the board should be
large enough to accommodate outsiders with backgrounds matching the disparate business
interests of the firm, who can advice the CEO on investment opportunities. 4 Kini et al (1995) also provide evidence that board sizes are reduced following disciplinary takeovers
8
Pfeffer (1972) suggest that the need for external resources such as debt finance will
increase the advising needs of the CEO, and will increase the size of the board. This is consistent
with a broader literature that argues that boards link the firm to the external environment to
2000). According to this literature, one of the functions of directors is to provide assistance in
obtaining resources from outside the firm. For instance, Booth and Deli (1999) find that firms
that require more debt financing are more likely to have a commercial banker on the board.
Similarly, Klein (1998) finds some support for the advisory role played by outside board
members in firms that have higher levels of debt.
Based on these arguments, we expect that board size should be higher for diversified
firms and firms with high debt ratios.5 Moreover, Tobin’s Q should be increasing in board size
for these firms. In particular, Tobin’s Q should be increasing in the number of outside directors
as outsiders are likely to be the ones advising the CEO in such firms.
2.1 Board composition and firm performance
As discussed earlier, extant literature suggests that boards with higher fraction of
outsiders are better at performing specific tasks (Brickley et al, 1994; Weisbach, 1988). The
evidence on the relation between board composition and firm performance, however, is
ambiguous. For instance, Baysinger and Butler (1985), Hermalin Weisbach (1991), and, more
recently, Bhagat and Black (2001), find no relation between the percentage of outside directors
on the board and Tobin’s Q. Yermack (1996) and Agrawal and Knoeber (1996) find that firms
with a greater fraction of outside directors on the board have, in fact, lower market value. In
contrast, Rosenstein and Wyatt (1997) find that in certain instances addition of an insider
5 Diversified firms are arguably more complex than focused firms, and hence may require higher monitoring. This would suggest that a smaller board may be better suited for a diversified firm, given arguments in Jensen (1993) and Yermack (1996). If anything, this would bias us against finding the results that we expect.
9
increases stock price, while Klein (1998) finds that various measures of firm performance
increase in the fraction of inside directors in the investment and finance committees.
Notwithstand ing the inconclusive evidence on the effect of board composition on firm
performance, there has been a general push towards boards with higher fraction outsiders. We
argue here that there are some firms that benefit by having a higher fraction of insiders on the
board. Inside directors could be better at strategic decisions (Baysinger and Hoskisson, 1990).
Insiders could also add value by providing information to the board. Raheja (2002) proposes a
model where firms with high project verification costs (such as R&D intensive firms) benefit
from having more insiders on the board. Klein (1998) finds that firm performance is positively
related to the fraction of insiders on the investment and finance committee. She suggests that her
findings support the notion that insiders contribute valuable specific information about the
organization’s activities. Since inside directors possess more firm-specific knowledge (Fama
and Jensen, 1983; Klein, 1998), their usefulness may prove highest in firms operating in more
uncertain and complex environments, which have greater needs for specialized knowledge
(Williamson, 1975). We use R&D as a proxy for uncertainty and complexity consistent with
prior research (Dosi, Rumelt, Teece, and Winter, 1994; Klein, 1998).
Burkart, Gromb, and Panunzi (1997) suggest that in firms where the manager’s initiative
leads to higher value, it may be optimal to reduce monitoring. It could be argued that managerial
initiative is a critical determinant of firm value in R&D-intensive firms. If this were true, and if
the fraction of outsiders correlated with monitoring intensity, then we would expect that high-
R&D firms would have less monitoring, and hence all else equal, will have higher fraction of
insiders.
10
Based on these arguments, we expect that R&D intensive firms will have higher fraction
insiders on the board. More importantly, Q will be increasing in fraction of insiders in high R&D
firms.
3. Data and summary statistics
Our starting sample is the 2001 version of the Execucomp database. For this starting
sample, we obtain board data from Compact Disclosure for the years 1992-1998.6 Compact
Disclosure gives the name of the company, CUSIP number, names, age and designations of both
the officers and the directors for a broad sample of firms. Compact Disclosure obtains the data
from the proxy statements filed by the company. We delete observations from Compact
Disclosure if the proxy date is not indicated. We cross-check this information with the proxy
statements directly (using LEXIS-NEXIS) for a substantial portion of the data. One limitation of
this database is that we can only identify if the director is an officer of the firm, and cannot
identify “affiliated”, or “grey”, directors. We classify all directors who are officers of the
company as “insiders”; all other directors are classified as outsiders. For the purpose of this study,
however, we believe such a classification is sufficient. This is also consistent with the
classification scheme in Huson et al (2001) and Adams and Mehran (2003). Our measure of
board composition, therefore, is the fraction of insiders on the board. As with other studies in the
literature, we use the ratio of market value of assets to book value of assets (Tobin's Q) as a
measure of firm value. Finally, we delete finance firms and utility firms from our sample to be
consistent with Yermack (1996) and other studies in this area. We obtain financial data on firms
from COMPUSTAT and segment information from COMPUSTAT Industrial Segment database.
6 We stop with 1998 because we need information on industrial segments, which is reported in a different format after 1998 due to change in FASB regulations.
11
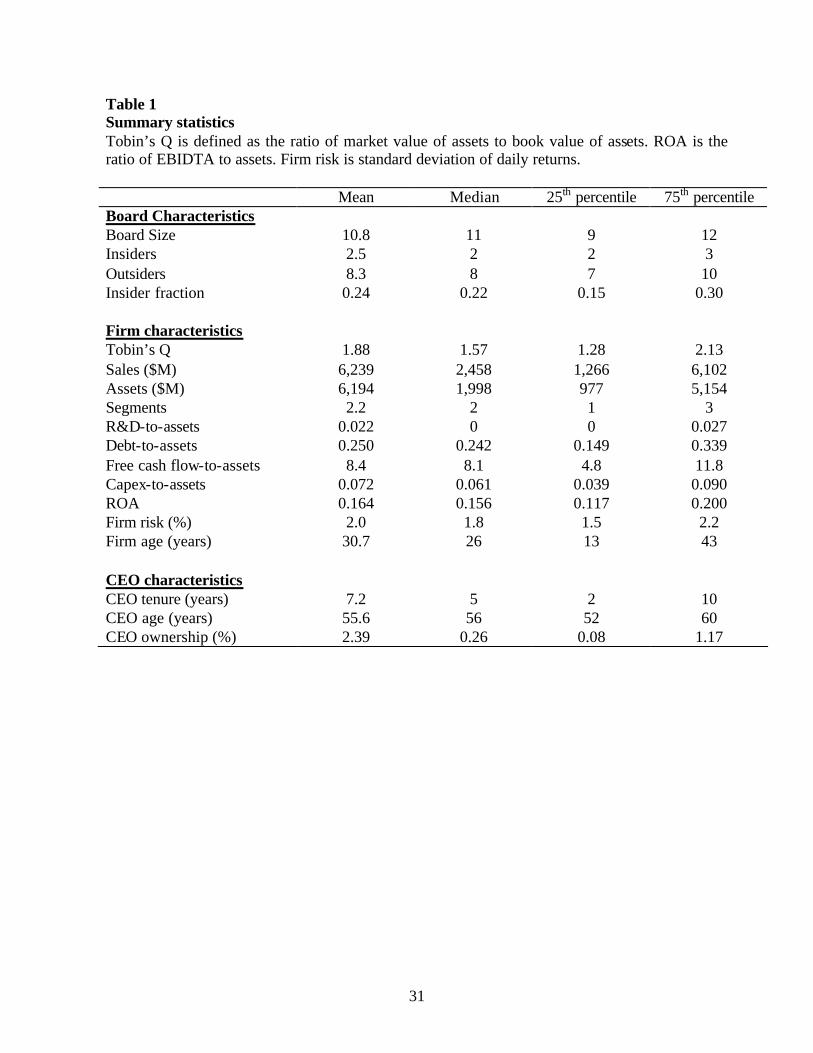
The summary statistics on board, firm, and CEO characteristics are presented in Panel A
of Table 1. The median board has 11 members, with 2 insiders and 9 outsiders. The median
insider fraction is 0.22. These numbers are similar to other recent studies. For example, Bhagat
and Black (2001) report a median board of 11 members with 3 insiders using data for the year
1991. Huson et al (2001) find that in their sample, for the period 1989-1994, the median board
size is 12, with median fraction insiders of 0.21.7 Yermack (1996) finds that over the period
1984-1991, the median sample firm has 12 members with an insider fraction of 0.33, which is
higher than the insider fraction that we find.8
The median firm in our sample is fairly large, with sales of $2.5 billion and assets of $2
billion. 52% of the firm-years are diversified, with a median of 2 segments. 51% of the firms
have non-zero R&D expenditures. The median book leverage is 24%. Mean CEO ownership of
2.39% (median=0.26%) is comparable with other studies such as Bhagat and Black (2001).
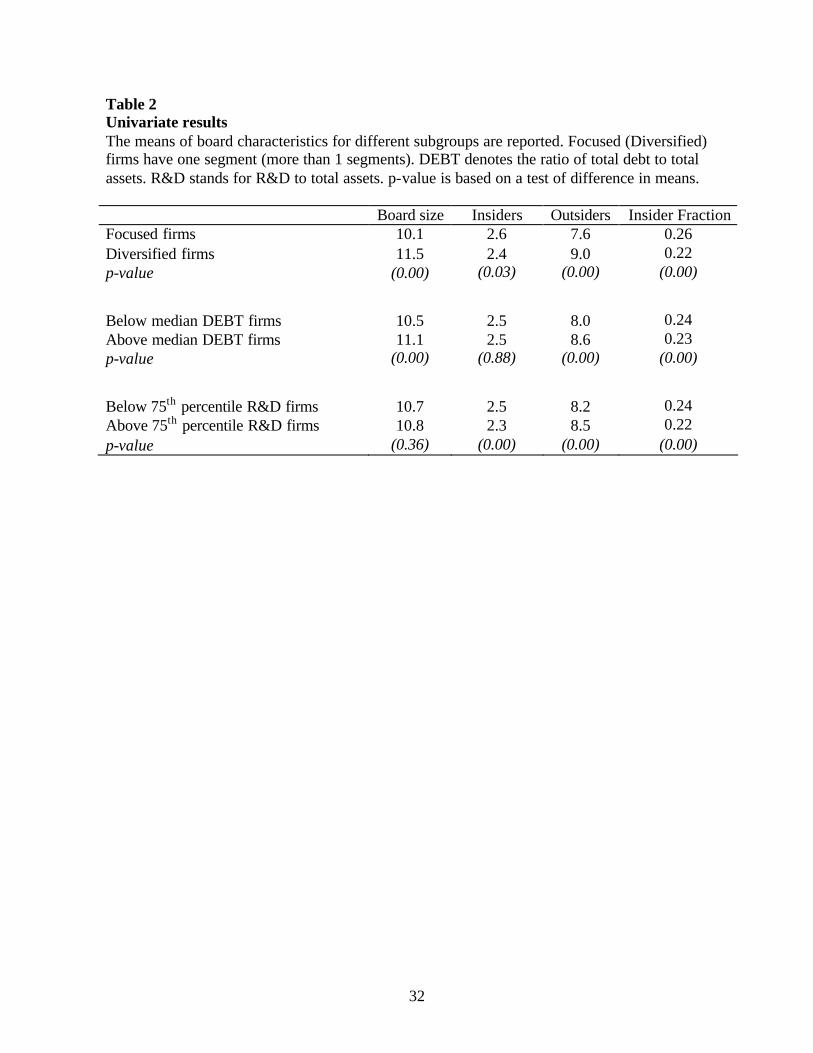
4. Univariate Results
Table 2 sheds some light on the differences in board structure for sub-samples of firms
grouped by firm characteristics. The results indicate that the boards of diversified firms are about
14% larger compared to boards of focused firms (11.5 versus 10.1, difference is significant at
1%). The difference is driven largely by outsiders (9 versus 7.6, difference is significant at 1%).
These numbers are consistent with Anderson et al (2000), who document that diversified firms
have larger boards and smaller fraction of insiders compared to focused firms. Compared to
firms that have below median leverage, firms with above median leverage have slightly larger
boards (11.1 versus 10.5). The difference is driven entirely by outsiders (8.6 versus 8). These
7 Huson et al (2001) have data on the Forbes 800 firms from 1971-1994. They examine board composition and other governance variables across 4 different sub-periods. We compare our data with their summary measures for the last sub-period as this overlaps with our data collection period. 8 Our fraction of outsiders on the board may not be comparable with other studies, as some studies may have broken up outsiders into “gray” and “independent” directors. Our fraction of insiders, however, should be comparable.
12
differences are significant at 1%. The results on diversified firms and high- leverage firms are
consistent with our hypotheses that these types of firms will require larger boards.
We expect R&D-intensive firms to have a higher fraction of insiders on the board. To
capture R&D intensity, we define all firms that have R&D to assets ratio greater than the 75th
percentile (=2.7%) in a given year as high R&D (or R&D-intensive) firms. We choose the 75th
percentile because R&D expenses are skewed, with a median R&D to assets ratio of 0%, and a
mean R&D to assets ratio of 2.2%. Further, for the sample of firms that report a non-zero R&D
expense, the median R&D expense is also 2.7%.9 Contrary to our expectation, insider fraction is
slightly lower in high-R&D firms compared to low-R&D firms (0.22 versus 0.24).
Our main hypotheses relate to the effect of board structure on Tobin’s Q for different
kinds of firms. Figure 1 provides some graphical support for our main hypotheses. Panel A
illustrates the relation between board size and Q for focused versus diversified firms. The dotted
line, which represents the overall sample, has a downward slope, consistent with the findings of
Yermack (1996). This negative relation appears to be driven by focused firms. In contrast, for
diversified firms, Q generally increases with board size, consistent with the idea that larger
boards may benefit diversified firms. Our sample also exhibits the well-documented results that
diversified firms typically have a lower market value compared to focused firms.
Panel B breaks down the sample by leverage. The overall negative relation between
board size and Tobin’s Q appears to be driven by low-debt firms. For high-debt firms, Q
generally increases with board size, consistent with our hypothesis.
To address our hypothesis relating Q to board composition in R&D-intensive firms, we
form deciles based on insider fraction. Since insider fraction is a continuous variable, unlike
9 Baker and Gompers (2003) show that the median value of R&D to assets in their sample of venture-financed firms is 5.58%, with a mean of 8.96%.
13
board size, we use deciles rather than directly using the insider fraction. Decile 1 (Decile 10)
comprises firms with the lowest (highest) insider fraction. Panel C indicates that Q increases
with insider fraction in both low and high R&D firms, but the high-R&D firms exhibit a steeper
slope. This is consistent with our hypothesis that high-R&D firms benefit from having a higher
insider fraction on the board. The dotted line, representing the overall sample, shows no
discernible trend, consistent with the generally inconclusive results on the effect of insider
fraction on Tobin’s Q.
Overall, these figures provide evidence consistent with our key hypotheses; Q increases
with board size in diversified firms and high debt firms, and with fraction insiders in R&D
intensive firms.
5. Multivariate Results
In this section, we discuss our main results relating to Q and board structure using
multivariate regressions that control for other variables that have been shown to affect Q. We
first attempt to replicate the results on board size and Q in Yermack (1996). Our choice of
control variables is based on Yermack’s study. We use contemporaneous, one-year lagged, and
two-year lagged ROA, firm size, capital expenditure scaled by assets, DIVERSE dummy (takes
the value 1 if the firm is diversified and 0 if the firm is focused), fraction of insiders on the board,
CEO ownership, 2-digit SIC dummies, and year dummies. Our proxy for firm size is log(sales).
Our results on all the control variables are generally similar to those in Yermack (1996). We also
find that Q decreases in board size, though the significance of the coefficient of board size is
sensitive to proxies for firm size. The coefficient of board size is significantly negative when we
use log(assets) or log(market value of equity), but is insignificantly negative when we use
14
log(sales).10 We believe, however, that sales are a better measure of firm size for two reasons.
First, sales are likely to be a better indicator of firm size in firms where human capital and
intangible assets are high. Second, the independent variable is the ratio of market value of assets
to book value of assets. If we use book value of assets as a control variable, there will be a
mechanical relation between the two.11
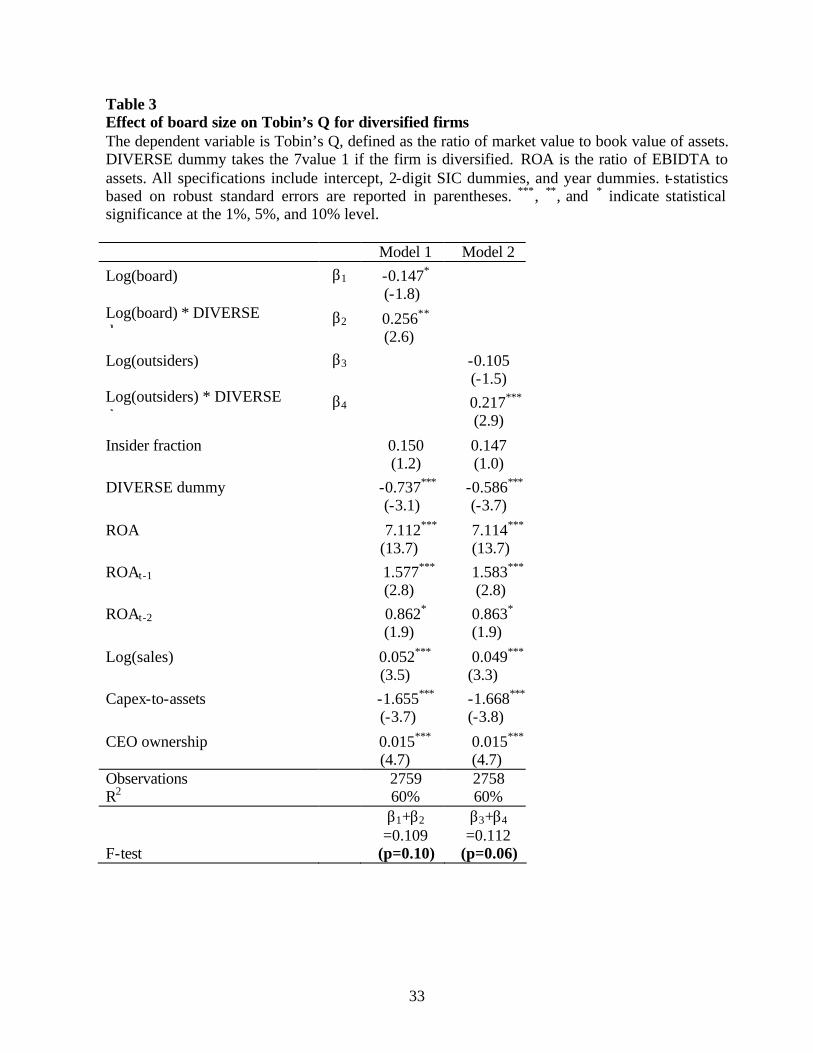
5.1 Tobin’s Q, Board Size, and Diversification
Our specification for investigating the effect of board size on Tobin’s Q for diversified
β2 is the incremental effect of board size on Q for diversified firms, which as per our hypothesis
is expected to be positive. A stronger test of our hypothesis would be that β1 + β2, which gives
the total effect, is positive.
Table 3 presents the OLS regression results of Q on board structure and other control
variables. The coefficient of DIVERSE is significantly negative, reflective of the diversification
discount documented in the literature for diversified firms (Berger and Ofek, 1995; Lang and
Stulz, 1994). 12 We also find that profitable firms, larger firms, and firms with high CEO
ownership are associated with higher Tobin’s Q, consistent with the findings in the literature.
10 Our main inferences are generally similar when we use log(assets) instead of log(sales) 11 Bhagat and Black (2001) report a negative relation between Tobin’s Q and board size in some, but not all, of their specifications. Ferris et al (2002) find a positive relation between Tobin’s Q and board size. The differences between Yermack’s results and these papers could be driven by various factors. First, Yermack (1996) drops finance and utility firms from his sample, while it is not clear whether the other two studies do so. Second, Yermack’s results are for data from 1984-1991, while the other papers cover subsequent time periods and there have been changes in board size and board composition in the latter period (in part due to Yermack’s paper). Third, the control variables that these studies employ differ from the control variables in Yermack (1996). 12 Here and elsewhere, the results are qualitatively similar if we use log(business segments) instead of DIVERSE.
15
The coefficient of board size is -0.147 (p-value 0.07) implying that larger boards result in
lower Q for focused firms. The interaction term of board size and diversification dummy is,
however, significantly positive (p-value=0.01), implying that the negative effect of board size on
Q for focused firms is offset to some extent for diversified firms.
To test if Tobin’s Q and board size are related for diversified firms, we sum the
coefficient of board size and the coefficient of the interaction term of board size with
diversification dummy. The sum gives the total effect of board size on Tobin’s Q for diversified
firms, and is significantly positive (sum=0.109; p=0.10; see the last row of Table 2). For
diversified firms, therefore, Tobin’s Q is increasing in board size, even after controlling for the
insider fraction. The above results are consistent with our hypothesis that diversified firms
benefit from having more directors on the board.13
The coefficient of 0.109 indicates that if the board size doubles in a diversified firm,
Tobin’s Q increases by 0.08, which represents an increase of 5% in the mean Tobin’s Q of a
diversified firm. Similarly for a focused firm, the coefficient of -0.147 for board size indicates
that if board size doubles, the Tobin’s Q decreases by an identical 5%. Given that diversified
firms are more than twice as large compared to focused firms (mean book assets of $9.2 billion
versus $4.2 billion), the economic significance of the board-size effect is larger in dollar terms
for diversified firms.
We argue earlier that diversified firms stand to benefit from having more directors on the
board, as CEOs of diversified firms have a greater need for advice and expertise. Given that
advice is more likely to be provided by outside directors, we expect that the positive relation
between board size and Tobin’s Q is driven by the number of outsiders on the board.
13 The total effect of board size on Tobin’s Q for diversified firms loses statistical power when we use log(assets) instead of log(sales) as a measure of firm size. This could be driven by a higher correlation between these variables and assets compared to the correlation between these variables and sales.
16
Consequently, in model 2, instead of using log of board size, we use log of the number of
outsiders as the independent variable. The coefficient of the interaction of log(outsiders) and
DIVERSE is significantly negative, implying that in diversified firms, having more outsiders
adds value relative to focused firms. The sum of the coefficient of log of outsiders and the
coefficient of the interaction term is positive (=0.112) and significant (p=0.06). This implies that
Tobin’s Q in diversified firms increases in the number of outside directors. Thus, the board size
effect in model 1 is driven more by outsiders rather than insiders. These results support our
hypothesis that more directors, specifically outside directors, add value in diversified firms.14
5.2 Tobin’s Q, Board Size, and Leverage
Our specification for investigating the effect of board size on Tobin’s Q for high-debt
where DEBT takes the value 1 if the firm has above median ratio of debt to assets in a year. Our
choice of using an indicator variable for debt rather than a continuous variable is dictated by the
fact that board size is discrete; we would therefore expect to see an increase in board size only
over broad ranges of debt ratios. β2 is the incremental effect of board size on Q for high-debt
firms, which as per our hypothesis is expected to be positive. β1 + β2, which gives the total effect
of board size on Q for high-debt firms, is positive.
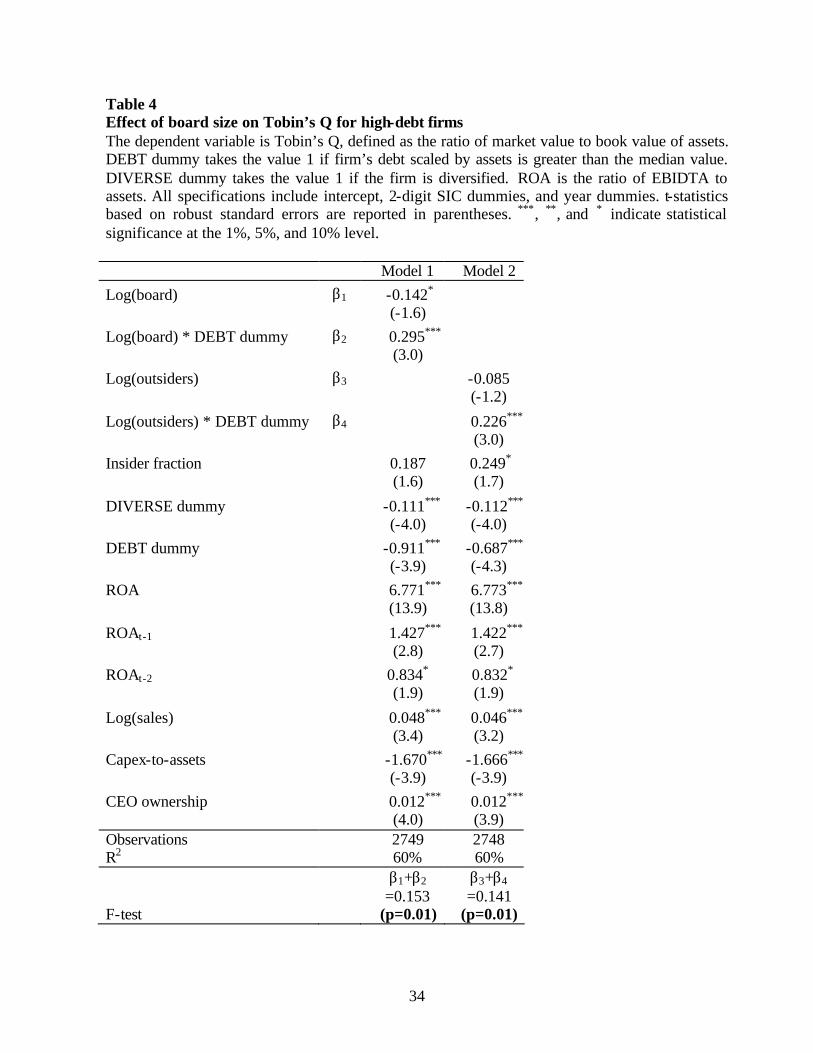
Table 4 reports the results. In Model 1, the coefficient of board size is significantly
negative (-0.142, p-value=0.10), which implies that for low-leverage firms, Q is decreasing in
14 Our results are robust to using log(assets) instead of log(sales), using log(segments) instead of DIVERSE dummy. We also use excess Tobin’s Q instead of Tobin’s Q as the dependent variable. The interaction term of DIVERSE and our measure of firm diversification is always significantly positive but the total effect of board size on Q is now not statistically significant at conventional levels.
17
board size. The coefficient of the interaction term of DEBT dummy with board size is
significantly positive indicating that the negative relation between Q and board size observed in
low-leverage firms is offset to some extent for high- leverage firms. The sum of the coefficient of
board size and the interaction term gives the total effect of board size on Q for high- leverage
firms. This number is 0.153, p-value = 0.01 (see last row of Table 4). These results indicate that
larger boards increase Tobin’s Q for firms with high leverage, consistent with our hypothesis.15
To assess the economic significance, consider the coefficient of -0.142 for low-leverage
firms. This indicates that when board size doubles, Q decreases by 0.10 (5% decrease). For firms
with high leverage, a doubling of board size is accompanied by an increase of 0.11 in Tobin’s Q
(7% increase). Again, the economic significance of this effect in dollar terms is stronger for
high- leverage firms, which tend to be larger in terms of book assets (mean assets of $8.4 billion
versus $4.6 billion).
In model 2, we use log of number of outside directors as the independent variable instead
of board size. The sum of the coefficient of log of outsiders and the coefficient of the interaction
of log of outsiders with DEBT dummy is positive (0.141) and is significant at the 1% level. Thus,
the results in model 1 are driven mainly by the presence of outsiders. It is the increase in outside
directors, rather than inside directors, that contributes to an increase in Tobin’s Q in high-
leverage firms.
5.3 Tobin’s Q, Fraction Insiders, and R&D Intensity
Finally, in model 5, we consider the effect of R&D intensity on the relation between
fraction of insiders on the board, and Q. Our final hypothesis states that, controlling for board
15 The total effect of board size on Tobin’s Q for high-debt firms loses statistical power when we use log(assets) instead of log(sales) as a measure of firm size. This could be driven by a higher correlation between these variables and assets compared to the correlation between these variables and sales. All our inferences unaltered if we use excess Tobin’s Q instead of Tobin’s Q as the dependent variable.
18
size, Tobin’s Q should increase with fraction insiders for R&D intensive firms. Our specification
where R&D dummy takes the value 1 if the firm’s R&D scaled by assets is greater than the 75th
percentile value. β2 is the incremental effect of insider fraction on Q for R&D intensive firms,
which as per our hypothesis is expected to be positive. A stronger test of our hypothesis would
be that β1 + β2, which gives the total effect of insider fraction on high R&D firms, is positive.
The coefficient of fraction insiders is statistically insignificant, suggesting that Q is
independent of board composition for low-R&D firms. The coefficient of the interaction of
fraction insiders with R&D dummy is positive (=0.709, p-value=0.05), indicating that Tobin’s Q
is more positively related to fraction insiders in high R&D firms compared to low R&D firms.
The sum of the coefficient of fraction insiders and the coefficient of the interaction term of
fraction insiders and R&D dummy is significantly positive (=0.757, p-value=0.03). This
indicates that Tobin’s Q increases in fraction insiders in R&D intensive firms, which supports
our hypothesis.
To gauge the economic significance of the results, consider the average firm in the
sample, which has 2.5 insiders in a board of 10.8 directors, implying a fraction of insiders of 0.23.
The results in model 1 indicate that if fraction insiders doubles, Q goes up by 0.757*0.23 = 0.17
for high R&D firms, an increase of 8%.
In conclusion, results from this section are consistent with our three hypotheses. We find
that in diversified firms and in highly levered firms, Tobin’s Q increases in board size, while in
R&D intensive firms, Tobin’s Q increases with fraction insiders. These results are inconsistent
19
with the widely-held belief that the value-maximizing board structure is one of smaller boards
with lower insider fraction.
6. Determinants of board size and board composition
In section 6 we discuss the need for, and the effect of, using simultaneous equations to
control for the endogeneity of board structure and Q. Before we address this issue, however, we
need to understand the determinants of board size and insider fraction. This section explores the
determinants of board size and insider fraction.
6.1 Determinants of board size
While the determinants of fraction insiders have been documented fa irly extensively in
the literature, there is limited evidence on factors affecting board size. Raheja (2002) derives a
theoretical model of board size, where outsiders serve to monitor the CEO. The outsiders use
their CEO succession votes to get insiders to reveal their superior information to the board. Her
model does not consider the advisory role of the board. Baker and Gompers (2002) and Adams
and Mehran (2003) estimate regressions of board size, but both papers use different sets of
independent variables. Further, there is not much discussion relating to their choice of variables.
Our choice of independent variables is based on these studies, and on our hypotheses discussed
earlier.
We use DIVERSE dummy and DEBT dummy, as we argue earlier that CEOs of
diversified firms and firms with high leverage require more advice and therefore such firms
require larger boards. We use firm size as this may proxy for the contracting environment of the
firm. Larger firms are likely to have more external contracting relationships, and may therefore
require larger boards (Pfeffer, 1972; Booth and Deli, 1996).
20
Firm age may also affect board size. Younger firms have higher investment opportunities
(Bevelander, 2002) and hence may require more advising. This suggests that they require larger
boards, all else equal. Conversely, younger firms may also face higher uncertainty, and hence
may require higher monitoring. The need for higher monitoring suggests that smaller boards are
more effective in such firms (Lipton and Lorsch, 1992; Jensen, 1993; Yermack, 1996). The net
effect of firm age on board size is, therefore, an empirical issue.
Board size may also depend on CEO characteristics - we focus here on CEO tenure, CEO
age, and CEO ownership. Hermalin and Weisbach (1988) find that, as part of the CEO
succession process, insiders get added to the board as the CEO nears retirement. Also,
unsuccessful insiders leave the board when the new CEO takes over. This suggests that board
size will increase with CEO tenure and with CEO age. Finally, Hermalin and Weisbach (1998)
argue that board structure is the outcome of a bargaining game between the CEO and the board.
CEOs with high ownership may have more bargaining power, and therefore we use CEO
ownership as an additional control variable.
Model 1 of Table 6 presents estimates from OLS regressions of log(board size). We find
that the coefficient of the diversification dummy is significantly positive, indicating that
diversified firms require larger boards. Similarly, firms with high leverage have larger boards.
These results are consistent with our notion that firms that with greater advisory needs will
require larger boards. Board size also increases with the size of the firm. In terms of CEO
characteristics, we find that board size is increasing in CEO age, is unrelated to CEO tenure, and
is decreasing in CEO ownership.16
16 To proxy for the CEO’s retirement age, we form an indicator variable that takes the value 1 if the CEO is over 60 years old (Baker and Gompers, 2002). Alternately, we form an indicator variable that takes the value 1 if the CEO’s age is between 62 and 66 (Hermalin and Weisbach, 1988). The results discussed here are robust to these alternate specifications.
21
In Model 2, we control for additional variables used in Adams and Mehran (2003) and
Baker and Gompers (2002) in regressions of board size. These include contemporaneous ROA,
one-year lagged ROA, two-year lagged ROA, firm risk (measured by log of standard deviation
of daily returns), and free cash flow to assets. Inferences from Model 2 are qualitatively similar
to that of Model 1. Of the additional variables, only firm risk is significant. The negative relation
between board size and firm risk would be consistent with Yermack (1996) to the extent that
high-risk firms require more monitoring and therefore would choose smaller boards to facilitate
effective monitoring.
Panel B of Table 6 estimates similar regressions with the dependent variable being
log(outsiders). Model 3 results are generally similar to Model 1 results. We observe that
diversified firms, firms with high leverage, larger firms, and older firms have more outsiders on
the board. The number of outsiders is negatively related to CEO ownership. Interestingly,
comparing models 1 and 3, we find that as CEO age increases, board size increases, but not the
number of outsiders. This is consistent with Hermalin and Weisbach (1988) that more insiders
are added to the board as the CEO nears retirement.
Model 4 shows that these results hold when we control for other variables that have been
used in Adams and Mehran (2003) and Baker and Gompers (2002) to explain board size. Again,
among the new control variables, only firm risk has statistical power; the coefficient is
significantly negative at the 1% level.17
6.2 Determinants of board composition
Our choice of independent variables for board composition is based on the extensive
literature in this area. Hermalin and Weisbach (1988) and Bhagat and Black (2001), find that
17 We included Tobin’s Q as an additional independent variable in both Models 2 and 4 to allow for the possibility that board size and number of outsiders may be determined by firm value. While none of the other inferences change, the coefficient of Q itself is positive but statistically insignificant.
22
outsiders get added to the board following poor performance. We therefore control for firm
performance using contemporaneous, one-year lagged, and two-year lagged ROA. Hermalin and
Weisbach (1998) study board composition as the outcome of a bargaining game between the
CEO and the board. Both CEO tenure and CEO ownership could be expected to increase the
CEO’s bargaining power, and therefore increase the fraction of insiders on the board. As board
composition could also be affected by CEO succession issues (Hermalin and Weisbach, 1988),
we control for CEO age. Further, there is empirical evidence that smaller and younger firms have
greater fraction of insiders (Hermalin and Weisbach, 1988; Denis and Sarin, 1999). We therefore
include firm size and firm age as additional control variables. Finally, given our hypothesis that
R&D intensive firms will have higher fraction insiders, we include our indicator variable for
high-R&D firms.
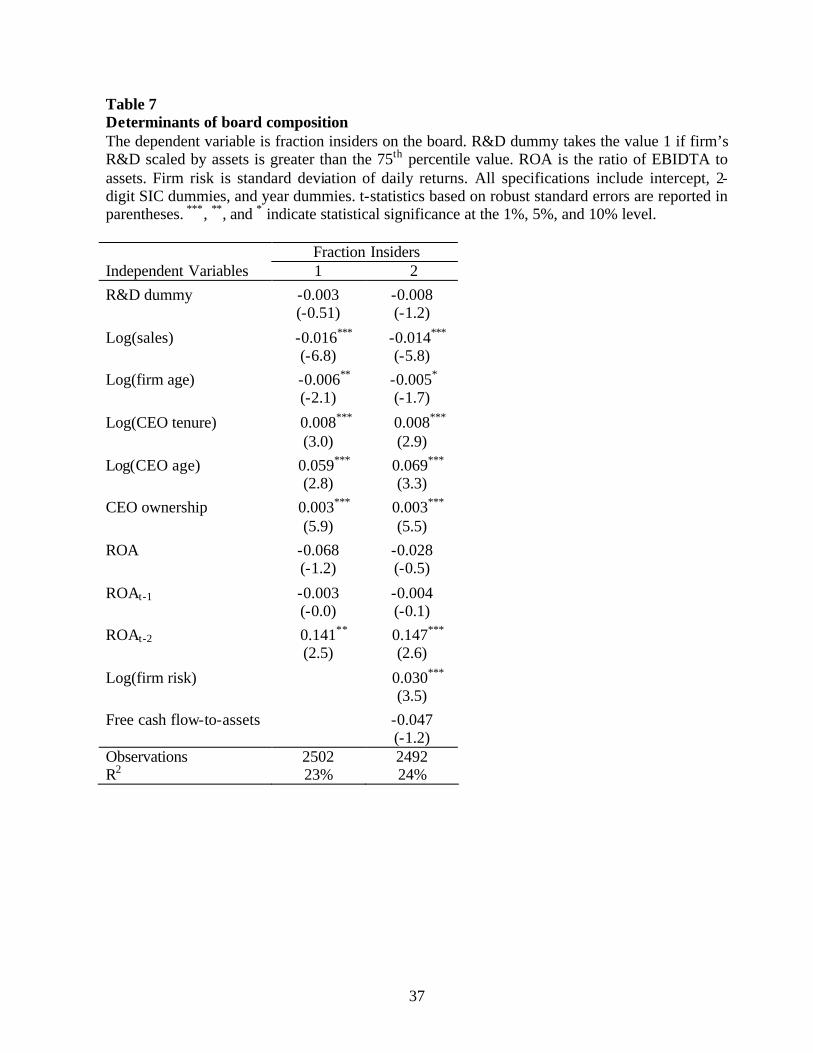
Table 7 reports the OLS regression results where the dependent variable is the fraction of
insiders. We find no significant relation between insider fraction and contemporaneous and one-
year lagged ROA. Two-year lagged ROA, however, is significantly positively related to insider
fraction, consistent with Hermalin and Weisbach (1998). When firm performance is good, the
CEO has more bargaining power, and is therefore able to have a higher fraction of insiders on the
board. Similarly, CEO ownership and CEO tenure, both of which presumably increase the
CEO’s bargaining power, are positively related to fraction insiders. As suggested by Hermalin
and Weisbach (1988) we find that CEO age is positively associated with the fraction of insiders
on the board.18 As with Denis and Sarin (1999), we find that bigger firms and older firms have
lower fraction of insiders. Contrary to our expectation, there appears to be no relation between
R&D intensity and insider fraction. In model 2, we estimate the same regression, but use firm
18 As with board size regressions, we use two different indicator variables to proxy for CEO retirement age. The results discussed here are robust to these alternate specifications.
23
risk and free cash flow scaled by assets as additional control variables as these could proxy for
monitoring requirement. Raheja (2002) suggests that these variables affect board composition.
Our findings in model 1 hold. Additionally, we find that the fraction of insiders increases in firm
risk.19
To sum up, this section describes the determinants of board size and fraction insiders.
Since these variables themselves are likely to arise endogenously to maximize Tobin’s Q, we
estimate these regressions in a simultaneous equation setting in the following section.
7. Effect of board structure on Q controlling for endogeneity
Hermalin and Weisbach (1988, 1991) and Bhagat and Black (1999, 2001) show that
board composition and board size could change following changes in firm value. Denis and Sarin
(1999) find changes in inside ownership following changes in firm performance. Morck et al
(1988) and McConnell and Servaes (1991) show that Q is related to inside ownership and to
CEO ownership. A separate literature (Smith and Watts, 1992; Bizjak et al, 1993; Core and Guay,
1999) argues that CEO ownership depends on Q. Bhagat and Black (2001) estimate Tobin’s Q,
board composition, and CEO ownership simultaneously using 3SLS. In our case, this suggests
the need to estimate Q, board size, fraction of insiders, and CEO ownership in a simultaneous
system. As in Bhagat and Black (2001), we use 3SLS. Table 5 reports the results.
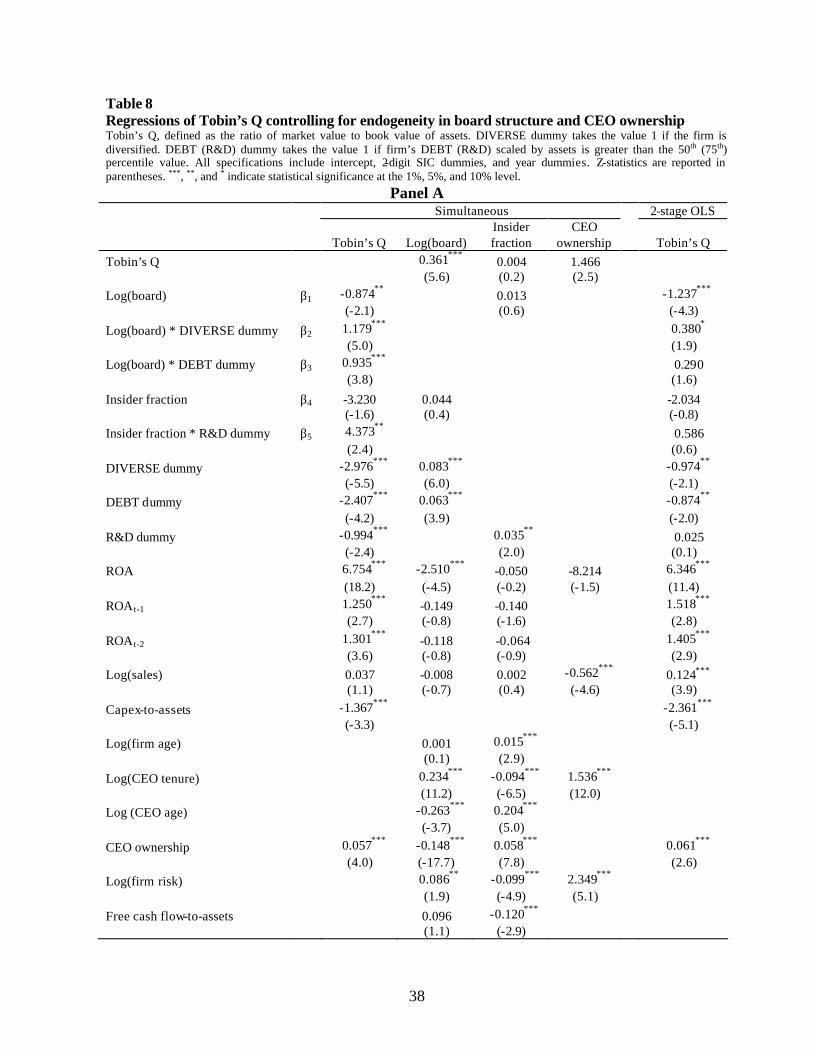
The results on Tobin’s Q are indicated in the first column of the table. The specification
is similar to that in Table 3; however, we include all three interaction terms that we discuss
earlier in the paper. Results on the control variables are qualitatively similar to the OLS
regression results in Tables 3-5. As with the OLS specifications in Tables 3-5, the coefficients of
all three interaction terms are positive. Unlike Tables 3-5, however, the overall effect of board
19 As with board size regressions, we included Tobin’s Q as an additional independent variable in both Models 2 and 4 to allow for the possibility that board composition may be determined by firm value. While none of the other inferences change, the coefficient of Q itself is positive but statistically insignificant.
24
structure on Q cannot be inferred directly. Panel B provides estimates of the overall effect for
various subgroups of firms.
We now find that the negative effect of board size on Q is driven by low-debt focused
firms. Similarly, the positive effect of board size on Q is driven by high-debt diversified firms,
where the advisory needs are arguably the highest. As before, we find that high-R&D firms
benefit by having a higher insider fraction on the board. For low-R&D firms, however, we find
that Q decreases with insider fraction.
The board size results, similar to the OLS results of board size (model 2 in table 6)
indicate that diversified firms and high-debt firms have larger boards. Firms with high CEO
ownership have smaller boards. There are important differences as well. The coefficient of firm
size is no longer significant. Also, as expected, board size increases with CEO tenure. The
coefficients of CEO age and firm risk have opposite signs as compared to the OLS results.
The third column presents the results for fraction insiders. The results on CEO age, CEO
ownership, and free cash flow are generally similar to the OLS results. As in board size
regressions, there are important differences compared to the OLS results. We find that high R&D
firms choose higher fraction insiders, consistent with our hypothesis. The results on CEO tenure,
firm age, and firm risk have opposite signs compared to the OLS results.
The fourth column in Table 8 presents results for CEO ownership. The factors affecting
CEO ownership are based on the extensive literature in this area.20 Prior research suggests that
CEO ownership is likely to be related to the firm’s size, growth opportunities, CEO tenure and
firm risk. We find that CEO ownership increases with market to book ratio, with firm risk, and
20 A partial list of references would include Demsetz and Lehn (1985), Bizjak, Brickley and Coles (1993), Smith and Watts (1992) and Core and Guay (1999)
25
with CEO tenure. CEO ownership decreases with firm size. These results are generally
consistent with prior literature.
Overall, the 3SLS results that controls for endogeneity generally support our arguments,
and support the OLS results provided earlier.
8. Conclusion
We examine two related research questions that have been subject of several studies; the
effect of board size on Tobin’s Q, and the effect of board composition on Tobin’s Q. While
earlier research has concluded that Tobin’s Q decreases with board size, we argue that there are
certain kinds of firms, specifically where the advisory role of the board is relatively more
important, which may benefit from bigger boards. Similarly, there are certain kinds of firms,
specifically where the firm-specific knowledge of inside directors is relatively more important,
for which a higher fraction of insiders on the board may add value to the firm.
Our study speaks to Hermalin and Weisbach’s (2003) call for a better understanding of
the relation between board size and corporate performance. McConnell (2002) also calls for
more research on the role of outsider directors. Our findings indicate that, in diversified firms
and in high-debt firms, Tobin’s Q increases with the number of directors, specifically, with more
outsiders on the board. This is consistent with outsiders playing an important advisory role. We
also find that Tobin’s Q increases in fraction insiders in R&D intensive firms. This supports the
idea that insiders have an important role to play in firms where specialized knowledge is critical.
These findings assume significance as the role of boards in the governance of
corporations has come under intense scrutiny in the wake of recent accounting scandals at
leading corporations such as Enron, WorldCom, and Qwest. For instance, in June 2002, the New
York Stock Exchange (NYSE) proposed changes in the corporate governance standards for all
26
firms listed with the Exchange. One of the principal recommendations of the NYSE was that all
NYSE-listed firms should have majority of independent directors on their board. Our findings
suggest that more research is required before adopting such recommendations, which are based
on a notion that there is one optimal board size or board composition.
27
References
Adams, R., B., 2000, The dual role of corporate boards as advisors and monitors of management: Theory and evidence, Working paper, Federal Reserve Bank of New York Adams, R. B. and H. Mehran, 2003, Board structure and banking firm performance, Federal Reserve Bank of New York Economic Policy Review, 9, 123-142 Agrawal, A., and C. R. Knoeber, 2001, Do some outside directors play a political role? Journal of Law and Economics, 14, 179-198 Anderson R., T. Bates, J. Bizjak, and M. Lemmon, 2000, Corporate governance and firm diversification, Financial Management, 29, 5-22 Bainbridge, S, 2003, A critique of the NYSE’s Director Independence Listing Standards, Working paper, UCLA School of Law Baker, M. and P. A. Gompers, 2003, The determinants of board structure at the initial public offering, Journal of Law and Economics, Forthcoming Baysinger, B. D. and H. N. Butler, 1985, Corporate governance and the board of directors: Performance effects of changes in board composition, Journal of Law, Economics, and Organization, 1, 101-124 Baysinger, B. D., R. D. Kosnik, and T. A. Turk, 1991, Effects of board and ownership structure on corporate R&D strategy, Academy of Management Journal, 34, 205-214 Baysinger, B. D. and R. E. Hoskisson, 1990, The composition of boards of directors and strategic control: Effects of corporate strategy, Academy of Management Review, 15, 72-87 Bhagat, S. and B. Black, 1999, The uncertain relationship between board composition and firm performance, Business Lawyer, 54, 921-963 Bhagat, S. and B. Black, 2001, The non-correlation between board independence and long term firm performance, Journal of Corporation Law, 27, 231-274 Bhagat, S. and I. Welch, 1995, Corporate research and development investments: International comparisons, Journal of Accounting and Economics, 19, 443-470 Bizjak, J. M., J. A. Brickley, and J. L. Coles, 1993, Stock-based incentive compensation and investment behavior, Journal of Accounting and Economics, 16, 349-372. Booth, J. and D. Deli, 1996, Factors affecting the number of outside directorships held by CEOs, Journal of Financial Economics, 40, 81-104 Booth, J. and D. Deli, 1999, On executives of financial institutions as outside directors, Journal
28
of Corporate Finance, 5, 227-250 Borokhovich, K. A., R. Parrino, and T. Trapani, 1996, Outside directors and CEO selection, Journal of Financial and Quantitative Analysis, 31, 337-355 Brickley, J. A., J. L. Coles, and R.L. Terry, 1994, Outside directors and the adoption of poison pills, Journal of Financial Economics, 35, 371-390 Burkart, M., D. Gromb, and F. Panunzi, 1997, Large shareholders, monitoring, and the value of the firm, Quarterly Journal of Economics, 112, 693-728 Byrd, J. W., and K. A. Hickman, 1992, Do outside directors monitor managers? Evidence from tender offer bids, Journal of Financial Economics, 32, 195-222 Cotter, J., A. Shivdasani, and M. Zenner, 1997, Do outside directors enhance target shareholder wealth during tender offer contests?, Journal of Financial Economics, 43, 195-218 Dalton, D., C. Daily, J. L. Johnson, and A. Ellstrand, 1999, Number of directors and financial performance: A meta-analysis, Academy of Management Journal, 42, 674-686 Demsetz, H. and K. Lehn, 1985, The structure of corporate ownership: Causes and Consequences, Journal of Political Economy, 93, 1155-1177 Denis D. J. and A. Sarin, 1999, Ownership and board structures in publicly traded corporations, Journal of Financial Economics, 52, 187-223 Dosi, G., R. Rumelt, D. Teece and S. Winter, 1994, Understanding corporate coherence: Theory and evidence, Journal of Economic Behavior and Organization, 23, 1-30 Eisenberg, T., Sundgren, S., and M. T. Wells, 1998, Larger board size and decreasing firm value in small firms, Journal of Financial Economics, 48, 35-54 Fama, E. F., and M. C. Jensen, 1983, Separation of ownership and control, Journal of Law and Economics, 26, 301-325 Gillan, S. L., J. C. Hartzell, and L. T. Starks, 2002, Industries, investment opportunities, and corporate governance structures, Working Paper, Center for Corporate Governance, University of Delaware Gillette, A., T. Noe, and M. Rebello, 2003, Corporate Board Composition, Protocols and Voting Behavior: Experimental Evidence, Journal of Finance, Forthcoming Hermalin, B. E. and M. S. Weisbach, 1988, The determinants of board composition, Rand Journal of Economics, 19, 589-606 Hermalin, B. E. and M. S. Weisbach, 1991, The effect of board composition and direct
29
incentives on firm performance, Financial Management, 20, 101-112 Hermalin, B. E. and M. S. Weisbach, 1998, Endogenously chosen boards of directors and their monitoring of the CEO, American Economic Review, 88, 96-118 Hermalin, B. E. and M. S. Weisbach, 2003, Board of directors as an endogenously determined institution, Federal Reserve Bank of New York Economic Policy Review, 9, 1-20 Hirshleifer, D. and A. Thakor, 1994, Managerial performance, boards of directors, and takeover bidding, Journal of Corporate Finance, 1, 63-90 Huson, M., Parrino, R., L. Starks, 2001. Internal monitoring mechanisms and CEO turnover: A long-term perspective, Journal of Finance, 56, 2265-2297 Jensen, M., 1993, The modern industrial revolution, exit and the failure of internal control systems, Journal of Finance, 48, 831-880 Kini, O., W. Kracaw, and S. Mian, 1995, Corporate takeovers, firm performance and board composition, Journal of Corporate Finance, 1, 383-412 Klein, A., 1998, Firm performance and board committee structure, Journal of Law and Economics, 41, 137-165 Lang, L. and R. Stulz, 1994, Tobin's q, corporate diversification and firm performance, Journal of Political Economy 102, 1248-1280 Lipton, M. and J. W. Lorsch, 1992, A modest proposal for improved corporate governance, Business Lawyer, 1, 59-77 Lorsch, J.W. and E. MacIver, 1989, Pawns or potentates: The reality of America’s corporate boards, Boston: Harvard Business School Press Mace, 1971, Directors, myth, and reality, Boston: Harvard Business School Press MacAvoy, P. and I. Millstein, 1999, The active board of directors and its effect on the performance of the large publicly traded corporation, Journal of Applied Corporate Finance, 11, 8-20 McConnell, J., 2002, Outside directors, Keynote address to Annual Meeting of Eastern Finance Association McConnell, J. and H. Servaes, 1990, Additional evidence on equity ownership and corporate value, Journal of Financial Economics, 27, 595-612 Morck, R., A. Shleifer, and R. Vishny, 1988, Management ownership and market valuation: An empirical analysis, Journal of Financial Economics, 20, 293-315
30
Noe, T. and M. Rebello, 2000, The design of corporate boards, composition, compensation, factions and turnover, Working paper, Georgia State University Pfeffer, J., 1972, Size and composition of corporate boards of directors: The organization and its environment, Administrative Science Quarterly, 17, 218-229 Pfeffer, J. and G. R. Salancik, 1978, The external control of organizations: A resource dependence perspective, New York: Harper & Row Rajan, R. G. and L. Zingales, 1995, What do we know about capital structure? Some evidence from international data, Journal of Finance, 50, 1421-1460 Rosenstein, S. and J. Wyatt, 1997, Inside directors, board effectiveness and shareholder wealth, Journal of Financial Economics, 44, 229-250 Vafeas, N. 1999, Board meeting frequency and firm performance, Journal of Financial Economics, 53, 113-142 Williamson, O. E., 1975, Markets and Hierarchies: Analysis and Antitrust implications, The Free Press, New York Weisbach, 1988, Outside directors and CEO turnover, Journal of Financial Economics, 20, 421-460 Wu, 2003, Honey, Calpers shrunk the board!, Journal of Corporate Finance, Forthcoming Yermack, D., 1996, Higher market valuation of companies with a small board of directors, Journal of Financial Economics, 40, 185-212
31
Table 1 Summary statistics Tobin’s Q is defined as the ratio of market value of assets to book value of assets. ROA is the ratio of EBIDTA to assets. Firm risk is standard deviation of daily returns.
Table 2 Univariate results The means of board characteristics for different subgroups are reported. Focused (Diversified) firms have one segment (more than 1 segments). DEBT denotes the ratio of total debt to total assets. R&D stands for R&D to total assets. p-value is based on a test of difference in means. Board size Insiders Outsiders Insider Fraction Focused firms 10.1 2.6 7.6 0.26 Diversified firms 11.5 2.4 9.0 0.22 p-value (0.00) (0.03) (0.00) (0.00)
Table 3 Effect of board size on Tobin’s Q for diversified firms The dependent variable is Tobin’s Q, defined as the ratio of market value to book value of assets. DIVERSE dummy takes the 7value 1 if the firm is diversified. ROA is the ratio of EBIDTA to assets. All specifications include intercept, 2-digit SIC dummies, and year dummies. t-statistics based on robust standard errors are reported in parentheses. ***, **, and * indicate statistical significance at the 1%, 5%, and 10% level. Model 1 Model 2 Log(board) β1 -0.147* (-1.8) Log(board) * DIVERSE dummy
Table 4 Effect of board size on Tobin’s Q for high-debt firms The dependent variable is Tobin’s Q, defined as the ratio of market value to book value of assets. DEBT dummy takes the value 1 if firm’s debt scaled by assets is greater than the median value. DIVERSE dummy takes the value 1 if the firm is diversified. ROA is the ratio of EBIDTA to assets. All specifications include intercept, 2-digit SIC dummies, and year dummies. t-statistics based on robust standard errors are reported in parentheses. ***, **, and * indicate statistical significance at the 1%, 5%, and 10% level. Model 1 Model 2 Log(board) β1 -0.142* (-1.6) Log(board) * DEBT dummy β2 0.295*** (3.0) Log(outsiders) β3 -0.085 (-1.2)
Table 5 Effect of insider fraction on Tobin’s Q for high-R&D firms The dependent variable is Tobin’s Q, defined as the ratio of market value to book value of assets. R&D dummy takes the value 1 if firm’s R&D scaled by assets is greater than the 75th percentile value. DIVERSE dummy takes the value 1 if the firm is diversified. ROA is the ratio of EBIDTA to assets. All specifications include intercept, 2-digit SIC dummies, and year dummies. t-statistics based on robust standard errors are reported in parentheses. ***, **, and * indicate statistical significance at the 1%, 5%, and 10% level. Model 1 Log(board) -0.021 (-0.4) Insider fraction β1 0.048 (0.4) Insider fraction * R&D dummy β2 0.709** (2.0)
DIVERSE dummy -0.118*** (-4.3) R&D dummy 0.138* (1.7)
CEO ownership 0.016*** (5.2) Observations 2740 R2 61%
F-test
β1+β8
=0.757 (p=0.03)
36
Table 6 Determinants of number of directors and number of outsiders on the board The dependent variable is either log of board size (Panel A) or log of outsiders on the board (Panel B). DIVERSE dummy takes the value 1 if the firm is diversified. DEBT dummy takes the value 1 if firm’s debt scaled by assets is greater than the 50th percentile value. ROA is the ratio of EBIDTA to assets. Firm risk is standard deviation of daily returns. All specifications include intercept, 2-digit SIC dummies, and year dummies. t-statistics based on robust standard errors are reported in parentheses. ***, **, and * indicate statistical significance at the 1%, 5%, and 10% level.
Table 7 Determinants of board composition The dependent variable is fraction insiders on the board. R&D dummy takes the value 1 if firm’s R&D scaled by assets is greater than the 75th percentile value. ROA is the ratio of EBIDTA to assets. Firm risk is standard deviation of daily returns. All specifications include intercept, 2-digit SIC dummies, and year dummies. t-statistics based on robust standard errors are reported in parentheses. ***, **, and * indicate statistical significance at the 1%, 5%, and 10% level. Fraction Insiders Independent Variables 1 2 R&D dummy -0.003 -0.008 (-0.51) (-1.2)
Table 8 Regressions of Tobin’s Q controlling for endogeneity in board structure and CEO ownership Tobin’s Q, defined as the ratio of market value to book value of assets. DIVERSE dummy takes the value 1 if the firm is diversified. DEBT (R&D) dummy takes the value 1 if firm’s DEBT (R&D) scaled by assets is greater than the 50th (75th) percentile value. All specifications include intercept, 2-digit SIC dummies, and year dummies. Z-statistics are reported in parentheses. ***, **, and * indicate statistical significance at the 1%, 5%, and 10% level.
Panel B Effect of board structure on Tobin’s Q for various subgroups of firms The effect of board structure on Tobin’s Q for various subgroups of firms based on simultaneous systems estimates is given below. The p-value given in parentheses is based on either Chi-square value (for sum of coefficients) or Z-statistic (for single coefficient). Effect of board size on Tobin’s Q for low-debt focused firms = β1 = -0.874 (p=0.08) Effect of board size on Tobin’s Q for low-debt diversified firms = β1+β2 = 0.305 (p=0.21) Effect of board size on Tobin’s Q for high-debt focused firms = β1+β3 = 0.061 (p=0.77) Effect of board size on Tobin’s Q for high-debt diversified firms = β1+β2+β3 = 1.240 (p=0.00) Effect of insider fraction on Tobin’s Q for low-R&D firms = β4 = -3.200 (p=0.10) Effect of insider fraction on Tobin’s Q for high-R&D firms = β4+β5 = 1.173 (p=0.00)
40
Panel A: diversified versus focused firms Panel B: high-debt versus low-debt firms Panel C: high-R&D versus low-R&D firms
1.5
1.9
2.3
2.7
4 8 12 16 20Board Size
Mea
n To
bin'
s Q
focused
overall
diversifed
1.3
1.7
2.1
2.5
2.9
4 8 12 16 20Board Size
Mea
n To
bin'
s Q
low-debt
overall
high-debt
1.4
1.8
2.2
2.6
3.0
0 2 4 6 8 10
Insider Fraction Decile
Mea
n To
bin'
s Q
low R&D
high-R&D
overall
Figure 1. Effect of board structure on Tobin’s Q for different types of firms The Y-axis is Tobin’s Q defined as the ratio of market value of assets to book value of assets. In Panel A, diversified firms represent those with more than one business segment. In Panel B, high (low) debt firms are those whose leverage is above (below) median values. In Panel C, high (low) R&D firms are those whose R&D expenditures scaled by assets is greater (less) than the 75th percentile values. In Panel C, firms are categorized into 10 deciles based on the fraction of insiders on the board, where decile 1 (10) consists of firms with the lowest (highest) fraction.


![School Board Legal Authority.ppt [Read-Only] · ––How Governing Boards Fit in EducationHow Governing Boards Fit in Education Governance Structure ... American System of Education](https://static.documents.pub/doc/80x56/5b7885e67f8b9a31308bc3ec/school-board-legal-read-only-how-governing-boards-fit-in-educationhow.jpg)


