89
| Date post: | 22-Oct-2014 |
| Category: |
Health & Medicine |
| View: | 2,362 times |
| Download: | 0 times |

Creating Excellence in Healthcare
Robert A. Frist, Jr.
Chief Executive Officer

99 HealthStream Customers Achieved Magnet Status
2008 100 Most Improved Hospitals
2008 100 Most Improved Hospitals
58% HealthStream Customers
Thompson-Rueters Top 100 Hospitals 2008
33% HealthStream Customers


Global Launch of Exclusive New Product
1pm Tomorrow!
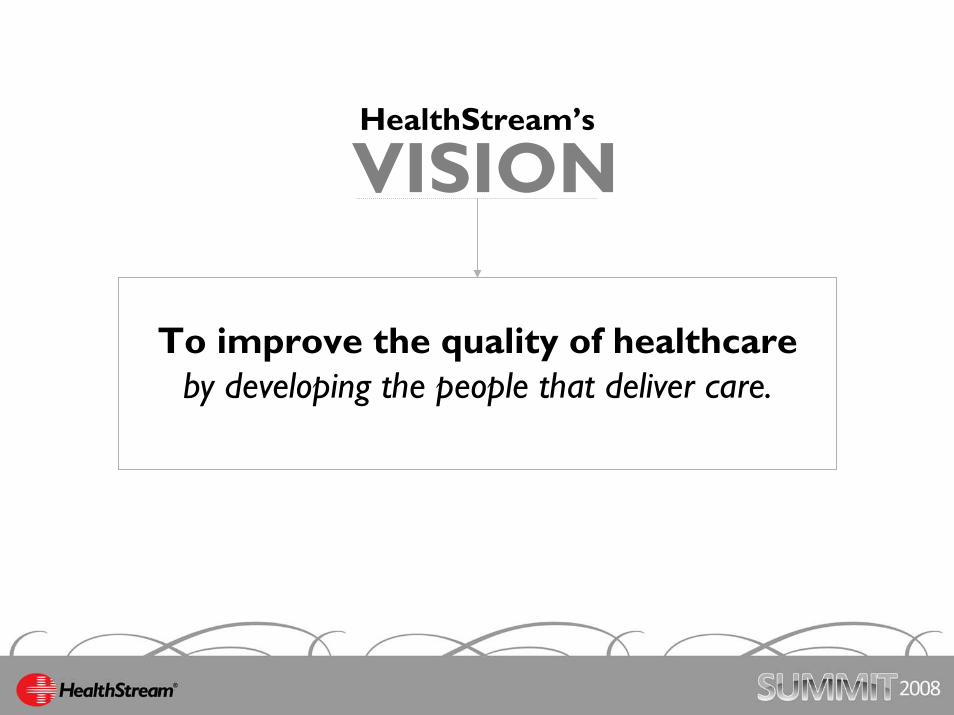
To improve the quality of healthcareby developing the people that deliver care.
VISIONHealthStream’s
To advance healthcare organizations through continuous measurement and adaptive learning solutions, resulting in
improved patient care, increased productivity, rapid assimilation of new practices, enhanced compliance, and better outcomes.
MISSIONHealthStream’s
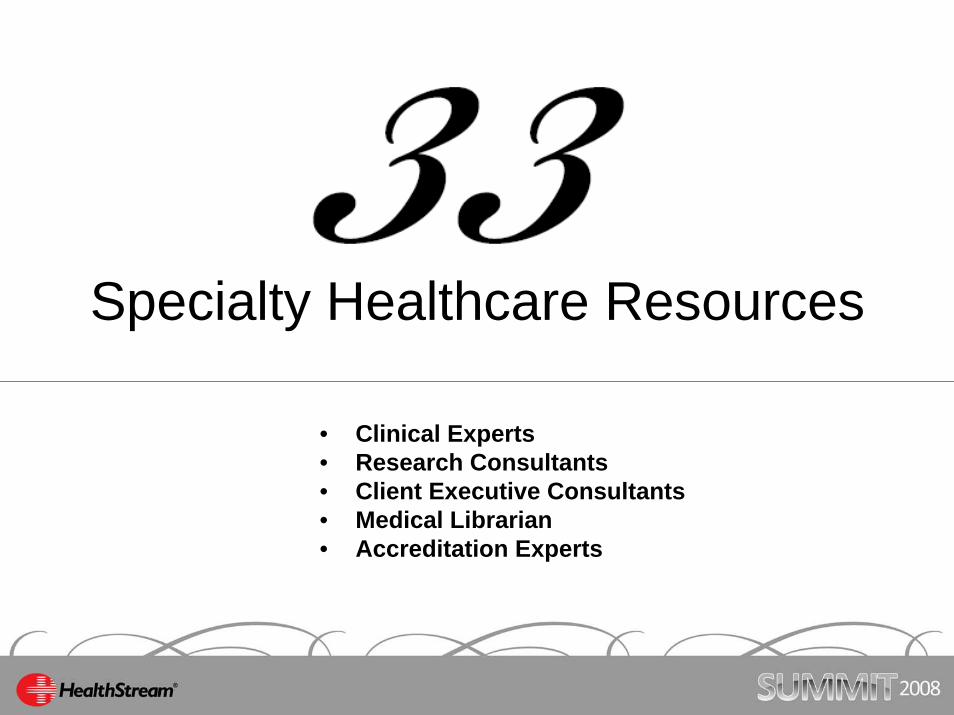
Specialty Healthcare Resources
• Clinical Experts• Research Consultants• Client Executive Consultants• Medical Librarian• Accreditation Experts

18 Themes


Case Studies of
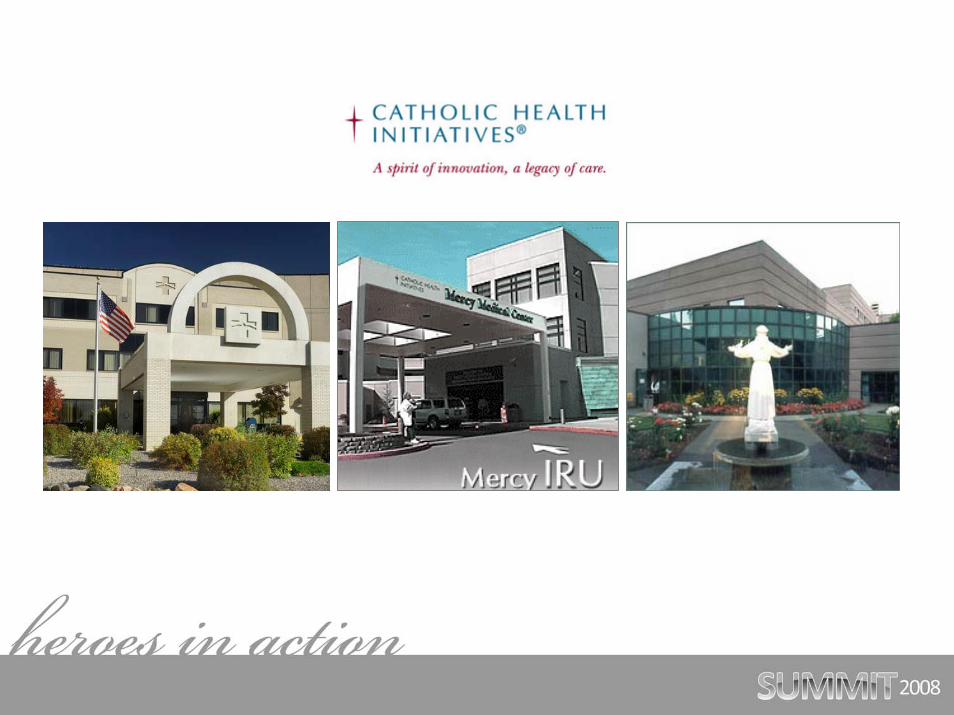
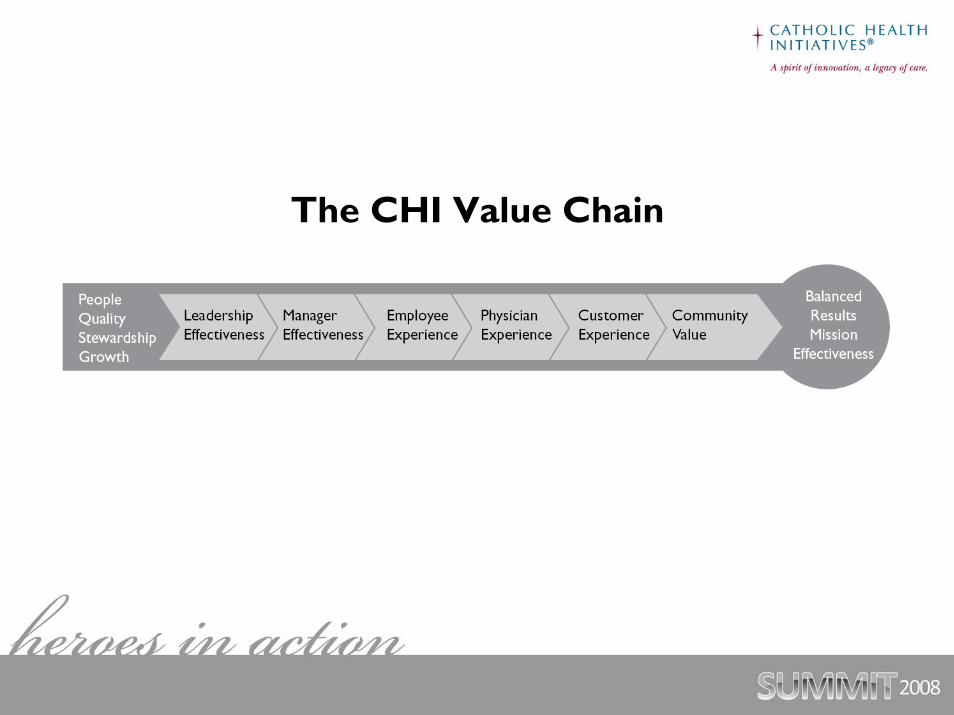
The CHI Value Chain
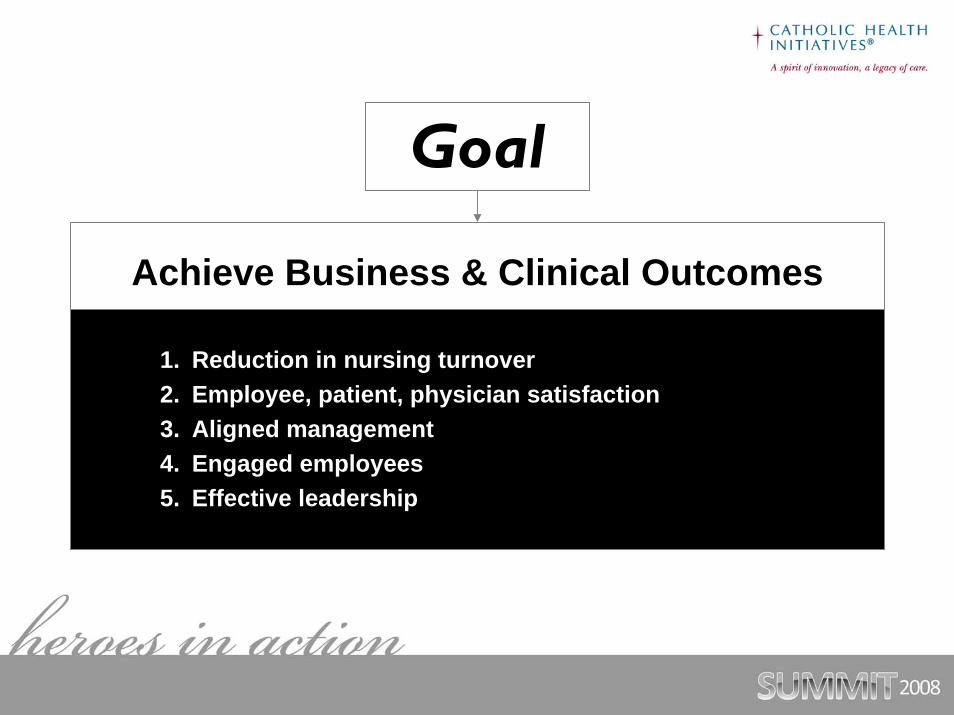
Achieve Business & Clinical Outcomes
1. Reduction in nursing turnover2. Employee, patient, physician satisfaction 3. Aligned management4. Engaged employees5. Effective leadership
Goal
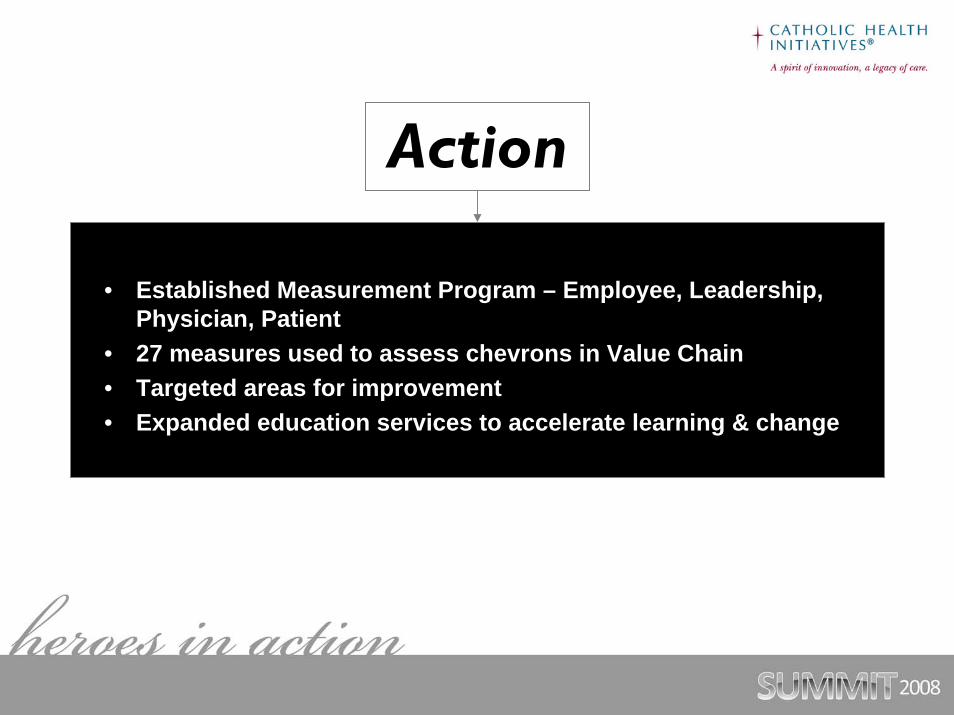
• Established Measurement Program – Employee, Leadership, Physician, Patient
• 27 measures used to assess chevrons in Value Chain• Targeted areas for improvement• Expanded education services to accelerate learning & change
Action
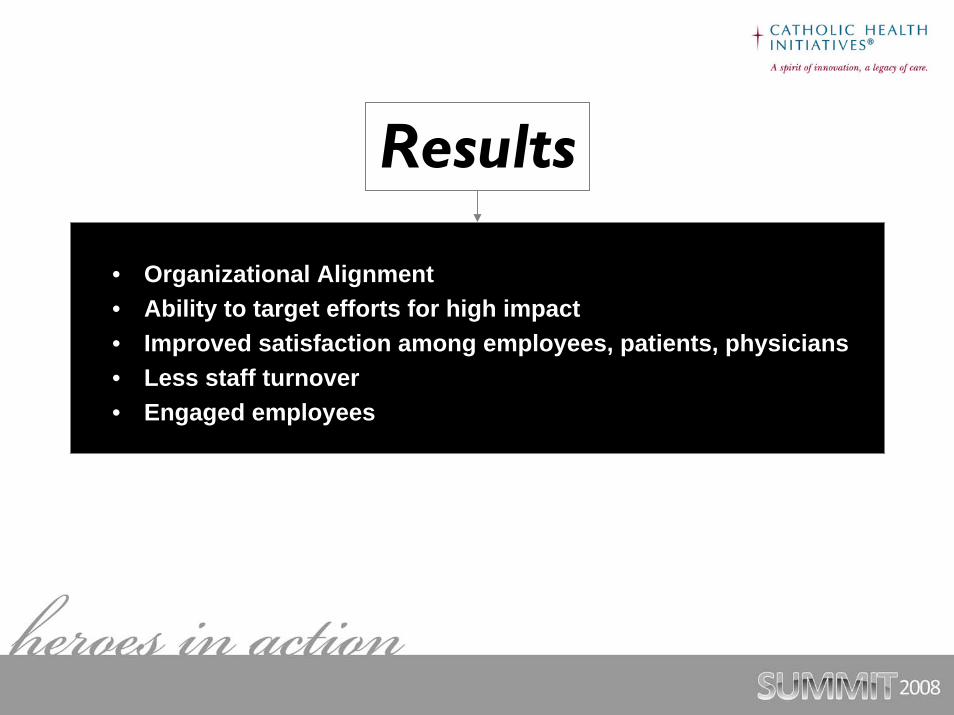
• Organizational Alignment• Ability to target efforts for high impact• Improved satisfaction among employees, patients, physicians• Less staff turnover• Engaged employees
Results
CHI Presentations at Summit 2008
Susan Almond
Colleen Elliott
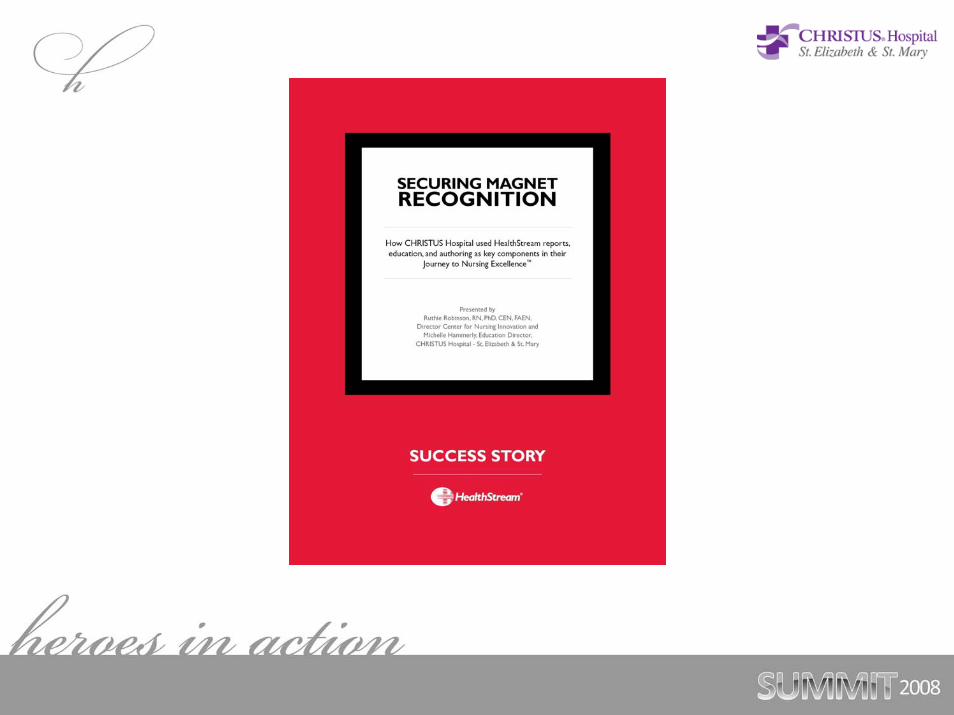
Achieve Magnet Recognition
Goal
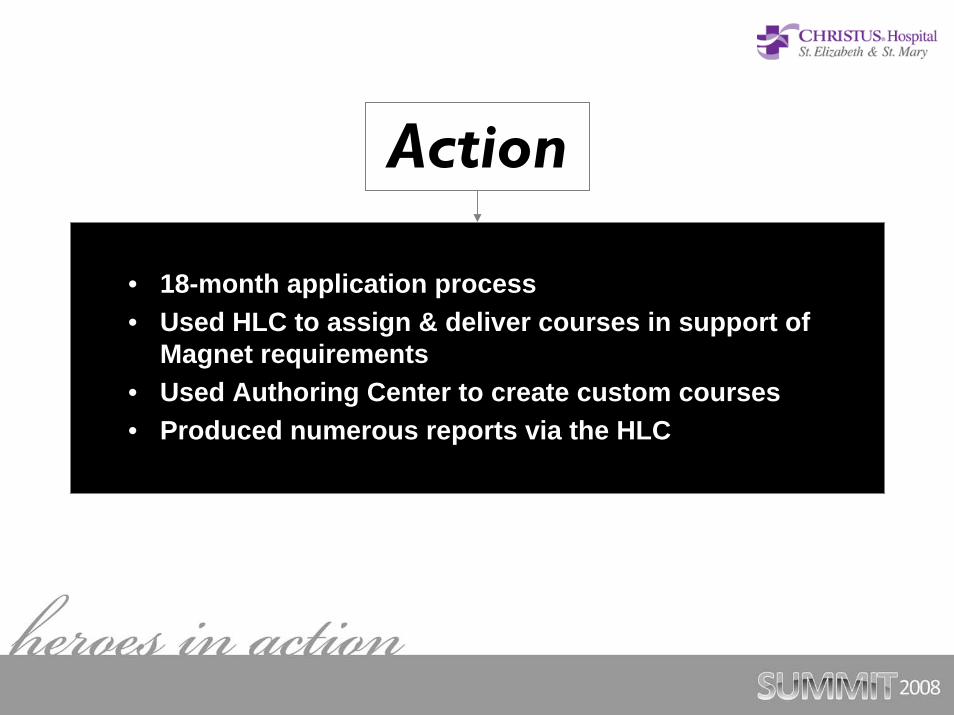
Action
• 18-month application process• Used HLC to assign & deliver courses in support of
Magnet requirements• Used Authoring Center to create custom courses• Produced numerous reports via the HLC
Results
• Achieved Magnet Status in June 2007 • Nursing staff completed over 100,000 education courses• Produced hundreds of required reports
To decrease unexpected events in the med-surg units, recognize signs of patient decline, and initiate calls to their
Rapid Response Team.
Goal
45 RNs completed an online scenario-based course, “Rapid Response in Medical-Surgical Units.”
Action
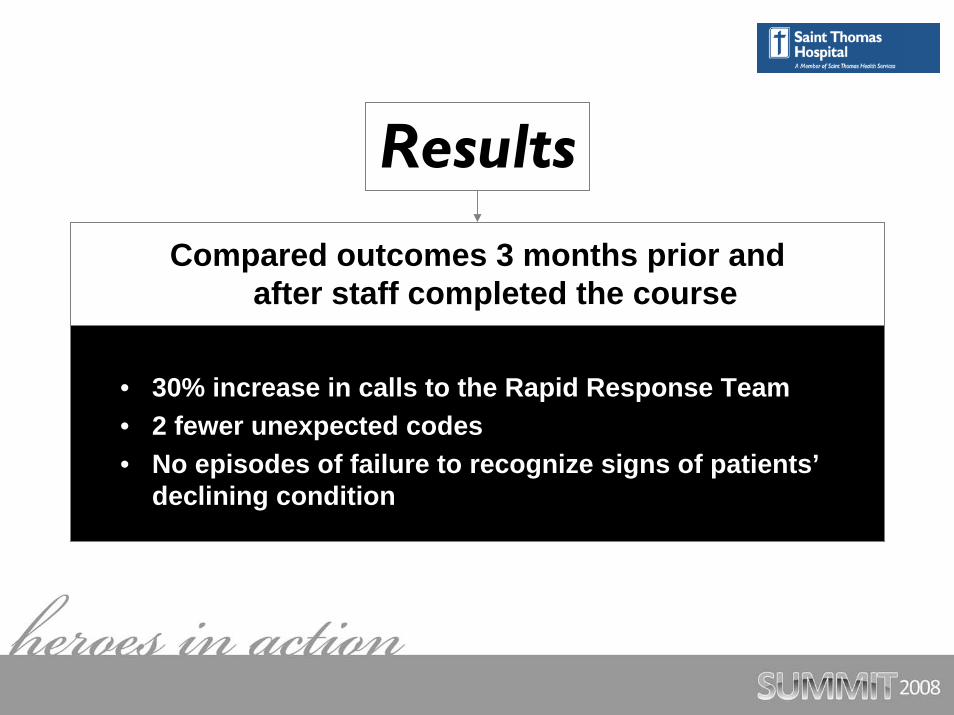
Compared outcomes 3 months prior and after staff completed the course
• 30% increase in calls to the Rapid Response Team• 2 fewer unexpected codes• No episodes of failure to recognize signs of patients’
declining condition
Results

U.S. Demographics & Trends

PopulationU.S. Population Trends and Projections by Age, 1980-2050
85+ Years
65-84 Years
20-64 Years
0-19 Years50
100
150
200
250
300
350
400
450
500
1980 1990 2000 2010 2020 2030 2040 2050
Mill
ions
Source: American Hospital Association 2008
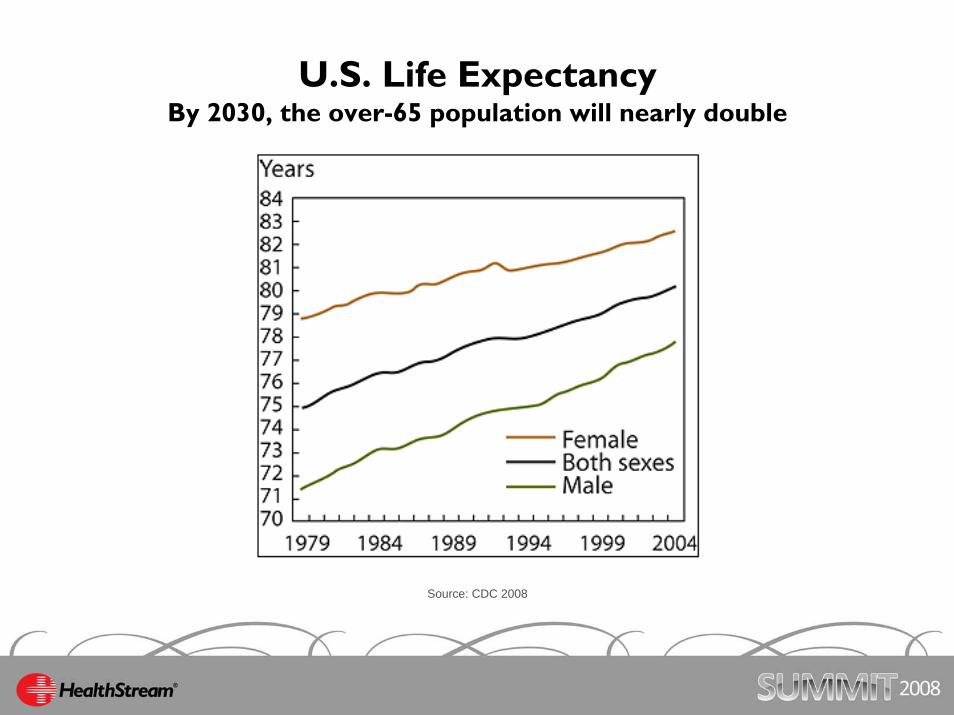
U.S. Life ExpectancyBy 2030, the over-65 population will nearly double
Source: CDC 2008
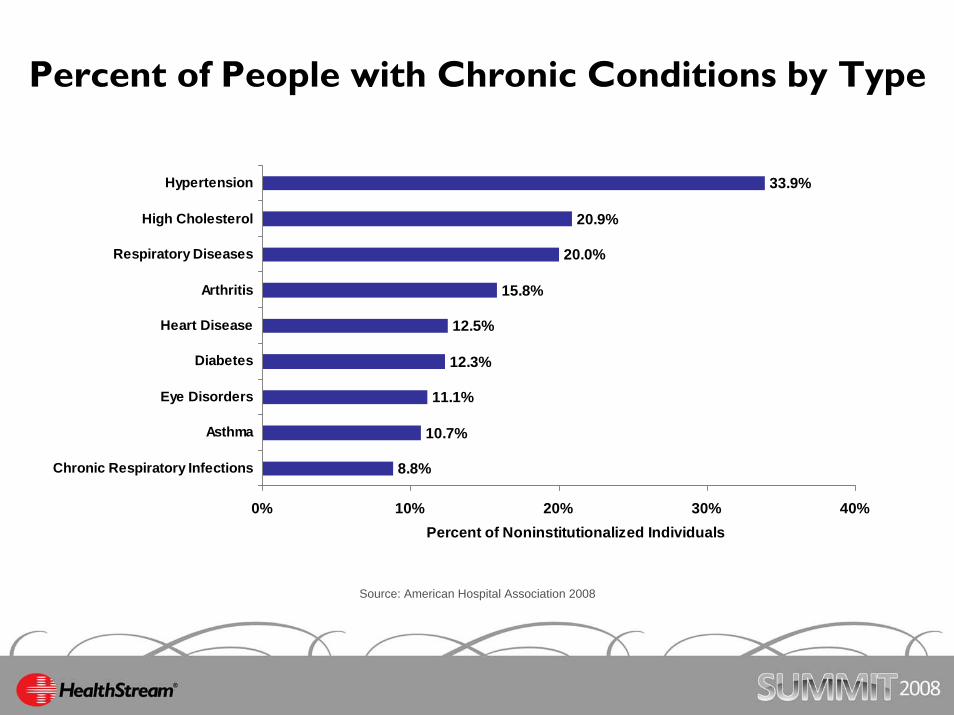
Percent of People with Chronic Conditions by Type
8.8%
10.7%
11.1%
12.3%
15.8%
20.0%
20.9%
33.9%
12.5%
0% 10% 20% 30% 40%
Chronic Respiratory Infections
Asthma
Eye Disorders
Diabetes
Heart Disease
Arthritis
Respiratory Diseases
High Cholesterol
Hypertension
Percent of Noninstitutionalized Individuals
Source: American Hospital Association 2008
Healthcare Industry Trends
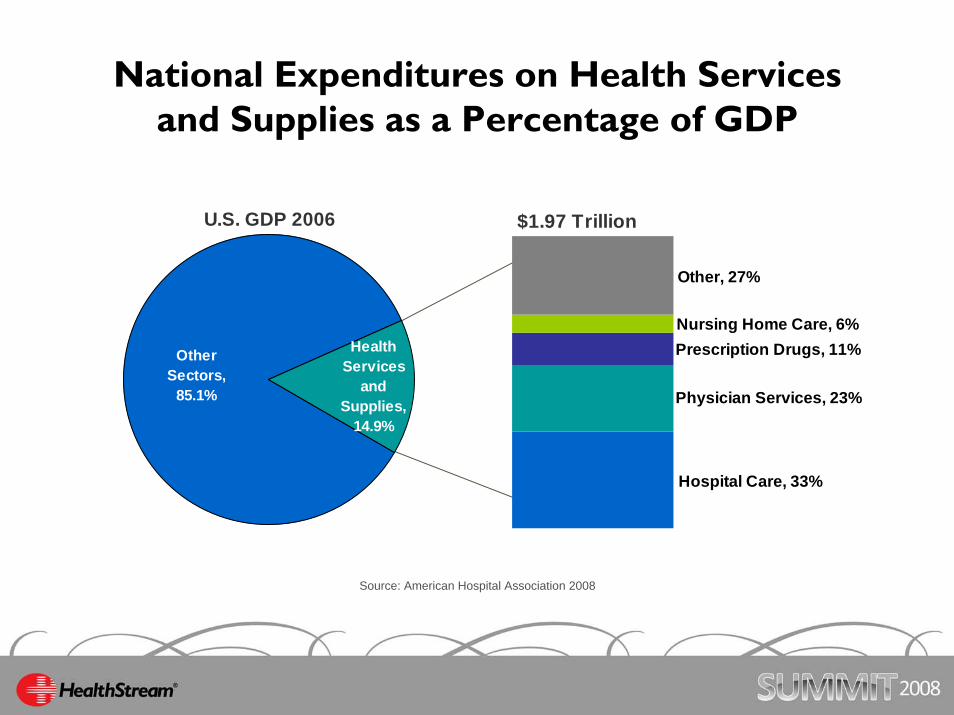
National Expenditures on Health Services and Supplies as a Percentage of GDP
U.S. GDP 2006
Health Services
and Supplies,
14.9%
Other Sectors,
85.1%
$1.97 Trillion
Hospital Care, 33%
Physician Services, 23%
Prescription Drugs, 11%Nursing Home Care, 6%
Other, 27%
Source: American Hospital Association 2008
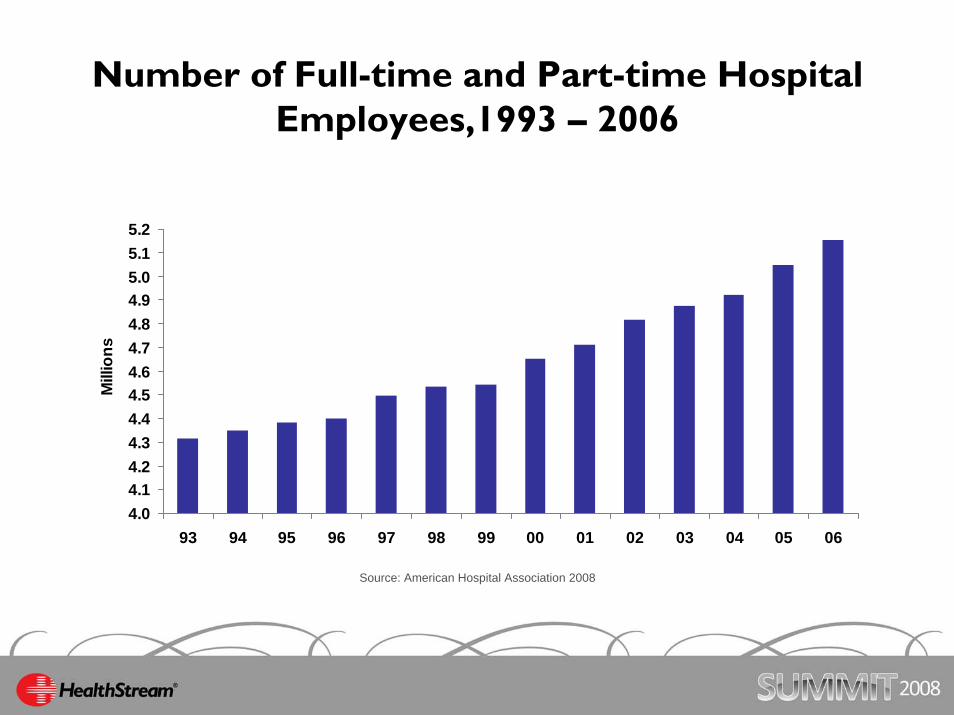
Number of Full-time and Part-time Hospital Employees,1993 – 2006
4.04.14.24.34.44.54.64.74.84.95.05.15.2
93 94 95 96 97 98 99 00 01 02 03 04 05 06
Mill
ions
Source: American Hospital Association 2008
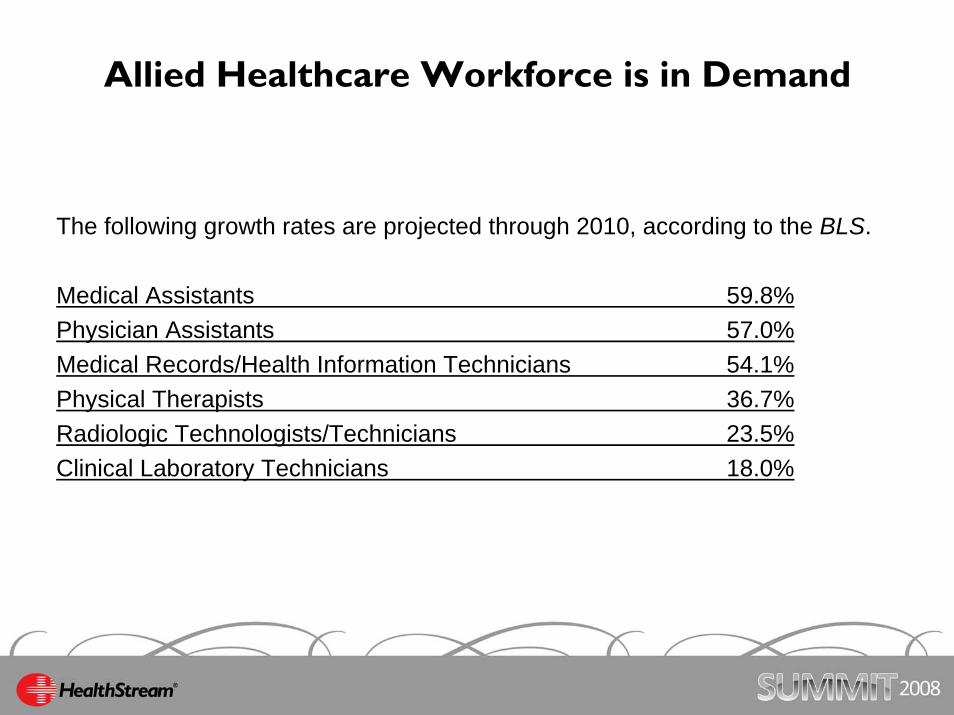
Allied Healthcare Workforce is in Demand
The following growth rates are projected through 2010, according to the BLS.
Medical Assistants 59.8%Physician Assistants 57.0%Medical Records/Health Information Technicians 54.1%Physical Therapists 36.7%Radiologic Technologists/Technicians 23.5%Clinical Laboratory Technicians 18.0%
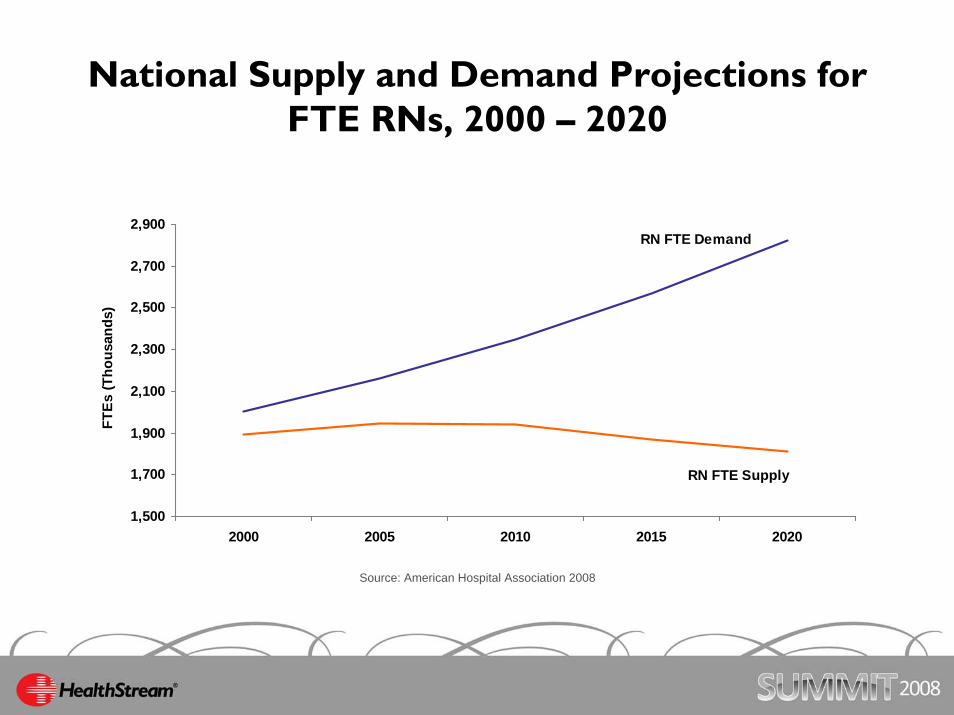
National Supply and Demand Projections for FTE RNs, 2000 – 2020
RN FTE Supply
RN FTE Demand
1,500
1,700
1,900
2,100
2,300
2,500
2,700
2,900
2000 2005 2010 2015 2020
FTE
s (T
hous
ands
)
Source: American Hospital Association 2008
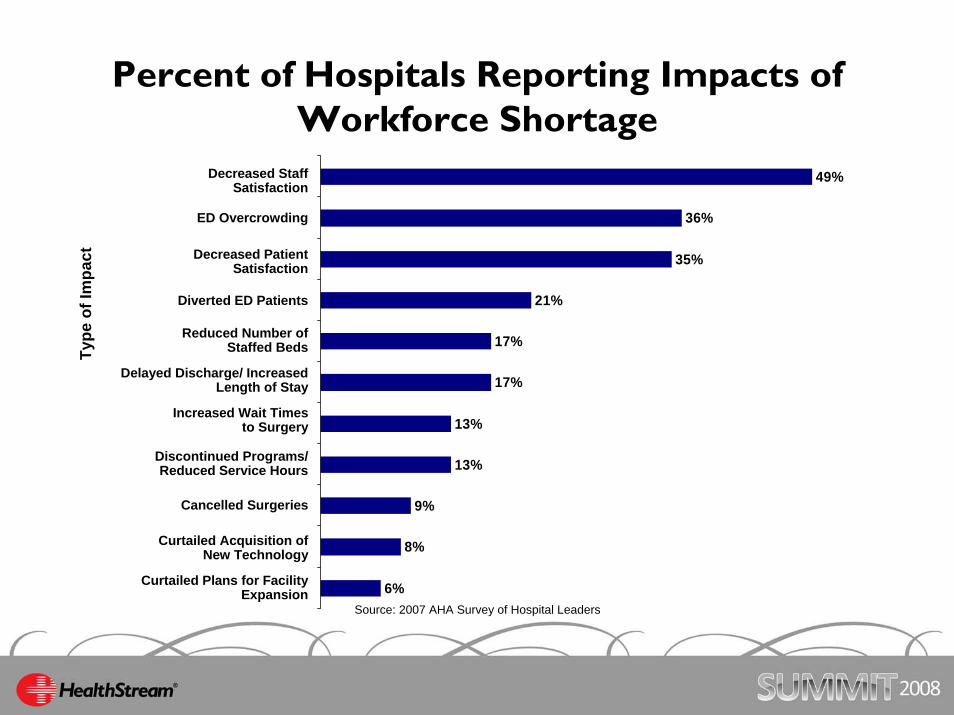
Percent of Hospitals Reporting Impacts of Workforce Shortage
6%
8%
9%
13%
13%
17%
17%
21%
35%
36%
49%
ED Overcrowding
Diverted ED Patients
Reduced Number of Staffed Beds
Increased Wait Times to Surgery
Discontinued Programs/ Reduced Service Hours
Delayed Discharge/ Increased Length of Stay
Cancelled Surgeries
Curtailed Acquisition of New Technology
Curtailed Plans for Facility Expansion
Source: 2007 AHA Survey of Hospital Leaders
Decreased Patient Satisfaction
Decreased Staff Satisfaction
Type
of I
mpa
ct
Pivotal Healthcare Movements
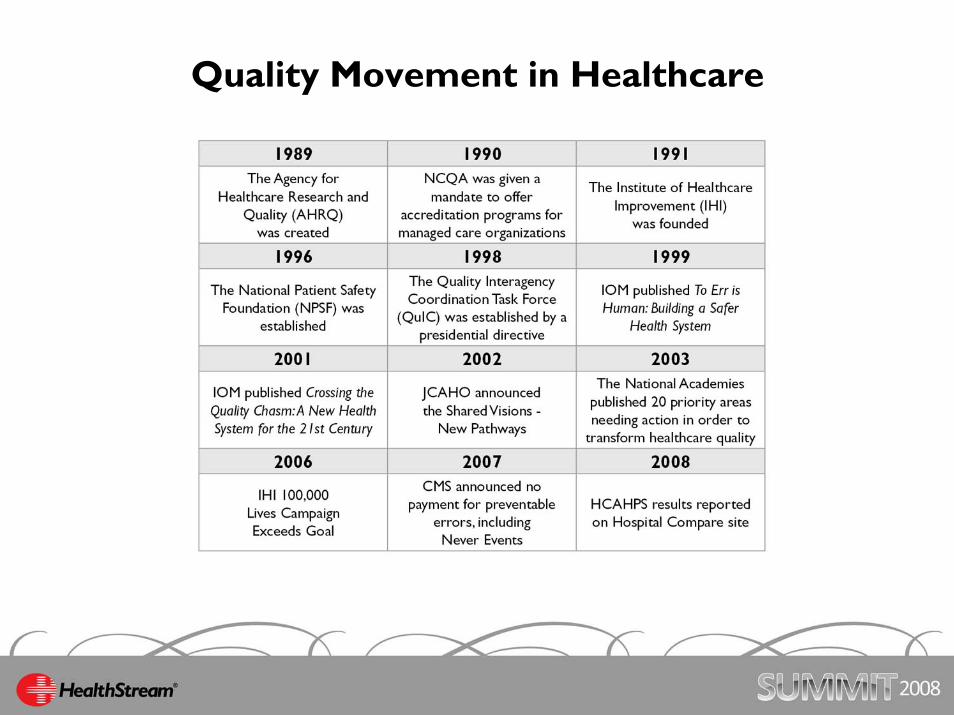
Quality Movement in Healthcare
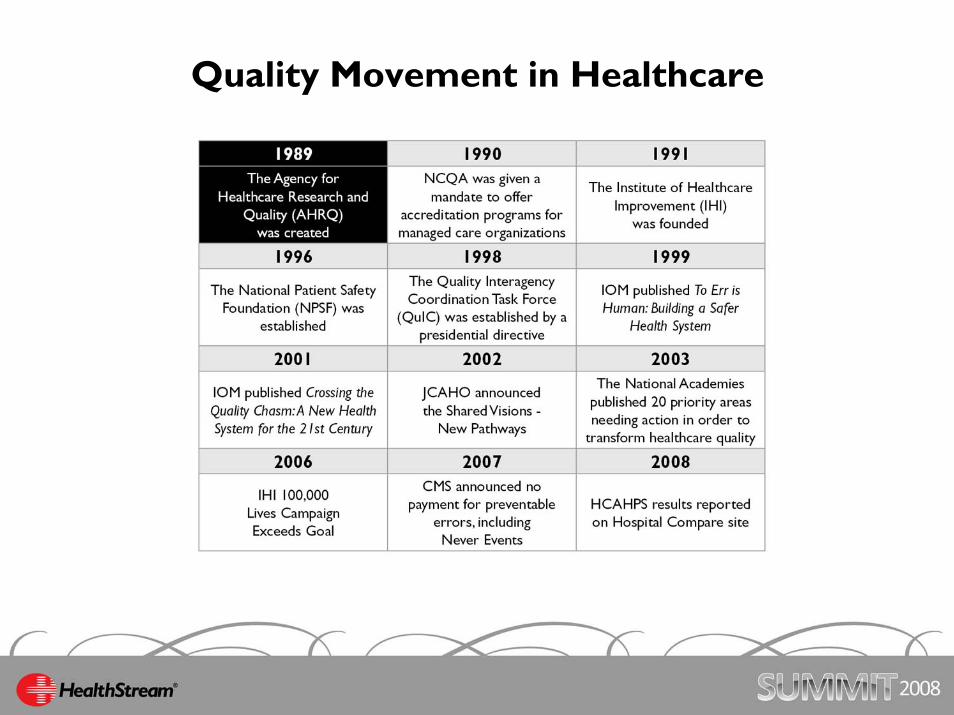
Quality Movement in Healthcare
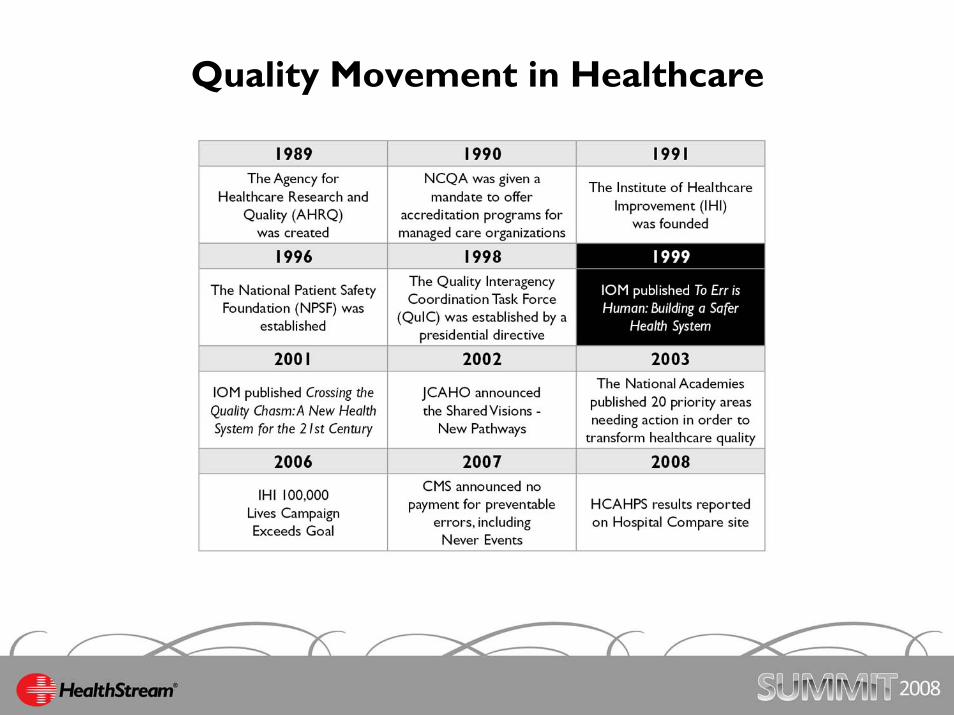
Quality Movement in Healthcare
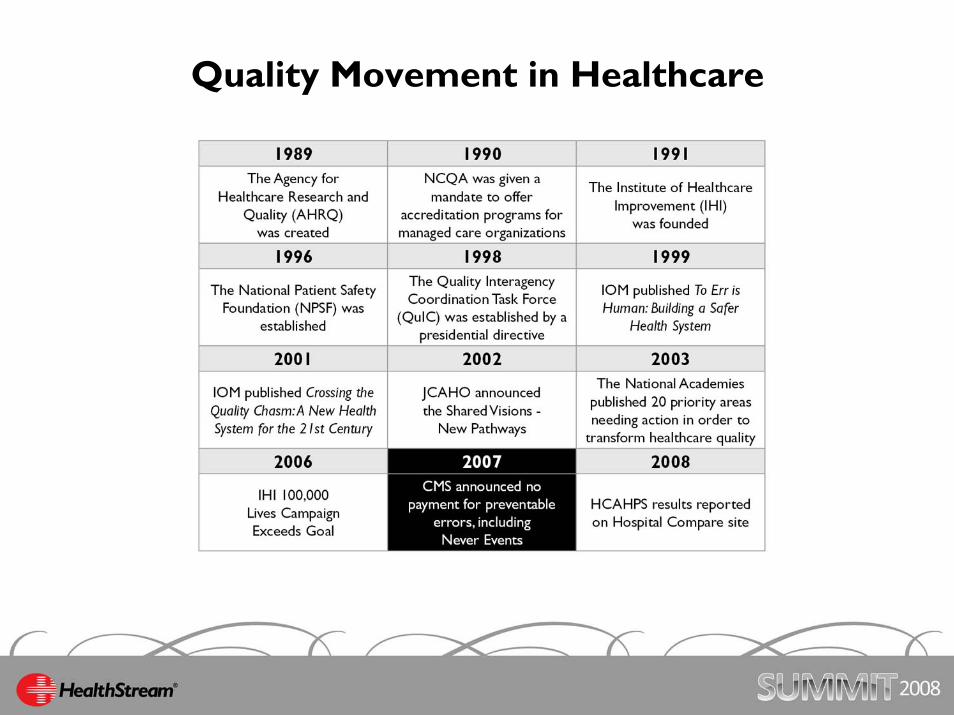
Quality Movement in Healthcare
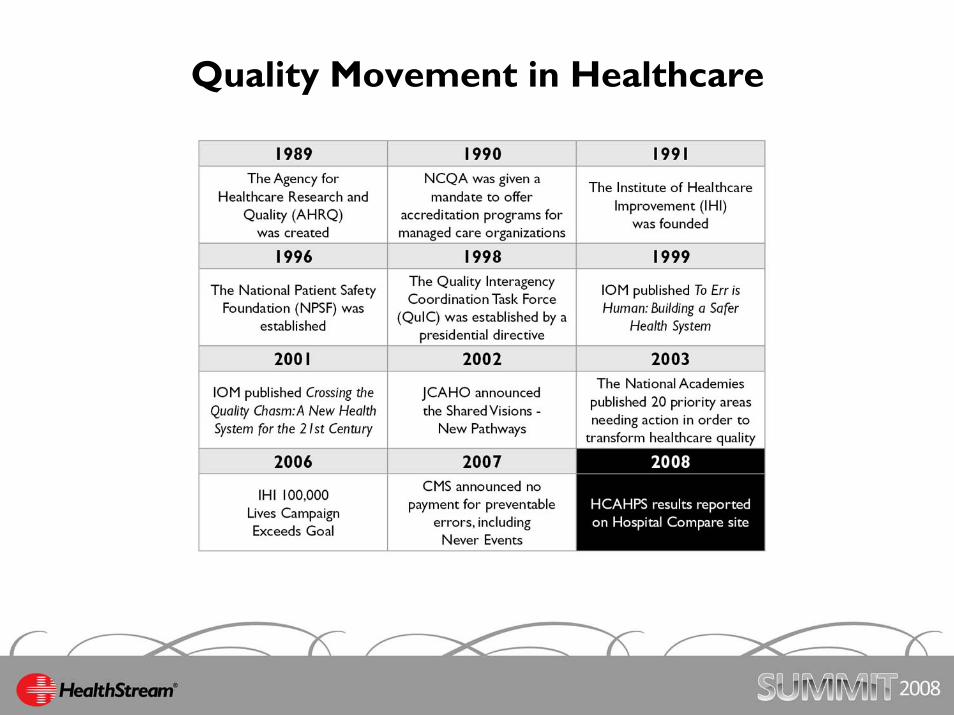
Quality Movement in Healthcare
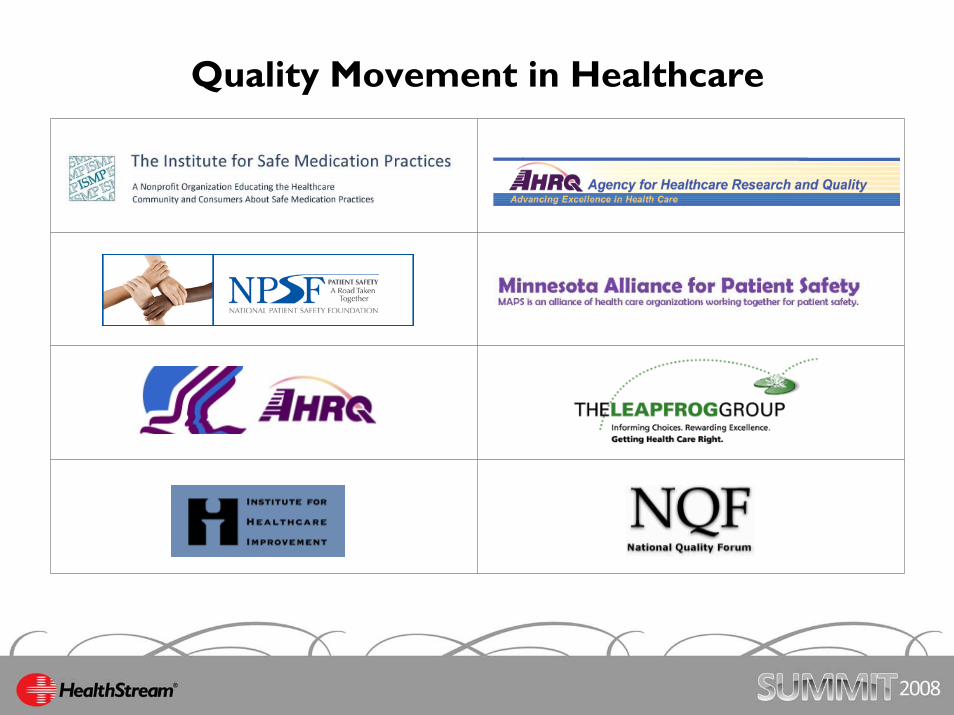
Quality Movement in Healthcare
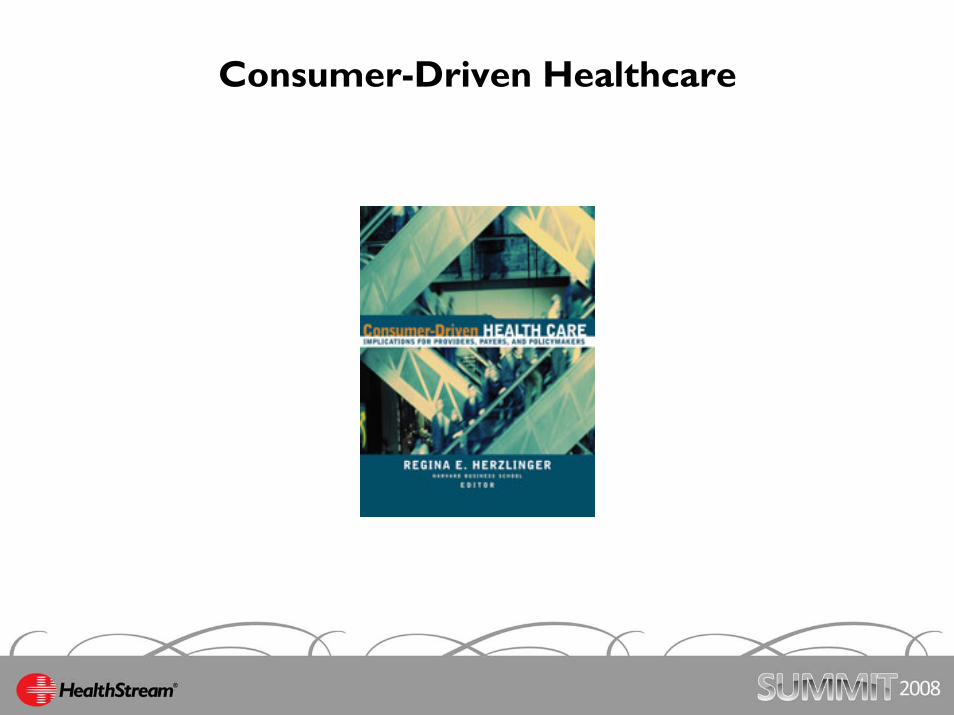
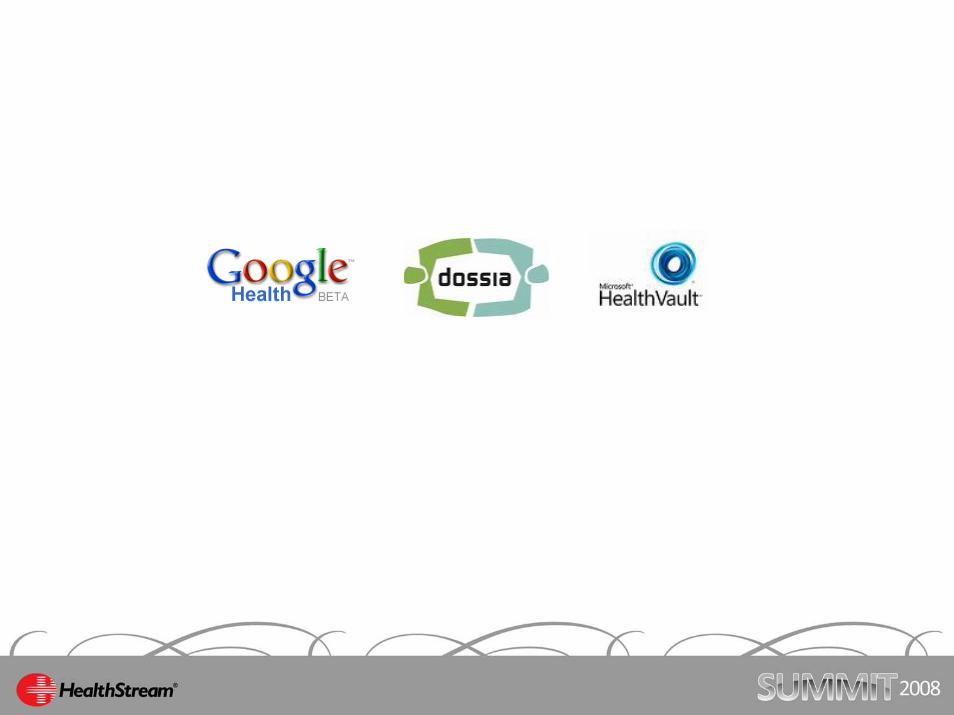
Consumer-Driven Healthcare

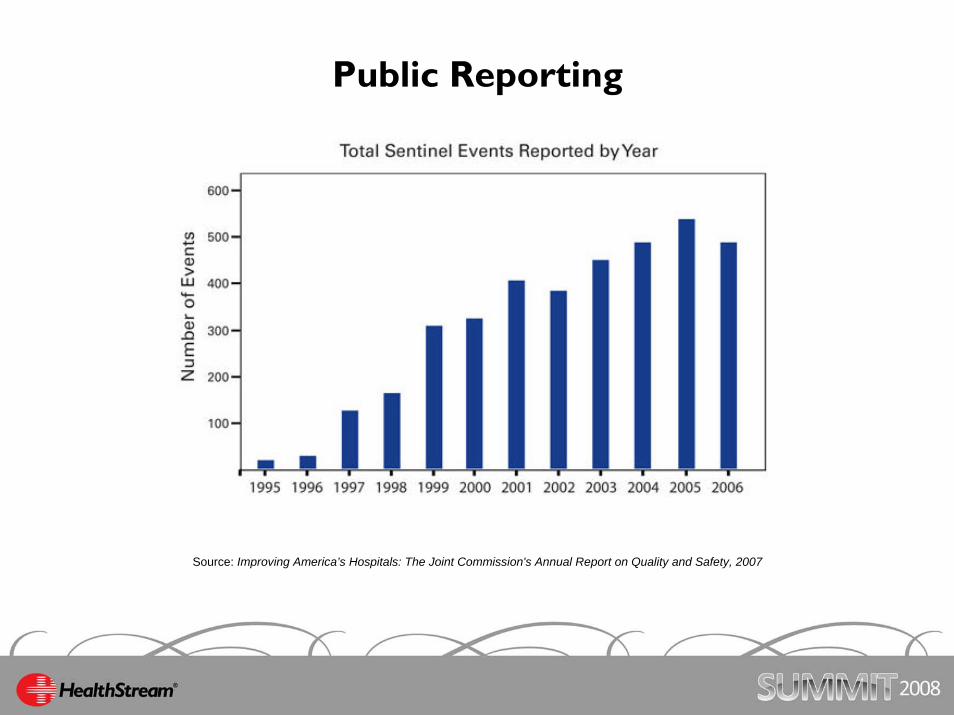
Public Reporting
Source: Improving America’s Hospitals: The Joint Commission's Annual Report on Quality and Safety, 2007


Research and Learning Challenges
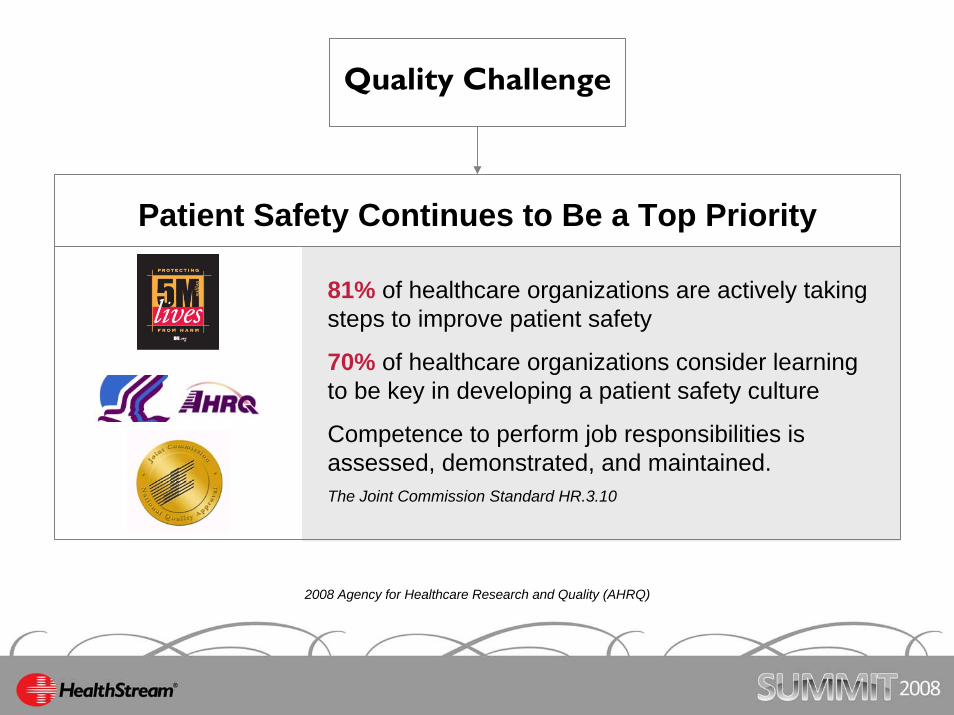
Patient Safety Continues to Be a Top Priority
81% of healthcare organizations are actively taking steps to improve patient safety
70% of healthcare organizations consider learning to be key in developing a patient safety culture
Competence to perform job responsibilities is assessed, demonstrated, and maintained.The Joint Commission Standard HR.3.10
Quality Challenge
2008 Agency for Healthcare Research and Quality (AHRQ)
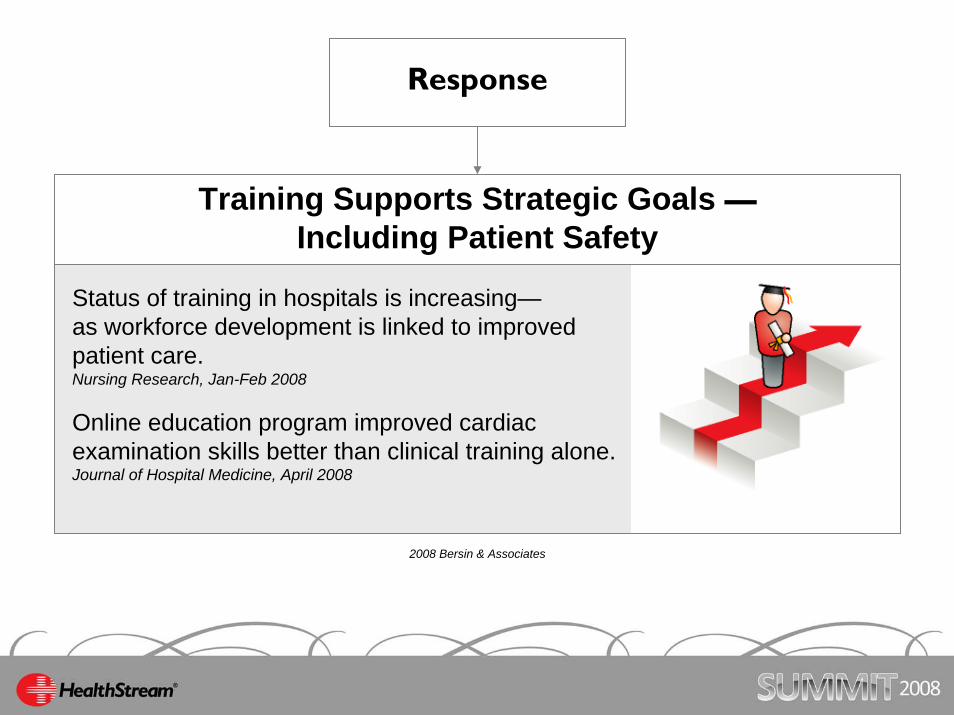
Training Supports Strategic Goals —Including Patient Safety
Status of training in hospitals is increasing—as workforce development is linked to improved patient care.Nursing Research, Jan-Feb 2008
Online education program improved cardiac examination skills better than clinical training alone.Journal of Hospital Medicine, April 2008
Response
2008 Bersin & Associates
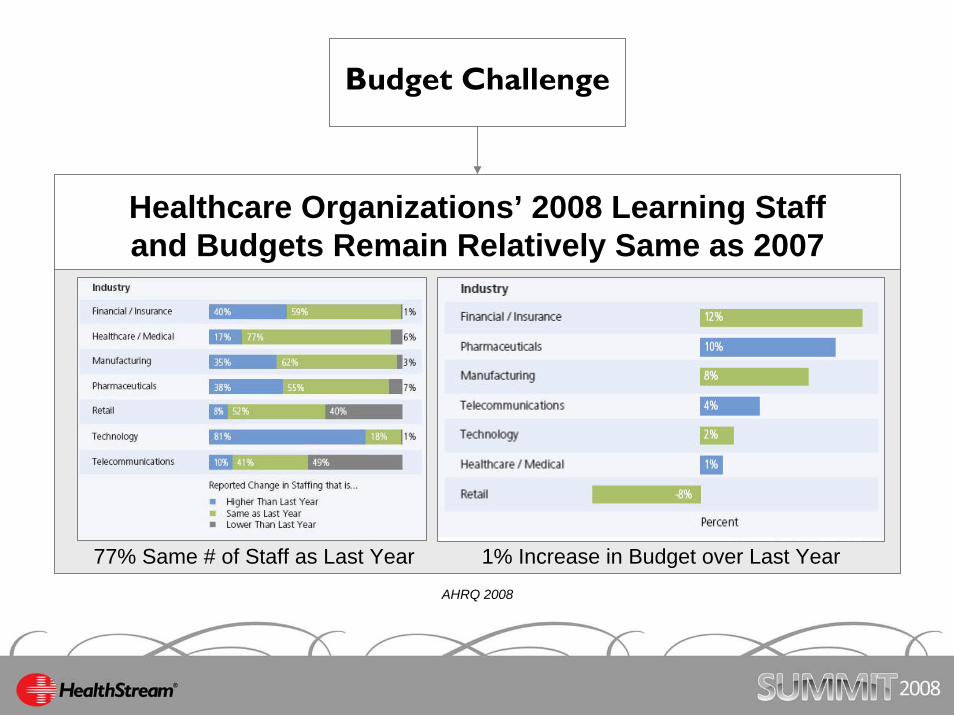
Budget Challenge
Healthcare Organizations’ 2008 Learning Staff and Budgets Remain Relatively Same as 2007
77% Same # of Staff as Last Year 1% Increase in Budget over Last YearAHRQ 2008
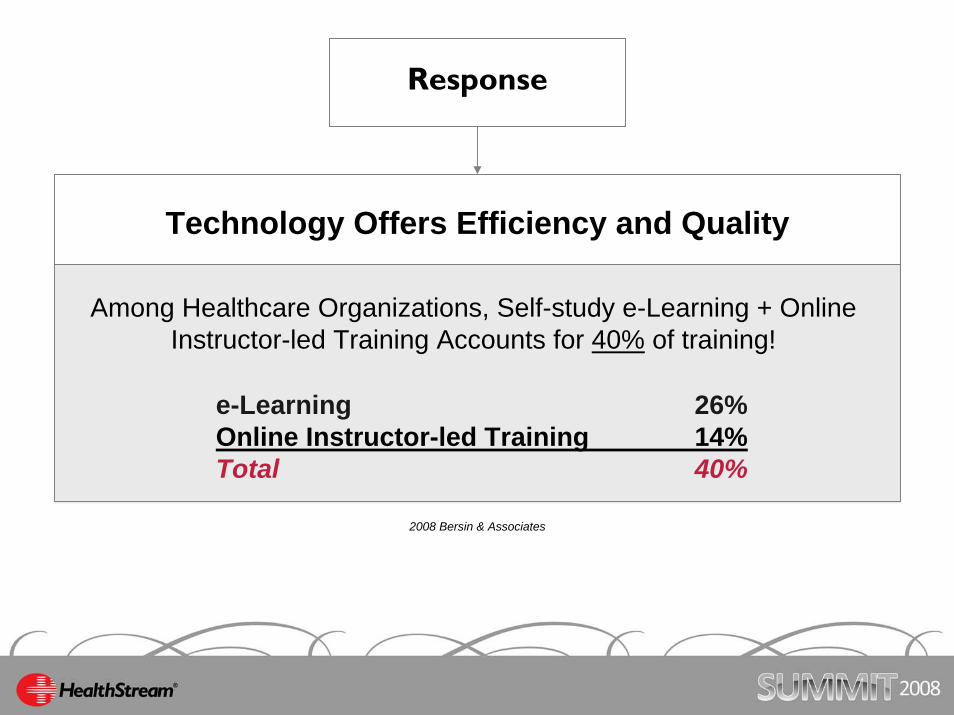
Technology Offers Efficiency and Quality
Among Healthcare Organizations, Self-study e-Learning + Online Instructor-led Training Accounts for 40% of training!
e-Learning 26%Online Instructor-led Training 14%Total 40%
Response
2008 Bersin & Associates
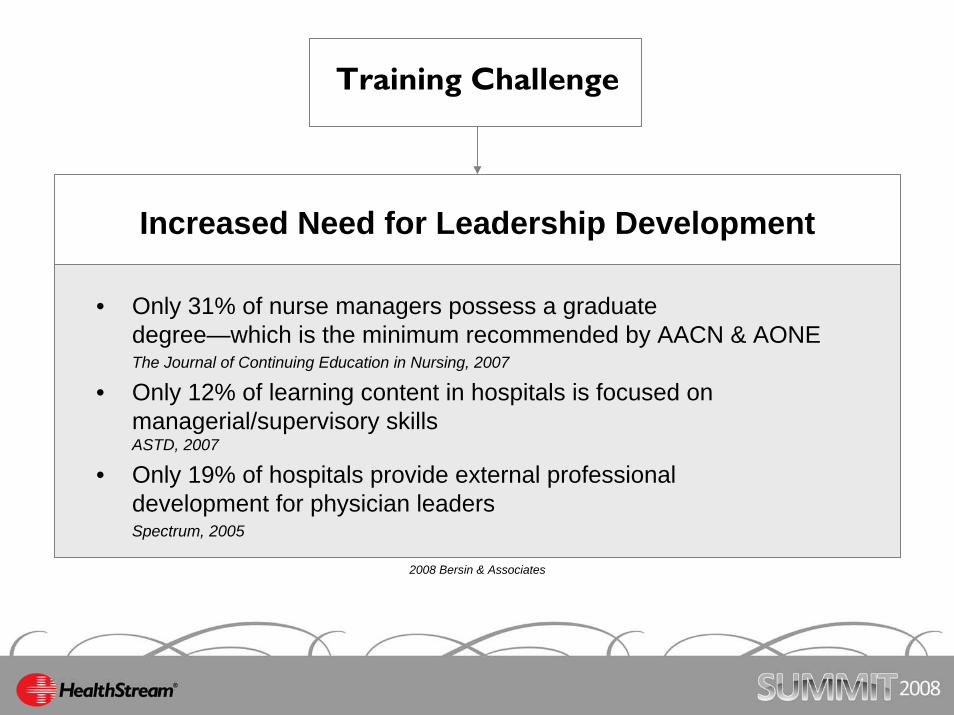
Training Challenge
Increased Need for Leadership Development
• Only 31% of nurse managers possess a graduate degree—which is the minimum recommended by AACN & AONE The Journal of Continuing Education in Nursing, 2007
• Only 12% of learning content in hospitals is focused on managerial/supervisory skillsASTD, 2007
• Only 19% of hospitals provide external professional development for physician leaders Spectrum, 2005
2008 Bersin & Associates
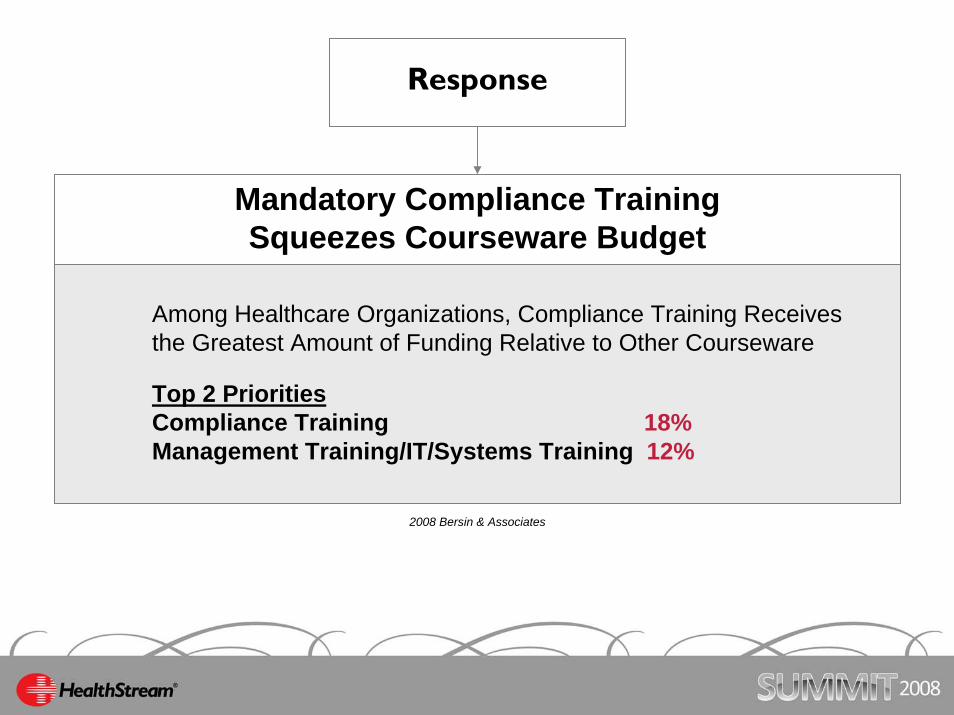
Mandatory Compliance TrainingSqueezes Courseware Budget
Top 2 Priorities Compliance Training 18%Management Training/IT/Systems Training 12%
Response
Among Healthcare Organizations, Compliance Training Receives the Greatest Amount of Funding Relative to Other Courseware
2008 Bersin & Associates
Measurement Challenge
Need for Continuous Data Collection
“… Healthcare organizations are being challenged to meet the data demands of a growing number of mandatory and voluntary measurement projects. For healthcare organizations, the “measurement monster” may seem impossible to tame.”Frontiers in Health Services Management, 2007
Response
Surge in Technology Utilization
“Full implementation of networked e-health records (EHR) in U.S. doctors’offices and hospitals could cost around $150 billion over eight years”Robert Miller, PhDUniversity of California, San FranciscoJuly, 2008
“52% of respondents to the HIMSS Annual Leadership Survey cited error reduction and safety as key drivers in technology adoption”HIMSS, 2007
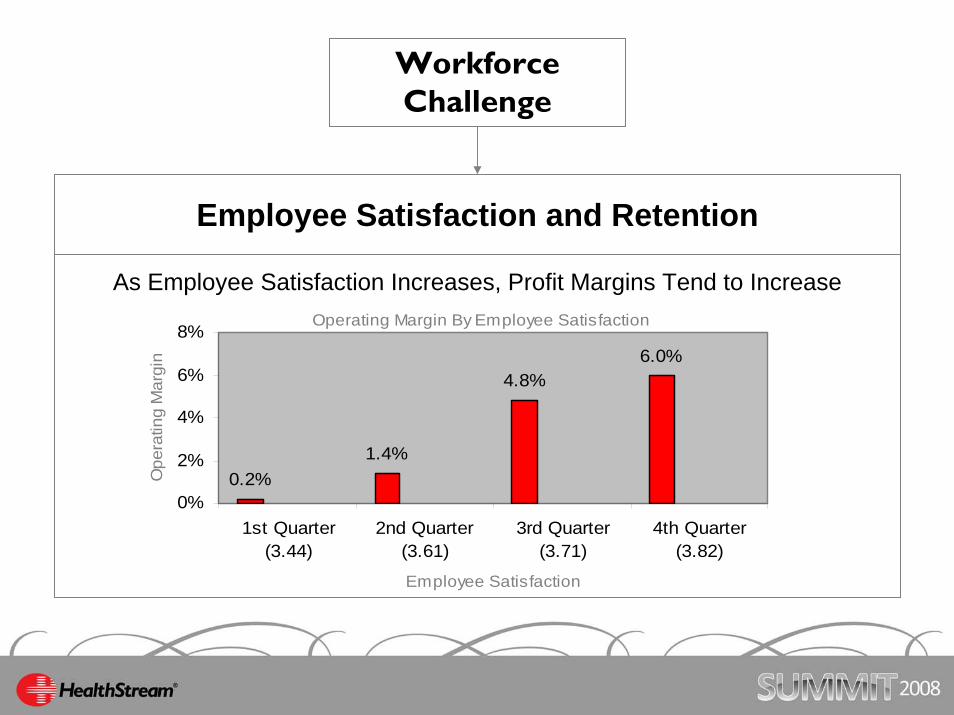
Operating Margin By Employee Satisfaction
0.2%1.4%
4.8%6.0%
0%
2%
4%
6%
8%
1st Quarter(3.44)
2nd Quarter(3.61)
3rd Quarter(3.71)
4th Quarter(3.82)
Employee Satisfaction
Ope
ratin
g M
argi
n
Employee Satisfaction and Retention
Workforce Challenge
As Employee Satisfaction Increases, Profit Margins Tend to Increase
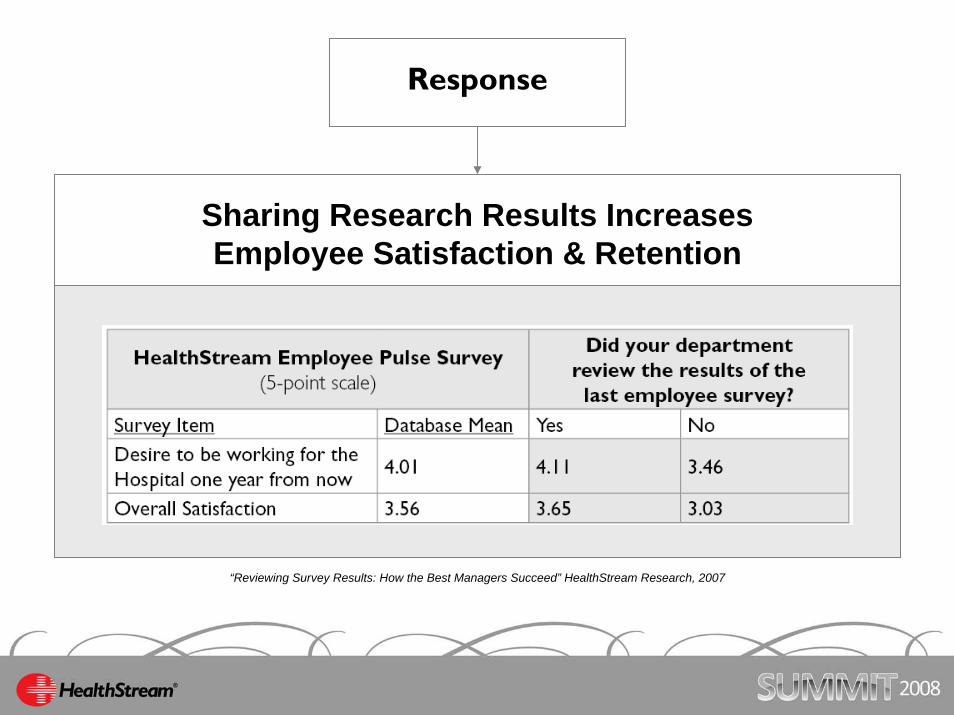
Response
Sharing Research Results Increases Employee Satisfaction & Retention
“Reviewing Survey Results: How the Best Managers Succeed” HealthStream Research, 2007
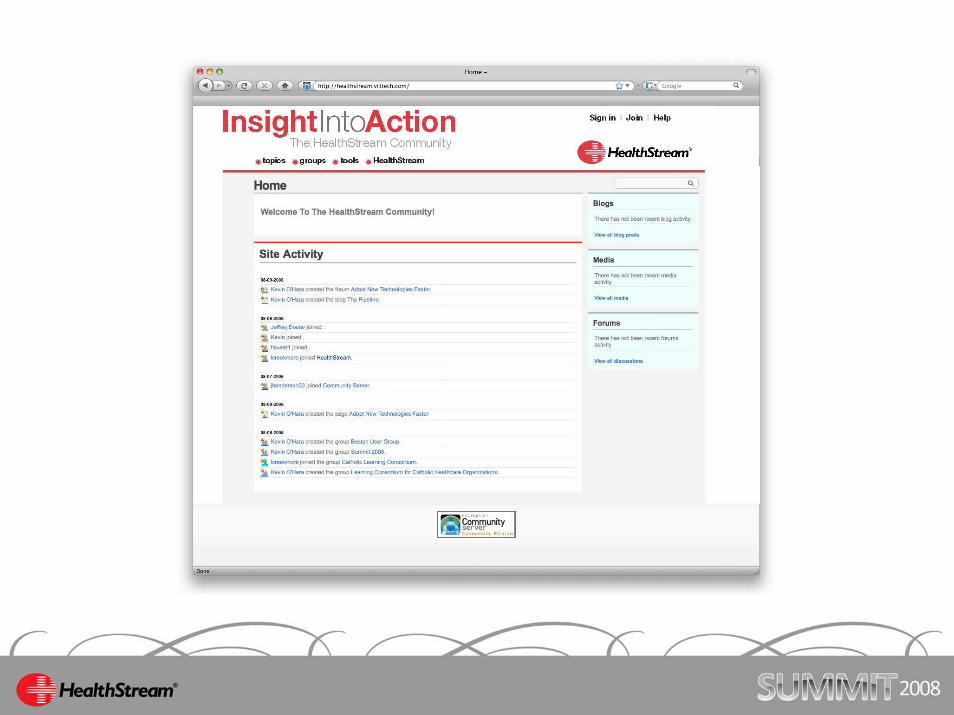
HealthStream LaunchesCommunity Site
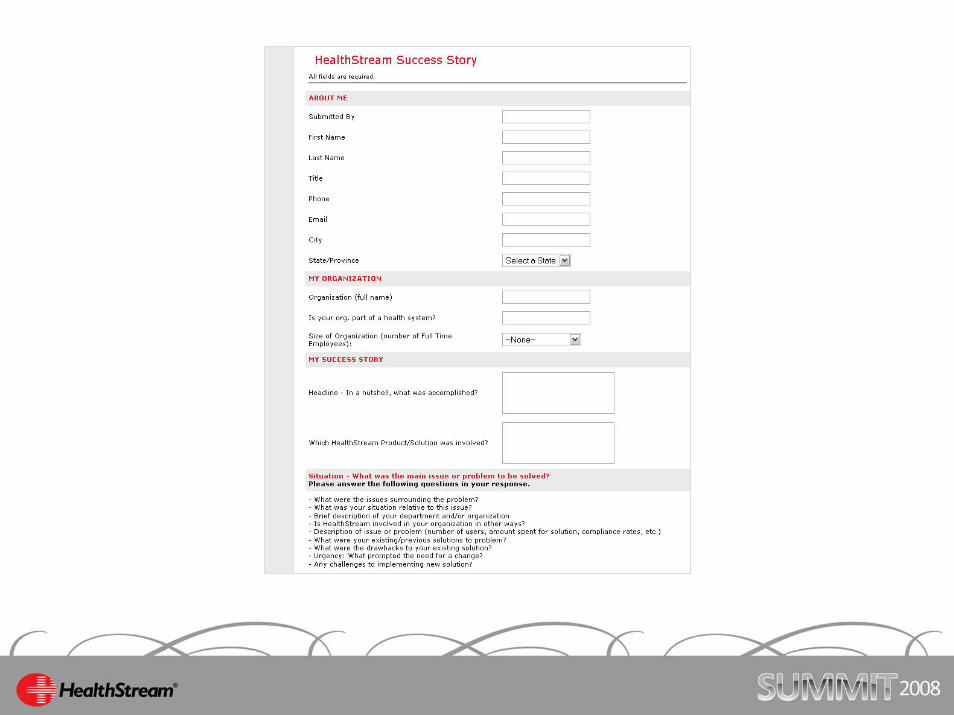
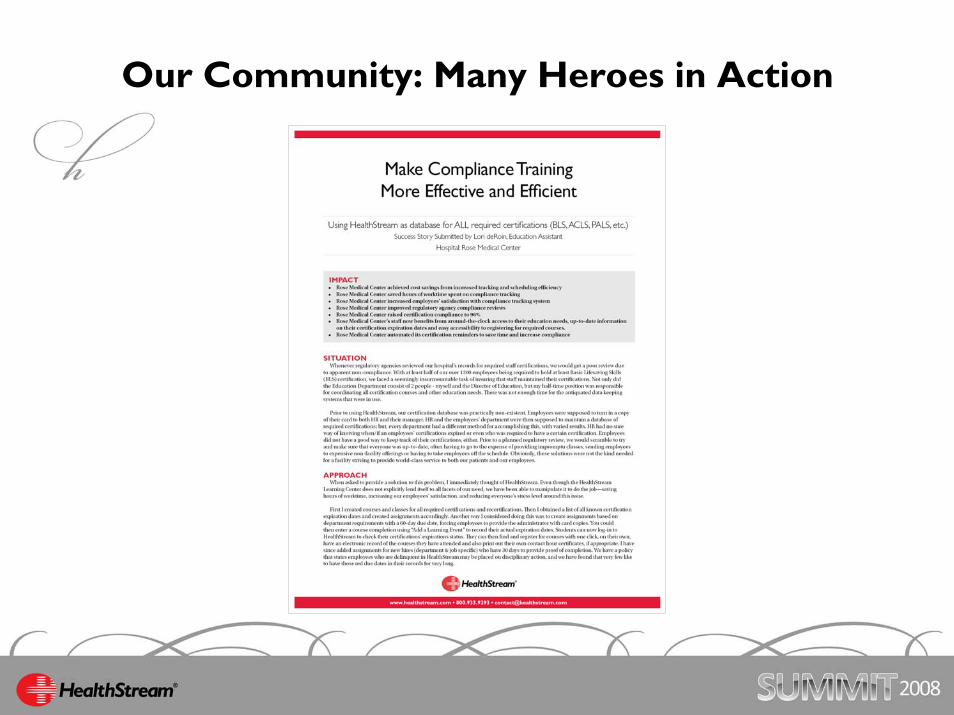
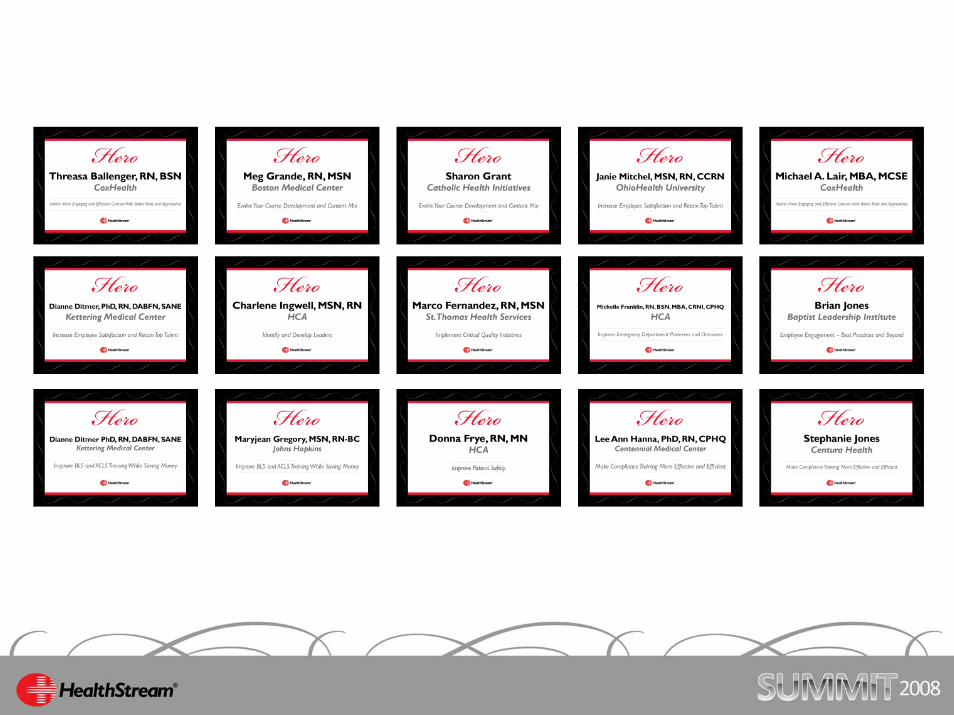
Our Community: Many Heroes in Action
Contribute to the HealthStream community by sharing your success story at
www.healthstream.com/mysuccess


