35
Australian Institute of Health and Welfare Canberra Cat. no. ACM 16 Burden of disease due to asthma in Australia 2003 September 2009

Australian Institute of Health and Welfare Canberra
Cat. no. ACM 16
Burden of disease due to asthma in Australia 2003
September 2009

© Australian Institute of Health and Welfare 2009 This work is copyright. Apart from any use as permitted under the Copyright Act 1968, no part may be reproduced without prior written permission from the Australian Institute of Health and Welfare. Requests and enquiries concerning reproduction and rights should be directed to the Head, Media and Communications Unit, Australian Institute of Health and Welfare, GPO Box 570, Canberra ACT 2601. This publication is part of the Australian Institute of Health and Welfare’s asthma series. A complete list of the Institute’s publications is available from the Institute’s website <www.aihw.gov.au>. ISSN 1448-7594 ISBN 978 1 74024 943 0
Suggested citation
Australian Institute of Health and Welfare: Australian Centre for Asthma Monitoring 2009. Burden of disease due to asthma in Australia 2003. Cat. no. ACM 16. Canberra: AIHW.
Australian Institute of Health and Welfare
Board Chair Hon. Peter Collins, AM, QC Director Penny Allbon Any enquiries about or comments on this publication should be directed to: Australian Centre for Asthma Monitoring PO Box M77 Missenden Road NSW 2050 Phone: (02) 9114 0467 Email: [email protected] Published by the Australian Institute of Health and Welfare Printed by Union Offset Printers
The Australian Institute of Health and Welfare is Australia’s national health and welfare statistics and information agency. The Institute’s mission is
better information and statistics for better health and wellbeing.
Please note that there is the potential for minor revisions of data in this report. Please check the online version at <www.aihw.gov.au> for any amendments.

iii
Contents Acknowledgments.............................................................................................................................. iv Summary ............................................................................................................................................... v 1 Introduction....................................................................................................................................1 2 Methods and data sources ...........................................................................................................2
2.1 Quantifying the total burden of disease: disability-adjusted life years (DALYs)..........2 2.2 Non-fatal burden: years lived with disability (YLD) .........................................................3 2.3 Fatal burden: years of life lost due to premature death (YLL) .........................................6 2.4 Estimates of the burden of disease among Aboriginal and Torres Strait Islander
Australians ...............................................................................................................................7 3 Results .............................................................................................................................................8
3.1 Leading causes of disease burden in Australia...................................................................8 3.2 Disease burden due to asthma in Australia ........................................................................9
3.2.1 Comparison of the burden of asthma with other conditions.................................9 3.2.2 Age and sex distribution of the burden of asthma................................................11
3.3 The burden of asthma in Aboriginal and Torres Strait Islander Australians...............15 3.3.1 Disparities in health between Indigenous Australians and the total Australian
population—the Indigenous health gap .................................................................15 3.3.2 Leading causes of disease burden in Aboriginal and Torres Strait Islander
Australians ..................................................................................................................15 3.3.3 Comparison of the burden of asthma with other conditions...............................16 3.3.4 Age and sex distribution of the burden of asthma in Aboriginal and Torres
Strait Islander Australians ........................................................................................18 3.4 Projections of the future burden of asthma.......................................................................20
4 Discussion ....................................................................................................................................21 4.1 Burden of asthma worldwide and in Australia ................................................................21 4.2 Evaluation of the estimates..................................................................................................21
4.2.1 Estimation of incident YLD.......................................................................................21 4.2.2 Counting cases of asthma..........................................................................................22 4.2.3 Indigenous data ..........................................................................................................22 4.2.4 Diagnostic labelling....................................................................................................22 4.2.5 Disability weights.......................................................................................................23 4.2.6 Co-morbid conditions................................................................................................23 4.2.7 What is not measured in burden of disease ...........................................................23
4.3 Conclusions............................................................................................................................24 Glossary................................................................................................................................................25 References............................................................................................................................................26 List of figures and tables...................................................................................................................29

iv
Acknowledgments
The authors of this report were Leanne Poulos and Guy Marks of the Australian Centre for Asthma Monitoring.
The authors would like to acknowledge the helpful comments of Professor Theo Vos from the Centre for Burden of Disease and Cost-Effectiveness, School of Public Health, University of Queensland.
Further refereeing was by David Muscatello, Kuldeep Bhatia and Adrian Webster.
Valuable guidance was also received from the Steering Committee of the Australian System for Monitoring Asthma (ASMA).
This publication was funded by the Australian Government Department of Health and Ageing through the National Asthma Management Program.

v
Summary Asthma affects people of all ages and is associated with a substantial impact on both the individual and on the community. Most of the impact of asthma is on physical functioning and on the ability to perform social roles. This report provides information on the burden of asthma in Australia by summarising the asthma-related findings of two reports: The burden of disease and injury in Australia 2003 and The burden of disease and injury in Aboriginal and Torres Strait Islander peoples 2003.
How is burden of disease measured? While there are several ways to estimate the burden of disease, we report here on an approach adopted by the World Health Organization and many individual nations, including Australia. Disability-adjusted life years or ‘DALYs’ have been used in this report to quantify the burden of asthma. The DALY describes the number of years of healthy life lost due to disability or premature death. One DALY represents one lost year of healthy life.
What is the burden of asthma in Australia? In 2003, asthma was the eleventh-leading contributor to the overall burden of disease in Australia, accounting for 2.4% of the total number of DALYs. In that year, 63,100 years of healthy life were lost due to asthma—59,054 of these due to years lived with disability and 4,045 due to premature death.
This report highlights the relative importance of long-term disability among children as a contributor to the burden of asthma in Australia. Among children, asthma represented the leading cause of burden of disease in 2003, contributing 17.4% of total DALYs.
It is predicted that asthma will continue to rank as one of the major causes of disease burden in Australia for the next 2 decades, particularly among females.
Chronic respiratory disease, which includes asthma, was the fourth-leading contributor to the Indigenous health gap in the burden of non-communicable conditions. It accounted for 9% of the gap, behind cardiovascular disease (23%), diabetes (12%) and mental disorders (12%).
How can we use this information? Quantifying the impact of asthma in terms of its burden, measured as DALYs, allows relative valuation of the impact of this disease—both overall and in subgroups of society—relative to other diseases. This has important consequences for health decision-making and planning processes. This report provides an indication of opportunities for health gain and will help guide the formation of health policy in relation to asthma. For example, interventions to reduce the Indigenous health gap in chronic respiratory disease burden and to improve the uptake of the key elements of effective asthma management—namely, a written asthma action plan and regular use of medications that control the disease and prevent exacerbations—represent two strategies likely to lead to reduced burden of disease attributable to asthma.

vi

1
1 Introduction
Asthma is a significant health problem in Australia, affecting 10% of the population (ACAM 2008). By international standards, the prevalence of asthma in Australia is high.
Asthma affects people of all ages and is associated with a substantial impact on the community. In 2006–07, 36,588 Australians were hospitalised due to asthma and 402 people died due to the condition in 2006 (ACAM 2008). Asthma is associated with poorer quality of life and people with asthma rate their health worse than people without the condition. Most of the impact of asthma is on physical functioning and on the ability to perform social roles.
There is currently no cure for asthma, although the condition can be effectively managed. Key elements in the effective management of asthma include a written asthma action plan and regular use of medications that control the disease and prevent exacerbations. However, evidence suggests that the uptake of these strategies has not been optimal among people who could benefit greatly in terms of reducing the impact of asthma on both themselves and the community. In 2004–05, less than one-quarter of people with asthma in Australia reported possessing a written asthma action plan (ACAM 2008) and only 18.5% of people with asthma aged 5 years or over reported using inhaled corticosteroids in the last 2 weeks (ACAM 2007).
This report aims to provide information on the burden of asthma in Australia by summarising the asthma-related findings of the Burden of Disease and Injury in Australia 2003 study (Begg et al. 2007) and the Burden of Disease and Injury in Aboriginal and Torres Strait Islander Peoples 2003 study (Vos et al. 2007). Using the ‘burden of disease’ approach, the impact of disease is quantified in terms of its fatal burden (‘years of life lost’) and also its impact on functional capacity (‘years lived with disability’). The combined effect of the fatal and non-fatal impacts is quantified as disability-adjusted life years (DALYs). One DALY represents 1 year of lost ‘good health’. The DALY is one measure for capturing the health burden of specific diseases by quantifying the impact of the condition on time lived in states of less than ideal ‘good health’ (Mathers et al. 1999).
The health burden attributable to asthma is at least partially remediable by improvements in disease management. Therefore, the information contained in this report gives an indication of opportunities for health gain and will help guide the formation of health policy in relation to asthma.

2
2 Methods and data sources
Burden of disease data used in this report were obtained from two studies—the Burden of Disease and Injury in Australia 2003 study (Begg et al. 2007) and the Burden of Disease and Injury in Aboriginal and Torres Strait Islander Peoples 2003 study (Vos et al. 2007). Both of these studies reported disability-adjusted life years (DALYs) to measure the total burden of disease and injury for over 170 conditions.
The Burden of Disease and Injury in Australia 2003 study (Begg et al. 2007) was conducted as a collaboration between the University of Queensland and the Australian Institute of Health and Welfare (AIHW). The 2003 study, on which this report is based, represents the second study of its kind to be conducted in Australia. The original study was performed by the AIHW in 1999 (Mathers et al. 1999) and provided information about the burden of disease for 1996. Unfortunately, due to the different methods used to calculate disease burden in 1996 and 2003, it is not possible to compare results from these two studies. However, figures back to 1994 and forecasts to 2033 were estimated in the 2003 study using consistent methods and assumptions and these allow comparisons of burden of disease data over time.
The Burden of Disease and Injury in Aboriginal and Torres Strait Islander Peoples 2003 study (Vos et al. 2007) was conducted by the University of Queensland and is the first study to assess burden of disease in our Indigenous population.
2.1 Quantifying the total burden of disease: disability-adjusted life years (DALYs)
Since life expectancy in many countries is much longer now than it has been in the past, it is becoming less relevant to estimate the burden of disease by investigating mortality rates alone. For this purpose, summary measures of population health—such as those which combine information about both fatal and non-fatal health outcomes into a single index—are more useful than measures of specific outcomes. The DALY is one such summary measure of population health. The DALY describes the number of years of healthy life lost due to disability coupled with those lost due to premature death. One DALY represents one lost year of healthy life.
The DALY provides a common currency by which many different diseases, injuries and risk factors can be compared. For example, it enables us to compare and contrast conditions that cause few deaths but cause much disability and illness with those that cause many premature deaths. The approach can also be used to relate health expenditure to the burden of disease.
DALYs are calculated by adding future years lived with disability (YLD) for incident (new) cases of the health condition, in the study year, to years of life lost due to premature mortality (YLL).
DALY = YLD + YLL
where: YLD = incidence × duration × disability weight
YLL = number of deaths × standard life expectancy at age of death

3
In the Burden of Disease and Injury in Australia 2003 study, uniform age weights were applied to give equal emphasis to loss of healthy life at any age and DALYs were then discounted using a 3% per annum time discount rate so that earlier gains in health were given a greater value than later gains (Begg et al. 2007). Further descriptions of the components of DALYs, that is, YLD and YLL, are provided in sections 2.2 and 2.3, respectively. Methods used in both studies (Begg et al. 2007; Vos et al. 2007) are similar and comparable, although there are some differences. A summary of these differences is provided in section 2.4.
2.2 Non-fatal burden: years lived with disability (YLD)
Most of the impact of asthma is on physical functioning and on the ability to perform social roles. Therefore, for asthma, the largest component of the DALY is years lived with disability (YLD). In this report, the term ‘disability’ refers to health states other than ideal good health and may be short term (for example, a day with a common cold) or long term (for example, chronic arthritic pain).
To calculate YLD for incident cases occurring in the study year, an estimation of the incidence of the disabling disease or injury for the specified time period is required. Incident YLD are then calculated by multiplying the number of incident cases of disease by the duration of the disease (from year of incidence to year of remission or death) and a disability weight associated with that disease.
Incident YLD are useful for estimating the potential value to be gained by preventing an incident case of a disease. Incident YLD were presented as the main findings of the two Australian burden of disease studies reported on here (Begg et al. 2007; Vos et al. 2007).
Thus, YLD are an incident-based measure that captures the future health-related consequences of new cases of a condition that occur in the year in which the analysis is set.
As incident cases of asthma are not routinely reported, incidence must be estimated using the best available data. In the Burden of Disease and Injury in Australia 2003 study, incidence estimates were derived using DisMod epidemiological modelling software (Barendregt et al. 2003) by applying age-specific remission rates for asthma (Bronnimann & Burrows 1986) and death rates attributed to asthma (ABS 2005) to published data on the prevalence of current asthma among children and adults. Prevalent cases of current asthma were defined as those people with airway hyperresponsiveness who also reported wheeze in the preceding 12 months (Bauman et al. 1992; Peat et al. 1992, 1994, 1995; Toelle et al. 2004). Age-specific estimates for the prevalence of asthma that were used in the Burden of Disease and Injury in Australia 2003 study are provided in Table 2.1.

4
Table 2.1: Estimations of prevalent cases of asthma(a) used in the Burden of Disease and Injury in Australia 2003 study
Age group Estimate of asthma prevalence (per cent) Source(s)
1 to 2 years 5.75 Wheeze estimate from the United States of America (Martinez et al. 1995) adjusted by 42% to estimate the subpopulation of these who have asthma (Peat et al. 1994, 1995; Toelle et al. 2004)
3 to 18 years Boys 12.30 Girls 8.80
Average of Peat et al. 1994, 1995; Toelle et al. 2004 and male:female ratio of 1.4:1 (Gergen et al. 1988)
Adults Males 5.00 Females 7.50
Bauman et al. 1992; Peat et al. 1992, 1994, 1995 and male:female ratio of 1:1.5 (DHS 2002)
(a) Prevalent cases defined as positive airway hyperresponsiveness test and wheezing in the last 12 months.
Source: Begg et al. 2007.
The study on which remission rates are based was conducted in a general population-based sample in Tucson, Arizona (United States of America; USA). Self-completed questionnaires were administered at baseline in 1972 to 1973 and then again in 1981 to 1983 (Bronnimann & Burrows 1986). Complete data were available for 2,300 subjects. Subjects were classified as having active asthma at the first survey if they reported ever having been diagnosed with asthma together with current use of medications for asthma, a recent attack of asthma or frequent attacks of shortness of breath with wheezing at that time. Among these subjects, those who reported no use of medications for asthma, no asthma attacks and no frequent attacks of shortness of breath with wheezing at the second survey were classified as being in remission from asthma. Overall, 136 subjects were defined as having active asthma in the first survey and 22% of these were in remission by the second survey, with the highest remission rate being in the adolescent years. It is not clear how well remission rates estimated using this rather old, international data source reflect those in Australia in 2003.
2.2.1 Disability weights There are several methods for developing disability weights that reflect the burden of asthma relative to other conditions, injuries and risk factors. Methods for doing this usually involve valuation exercises in which participants make judgements about where a condition lies in a continuum between perfect health and death. The disability weight gives an indication of the severity of the disease on a scale from 0 (perfect health) to 1 (death).
A comprehensive set of disability weights has not yet been derived for use in the Australian context. The Burden of Disease and Injury in Australia 2003 study used a variety of weights, many of which were derived from a valuation study carried out in the Netherlands (Stouthard et al. 1997). These were supplemented with weights from the Global Burden of Disease study (Lopez et al. 2006; Murray and Lopez 1996b) and also weights derived from a statistical model based on the Dutch weights and each of the six domains in the quality-of-life instrument from the EuroQol group known as the EQ 5D+. These disability weights have not yet been validated in the Australian context.
For the Australian Burden of Disease and Injury 2003 study, it was assumed that people with asthma are symptomatic 12% of the time (Bauman et al. 1992). For this symptomatic period, they were assigned a weight of 0.229. This was derived from the weight for asthma from the Dutch study, asthma severity distributions in the 1998 Australian disability survey (ABS 1999) and the disability weight regression model. For the remaining 88% of the time, when

5
people with asthma would not be experiencing symptoms, it was assumed that the health state would be equivalent to the ‘Dutch weight for asthma controlled by treatment’ (that is, 0.03). Combining these (12% × 0.229 + 88% × 0.03) provides the derived overall asthma weight of 0.054 that was used in the Australian burden of disease and injury study.
To provide some context for the disability weights applied to asthma, examples of disability weights assigned to other health states for the Burden of Disease and Injury in Australia 2003 study are presented in Table 2.2.
Table 2.2: Some examples of disability weights from the Burden of Disease and Injury in Australia 2003 study
Disease Disability weight
Hearing loss Mild (25–34 dB) 0.020, Mild (35–44 dB) 0.040
Influenza 0.047
Asthma 0.054
Diabetes
Uncomplicated 0.070
Neuropathy Type I—0.099; Type 2—0.074
Amputation and diabetic foot 0.113
Peripheral vascular disease 0.190
Renal failure 0.290 for 6 months after transplant and 0.110 thereafter
Epilepsy 0.110
Acute bronchitis 0.132
Measles and rubella 0.152
Chronic obstructive pulmonary disease Males—0.168; females—0.159
Asperger’s syndrome 0.250
Pneumonia 0.373
Hepatitis A 0.420
Psychotic disorders 0.434
Severe chronic obstructive pulmonary disease 0.530
Autism 0.550
Motor neurone disease 0.670
HIV/AIDS Stage 1—0.200; stage 2—0.310; stage 3—0.560; stage 4—0.950
Source: Begg et al. 2007.
Adjustment for comorbid conditions Since many individuals suffer from two or more conditions at the same time, the Burden of Disease and Injury in Australia 2003 study applied disability weight corrections for coexisting health states. Disability weights for each condition or health state are generally derived in isolation and cannot simply be summed to account for comorbid conditions. Corrections for coexisting health states or ‘comorbidity’ must be derived empirically. In the Australian study, hospital data and numerous surveys were used to estimate the probabilities of coexistence for each of the possible combinations of health states. These were modelled using an approach which accounted for dependence between health states, that is,

6
‘groups of conditions being more likely to coexist due to common causal pathways’ (Begg et al. 2007). This method of adjustment for comorbid conditions represents a substantial advance upon the methods for dealing with comorbid conditions that have been used in previous studies.
2.2.2 Prevalent years lived with disability (PYLD) Prevalent YLD (PYLD) can also be calculated using the prevalence of the disease in the study year multiplied by its disability weight. Prevalent YLD provide an indication of the burden of disease that is relevant to service utilisation or expenditure. They reflect the burden of disability over the current year due to cases arising in preceding years and persisting into the current year (that is, prevalent cases). Prevalent YLD are a useful indicator of the amount of disability being experienced in a population at the time of the study. This is particularly relevant to asthma, as there are currently no effective interventions for preventing incident cases of asthma. However, prevalent YLD are not suitable for calculating DALY estimates, because they cannot be added to YLL. This is because YLL are inherently a component of future health loss, while prevalent YLD relate to current health loss. For this reason, analyses of DALYs for asthma presented in this report are based on incident YLD. However, the Burden of Disease and Injury in Australia 2003 study also calculated prevalent YLD and the contrasting interpretation of prevalent and incident YLD is presented in Section 3.
2.3 Fatal burden: years of life lost due to premature death (YLL)
The DALY can be considered as a health gap measure. In terms of calculating the fatal burden, it requires an agreed standard against which to quantify the gap between current patterns of mortality and an ideal scenario where everyone survives into old age. For the purposes of The burden of disease and injury in Australia 2003 report, the internationally recognised standard was used to define the mortality gap used in calculating the years of life lost due to premature death (YLL). This is provided by the Coale and Demeny West level 25 and 26 model life tables (Coale & Guo 1989). The remaining life expectancy at each age from these model life tables is taken as the ‘ideal’ length of life for a person at that age. To calculate YLL, each death is multiplied by this remaining life expectancy and, hence, a young death is associated with a greater loss than a death at older ages.
The distribution of ages at death in cases of death attributed to asthma (International Classification of Diseases, version 10 (ICD-10) codes J45 and J46) were obtained from the National Mortality Database for 2003 (ABS 2005). Note that the number of deaths attributed to asthma in the National Mortality Database may differ slightly from the number used in the Burden of Disease and Injury in Australia 2003, as this study incorporated a proportional redistribution of the 0.68% of all deaths where the cause of death was ill-defined.
The sum of YLL for individuals dying due to asthma is the population YLL due to asthma for 2003.

7
2.4 Estimates of the burden of disease among Aboriginal and Torres Strait Islander Australians
A detailed description of the methods used to estimate the burden of disease in Australia’s Indigenous population can be found in the report entitled The burden of disease and injury in Aboriginal and Torres Strait Islander peoples 2003 (Vos et al. 2007). A summary is provided here. Unless stated otherwise, calculation of estimates of burden of disease among Aboriginal and Torres Strait Islander Australians was carried out in the same way as described in the preceding sections for the whole population.
Data from the Australian Bureau of Statistics’ 2004–05 National Aboriginal and Torres Strait Islander Health Survey (NATSIHS) were used to estimate the prevalence of asthma among Indigenous Australians. Respondents who stated that they had ever been told by a doctor or nurse that they had asthma and that their asthma had lasted, or was expected to last, for 6 months or more were classified as having asthma. Prevalence was estimated separately for Indigenous Australians living in remote and non-remote areas and both rates were compared to those in the Australian population as a whole. It was assumed that (1) the relative prevalence of self-reported asthma reflected the true relative prevalence of asthma and (2) the rate of remission of asthma was the same in the Indigenous population as in the total Australian population.
While Indigenous identification and the quality of Indigenous data have been improving over time, there was still incomplete identification of Indigenous deaths in Australia in 2003. A correction for under-registration of deaths in the Indigenous population was applied using the generalised growth balance method. This method was applied separately to both population and mortality data according to remoteness of residence classified using the Accessibility/Remoteness Index of Australia (ARIA+) classification where ‘remote’ included ‘remote’ and ‘very remote’ ARIA+ categories and ‘non-remote’ included all other ARIA+ categories.
Note that all prevalence, hospitalisation and mortality rate ratios were age-standardised to remove the confounding effects of age when comparing the Indigenous population to the total Australian population. This is particularly important for the purposes of this comparison since the Aboriginal and Torres Strait Islander population has a much younger age distribution than the total Australian population.
The disability weight used in the Indigenous Australian burden of disease estimate was higher than the disability weight used for the total population (see Section 2.2.1). A higher disability weight was derived because it was assumed that the disproportionately higher rate of hospitalisations for asthma observed in Indigenous Australians was due, in part, to suboptimal therapy (Vos et al. 2007; Correll et al. 2007; Couzos & Davis 2005).
As described in Section 2.2.1, the national model of burden of disease due to asthma derived a disability weight based on symptomatic and asymptomatic estimates used in the Dutch study. For the total population estimates, this disability weight assumed that the treatment coverage was that used for the established market economies by the Global Burden of Disease study (95%; Murray & Lopez 1996a). For the Indigenous population, it was assumed that the treatment coverage was lower (80%). The asthma disability weight used for the total population was adjusted to reflect this difference in treatment coverage for the Indigenous population (Vos et al. 2007).

8
3 Results
3.1 Leading causes of disease burden in Australia In Australia in 2003, there were over 2.6 million years of healthy life lost due to new (incident) cases of disease and injury occurring during that year. The overall leading cause of burden of disease among Australians in 2003 was ischaemic heart disease, which contributed 10% of the total disease burden with 263,497 DALYs (Table 3.1).
Asthma accounted for 59,054 years lived with disability (YLD) and 4,045 years of life lost due to premature death (YLL), making a total of 63,100 DALYs. Asthma was the eleventh-leading contributor to the overall burden of disease in Australia in 2003 with 2.4% of total DALYs (Table 3.1).
Asthma represented the leading cause of burden of disease among children aged 0 to 14 years in 2003 (Table 3.1). In this age group, asthma contributed 38,443 DALYs (17.4% of total DALYs). The next largest contributor in this age group was anxiety and depression, contributing 25,062 (11.3%).
Anxiety and depression was also the second-largest cause of disease burden overall with DALYs representing 7.3% of the total DALYs in 2003 among people of all ages. Chronic obstructive pulmonary disease represented the eighth-leading cause of disease burden in Australia in 2003 with 86,751 DALYs.

9
Table 3.1: The 15 leading causes of disease burden in Australia, 2003
All ages Children aged 0 to 14 years
Rank Condition
DALYs
Per cent of total DALYs Rank
Condition DALYs
Per cent of total DALYs
1 Ischaemic heart disease 263,497 10.0 1 Asthma 38,443 17.4
2 Anxiety and depression 191,786 7.3 2 Anxiety and depression 25,062 11.3
3 Type 2 diabetes 132,940 5.0 3 Childhood conditions 23,681 10.7
4 Stroke 118,462 4.5 4 Low birthweight 15,423 7.0
5 Sense organ disorders 112,728 4.3 5 Autism spectrum disorders 13,759 6.2
6 Dementia 94,399 3.6 6 Attention-deficit hyperactivity disorder
9,922 4.5
7 Lung cancer 88,904 3.4 7 Birth trauma and asphyxia 9,307 4.2
8 Chronic obstructive pulmonary disease
86,751 3.3 8 Other chromosomal disorders 8,437 3.8
9 Adult-onset hearing loss 64,853 2.5 9 Other conditions arising in the perinatal period
6,424 2.9
10 Colorectal cancer 63,605 2.4 10 Other nervous system and sense organ disorders
6,151 2.8
11 Asthma 63,100 2.4 11 Other congenital abnormalities 6,140 2.8
12 Substance use disorders 60,782 2.3 12 Epilepsy 5,695 2.6
13 Breast cancer 60,654 2.3 13 Congenital heart disease 5,636 2.5
14 Suicide and self-inflicted injuries
49,916 1.9 14 Other unintentional injuries 4,158 1.9
15 Road traffic accidents 42,425 1.6 15 Neonatal infections 3,404 1.5
Total DALYs in 2003 (all causes) 2,632,770 Total DALYs in 2003 (all causes) 221,536
Note : DALYs = disability-adjusted life years.
Source: AIHW: Begg et al. 2007.
3.2 Disease burden due to asthma in Australia
3.2.1 Comparison of the burden of asthma with other conditions
Non-fatal burden of disease (years lived with disability—YLD) The majority (59,054; 94%) of DALYs due to asthma arise from years of healthy life lost due to disability caused by the condition (YLD) (Figure 3.1). This high proportion of DALYs that was attributable to YLD for asthma, was also seen for arthritis/musculoskeletal diseases (93%) and mental disorders (93%), although the overall burden of asthma was much smaller. Mental disorders were the leading contributor to total YLD in Australia in 2003, accounting for 327,391 years of healthy life lost.

10
Fatal burden of disease (years of life lost—YLL) Death due to asthma (YLL) is relatively uncommon and, in 2003, YLL accounted for only 6% (4,045) of the DALYs due to asthma (Figure 3.1). This is in contrast to many of the other health problems that contribute a large proportion to Australia’s ill health. In particular, YLL account for the majority of the total burden of disease for conditions such as cancer (83%), cardiovascular disease (78%) and injuries (76%).
0 50,000 100,000 150,000 200,000 250,000 300,000 350,000 400,000 450,000 500,000
Asthma
Chronic obstructive pulmonary disease(COPD)
Arthritis/musculoskeletal diseases
Diabetes mellitus
Injuries
Mental disorders
Cardiovascular disease
Cancer
DALYs
YLDYLL
Data table
Condition YLD YLL DALYs
Cancer 87,463 (17.5%) 411,953 (82.5%) 499,416 (100%)
Cardiovascular disease 104,429 (22.0%) 369,365 (78.0%) 473,794 (100%)
Mental disorders 327,391 (93.4%) 23,154 (6.6%) 350,545 (100%)
Injuries 44,402 (24.0%) 140,648 (76.0%) 185,050 (100%)
Diabetes mellitus 111,536 (77.5%) 32,295 (22.5%) 143,831 (100%)
Arthritis/musculoskeletal diseases 98,481 (93.3%) 7,027 (6.7%) 105,508 (100%)
Chronic obstructive pulmonary disease (COPD) 39,543 (45.6%) 47,208 (54.4%) 86,751 (100%)
Asthma 59,054 (93.6%) 4,045 (6.4%) 63,100 (100%)
Notes: DALYs = disability-adjusted life years. Cancer includes all malignant neoplasms. Cardiovascular disease includes rheumatic heart disease, ischaemic heart disease, stroke, inflammatory heart disease, hypertensive heart disease, non-rheumatic valvular disease, aortic aneurysm, peripheral vascular disease and other cardiovascular disease. Mental disorders include substance use disorders, schizophrenia, anxiety and depression, bipolar disorder, personality disorders, eating disorders (including anorexia nervosa and bulimia nervosa), childhood conditions (including attention-deficit hyperactivity disorder and autism spectrum disorders) and other mental disorders. Arthritis and musculoskeletal diseases include rheumatoid arthritis and osteoarthritis.
Source: Begg et al. 2007.
Figure 3.1: Burden of disease, as years lived with disability (YLD) and years of life lost (YLL), attributable to major diseases or disease groups, Australia, 2003

11
3.2.2 Age and sex distribution of the burden of asthma In 2003, 60.9% of the burden of disease attributed to asthma was borne by children aged 0 to 14 years (Table 3.2). In this age group, asthma accounted for 21,953 DALYs among boys and 16,490 DALYs among girls. Asthma contributed a slightly higher proportion of total DALYs among boys aged 0 to 14 years (17.6%) than among girls of the same age (17.0%). On the other hand, the burden of asthma was greater among females aged 15 years and over compared with males of the same age. Asthma represented 1.5% and 0.6% of the total DALYs among females and males, respectively, aged 15 years and over. The burden of disease attributed to asthma in 2003 was lowest among older adults aged 65 years and over.
Table 3.2: Disability-adjusted life years by age and sex, asthma and all causes, Australia, 2003
Source: Begg et al. 2007.
In this oldest age group, people are likely to suffer from comorbidities and share the burden of disease across a range of conditions, including asthma and chronic obstructive pulmonary disease but also cardiovascular disease, diabetes and cancer.
Among females, there was a linear decline in the total number of DALYs attributed to asthma with increasing age (Figure 3.2). However, the vast majority of DALYs due to asthma among males occurred in those aged 0 to 14 years and from the age of 15 years there was a sharp decline in DALYs due to asthma. Overall, females contributed more DALYs due to asthma (33,828) than males (29,271).
As would be expected, the proportion of the total disease burden due to asthma represented by YLL increased with increasing age (Figure 3.2).
Males Females
Age group (years) Asthma All causes Asthma All causes
0 to 14 21,953 (75.0%) 124,809 (9.1%) 16,490 (48.7%) 96,727 (7.6%)
15 to 34 3,158 (10.8%) 202,244 (14.8%) 9,701 (28.7%) 192,750 (15.2%)
35 to 64 2,957 (10.1%) 504,173 (36.9%) 5,009 (14.8%) 415,659 (32.8%)
65 and over 1,203 (4.1%) 533,388 (39.1%) 2,628 (7.8%) 563,019 (44.4%)
All ages 29,271 (100%) 1,364,614 (100%) 33,828 (100%) 1,268,156 (100%)

12
0
5,000
10,000
15,000
20,000
25,000
0–14 15–24 25–64 65–74 75 and over 0–14 15–24 25–64 65–74 75 and over
Age group (years) and sex
Dis
abili
ty-a
djus
ted
life
year
s (D
ALY
s)
YLDYLL
Males Females
Source: Begg et al. 2007.
Figure 3.2: Burden of disease, measured as years lived with disability (YLD) and years of life lost (YLL), attributable to asthma, by age group and sex, Australia 2003
Expressed as a population rate, DALYs due to asthma were higher in young boys compared with girls and higher in women aged 15 years and over compared with men (Figure 3.3). Similar patterns have been observed in overseas studies on the incidence of asthma. Male gender was found to be a significant risk factor (adjusted hazard ratio 1.43 (95% confidence interval 1.39–1.47)) for the incidence of asthma in a large Canadian study (Dik et al. 2004). In Sweden, the incidence of asthma was 2.8% among adult women compared with 1.9% among men (Ekerljung et al. 2008). Furthermore, a longitudinal cohort study conducted in Tucson, USA, found that male gender was significantly associated with asthma remission, while female gender was an independent predictor of incident asthma at age 22 years (Stern et al. 2008). These findings also reflect patterns seen in the prevalence of asthma, where males aged 0 to 14 years are more likely to have asthma than girls of the same age and women aged 15 years and over are more likely to report having the condition than men (ACAM 2008).

13
0
200
400
600
800
1,000
1,200
0 to 14 15 to 24 25 to 64 65 to 74 75 and over
Age group (years)
DA
LYs
per 1
00,0
00 p
opul
atio
n
malesfemales
Source: Begg et al. 2007.
Figure 3.3: Burden of disease attributed to asthma, measured as disability-adjusted life years (DALYs) per 100,000 population, by age group and sex, Australia, 2003
Up to this point in the report, we have presented incident YLD, which indicate the future burden that would be avoided if a disease was prevented in the study year. Prevalent YLD, which provide an indication of the burden of disability due to a disease in the study year, are particularly useful in the case of asthma because there are currently no known measures that are effective in preventing this condition. Prevalent YLD indicate the current burden due to existing diseases in the study year. This burden is potentially amenable to reduction by better management of current asthma. Furthermore, the data used to calculate prevalent YLD are more robust than the data on incidence and remission used to calculate incident YLD for asthma.
Comparison of prevalent and incident YLD for all causes shows that the two estimates are broadly similar but prevalent YLD are lower than incident YLD in the youngest age group and higher than incident YLD in the older age groups (Begg et al. 2007). This reflects the fact that children are generally more likely to have incident conditions while a larger proportion of the elderly population have prevalent conditions.
Incident YLD due to asthma in 2003 were highest in the young and lowest in older age groups (Table 3.3). Among males, 78.9% of incident YLD due to asthma were attributed to those aged 0 to 14 years, reflecting the higher incidence of asthma in boys compared with adult males. On the other hand, prevalent YLD due to asthma were highest in persons aged 35 to 64 years, particularly females.
In 2003, prevalent YLD due to asthma represented 4.4% of the prevalent YLD for all causes (Table 3.3), with a slightly higher proportion contributed by females (4.8%) compared with

14
males (4.0%). People aged 35 to 64 years accounted for 36.1% of all prevalent YLD due to asthma (Table 3.3). Among males, 27% of the prevalent YLD due to asthma were attributed to those aged 0 to 14 years (Table 3.3). Furthermore, the 8,455 prevalent YLD due to asthma for males in this age group represented 17.2% of the prevalent YLD for all causes.
Table 3.3: Prevalent and incident years lived with disability (YLD) due to asthma by age and sex, Australia, 2003
Prevalent YLD Incident YLD
Age group (years) and sex
Number due to asthma
Proportion of all asthma
(column %)
Proportion of all cause within
age group(row %)
Number due to asthma
Proportion of all asthma
(column %)
Proportion of all cause
within age group
(row %)
Males
0 to 14 8,455 27.0 17.2 21,828 78.9 23.1
15 to 34 9,822 31.4 7.4 2,681 9.7 2.0
35 to 64 10,215 32.7 3.1 2,355 8.5 0.9
65 and over 2,765 8.8 1.0 785 2.8 0.4
All ages 31,258 100 4.0 27,649 100 4.2
Females
0 to 14 6,406 16.9 18.3 16,393 52.2 22.4
15 to 34 11,637 30.8 8.4 9,402 29.9 5.7
35 to 64 14,739 39.0 4.6 4,042 12.9 1.6
65 and over 5,016 13.3 1.7 1,567 5.0 0.8
All ages 37,799 100 4.8 31,405 100 4.5
Persons
0 to 14 14,862 21.5 17.7 38,222 64.7 22.8
15 to 34 21,460 31.1 7.9 12,083 20.5 4.0
35 to 64 24,955 36.1 3.9 6,397 10.8 1.3
65 and over 7,781 11.3 1.4 2,352 4.0 0.6
All ages 69,057 100 4.4 59,054 100 4.4
Note: Components may not add to total because of rounding.
Source: Begg et al. 2007.

15
3.3 The burden of asthma in Aboriginal and Torres Strait Islander Australians
3.3.1 Disparities in health between Indigenous Australians and the total Australian population—the Indigenous health gap
The health gap between Aboriginal and Torres Strait Islander peoples and non-Indigenous Australians is well documented (ABS & AIHW 2005; Oxfam Australia 2007), although poorly quantified until recently. The gap in mortality between Indigenous and non-Indigenous Australians is greater than the gap in disability, which partly reflects the higher case fatality among Indigenous Australians (Vos et al. 2007). It has been estimated that the total burden of disease among the Australian Indigenous population could have been decreased by 59% (56,455 DALYs) in 2003 if Indigenous Australians had similar levels of mortality and disability as the total Australian population (Vos et al. 2007, 2009).
Non-communicable diseases accounted for 70% of the health gap between Indigenous Australians and the total Australian population in 2003 (Vos et al. 2009). Chronic respiratory disease was the fourth-leading contributor to this non-communicable health gap (9%) behind cardiovascular disease (23%), diabetes (12%) and mental disorders (12%) (Vos et al. 2007).
3.3.2 Leading causes of disease burden in Aboriginal and Torres Strait Islander Australians
Among Aboriginal and Torres Strait Islander Australians in 2003, there were 95,976 years of healthy life lost due to new (incident) cases of disease and injury occurring during that year. The overall leading cause of burden of disease among Indigenous Australian males in 2003 was ischaemic heart disease, which contributed 11.8% of the total disease burden with 5,899 DALYs (Table 3.4). Among Indigenous females, anxiety and depression was the leading cause of burden of disease with 4,582 DALYs (10.0% of total DALYs among females).
Asthma accounted for 1,396 DALYs among Indigenous males and 1,907 DALYs among Indigenous females making it the eighth- and fourth-leading contributor to the overall burden of disease in males and females, respectively (Table 3.4). These rankings were much higher than those for the Australian population as a whole where asthma was ranked as the thirteenth-leading cause of disease burden among males and the ninth among females. This difference, which was largely due to the younger age structure of the Indigenous population, represents a 1.4 times higher burden of asthma in Aboriginal and Torres Strait Islander Australians compared to the total Australian population (Vos et al. 2007).
Chronic obstructive pulmonary disease (COPD) was also a significant cause of disease burden in the Aboriginal and Torres Strait Islander population. COPD accounted for 1,941 and 1,678 DALYs among males and females, respectively, and represented the sixth-leading cause of disease burden among males and the fifth among females (Table 3.4). The burden due to COPD was 4.5 times higher in the Indigenous Australian population than the total Australian population (Vos et al. 2007).

16
Table 3.4: The 15 leading causes of disease burden in Indigenous Australians and comparison of ranking with total Australian population, by sex, 2003
Males Females
Condition DALYs
RankingIndigenous Australian
Ranking total
Australian Condition DALYs
Ranking Indigenous Australian
Ranking total
Australian
Ischaemic heart disease
5,899 1 1 Anxiety and depression
4,582 1 1
Type 2 diabetes 3,520 2 2 Type 2 diabetes 4,361 2 4
Anxiety and depression 2,864 3 3 Ischaemic heart disease
4,074 3 2
Suicide and self-inflicted injuries
2,644 4 8 Asthma 1,907 4 9
Road traffic accidents 1,955 5 12 COPD 1,678 5 7
COPD 1,941 6 6 Stroke 1,413 6 3
Alcohol dependence and harmful use
1,797 7 14 Road traffic accidents 1,074 7 22
Asthma 1,396 8 13 Alcohol dependence and harmful use
1,008 8 34
Stroke 1,293 9 5 Lung cancer 945 9 8
Homicide and violence 1,102 10 46 Homicide and violence
854 10 75
Low birth weight 1,001 11 37 Low birth weight 808 11 33
Lung cancer 995 12 4 Pneumonia 798 12 16
Pneumonia 878 13 21 Suicide and self-inflicted injuries
795 13 24
Inflammatory heart disease
799 14 32 Breast cancer 719 14 6
Heroin or polydrug dependence
771 15 24 Rheumatic heart disease
660 15 74
Note: DALYs = disability-adjusted life years; COPD = chronic obstructive pulmonary disease.
Source: Reproduced and modified from Vos et al. 2007.
3.3.3 Comparison of the burden of asthma with other conditions The leading causes of disease burden in the Indigenous Australian population in 2003 were cardiovascular disease and mental disorders (Figure 3.4). Together, these accounted for 32% of the total disease burden. Chronic respiratory disease accounted for approximately 8% of the total disease burden, with COPD contributing 3.8% and asthma contributing 3.4%.
Non-fatal burden of disease (years lived with disability—YLD) The majority (90%) of DALYs due to asthma in Aboriginal and Torres Strait Islander Australians arise from years lived with disability (YLD) (Figure 3.4). Asthma was the third-leading cause of incident YLD in both Indigenous males and females in 2003 (Vos et al. 2007), contributing 1,262 YLD in males and 1,718 in females. Only anxiety and depression and type 2 diabetes accounted for more incident YLD among Indigenous Australians in 2003.

17
Fatal burden of disease (years of life lost—YLL) Deaths due to asthma (YLL) accounted for only a small proportion (9.8%) of the DALYs due to asthma among Indigenous Australians (Figure 3.4). This contrasts with a much higher proportion of DALYs attributable to YLL for cancer, injuries and cardiovascular disease.
0 2,000 4,000 6,000 8,000 10,000 12,000 14,000 16,000 18,000
Arthritis/musculoskeletal diseases
Asthma
Chronic obstructive pulmonarydisease (COPD)
Cancer
Diabetes mellitus
Injuries
Mental disorders
Cardiovascular disease
DALYs
YLD
YLL
Data table
Condition YLD YLL DALYs
Cardiovascular disease 4,214 (25.1%) 12,573 (74.9%) 16,787 (100%)
Mental disorders 12,335 (83.0%) 2,525 (17.0%) 14,860 (100%)
Injuries 2,086 (16.8%) 10,298 (83.2%) 12,384 (100%)
Diabetes mellitus 4,946 (58.2%) 3,552 (41.8%) 8,498 (100%)
Cancer 466 (6.0%) 7,351 (94.0%) 7,817 (100%)
Chronic obstructive pulmonary disease (COPD) 1,948 (53.8%) 1,671 (46.2%) 3,619 (100%)
Asthma 2,980 (90.2%) 323 (9.8%) 3,303 (100%)
Arthritis/musculoskeletal diseases 1,032 (85.1%) 180 (14.9%) 1,212 (100%)
Notes: DALYs = disability-adjusted life years. Cancer includes all malignant neoplasms. Cardiovascular disease includes rheumatic heart disease, ischaemic heart disease, stroke, inflammatory heart disease, hypertensive heart disease and other cardiovascular disease. Mental disorders include substance use disorders, schizophrenia, anxiety and depression and other mental disorders. Arthritis and musculoskeletal diseases include rheumatoid arthritis, osteoarthritis, back pain/slipped disc and other musculoskeletal diseases. Injuries include intentional and unintentional injuries.
Source: Vos et al. 2007.
Figure 3.4: Burden of disease, measured as years lived with disability (YLD) and years of life lost (YLL), attributable to major diseases or disease groups, Indigenous Australians, 2003
18
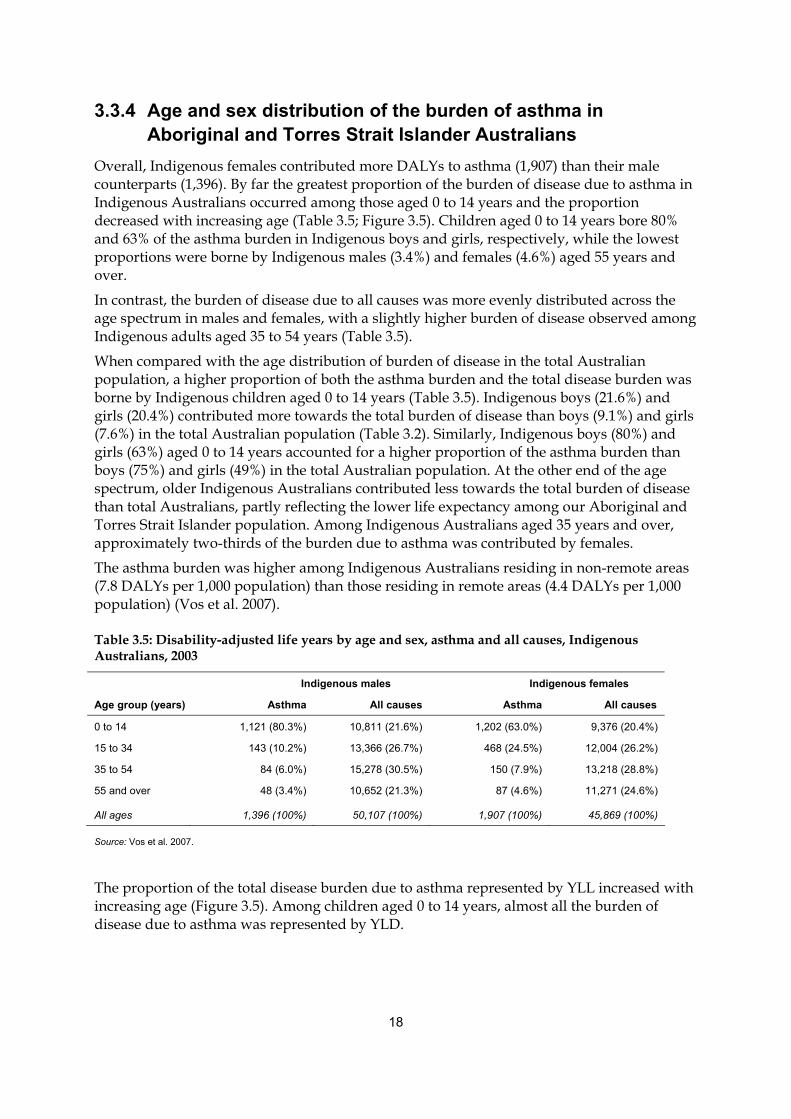
3.3.4 Age and sex distribution of the burden of asthma in Aboriginal and Torres Strait Islander Australians
Overall, Indigenous females contributed more DALYs to asthma (1,907) than their male counterparts (1,396). By far the greatest proportion of the burden of disease due to asthma in Indigenous Australians occurred among those aged 0 to 14 years and the proportion decreased with increasing age (Table 3.5; Figure 3.5). Children aged 0 to 14 years bore 80% and 63% of the asthma burden in Indigenous boys and girls, respectively, while the lowest proportions were borne by Indigenous males (3.4%) and females (4.6%) aged 55 years and over.
In contrast, the burden of disease due to all causes was more evenly distributed across the age spectrum in males and females, with a slightly higher burden of disease observed among Indigenous adults aged 35 to 54 years (Table 3.5).
When compared with the age distribution of burden of disease in the total Australian population, a higher proportion of both the asthma burden and the total disease burden was borne by Indigenous children aged 0 to 14 years (Table 3.5). Indigenous boys (21.6%) and girls (20.4%) contributed more towards the total burden of disease than boys (9.1%) and girls (7.6%) in the total Australian population (Table 3.2). Similarly, Indigenous boys (80%) and girls (63%) aged 0 to 14 years accounted for a higher proportion of the asthma burden than boys (75%) and girls (49%) in the total Australian population. At the other end of the age spectrum, older Indigenous Australians contributed less towards the total burden of disease than total Australians, partly reflecting the lower life expectancy among our Aboriginal and Torres Strait Islander population. Among Indigenous Australians aged 35 years and over, approximately two-thirds of the burden due to asthma was contributed by females.
The asthma burden was higher among Indigenous Australians residing in non-remote areas (7.8 DALYs per 1,000 population) than those residing in remote areas (4.4 DALYs per 1,000 population) (Vos et al. 2007).
Table 3.5: Disability-adjusted life years by age and sex, asthma and all causes, Indigenous Australians, 2003
Indigenous males Indigenous females
Age group (years) Asthma All causes Asthma All causes
0 to 14 1,121 (80.3%) 10,811 (21.6%) 1,202 (63.0%) 9,376 (20.4%)
15 to 34 143 (10.2%) 13,366 (26.7%) 468 (24.5%) 12,004 (26.2%)
35 to 54 84 (6.0%) 15,278 (30.5%) 150 (7.9%) 13,218 (28.8%)
55 and over 48 (3.4%) 10,652 (21.3%) 87 (4.6%) 11,271 (24.6%)
All ages 1,396 (100%) 50,107 (100%) 1,907 (100%) 45,869 (100%)
Source: Vos et al. 2007.
The proportion of the total disease burden due to asthma represented by YLL increased with increasing age (Figure 3.5). Among children aged 0 to 14 years, almost all the burden of disease due to asthma was represented by YLD.

19
0
200
400
600
800
1,000
1,200
1,400
0–14 15–34 35–64 65 and over 0–14 15–34 35–64 65 and over
Age group (years) and sex
DA
LYs
YLDYLL
Males Females
Source: Vos et al. 2007.
Figure 3.5: Burden of disease, measured as years lived with disability (YLD) and years of life lost (YLL), attributable to asthma, by age group and sex, Indigenous Australians, 2003
Asthma was the third-leading cause of incident YLD in both Indigenous males and females in 2003, contributing 1,262 YLD in males and 1,718 in females (Table 3.6; Vos et al. 2007). As observed in the burden of disease estimates from the total Australian population, prevalent YLD were lower than incident YLD in the youngest age group and higher than incident YLD in the oldest age group among Aboriginal and Torres Strait Islander Australians (Table 3.6).
In 2003, prevalent YLD due to asthma represented 5.8% of the prevalent YLD for all causes among Aboriginal and Torres Strait Islander Australians (Table 3.6). Females contributed a slightly higher proportion of prevalent YLD (6.8%) than males (4.8%).
Young adults aged 15 to 34 years accounted for 39.1% of all prevalent YLD due to asthma while children aged 0 to 14 years accounted for 35.6%. Among females, 473 prevalent YLD due to asthma among children aged 0 to 14 years represented 16.0% of the prevalent YLD for all causes.

20
Table 3.6: Prevalent and incident years lived with disability (YLD) due to asthma by age and sex, Indigenous Australians, 2003
Prevalent YLD Incident YLD
Age group (years) and sex
Number due to asthma
Proportion ofall asthma
(column %)
Proportion of all cause within
age group(row %)
Number due to asthma
Proportion of all asthma
(column %)
Proportion of all cause
within age group
(row %)
Males
0 to 14 371 39.0 10.6 1,107 87.7 16.0
15 to 34 379 39.8 6.4 117 9.3 1.8
35 to 54 156 16.4 2.4 27 2.1 0.5
55 and over 46 4.8 1.2 11 0.9 0.4
All ages 952 100 4.8 1,262 100 6.0
Females
0 to 14 473 33.3 16.0 1,187 69.1 19.1
15 to 34 550 38.7 8.2 435 25.3 5.3
35 to 54 302 21.2 4.4 68 4.0 1.1
55 and over 97 6.8 2.2 27 1.6 0.9
All ages 1,422 100 6.8 1,718 100 7.4
Persons
0 to 14 844 35.6 13.1 2,294 77.0 17.5
15 to 34 929 39.1 7.3 552 18.5 3.7
35 to 54 458 19.3 3.4 95 3.2 0.8
55 and over 143 6.0 1.7 38 1.3 0.7
All ages 2,373 100 5.8 2,980 100 6.7
Note: Components may not add to total because of rounding.
Source: Vos et al. 2007.
3.4 Projections of the future burden of asthma Projections of the future burden of asthma are important in estimating future health expenditure due to the condition.
Among females, asthma represented the ninth-leading cause of DALYs in 2003 (2.7% of total burden). It is predicted that asthma will remain in ninth place in 2013 and 2023, although its share of the total burden of disease will decrease from 2.5% to 2.4%, respectively.
Among males, asthma was the thirteenth-leading cause of DALYs in 2003, representing 2.1% of the total burden. It is estimated that asthma will move to the twelfth-leading cause of DALYs in 2013 (2.0% of total burden) and remain at this ranking in 2023 (1.9% of total).
Another important aspect of the future burden of asthma is the projected expenditure. It has been estimated that there will be a 205% increase in expenditure for respiratory conditions between 2002–03 to 2032–33 from $7,188 million to $21,947 (2006–07 dollars; AIHW 2008).

21
4 Discussion
4.1 Burden of asthma worldwide and in Australia In 2004, asthma affected almost 235 million people around the world (WHO 2008). At this time, it was estimated that asthma accounted for 16.317 million DALYs, representing 1.1% of the total global burden of disease. During 2004, DALYs due to asthma were slightly higher among males (8.856 million; 1.1% of total DALYs) compared with females (7.461 million; 1.0% of total DALYs) worldwide. Asthma represents a substantially higher proportion of the burden of disease in Australia (2.4%), possibly reflecting the relative absence in Australia of some diseases associated with a high global burden.
Most of the impact of asthma is on physical functioning and on the ability to perform social roles (ACAM 2008). This is reflected in Australian burden of disease estimates whereby burden of disease attributable to asthma is dominated by the disability component, especially in children and particularly among boys more so than girls.
Chronic respiratory disease was the fourth-leading contributor to the Indigenous health gap in burden of non-communicable disease in Australia in 2003. Thus, asthma and COPD, which together contribute 81% to the chronic respiratory disease burden, represent two conditions for which targeted interventions could improve the health status of Aboriginal and Torres Strait Islander Australians.
4.2 Evaluation of the estimates The Global Burden of Disease study measures have been adopted by the World Health Organization and many individual nations, including Australia. However, there are important limitations to the methods used in the study, particularly in terms of estimating the burden of disease due to asthma, and some of these are discussed in the paragraphs that follow.
4.2.1 Estimation of incident YLD Estimates of the lifelong burden due to asthma summarised in this report are sensitive to estimates of the incidence of the condition. Data on the incidence of asthma are not robust. It is important to be aware that the estimation of incident YLD, which form the major component of DALYs for asthma, is based on expected future disability in incident cases of asthma arising during the study year. This measure was used because it is a conceptually consistent measure of future disease burden that can be added to YLL to estimate DALYs in the given study year. Incident YLD are relevant to assessing the potential impact of preventive interventions that would reduce the number of incident cases and will be favourably influenced by future interventions that increase rates of remission of asthma, hence shortening the duration of the disease. However, there are limited data on the incidence of asthma in Australia, since incident cases are not routinely reported. The Burden of Disease and Injury in Australia 2003 study derived estimates of incidence based on data on remission rates from a study conducted in the USA and rather old data on prevalence and

22
frequency of symptoms from Australia. The validity of these data for predicting the incidence of asthma and disability arising from it in Australia in 2003 is uncertain.
4.2.2 Counting cases of asthma There are many other uncertainties in the estimation of DALYs attributable to asthma. The calculation of incident YLD is based on estimation of both the incidence and the duration of asthma. Both of these are derived from primary data on the prevalence, age-specific mortality and remission rates. There is no universally agreed definition of prevalence of asthma and estimates vary substantially depending on the definition that is applied (ACAM 2008; Baker et al. 2004). This is particularly true in the case of young children and the elderly. The Burden of Disease and Injury in Australia 2003 study applied an epidemiological definition which has been shown to identify a population with ‘asthma that matters’, that is, asthma that is more likely to be persistent, to require treatment and to be associated with impact on quality of life and need for health care (Toelle et al. 1992, 1997). The study defined prevalent cases of current asthma as those people with airway hyperresponsiveness who also reported wheeze in the preceding 12 months. However, some people who are labelled as having asthma, have symptoms of asthma and take treatment for asthma are not included within this definition. On the other hand, there may be many people who self-report asthma or symptoms of asthma but who may not have the condition or may only experience very minor disability from it.
4.2.3 Indigenous data In the Indigenous study, self-reported Indigenous status and current asthma status from the National Aboriginal and Torres Strait Islander Health Survey were used as the basis of burden of disease estimates. These results were not confirmed by a clinical examination and uncertainties about the diagnosis of asthma, particularly in those less than 1 year of age and older than 55 years of age, are likely to be problematic. Furthermore, there may also be some degree of under-reporting of Indigenous status due to the self-reported nature of this identifier in the survey questionnaire. However, the relativities used in the burden of disease estimates provide a reasonable proxy for differences in ‘true’ prevalence between Indigenous and non-Indigenous Australians.
4.2.4 Diagnostic labelling Other factors may have also affected the estimation of the burden of asthma in this report. It is difficult to distinguish between asthma and other forms of chronic lung disease in young children and among the elderly, particularly the latter. In older persons, there is overlap between asthma and chronic obstructive pulmonary disease (COPD) and the labelling of airways disease in this age group is often uncertain. It is possible that some people in older age groups with asthma were wrongly classified as having COPD, and vice versa, resulting in either an underestimation of the burden of disease due to asthma or an overestimate of asthma mortality that was really COPD. Diagnostic labelling of airways disease is also a difficult task among Aboriginal and Torres Strait Islander Australians. As with the non-Indigenous population, accurate diagnosis of COPD and asthma is challenging among the elderly. At the other end of the age spectrum, chronic suppurative lung disease and
23
bronchiolitis have symptoms that overlap with those of asthma and are relatively common in young Aboriginal and Torres Strait Islander children (Chang et al. 2008).
It is important to note that difficulties in defining asthma in the general population and in Aboriginal and Torres Strait Islander Australians are not limited to burden of disease studies such as the ones reported on here. All epidemiological studies of asthma are faced with similar difficulties, regardless of where they are conducted around the world.
4.2.5 Disability weights Another area to consider when assessing the precision of estimates is the disability weights assigned to each condition. For most conditions, the rank order of the disability weights has strong face validity and has been shown to be relatively constant for a number of conditions when replicated in several different countries. On the other hand, for conditions such as asthma, which are quite common but generally have low severity, existing methods do not accurately capture the spectrum of disease severity in the community. This is important because small differences in the disability weight for a common condition have a large impact on the calculation of the size of the disease-specific burden. This area requires further development.
The disability weight for asthma was calculated using the assumption that people with asthma suffer from symptoms 12% of the time (see Section 2.2.1). This was derived from data that were collected in late 1990 (Bauman et al. 1992). Since that time there have been major changes in the management of asthma along with improvements in mortality and morbidity. In particular, the range of medications available for the treatment for asthma, and the efficacy of these, has improved considerably. Hence, the proportion of time spent symptomatic that was used to calculate the disability weight for asthma may be an overestimation. However, the extent of overestimation cannot be ascertained with the data available.
4.2.6 Co-morbid conditions A major strength of the Burden of Disease and Injury in Australia 2003 study is that the outcomes reported were adjusted to account for coexisting or comorbid conditions. Without such adjustments, health loss due to asthma and other conditions would have been overestimated, since disability weights were derived in isolation and without taking into account the existence of multiple conditions within an individual.
4.2.7 What is not measured in burden of disease Another important aspect to consider when assessing the burden of asthma is the influence it has on the lives of family and carers. This may come in the form of the financial costs of asthma care borne by the family and/or the loss of time for productive activity due to caring for other members of the family with the condition. Unfortunately, the burden of disease measured using DALYs only incorporates and quantifies the health burden which is borne by the individual with the condition, in this case, asthma. Therefore, we can assume that the burden of asthma on the community as a whole is underestimated in this report.

24
4.3 Conclusions Reducing the burden of asthma will require improvements in disease management. Treatment guidelines and available evidence both suggest that patients with persistent asthma should use inhaled corticosteroids regularly. However, there is evidence from a range of sources that many people with asthma use this class of medication intermittently or not at all (ACAM 2008). Improving the utilisation of this mode of treatment would be expected to decrease the time during which people with asthma are symptomatic, leading to a decrease in the burden of disease due to asthma. Thus, policy directed at improving access and adherence to treatment with inhaled corticosteroids could contribute to a potentially avoidable burden due to asthma.
It is estimated that asthma will continue to rank as one of the major causes of disease burden in Australia for the next 20 years, particularly among females. This report highlights the relative importance of long-term disability among children as a contributor to the burden of asthma in Australia. Furthermore, increases in life expectancy and the resulting ageing population will contribute to a growing demand for health services in the future. Finally, chronic respiratory disease, including asthma, accounts for a sizeable proportion of the Indigenous health gap observed in the burden of non-communicable disease in Australia and represents an area where significant gains in Aboriginal and Torres Strait Islander Australian health could be made.
Estimates of burden of disease attributable to conditions such as asthma represent the first step in prioritising diseases for policy action. Considered together with economic evaluations of existing and proposed interventions, burden of disease studies provide an important input to health service planning and the allocation of resources.

25
Glossary
Airway hyperresponsiveness
Excessive twitchiness or narrowing of the airways in response to certain stimuli. This is a characteristic feature of asthma.
Comorbidity When a person has two or more health problems at the same time.
Disability Departure from good or ideal health in any of the important domains of health, such as mobility, self-care, pain and discomfort, participation in usual activities, anxiety and depression and cognitive impairment.
Disability-adjusted life year (DALY)
A DALY is equivalent to a lost year of healthy life and is used to provide a common currency by which many different diseases, injuries and risk factors can be compared. It is calculated by adding future years lived with disability (YLD) for incident cases of the health condition to years of life lost due to premature death (YLL) due to the condition.
Disease burden The overall health impact of a disease due to its presence in a population. This encompasses impairments to quality of life, disability and premature mortality from the disease.
Incidence The number of new cases (of a disease, condition or event) occurring during a given period. Compare with Prevalence.
Prevalence The number or proportion (of cases, instances, and so forth) present in a population at a given time. Compare with Incidence.
Years lived with disability
Years lived in less than ideal health due to a disease or health condition weighted for severity.
Years of life lost The difference between age of death and an ideal survival at any given age.

26
References
ABS (Australian Bureau of Statistics) 1999. Disability, ageing and carers, Australia: summary of findings, 1998. ABS cat. no. 4430.0. Canberra: ABS.
ABS 2005. Causes of death Australia 2003. ABS cat. no. 3303.0. Canberra: ABS.
ABS and AIHW (Australian Bureau of Statistics and Australian Institute of Health and Welfare) 2005. The health and welfare of Australia’s Aboriginal and Torres Strait Islander peoples 2005. ABS cat. no. 4704.0, AIHW cat. no. IHW11. Canberra: ABS and AIHW.
ACAM (Australian Centre for Asthma Monitoring) 2007. Asthma in Australia: findings from the 2004–05 National Health Survey. Cat. no. ACM 10. Available at <www.asthmamonitoring.org>. Canberra: AIHW.
ACAM 2008. Asthma in Australia 2008. Cat. no. ACM 14. Available at <www.asthmamonitoring.org>. Canberra: AIHW.
AIHW (Australian Institute of Health and Welfare) 2008. Projection of Australian health care expenditure by disease, 2003 to 2033. Cat no. HWE 43. Canberra: AIHW.
Baker DF, Marks GB, Poulos LM & Williamson M 2004. Review of proposed National Health Priority Area asthma indicators and data sources. Cat. no. ACM 2. Available at <www.asthmamonitoring.org>. Canberra: AIHW.
Barendregt JJ, van Oortmarssen GJ, Vos T & Murray CJL 2003. A generic model for the assessment of disease epidemiology: the computational basis of DisMod II. Population Health Metrics 1(1):4.
Bauman A, Mitchell C, Henry R, Robertson C, Abramson M, Comino E et al. 1992. Asthma morbidity in Australia: an epidemiological study. Medical Journal of Australia 156:827–31.
Begg S, Vos T, Barker B, Stevenson C, Stanley L & Lopez A 2007. The burden of disease and injury in Australia, 2003. AIHW cat. no. PHE 82. Canberra: AIHW.
Bronnimann S & Burrows B 1986. A prospective study of the natural history of asthma. Remission and relapse rates. Chest 90:480–4.
Chang AB, Grimwood K, Macguire G, King P, Morris P & Torzillo P 2008. Management of bronchiectasis and chronic suppurative lung disease in Indigenous children and adults from rural and remote Australian communities [position statement]. Medical Journal of Australia 189:386–93.
Coale A & Guo G 1989. Revised regional model life tables at very low levels of mortality. Population Index 55:613–43.
Correll PK, Xuan W, Williamson M, Sundararajan V, Ringland C & Marks GB 2007. Reattendance at hospital for asthma in two Australian states, 2000–2003. Respirology 12(2):220–6.
Couzos S & Davis S 2005. Inequities in Aboriginal health—access to the Asthma 3+ Visit Plan. Australian Family Physician 34(10):837–40.
DHS (Department of Human Services, Victoria) 2002. Victorian Population Health Survey 2001. Melbourne: DHS.
Dik N, Tate R, Manfreda J & Anthonisen NR 2004. Risk of physician-diagnosed asthma in the first 6 years of life. Chest 126:1,147–53.

27
Ekerljung L, Rönmark E, Larsson K, Sundblad B-M, Bjerg A, Ahlstedt S et al. 2008. No further increase of incidence of asthma: incidence, remission and relapse of adult asthma in Sweden. Respiratory Medicine 102:1,730–6.
Gergen PJ, Mullally DI & Evans R, 3rd 1988. National survey of prevalence of asthma among children in the United States, 1976 to 1980. Pediatrics 81:1–7.
Lopez AD, Mathers CD, Ezzati M, Jamison DT & Murray CJL (eds) 2006. Global burden of disease and risk factors. New York: Oxford University Press & the World Bank.
Martinez FD, Wright AL, Taussig LM, Holberg CJ, Halonen M & Morgan WJ 1995. Asthma and wheezing in the first six years of life. New England Journal of Medicine 332:133–8.
Mathers C & Penm R 1999. Health system costs of injury, poisoning and musculoskeletal disorders in Australia 1993–94. Cat. no. HWE 12. Canberra: AIHW.
Mathers C, Vos T & Stevenson C 1999. The burden of disease and injury in Australia. Cat. no. PHE 17. Canberra: AIHW.
Murray CJL & Lopez AD (eds) 1996a. The global burden of disease: a comprehensive assessment of mortality and disability from diseases, injuries and risk factors in 1990 and projected to 2020. Vol I. Cambridge, MA: Harvard School of Public Health on behalf of the World Health Organization & the World Bank.
Murray CJL & Lopez AD 1996b. Global health statistics: a compendium of incidence, prevalence and mortality estimates for over 200 conditions. Cambridge, MA: Harvard School of Public Health on behalf of the World Health Organization & the World Bank.
Oxfam Australia 2007. Close the gap. Solutions to the Indigenous health crisis facing Australia. A policy briefing paper from the National Aboriginal Community Controlled Health Organisation and Oxfam Australia. Fitzroy: Oxfam Australia.
Peat JK, Gray EJ, Mellis CM, Leeder SR & Woolcock AJ 1994. Differences in airway responsiveness between children and adults living in the same environment: an epidemiological study in two regions of New South Wales. European Respiratory Journal 7:1,805–13.
Peat JK, Haby M, Spijker J, Berry G & Woolcock AJ 1992. Prevalence of asthma in adults in Busselton, Western Australia. British Medical Journal (Clinical Research Edition) 305:1,326–9.
Peat JK, Toelle BG, Gray EJ, Haby MM, Belousova E, Mellis CM et al. 1995. Prevalence and severity of childhood asthma and allergic sensitisation in seven climatic regions of New South Wales. Medical Journal of Australia 163:22–6.
Stern DA, Morgan WJ, Halonen M, Wright AL & Martinez FD 2008. Wheezing and bronchial hyper-responsiveness in early childhood as predictors of newly diagnosed asthma in early adulthood: a longitudinal birth-cohort study. The Lancet 372:1058–64.
Stouthard MEA, Essink-Bot M, Bonsel GM, Garendregy JJ, Kramer PGN, van de Water HPA et al. 1997. Disability weights for diseases in the Netherlands. Rotterdam: Department of Public Health, Erasmus University.
Toelle BG, Ng K, Belousova E, Salome CM, Peat JK & Marks GB 2004. Prevalence of asthma and allergy in schoolchildren in Belmont, Australia: three cross sectional surveys over 20 years. British Medical Journal 328:386–7.
Toelle BG, Peat JK, Salome CM, Mellis CM & Woolcock AJ 1992. Toward a definition of asthma for epidemiology. American Review of Respiratory Disease 146:633–7.

28
Toelle BG, Peat JK, van den Berg R, Dermand J & Woolcock A 1997. Comparison of three definitions of asthma: a longitudinal perspective. Journal of Asthma 34:161–7.
Vos T, Barker B, Stanley L & Lopez AD 2007. The burden of disease and injury in Aboriginal and Torres Strait Islander peoples 2003. Brisbane: School of Population Health, The University of Queensland.
Vos T, Barker B, Begg S, Stanley L & Lopez A 2009. Burden of disease and injury in Aboriginal and Torres Strait Islander peoples: the Indigenous health gap. International Journal of Epidemiology 38:470–7.
WHO (World Health Organization) 2008. The global burden of disease 2004 update. Switzerland: WHO.

29
List of figures
Figure 3.1: Burden of disease, as years lived with disability (YLD) and years of life lost (YLL), attributable to major diseases or disease groups, Australia, 2003 ........................................ 10
Figure 3.2: Burden of disease, measured as years lived with disability (YLD) and years of life lost (YLL), attributable to asthma, by age group and sex, Australia 2003 ........................... 12
Figure 3.3: Burden of disease attributed to asthma, measured as disability-adjusted life years (DALYs) per 100,000 population, by age group and sex, Australia, 2003............................ 13
Figure 3.4: Burden of disease, measured as years lived with disability (YLD) and years of life lost (YLL), attributable to major diseases or disease groups, Indigenous Australians, 2003.......................................................................................................................... 17
Figure 3.5: Burden of disease, measured as years lived with disability (YLD) and years of life lost (YLL), attributable to asthma, by age group and sex, Indigenous Australians, 2003 ................................................................................................................................................ 19
List of tables
Table 2.1: Estimations of prevalent cases of asthma used in the Burden of Disease and Injury in Australia 2003 study ................................................................................................................. 4
Table 2.2: Some examples of disability weights from the Burden of Disease and Injury in Australia 2003 study...................................................................................................................... 5
Table 3.1: The 15 leading causes of disease burden in Australia, 2003 .................................................... 9 Table 3.2: Disability-adjusted life years by age and sex, asthma and all causes, Australia, 2003....... 11 Table 3.3: Prevalent and incident years lived with disability (YLD) due to asthma by age and
sex, Australia, 2003 ...................................................................................................................... 14 Table 3.4: The 15 leading causes of disease burden in Indigenous Australians and comparison
of ranking with total Australian population, by sex, 2003..................................................... 16 Table 3.5: Disability-adjusted life years by age and sex, asthma and all causes, Indigenous
Australians, 2003.......................................................................................................................... 18 Table 3.6: Prevalent and incident years lived with disability (YLD) due to asthma by age and
sex, Indigenous Australians, 2003 ............................................................................................. 20


