24
Equalization grants International Experience Indonesia’s Options Bert Hofman, World Bank with thanks to Jun Ma, Ehtisham Ahmad
| Date post: | 28-Dec-2015 |
| Category: |
Documents |
| Upload: | clepsa-victor |
| View: | 1 times |
| Download: | 0 times |
Equalization grants
International ExperienceIndonesia’s Options
Bert Hofman, World Bank
with thanks to Jun Ma, Ehtisham Ahmad
Equalization grants
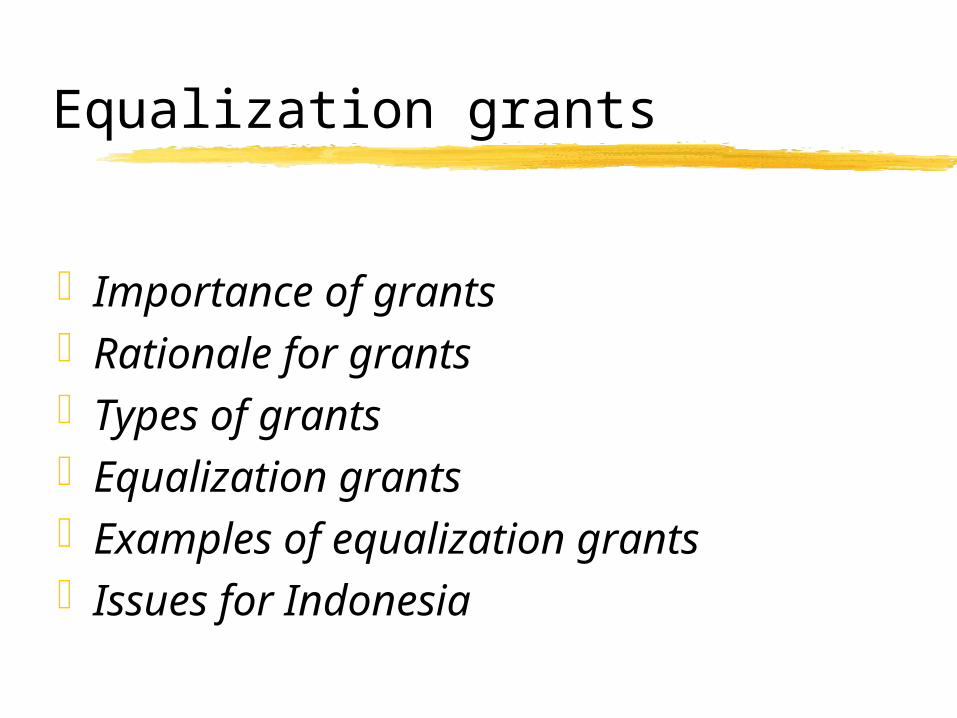
Importance of grantsRationale for grantsTypes of grantsEqualization grantsExamples of equalization grantsIssues for Indonesia
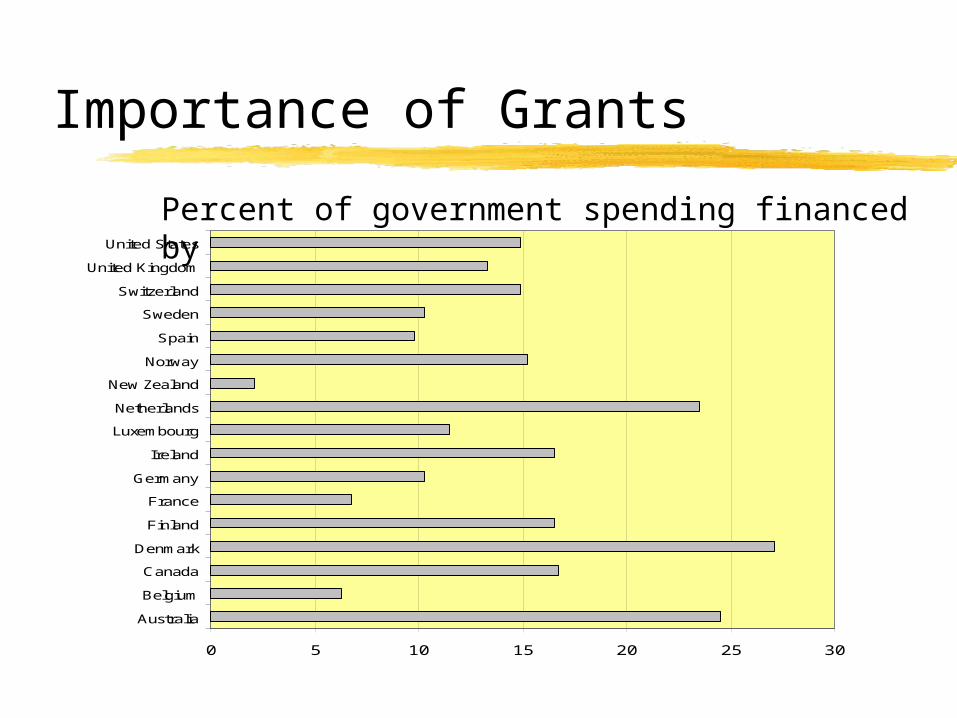
Importance of Grants
Percent of government spending financed by grants
0 5 10 15 20 25 30
Australia
Belgium
Canada
Denmark
Finland
France
Germany
Ireland
Luxembourg
Netherlands
New Zealand
Norway
Spain
Sweden
Switzerland
United Kingdom
United States
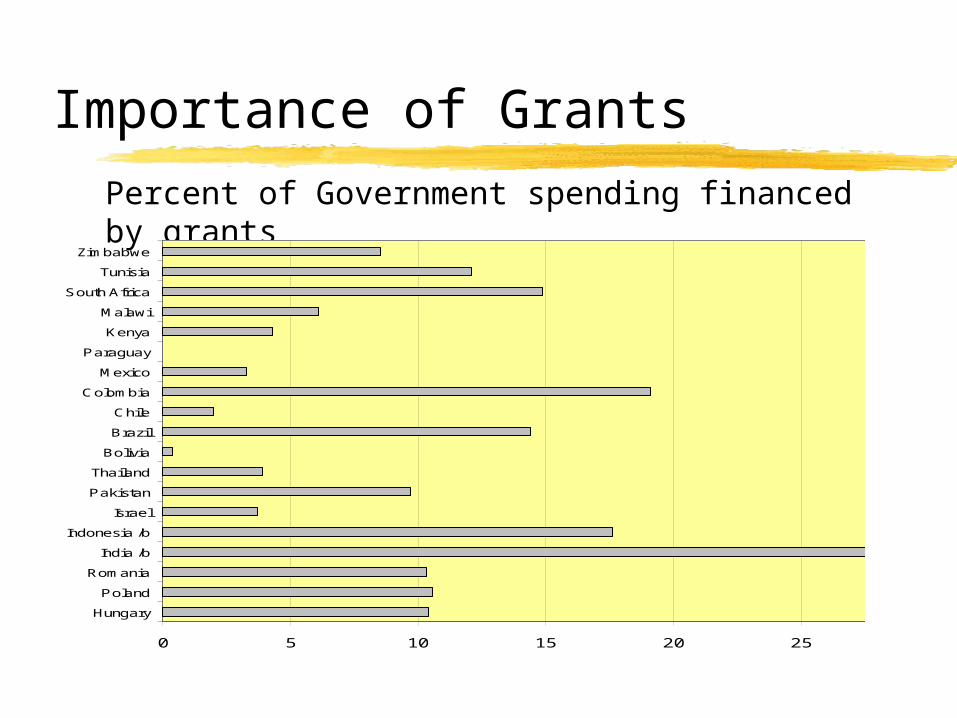
Importance of GrantsPercent of Government spending financed by grants
0 5 10 15 20 25 30
Hungary
Poland
Romania
India /b
Indonesia /b
Israel
Pakistan
Thailand
Bolivia
Brazil
Chile
Colombia
Mexico
Paraguay
Kenya
Malawi
South Africa
Tunisia
Zimbabwe
Importance of Grants
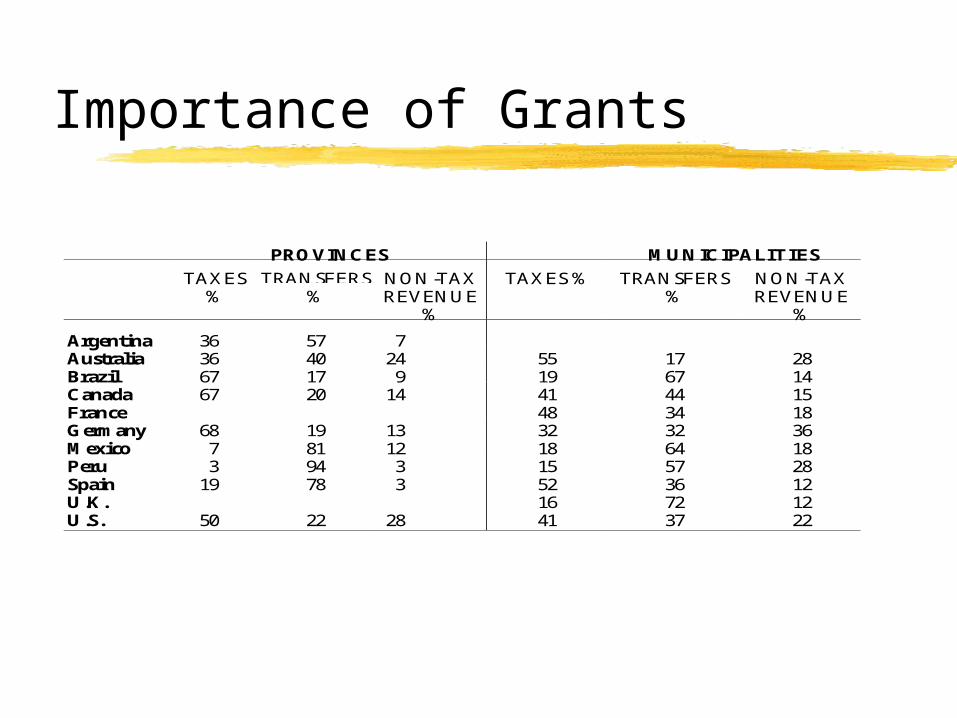
PROVINCES MUNICIPALITIES
TAXES%
TRANSFERS%
NON-TAXREVENUE
%
TAXES % TRANSFERS%
NON-TAXREVENUE
%
Argentina 36 57 7Australia 36 40 24 55 17 28Brazil 67 17 9 19 67 14Canada 67 20 14 41 44 15France 48 34 18Germany 68 19 13 32 32 36Mexico 7 81 12 18 64 18Peru 3 94 3 15 57 28Spain 19 78 3 52 36 12U.K. 16 72 12U.S. 50 22 28 41 37 22
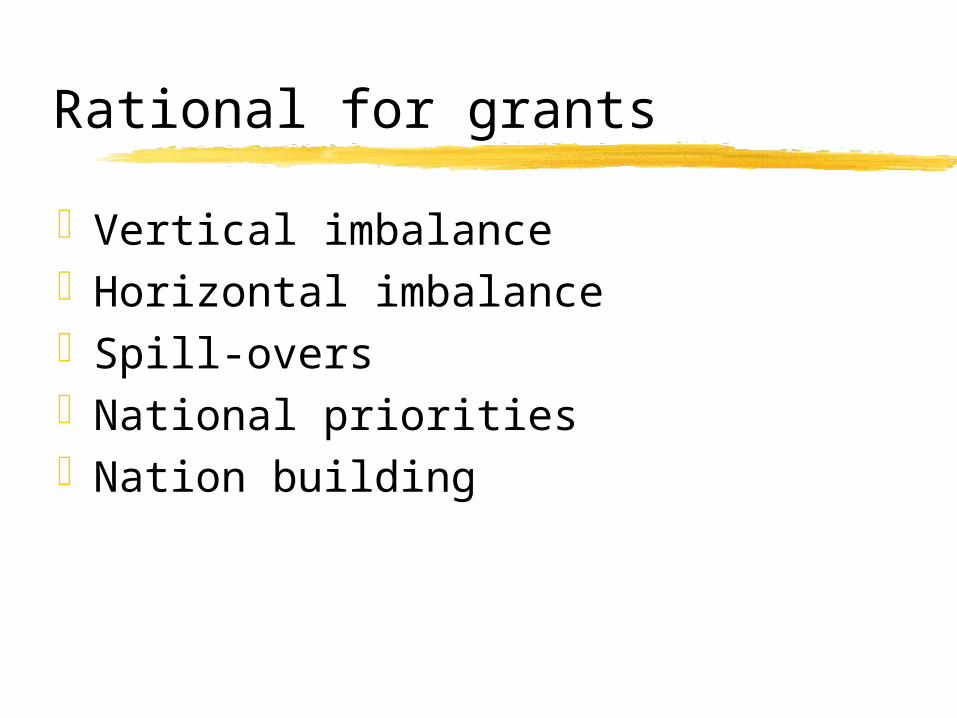
Rational for grants
Vertical imbalanceHorizontal imbalanceSpill-oversNational prioritiesNation building
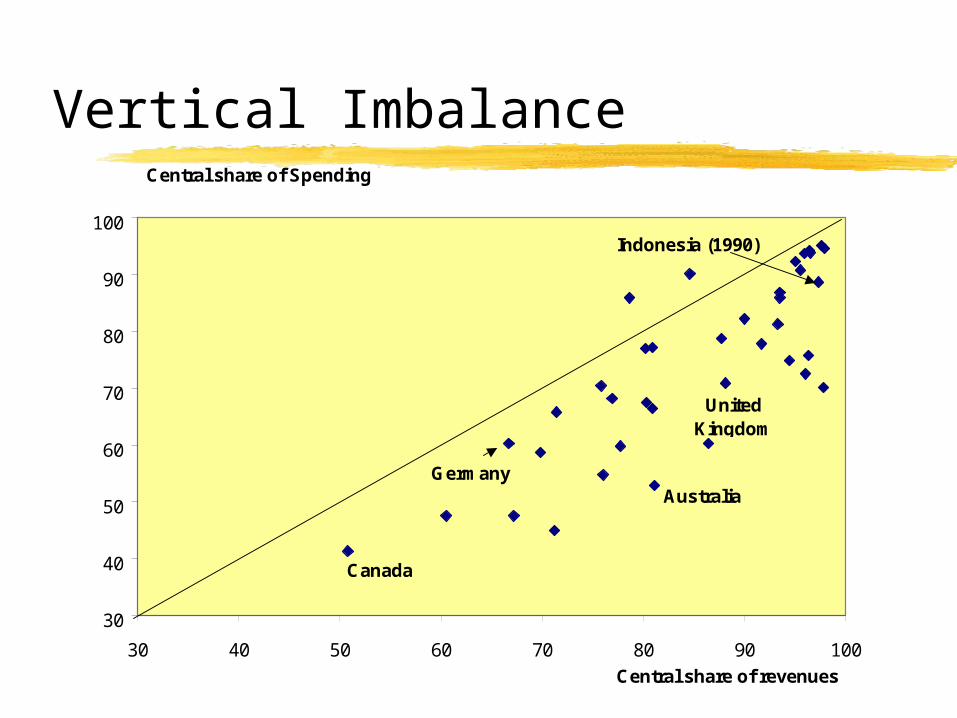
Vertical Imbalance
30
40
50
60
70
80
90
100
30 40 50 60 70 80 90 100
Australia
United Kingdom
Canada
Germany
Indonesia (1990)
Central share of Spending
Central share of revenues
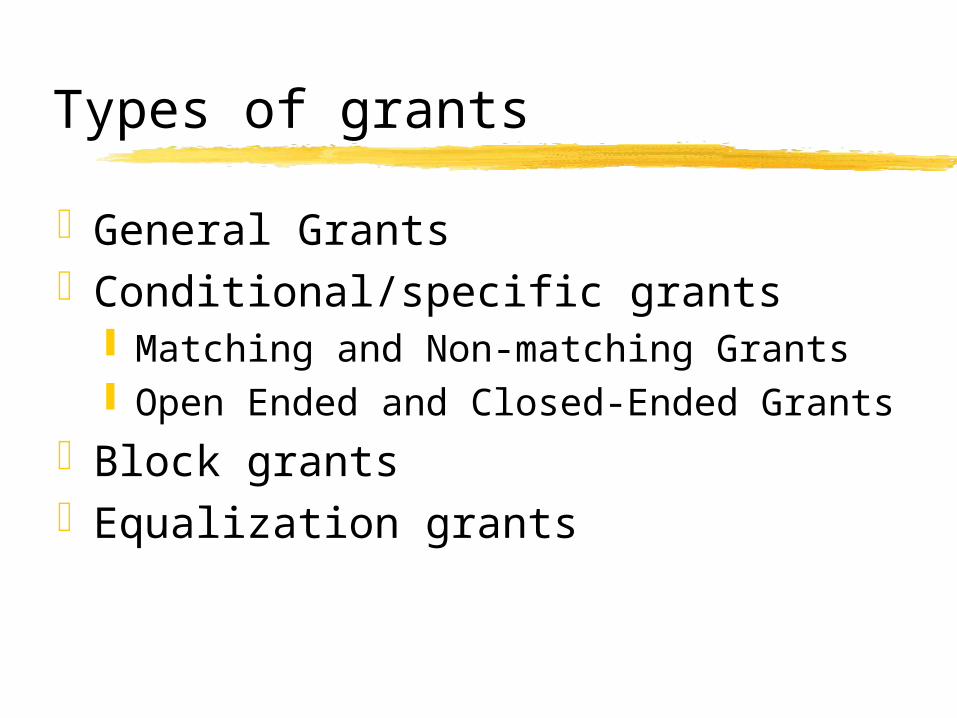
Types of grants
General GrantsConditional/specific grants
Matching and Non-matching Grants Open Ended and Closed-Ended Grants
Block grantsEqualization grants
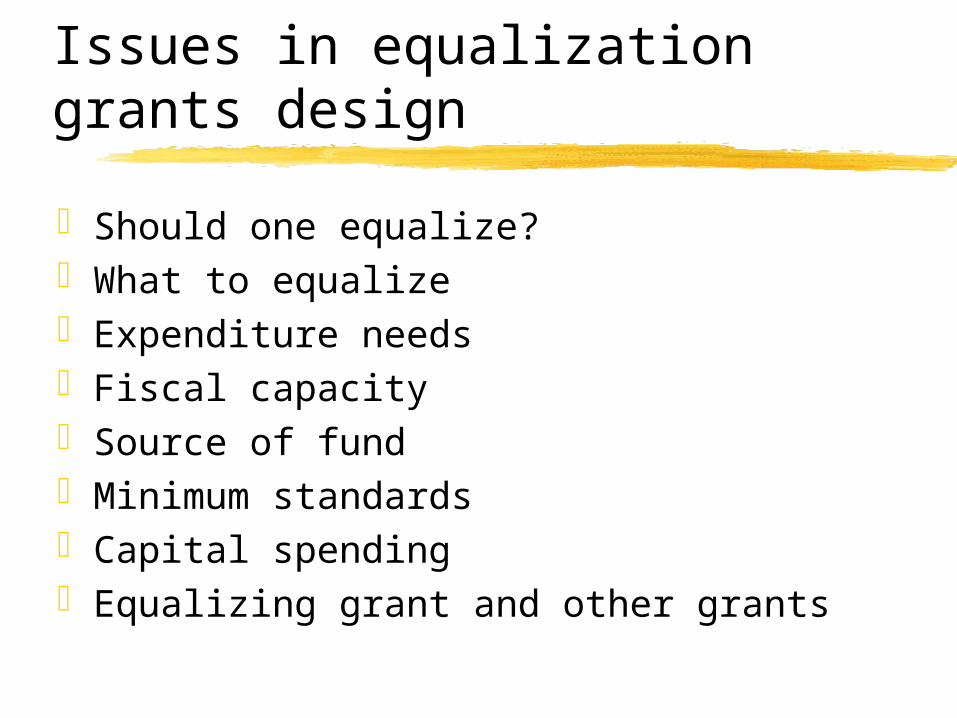
Issues in equalization grants design
Should one equalize?What to equalizeExpenditure needsFiscal capacitySource of fundMinimum standardsCapital spendingEqualizing grant and other grants
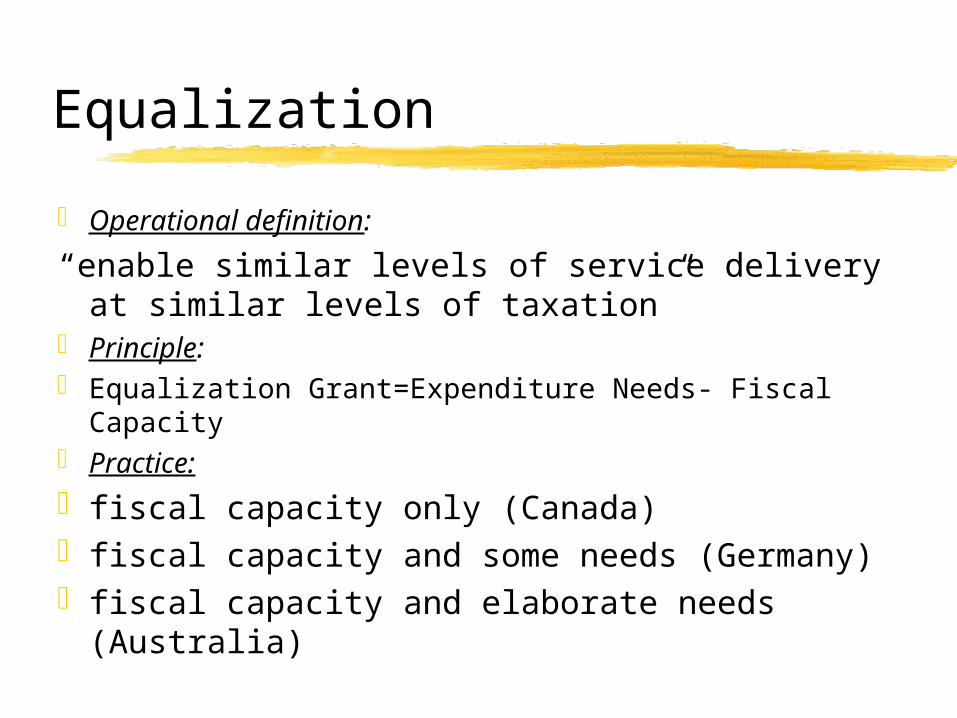
Equalization
Operational definition:
“enable similar levels of service delivery at similar levels of taxation”
Principle: Equalization Grant=Expenditure Needs- Fiscal
Capacity Practice:
fiscal capacity only (Canada)fiscal capacity and some needs (Germany)fiscal capacity and elaborate needs (Australia)
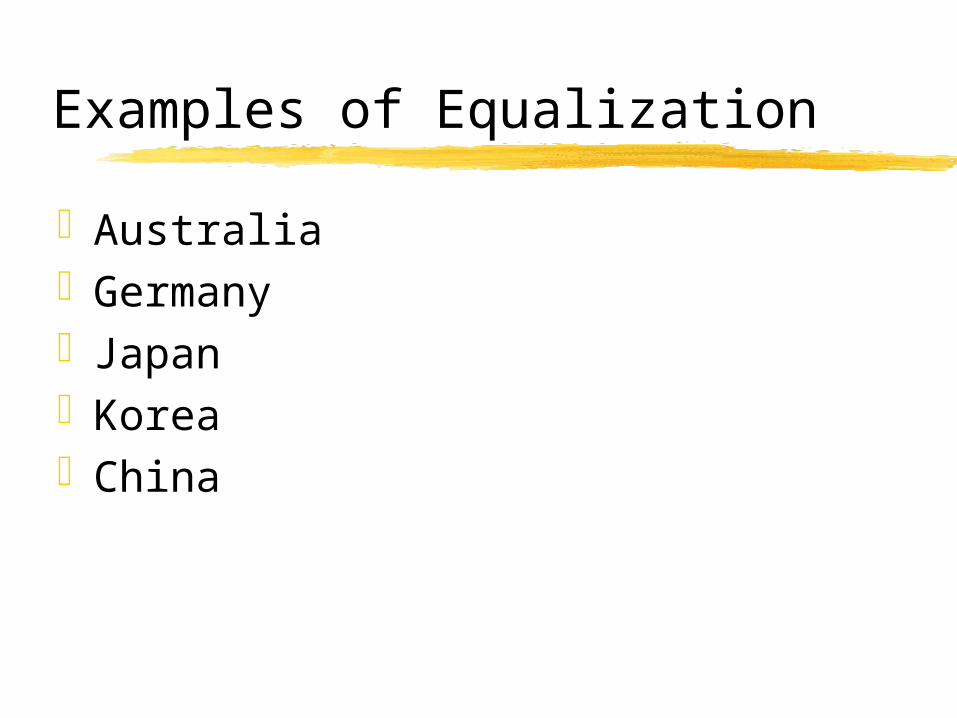
Examples of Equalization
AustraliaGermanyJapanKoreaChina
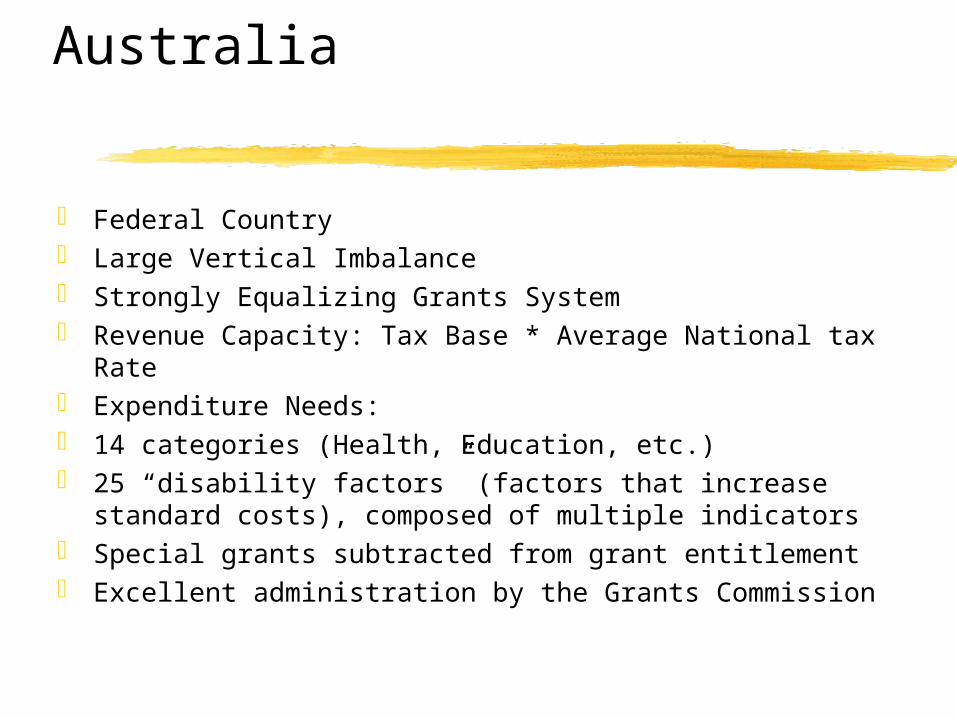
Australia
Federal Country Large Vertical Imbalance Strongly Equalizing Grants System Revenue Capacity: Tax Base * Average National tax Rate Expenditure Needs: 14 categories (Health, Education, etc.) 25 “disability factors” (factors that increase standard
costs), composed of multiple indicators Special grants subtracted from grant entitlement Excellent administration by the Grants Commission

Germany
Federal country Substantial tax sharing VAT redistributed per capita--provides most of the equalization Fiscal Equalization through Finanzausgleich (Financial Settlement) Principle: equalize needs-adjusted fiscal capacity Needs: “special burdens” for city states Every state obtains at least 95 percent of average revenues “Rich states” are taxed--discourages tax effort
Tax capacity over 110 percent of average tax with 80 percent Eastern, poor states receive additional grants from central
government

Japan
Unitary countryLarge vertical imbalanceEqualization through “Local Allocation
Tax”--both provinces and municipalitiesConsiders fiscal capacity and needsNeeds based on functions assigned to
government

Japan Cont.
Basic need = modification coefficient * unit cost
modification coefficients examples:school typessize of regionpopulation density in regioncold areaurbanization of regionMOF Administers

Korea
Unitary country Similar to Japan’s system Fiscal capacity and needs “Fiscal scarcity= standard need - standard
revenue” Needs = standard fiscal need + supplemental
need 29 standard factors Separate education transfer Ministry of Home Affairs Administers

China
See Mr. Zhang’s speech
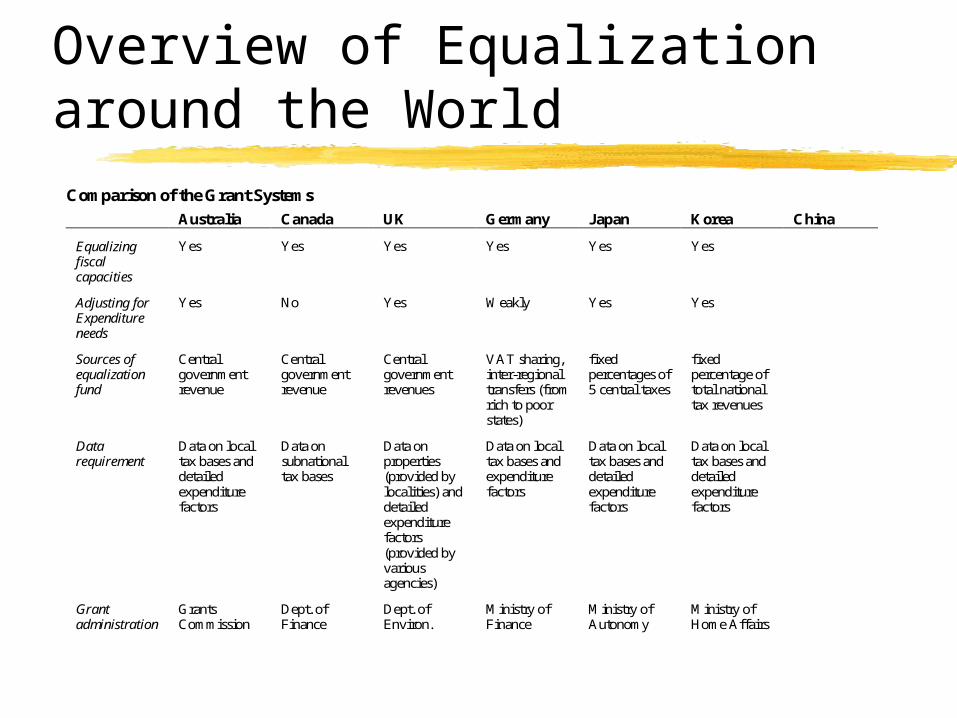
Overview of Equalization around the World
Comparison of the Grant Systems
Australia Canada UK Germany Japan Korea China
Equalizingfiscalcapacities
Yes Yes Yes Yes Yes Yes
Adjusting forExpenditureneeds
Yes No Yes Weakly Yes Yes
Sources ofequalizationfund
Centralgovernmentrevenue
Centralgovernmentrevenue
Centralgovernmentrevenues
VAT sharing,inter-regionaltransfers (fromrich to poorstates)
fixedpercentages of5 central taxes
fixedpercentage oftotal nationaltax revenues
Datarequirement
Data on localtax bases anddetailedexpenditurefactors
Data onsubnationaltax bases
Data onproperties(provided bylocalities) anddetailedexpenditurefactors(provided byvariousagencies)
Data on localtax bases andexpenditurefactors
Data on localtax bases anddetailedexpenditurefactors
Data on localtax bases anddetailedexpenditurefactors
Grantadministration
GrantsCommission
Dept. ofFinance
Dept. ofEnviron.
Ministry ofFinance
Ministry ofAutonomy
Ministry ofHome Affairs
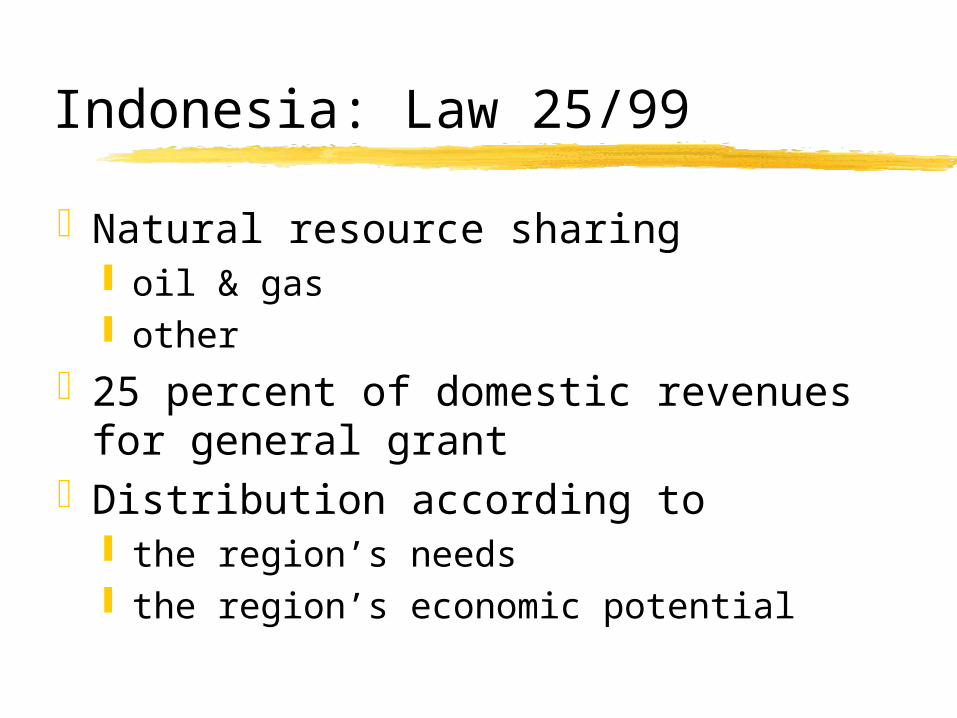
Indonesia: Law 25/99
Natural resource sharing oil & gas other
25 percent of domestic revenues for general grant
Distribution according to the region’s needs the region’s economic potential
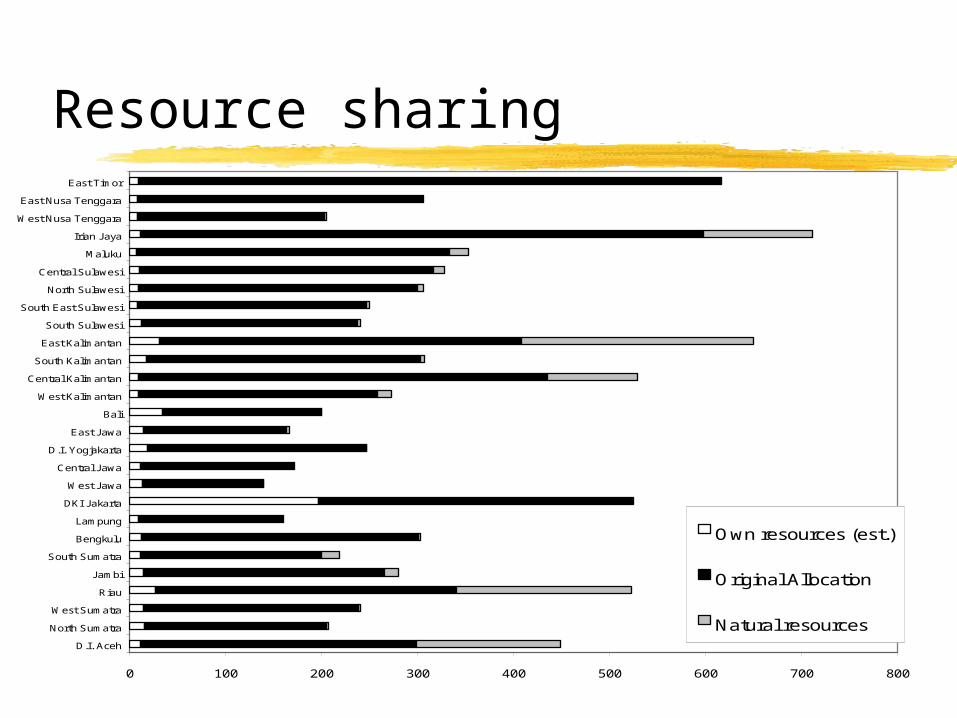
Resource sharing
0 100 200 300 400 500 600 700 800
D.I. Aceh
North Sumatra
West Sumatra
Riau
Jambi
South Sumatra
Bengkulu
Lampung
DKI Jakarta
West Jawa
Central Jawa
D.I. Yogjakarta
East Jawa
Bali
West Kalimantan
Central Kalimantan
South Kalimantan
East Kalimantan
South Sulawesi
South East Sulawesi
North Sulawesi
Central Sulawesi
Maluku
Irian Jaya
West Nusa Tenggara
East Nusa Tenggara
East Timor
Own resources (est.)
Original Allocation
Natural resources

Resource Sharing
0
100
200
300
400
500
600
700
800
0 1000 2000 3000 4000 5000 6000 7000 8000 9000 10000
Transfers (000 Rupiah per capita)
Non-Oil GDP Per Capita 9Rp.'000
Before Natural Resource Sharing
After Natural Resource Sharing
De-equalizing
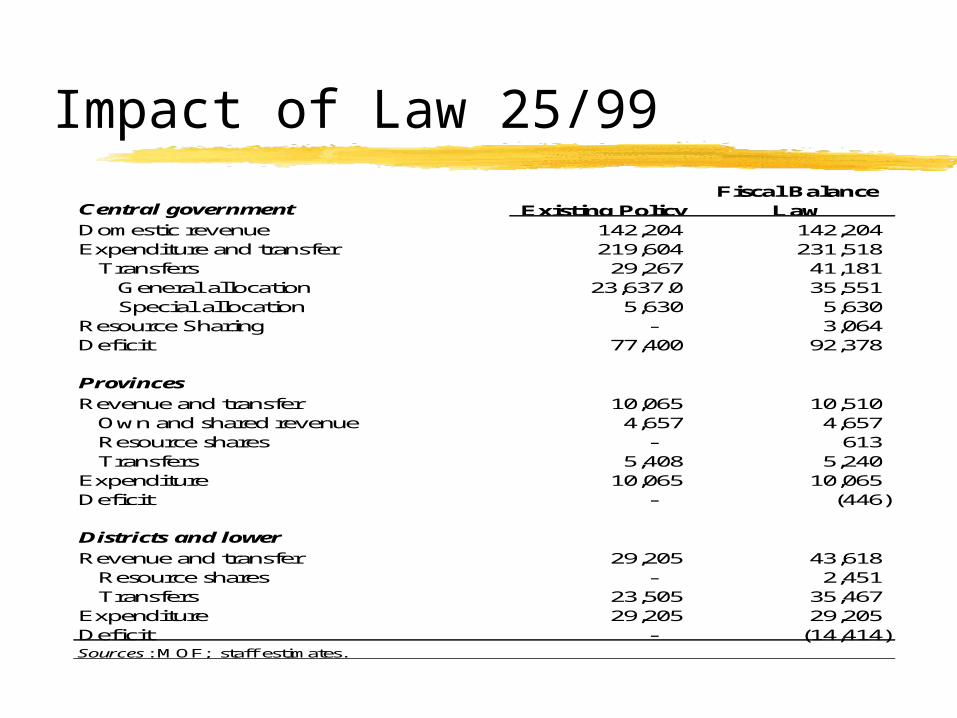
Impact of Law 25/99
Central government
Domestic revenue 142,204 142,204 Expenditure and transfer 219,604 231,518 Transfers 29,267 41,181 General allocation 23,637.0 35,551 Special allocation 5,630 5,630 Resource Sharing - 3,064 Deficit 77,400 92,378
Provinces
Revenue and transfer 10,065 10,510 Own and shared revenue 4,657 4,657 Resource shares - 613 Transfers 5,408 5,240 Expenditure 10,065 10,065 Deficit - (446)
Districts and lower
Revenue and transfer 29,205 43,618 Resource shares - 2,451 Transfers 23,505 35,467
Expenditure 29,205 29,205 Deficit - (14,414) Sources : MOF; staff estimates.
Fiscal Balance LawExisting Policy
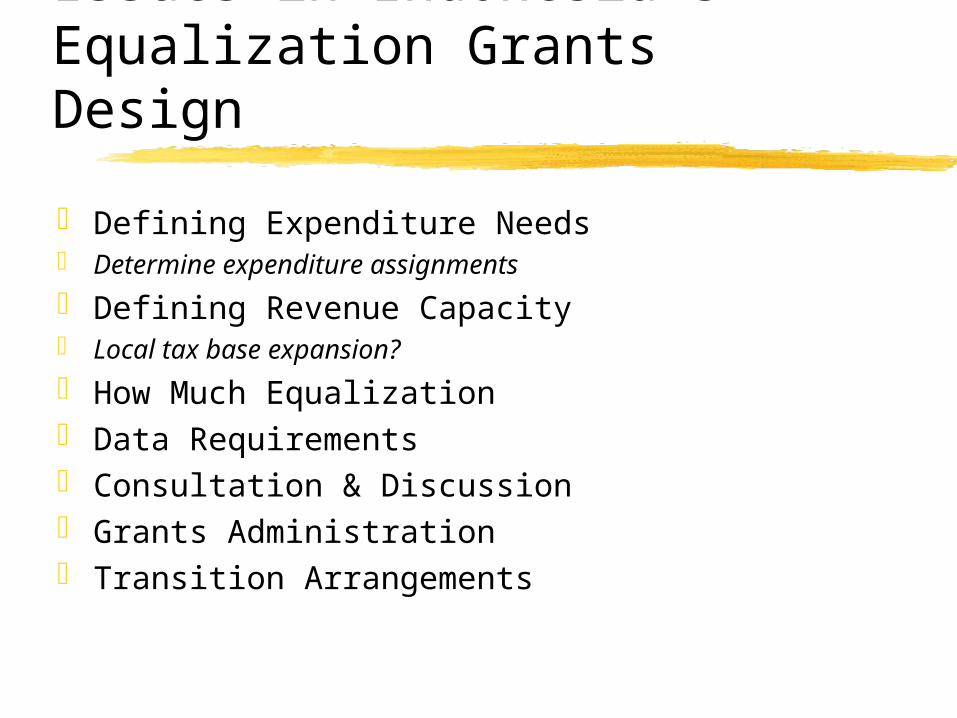
Issues in Indonesia’s Equalization Grants Design
Defining Expenditure Needs Determine expenditure assignments
Defining Revenue Capacity Local tax base expansion?
How Much Equalization Data Requirements Consultation & Discussion Grants Administration Transition Arrangements
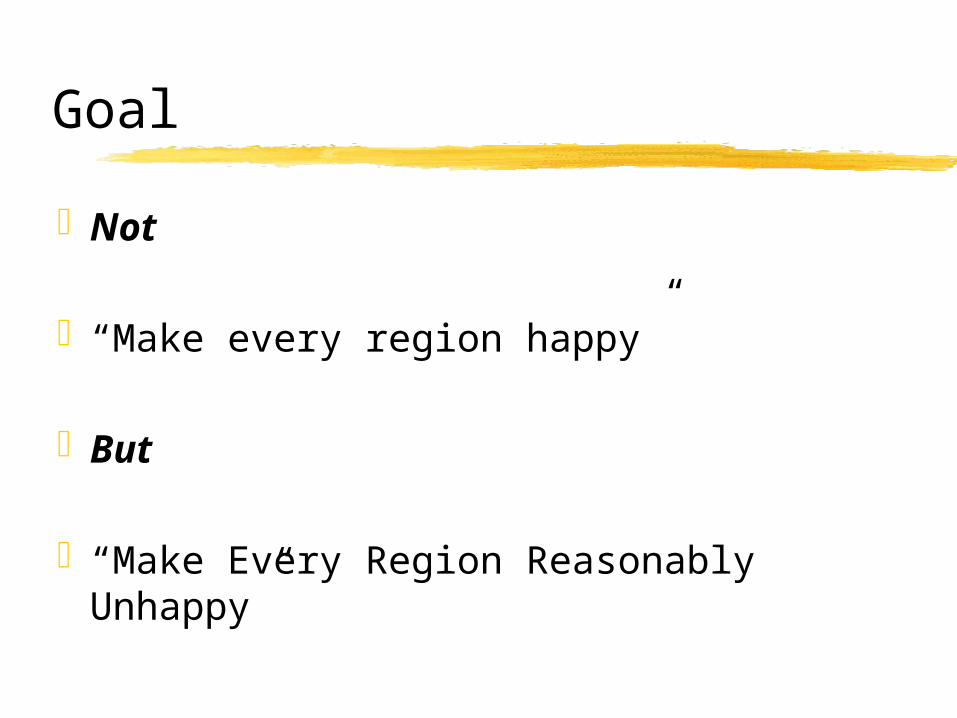
Goal
Not
“Make every region happy”
But
“Make Every Region Reasonably Unhappy”


