Page 1
No. 14November 2017 -
www.aeade.net
Núñez De Vela E 3-13 and Atahualpa
Torre del Puente Building, Floor 10.
Phone: 02 226 9052 / 226 9056 / 226 4925 / 226 4927
Quito - Ecuador
AUTOMOTIVESECTOR
in figures
Automotive Sector in Figures
is a publication exclusively
for AEADE affiliates.
If you would like to receive complete information,
contact us at [email protected] or 02-2269052
SIGN UP!
Page 2
Alberto Reza, Technical Coordinator Mauricio Larco, Market AnalystMelany Corella, Technical Assistant
Genaro Baldeón, Executive President(Chief Executive Officer) CEO
Óscar Calahorrano, Director of Operations(Chief Operations Officer) COO
www.aeade.netNúñez de Vela E3-13 and Atahualpa
Torre del Puente Building, Floor 10Phone: 226 9052 / 226 9056 / 226 4925 / 226 4927
@AEADE.EC@AeadeEc
Published on November 13th 2017
Board members
María Grazzia Pérez, Designer
Page 3
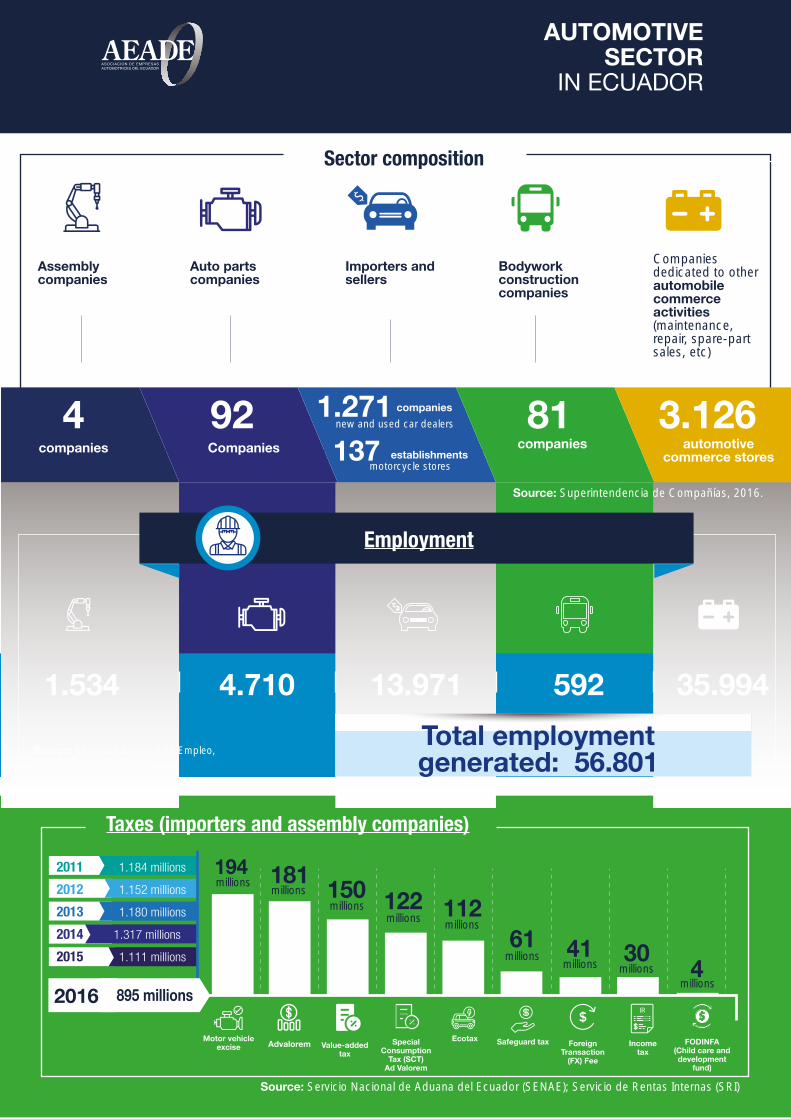
Sector composition
Companies dedicated to other automobile commerce activities (maintenance, repair, spare-part sales, etc)
Bodywork construction companies
Importers and sellers
Auto parts companies
Assembly companies
4 92 1.271137
81 3.126companies Companies
new and used car dealers
motorcycle stores
companies automotive commerce stores
companies
establishments
Employment
AUTOMOTIVESECTOR
IN ECUADOR
1.534 4.710 13.971 592 35.994
Source: Superintendencia de Compañías, 2016.
Source: Encuesta Nacional de Empleo,Desempleo y Subempleo
Source: Servicio Nacional de Aduana del Ecuador (SENAE); Servicio de Rentas Internas (SRI)
Total employmentgenerated: 56.801
1.184 millions
1.152 millions
1.180 millions
1.317 millions
1.111 millions
Taxes (importers and assembly companies)
Value-addedtax
AdvaloremMotor vehicle
exciseEcotaxSpecial
ConsumptionTax (SCT)
Ad Valorem
ForeignTransaction
(FX) Fee
Incometax
Safeguard tax FODINFA(Child care anddevelopment
fund)
150181194
112122
41614
30
2016 895 millions
20112012201320142015
millionsmillions
millionsmillions millions
millionsmillions millions
millions
Page 4
Source: Banco Central del Ecuador, 2017
Source: Superintendencia de Bancos, 2017
Source: Servicio Nacional de Aduana (SENAE); Cámara de la Industria Automotriz Ecuatoriana (CINAE),Asociación de Empresas Automotrices del Ecuador (AEADE), 2017.
Macroeconomic figures
Total trade balance (jan - aug 2017):
Average oil price WTI (jan - aug 2017):
Annual inflation (aug 2017):
Annual GDP variation (jan - jun 2017 / 2016):
Credit (january - september 2017)
Regular consumption: Priority consumption:
Light vehicle* and commercial vehicle** market
Imports: Production: Sales:(January - September 2017) (January - September 2017) (January - October 2017)
Exports:(January - September 2017)
*Light vehicles: automobiles, pickups, SUV**Commercial vehicles: VAN, trucks, buses
Automotive sector in figures - No. 14
Ecuador´s summary
$346 million USD - FOB
$49,37
0,28%
2,6%
$224 million USD $1.792 million USD
45.638units
27.738units
355units
2
81.101units
Page 5
Automotive sector in figures - No. 14
Vehicle importsMonthly vehicle imports (units)
Units
jan
feb
mar apr
may jun jul
aug
sep
oct
nov
dec
jan
feb
mar apr
may jun jul
aug
sep
jan
feb
mar apr
may jun jul
aug
sep
oct
nov
dec
2015 2016 2017
7.40
2
4.76
5
4.87
2
3.41
4
1.92
2
2.07
0
1.57
1 2.55
4
1.81
5
1.71
1
1.47
6 2.34
4 3.28
5
2.78
3
2.68
57.
345
787
702 88
7
4.58
7
4.94
21.
736
1.22
24.
464
923
4.04
0
3.62
5
3.53
8 4.79
2
6.57
7
5.66
5
6.4
66
6.3
48
35.916 31.761
0
1.000
2.000
3.000
4.000
5.000
6.000
7.000
8.000SE
PTEM
BER
Historical vehicle imports (units)2012 - 2017 (september)
5.212
4.873
7.033
1.815
2.685
6.348 2017
2016
2015
2014
2013
2012
0 1.000 2.000 3.000 4.000 5.000 6.000 7.000 8.000
Source: Servicio Nacional de Aduana delEcuador (SENAE), 2017.
Vehicle production*
2015 2016 2017
Units
Monthly vehicle production (units)
jan
feb
mar apr
may jun jul
aug
sep
oct
nov
dec
jan
feb
mar apr
may jun jul
aug
sep
jan
feb
mar apr
may jun jul
aug
sep
oct
nov
dec
5.42
2
5.12
7
4,62
5
4.10
3
3.84
9 4.36
7
3.57
3
4.11
2
4.46
3
4.23
2
3.43
3
1.62
0
2.95
2
1.06
9 1.80
5
1.83
2
2.01
7
2.48
1
2.35
4
2.38
8
2.28
5
2.73
8
2.63
9
2.39
1
2.55
7
3.01
4
2.74
5
3.04
3
2.22
6
3.30
9
3.42
1
3.5
08
3.7
50
48.926
26.786
1.000
2.000
3.000
4.000
5.000
6.000
2012 - 2017 (september) Historical vehicle production (units)
SEPT
EMBE
R
0 1.000 2.000 3.000 4.000 5.000 6.000 7.000 8.000
3.750
2.388
4.463
5.973
4.630
6.963 2012
2013
2014
2015
2016
2017
3
*Does not include the production ofCIAUTO assembly company.
Source: Cámara de la Industria AutomotrizEcuatoriana (CINAE), 2017.
Page 6
Automotive sector in figures - No. 14
Vehicle exportsUn
its
Monthly vehicle exports (units)
jan
feb
apr
jun
aug
mar
may ju
l
sep
oct
nov
dec
jan
feb
apr
jun
aug
mar
may ju
l
sep
jan
feb
apr
jun
aug
mar
may ju
l
sep
oct
nov
dec
75
340 405
325
460
255
76
260 275
105
74
45 45
15 27 3025
90 135
75
45
- - --
74 105
210
179
120
340
119
16
3.274 716
0
100
200
300
400
500
SEPT
EMBE
R
2012 - 2017 (september) Historical vehicle exports (units)
2012
2013
2014
2015
2016
2017
45
75
120
778
293
2.178
0 500 1.000 1.500 2.000 2.500 3.000 3.500
3.478
Source: Cámara de la Industria AutomotrizEcuatoriana (CINAE), 2017.
2015 2016 2017
Vehicle sales
2015 2016 2017
Monthly vehicle sales (units)
Units
jan
feb
apr
jun
aug
mar
may ju
l
sep
oct
nov
dec
jan
feb
apr
jun
aug
mar
may ju
l
sep
oct
jan
feb
apr
jun
aug
mar
may ju
l
sep
oct
nov
dec
6.68
6
5.97
2
5.91
6
7.50
5
7.60
3
7.54
3
9.06
6 9.51
2
9.38
2
9.24
1
9.36
1
8.27
8
7.56
2
9.36
7
7.78
3
6.94
5
6.75
3
6.56
9
6.13
6
5.88
9
5.61
8
5.07
9
5.33
0
3.82
1
4.08
9
4.31
3 4.85
8
6.07
3
4.28
8 5.25
0 5.71
1
5.74
1 6.16
5
6.56
0
81.309 63.555
4.000
6.000
8.000
10.000
Historical vehicle sales (units)2012 - 2017 (october)
OCTO
BER
2012
2013
2014
2015
2016
2017
0 2.000 4.000 6.000 8.000 10.000 12.000
9.361
6.165
5.618
11.121
9.399
9.114Source: Asociación de Empresas Automotrices delEcuador (AEADE), 2017.Autoplus, 2017.
4
Page 7
Automotive sector in figures - No. 14
Vehicle sales
*Light vehicles: automobiles, pickups, SUV **Commercial vehicles: VAN, trucks, buses
light vehicles* 2017 (Jan - Oct)Market share by province (units),
commercial vehicles** 2017 (Jan - Oct)Market share by province (units),
Others
Imbabura
Manabí
Tungurahua
Azuay
Guayas
Pichincha
40%
28%
6%
6%
5%
12%
3%
Others
El Oro
Manabí
Azuay
Tungurahua
Guayas
Pichincha
34%
28%
10%
9%
5%
11%
3%
Source: Asociación de Empresas Automotrices del Ecuador (AEADE), 2017Autoplus, 2017
*Light vehicles: automobiles, pickups, SUV **Commercial vehicles: VAN, trucks, buses
Market share by brand (units),light vehicles* 2017 (Jan - Oct)
Market share by brand (units),commercial vehicles** 2017 (Jan - Oct)
Other BrandsMazda
Renault
Ford
Nissan
Toyota
Great Wall
Hyundai
Kia
Chevrolet
42%
18%
9%
7%
5%
3%
2%2% 8%
4%
Other Brands
Foton
Mercedes Benz
DFSK
JAC
Chery
Hyundai
Kia Chevrolet
Hino32%
23%6%
6%
4%
3%
3%
3%
17%
3%
2015 2016 2017Source: Asociación de Empresas Automotrices del Ecuador (AEADE), 2017Autoplus, 2017
Market share. Imported vs assembled (units)
imported
assembled
jan
feb
apr
jun
aug
mar
may ju
l
sep
oct
nov
dec
jan
feb
apr
jun
aug
mar
may ju
l
sep
oct
nov
dec
jan
feb
apr
jun
aug
mar
may ju
l
sep
oct
Perc
enta
ge o
f par
ticip
atio
n
0,3
0,4
0,5
0,6
51,8% 54,0% 55,4%
50,1%
57,4%
53,1%
53,5%
53,2%
51,4%
49,1%
50,2%
54,1% 56,4%
55,8%
56,9%
56,4% 57,0% 58,2%
52,8%
49,1% 50,9%
51,2%
56,9%
50.7%55,9%
52,6%
52,4% 53,1%
60,9% 61,8% 63,4% 66,1% 67,6%
65,1%
42,6% 46
,9%
45,9%
43,6%
44,2%
43,1%
43,6% 43%
41,8%47,2% 49,1%
48,8%
43,1%
49,3%
44,1%
50,9%
49,8%
49,9%
50,9%
46,5%
46,8% 48,6%
48,2%
46,0%
44,6% 47,4%
47,6%
46,9%
39,1%
38,2%
36,6%
33,9% 34,9%
32,4%
5
Page 8
Automotive sector in figures - No. 14
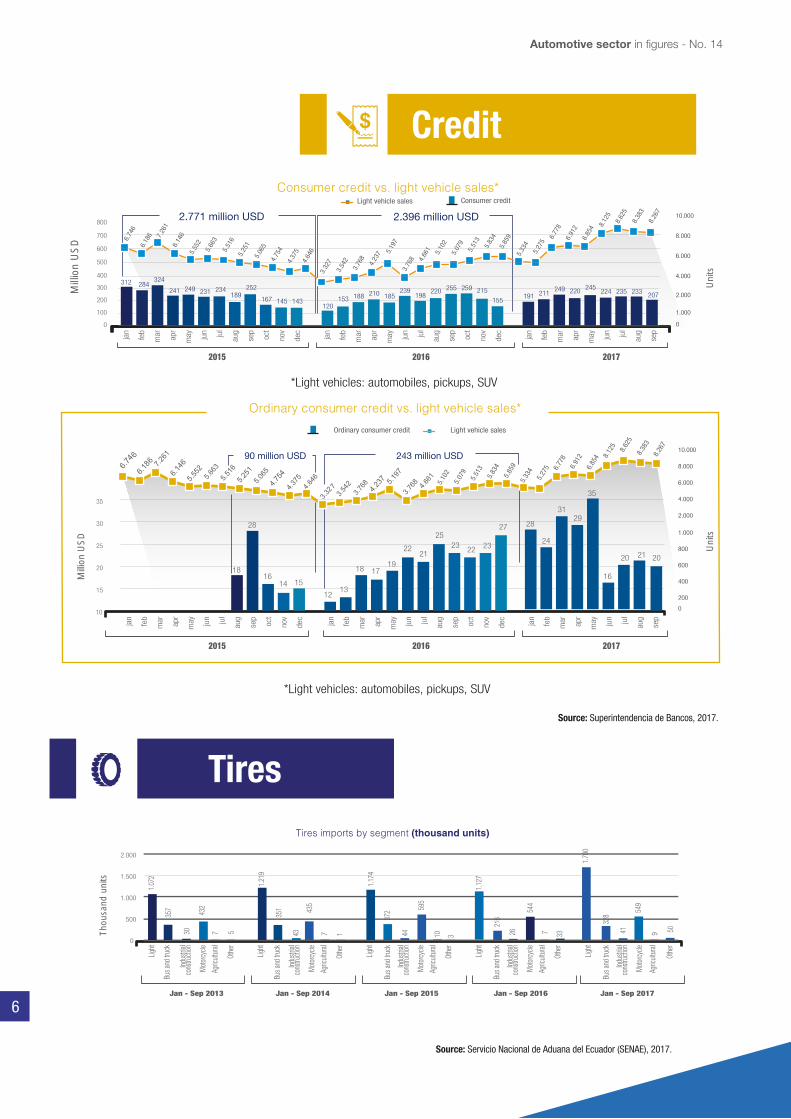
Credit
Uni
ts
Ordinary consumer credit vs. light vehicle sales*
*Light vehicles: automobiles, pickups, SUV
Light vehicle salesOrdinary consumer credit
*Light vehicles: automobiles, pickups, SUV
2015 2016 2017
2015 2016 2017
Consumer credit vs. light vehicle sales*
Mill
ion
US
D
Uni
ts
Light vehicle sales Consumer credit
Milli
on U
SD
jan
feb
mar apr
may jun jul
aug
sep
oct
nov
dec
jan
feb
mar apr
may jun jul
aug
sep
jan
feb
mar apr
may jun jul
aug
sep
oct
nov
dec
jan
feb
mar apr
may jun jul
aug
sep
oct
nov
dec
jan
feb
mar apr
may jun jul
aug
sep
jan
feb
mar apr
may jun jul
aug
sep
oct
nov
dec
400
500
600
700
800
312 284324
241 249 231 234189
252
167 145 143120
153 188 210 185239
198220 255 259 215
155191 211
249 220 245224 235 233 207
2.771 million USD 2.396 million USD
4.000
6.000
8.000
10.000
6.74
6
6.18
6 7.26
16.
146
5.55
25.
663
5.51
6 5.
251
5.06
5 4.
754
4.37
5
3.32
7 3.
542
3.76
8 4.
237 5
.197
3
.768
4
.661
5
.102
5
.079
5
.513
5
.834
5
.859
5.
334
5.27
5 6.
778
6.91
2 6.
854 8.
125
8.62
5 8
.383
8.2
67
4.64
6
2.000
1.000
00
100
200
300
18
28
1614 15
1213
18 1719
2221
2523
22 23
27 28
24
3129
16
20 20 21
35
243 million USD90 million USD
10
15
20
25
30
35
5.10
25.
079
5.51
35.
834
5.85
9
5.27
5 6.77
86.
912
5.33
4 6.85
4 8.12
58.
625
8.3
83 8
.267
2.000
4.000
6.000
8.000
10.000
1.000
800
600
400
200
0
Tires
Jan - Sep 2013 Jan - Sep 2014 Jan - Sep 2015 Jan - Sep 2016 Jan - Sep 2017
Tires imports by segment (thousand units)
Thou
sand
uni
ts
Othe
r
Light
Bus a
nd tr
uck
Indus
trial
cons
truct
ion
Mot
orcy
cle
Agric
ultur
al
Othe
r
Light
Bus a
nd tr
uck
Indus
trial
cons
truct
ion
Mot
orcy
cle
Agric
ultur
al
Othe
r
Light
Bus a
nd tr
uck
Indus
trial
cons
truct
ion
Mot
orcy
cle
Agric
ultur
al
Othe
r
Light
Bus a
nd tr
uck
Indus
trial
cons
truct
ion
Mot
orcy
cle
Agric
ultur
al
Othe
r
Light
Bus a
nd tr
uck
Indus
trial
cons
truct
ion
Mot
orcy
cle
Agric
ultur
al
1.07
2
357
30
432
57
1.21
9
351
43
435
17
372
1.17
4
44
595
310
1.12
7
216
26
544
337
1.70
0
328
41
549
509
0
500
1.000
1.500
2.000
6
Source: Superintendencia de Bancos, 2017.
Source: Servicio Nacional de Aduana del Ecuador (SENAE), 2017.
Page 9
Automotive sector in figures - No. 14
OCTO
BER
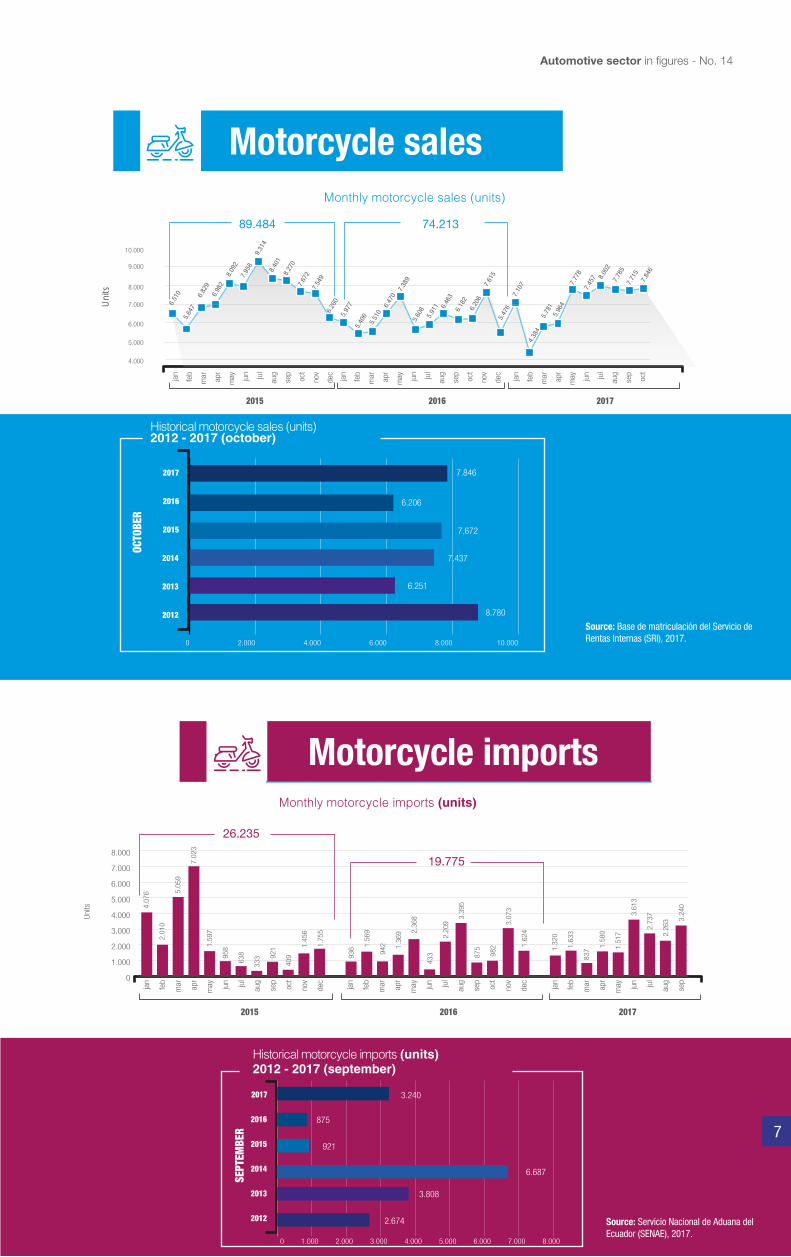
Motorcycle sales
Historical motorcycle sales (units)2012 - 2017 (october)
jan
feb
mar apr
may jun jul
aug
sep
oct
nov
dec
jan
feb
mar apr
may jun jul
aug
sep
oct
jan
feb
mar apr
may jun jul
aug
sep
oct
nov
dec
2015 2016 2017
Uni
ts
Monthly motorcycle sales (units)
74.213
6.51
05.
647
6.82
96.
982
8.09
27.
958
9.31
48.
401
8.27
07.
672
7.54
96.
260
5.97
75.
406
5.51
06.
470
7.38
95.
608
5.91
1 6.46
36.
182
6.20
67.
615
5.47
67.
107
4.38
45.
781
5.96
4
7.77
87.
457 8.
002
7.78
5 7
.715
7
.846
89.484
4.000
6.000
8.000
10.000
9.000
7.000
5.000
2016
2017
2015
2014
2013
2012
0 2.000 4.000 6.000 8.000 10.000
7.846
6.206
7.672
7.437
6.251
8.780
Motos: matriculaciónMotorcycle imports
2015 2016 2017
Monthly motorcycle imports (units)
Units
jan
feb
mar apr
may jun jul
aug
sep
oct
nov
dec
jan
feb
mar apr
may jun jul
aug
sep
jan
feb
mar apr
may jun jul
aug
sep
oct
nov
dec
4.07
6
2.01
0
5.05
9
7.02
3
1.59
7
958
638
333 92
1
409
1.45
6
1.75
5
936 1.
569
942 1.
369 2.
368
433
2.20
9
3.39
5
875
982
3.07
3
1.62
4
1.32
0
1.63
3
837
1.58
0
1.51
7
3.61
3
2.73
7
2.2
63 3.2
40
19.775
26.235
0
1.000
2.000
3.000
4.000
5.000
6.000
7.000
8.000
SEPT
EMBE
R
Historical motorcycle imports (units)2012 - 2017 (september)
2017
2016
2015
2014
2013
2012
0 1.000 2.000 3.000 4.000 5.000 6.000 7.000 8.000
2.674
3.808
6.687
921
875
3.240
Source: Servicio Nacional de Aduana delEcuador (SENAE), 2017.
7
Source: Base de matriculación del Servicio deRentas Internas (SRI), 2017.
Page 10
Automotive sector in figures - No. 14
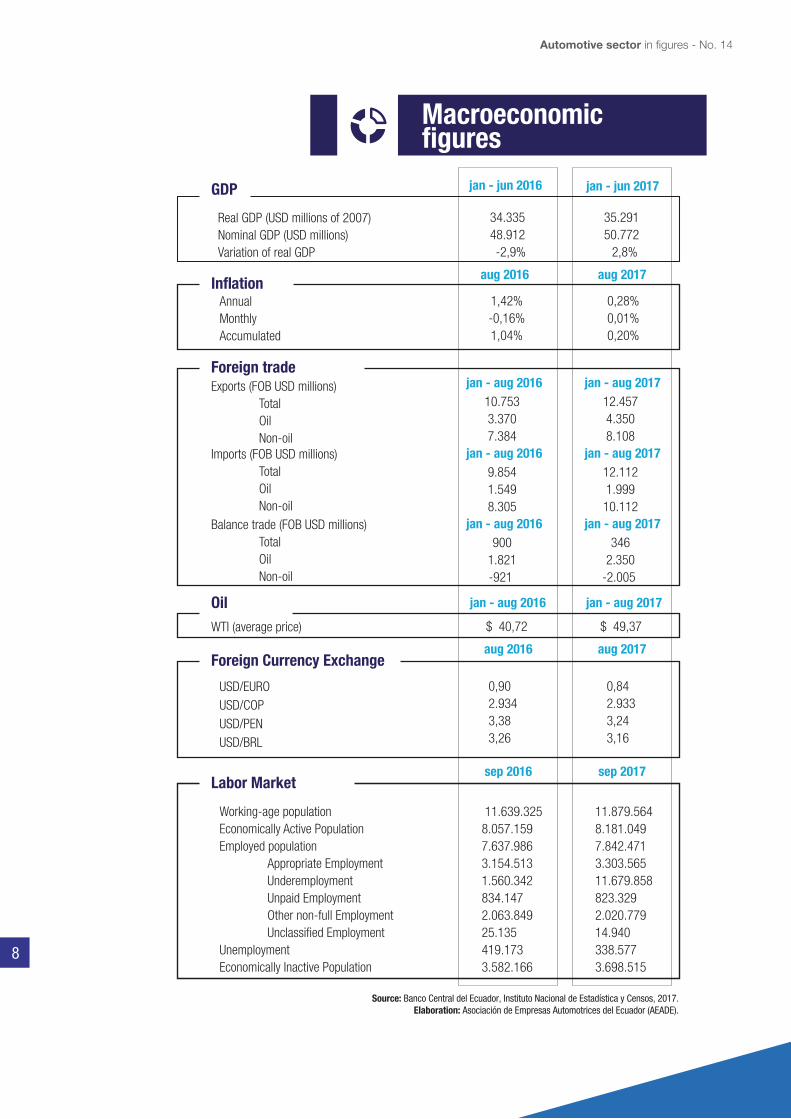
jan - jun 2016 jan - jun 2017
aug 2016 aug 2017
aug 2016 aug 2017
sep 2016 sep 2017
jan - aug 2016 jan - aug 2017
jan - aug 2016 jan - aug 2017
jan - aug 2016 jan - aug 2017
jan - aug 2016 jan - aug 2017
GDP
Inflation
Foreign trade
Foreign Currency Exchange
Labor Market
AnnualMonthlyAccumulated
Exports (FOB USD millions) Total Oil Non-oil
USD/EUROUSD/COPUSD/PENUSD/BRL
Imports (FOB USD millions) Total Oil Non-oilBalance trade (FOB USD millions) Total Oil Non-oil
Working-age populationEconomically Active PopulationEmployed population Appropriate Employment Underemployment Unpaid Employment Other non-full Employment Unclassified Employment Unemployment Economically Inactive Population
Oil
Source: Banco Central del Ecuador, Instituto Nacional de Estadística y Censos, 2017.Elaboration: Asociación de Empresas Automotrices del Ecuador (AEADE).
WTI (average price)
Real GDP (USD millions of 2007)Nominal GDP (USD millions)Variation of real GDP
Macroeconomicfigures
1,42%-0,16%1,04%
34.335 48.912
-2,9%
35.291 50.772
2,8%
0,28%0,01%0,20%
10.753 3.370 7.384
0,90 2.934 3,38 3,26
0,84 2.933 3,24 3,16
12.457 4.350 8.108
9.854 1.549 8.305
12.112 1.999 10.112
900 1.821 -921
346 2.350 -2.005
$ 49,37 $ 40,72
11.639.325 8.057.159 7.637.986 3.154.513 1.560.342 834.147 2.063.849 25.135 419.173 3.582.166
11.879.564 8.181.049 7.842.471 3.303.565 11.679.858 823.329 2.020.779 14.940 338.577 3.698.515
8
Page 11
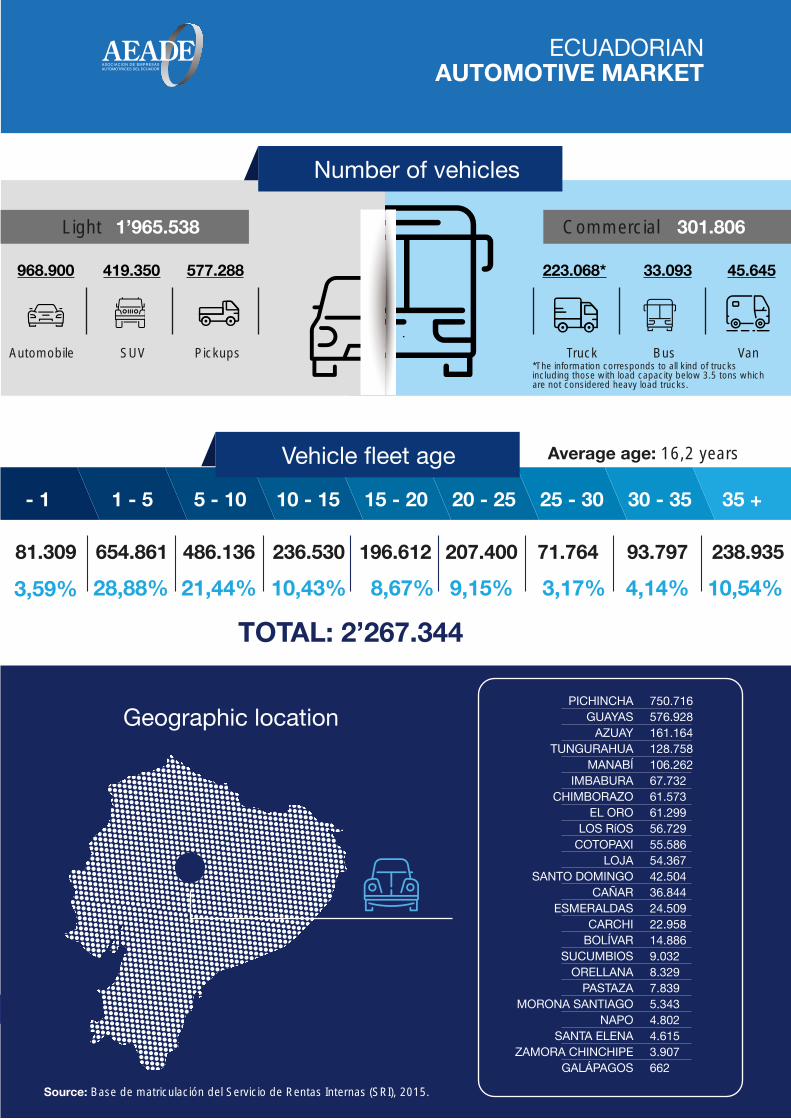
- 1 1 - 5 5 - 10 10 - 15 15 - 20 20 - 25 25 - 30 30 - 35 35 +
ECUADORIANAUTOMOTIVE MARKET
Number of vehicles
Vehicle fleet age
Geographic location750.716 576.928 161.164 128.758 106.262 67.732 61.573 61.299 56.729 55.586 54.367 42.504 36.844 24.509 22.958 14.886 9.032 8.329 7.839 5.343 4.802 4.615 3.907 662
PICHINCHAGUAYAS
AZUAYTUNGURAHUA
MANABÍIMBABURA
CHIMBORAZOEL ORO
LOS RíOSCOTOPAXI
LOJASANTO DOMINGO
CAÑARESMERALDAS
CARCHIBOLÍVAR
SUCUMBIOSORELLANA
PASTAZAMORONA SANTIAGO
NAPOSANTA ELENA
ZAMORA CHINCHIPEGALÁPAGOS
81.309
3,59% 28,88% 21,44% 10,43% 8,67% 9,15% 3,17% 4,14% 10,54%
654.861 486.136 236.530 196.612 207.400 71.764 93.797 238.935
TOTAL: 2’267.344
Light
Automobile SUV Pickups Truck Bus Van
1’965.538
968.900 419.350 577.288 223.068* 33.093 45.645
Commercial 301.806
Source: Base de matriculación del Servicio de Rentas Internas (SRI), 2015.
Average age: 16,2 years
*The information corresponds to all kind of trucksincluding those with load capacity below 3.5 tons whichare not considered heavy load trucks.
Page 12
Automotive Business Intelligence
¡Buy your plan now!
(02) 226 9052 / 226 9056 / 226 4925 / 226 4927
099 261 4120
[email protected]
@AEADE.EC
LLANTA
MOTO
CREDI
IMPOR
Page 13
www.aeade.net
@AEADE.EC @AeadeEc
AEADEAEADEecuador