,... .... _,• nc" ¸ ,_-.j_ Bolt Beranek and Newman i J__=Gq ,; s_ 1.1 L h Report No. 3982 _'_ - _ _ - D I i:i l Experimental Study of the Effect of the Difference Between "Hard" and "Soft" Ground Surfaces on Truck Noise Measurements November 1978 _I'1/ _/ Preparedfor: United States Environmental ProtectionAgency i_. .... J _._•_,, _. i ......... ;.,.. m; h
Transcript
,... .... _,• nc"̧ ,_-.j_Bolt Beranek and Newman i J__=Gq,;s_
1.1 L
h
Report No. 3982 _'_ - _ _ - D I i:i
l
Experimental Study of the Effect of the Difference
Between "Hard" and "Soft" Ground Surfaceson Truck Noise Measurements
November 1978
_I'1/
_/ Prepared for:
United States Environmental ProtectionAgency
i _.
.... J_._•_,, _. i ......... ;.,.. m; h
r
i.!
Report No. 3962
_ EXPERIMENTAL STUDY OF THE EFFECT OF THE DIFFERENCE BETWEEN"HARD" AND "SOFT" GROUND SURFACES ON TRUCK NOISE MEASUREMENTS
! _ November 1978
I][
i_ Contract No. 68-01-4467
Task Order No. I
Submittedto:Y _ United States Environmental Protection Agency_ Office of Noise Abatement and Control
Washington, D.C. 20460F,4il
Submitted by,'
#_I Bolt Beranek and Newman Inc.BO Moulton StreetCambridge, MA 0213B
W
, Report No. 3962 Bolt Beranek and Newman Inc.
{
ABSTRACT
m
Data on truck noise measurements have been gathered for two
trucks, operating in accordance with the Bureau of Motor Carrier
Safety Noise Regulations, over "hard" and "soft" sites, aod forvarious intermediate surface conditions. The results, averaged
for all operating conditions, indicate a difference between hard IIand soft sites tha_ increases with both the percentage of site
hardness and with microphone distance. The generally accepted
difference of + 2 dB(A) between hard-slte and soft-slte data
specified in the BMCS regulations is seen to be approximately
_'_ correct for IMI tests, but about I dB(A) low for passby _ests at
50 ft. These results confirm those reported by other investigators.
Y
," if
)
!Report No. 3962 Bolt Beranek and Newman Inc,
r
r_,_
TABLEOFCONTENTS
page
ABSTRACT .................................................. ili
LIST OF FIGURES ........................................... vLIST OF TABLES ............................................ vll
SECTION i. INTRODUCTION 1
2. RESULTS AND CONCLUSIONS ...................... 2
A.1. Serial numbers of instruments used for hardslte/soft field measurements ................ A-2
im
I_ B.1. Measured sound levels. Each value is the
average of five measurements ................. B-2
)
b
r'!
., vii
il.Report No. 3962 Bolt Beranek and Newman Inc,
1. INTRODUCTION
The Department of Transportation Bureau of Motor Oarrier
i,_ Safety Regulations for Enforcement of Motor Carrier Noise Emission
Standards (49 CFR 325) specify in some detail the requirements
i_-- for sites at which motor carrier noise is to be measured for en-forcement purposes. Included in these requirements are the pro-
visions that measurements must be made between 35 and 83 ft
i,_ (10.7 m and 25.3 m) away from the center line of the traffic lane
_ traveled by the vehicle and that the results are to be interpreted
_ _ differently for "hard" and "soft" sites.
iJI_'._ The regulations define a "hard" site as "any test site havingthe ground surface covered with concrete, asphalt, packed dirt,
I: gravel, or similar reflective material for more than 1/2 the dis-tance between the [traveled lane] and the microphone location
_ point." A "soft" site is "any test site having the ground surface
,_ covered with grass, other ground cover, or similar absorptive
i material for 1/2 or more of the distance between the [traveled
_,I_ lane] and the microphone location point."
_I _ The regulations indicate that the difference between noiselevels observed at hard sites and at soft sites will be + 2 dB(A),
regardless of the distance between the measurement microphone andthe traveled lane. The purpose of the work described here was to
obtain limited additional experimental data on the difference in
noise levels between hard end soft sites, particularly for micro-
: phone spacings of less than 50 ft (15.2 m). In addition, infor-
I!matlon was obtained pertinent to the pos@ibility of enforcingtruck noise limits with measurements made at distances less than
_ the 35 ft (10.7 m) minimum distance allowed by the regulations.
!';
_rl
r
Report No. 3962 Bolt Beranek and Newman Inc.
_q
ii 2. RESULTS AND CONCLUSIONS
The results and conclusions, based upon measurements of two
L.! trucks, can be summarized in four major points.
i-__ First, the difference between maxilnum truck noise levels ob-served at "hard" sites and corresponding levels observed at "soft"
sites is a strong function of the percentage of surface hardness,
I_ and this difference increases with the percentage of hardness. W
For example (see Fig, 6.1), at a measurement distance of 50 ft
I_ (15.2 m), the difference ranges from about 1 dB(A) for a 25% hard
! _ site to 3 to 4 dB(A) for a 100% hard site.
ii_ Second, the hard-site-to-soft-site difference is a function
:!I_ of microphone distance: The greater the microphone distance, thei_ greater the difference. For example (see Fig. 6.2), going from a
100% hard site to a typical soft site yields a difference of 1.5
I! I_ dB(A) at 25 ft (7.6 m), and about 2.5 dB(A) at 50 ft (15.2 m).
!i Third, the results of this study generally confirm the re-
.... _ sults of previous investigators for IMI/low-speed-acceleratlon
_ _ truck operations. However, for truck passby operations, the pres-
_i_ _ ent results indicate a hard-site-to-soft-slte difference about
'_i 0.5 dB(A) less tl_an reported by others.
, 'i
_. Finally, these data indicate that the 2 dB(A) difference be-
I_ tween hard- and soft-site truck noise levels specified in BMCS
I_ re'gulations is slightly low, but approximately correct. However,
_ it can vary by ± 1 dB for the range of conditions that.could occur
in field enforcement practices.
" _ _"Pereentage of surface hardness" is defined here as the percentageof pavement along the shortest path f_om the vehicle track to the
_._ microphone. See Table 5.1.
,! 2
Report No. 3962 Bolt Beranek and Newman Inc.
i J# 3. BACKGROUND
3.1 Analysis
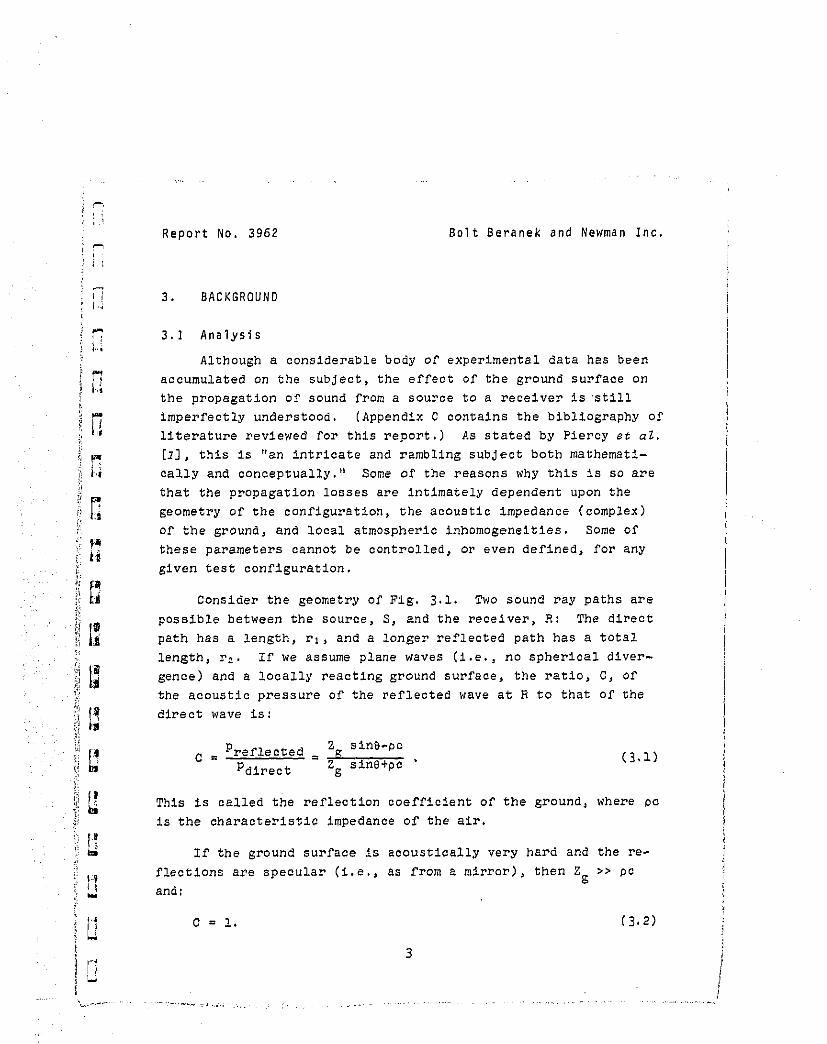
Although a considerable body of experimental data has been
accumulated on the subject, the effect of the ground surface onthe propagation of sound from a source to a receiver Is still
imperfectly understood. (Appendix O contains the bibliography of
L'_ literature reviewed for this report.) As stated by Piercy et aZ.
[_], this is "an intricate and rambling subject both mathemati-cally and conceptually." Some of the reasons why this is so are
that the propagation losses are intimately dependent upon the
geometry of the configuration, She acoustic impedance (complex)
o9 the ground, and local atmospheric inhomogeneities. Some of_a
_ these parameters cannot be controlled, or even defined, for any: given test configuration.
:_ _ Consider the geometry of Fig. 3.1. Two sound ray paths are
i__'_ possible between the source, S, and the receiver, R: The direct
.i_ _ path has a length, rl, and a longer reflected path has a total
length, r_. If we assume plane waves (i.e., no spherical diver-
[_ genee) and a locally reacting ground surface, the ratio, C,of
the acoustic pressure of the reflected wave at R to that of the
dlrecwaveis:G
PrefleetedZ slnB-po
C = = (3,1)° Pdlrect -g --"__-i.
,i._ This is called the reflection coefficient of the ground, where pcb' is the characteristic impedance of the air.
If the ground surface is acoustically very hard and the re-
_ fleetions are specular (i.e., as from a mirror), then Zg >> pc
and:
_" C = i. (3,2)
3
i:
',;
/"i
¸¸I,:
_
CO
o 0
Zo
=pC
rl
eR
/49
_G
ffO
UN
DS
UR
FA
('E=
?u///
/////;
//////
///u/
/m//m
//////
//////
//////
//////
//////
//////
Z9
o
FIG
.3.
1.T
WO
SO
UN
DPA
TH
SFR
O)4A
NO
ISE
SO
UR
CE(S
),T
OA
RE
CE
IVE
R(R
),N
EA
RTHEGROUND.
=_
fb
k • . • .
Report No. 3962 Bolt Beranek and Newman Inc.
In this perfect-reflection case, the two waves will add together
at the receiver when r2 - rz is an integral number of wavelengths,
and they will interfere or cancel when r2 - r_ is an odd number
'_' of half wavelengths. Obviously this summation or cancellation
effect will be a function of sound frequency and geometry.
On the other hand, if_the ground is acoustically very soft- m
j._ (i.e., Zg << pc), then C approaches - i, and there is a 180_ phasereversal of the wave upon reflection. Then the interference pat-
_ tern reverses, and the direct and reflected waves cancel for
r2 - r_ equal to an integral number of wavelengths, and they add
_ _. for r_ - r_ equal to an odd number of half wavelengths.
: Finally, for any finite value of Zg, a 180 ° phase reversal;_ . (C = -i) occurs for grazing incidence as B approaches zero. Be-
cause r_ essentially equals r2 at grazing incidence, the two
wavescancel plane-wavepropagationcannotoccurThe impedance of the ground, Zg, is a complex function of
i _ frequency and angle of incidence. It changes with the type of
_. ground cover, water content, and other climate-dependent variables.
I_ In the same way, the effective lengths of the direct and reflected
sound paths r_ and r2 change because of local atmospheric inhomo-
i _ genities and differences in the heights of the many separate noise
sources of a truck. Finally, the ground is seldom perfectly flat,"_,I!'_ and the surface irregularities that are comparable to or larger
m than the sound wavelength can produce sound scattering rather than
I-_ specular reflection. It is because of these complexities thatthe prediction of sound propagation near the ground is far more
'.... *This is not true for the more general case of spherical waves,however. For spherical waves, a ground-wave term analagous tothat existing in electromagnetic propagation takes over to pro-
-_. vide some signal under grazing-incldence conditions.
r
f,,.
_D
Report No. 3962 Bolt Beranek and Newman Inc.
_i complicated than the simple description that we have given here.JA
In general, any real configuration, such as that used for motor
carrier noise emission regulation, cannot be handled analytically' I
and must be treated empirically, with some guidance provided from
1,7 the simplified analytical picture.
3.2 Prior Experimental Work
Other investigators have published data on the effects of
soft vs hard sites on truck noise measurements. Several of these
i_ studies are summarized in Table 3.1. An interesting trend is re-
vealed by comparing the first three rows -- data for trucks aecel-
.._H crating at low speed --with the second three rows -- data for
trucks passing by under power. The former indicate a hard-site-_a
_ i_ to-soft-slte difference of 2 dB(A); the latter indicate a corres-ponding difference of about 3 dB(A). This trend is also noted
' i_ in Her. 3, where the author cautions that it is in need of further
' verification. Of course, the generally accepted difference is
_ 2 dB(A) for all test conditions, as specified in the regulation' _,_ and other literature [4].
t!
L,'
TA
BL
E3.1
.R
ES
UL
TSO
FM
EA
SU
RE
ME
NT
SO
FT
RU
CKN
OIS
EA
TS
OF
TV
SH
AR
DSIT
ES
,A
SR
EP
OR
TE
DBY
OT
HE
rINVESTIGATORS.
Z
HardSite
SoftSite
o
Noise
Operating
Numberof
Numberof
AA
Source
_lo
deDistance
%Hard
Trucks
%Hard
Trutks
dB(A)
%B
Refs.
Three
Acoeleration
per
50
ft
Trucks
SAE-J366b
(15.2
m)
91
51
32
55
2.0
59
2,3
(20
to30
m_)
Transient
Acceleration
at
50
ft
Trucks
<30
mph
(15.2
m)
100
_06
32
h06
1.8
68
3(hS_Ib)
Transient
Acceleration
at50
ft
Trucks
<35
mph
(15.2
mY
?(largey
_(largey
_2
68
_,3
-_
(53
kin/h)
?
Three
Power
passby,
50
ft
Trucks
about
55
mph
(15.2
my
91
23
32
50
3._
59
2,3
o
Transient
Power
pBssby,
_0ft
Trucks
h5
to
60
mph
(15.2
m)
711
29
32
226
2.h
42
2,3
m
(Y2
to
97
km/h)
Transient
Power
passby,
50ft
Truck
_5
to
60
mph
(15.2
m)
i00
_8
32
226
_-5
68
2,3
(72
to97km/h)
=
Free-
I
flowing
Power
passby
Empirical
fit
to
measured
data
indicates
change
from
3dB/dd
over
5Traffic
hard
sites
to
_-5
dB/dd
over
soft
sites.
n
Report No. 3962 Bolt Beranek and Newman Inc.
ii 4, MEASUREMENTS
,: 4.1 GeneralL*
Field measurements were performed July 27, 28, 31, and
_ August l, 1978, at Westfield-Barnes Airport in Westfield, Mass-L_
achusetts. An abandoned runway, currently unused but maintained,
was used as the "road." This runway is about 3300 ft long and
: ,_i 150 ft wide. It has an asphalt surface, with both shoulders
grassy and level.
Westfield-Barnes Airport was chosen because of the excellent
_ condition of the unused runway and its relative proximity _o BoltBeranek and Newman's Cambridge offices. A runway, rather than a
highway, was selected as the ideal test site because its width_i allowed a large working area for microphone layout and because
i_ there were no paved shoulders. (See Fig. 4.1.) Receiver locations" could then be varied incrementally, from soft to hard. That is,
ii the locations could be all on the grass beside the runway (soft);
ii _ there could be various combinations of partially hard, partiallysoft locations_ or all the locations could be on asphalt (hard).
: _ Aircraft activity at the airport was light. When an occa-
f_ sional aircraft produced noise that might have interfered with the
truck noise measurements, the truck noise measurements were repeated.
I_ The weather, during the measurement period varied somewhat,a_
but conditions were generally fair, clear, and cool. Temperatures
_ averaged 60°F; wind speed ranged from 0 mph to 10 mph. No measure-
_ _ ments were taken during occasional wind gusts of up to 15 mph.
_., The coolness assured that the pavement did not get hot and soft,
-- and its characteristics are believed to have remained constant.
I"!I
:'i 8
.,......................... .... L
Report No. 3962 Bolt Beranek and Newman Inc.
i ,
J *
t_j
i :
L
t.q
FIG. 4.1. VIEW ACROSS 150 FT WIDE RUNWAY USED FOR VEHICLE NOISE TESTS.
W.4
9
L_
Report No, 3962 Bolt Beranek and Newman Inc.
l4_
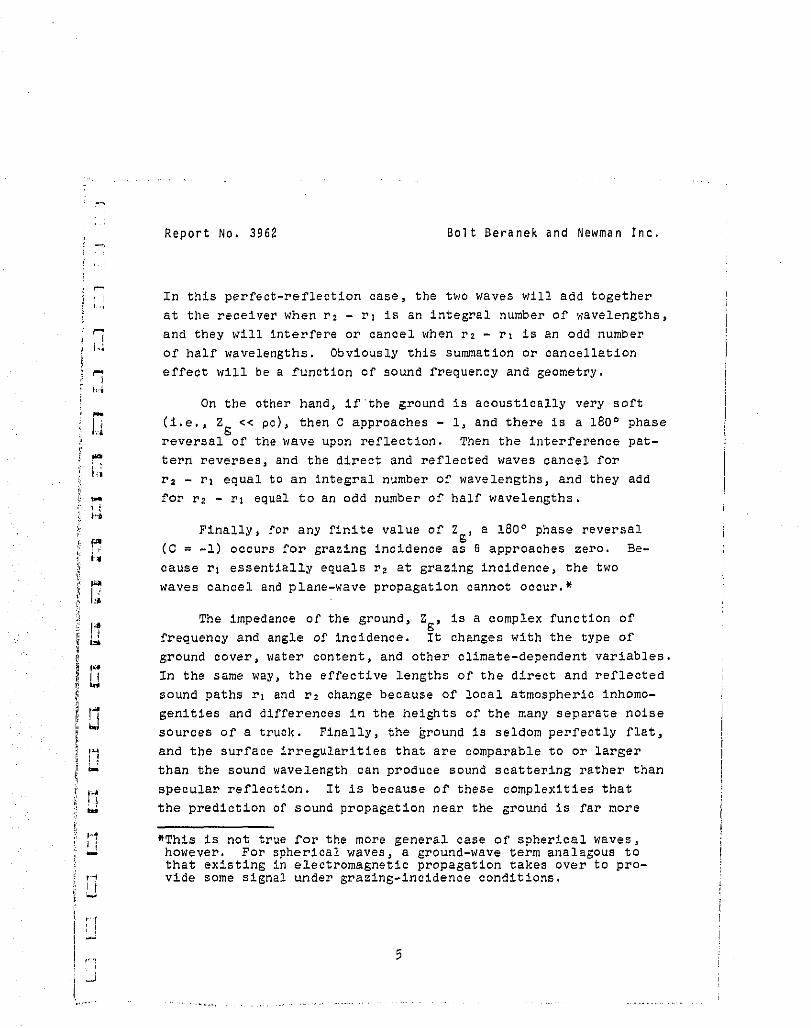
:I Five 10-ft (3-m) wide lanes were marked out with traffichl
cones and spray paint. Lane 1 was nearest the edge of the runway
. and Lane 5 farthest from it. (See Fig. 4.2.) Tests were runi _,_! with the noise source vehicle in each of the five lanes. The
_ microphones were moved with each lane change to maintain a con-.__'" stant distance from the source. In this way, the percentage of
-- hard surface between the source and the microphones was varied.
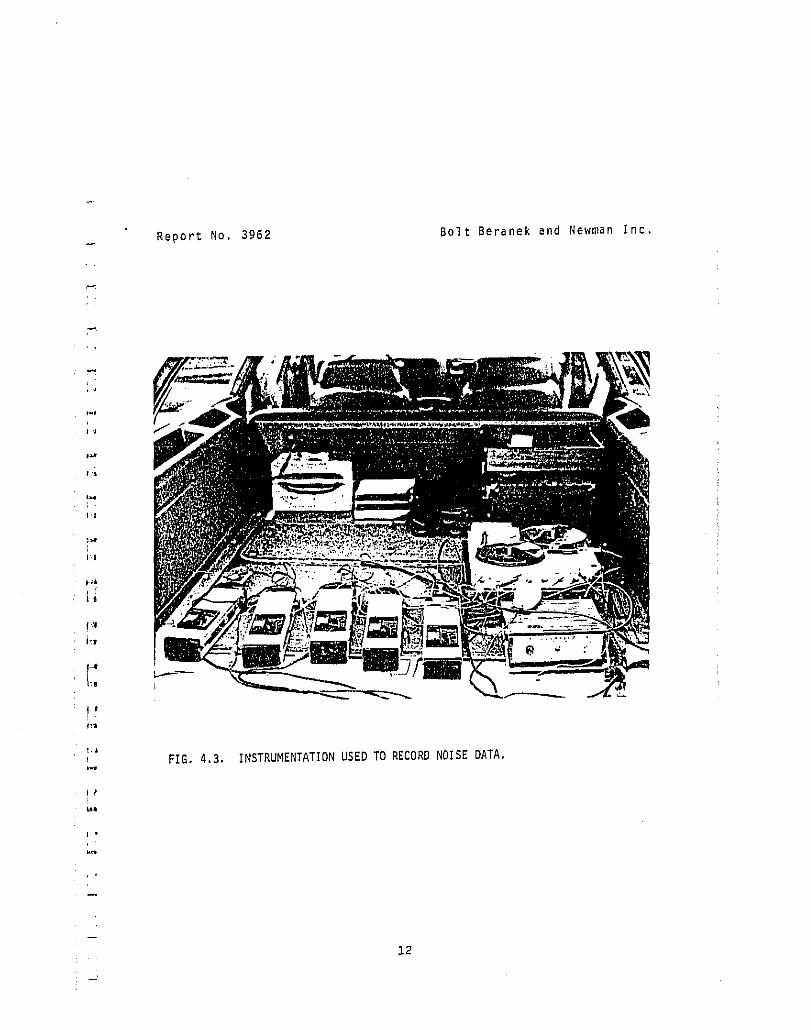
4.2 Instrumentation2_
_'_ GenRad 9601 microphones were placed at distances 25, 31, 36,
and 50 ft (7.6, 9.4, ll, and 15.2 m) from the centerline of the_:i lane being used for the tests. A reference microphone was placed
50 ft (15.2 m) from the lane centerline on the opposite side, All
L IT microphones were at a height of _ ft (1,2 m). Each microphone
was connected through a cable to a GenRad 1982 Sound Level Meter,
_ which provided a digital read-out of the maximum sound level ob-
_ rained on the "fast" response scale. See Fig. 4.3. These meters
i__I hold this maximum reading until they are manually cleared. Ant_
i_ anemometer was used to record wind speeds. Details of the sound
_i_ measurement equipment are listed in Appendix A.
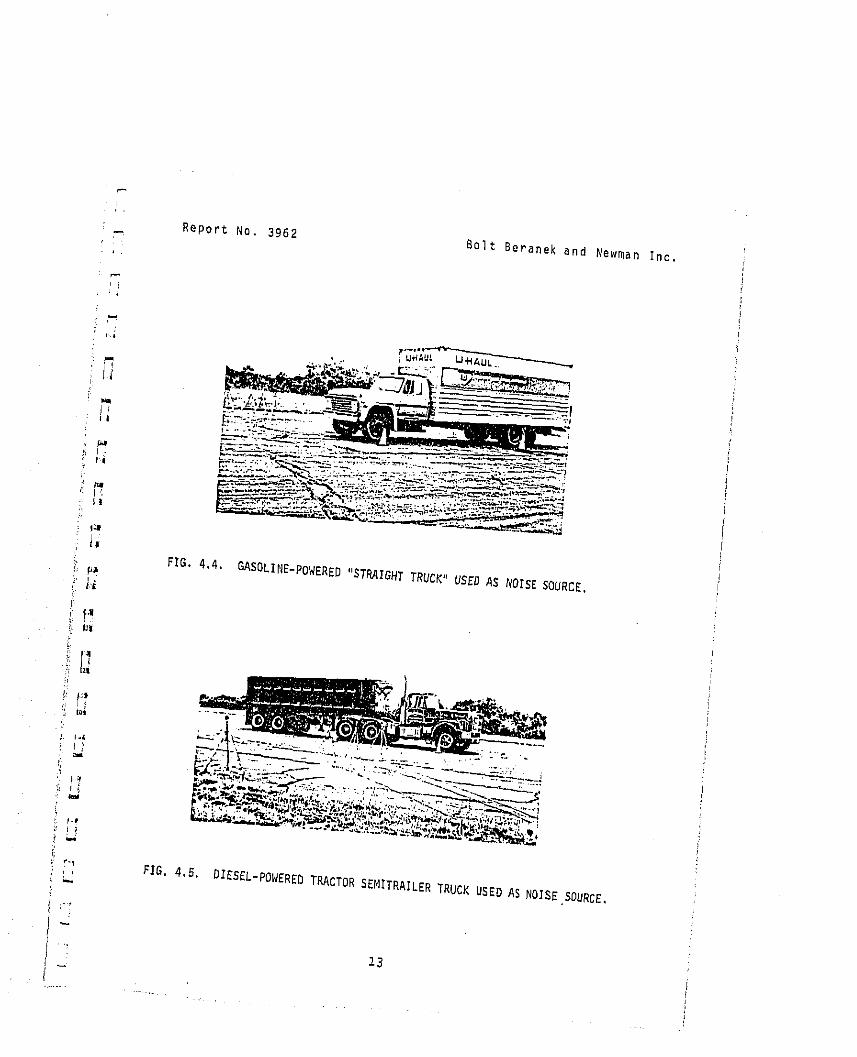
4.3 The Trucks
Two trucks were used: a gasoline-fueled and e diesel-powered
• _ i_ truck. The gas, or straight truck, was a rented U-Haul, as shown
in Fig. 4.4. This truck has a V-8 engine of 330 cu in. displace-
ment, and a manual four-speed transmission. It is 28 ft long.
(Its U-Haul equipment number is $633TP6092C.)
_ The diesel truck was a tractor semitrailer. This truck is
" a 1975 Brockway, Model EL-380. See Fig. 4.5. The engine is rated
!,_ at 425 horsepower; it is manufactured by Caterpillar and has six
I
ii l0
Report No. 3962 Bolt Beranek and Newman Inc.
,"3,
I -'1 '_1o'
I"_'_ I /SOURCE LOCUSASSUMED/tBXAMPLE SHOWNFORLANEI)
J'_J I
I 5o,I' _ R_ERENCEM,CROPHONEI._ I
TEST LANE) _ I
MICROPHONE POBITIONB(FROM CENTER LINE OF TEST LANE)
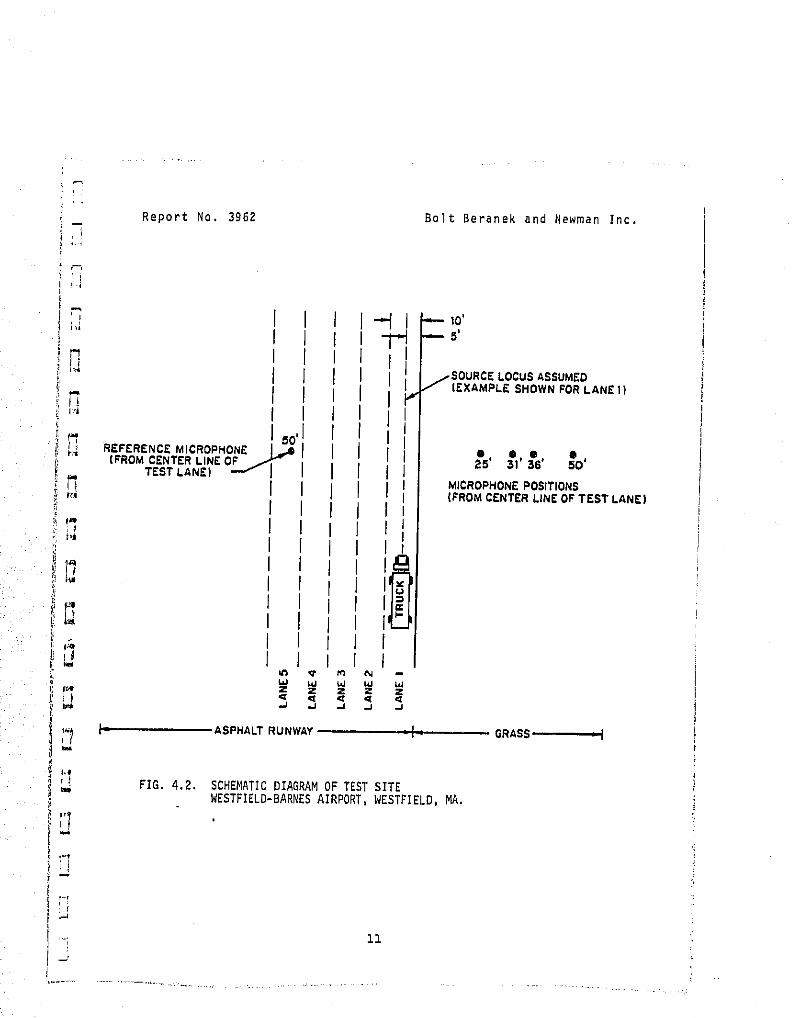
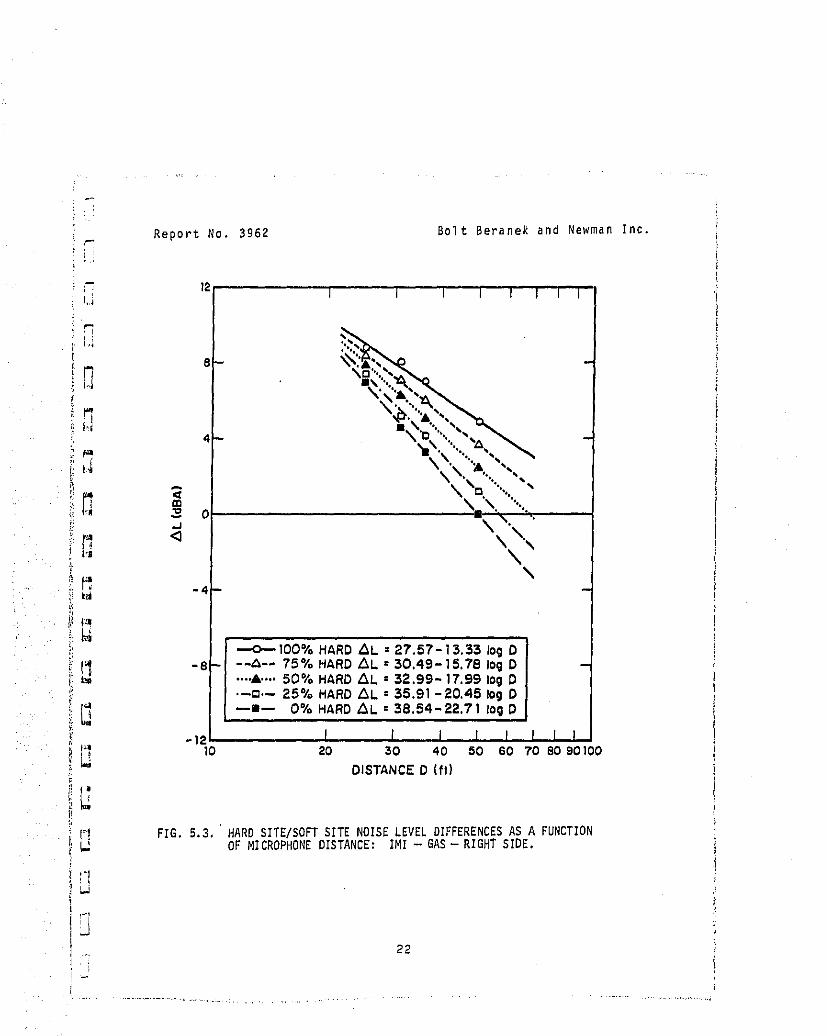
i _'_ ....A.... 50% HARDZ_L = 30.85 - ]7.22 log;_ .-r_._ 25% HARD "%L= 32.88 - 19.16 109
'_ -12 --II-- 0% HARDA,L = 34.75 - 20.81 log_, f r I I I I I I++ lo 20 3o 40 5o so Toeo_oloo
DISTANCED (ft)
l+ FIB.B.ll. HARDSITE/SOFTSITENOISELEVELDIFFERENCESAS A FUNCTIONOF MICROPHONEDISTANCE:GASPASSBYS- 45 MPH- RIGHTSIDE•
!i
30
J_ • + ........
............ ,.._. ++:, . ...........
Report No. 3962 Bolt Beranek and Newman Inc.
12i I I i I I I
j i
",,\'"
-J \ '\.
-_
:, ] _I00% HARD AL = 24.89 - 12.07 log D
-8- --",-- 75% HARD .A,L = 28.40-'14.891ogd -I; ....&.... 50% HARD Z_L = 32.04 - 17.75 logO
.--I:1.-- 25% HARD AL = 35.22 - 20.32 log D
!,_= ---m-- 0% HARD AL = 38.70- _'3.09 log D
= -12 I I I I I I IFa 10 20 30 40 50 60 70 80 90100_'_ DISTANCE D (ft)
FIG, 5.12, HARD BITE/SOFTSITE NOISELEVELDIFFERENCESAS A FUNCTION
OF MICROPHONEDISTANCE:GASPASSBYS- 40 MPH- LEFTSIDE,
'i
1_
3:1.
I
Report No. 396;2 Bolt Beranek and Newman Inc.
• ij-q
ii J J l r I J I
i,!
_ • ,.,,
! "- •
ili_ -_ o , , \ "
:; "0 %%
i! ---o'mlO0% HARD AL = 26.11 -1'_.94 Io(t D_; (_ I B _ l "&ll 75% HARD AL 27.56 -]4.4.6 log Dill"_A_l _ 'l..&-.." 50% HARD AL 2B.84 -15.SB log D_: ( .--0.-- _'5% HARD AL "40,83 li7.78 log D
}': I _l_ 0% HARD /%L 32,_'B "19.'_9 log D¢;l }!
:_ II_ I ' I I I I I t r
,_]_ _o zo zo 40 _o so 70 aoso_o(, i_ _ DISTANCE D (ft)
_ FIG. 5.14. HARDSITE/SOFTSITE NOISE LEVEL DIFFERENCESAS A FUNCTION_' OF MICROPHONEDISTANCE: TOTAL PASSBYS.
I 33r!
J
Report No, 3962 Bolt Beranek and Newman Inc,
J
i ,
, I I I I I I I Ih;
l'i
m" 8-- _ --
!i "= o -- -'_ "'.j _-_'"_°°%°
_ <_ \ ",_i.lJ:s \
i_) -"'O---100% HARD &L = 25.54-12.99 Io9 D": t_l -8 ._A.. 75% HARD AL = 26.88 -14.37 log D_ _ ....A'... 50% HARD AL = 27.90-15.51 log D
._m._ 25% HARD AL = 29.20-16.85 log D7;
_i_,{_ _11_ 0% HARD AL = 29.75 -17.69 log D-m I I I I I I I I
_' _@ 10 ZO 30 40 50 60 70 80 90100_,j_ DISTANCE D (ft)
Ill
FIG,5.15, HARDSITE/SOFTSITENOISE LEVELDIFFERENCESASA FUNCTION
OF MICROPHONEDISTANCE: ALL DATA,
U
= ;34 :
! J
Report No. 3962 Bolt Beranek and Newman Inc.
6. DISCUSSION OF RESULTS
The BMCS regulations define a "hard" site as one paved for
It more than 50% of the sound path. A "soft" site has 50% or less
pavement (see Sec. 1 for exact definitions). In practice, a soft
_ site, is rarely less than 32% hard, because it is underlaid byhalf the active vehicle lane and a paved shoulder or breakdown
lane [3]. However, fully hard sites are common.
The IMI test procedure used in this study is generally ac-
}v cepted as being most comparable to results obtained with trucks
accelerating at low speed during roadway operations [4]. Using
this information and the "percentage site hardness" observationmentioned in the previous paragraph, it is possible to compare
¢_ the results of the present study with those of previous inves-
t| tigators, as they are summarized in Table 3.1. This comparison
_ is illustrated in Fig. 6.1. The locations of the data points fromprior studies on the abscissa of Fig. 6.1 are based upon the
differences in the percentage of surface hardness between "hard"
and "soft" sites as reported by the previous investigations.
See the next to last column of Table 3.1.
It is seen that the present results for IMI operations are
_@ quite comparable to those from previous studies. However, thepresent results for passbys are about 0.5 dB(A) lower than
previous results. The reasons for this difference are unknown,
but could be caused by the very small sample of trucks used in
this study.
In any case, there is a clear indication that the noise
level difference increases with percentage site hardness, ratherthan being constant as implied in the BMCS regulations. Fur-
II thermore, the present results confirm the observation of1
i!
35
Report No, 3962 Bolt Beranek and Newman Inc.
,!I ,
i,iCl PASSBYS, PRESENT STUDY, FROM FIG. 5.14
_ 0 PRIOR PASSBY TESTS, 2nd THREE ROWS: " OF TABLE 3.l,' I IMI,PRESENT STUDY FROM FIG, 5.13i;_ • PRIOR ACCELERATION TESTS, FIRST THREE;_'_ _ ROWS OF TABLE 3.I
t_f =¢)ul
i,4w 0u
ul 0
..j 0i_J
tra ,.I
om BMCS REGULATIONS
• (= = MOST LIKELY
t_ SOFT- SITE RANGE)
/L_
I r(_'/,',','r((;'(t I rI_ zO ...... _<__"="_ sO BO 100_ % HARD
•_iI_ FIG. 6.1. COMPARISONOF RESULTSFROM PRESENTEXPERIMENTSWITH THOSE" OF PREVIOUSSTUDIES,AT DO FT. HARDSITE MINUSSOFT SITE
NOISE LEVEL DIFFERENCEvs PERCENTAGEOF SITE HARDNESS.
!"l 36J
Report No. 3962 Bolt Beranek and Newman Inc.
!,
. Ref. 3 -- that a greater hard-site-to-soft-site noise level
difference occurs for passbys than for IMI tests.
_ The British data indicated in _he last row of Table 3.1
_ are based upon Ll0 levels for free-flowing traffic and can not
be directly compared with the present data for individual trucks.
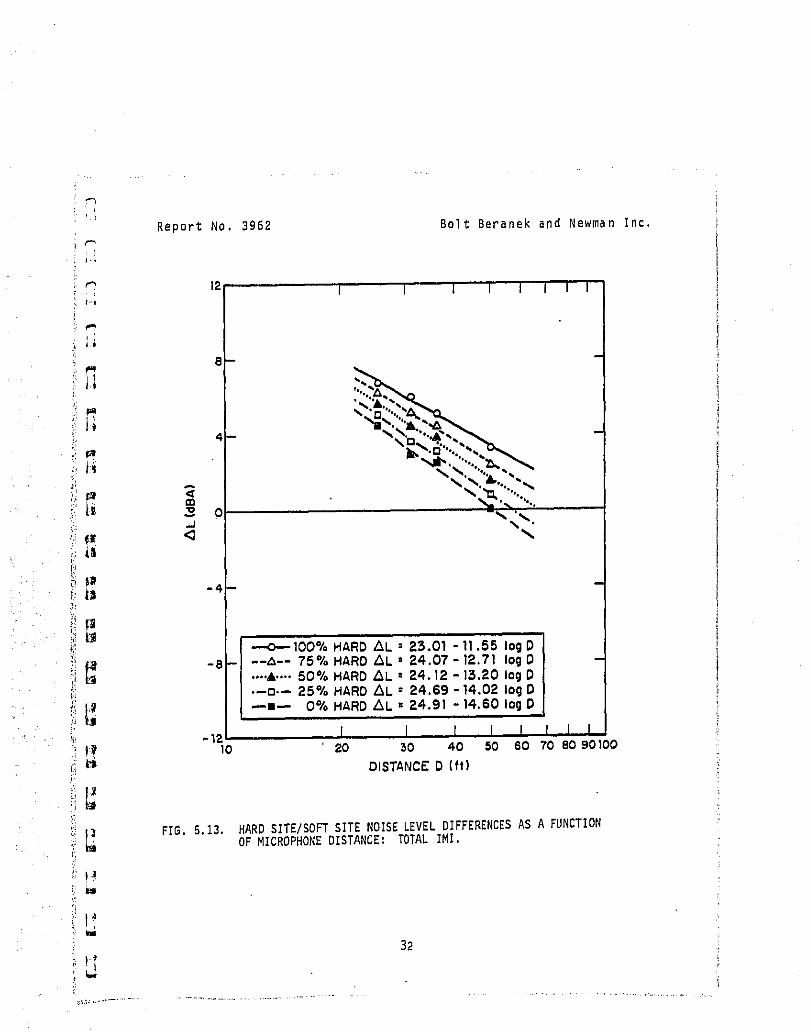
However, note (Fig. 5.15) that the slope of sound-level differ-
enee vs distance does indeed decrease with increasing percentage
of site hardness, going from about 5.2 dB/dd at 0% hardness to
3.9 dB/dd at 100% hardness, a difference of 1.3 dB/dd.
In general, the decrease in sound level with distance does
_ _ not approach the classic 6 dB/dd for the data reported herein.
' This suggests that the measurements at distances of less than• _._l| 50 ft from the trucks are in the near field of the noise source,
and/or in a region of pronounced ground-reflectlon effects.
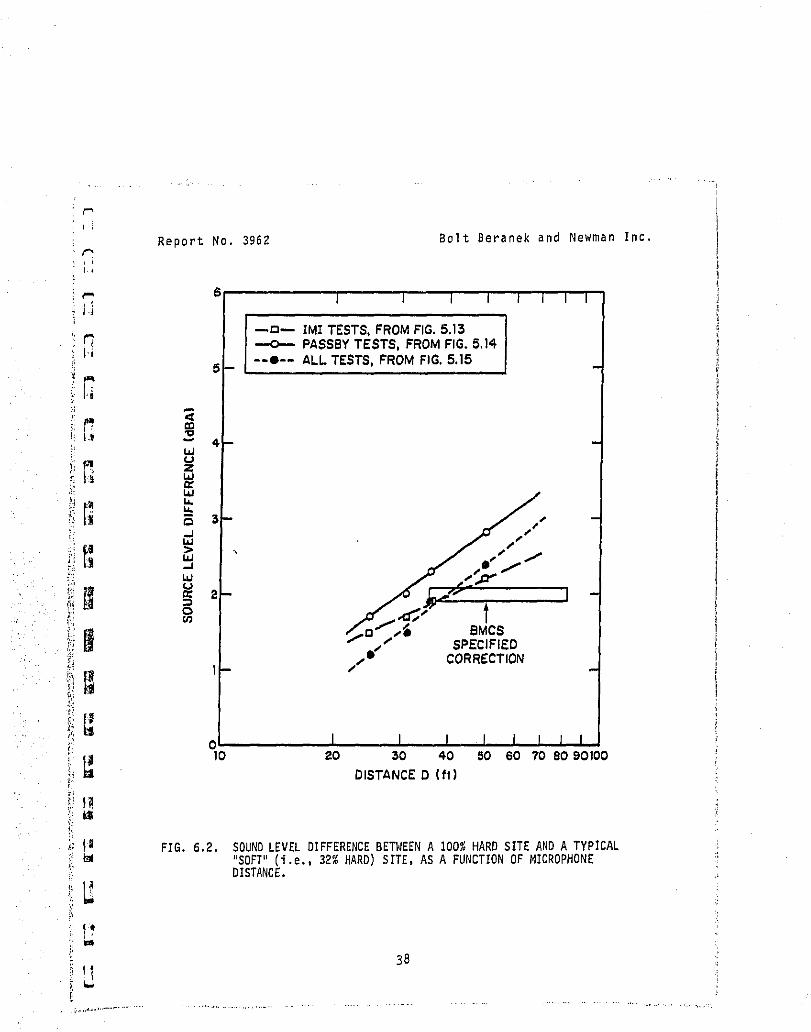
Finally, there is definitely a trend of increasing sound
I_ level difference with increasing microphone distance, as illus-
_ trated in Fig. 6.2. In this figure, the difference in sound levels
for a 100% hard site and for a "typical" (i.e., 32% hard) softP_
[_ site is plotted as a function of microphone distance. The hard-
_i site-to-soft-slte difference is about i dB(A) less at 25 ft than
at 50 ft for typical site conditions.
Note that the results illustrated on Fig. 6.2 would shift
up or down relative to the BMOS-specifled correction, depending
upon the choice of percentage of site hardness selected._
--_-- IMI TESTS, FROM FIG. 5.13i' _ --0--. PASSBY TESTS, FROM FIG. 5,14
II--e-- ALL TESTS, FROM FIG. 5.15
i; h
,x W _S
..IW
03:t_ u_
,,MCS_:_! SPECIFIEDCORRECTION
i I,_ 10 20 30 4.0 50 60 70 80 90100
C' DISTANCE D (fl)
i:
i}I_ FIG. 6.2. SOUNDLEVEL DIFFERENCEBETWEENA 100% HARD SITE ANO A TYPICAL
:i_, i_ "SOFT"(i.e.,32% HARD) SITE,AS A FUNCTIONOF MICROPHONEi DISTANCE.
_. 38" If
r_riI,
Report No. 3962 Bolt Beranek and Newman Inc, ,L
'i].i R'EFERENCES
l. J.E. Piercy and T.F.W. Embleton, "Review of Noise Propaga-I,_ tion in the Atmosphere," J. Aoous_. Soo. Am. 61 (6), 1403-
1418 (1977).
lJi 2. E.J. Rickely and R.W. Quinn, "Noise Measurement Data form
Highway Bite Qualification," U.S. Department of Transporta-tion, Transportation Systems Center, final report draft,
I_ 1976. Data as analyzed in Ref. 3.
3. Donald B. Pies, "Assessment of Ground Surface Correctionsfor Motor Vehicle Noise Measurements," Wyle Research Report
_ WCR 77-9,February1977.!
I_ 4. B.H. Sharp, "A Study of Truck Noise Levels and the Effectof Regulations," Wyle Laboratories Report WE 74-8, preparedfor U.S. Environmental Protection Agency, December 1974.
'_I Hillquist, R.K. and Bettie, R.A., "Measurement of AutomotivePassby Noise," SEA 720275,1052-1059 (1972).
_ii_ Isei, T., Embleton, T.F.W., and Piercy, J.E., "Influence of Re-'_ _ flections at the Ground on Insertion Loss of Barriers," J..... Accuse. So_. Am. 63(SI) $59(A) (1978).
_ _ Kurze, V. and Beranek, L.L., "Sound Propagation Outdoors," in
<_ L.L. Beranek, ed., Noise and Vibration ControZ (McGraw-Hill
ii_;': Lyon, R.H., "Automotive Noise Propagation in Open Areas," inLecture 16, Transportation Noise (Grozier Publishing, 1973),_' 153-163.
Moorhen, van W.K. and Lanier, S.K., "Effect of a Ground Surface_i_ on Acoustic Propagation," J. Aooust. Sos. Am. 61(SI) SIS(A)
!ii:_ (1977).
_;i_i: Parkin_ P.H. and Scholes, W.E., "The Horizontal Propagation ofSound From a Jet Engine Close to the Ground at Hatfleld," J.
4Sound Vib. B(4) 35_-37 (1965).
_ _ Piercy, J.E., Donate, R.J., and Embleton, T.F.W., "Near Horizontal!_iil.il_ Propagation of Sound Over Grassland," J. Aooust. See. Am. 60(S1)
S2(A)(1976).
Piersy, J.E. and Embleton, T.F.W., "Review of Noise Propagationin the Atmosphere," J. Aooust. Sos. Am. 61(6) 1403-1418 (1977).
_C. _ Pies, D.B., "Assessment of Ground Surface Corrections for Motor}:<!_ Vehicle Noise Measurements," Wyle Research Report WCR77-9, U.S._ EPA Office of Noise Abatement and Control (1977).
_.- Sargent, J.W., "Data from Free Flow Traffic Noise Measurements,"_ii! J. Sound Yib. 57(2) 307 (1978).
_: Sharp, B.H., "A Survey of Truck Noise Levels and the Effect of._ Regulations," Wyle Research Report WR74-8, U.S. EPA Office of:_i_, Noise Abatement an_ Control (1974).& ,_
-- Sharp, B.H., "Research on Highway Noise Measurement Sites," WyleLaboratories Research Staff Report WCR72-1, California Highway