18
1 Heat of Combustion of Naphthalene using Comb Calorimetry Physical Measurements Daniel Gonzalez Goux Spring 2016
| Date post: | 22-Jan-2018 |
| Category: |
Documents |
| Upload: | daniel-gonzalez |
| View: | 1,471 times |
| Download: | 0 times |
1
Heat of Combustion of Naphthalene using
Comb Calorimetry
Physical Measurements
Daniel Gonzalez
Goux
Spring 2016
2
ABSTRACT:
INTRODUCTION:
The process of calorimetry aims to measure absorbed or transfered heat during a chemical reaction.. According
to the first law of thermodynamics, energy can neither be created nor destroyed but meerely transformed from
one state to another. Bomb calorimetry aims to monopolize uon this relationship by holding pressure and
temperature constant and measuring changes in temperature. During this process, the fuse wire and pellet are
ignited in the bomb that is pressurized with flammable oxygen gas. This reaction of combustion releases heat
that will warm up the bomb and water that can be detected by the thermometer. By placing the bomb in an
insulated jacket containing a pail of water, heat is kept with in the calorimeter and an adiabatic wall is created
to trap heat (∆q)
∆U=q+W
But with constant volume, work being equal to –pΔV will be equal to 0 as the bomb will not expand (granted it
does not explode)
Thus ∆U=q
If the change in temperature is recorded and pressure and volume are constant,
H=U+ΔnRT
And
𝛥𝑈
𝑇2 −′ 𝑇1
′={𝐶𝑝
𝐶𝑣
Where T2-T1 =ΔT
Such that
ΔTcorrected=ΔT-(Tf-Ti)- (𝑑𝑇
𝑑𝑡)(td-ti)-(
𝑑𝑇
𝑑𝑡)f (tf-td) (1)
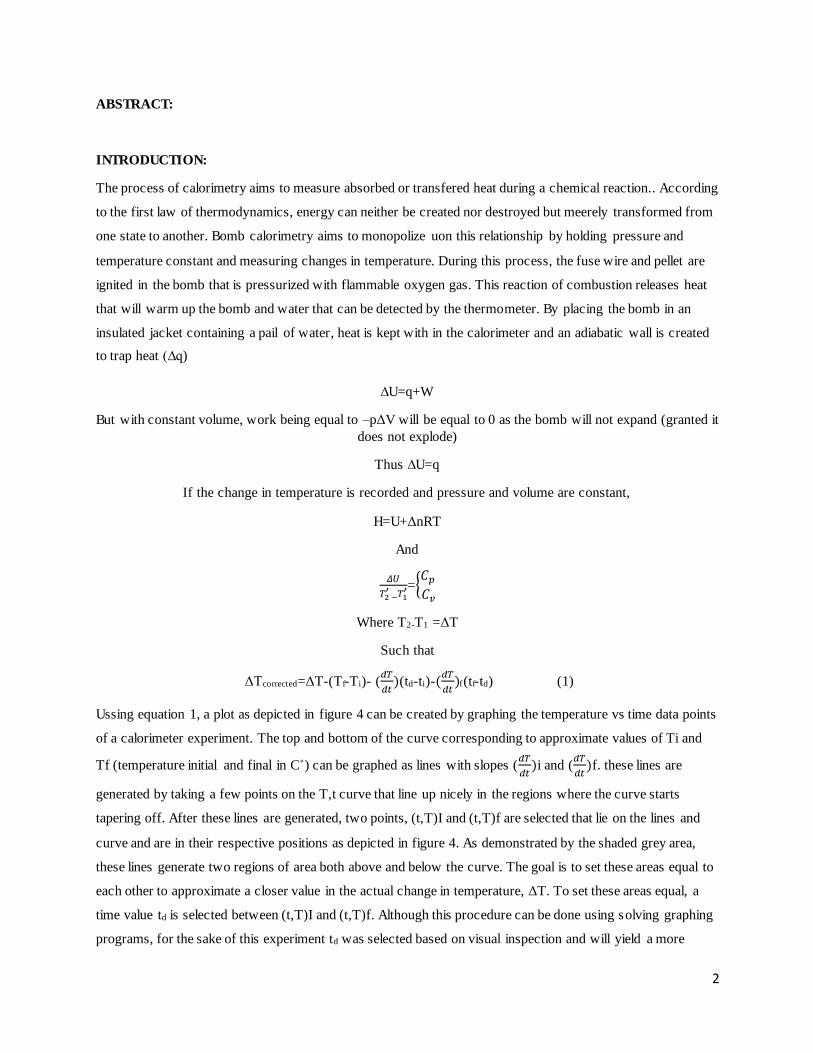
Ussing equation 1, a plot as depicted in figure 4 can be created by graphing the temperature vs time data points
of a calorimeter experiment. The top and bottom of the curve corresponding to approximate values of Ti and
Tf (temperature initial and final in C˚) can be graphed as lines with slopes (𝑑𝑇
𝑑𝑡)i and (
𝑑𝑇
𝑑𝑡)f. these lines are
generated by taking a few points on the T,t curve that line up nicely in the regions where the curve starts
tapering off. After these lines are generated, two points, (t,T)I and (t,T)f are selected that lie on the lines and
curve and are in their respective positions as depicted in figure 4. As demonstrated by the shaded grey area,
these lines generate two regions of area both above and below the curve. The goal is to set these areas equal to
each other to approximate a closer value in the actual change in temperature, ΔT. To set these areas equal, a
time value td is selected between (t,T)I and (t,T)f. Although this procedure can be done using solving graphing
programs, for the sake of this experiment td was selected based on visual inspection and will yield a more
3
accurate result than if no td was selected at all. Once the values are all obtained and assigned from the plots,
they can be substituted into equation (1) giving values for ΔT.
Once ΔT is determined for benzoic acid, the heat capacity of the calorimeter can be determined using the ΔE
values of iron and benzoic acid. (These calculations can be seen in the results section) once the heat capacity is
determined, the heat capacity can be used to calculate the ΔU of combustion of naphthalene by calculating the
ΔT of naphthalene. The ΔU combustion can then be used to calculate the ΔH of combustion, which can then
finally be used to calculate ΔH of formation of naphthalene using Hess’s Law.
METHODS:
All methods were performed at the University of Texas at Dallas’ Berker hall under the supervision of Dr.
Warren Goux in the teaching laboratory.
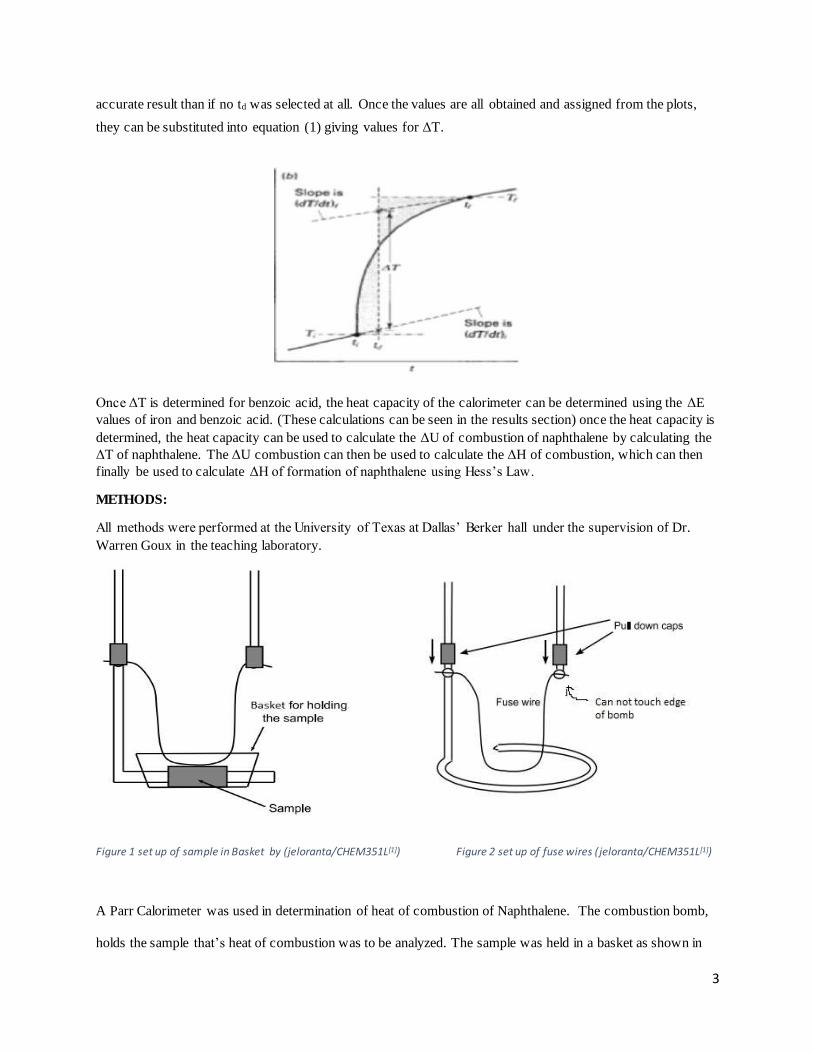
Figure 1 set up of sample in Basket by (jeloranta/CHEM351L[1]) Figure 2 set up of fuse wires (jeloranta/CHEM351L[1])
A Parr Calorimeter was used in determination of heat of combustion of Naphthalene. The combustion bomb,
holds the sample that’s heat of combustion was to be analyzed. The sample was held in a basket as shown in

4
Fig. 1[1]. (figure 2) [2] diagrams how the ignition wire is attached to the electrodes. The sample of naphthalene
or Benzoic acid and the wire were placed in the bomb, and the bomb was pressurized with oxygen gas to
approximately 23 atm. (figure 1): Schematic of the sample support stand [1]. The wire was prepared as to not
touch the sides of the bomb. The bomb was then tightly sealed by screwing down the cap and was placed in an
oval metal pale containing exactly 2L of H2O measured using a 2L volumetric flask and DiH2O. The
temperature change of combustion was read from a thermometer and recorded. A stir propeller was turned on
to evenly distribute the water throughout the pale. The pale is enshrined in an insulating air space which
dramatically prevents heat leakage to the surroundings. The caps on the electrodes were fastened into place to
hold the ignition wire.
Figure 3 the schematic of a Parr Bomb Calorimeter[2]
SAMPLE PREPARATION
Two independent measurements of the benzoic acid standard and two measurements of naphthalene samples
were run. Two pellets of benzoic acid were prepare being of masses 1.0233 and 1.0034 g respectively. A pellet
press was used to make a pellet and balance 4 was used to take the mass. The pellets were place it in the
sample basket after being lassoed with a known mass of iron wire and tied with tweezers.

5
The ignition wire was the connected and the caps were pressed down to keep them in place. The holding stand
was then placed into the bomb and secured by screwing down the cap carefully.
Pressurizing the Bomb:
The connection hose was fastened to the pin on the top of the bomb assembly. The bomb was charged with
oxygen by opening the oxygen tank valve. The regulator valve was left open for 2 minutes to purge the bomb
of nitrogen. After two minute the valve was closed with the oxygen tank left open and the pressure was
allowed to rise to 23atm.
The bomb was then lowered into the pail containing 2l of water with the leads connected, and the top of the
calorimeter was placed on. A thermometer was inserted to view temperature change and the stir propeller was
turned on by connecting the pulley and band to the motor and turning of the motor. The system was left for 5
minutes to equilibrate before the charge was started by pressing and holding the ignition button for 5 sec onds.
After ignition the temperature was recorded every 30 seconds for a 20 minute interval. The Data of
Temperature vs Time was plotted and data was extrapolated to calculate thermodynamic quantities in the
results section.
RESULTS:
Figure4 Format of Graphs 1 and 2 to calculate ΔT values

6
Chart 1.
Chart 2.
make this Tf
y = -3E-16x + 23.433
y = -3E-16x + 21.82R² = #N/A
y = 0.0027x + 24.687R² = 0.9796
y = 0.0047x + 22.34R² = 0.9423
20
21
22
23
24
25
26
27
28
0 200 400 600 800 1000 1200 1400 1600
Tem
p C
time in seconds
Benzoic Acid T(C) vs t(s) curves
curve 1 BA trial 1
Curve 2 BA trial 2
trial 2 lower bound
trial 1 lower bound
trial 2 upper bound
trial 1 upper bound
Linear (trial 2 lower bound)
Linear (trial 1 lower bound)
Linear (trial 2 upper bound)
Linear (trial 1 upper bound)
21.79
420, 24.3
300, 25.5
180, 21.79
y = 0.0207x + 19.333R² = 0.9914
y = 21.79R² = #N/A
y = 0.004x + 22.593R² = 0.9643
y = -5E-05x + 23.522R² = 0.6
21.5
22.5
23.5
24.5
25.5
26.5
27.5
0 100 200 300 400 500 600 700 800
Tem
pe
ratu
re (
C)
Time (s)
Combustion of Naphthalene Temperature vs. Time

7
Example Calculation for ΔT of Benzoic Acid Using Run 1
ΔT=(Tf-Ti)- (𝑑𝑇
𝑑𝑡)(td-ti)-(
𝑑𝑇
𝑑𝑡)f (tf-td) (1)
From Graph 1, curve one, the values of dT/dt I , dT/dt f, (t,T)i, (t,T)f and td can be determined and are listed in table 1. Substituting these values into equation 1 yields the following:
ΔT=(24.8-21.82)C˚- (−3𝑥10−16)𝐶˚
𝑠(300-240)(s)-(.0047)(
𝐶˚
𝑠) (390-300)
ΔT=2.557 C˚ for run 1 of Benzoic Acid
This Calculation must be performed four times. Twice for Benzoic acid and twice for Naphthalene. The values
are averaged for each compound and standard deviations are recorded in tables 1 and 2.
Table 1. Calculation of ΔT for Benzoic Acid
ΔT for Benzoic Acid td =300 (s)
Run dT/dt i (C˚/s)
dT/dt f (C˚/s)
ti
(s) Ti
(C˚) tf
(s) Tf
(C˚) Delat T Avg ΔT (C˚) SD dt
BA 1 -3E-16 0.0047 240 21.82 390 24.8 2.557 2.5325 0.034648
BA 2 -3.E-16 0.0027 240 23.43 360 26.1 2.508
Table 2. Calculation of ΔT for Naphthalene
ΔT for Naphthalene with td =250 (s)
Run dT/dt i (C˚/s)
dT/dt f (C˚/s)
ti
(s) Ti
(C˚) Tf
(C˚) Tf
(C˚) Delat T Avg ΔT
(C˚) SD N1 0 0.004 180 21.2 420 25.52 3.64 3.721925 0.115859
N2 -5.E-05 0.00207 240 23.39 345 27.39 3.80385
DETERMINATION OF Ccal:
In ofder to determine the Cp of the calorimeter, the ΔT of a standard must be known. In this experiment
Benzoic acid served as that standard. The Cp of the calorimeter is the due to both the cp of the metal
components of the bomb and the Cp of the 2 liter water bath surrounding the metal components of the bomb
itself. (this makes sense as a change I observable temperature would be only if both of these parts changed as
well) this relationship is expressed by equation 2.
ΔH1=∫ 𝐶𝑝(𝐶 + 𝐷 + 𝑆)𝑑𝑇𝑇0
𝑇1 (2)
Where Cp is the heat capacity and ΔH is the enthalpy over a change in temperature.

8
According to Equation 3,
ΔH=ΔE +Δ(pV) (3)
This is the definition of enthalpy and allows for Molar energies to be used to substitute for ΔH and then
solve for Cp in equation 2. Because Δ(pV) is dependent on pressure of a gas, making an ideal gas law substitution where pV=nRT equation 3 becomes equation 4.
ΔH=ΔE + RTΔngas (4)
When working with solids though, ΔnRT can be assumed negligible.
According to Shoemaker, the vales for ΔẼ for Benzoic acid and Iron are as follows:
ΔẼBA=-26.41 KJg-1
ΔẼFe=-6.68 KJg-1
When using these values in equation 4 equation 5 is obtained where ΔẼ known are the sums of the above quantities times the mass of each respective quantity combusted over ΔT (which was calculated first)
Cp=−𝛥𝐸𝑘𝑛𝑜𝑤𝑛
𝑇2′−𝑇1
′ (5)
When Substituting ΔẼBA and ΔẼfe into equation 5 with the ΔT value obtained form the benzoic acid run 1,
Cp=
−(−26.41𝐾𝐽
𝑔𝐵.𝐴(122.12
𝑔
𝑚𝑜𝑙 𝑏.𝑎.)( 1.0233𝑔𝑏𝑎
122.12𝑔
𝑚𝑜𝑙𝑏𝑎
)−6.68𝑘𝐽
𝑔𝑓𝑒(55.845
𝑔
𝑚𝑜𝑙𝑓𝑒.)( .0143𝑔𝑓𝑒
55.845𝑔
𝑚𝑜𝑙𝑓𝑒
))
(2.5325𝐶˚)
Cp =10.5ish kJ/C˚
This Calculation is done twice and averaged with a standard deviation reported in table 3.
Despit calculating the Cp due to Benzoic acid and the amount of iron combusted, it is also important (and
critical) to include the Cp component of the water in the bomb calorimeter pale.
Calculation of ΔU of Naphthalene :
According to equation 2 ΔH1=∫ 𝐶𝑝(𝑏𝑜𝑚𝑏)𝑑𝑇𝑇0
𝑇1
ΔH=ΔU + RTΔnga
ΔU + RTΔnga =∫ 𝐶𝑝(𝑏𝑜𝑚𝑏)𝑑𝑇𝑇0
𝑇1
ΔU/mols= −CpΔT + RTΔngas−6.68
𝐾𝐽
𝑔𝑓𝑒(.0143𝑔𝑓𝑒
1)
𝑚𝑜𝑙𝑠 𝑛𝑎𝑝ℎ𝑡ℎ𝑎𝑙𝑒𝑛𝑒 (6)

9
When substituting values from a run of Naphthaline with a ΔT value of Naphthalene the following is obtained:
ΔU/mols= −10.597
KJ
C(3.64C) +(8.3475J/Kmol)(295K)(−2mol)gas −6.68
𝐾𝐽
𝑔𝑓𝑒(
.0143𝑔𝑓𝑒
1)
0.9604 g naphthalene
128.19g
mol𝑛𝑎𝑝ℎ𝑡ℎ𝑎𝑙𝑒𝑛𝑒
ΔU/mols= -5143.21 +/- 12.21 kJ/mol
Table 3. Calculation of Ccal using Benzoic acid as a reference
Ccal from Benzoic Acid
ΔẼBA
kJ/mol ΔẼFe
kJ/mol Mass Fe (g)
Mass B.A (g)
Gfm B.A. (amu)
Gfm Fe
(amu)
Ccal kJ/C˚
Average Ccal kJ/C˚
SD kJ/C˚
1 -26.41 -6.68 0.0143 1.0233 122.12 55.845 10.706 10.59725 0.19422
2 -26.41 -6.68 0.0106 1.0034 122.12 55.845 10.4885
Table 4. Calculation of ΔU/n (JK/mol) for Naphthalene
Delta U Naphthalene with CH2O=8.345 KJ /C˚
run Cp (Ccal) kJ /C˚
ΔT C˚
Mass Fe (g)
ΔẼFe
kJ/mol Mass Naph. (g)
Gfm Naph. (amu)
ΔU/n kJ/mol
Avg kJ/mol SD
1 10.59725 3.64 0.0083 -6.88 0.96 128.19 -5143.21 -5151.84 12.21179
2 10.59725 3.85 0.0087 -6.88 1.012 128.19 -5160.48
Calculation of ΔH/n (JK/mol) for Naphthalene
ΔH=ΔU-RTΔn combustion (8)
ΔH=Δ(-5143.21)kJ-(298)K(-2mol)(.00831kJ/mol K)
Table 5. Calculation of ΔHcomb kJ/mol
Calculation of ΔH combustion for Naphthalene
run Delta U
kJ T
(K) R
(kJ/mol K) Δn
(mols) H
kJ/mol average SD 1 -5143.21 298 0.00831 -2 -5138.25 -5146.89 12.21179
2 -5160.48 298 0.00831 -2 -5155.52

10
ΔH formation:
Using Hess’s law CO2 and H20 and 02 (is zero)-(ΔH of combustion)
C10H10 (s) +12O2 (g) 10CO2 (g) +4H2O (g)
Table 6. kJ/mol values
Molecule ΔHf
kJ/mol
CO2 -393.5
H2O -268
O2 0
ΔHf = 10(-393 kJ/mol)+4( -286 kJ/mol)-(-5146.89 kJ/mol)= -72.89 kJ/mol (9)
Table 7. Values of ΔHf Naphthalene kJ/mol
Naphthalene ΔHf
kJ/mol CO2
ΔHf
kJ/mol H2O
ΔHcomb
kJ/mol ΔHf
kJ/mol Average SD
Run1 -393 -286 -5138.25 64.25443 72.88947 12.21179 Run2 -393 -286 -5155.52 81.5245
Table 8. Comparison of Calculated Data to literature
𝛥𝑈 ΔHcombustion ΔHformation
Naphthalene -5151.84 -5146.89 -72.89
SD 12.21 12.21 12.21 Literature -5097 -5156.4 -79
% difference 1.06% .18% -7.73%

11
DISCUSSION:
Over all the experiment was successful. The bomb calorimeter was operated to combust naphthalene
successfully and use benzoic acid as a standard to calculate the heat transfer involved in this process. It was
found that ΔU for naphthalene was calculated to be -5151.84 +/- 12.21 kJ/mol which was 1.06% higher than
standard literature values. This could be due to the fact that the two runs of benzoic acid produced ΔU values
that were different by about 17kJ/mol. This difference is fairly large given the fact that such small samples of
naphthalene were used in both samples. This discrepancy could be due to loss of naphthalene in handling the
pellet while trying to lasso it with the iron wire and secure it to the basket for combustion. If this were the case,
one value would be lower than expected because more sample should produce more heat, and if there is less
sample being combusted than expected, a falsely low value of ΔU will be returned. This low value will
propagate through the rest of the calculations as ΔU is used to calculate ΔH combustion and ΔH formation. In
addition to error in mass, a very real error could lay in the manner in which points were used to calculate the
ΔT for the benzoic acid runs and naphthalene runs. If this ΔT is too small, all of the corresponding values for
Cp will be too large, and if the ΔT is too large, all of the Cp values will be too small. It was noticed at first the
calculations were not resulting in data near literature values due to this very reason. Upon re-analyzing the data
and selecting different points in the determination of ΔT, it was found that the majority of error could be
corrected in the calculations.
Over all this experiment was relatively strait forward and the values obtained by calculation were similar to
that of literature (table 8). It was noticed that the largest error came from the value of ΔH of formation of
Napthalene. It makes sense that there is error here as ΔH formation is calculated directly for ΔH combustion
which had an error of +/- 12.21kJ. One method to help eliminate this error would have been to do five runs
rather than just 2. In the case of only two runs, it is impossible to actually determine if one run is completely
off compared to another run and no statistical methods such as a Q test can be performed to get rid of a poor
measurement.

12
REFFERENCES:
[1] Experiment 1: Adiabatic Bomb Calorimeter 2010, www.csun.edu/CHEM351L,pp 1-7
[2] Shoemaker, D; et. al; Experiments in Physical Chemistry, 8th ed.; McGraw Hill, NY 2009, pp152-158
[3] NIST,material measurements laboratory, Naphthalene 2006 http://webbook.nist.gov/cgi/cbook.cgi?ID=C91203&Type=HCOMB
[4]P. W. Atkins and J. de Paula, Physical Chemistry (7th ed.) (Oxford University Press, Oxford, UK, 2002).
[5] R. J. Silbey, R. A. Alberty, and M. G. Bawendi, Physical Chemistry (4th ed.) (Wiley, New York, 2004).
[6] R. Chang, Physical chemistry for the chemical and biological sciences (Unive rsity Science Books,
Sausalito, California, 2000)

13
APPENDIX:
Equations:
C10H8(s) +12O2= 10CO2(g) +4H2O(l)
ΔH =𝛥𝐻
𝑛 and Ẽ=
𝛥𝐸
𝑛 where n is the number of moles of the limiting reagent ΔH and ΔẼ are path independent
quantities
Step I
A(T0) + B(T1) +S(T0) = C(T1) + D(T1) + S(T1) where S represents the parts of the system and remains
constant and constitutes the entire system it can be assumed that the heat q=0
Step II
D(T1) + C(T1) +S(T1) = C(T0) + D(T0) + S(T0) –this is the portion where the products are brought back to
initial temperatures. q≠0 but q can be calculated by (T1 - T0 ) (IF THE HEAT CAPACITY IS KNOWN)
ΔH=ΔH1 + ΔHII the enthalpy of the system can be described as the sum of the enthalpies of Step one and two
ΔE=ΔE1 + ΔEII
Step 1: Q
ΔH1=qp =0 at constant pressure
ΔE=qv =0 At constant volume
ΔH=ΔHII if both steps are carried out at constant pressure (which they are)
ΔE=ΔEII if both steps are carried out at constant volume (which they are)
ΔH=ΔE +Δ(pV) (definition of enthalpy)
ΔH=ΔE + RTΔngas (this is just a substitution of the ideal gas law, for solid states this term RTΔngas can be neglected)
Welectric=∫ 𝑉𝑘𝑑𝑄 = ∫ 𝑉𝑘𝐼 𝑑𝑡 (it is easier to calculate work rather than calculating heat, so work is
calculated in terms of the electrical current that was applied to the system) Vk is the voltage drop I is the
Current and Q is the electrical charge. Vk I should be measured against constant resistance.
ΔH1I=Welectric at constant pressure
ΔEII =Welectric at constant volume
OR calculate the heat capacities and Only use Step 1 to calculate everything using the following equations
where Cp Cv are the heat capacities at constant pressure and volume respectively:
ΔH1=∫ 𝐶𝑝(𝐶 + 𝐷 + 𝑆)𝑑𝑇𝑇0
𝑇1
ΔE=∫ 𝐶𝑣 (𝐶 + 𝐷 + 𝑆)𝑑𝑇𝑇0
𝑇1

14
These two equations are simplified versions of the previous two assuming Cp and Cv do not change much
over the course of a small range of temperatures.
ΔE= -Cv (C +D +S)(T1-T0)
ΔH1= -Cp (C +D +S)(T1-T0)
HOW TO DETERMINE HEAT CAPACITY:
𝑊𝑒𝑙𝑒𝑐𝑡𝑟𝑖𝑐
𝑇2 −′ 𝑇1
′ ={𝐶𝑝
𝐶𝑣
{𝛥𝐻𝛥𝐸= -C(s)(T1-T0) this assumption can be made because the mass of the system (water is 3 orders of
magnitude larger than the mass of the sample and in this case, volume and pressure are irrelevant when
considering a liquid’s heat capacity.
C(s(bomb water ect,) ) ={
−𝛥𝐻𝑘𝑛𝑜𝑤𝑛
𝑇2′−𝑇1
′ 𝑐𝑜𝑛𝑠𝑡𝑎𝑛𝑡 𝑃
−𝛥𝐸𝑘𝑛𝑜𝑤𝑛
𝑇2′−𝑇1
′ 𝑐𝑜𝑛𝑠𝑡𝑎𝑛𝑡 𝑉
When working with an imperfect bomb,
(𝑑𝑇
𝑑𝑡)𝑙𝑒𝑎𝑘+𝑠𝑡𝑖𝑟 =
1
𝐶𝑝 𝑜𝑟 𝑣[P-k(T-Ts) where Ts is the temperature of surroundings and k is the thermal rate constant
dependent upon the thermal conductivity of the insulation of the bomb.
Tf-Ti =ΔT + ∫ (𝑑𝑇
𝑑𝑡)𝑙𝑒𝑎𝑘+𝑠𝑡𝑖𝑟𝑑𝑡
𝑡𝑓
𝑡1
Thus: the overall calculation will be:
T1-T0 =ΔT =(Tf-Ti) -1
𝐶 ∫ {−𝑘[𝑇(𝑡) − 𝑇𝑠]}𝑑𝑡
𝑡𝑓
𝑡1
Obtain this by graphing T –t , choose (Tf,tf) determine td and use the above equation to calculate ΔT td should
lie in between ti (time the electricity is turned on) and tf is the time it is turned off. And td is the midpoint in this
time.
ΔẼBA=-26.41 KJg-1
ΔẼFe=-6.68 KJg-1
Assuming P is constant, . k(T-Ti) is small but not negligible, T-t plot where the stir drift rate (𝑑𝑇 𝑑𝑡)𝑖⁄ at ti
differs from the final rate (dT/dt)f at tf

15
ΔT-(Tf-Ti)- (𝑑𝑇
𝑑𝑡)(td-ti)-(
𝑑𝑇
𝑑𝑡)f (tf-td)

16
Tabular Data:
Table 5
Tabular data for Benzoic Acid Bomb Cal. Experiment
Time original Temp for run 1 Temp for run 2 Time corrected -240 21.82 23.42 0
-180 21.82 23.44 60
-120 21.82 23.43 120 -60 21.82 23.44 180
0 21.82 23.43 240 30 22.22 23.78 270
60 23.26 24.66 300 90 23.78 25.26 330
120 24.00 25.54 360
150 24.20 25.72 390 180 24.28 25.82 420
210 24.34 25.88 450 240 24.38 25.92 480
270 24.4 25.94 510 300 24.42 25.94 540
330 24.42 25.94 570
360 24.42 25.94 600 390 24.43 25.95 630
420 24.43 25.94 660 450 24.43 25.94 690
480 24.43 25.94 720 510 24.43 25.93 750
540 24.43 25.93 780
570 24.42 25.92 810 600 24.42 25.92 840
630 24.41 25.91 870 660 24.41 25.91 900
690 24.41 25.90 930 720 24.40 25.90 960
750 24.40 25.90 990
780 24.40 25.89 1020 810 24.39 25.89 1050
840 24.39 25.88 1080 870 24.38 25.87 1110
900 24.38 25.87 1140 930 24.38 25.86 1170
960 24.37 25.86 1200 990 24.37 25.86 1230
1020 24.36 25.85 1260

17
Table 5 continued Benzoic Acid Time original Temp for run 1 ( C˚) Temp for run 2 ( C˚) Time corrected
1050 24.36 25.84 1290 1080 24.35 25.83 1320
1110 24.35 25.82 1350
1140 24.34 25.82 1380 1170 24.34 25.81 1410
Table 6
Tabular data for Naphthalene Bomb Cal. Experiment
Time original (s) Temp for run 1 ( C˚) Temp for run 2 ( C˚) Time corrected (s)
-240 21.79 23.52 0
-180 21.79 23.52 60 -120 21.79 23.52 120
-60 21.79 23.51 180 0 21.79 23.51 240
30 22.28 24.65 270 60 22.78 25.5 300
90 23.46 26.22 330
120 23.86 26.74 360 150 24.14 27.02 390
180 24.3 27.2 420 210 24.38 27.3 450
240 24.46 27.34 480 270 24.5 27.39 510
300 24.52 27.4 540
330 24.53 27.41 570 360 24.54 27.42 600
390 24.54 27.42 630 420 24.54 27.42 660
450 24.54 27.42 690 480 24.54 27.42 720
510 24.54 27.42 750
540 24.54 27.41 780 570 24.54 27.41 810
600 24.54 27.4 840 630 24.54 27.4 870
660 24.54 27.39 900 690 24.53 27.39 930
720 24.53 27.38 960
750 24.53 27.38 990 780 24.52 27.37 1020
810 24.52 27.37 1050

18
Table 6 Continued Naphthalene Time original (s) Temp for run 1( C˚) Temp for run 2 ( C˚) Time corrected (s)
840 24.52 27.36 1080 870 24.51 27.36 1110
900 24.51 27.35 1140
930 24.51 27.34 1170 960 24.51 27.33 1200
990 24.50 27.32 1230 1020 24.50 27.32 1260
1050 24.49 27.31 1290 1080 24.49 27.30 1320
1110 24.48 27.29 1350
1140 24.48 27.28 1380 1170 24.47 27.28 1410


