Bond Graph Modelling of Chemiosmotic Biomolecular Energy Transduction Peter J. Gawthrop *1 1 Systems Biology Laboratory, Melbourne School of Engineering, University of Melbourne, Victoria 3010, Australia. Department of Electrical and Electronic Engineering, Melbourne School of Engineering, University of Melbourne, Victoria 3010, Australia. February 23, 2017 Abstract Engineering systems modelling and analysis based on the bond graph approach has been applied to biomolecular systems. In this context, the notion of a Faraday-equivalent chemi- cal potential is introduced which allows chemical potential to be expressed in an analogous manner to electrical volts thus allowing engineering intuition to be applied to biomolecular systems. Redox reactions, and their representation by half-reactions, are key components of biological systems which involve both electrical and chemical domains. A bond graph interpretation of redox reactions is given which combines bond graphs with the Faraday- equivalent chemical potential. This approach is particularly relevant when the biomolecular system implements chemoelectrical transduction – for example chemiosmosis within the key metabolic pathway of mitochondria: oxidative phosphorylation. An alternative way of implementing computational modularity using bond graphs is in- troduced and used to give a physically based model of the mitochondrial electron transport chain (ETC). To illustrate the overall approach, this model is analysed using the Faraday- equivalent chemical potential approach and engineering intuition is used to guide affinity equalisation: a energy based analysis of the mitochondrial electron transport chain. 1 Introduction Like engineering systems, living systems are subject to the laws of physics in general and the laws of thermodynamics in particular. This fact gives the opportunity of applying engineering * Corresponding author. [email protected]1 arXiv:1611.04264v2 [q-bio.MN] 22 Feb 2017
Transcript
Bond Graph Modelling of Chemiosmotic BiomolecularEnergy Transduction
Peter J. Gawthrop∗1
1 Systems Biology Laboratory, Melbourne School of Engineering, University ofMelbourne, Victoria 3010, Australia.
Department of Electrical and Electronic Engineering, Melbourne School ofEngineering, University of Melbourne, Victoria 3010, Australia.
February 23, 2017
Abstract
Engineering systems modelling and analysis based on the bond graph approach has beenapplied to biomolecular systems. In this context, the notion of a Faraday-equivalent chemi-cal potential is introduced which allows chemical potential to be expressed in an analogousmanner to electrical volts thus allowing engineering intuition to be applied to biomolecularsystems. Redox reactions, and their representation by half-reactions, are key componentsof biological systems which involve both electrical and chemical domains. A bond graphinterpretation of redox reactions is given which combines bond graphs with the Faraday-equivalent chemical potential. This approach is particularly relevant when the biomolecularsystem implements chemoelectrical transduction – for example chemiosmosis within the keymetabolic pathway of mitochondria: oxidative phosphorylation.
An alternative way of implementing computational modularity using bond graphs is in-troduced and used to give a physically based model of the mitochondrial electron transportchain (ETC). To illustrate the overall approach, this model is analysed using the Faraday-equivalent chemical potential approach and engineering intuition is used to guide affinityequalisation: a energy based analysis of the mitochondrial electron transport chain.
1 IntroductionLike engineering systems, living systems are subject to the laws of physics in general and thelaws of thermodynamics in particular. This fact gives the opportunity of applying engineering
approaches to the modelling, analysis and understanding of living systems. The bond graphmethod of Paynter (1961) is one such well-established engineering approach (Borutzky, 2010;Cellier, 1991; Gawthrop and Smith, 1996; Gawthrop and Bevan, 2007; Karnopp et al., 2012)which has been extended to include biomolecular systems (Oster et al., 1971, 1973). To quotefrom Paynter (1993):
Katchalsky’s breakthroughs in extending bond graphs to biochemistry are verymuch on my own mind. I remain convinced that BG models will play an increasinglyimportant role in the upcoming century, applied to chemistry, electrochemistry andbiochemistry, fields whose practical consequences will have a signicance compara-ble to that of electronics in this century. This will occur both in device form, say aschemfets, biochips, etc, as well as in the basic sciences of biology, genetics, etc.
With this quotation in mind, this paper builds on the pioneering work of Katchalsky’s group (Os-ter et al., 1971, 1973), together with more recent investigations (Gawthrop and Crampin, 2016;Gawthrop, 2017; Gawthrop and Crampin, 2014; Gawthrop et al., 2015a) to give an engineering-inspired modelling approach to biomolecular systems which seamlessly combines biochemicalreactions, electrons and protons using the concept of the Faraday-equivalent chemical potential.In particular, this paper shows that combining electrical units for chemical potential with bondgraph models of biomolecular systems not only provides a systematic methods for model devel-opment and analysis of biomolecular systems but also provides a bridge allowing application ofelectrical engineering methodology to biomolecular networks.
Redox reactions provide the energy required to sustain life (Atkins and de Paula, 2011; Sousaet al., 2013) and the notion of the redox potential is useful in describing energetic properties. Thispaper shows that both redox reactions and redox potential can be clearly and explicitly describedusing the bond graph approach and the use of the Faraday-equivalent chemical potential.
Mitochondria make use of redox reactions to provide the power driving many living systems.Mathematical modelling of the key components of mitochondria is thus an important challengeto systems biology. As discovered by Mitchell (1961, 1976, 1993, 2011), the key feature ofmitochondria is the chemiosmotic energy transduction whereby a chain of redox reactions pumpsprotons across the mitochondrial inner membrane to generate the proton-motive force (PMF).This PMF is then used to power the synthesis of ATP – the universal fuel of living systems.Because mitochondria transduce energy, an energy-based modelling method (Beard and Qian,2010; Hill, 1989; Qian and Beard, 2005; Wu et al., 2007) is desirable.
Modular bond graphs provide a way of decomposing complex biomolecular systems intomanageable parts (Gawthrop and Crampin, 2016; Gawthrop et al., 2015a). This paper combinesthe modularity concepts of Neal et al. (2016) with the bond graph approach to give a more flexibleapproach to modularity. This paper suggests that such a modular bond graph approach, combinedwith electrical units, provides a flexible and powerful energy-inspired modelling method whichbrings engineering expertise to the analysis of biomolecular systems in general and chemiosmoticenergy transduction in mitochondria in particular.
An alternative approach would use electrical networks to model chemical systems (Caravacaet al., 2014; Oster and Perelson, 1974; Zupanovic and Juretic, 2004). Indeed, Oster and Perelson(1974) show the precise connection between the two approaches. However, the resultant circuit
2
diagrams can be unwieldy and the representation of stoichiometry is cumbersome. Therefore,in the author’s opinion, the more general bond graph approach is superior. Nevertheless, theequivalence discussed by Oster and Perelson (1974) should, in principle, allow circuit-theoreticalapproaches (Anderson and Vongpanitlerd, 2006) to be incorporated.§ 2 introduces the Faraday-equivalent chemical potential and this is used in § 3 to provide
bond graph models of redox reactions which seamlessly combine the chemical and electricaldomains and provide a bond graph interpretation of redox potential. § 4 considers an approachto computational modularity in the context of bond graphs which is then used, together with theredox reaction models of § 3, in § 5 to give a modular bond graph model of the mitochondrialelectron transport chain (ETC). § 6 uses this bond graph model to analyse how the intermediateelectron transporters coenzyme Q and cytochrome c equalise the Faraday-equivalent potentialsalong the mitochondrial electron transport chain. § 7 describes how the bond graph represen-tation of redox reactions can be generalised to include ATP hydrolysis and synthesis and howthis can be combined with the ETC to give a modular bond graph representation of oxidativephosphorylation. § 8 concludes the paper and suggests directions for future research.
2 The Faraday-equivalent potentialThe fundamental biophysical processes of life involve the transduction of chemical energy andelectrical energy (Lane and Martin, 2010). For example, the chemiosmotic theory of Mitchell(1961, 1976, 1993, 2011) explains how a mixture of chemical and electrical energy is stored ina trans-membrane proton gradient and the theory of Hodgkin and Huxley (1952) shows how themutual transduction of chemical and electrical energy gives rise to action potential in nerves.
Because the chemical and electrical domains are so intertwined, the analysis and understand-ing of such systems is enhanced by a common approach to the two domains. One example ofthis is the proton motive force PMF of chemiosmotic theory (Alberts et al., 2015; Berg et al.,2012; Mitchell, 1993; Nicholls and Ferguson, 2013) which reexpresses the chemical potential ofprotons as electrical voltage using the Faraday constant so that it can be added to the electricalpotential. A second example is the notion of redox potential (Alberts et al., 2015; Atkins andde Paula, 2011; Berg et al., 2012) which assigns a voltage to reactions involving electron transfer.
A theme of this paper is that the notion of rexpressing chemical potential as electrical poten-tial is not just confined to electrically-charged ions but can be generally applied to any chemicalspecies – charged or not. Indeed, this can be regarded as one aspect of the concept of physicalanalogies introduced by Maxwell (1871) who pointed out that analogies are central to scientificthinking and allow mathematical results and intuition from one physical domain to be transferredto another. The central concept here is that conservation of energy holds across different physicaldomains.
2.1 Variables & UnitsIn the context of electrochemical systems, there are two ways of unifying the two domains: reex-press chemical potential as electrical potential (Bose et al., 2003) (as in the proton-motive force
3
concept Mitchell (1993, 2011)) or reexpress electrical potential as chemical potential (Gawthropet al., 2015b). Those with a physics or engineering background would be more familiar withelectrical units and would therefore prefer the former choice. However there is a more generalreason for choosing the electrical domain: it is better endowed with dedicated units.
Chemical potential is expressed as the compound unit of Joules per mole (J mol−1) but doesnot have a dedicated unit1. In contrast, electrical potential has its own unit, the Volt (V). Al-though it would be possible to ignore this unit and use the equivalent compound unit of Joulesper Coulomb (J C−1), this would obscure the basic simplicity of electrical theory. Moreover,chemical flow can be expressed in compound units as moles per second (mol s−1) but does nothave a dedicated unit; in contrast, electrical flow has its own unit, the Amp (A). Again, it wouldbe possible to be perverse and ignore this unit and use the equivalent compound unit of Coulombsper second (C s−1).
The conversion factor relating the electrical and chemical domains is Faraday’s constant F ≈96 485 C mol−1. As discussed by Karnopp (1990) and Gawthrop et al. (2015b), this conversioncan be represented by the bond graph TF component which enforces energy conservation. Likeall physical quantities, Faraday’s constant F is composed of a real number (the measure) and aunit (Walton, 1996). In particular:
F = F × U (1)where F ≈ 96485 (2)
and U = 1 C mol−1 (3)
In bond graph terms, the single bond graph TF component representing F has been split into twoTF components: one representing the the purely numerical conversion F and one representingthe purely dimensional conversion U .
Hence it is possible to define two new derived units, the Faraday-equivalent voltage V =FJ mol−1 and the Faraday-equivalent current A = 1
Fmol s−1. Using these units, the Faraday-
equivalent potential φ, Faraday-equivalent affinity Φ and the Faraday-equivalent flow f are de-fined in terms of chemical potential µ and molar flow v as:
Faraday-equivalent chemical potential φ =µ
FV (4)
Faraday-equivalent reaction affinity Φ =A
FV (5)
Faraday-equivalent flow f = FvA (6)
For example, consider NAD at standard conditions which has a chemical potential at standardconditions µNAD = 18 100 J mol−1; the corresponding Faraday-equivalent potential is φNAD =188 mV. Similarly, a molar flow of v = 1 µmol s−1 has a Faraday-equivalent flow of aboutf = 97 mA. Faraday-equivalent chemical potentials for some other species are given in Table 1.
1 Job and Herrmann (2006) suggest the Gibbs (G) as a the unit of chemical potential, but this is not widely used.
4
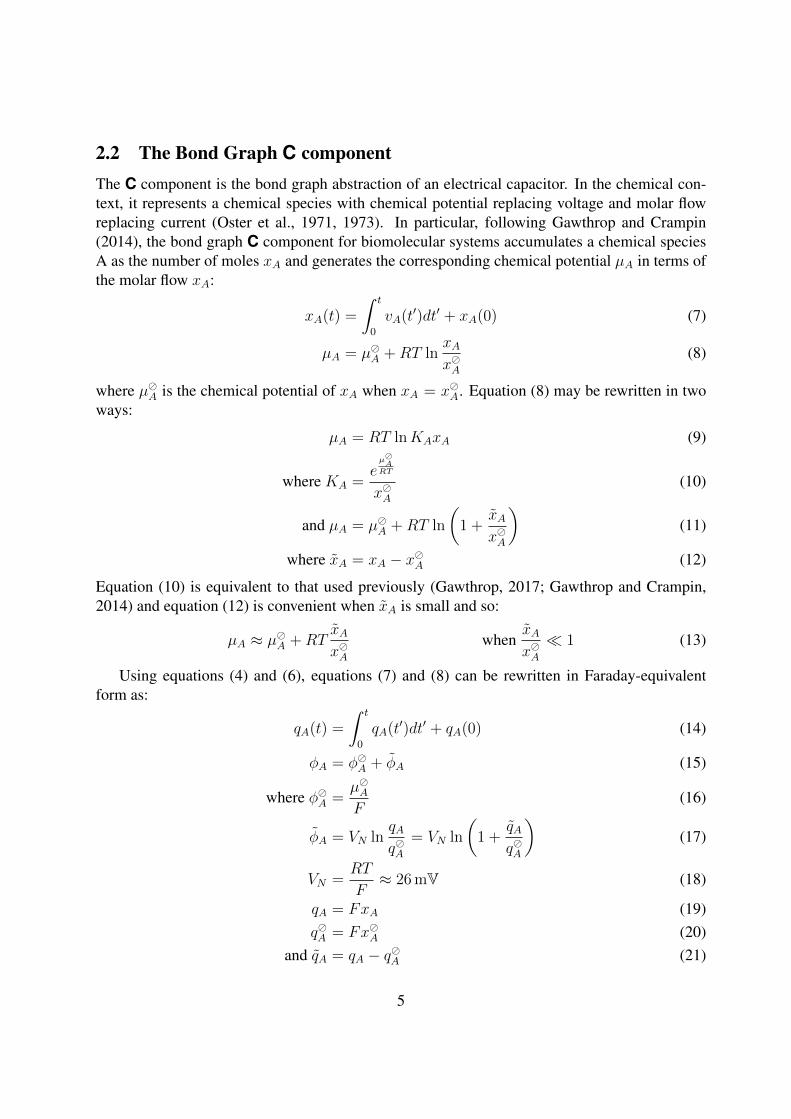
2.2 The Bond Graph C componentThe C component is the bond graph abstraction of an electrical capacitor. In the chemical con-text, it represents a chemical species with chemical potential replacing voltage and molar flowreplacing current (Oster et al., 1971, 1973). In particular, following Gawthrop and Crampin(2014), the bond graph C component for biomolecular systems accumulates a chemical speciesA as the number of moles xA and generates the corresponding chemical potential µA in terms ofthe molar flow xA:
xA(t) =
∫ t
0
vA(t′)dt′ + xA(0) (7)
µA = µA +RT lnxAxA
(8)
where µA is the chemical potential of xA when xA = xA. Equation (8) may be rewritten in twoways:
µA = RT lnKAxA (9)
where KA =eµART
xA(10)
and µA = µA +RT ln
(1 +
xAxA
)(11)
where xA = xA − xA (12)
Equation (10) is equivalent to that used previously (Gawthrop, 2017; Gawthrop and Crampin,2014) and equation (12) is convenient when xA is small and so:
µA ≈ µA +RTxAxA
whenxAxA 1 (13)
Using equations (4) and (6), equations (7) and (8) can be rewritten in Faraday-equivalentform as:
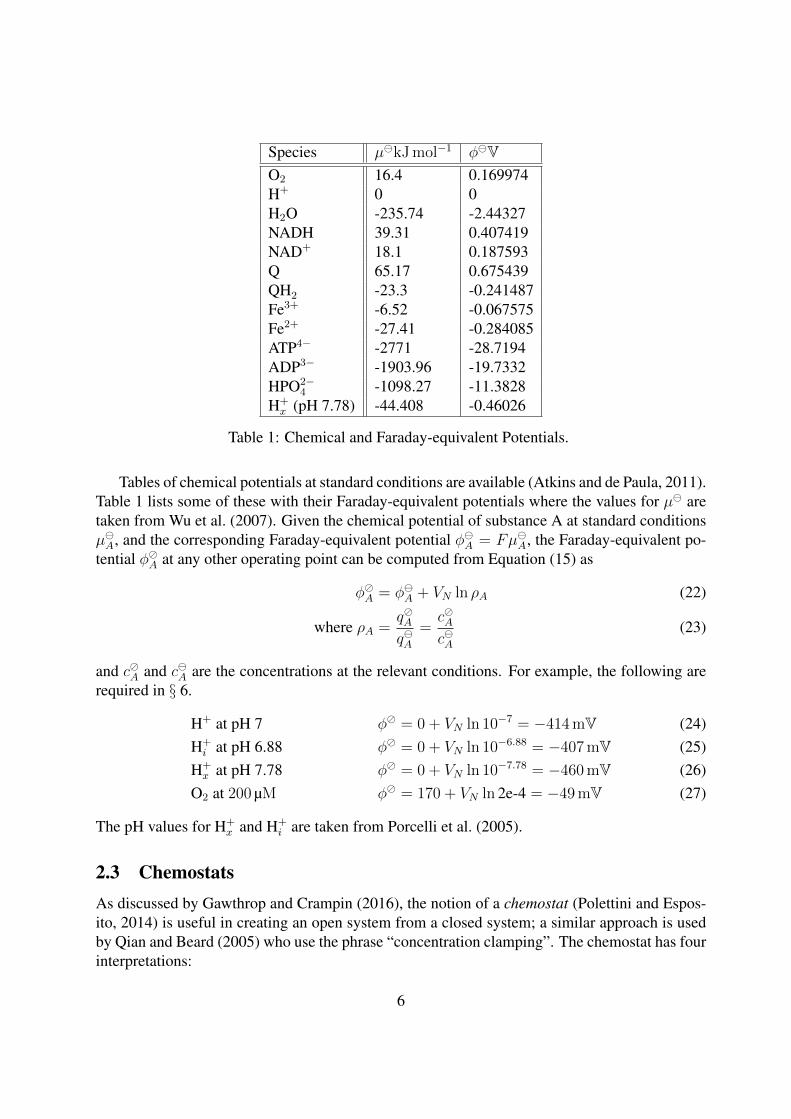
Table 1: Chemical and Faraday-equivalent Potentials.
Tables of chemical potentials at standard conditions are available (Atkins and de Paula, 2011).Table 1 lists some of these with their Faraday-equivalent potentials where the values for µ aretaken from Wu et al. (2007). Given the chemical potential of substance A at standard conditionsµA, and the corresponding Faraday-equivalent potential φA = FµA, the Faraday-equivalent po-tential φA at any other operating point can be computed from Equation (15) as
φA = φA + VN ln ρA (22)
where ρA =qAqA
=cAcA
(23)
and cA and cA are the concentrations at the relevant conditions. For example, the following arerequired in § 6.
H+ at pH 7 φ = 0 + VN ln 10−7 = −414 mV (24)H+
i at pH 6.88 φ = 0 + VN ln 10−6.88 = −407 mV (25)H+
x at pH 7.78 φ = 0 + VN ln 10−7.78 = −460 mV (26)O2 at 200 µM φ = 170 + VN ln 2e-4 = −49 mV (27)
The pH values for H+x and H+
i are taken from Porcelli et al. (2005).
2.3 ChemostatsAs discussed by Gawthrop and Crampin (2016), the notion of a chemostat (Polettini and Espos-ito, 2014) is useful in creating an open system from a closed system; a similar approach is usedby Qian and Beard (2005) who use the phrase “concentration clamping”. The chemostat has fourinterpretations:
6
1. one or more species is fixed to give a constant concentration (Gawthrop et al., 2015a);this implies that an appropriate external flow is applied to balance the internal flow of thespecies.
2. an ideal feedback controller is applied to species to be fixed with setpoint as the fixedconcentration and control signal an external flow.
3. as a C component with a fixed state and
4. as an ideal source of Faraday-equivalent potential: φ = φ.
In this paper, a further interpretation is added. In § 4, a chemostat is interpreted as an externalport of a module which allows connection to other modules.
2.4 The Bond Graph Re componentThe R component is the bond graph abstraction of an electrical resistor. In the chemical context,a two-port R component represents a chemical reaction with chemical affinity (net chemicalpotential) replacing voltage and molar flow replacing current (Oster et al., 1971, 1973). As it is sofundamental, this two port R component is given a special symbol: Re (Gawthrop and Crampin,2014). In particular, the Re component determines a reaction flow v1 in terms of forward andreverse affinities Af
1 and Ar1 as the Marcelin – de Donder formula (Van Rysselberghe, 1958):
v1 = κ1
(exp
Af1
RT− exp
Ar1
RT
)(28)
in the special case of mass-action kinetics, κ is a constant. Otherwise κ is a function of theforward and reverse affinities Af
1 and Ar1. Using equations (5) and (6), equation (28) can be
rewritten in Faraday-equivalent form as:
f1 =VNr1
(exp
Φf1
VN− exp
Φr1
VN
)(29)
where r1 =VNFκ1
(30)
VN is given by Equation (18) and the resistance r1 has units of ohms (Ω). Alternatively:
f1 =VNr1
2 expΦ1
VNsinh
Φ1
VN
2(31)
where Φ1 =Φf
1 + Φ21
2(32)
and Φ =Φf
1 − Φr1
2(33)
7
When the normalised reaction affinity Φ1
VN 1:
f1 ≈(
expΦ1
VN
)Φ1
r1
(34)
3 Redox reactions
C:NADH C:NAD C:Q C:QH2
C:H
C:E1 C:E2
Re:r1 Re:r2Re:r
0 0
0 0
0 0
00
0 0
1 1 1 1
V1 i1 V2 i2
Φr2
f2f2
Φf1
f1 f1 f f
V1 V2Φr1 + 2V1 Φf
2 + 2V2
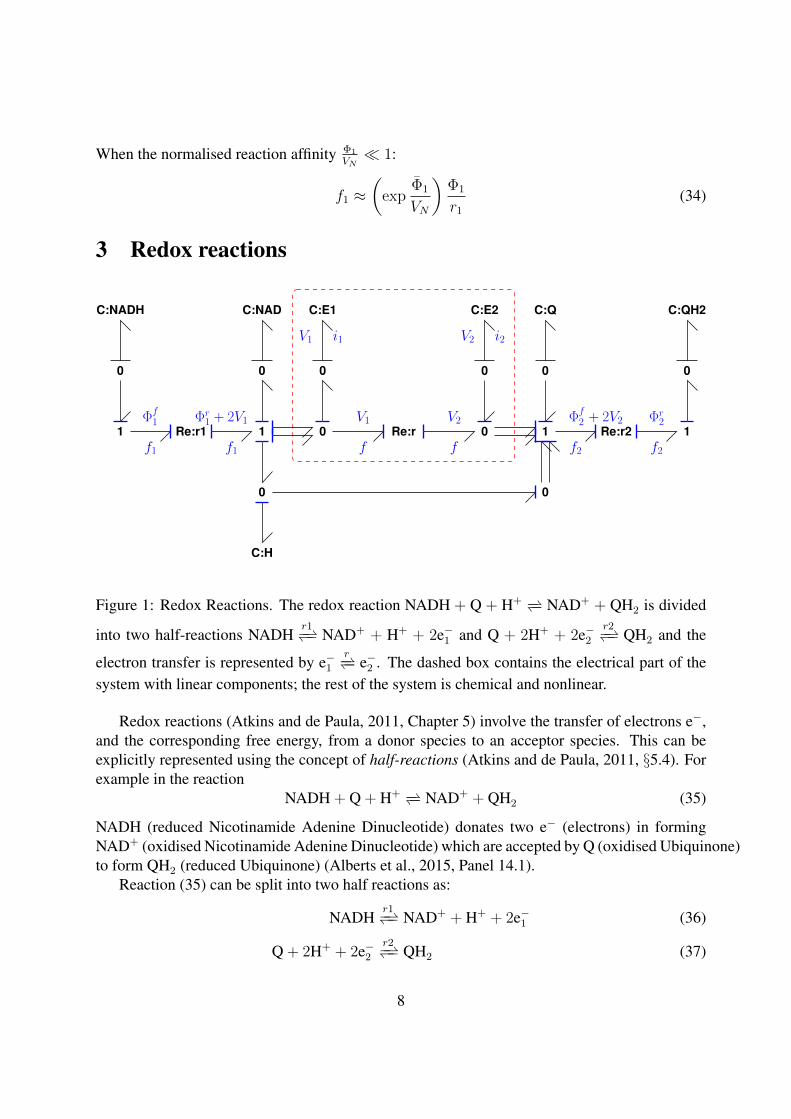
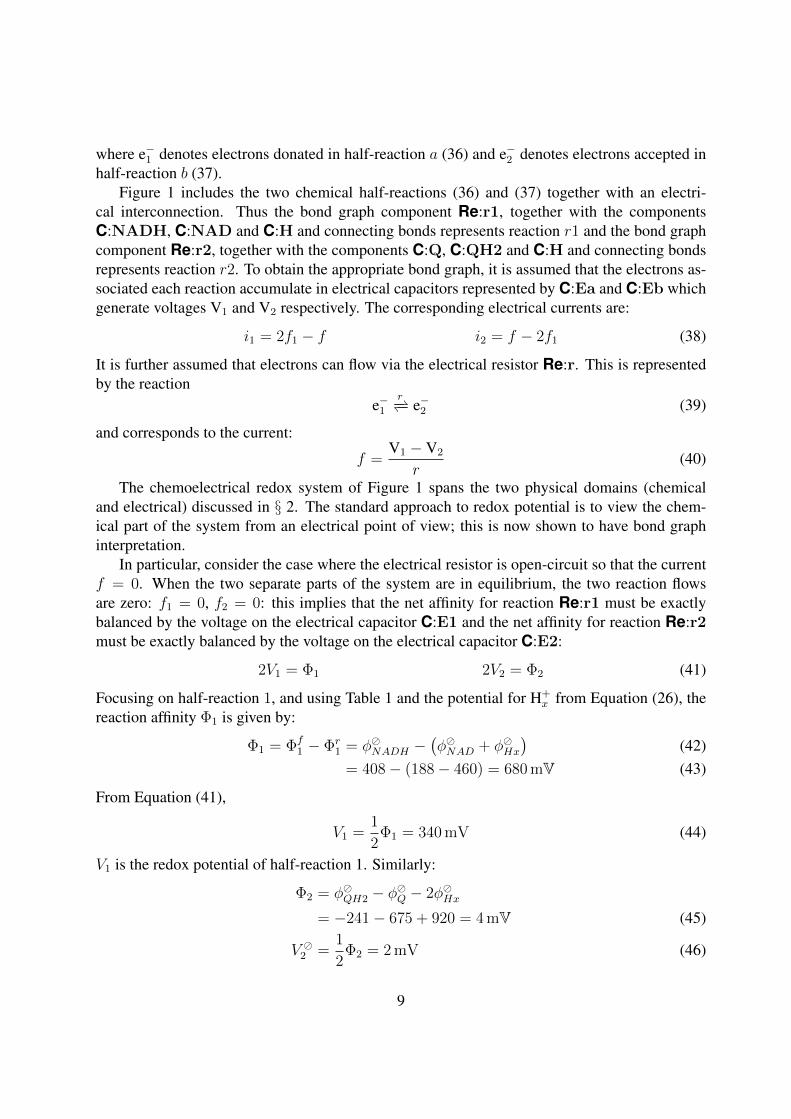
Figure 1: Redox Reactions. The redox reaction NADH + Q + H+ −− NAD+ + QH2 is divided
into two half-reactions NADHr1−− NAD+ + H+ + 2e−1 and Q + 2H+ + 2e−2
r2−− QH2 and the
electron transfer is represented by e−1r−− e−2 . The dashed box contains the electrical part of the
system with linear components; the rest of the system is chemical and nonlinear.
Redox reactions (Atkins and de Paula, 2011, Chapter 5) involve the transfer of electrons e−,and the corresponding free energy, from a donor species to an acceptor species. This can beexplicitly represented using the concept of half-reactions (Atkins and de Paula, 2011, §5.4). Forexample in the reaction
NADH + Q + H+ −− NAD+ + QH2 (35)
NADH (reduced Nicotinamide Adenine Dinucleotide) donates two e− (electrons) in formingNAD+ (oxidised Nicotinamide Adenine Dinucleotide) which are accepted by Q (oxidised Ubiquinone)to form QH2 (reduced Ubiquinone) (Alberts et al., 2015, Panel 14.1).
Reaction (35) can be split into two half reactions as:
NADHr1−− NAD+ + H+ + 2e−1 (36)
Q + 2H+ + 2e−2r2−− QH2 (37)
8
where e−1 denotes electrons donated in half-reaction a (36) and e−2 denotes electrons accepted inhalf-reaction b (37).
Figure 1 includes the two chemical half-reactions (36) and (37) together with an electri-cal interconnection. Thus the bond graph component Re:r1, together with the componentsC:NADH, C:NAD and C:H and connecting bonds represents reaction r1 and the bond graphcomponent Re:r2, together with the components C:Q, C:QH2 and C:H and connecting bondsrepresents reaction r2. To obtain the appropriate bond graph, it is assumed that the electrons as-sociated each reaction accumulate in electrical capacitors represented by C:Ea and C:Eb whichgenerate voltages V1 and V2 respectively. The corresponding electrical currents are:
i1 = 2f1 − f i2 = f − 2f1 (38)
It is further assumed that electrons can flow via the electrical resistor Re:r. This is representedby the reaction
e−1r−− e−2 (39)
and corresponds to the current:
f =V1 − V2
r(40)
The chemoelectrical redox system of Figure 1 spans the two physical domains (chemicaland electrical) discussed in § 2. The standard approach to redox potential is to view the chem-ical part of the system from an electrical point of view; this is now shown to have bond graphinterpretation.
In particular, consider the case where the electrical resistor is open-circuit so that the currentf = 0. When the two separate parts of the system are in equilibrium, the two reaction flowsare zero: f1 = 0, f2 = 0: this implies that the net affinity for reaction Re:r1 must be exactlybalanced by the voltage on the electrical capacitor C:E1 and the net affinity for reaction Re:r2must be exactly balanced by the voltage on the electrical capacitor C:E2:
2V1 = Φ1 2V2 = Φ2 (41)
Focusing on half-reaction 1, and using Table 1 and the potential for H+x from Equation (26), the
reaction affinity Φ1 is given by:
Φ1 = Φf1 − Φr
1 = φNADH −(φNAD + φHx
)(42)
= 408− (188− 460) = 680 mV (43)
From Equation (41),
V1 =1
2Φ1 = 340 mV (44)
V1 is the redox potential of half-reaction 1. Similarly:
Φ2 = φQH2 − φQ − 2φHx
= −241− 675 + 920 = 4 mV (45)
V 2 =1
2Φ2 = 2 mV (46)
9
Using the standard sign convention, V 2 is minus the redox potential of half-reaction 2. Theoverall redox potential is given by:
V = V 1 − V 2 = 338 mV (47)
If current is allowed to flow through the resistor, all the energy associated with the redoxpotential V is wastefully dissipated. In contrast, the CI complex of the mitochondrial respira-tory chain uses the flow of electrons to pump protons across the inner mitochondrial membraneagainst both a concentration and electrical gradient: thus much of the energy associated withV is transduced and stored as the mitochondrial proton-motive force (Mitchell, 1993, 2011;Nicholls and Ferguson, 2013). This is examined in §§4 & 5.
4 Computational Modularity
C:E1 C:E2
C:HiC:Hx
C:P
C:S1
C:S2
C:S3 C:S4
C:S5
C:S6
Re:r12
Re:r23
Re
:r3
4
Re:r45
Re:r56
Re
:r6
1
TF
:tf
TF
:tr
0
0
0
0
0
0
0
0
0
1
1 1 1
1
(a) Proton pump
SS:[E1]
SS:[Hx] SS:[Hi]
SS:[E2]
SS:[P]
C:S1
C:S2
C:S3 C:S4
C:S5
C:S6
Re:r12
Re:r23
Re
:r3
4
Re:r45
Re:r56R
e:r
61
TF
:tf
TF
:tr
0
0
0
0
0
0
0
0
0
1
1 1 1
1
(b) Proton pump module
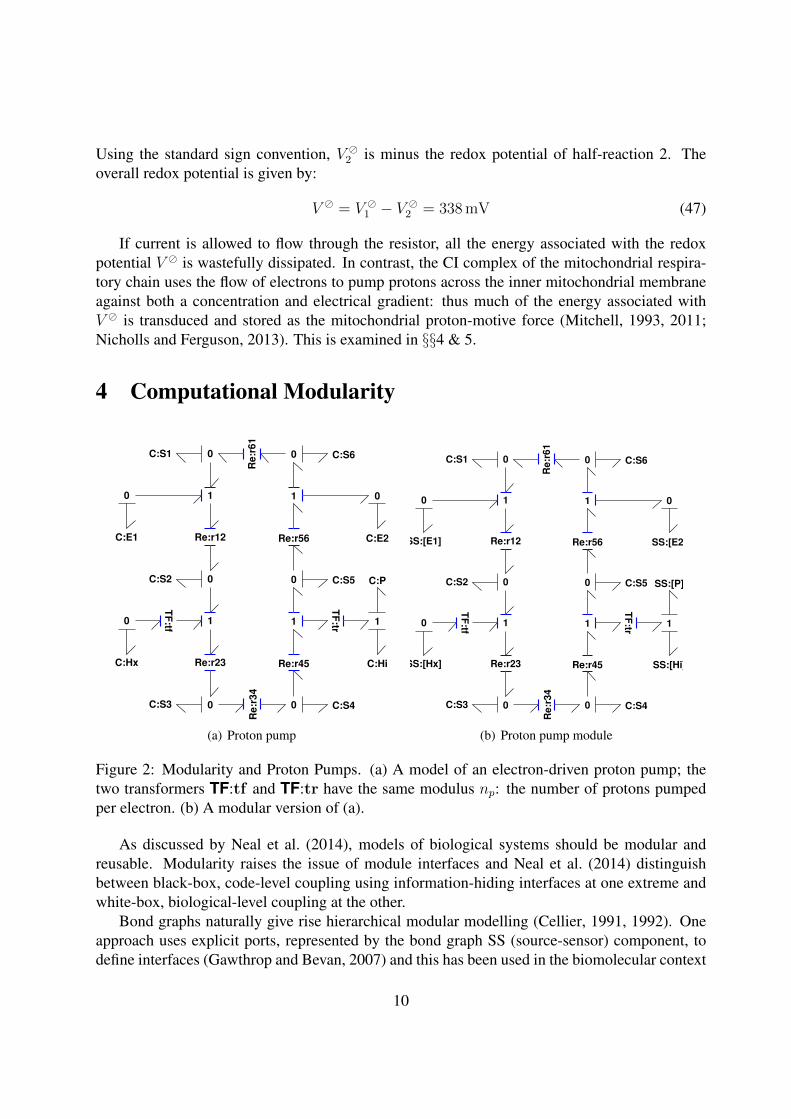
Figure 2: Modularity and Proton Pumps. (a) A model of an electron-driven proton pump; thetwo transformers TF:tf and TF:tr have the same modulus np: the number of protons pumpedper electron. (b) A modular version of (a).
As discussed by Neal et al. (2014), models of biological systems should be modular andreusable. Modularity raises the issue of module interfaces and Neal et al. (2014) distinguishbetween black-box, code-level coupling using information-hiding interfaces at one extreme andwhite-box, biological-level coupling at the other.
Bond graphs naturally give rise hierarchical modular modelling (Cellier, 1991, 1992). Oneapproach uses explicit ports, represented by the bond graph SS (source-sensor) component, todefine interfaces (Gawthrop and Bevan, 2007) and this has been used in the biomolecular context
10
(Gawthrop et al., 2015a). However, this does have the disadvantages of the black-box approachdiscussed by Neal et al. (2014). This paper uses an alternative approach to bond graph modularityinspired by the approach of Neal et al. (2016). The basic idea is simple: modules are self-contained and have no explicit ports; but any species, as represented by a C component hasthe potential to become a port. Thus if two modules share the same species, the correspondingC component in each module is replaced by an SS component with the same name, and thespecies is explicitly represented as a C component on a higher level. Moreover, each modulecan be individually tested by replacing the relevant C components by chemostats. Although notpresent in the current implementations, explicit connection to ontology databases such as theOntology of Physics for Biology (Cook et al., 2011) or composite ontologies (Gennari et al.,2011) would be required for general use.
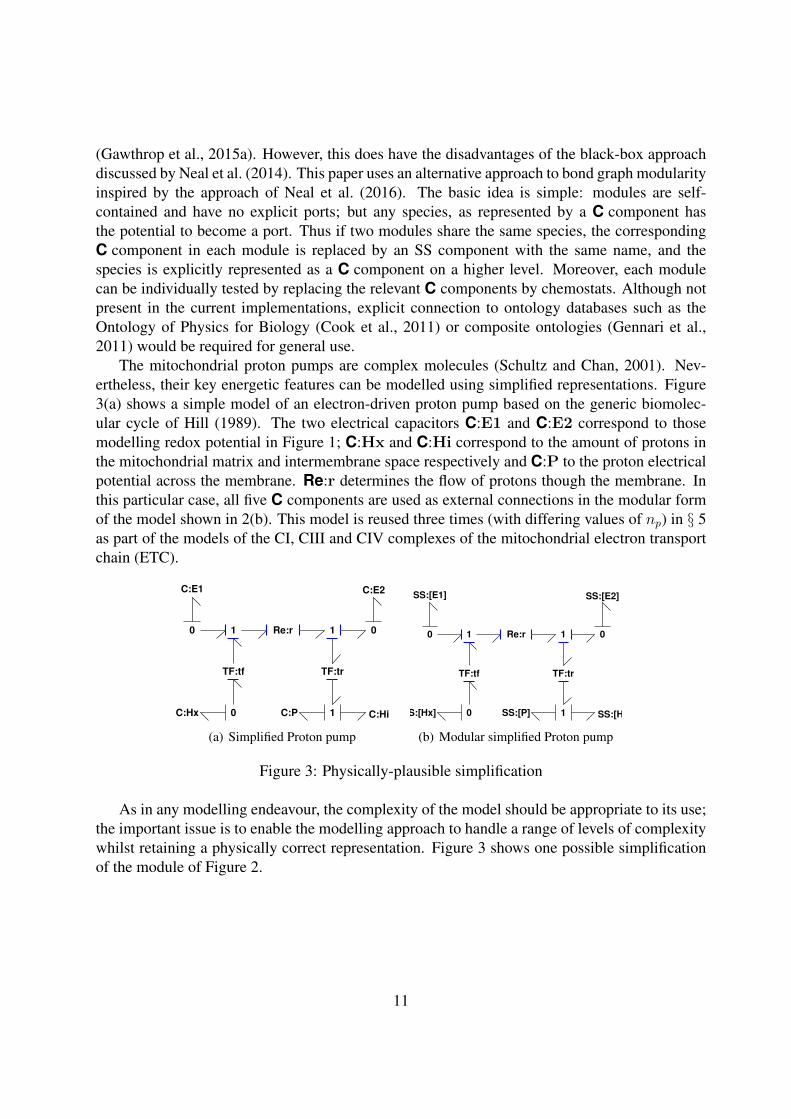
The mitochondrial proton pumps are complex molecules (Schultz and Chan, 2001). Nev-ertheless, their key energetic features can be modelled using simplified representations. Figure3(a) shows a simple model of an electron-driven proton pump based on the generic biomolec-ular cycle of Hill (1989). The two electrical capacitors C:E1 and C:E2 correspond to thosemodelling redox potential in Figure 1; C:Hx and C:Hi correspond to the amount of protons inthe mitochondrial matrix and intermembrane space respectively and C:P to the proton electricalpotential across the membrane. Re:r determines the flow of protons though the membrane. Inthis particular case, all five C components are used as external connections in the modular formof the model shown in 2(b). This model is reused three times (with differing values of np) in § 5as part of the models of the CI, CIII and CIV complexes of the mitochondrial electron transportchain (ETC).
C:E1 C:E2
C:HiC:Hx C:P
Re:r
TF:tf TF:tr
0
0
01 1
1
(a) Simplified Proton pump
SS:[E1] SS:[E2]
SS:[Hx] SS:[P] SS:[Hi]
Re:r
TF:tf TF:tr
0
0
01 1
1
(b) Modular simplified Proton pump
Figure 3: Physically-plausible simplification
As in any modelling endeavour, the complexity of the model should be appropriate to its use;the important issue is to enable the modelling approach to handle a range of levels of complexitywhilst retaining a physically correct representation. Figure 3 shows one possible simplificationof the module of Figure 2.
11
[NADH]
[Q] [QH2]
[NAD] [Fe3]
[QH2] [Q]
[Fe2] [Fe2]
[O2] [H2O]
[Fe3]
[Hx]
[P][Hi] [Hi] [P]
[Hx] [Hx]
[Hi] [P]
C:NADH C:NAD
C:Q
C:QH2
C:Fe3
C:Fe2
C:O2 C:H2O
C:Hx
C:Hi
C:P
mCI mCIII mCIV0
0
0 0 0
0
0
00
00
0
0 0
0 0
0
0
0
0
0
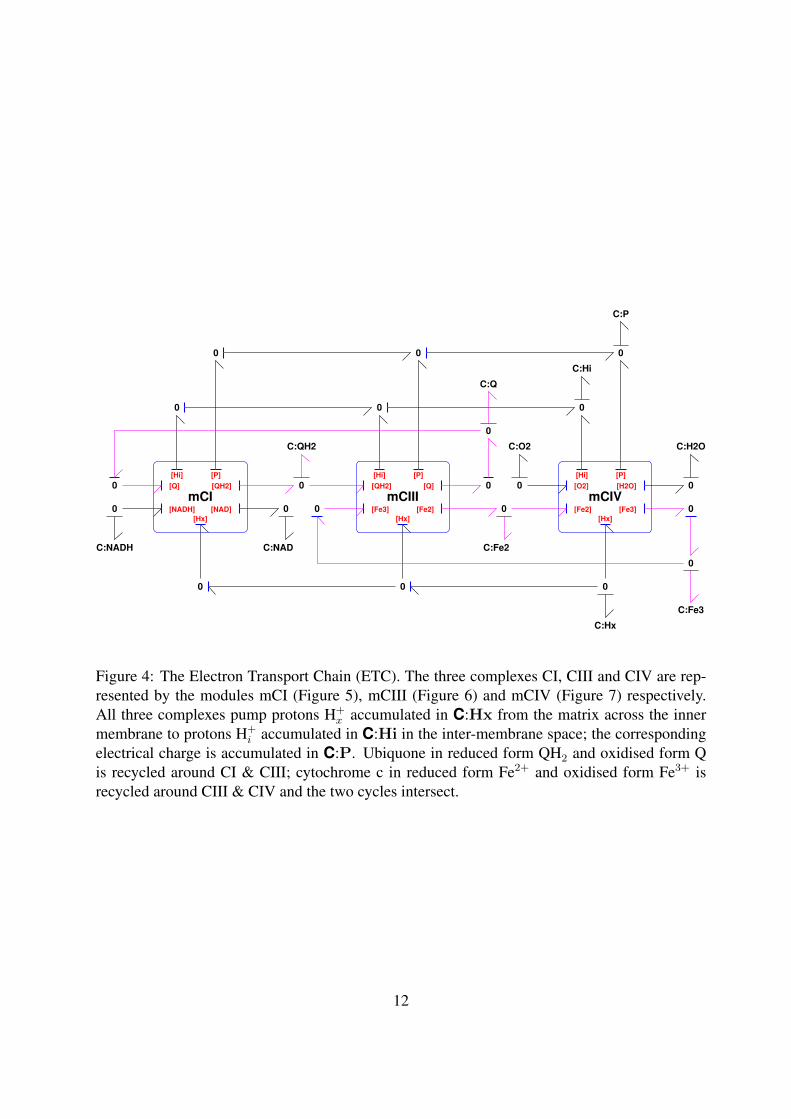
Figure 4: The Electron Transport Chain (ETC). The three complexes CI, CIII and CIV are rep-resented by the modules mCI (Figure 5), mCIII (Figure 6) and mCIV (Figure 7) respectively.All three complexes pump protons H+
x accumulated in C:Hx from the matrix across the innermembrane to protons H+
i accumulated in C:Hi in the inter-membrane space; the correspondingelectrical charge is accumulated in C:P. Ubiquone in reduced form QH2 and oxidised form Qis recycled around CI & CIII; cytochrome c in reduced form Fe2+ and oxidised form Fe3+ isrecycled around CIII & CIV and the two cycles intersect.
12
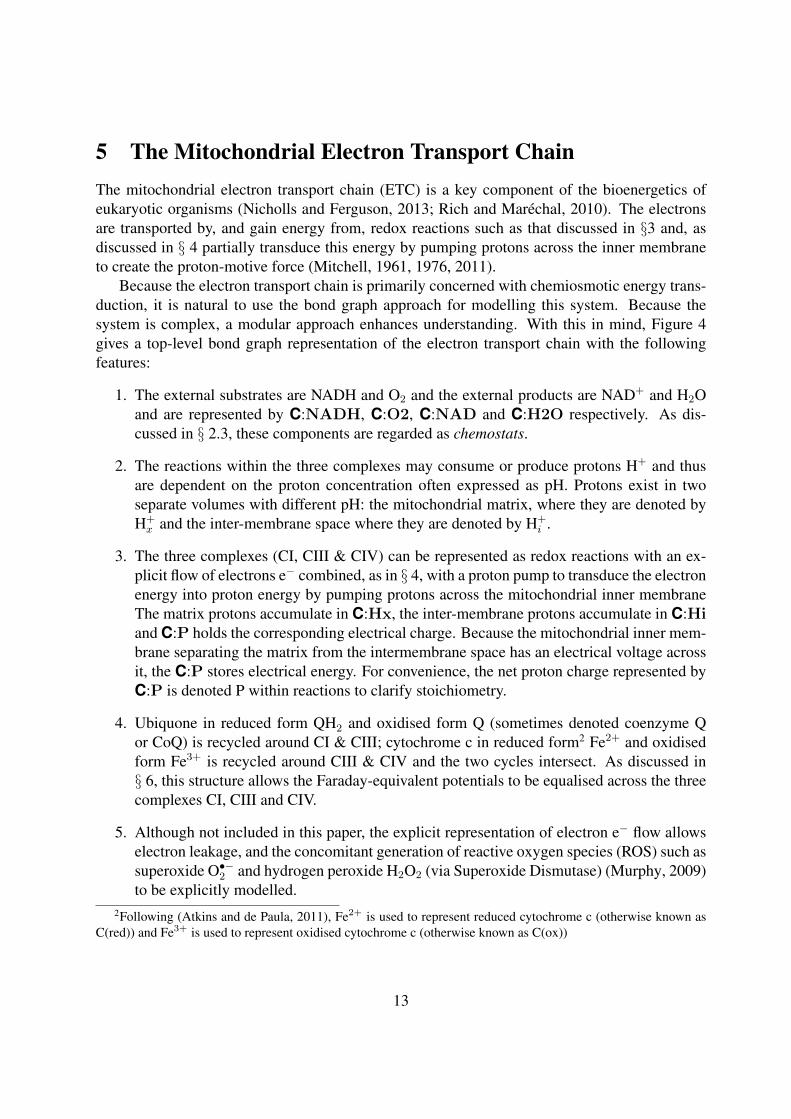
5 The Mitochondrial Electron Transport ChainThe mitochondrial electron transport chain (ETC) is a key component of the bioenergetics ofeukaryotic organisms (Nicholls and Ferguson, 2013; Rich and Marechal, 2010). The electronsare transported by, and gain energy from, redox reactions such as that discussed in §3 and, asdiscussed in § 4 partially transduce this energy by pumping protons across the inner membraneto create the proton-motive force (Mitchell, 1961, 1976, 2011).
Because the electron transport chain is primarily concerned with chemiosmotic energy trans-duction, it is natural to use the bond graph approach for modelling this system. Because thesystem is complex, a modular approach enhances understanding. With this in mind, Figure 4gives a top-level bond graph representation of the electron transport chain with the followingfeatures:
1. The external substrates are NADH and O2 and the external products are NAD+ and H2Oand are represented by C:NADH, C:O2, C:NAD and C:H2O respectively. As dis-cussed in § 2.3, these components are regarded as chemostats.
2. The reactions within the three complexes may consume or produce protons H+ and thusare dependent on the proton concentration often expressed as pH. Protons exist in twoseparate volumes with different pH: the mitochondrial matrix, where they are denoted byH+
x and the inter-membrane space where they are denoted by H+i .
3. The three complexes (CI, CIII & CIV) can be represented as redox reactions with an ex-plicit flow of electrons e− combined, as in § 4, with a proton pump to transduce the electronenergy into proton energy by pumping protons across the mitochondrial inner membraneThe matrix protons accumulate in C:Hx, the inter-membrane protons accumulate in C:Hiand C:P holds the corresponding electrical charge. Because the mitochondrial inner mem-brane separating the matrix from the intermembrane space has an electrical voltage acrossit, the C:P stores electrical energy. For convenience, the net proton charge represented byC:P is denoted P within reactions to clarify stoichiometry.
4. Ubiquone in reduced form QH2 and oxidised form Q (sometimes denoted coenzyme Qor CoQ) is recycled around CI & CIII; cytochrome c in reduced form2 Fe2+ and oxidisedform Fe3+ is recycled around CIII & CIV and the two cycles intersect. As discussed in§ 6, this structure allows the Faraday-equivalent potentials to be equalised across the threecomplexes CI, CIII and CIV.
5. Although not included in this paper, the explicit representation of electron e− flow allowselectron leakage, and the concomitant generation of reactive oxygen species (ROS) such assuperoxide O•−2 and hydrogen peroxide H2O2 (via Superoxide Dismutase) (Murphy, 2009)to be explicitly modelled.
2Following (Atkins and de Paula, 2011), Fe2+ is used to represent reduced cytochrome c (otherwise known asC(red)) and Fe3+ is used to represent oxidised cytochrome c (otherwise known as C(ox))
13
5.1 Complex CI
[E2]
[P]
[E1]
[Hx] [Hi]
C:NADH C:NAD C:Q C:QH2
C:Hx C:Hi
C:E1 C:E2
C:P
Re:r1 Re:r2
mppn:pp
0 0
0 0
0 0
00
0
0 0
0
1 1 1 111
V1 i1 V2 i2
Φr2
f2
Φf2
f2
Φf1
f1
Φr1
f1 f f
V1 V2
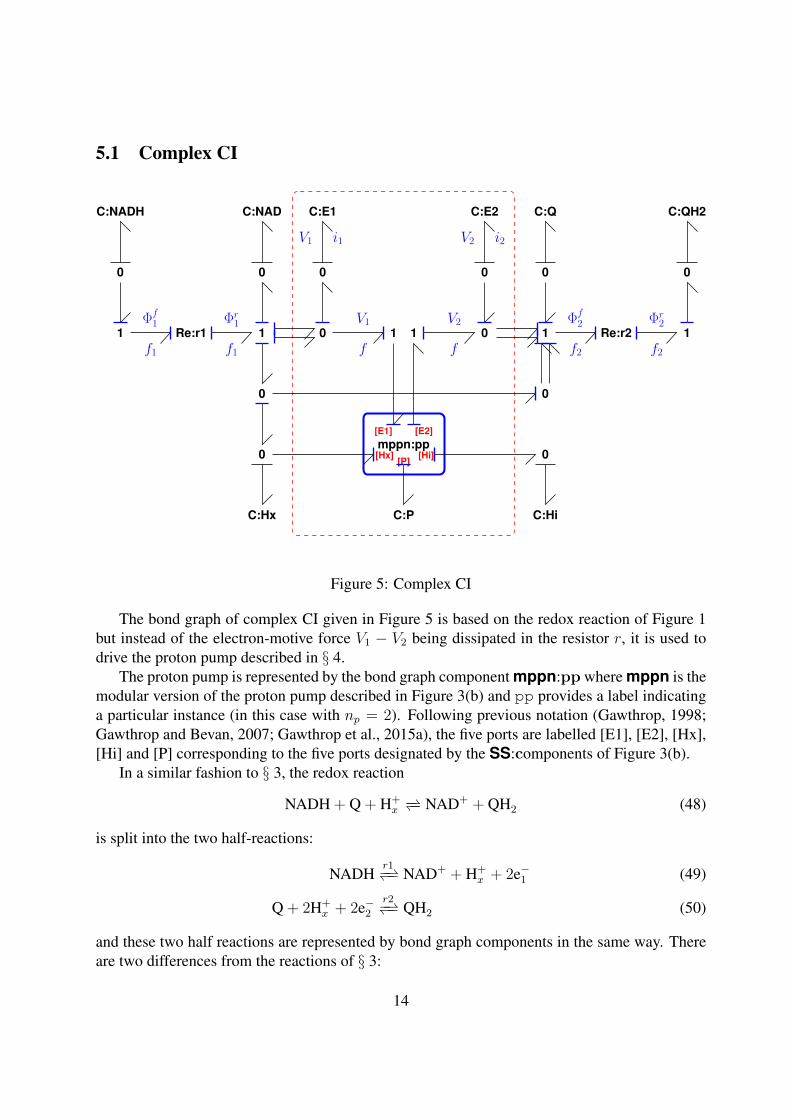
Figure 5: Complex CI
The bond graph of complex CI given in Figure 5 is based on the redox reaction of Figure 1but instead of the electron-motive force V1 − V2 being dissipated in the resistor r, it is used todrive the proton pump described in § 4.
The proton pump is represented by the bond graph component mppn:pp where mppn is themodular version of the proton pump described in Figure 3(b) and pp provides a label indicatinga particular instance (in this case with np = 2). Following previous notation (Gawthrop, 1998;Gawthrop and Bevan, 2007; Gawthrop et al., 2015a), the five ports are labelled [E1], [E2], [Hx],[Hi] and [P] corresponding to the five ports designated by the SS:components of Figure 3(b).
In a similar fashion to § 3, the redox reaction
NADH + Q + H+x−− NAD+ + QH2 (48)
is split into the two half-reactions:
NADHr1−− NAD+ + H+
x + 2e−1 (49)
Q + 2H+x + 2e−2
r2−− QH2 (50)
and these two half reactions are represented by bond graph components in the same way. Thereare two differences from the reactions of § 3:
14
1. the energy from the redox reaction is no longer dissipated in the component Re:r but areused to drive the proton pump represented by mppn:pp. The pump removes protons H+
x
from the matrix and deposits them as H+i in the intermembrane space; as discussed above,
the matrix protons accumulate in C:Hx, the inter-membrane protons accumulate in C:Hiand C:P holds the corresponding electrical charge.
2. the hydrogen ions H+x are explicitly associated with the mitochondrial matrix.
In this case, np = 2 and thus two protons are pumped from the matrix to the intermembranespace for each electron associated with the redox reaction. As two electrons are associated witheach molecule of NADH, four protons are pumped for each molecule of NADH consumed in thereaction. In addition, reaction Re:r1 produces one, and reaction Re:r2 consumes two, protonsin the matrix. Thus the overall reaction represented by Figure 5 is:
NADH + Q + 5H+x
CI−− NAD+ + QH2 + 4H+i + 4P (51)
In Figure 16 of his Nobel Lecture, Mitchell (1993) draws insightful comparisons betweenfuel cells and mitochondria. In particular, he notes that the two half-reactions are coupled byelectrons (electricity) and protons (proticity). The difference is that fuel cells are designed togenerate electricity whereas the electron transport chain of mitochondria generates proticity. Thisis also the situation in Figures 5, 6 and 7 where electrons flow in the upper part of the diagramand protons in the lower and the two half reactions are to the left and the right. Thus the bondgraph representation of complexes CI, CIII and CIV reflects the situation depicted by Mitchell(1993, Figure 16).
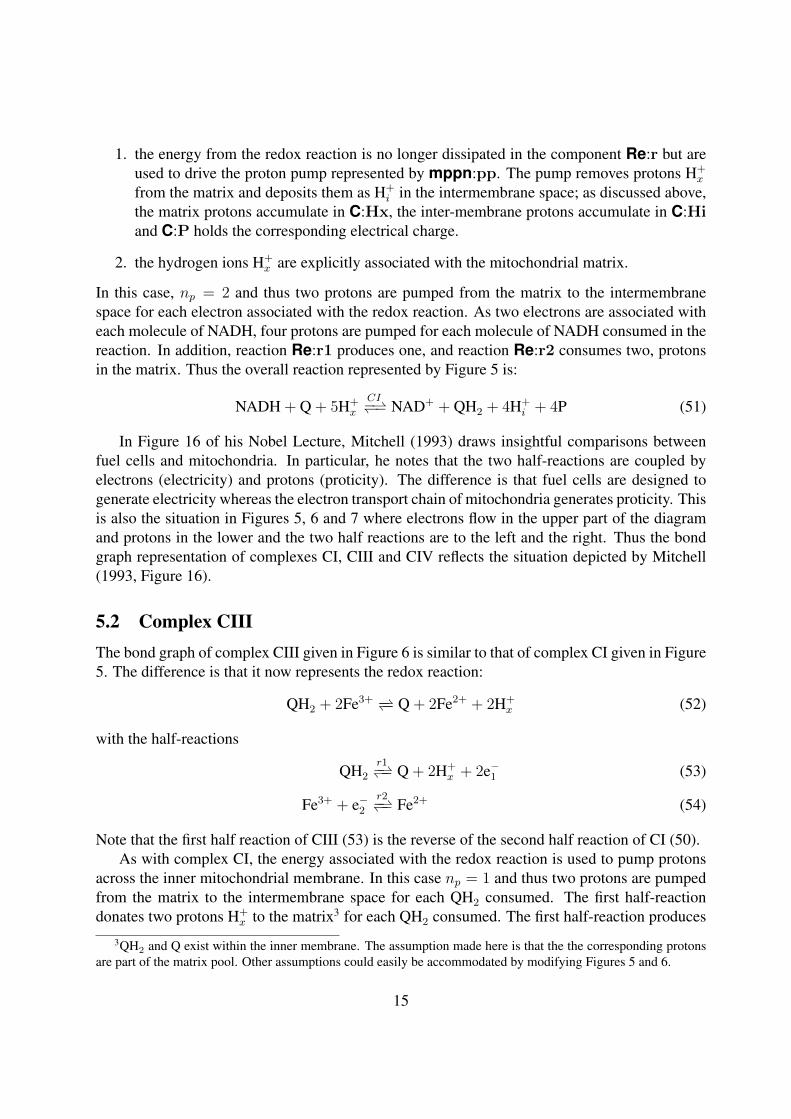
5.2 Complex CIIIThe bond graph of complex CIII given in Figure 6 is similar to that of complex CI given in Figure5. The difference is that it now represents the redox reaction:
QH2 + 2Fe3+ −− Q + 2Fe2+ + 2H+x (52)
with the half-reactions
QH2
r1−− Q + 2H+x + 2e−1 (53)
Fe3+ + e−2r2−− Fe2+ (54)
Note that the first half reaction of CIII (53) is the reverse of the second half reaction of CI (50).As with complex CI, the energy associated with the redox reaction is used to pump protons
across the inner mitochondrial membrane. In this case np = 1 and thus two protons are pumpedfrom the matrix to the intermembrane space for each QH2 consumed. The first half-reactiondonates two protons H+
x to the matrix3 for each QH2 consumed. The first half-reaction produces3QH2 and Q exist within the inner membrane. The assumption made here is that the the corresponding protons
are part of the matrix pool. Other assumptions could easily be accommodated by modifying Figures 5 and 6.
15
[E2]
[P]
[E1]
[Hx] [Hi]
C:QH2 C:Q C:Fe3 C:Fe2
C:Hx C:Hi
C:E1 C:E2
C:P
Re:r1 Re:r2
mppn:pp
0 0
0 0
0 0
0
0
0 0
0
1 11 1 1 1
V1 i1 V2 i2
Φr2
f2
Φf2
f2
Φf1
f1
Φr1
f1 f f
V1 V2
Figure 6: Complex CIII
two electrons for each QH2 consumed and the second half-reaction consumes one electron foreach Fe3+ consumed. Thus the overall reaction represented by Figure 6 is:
QH2 + 2Fe3+ CIII−−−−−− Q + 2Fe2+ + 2H+i + 2P (55)
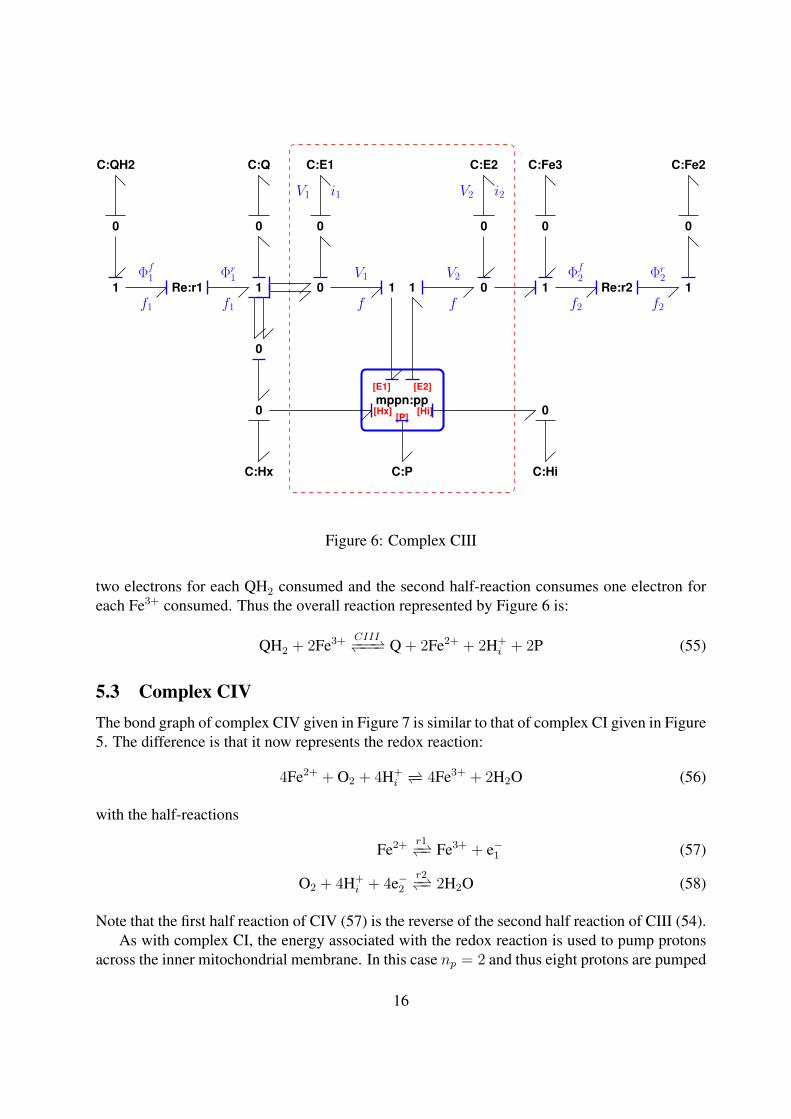
5.3 Complex CIVThe bond graph of complex CIV given in Figure 7 is similar to that of complex CI given in Figure5. The difference is that it now represents the redox reaction:
4Fe2+ + O2 + 4H+i−− 4Fe3+ + 2H2O (56)
with the half-reactions
Fe2+ r1−− Fe3+ + e−1 (57)
O2 + 4H+i + 4e−2
r2−− 2H2O (58)
Note that the first half reaction of CIV (57) is the reverse of the second half reaction of CIII (54).As with complex CI, the energy associated with the redox reaction is used to pump protons
across the inner mitochondrial membrane. In this case np = 2 and thus eight protons are pumped
16
[E2]
[P]
[E1]
[Hx] [Hi]
C:Fe2 C:Fe3 C:O2 C:H2O
C:Hx C:Hi
C:E1 C:E2
C:P
Re:r1 Re:r2
mppn:pp
0 0
0 0
0 0
0
0
0 0
0
1 11 1 1 1
V1 i1 V2 i2
Φr2
f2
Φf2
f2
Φf1
f1
Φr1
f1 f f
V1 V2
Figure 7: Complex CIV
from the matrix to the intermembrane space for each oxygen molecule O2 consumed. The firsthalf-reaction consumes two protons H+
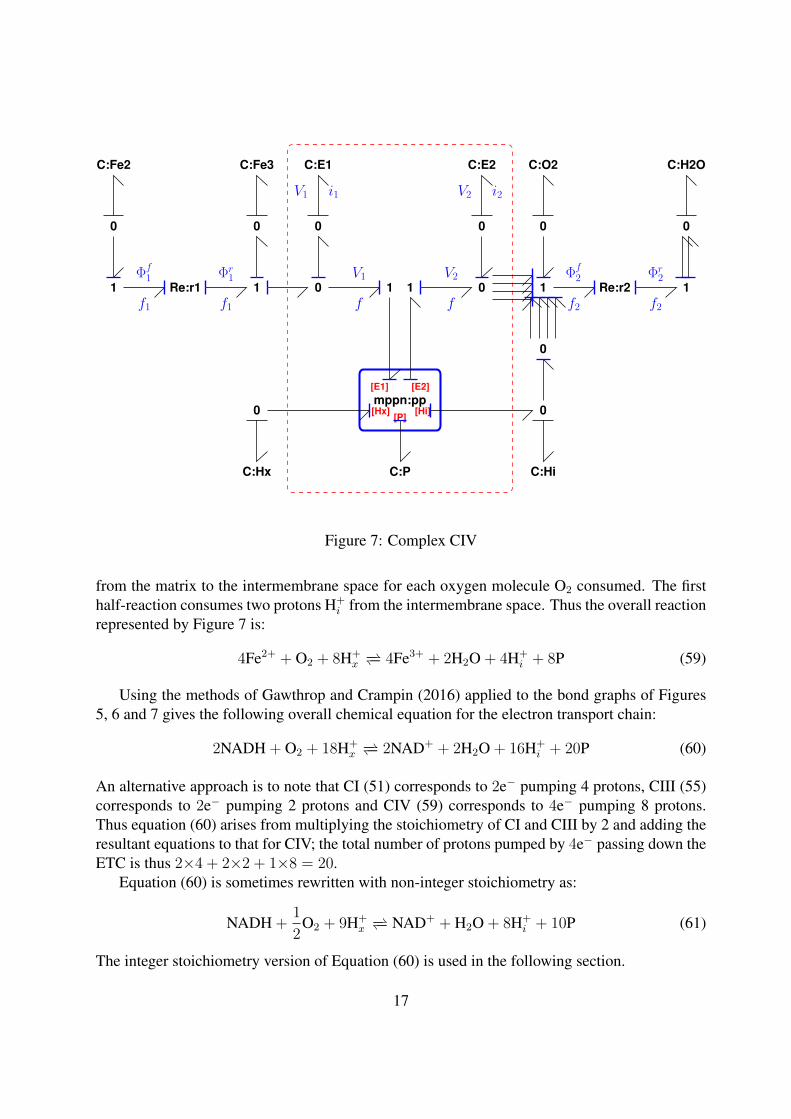
i from the intermembrane space. Thus the overall reactionrepresented by Figure 7 is:
4Fe2+ + O2 + 8H+x−− 4Fe3+ + 2H2O + 4H+
i + 8P (59)
Using the methods of Gawthrop and Crampin (2016) applied to the bond graphs of Figures5, 6 and 7 gives the following overall chemical equation for the electron transport chain:
2NADH + O2 + 18H+x−− 2NAD+ + 2H2O + 16H+
i + 20P (60)
An alternative approach is to note that CI (51) corresponds to 2e− pumping 4 protons, CIII (55)corresponds to 2e− pumping 2 protons and CIV (59) corresponds to 4e− pumping 8 protons.Thus equation (60) arises from multiplying the stoichiometry of CI and CIII by 2 and adding theresultant equations to that for CIV; the total number of protons pumped by 4e− passing down theETC is thus 2×4 + 2×2 + 1×8 = 20.
Equation (60) is sometimes rewritten with non-integer stoichiometry as:
NADH +1
2O2 + 9H+
x−− NAD+ + H2O + 8H+
i + 10P (61)
The integer stoichiometry version of Equation (60) is used in the following section.
17
-5 -4 -3 -2 -1 0 1 2-100
0
100
200
300
400
φO2 (V)
∆ψ&
∆p
(mV
)
∆ψ∆p
(a) ∆ψ & ∆p
-5 -4 -3 -2 -1 0 1 2-1000
-500
0
500
1000
φO2 (V)
φ Q&
φ Fe
(mV
)
φQ
φFe
(b) φQ & φFe
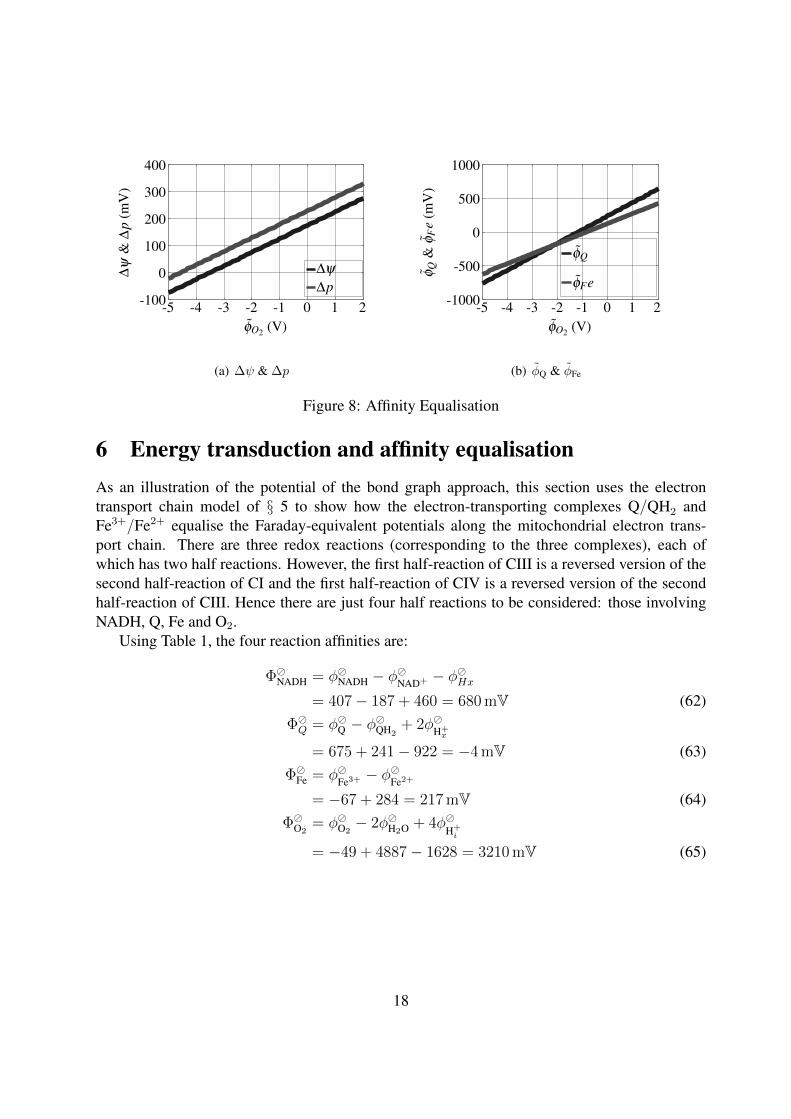
Figure 8: Affinity Equalisation
6 Energy transduction and affinity equalisationAs an illustration of the potential of the bond graph approach, this section uses the electrontransport chain model of § 5 to show how the electron-transporting complexes Q/QH2 andFe3+/Fe2+ equalise the Faraday-equivalent potentials along the mitochondrial electron trans-port chain. There are three redox reactions (corresponding to the three complexes), each ofwhich has two half reactions. However, the first half-reaction of CIII is a reversed version of thesecond half-reaction of CI and the first half-reaction of CIV is a reversed version of the secondhalf-reaction of CIII. Hence there are just four half reactions to be considered: those involvingNADH, Q, Fe and O2.
where ΦETC is the overall affinity of the electron transport chain summarised by Equation (60)4
.Each complex drives protons across the inner membrane against the PMF ∆p; but each com-
plex drives a different number of protons: nCI = 4, nCIII = 2 and nCIV = 8. The overallnumber of protons transferred by the electron transport chain is
nETC = 2nCI + 2nCIII + nCIV = 20 (70)
ΦCI =ΦCI
nCI
=676
4= 169 mV (71)
ΦCIII =ΦCIII
nCIII
=438
2= 219 mV (72)
ΦCIV =ΦCIV
nCIV
=2344
8= 293 mV (73)
Φ =ΦETC
nETC
=4572
20= 228 mV (74)
Thus with these values of working concentrations, the maximum PMF ∆p is determined by thesmallest of these values, namely 169 mV for complex CI and the other two complexes havewasted affinity.
Complex CIII acts as an electronic bridge between the the Q/QH2 and the Fe3+/Fe2+ poolsand therefore can regulate the entire electronic transport chain (Sarewicz and Osyczka, 2014). Inparticular, allowing the concentrations relating to the Q and Fe half reactions to vary gives twodegrees of freedom to equalise the complex affinities per proton. That is:
ΦCI = ΦCI + ΦCI = ΦCI + ΦQ (75)
ΦCIII = ΦCIII + ΦCIII = ΦCIII − ΦQ + 2ΦFe (76)
ΦCIV = ΦCIV + ΦCIV = ΦCIV − 4ΦFe (77)
4 Equation (60) corresponds to 4e− passing down the ETC. The non-integer stoichiometry version (61) corre-sponds to 2e− passing down the ETC and thus the corresponding affinity is 1
2ΦETC = 2286 mV = 220 kJmol−1.
This is the figure quoted in the literature (Nath, 2016; Nicholls and Ferguson, 2013).
19
As ΦETC is not affected by ΦQ or ΦFe, the three complex affinities per proton can all be set to
∆p = Φ =ΦETC
nETC
(78)
Hence equations (75) and (77) can rewritten as:
ΦQ = ΦCI − ΦCI = nCIΦ− ΦCI
= 912− 676 = 236 mV (79)
ΦFe = −1
4
(ΦCIV − ΦCIV
)= −1
4
(nCIV Φ− ΦCIV
)= −1
4(1824− 2344) = 130 mV (80)
It can be verified that this choice of ΦQ and ΦFe equalises the three complex affinities per proton:ΦCI = ΦCIII = ΦCIV = Φ. The corresponding concentration ratios are:
ρQ = expΦQ
VN= 1.0328× 10⁴ (81)
ρFe = expΦFe
VN= 151.0 (82)
The formulae (78), (79) & (80) can be used to evaluate the PMF ∆p, and the incrementalchanges in the poll affinities ΦQ ΦFe as the concentration of O2, as reflected in the potential φO2
changes.Figure 8 shows the results of changing the concentration of O2 so that the potential is varied
by φO2 . Figure 8(a) shows how the PMF ∆p and voltage ∆ψ vary and Figure 8(b) shows howthe potentials φQ & φFe of the two pools vary. This corresponds to the fact that hypoxia effectsmitochondrial oxidative metabolism (Solaini et al., 2010).
7 Synthesis of ATPATP hydrolysis is a key energy-generating reaction in biochemistry. Following Berg et al. (2012),it may be written as:
ATP4− + H2O −− ADP3− + HPO2−4 + H+ (83)
where HPO2−4 is the orthophosphate ion commonly referred to as inorganic phosphate or Pi. Us-
ing the proton-motive force generated by the electron transport chain of § 5, this reaction can bedriven in reverse to synthesise ATP4− from ADP3− and HPO2−
4 . As discussed in § 3, the standarddecomposition of redox reactions into half reactions has a neat bond graph representation whichallows the coupling of a proton pump in a natural way. The essence of the half-reaction approachis that the two half reactions are coupled by one or more electrons e−. Here, it is suggested thatthis idea can be generalised by allowing the coupling to be some arbitrary chemical entity. In
20
[E2][E1]
[Hx] [Hi][P]
C:ATP C:ADP C:H2O C:HPO4
C:Hx C:Hi
C:PO1 C:PO2
C:P
Re:r1 Re:r2
mppn:pp
0
0
0 0
0 0
0 0
0
0
0 0
0
1 1 1 111
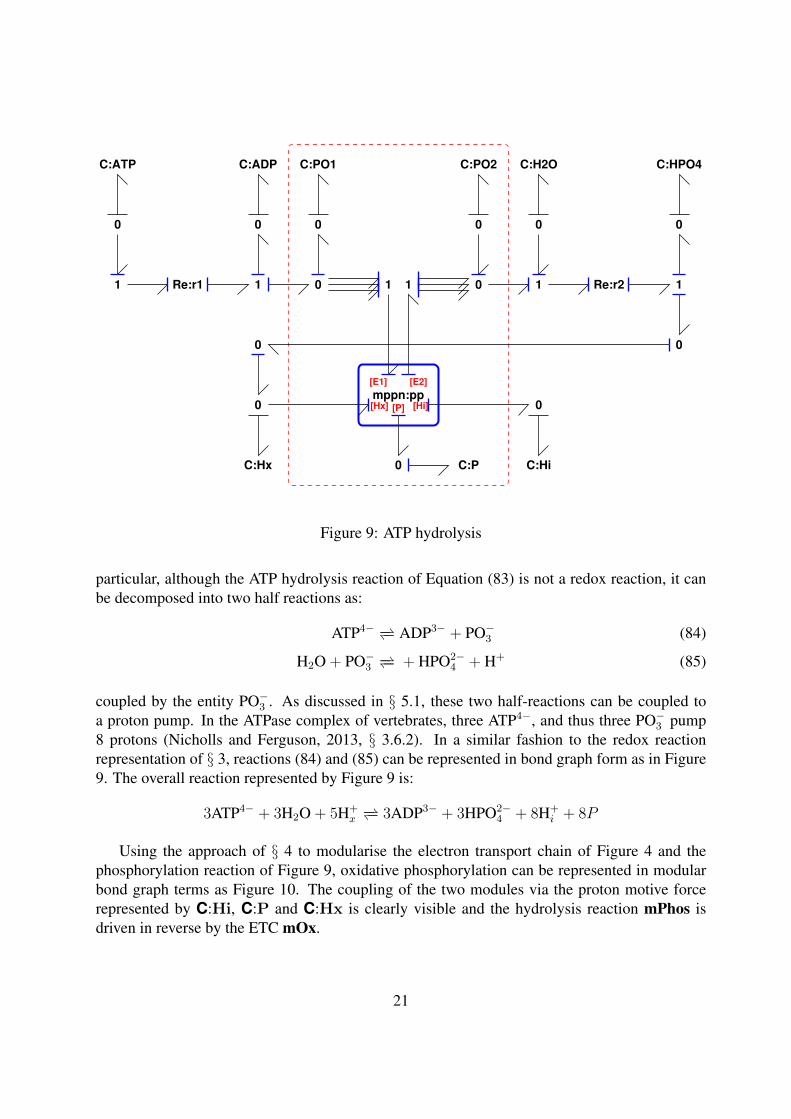
Figure 9: ATP hydrolysis
particular, although the ATP hydrolysis reaction of Equation (83) is not a redox reaction, it canbe decomposed into two half reactions as:
ATP4− −− ADP3− + PO−3 (84)
H2O + PO−3 −− + HPO2−4 + H+ (85)
coupled by the entity PO−3 . As discussed in § 5.1, these two half-reactions can be coupled toa proton pump. In the ATPase complex of vertebrates, three ATP4−, and thus three PO−3 pump8 protons (Nicholls and Ferguson, 2013, § 3.6.2). In a similar fashion to the redox reactionrepresentation of § 3, reactions (84) and (85) can be represented in bond graph form as in Figure9. The overall reaction represented by Figure 9 is:
3ATP4− + 3H2O + 5H+x−− 3ADP3− + 3HPO2−
4 + 8H+i + 8P
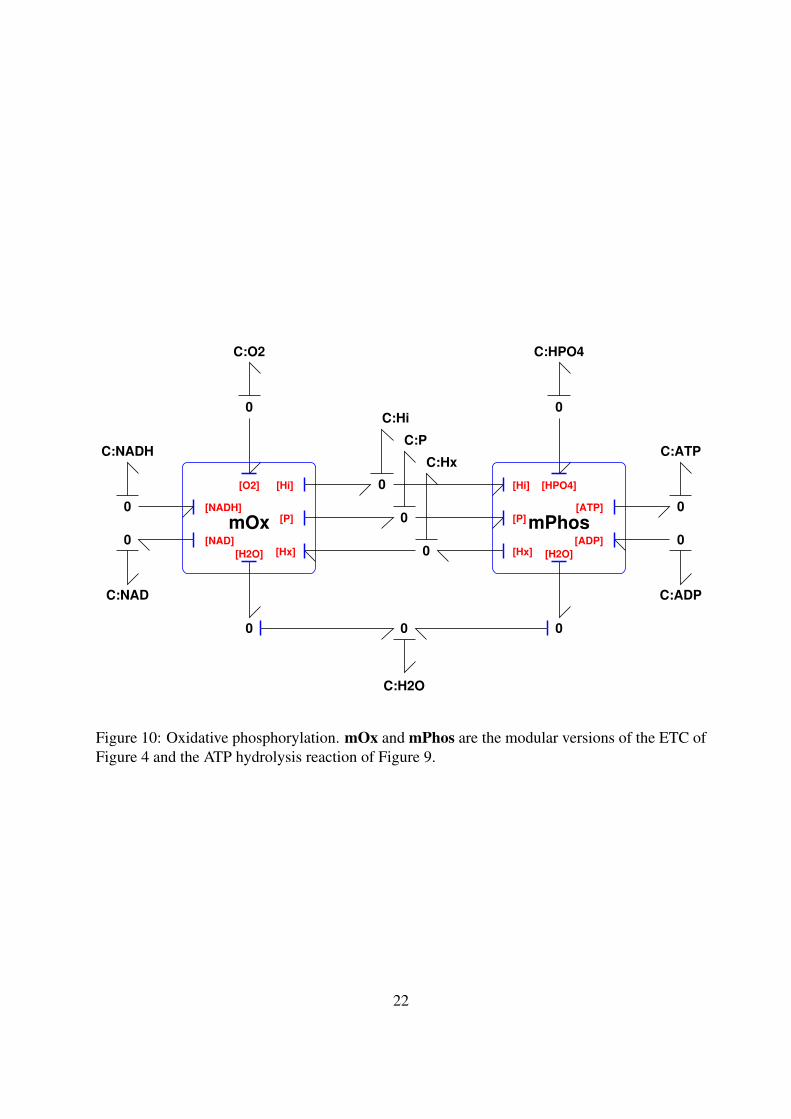
Using the approach of § 4 to modularise the electron transport chain of Figure 4 and thephosphorylation reaction of Figure 9, oxidative phosphorylation can be represented in modularbond graph terms as Figure 10. The coupling of the two modules via the proton motive forcerepresented by C:Hi, C:P and C:Hx is clearly visible and the hydrolysis reaction mPhos isdriven in reverse by the ETC mOx.
21
[NAD]
[NADH] [ATP]
[ADP][Hx] [Hx]
[Hi] [Hi]
[P] [P]
[O2] [HPO4]
[H2O] [H2O]
C:NADH
C:NAD
C:O2
C:H2O
C:Hx
C:Hi
C:P
C:ADP
C:HPO4
C:ATP
mOx mPhos0
0 0
0
0
00 0
0
00
0
Figure 10: Oxidative phosphorylation. mOx and mPhos are the modular versions of the ETC ofFigure 4 and the ATP hydrolysis reaction of Figure 9.
22
8 ConclusionIt has been shown that combining previous work on the bond graph modelling of biomolecularsystems with the Faraday-equivalent chemical potential and an alternative concept of bond graphmodularity gives a seamless approach to modelling complex chemiosmotic biological systemsinvolving biochemical reactions, electrons and protons. Using a new bond graph representa-tion of redox reactions, the approach has been applied to give a model of the mitochondrialelectron transport chain. As an illustration, this model is then used to show how the electron-transporting complexes Q/QH2 and Fe3+/Fe2+ equalise the Faraday-equivalent potentials alongthe mitochondrial electron transport chain. More generally, the approach of this paper providesan approach to analysing and understanding energy flows in complex biomolecular systems – forexample, those within the Physiome Project (Hunter, 2016).
The appropriate level of complexity of a given model depends on the use to which the modelis put. For example, it would be helpful to extend the mitochondrial electron transport chainto include the Q-cycle (Hunte et al., 2003) in complex CIII, the production of reactive oxygenspecies (ROS) (Bazil et al., 2016; Murphy, 2009; Vinogradov and Grivennikova, 2016) and thecorresponding cellular control systems (Cosentino and Bates, 2012; Dunn et al., 2015; Vinnakotaet al., 2016). On the other hand, for some purposes the model of this paper may be too detailed;in this case the energy-based pathway analysis of Gawthrop and Crampin (2016) can be usedto give a reduced model retaining the key thermodynamic features. Versions of a model of aparticular biomolecular subsystem (for example, CIII) can be encapsulated as modules and usedand reused within larger systems to give the appropriate complexity.
It has been argued by Nath and Villadsen (2015) that Mitchell’s chemiosmotic theory isdeficient in that “the energy transducing complexes involved in oxidative phosphorylation andphotosynthesis are proton-dicarboxylic acid anion cotransporters” rather than just proton trans-porters. It would be interesting to create bond graph models corresponding to this hypothesisand compare the models with those of this paper.
The energy balance of biomolecular systems has been discussed in the literature (Ghafuriet al., 2014; Gibbs and Chapman, 1985; Harris et al., 2012; Sengupta and Stemmler, 2014) andsummarised by Nath (2016) in the context of oxidative phosphorylation. The energy-based ap-proach used here forms the basis of an alternative efficiency analysis of biomolecular systemsand this is the subject of current research (Gawthrop et al., 2015b).
Although not discussed here, the bond graph approach leads to dynamic models which canbe used to generate time-course data via simulation. Moreover, stability issues can be consideredin this context (Gawthrop and Crampin, 2016). This is the subject of current research. Althoughnot discussed here, spatial variation issues are of interest. Externally, mitochondria change theirshape, size and clustering configuration (Jarosz et al., 2016) and, according to the mechano-chemiosmotic model, they change their shape internally (Kasumov et al., 2015). It would beinteresting to include spatial effects within the bond graph formulation of this paper.
In addition to the oxidative phosphorylation model of Figure 10, a model of mitochondrialmetabolism would include glycolysis, the conversion of pyruvate to acetyl coenzyme A, and thecitric acid cycle (Alberts et al., 2015; Berg et al., 2012). The modular energy-based approachof this paper will be extended to more complete model making use of the pre-existing modular
23
bond graph model of glycolysis (Gawthrop et al., 2015a).Because mitochondria are critical to life, mitochondrial dysfunction is hypothesised to be the
source of ageing (Alberts et al., 2015; Wellstead, 2012), neuro-degenerative diseases (Cloutieret al., 2012; Drion et al., 2012; Francis et al., 2012; Le Masson et al., 2014; Poliquin et al., 2013;Wellstead, 2012; Wellstead and Cloutier, 2012) cancer (Gogvadze et al., 2008; Marin-Hernandezet al., 2014; Solaini et al., 2011) and other diseases (Nunnari and Suomalainen, 2012; Wallace,2005). Although mathematical models of mitochondria exist already (Bazil et al., 2016; Cortassaand Aon, 2014; Vinnakota et al., 2016; Wu et al., 2007), it is hoped that the engineering-inspiredbond graph approach of this paper will shed further light on the function and dysfunction ofmitochondria. This is the subject of current research.
The equations describing the examples are worked out in some detail in the paper; how-ever, the results can also be automatically generated from the system bond graphs. To illus-trate this, a Virtual Reference Environment (Hurley et al., 2014) is available for this paper atdoi:10.5281/zenodo.166046. This contains a ISO image of the software, bootable by a virtualmachine, which not only generates all figures in the paper but also automatically generates infor-mation about the systems and modules discussed in the paper.
9 AcknowledgementsPeter Gawthrop would like to thank the Melbourne School of Engineering for its support viaa Professorial Fellowship, Edmund Crampin for help, advice and encouragement and DanielHurley for help with the virtual reference environment. He would also like to thank the reviewersfor their suggestions for improving the paper and drawing his attention to references (Nath, 2016)and (Kasumov et al., 2015).
ReferencesBruce Alberts, Alexander Johnson, Julian Lewis, David Morgan, Martin Raff, Keith Roberts,
and Peter Walter., editors. Molecular Biology of the Cell. Garland Science, Abingdon, UK,sixth edition, 2015.
Brian D. O. Anderson and Sumeth Vongpanitlerd. Network Analysis and Synthesis: A ModernSystems Theory Approach. Dover, 2006. First published 1973 by Prentice-Hall.
Peter Atkins and Julio de Paula. Physical Chemistry for the Life Sciences. Oxford UniversityPress, 2nd edition, 2011.
Jason N. Bazil, Daniel A. Beard, and Kalyan C. Vinnakota. Catalytic coupling of oxidativephosphorylation, ATP demand, and reactive oxygen species generation. Biophysical Journal,110(4):962 – 971, 2016. ISSN 0006-3495. doi:10.1016/j.bpj.2015.09.036.
Daniel A Beard and Hong Qian. Chemical biophysics: quantitative analysis of cellular systems.Cambridge University Press, 2010.
Jeremy M Berg, John L Tymoczko, and Lubert Stryer. Biochemistry: international edition. WHFreeman, New York, seventh edition, 2012. ISBN 978-1-4292-7635-1.
Wolfgang Borutzky. Bond graph methodology: development and analysis of multidisciplinarydynamic system models. Springer, 2010. ISBN 978-1-84882-881-0. doi:10.1007/978-1-84882-882-7.
Salil Bose, Stephanie French, Frank J. Evans, Fredric Joubert, and Robert S. Balaban. Metabolicnetwork control of oxidative phosphorylation: Multiple roles of inorganic phosphate. Journalof Biological Chemistry, 278(40):39155–39165, 2003. doi:10.1074/jbc.M306409200.
Manuel Caravaca, Pilar Sanchez-Andrada, Antonio Soto, and Mateo Alajarin. The net-work simulation method: a useful tool for locating the kinetic-thermodynamic switchingpoint in complex kinetic schemes. Phys. Chem. Chem. Phys., 16:25409–25420, 2014.doi:10.1039/C4CP02079K.
F. E. Cellier. Continuous system modelling. Springer-Verlag, 1991.
F. E. Cellier. Hierarchical non-linear bond graphs: a unified methodology for modeling complexphysical systems. SIMULATION, 58(4):230–248, 1992. doi:10.1177/003754979205800404.
M. Cloutier, R. Middleton, and P. Wellstead. Feedback motif for the pathogenesis of Parkinson’sdisease. Systems Biology, IET, 6(3):86–93, June 2012. ISSN 1751-8849. doi:10.1049/iet-syb.2011.0076.
Daniel L. Cook, Fred L. Bookstein, and John H. Gennari. Physical properties of biologicalentities: An introduction to the ontology of physics for biology. PLoS ONE, 6(12):e28708, 122011. doi:10.1371/journal.pone.0028708.
Sonia Cortassa and MiguelA. Aon. Dynamics of Mitochondrial Redox and Energy Networks:Insights from an Experimental-Computational Synergy. In Miguel A. Aon, Valdur Saks, andUwe Schlattner, editors, Systems Biology of Metabolic and Signaling Networks, volume 16of Springer Series in Biophysics, pages 115–144. Springer Berlin Heidelberg, 2014. ISBN978-3-642-38504-9. doi:10.1007/978-3-642-38505-6 5.
Carlo Cosentino and Declan Bates. Feedback Control in Systems Biology. CRC press, BocaRaton, FL, USA, 2012. ISBN 978-1-4398-1690-5.
Guillaume Drion, Vincent Seutin, and Rodolphe Sepulchre. Mitochondrion- and endoplasmicreticulum-induced SK channel dysregulation as a potential origin of the selective neurode-generation in parkinson’s disease. In Peter Wellstead and Mathieu Cloutier, editors, SystemsBiology of Parkinson’s Disease, chapter 4, pages 57–79. Springer New York, New York, NY,2012. ISBN 978-1-4614-3411-5. doi:10.1007/978-1-4614-3411-5 4.
Joe Dan Dunn, Luis AJ Alvarez, Xuezhi Zhang, and Thierry Soldati. Reactive oxygen speciesand mitochondria: A nexus of cellular homeostasis. Redox Biology, 6:472 – 485, 2015. ISSN2213-2317. doi:10.1016/j.redox.2015.09.005.
Febe Francis, Miriam R. Garcia, and Richard H. Middleton. Energetics of ion transport indopaminergic substantia nigra neurons. In Peter Wellstead and Mathieu Cloutier, editors,Systems Biology of Parkinson’s Disease, pages 81–109. Springer New York, 2012. ISBN978-1-4614-3410-8. doi:10.1007/978-1-4614-3411-5 5.
P. J. Gawthrop and E. J. Crampin. Modular bond-graph modelling and analysis of biomolec-ular systems. IET Systems Biology, 10(5):187–201, October 2016. ISSN 1751-8849.doi:10.1049/iet-syb.2015.0083. Available at arXiv:1511.06482.
P. J. Gawthrop and E. J. Crampin. Energy-based Analysis of Biomolecular Pathways. ArXive-prints, November 2016. URL https://arxiv.org/abs/1611.02332.
P. J. Gawthrop and L. P. S. Smith. Metamodelling: Bond Graphs and Dynamic Systems. PrenticeHall, Hemel Hempstead, Herts, England., 1996. ISBN 0-13-489824-9.
Peter J. Gawthrop. Bond graphs, symbolic algebra and the modelling of complex systems. InProceedings of the UKACC conference “Control ’98”, Swansea, U.K., 1998.
Peter J. Gawthrop. Bond-graph modelling and causal analysis of biomolecular systems. InWolfgang Borutzky, editor, Bond Graphs for Modelling, Control and Fault Diagnosis of En-gineering Systems, pages 587–623. Springer International Publishing, Berlin, 2017. ISBN978-3-319-47434-2. doi:10.1007/978-3-319-47434-2 16.
Peter J Gawthrop and Geraint P Bevan. Bond-graph modeling: A tutorial introduc-tion for control engineers. IEEE Control Systems Magazine, 27(2):24–45, April 2007.doi:10.1109/MCS.2007.338279.
Peter J. Gawthrop and Edmund J. Crampin. Energy-based analysis of biochemical cycles usingbond graphs. Proceedings of the Royal Society A: Mathematical, Physical and EngineeringScience, 470(2171):1–25, 2014. doi:10.1098/rspa.2014.0459. Available at arXiv:1406.2447.
Peter J. Gawthrop, Joseph Cursons, and Edmund J. Crampin. Hierarchical bond graph modellingof biochemical networks. Proceedings of the Royal Society A: Mathematical, Physical and En-gineering Sciences, 471(2184):1–23, 2015a. ISSN 1364-5021. doi:10.1098/rspa.2015.0642.Available at arXiv:1503.01814.
Peter J. Gawthrop, Ivo Siekmann, Tatiana Kameneva, Susmita Saha, Michael R. Ibbotson,and Edmund J. Crampin. The Energetic Cost of the Action Potential: Bond Graph Mod-elling of Electrochemical Energy Transduction in Excitable Membranes. Available atarXiv:1512.00956, 2015b.
John H. Gennari, Maxwell L. Neal, Michal Galdzicki, and Daniel L. Cook. Multiple ontologies inaction: Composite annotations for biosimulation models. Journal of Biomedical Informatics,44(1):146 – 154, 2011. ISSN 1532-0464. doi:10.1016/j.jbi.2010.06.007. Ontologies forClinical and Translational Research.
Mohazabeh Ghafuri, Mohsen Nosrati, Bahareh Golfar, and Saman Hoseinkhani. An improve-ment in the calculation of the efficiency of oxidative phosphorylation and rate of energy dissi-pation in mitochondria. Journal of Non-Equilibrium Thermodynamics, 39(4):175 – 182, 2014.ISSN 03400204.
C. L. Gibbs and J. B. Chapman. Cardiac mechanics and energetics: chemomechanical transduc-tion in cardiac muscle. American Journal of Physiology - Heart and Circulatory Physiology,249(2):H199–H206, 1985.
Vladimir Gogvadze, Sten Orrenius, and Boris Zhivotovsky. Mitochondria in cancer cells: whatis so special about them? Trends in Cell Biology, 18(4):165 – 173, 2008. ISSN 0962-8924.doi:10.1016/j.tcb.2008.01.006.
Julia J. Harris, Renaud Jolivet, and David Attwell. Synaptic energy use and supply. Neuron, 75(5):762 – 777, 2012. ISSN 0896-6273. doi:10.1016/j.neuron.2012.08.019.
Terrell L Hill. Free energy transduction and biochemical cycle kinetics. Springer-Verlag, NewYork, 1989.
A. L. Hodgkin and A. F. Huxley. A quantitative description of membrane current and its ap-plication to conduction and excitation in nerve. The Journal of Physiology, 117(4):500–544,1952.
Carola Hunte, Hildur Palsdottir, and Bernard L Trumpower. Protonmotive pathways and mecha-nisms in the cytochrome bc1 complex. FEBS Letters, 545(1):39 – 46, 2003. ISSN 0014-5793.doi:10.1016/S0014-5793(03)00391-0.
Peter Hunter. The virtual physiological human: The physiome project aims to develop repro-ducible, multiscale models for clinical practice. IEEE Pulse, 7(4):36–42, July 2016. ISSN2154-2287. doi:10.1109/MPUL.2016.2563841.
Daniel G. Hurley, David M. Budden, and Edmund J. Crampin. Virtual reference environ-ments: a simple way to make research reproducible. Briefings in Bioinformatics, 2014.doi:10.1093/bib/bbu043.
Jan Jarosz, Shouryadipta Ghosh, Lea M.D. Delbridge, Amorita Volschenk, Anthony JR Hickey,Edmund J Crampin, Eric Hanssen, and Vijay Rajagopal. Changes in mitochondrial morphol-ogy and organisation can enhance energy supply from mitochondrial oxidative phosphoryla-tion in diabetic cardiomyopathy. American Journal of Physiology - Cell Physiology, 2016.ISSN 0363-6143. doi:10.1152/ajpcell.00298.2016.
G Job and F Herrmann. Chemical potential – a quantity in search of recognition. EuropeanJournal of Physics, 27(2):353–371, 2006. doi:10.1088/0143-0807/27/2/018.
Dean Karnopp. Bond graph models for electrochemical energy storage : electrical, chemical andthermal effects. Journal of the Franklin Institute, 327(6):983 – 992, 1990. ISSN 0016-0032.doi:10.1016/0016-0032(90)90073-R.
Dean C Karnopp, Donald L Margolis, and Ronald C Rosenberg. System Dynamics: Modeling,Simulation, and Control of Mechatronic Systems. John Wiley & Sons, 5th edition, 2012. ISBN978-0470889084.
Eldar A. Kasumov, Ruslan E. Kasumov, and Irina V. Kasumova. A mechano-chemiosmoticmodel for the coupling of electron and proton transfer to ATP synthesis in energy-transformingmembranes: a personal perspective. Photosynthesis Research, 123(1):1–22, 2015. ISSN 1573-5079. doi:10.1007/s11120-014-0043-3.
Nick Lane and William Martin. The energetics of genome complexity. Nature, 467(7318):929–934, Oct 2010. ISSN 0028-0836. doi:10.1038/nature09486.
Gwendal Le Masson, Serge Przedborski, and L.F. Abbott. A computational model ofmotor neuron degeneration. Neuron, 83(4):975 – 988, 2014. ISSN 0896-6273.doi:10.1016/j.neuron.2014.07.001.
Alvaro Marin-Hernandez, Sayra. Lopez-Ramirez, JuanCarlos Gallardo-Perez, Sara Rodriguez-Enriquez, Rafael Moreno-Sanchez, and Emma Saavedra. Systems biology approaches tocancer energy metabolism. In Miguel A. Aon, Valdur Saks, and Uwe Schlattner, editors,Systems Biology of Metabolic and Signaling Networks, volume 16 of Springer Series inBiophysics, pages 213–239. Springer Berlin Heidelberg, 2014. ISBN 978-3-642-38504-9.doi:10.1007/978-3-642-38505-6 9.
J.C. Maxwell. Remarks on the mathematical classification of physical quantities. ProceedingsLondon Mathematical Society, pages 224–233, 1871.
Peter Mitchell. Coupling of phosphorylation to electron and hydrogen transfer by a chemi-osmotic type of mechanism. Nature, 191(4784):144–148, Jul 1961. doi:10.1038/191144a0.
Peter Mitchell. Possible molecular mechanisms of the protonmotive function of cytochromesystems. Journal of Theoretical Biology, 62(2):327–367, 1976. doi:10.1016/0022-5193(76)90124-7.
Peter Mitchell. David Keilins Respiratory Chain Concept and its Chemiosmotic Consequences.In Tore Frangsmyr and Sture Forsen, editors, Nobel Lectures in Chemistry, 1971-1980. WorldScientific, Singapore, 1993. ISBN 981-02-0786-7.
Peter Mitchell. Chemiosmotic coupling in oxidative and photosynthetic phosphorylation.Biochimica et Biophysica Acta (BBA) - Bioenergetics, 1807(12):1507 – 1538, 2011. ISSN0005-2728. doi:10.1016/j.bbabio.2011.09.018. Special Section: Peter Mitchell - 50th an-niversary of the chemiosmotic theory.
Michael P. Murphy. How mitochondria produce reactive oxygen species. Biochemical Journal,417(1):1–13, 2009. ISSN 0264-6021. doi:10.1042/BJ20081386.
Sunil Nath. The thermodynamic efficiency of ATP synthesis in oxidative phosphorylation. Bio-physical Chemistry, 219:69 – 74, 2016. ISSN 0301-4622. doi:10.1016/j.bpc.2016.10.002.
Sunil Nath and John Villadsen. Oxidative phosphorylation revisited. Biotechnology and Bio-engineering, 112(3):429–437, 2015. ISSN 1097-0290. doi:10.1002/bit.25492.
Maxwell L. Neal, Michael T. Cooling, Lucian P. Smith, Christopher T. Thompson, Herbert M.Sauro, Brian E. Carlson, Daniel L. Cook, and John H. Gennari. A reappraisal of how to buildmodular, reusable models of biological systems. PLoS Comput Biol, 10(10):e1003849, 102014. doi:10.1371/journal.pcbi.1003849.
Maxwell L. Neal, Brian E. Carlson, Christopher T. Thompson, Ryan C. James, Karam G. Kim,Kenneth Tran, Edmund J. Crampin, Daniel L. Cook, and John H. Gennari. Semantics-basedcomposition of integrated cardiomyocyte models motivated by real-world use cases. PLoSONE, 10(12):1–18, 12 2016. doi:10.1371/journal.pone.0145621.
David G Nicholls and Stuart Ferguson. Bioenergetics 4. Academic Press, Amsterdam, 2013.
Jodi Nunnari and Anu Suomalainen. Mitochondria: In sickness and in health. Cell, 148(6):1145– 1159, 2012. ISSN 0092-8674. doi:10.1016/j.cell.2012.02.035.
G. Oster and A. Perelson. Chemical reaction networks. Circuits and Systems, IEEE Transactionson, 21(6):709 – 721, November 1974. ISSN 0098-4094. doi:10.1109/TCS.1974.1083946.
George Oster, Alan Perelson, and Aharon Katchalsky. Network thermodynamics. Nature, 234:393–399, December 1971. doi:10.1038/234393a0.
George F. Oster, Alan S. Perelson, and Aharon Katchalsky. Network thermodynamics: dy-namic modelling of biophysical systems. Quarterly Reviews of Biophysics, 6(01):1–134, 1973.doi:10.1017/S0033583500000081.
H. M. Paynter. Analysis and design of engineering systems. MIT Press, Cambridge, Mass., 1961.
Henry M. Paynter. Preface. In J. J. Granda and F. E. Cellier, editors, Proceedings of the Inter-national Conference On Bond Graph Modeling (ICBGM’93), volume 25 of Simulation Series,page v, La Jolla, California, U.S.A., January 1993. Society for Computer Simulation. ISBN1-56555-019-6.
Matteo Polettini and Massimiliano Esposito. Irreversible thermodynamics of open chemicalnetworks. I. Emergent cycles and broken conservation laws. The Journal of Chemical Physics,141(2):024117, 2014. doi:10.1063/1.4886396.
Pierre O. Poliquin, Jingkui Chen, Mathieu Cloutier, Louis-Eric Trudeau, and Mario Jolicoeur.Metabolomics and in-silico analysis reveal critical energy deregulations in animal models ofParkinsons disease. PLoS ONE, 8(7):e69146, 07 2013. doi:10.1371/journal.pone.0069146.
Anna Maria Porcelli, Anna Ghelli, Claudia Zanna, Paolo Pinton, Rosario Rizzuto, and MichelaRugolo. pH difference across the outer mitochondrial membrane measured with a green fluo-rescent protein mutant. Biochemical and Biophysical Research Communications, 326(4):799– 804, 2005. ISSN 0006-291X. doi:10.1016/j.bbrc.2004.11.105.
Hong Qian and Daniel A. Beard. Thermodynamics of stoichiometric biochemical networks inliving systems far from equilibrium. Biophysical Chemistry, 114(2-3):213 – 220, 2005. ISSN0301-4622. doi:10.1016/j.bpc.2004.12.001.
Peter R. Rich and Amandine Marechal. The mitochondrial respiratory chain. Essays In Bio-chemistry, 47:1–23, 2010. ISSN 0071-1365. doi:10.1042/bse0470001.
Marcin Sarewicz and Artur Osyczka. Electronic connection between the Quinone and Cy-tochrome c redox pools and its role in regulation of mitochondrial electron transportand redox signaling. Physiological Reviews, 95(1):219–243, 2014. ISSN 0031-9333.doi:10.1152/physrev.00006.2014.
Brian E. Schultz and Sunney I. Chan. Structures and proton-pumping strategies of mitochondrialrespiratory enzymes. Annual Review of Biophysics and Biomolecular Structure, 30(1):23–65,2001. doi:10.1146/annurev.biophys.30.1.23. PMID: 11340051.
B. Sengupta and M.B. Stemmler. Power consumption during neuronal computa-tion. Proceedings of the IEEE, 102(5):738–750, May 2014. ISSN 0018-9219.doi:10.1109/JPROC.2014.2307755.
Giancarlo Solaini, Alessandra Baracca, Giorgio Lenaz, and Gianluca Sgarbi. Hypoxia and mito-chondrial oxidative metabolism. Biochimica et Biophysica Acta (BBA) - Bioenergetics, 1797(67):1171 – 1177, 2010. ISSN 0005-2728. doi:10.1016/j.bbabio.2010.02.011. 16th EuropeanBioenergetics Conference 2010.
Giancarlo Solaini, Gianluca Sgarbi, and Alessandra Baracca. Oxidative phosphorylation in can-cer cells. Biochimica et Biophysica Acta (BBA) - Bioenergetics, 1807(6):534 – 542, 2011.ISSN 0005-2728. doi:10.1016/j.bbabio.2010.09.003. Bioenergetics of Cancer.
Filipa L. Sousa, Thorsten Thiergart, Giddy Landan, Shijulal Nelson-Sathi, Ines A. C. Pereira,John F. Allen, Nick Lane, and William F. Martin. Early bioenergetic evolution. PhilosophicalTransactions of the Royal Society of London B: Biological Sciences, 368(1622), 2013. ISSN0962-8436. doi:10.1098/rstb.2013.0088.
Pierre Van Rysselberghe. Reaction rates and affinities. The Journal of Chemical Physics, 29(3):640–642, 1958. doi:10.1063/1.1744552.
Kalyan C. Vinnakota, Jason N. Bazil, Franoise Van den Bergh, Robert W. Wiseman, andDaniel A. Beard. Feedback regulation and time hierarchy of oxidative phosphorylation incardiac mitochondria. Biophysical Journal, 110(4):972 – 980, 2016. ISSN 0006-3495.doi:10.1016/j.bpj.2016.01.003.
Andrei D. Vinogradov and Vera G. Grivennikova. Oxidation of NADH and ROS production byrespiratory complex I. Biochimica et Biophysica Acta (BBA) - Bioenergetics, 1857(7):863 –871, 2016. ISSN 0005-2728. doi:10.1016/j.bbabio.2015.11.004.
Douglas C. Wallace. A mitochondrial paradigm of metabolic and degenerative diseases, aging,and cancer: A dawn for evolutionary medicine. Annual Review of Genetics, 39(1):359–407,2005. doi:10.1146/annurev.genet.39.110304.095751.
Alan J Walton. Units and dimensions. Physics Education, 31(3):174, 1996. doi:10.1088/0031-9120/31/3/019.
Peter Wellstead. A New Look at Disease: Parkinson’s through the eyes of an engineer. ControlSystems Principles, Stockport, UK, 2012. ISBN 978-0-9573864-0-2.
Peter Wellstead and Mathieu Cloutier, editors. Systems Biology of Parkinson’s Disease. SpringerNew York, 2012. ISBN 978-1-4614-3411-5. doi:10.1007/978-1-4614-3411-5.
Fan Wu, Feng Yang, Kalyan C. Vinnakota, and Daniel A. Beard. Computer modelingof mitochondrial tricarboxylic acid cycle, oxidative phosphorylation, metabolite transport,and electrophysiology. Journal of Biological Chemistry, 282(34):24525–24537, 2007.doi:10.1074/jbc.M701024200.
Pasko Zupanovic and Davor Juretic. The chemical cycle kinetics close to the equilibrium stateand electrical circuit analogy. Croatica chemica acta, 77(4):561–571, 2004.